Article

Decision-Making Tool for the Selection of Priority Areas for Building Rehabilitation in Barcelona

by
Còssima Cornadó
1,
Sara Vima-Grau
1,*,
Pilar Garcia-Almirall
1,
Angel Uzqueda
2 and
Mireia de la Asunción
1
1
Architectural Technology Department, Universitat Politècnica de Catalunya—Barcelona Tech, 08028 Barcelona, Spain
2
Municipal Institute of Housing and Renovation, Ajuntament de Barcelona, 08003 Barcelona, Spain
*
Author to whom correspondence should be addressed.
Buildings 2022, 12(2), 247; https://doi.org/10.3390/buildings12020247
Submission received: 15 January 2022 / Revised: 14 February 2022 / Accepted: 17 February 2022 / Published: 21 February 2022
(This article belongs to the Topic Sustainable Smart Cities and Smart Villages)

Abstract

:
The promotion of rehabilitation is an urgent necessity in today’s consolidated cities, both due to the need to update their buildings to achieve habitability and safety standards that are required nowadays, as well as to stop the deterioration of buildings in vulnerable environments, where paradoxically the obtainment of economic resources to invest in building maintenance and upgrade is scarcer. Decision making on the delimitation of areas in which the need to invest is higher is extremely complex and often relies on large secondary data studies that are contrasted with local stakeholders’ intuition and knowledge on the ground. Usually, rehabilitation aids are directed to relatively large areas, where a certain need may be found. However, these areas are often excessively wide and specific needs that would require special focus can be diluted in the whole. The current trend of area-based and site-specific rehabilitation programs calls for precise and focused data studies and methodologies. The research presented here provides a methodology for the selection of priority areas to promote rehabilitation in the context of Barcelona’s vulnerable neighborhoods. The selection methodology combines primary and secondary data with a very high level of disaggregation that identifies where the needs are greatest, and it also provides a tool that is still based on primary disaggregated data for the delimitation of areas. The results obtained highlight specific priority areas such as parts of the Raval, Carmel and Besòs-Maresme neighborhoods within larger zones that had been previously defined as vulnerable. The proposed methodology seeks to provide tools to foster evidence-based decision making, thus improving both the understanding of reality and its spatial distribution through data mining techniques and data visualization.

1. Introduction

1.1. Rehabilitation and Regeneration Public Policies

There is a wide range of current rehabilitation policies and they can be studied according to their targets, which can be universal or can address certain groups or zones, buildings-based or area-based. It is possible to resume them into three main scales or types of intervention: a first universal type of program that refers to the whole city and can foster any kind of rehabilitation action; a second thematic type of program that can specifically address the issue of accessibility or, more recently, energy performance; and finally, an integrated type of program that is specifically addressed to a site or small area and that is often interlinked with other programs of housing, economy or social policies. Area-based approaches are increasingly chosen as problems can be more easily diagnosed and tackled and outcomes can be better assessed. Therefore, there is a widespread tendency to adopt an area-based spatial focus in the design of housing renewal and rehabilitation policies [1].
Furthermore, the well-known and described relationship between urban social and economic inequalities and their concentration and spatialization in the city encourages the fostering of urban rehabilitation where it is most needed [2]. While there is debate on the disadvantages of treating small areas through area-based approaches, such as the possibility to intervene on the effects and not on the causes of the problems, it is increasingly common to address public rehabilitation investments as a tool for the redistribution of wealth and social and environmental justice in particularly disadvantaged areas of cities [3].
The City of Barcelona is an example of this trend, where public rehabilitation policies have transited from universal city-wide programs focused on the improvement of the housing stock in general rather to area-based approaches that are increasingly gaining specificity and tending towards a more integral people-centered approach. Urban renewal and regeneration policies have been successively developed based on the delimitation of areas such as ARI (areas of internal renewal) and other programs [4,5]. Rehabilitation policies have been historically addressed from the building scale and have mostly referred to buildings’ state of conservation and constructive type. The current trend towards area-based programs translates into the delimitation of areas or groups of buildings according to their needs and opportunities for improvement taking into account their state of conservation and existing deficiencies, while also tackling social and economic needs and aspects related to the urban environment (public spaces, facilities, ground floor activities, etc.). These policies are very specific regarding their area target, but very integrated and wide in terms of the thematic target [4,5].
When designing area-based policies, current urbanistic tools allow public administrations to economically compensate areas of rehabilitation by the redistribution of values and edificatory profit among compensation units, i.e., the distribution of benefits and charges among various affected properties of an area so they can successfully simultaneously affect groups of buildings regardless of their variability of needs and characteristics. This approach calls first for a delimitation of areas where rehabilitation programs will be applied, although these areas can be discontinuous (part of urban blocks, part of streets, etc.), heterogeneous and do not necessarily have to correspond to a closed urban form. The methodology for the selection of such areas becomes a crucial part of the decision making in rehabilitation public policies.
Traditionally, public administrations have taken two possible approaches on the delimitation of priority areas for urban and building rehabilitation. First, some areas are prioritized as a result of an obvious accumulation of problems of a different nature that go far beyond the need of physical improvement and that motivate the elaboration of selective studies that further inform the public administrations or that provide so-called objective data that support future interventions. This corrective approach is carried out when the superposition and the urgency of the problems have already manifested for a long time, with no, or insufficient, administration intervention. In opposition to that, when public administrations have enough resources and intuition, they sometimes operate in a proactive and assertive way by taking on research studies that pre-figurate certain policies. For example, if there is a political will to intervene in the improvement of the quality of building stock in the most vulnerable urban areas, those are first determined by anticipatory research studies [3].

1.2. Methodological Approaches to the Delimitation of Priority Areas

In the past few decades there has been an increasing preoccupation with the development of methodologies of data collection and assessment that can better inform public policies of urban planning and urban regeneration. The need for tracking and proofing the results and side-effects of public intervention is gaining importance all over Europe [6,7]. Nevertheless, the challenge of the delimitation of priority areas is that it is not yet widely determined by information (evidence-based), yet often relies on political and or technical intuitions that lay down scientific evidence (non-party political). The extension and the scale of selected areas are determined by the economic capacity of public programs, which usually act as the main limitation of scale and scope [3,5]. Fundamentally, secondary urbanistic databases are employed, mainly the cadaster, while very few studies carry out research on site. Furthermore, usually the driving urbanistic approach based on very few secondary databases is prevalent to other aspects that can be more related to the particularities in building type, construction or state of conservation.
Firstly, many scientific studies have successfully provided tools for the detection of priority areas due to their higher vulnerability [8,9,10]. In Spain, scientific research in this line [11,12] has enabled the creation of an observatory of vulnerable neighborhoods that keeps track of the evolution of the most deprived areas [13], as well as a more recent observatory for the evaluation of public rehabilitation policies’ scope and results [14]. Similar tools have been developed in the Basque country [15] and in the metropolitan area of Barcelona [16]. The search for methodologies that can better inform decision making in residential rehabilitation constitutes an expanding field of research [17,18]. Most scientific studies that have successfully provided tools for the selection of priority areas have a top-down approach, based on the analysis of very complex secondary data sources and the detection of areas of high vulnerability. Many cities and metropolitan areas have developed similar approaches in the context of designing rehabilitation area-based policies such as London [19,20], Madrid [21,22,23] and Barcelona, [24] among others. In the local context, many such studies are working on the incorporation of mixed methodologies that aim to integrate qualitative information [25,26] and primary data obtained through complex fieldwork [27,28].
Besides, very often research studies that are focused on the analysis of the building stock, the state of conservation, the habitability conditions, property or other aspects related to housing are taking much more disaggregated units of analysis, either of building units or even of individual dwellings. Extensive and precise fieldwork and the inclusion of qualitative data and the residents’ perspective are also increasingly common aspects [27,28,29].
There are very few examples of mixed methodologies that operate simultaneously as a large database scale and as small disaggregated units of analysis that incorporate fieldwork and qualitative information [30]. These two extensively developed approaches have rarely been integrated, as traditionally data studies have been used for the design of public policies and disaggregated studies have helped to implement or materialize already made public programs on site.
It proves to be crucial to integrate such approaches rather in a bottom-up research methodology that can part from disaggregated sources of information to operate higher scales of analysis and inform public policies before they reach the implementation phase [3].
The City of Barcelona is also increasingly seeking to fundament its public policies on well-informed scientific sources and has recently undertaken high-scale scientific studies that have already helped to inform public policies and rehabilitation programs. One of them is an example of a highly complex database analysis that helped the selection of priority neighborhoods in which the Neighborhood Plan is being implemented [24]. The other, is an example of the selection of very specific and disaggregated information at the building scale [29] that aimed at offering a first prioritization of buildings in which to implement the Program for High-Complexity Buildings [31,32].
This research purposes what the authors believe is a poorly explored intermediate step between the design of public rehabilitation policies and their implementation through rehabilitation programs, based on the information provided by several research studies applied to the City of Barcelona [24,29]. The selection of disaggregated quantitative and qualitative information that can extensively describe the need for rehabilitation of the building stock, obtained both from very extensive fieldwork along with data mining techniques with secondary databases, enables for a bottom-up approach to the delimitation of priority areas that can be complementary to the first large-scale data analysis results.
The provided methodology aims at studying aspects that are usually undertaken in traditional urbanistic studies that inform decision making in the delimitation of priority areas. Furthermore, it allows the transition from a very high level of disaggregation to a sector aggregation that enables the definition of areas with a greater need for repair and upgrade intervention.
Although the present research is focused on the need for rehabilitation, and thus concentrates on the state of conservation of the building stock, the purposed methodology is opened enough to incorporate further information such as the state and availability of facilities, public spaces, green areas, etc. The possibility to amplify the analyzed information and incorporate further databases if available in a sufficiently disaggregated scale would enable the informing of other types of more integral policies.

2. Objectives

The main aim of this research is to define a methodology for the inclusion of the content and information needed and its treatment with enough level of disaggregation in order to understand where the needs of intervention are greater with the objective of providing a high level of precision that can better inform public administration decisionmakers to define priority areas for public rehabilitation, as well as foster the optimization and efficacy of public rehabilitation policies.
This research parts from the question: Is it possible to invert the usually top-down urbanistic approach employed when defining priority urban sectors and part from a highly disaggregated source of information in order to define sectors with a higher level of understanding?
Its application in rehabilitation policies’ decision making is particularly interesting, because their existing intervention tools need to be applied per sector, yet refer most frequently to the building scale, and thus to a very disaggregated unit of analysis.

3. Materials and Methods

3.1. Data Sources

The research methodology combines secondary data with primary data in a progressive approach to the field of housing renewal and urban rehabilitation. It is embedded in large-scale data studies that provide a more precise understanding of the different problems in residential buildings in vulnerable environments.
It is based on the premise that socially vulnerable areas are those in which inhabitants will find it more difficult to maintain their buildings; therefore, they are the main areas where public aid for the rehabilitation of buildings is most necessary [5,32].
The first main data source and starting point of this research is the study for the detection of vulnerable areas in the City of Barcelona that provided its vulnerability map (Figure 1, left map) [24], which was carried out with a highly complex database analysis on the available 20 data sources of public secondary data (cadaster, census, construction work licenses, etc.) including socioeconomic, sociodemographic socio-urban and residential aspects with different levels of disaggregation (from individual buildings to neighborhood). The obtained results where determinant for the selection of the 25 neighborhoods of the city where the Barcelona City Hall has applied the Neighborhood Plan of 2016–2020 and 2021–2024 [31] and where further fieldwork research was later carried out (Figure 1, right map).
The aforementioned rehabilitation policies are being implemented in 25 of the 73 neighborhoods of Barcelona, where a greater risk of residential vulnerability was detected. In those neighborhoods exhaustive studies were made on the state of the conservation of residential buildings [29]. These consisted of a pre-diagnosis of the state of conservation of the buildings carried out from the outside and establishing five indexes corresponding to the priority level of need for rehabilitation of each building:
  • 1: urgent;
  • 1.5: high;
  • 2: necessary;
  • 2.5: low;
  • 3: very low.
In addition, a series of observable indicators in the buildings (damage and deficiencies) were taken into account for the pre-diagnosis [29]: the presence of capillary and/or seepage damp, unstable facade elements or cladding, the presence of security nets, cracks in the facade walls, cracks in the cladding, windows in poor condition and damaged facilities.
Consequently, highly disaggregated information is available from primary sources in 25 neighborhoods and a total of 11,738 buildings and 96,307 dwellings (Table 1).

3.2. Methodological Background and the Issue of Data Disaggregation

During the pre-diagnosis studies of the residential building stock, the difficulty in selecting areas where rehabilitation actions could be carried out with joint management was detected. The results of these studies presented a reality, where buildings in good condition appear together with buildings with a poor state of conservation in a very dispersed distribution that made it difficult to define areas for zoning (Figure 2). It is seldom possible to define a perimeter of one or more blocks in a poor and uniform state of conservation. The dispersed distribution and the level of disaggregation of the building data makes it difficult to establish specific areas of special aid.
In order to visualize areas with greater needs within a large sector, one option is to carry out a synthetic index by urban block. In other words, performing the weighted average per plot area and its index of need for rehabilitation or performing the weighted average per number of plots and its index of need for rehabilitation; both options with very similar results (Figure 3).
This methodology has the advantage of providing a simplified visualization at the neighborhood level and presenting the information in a less fragmented way. Nevertheless, as a main disadvantage this type of methodology oversimplifies reality and there are many situations where highly risky cases are masked. For example, there are cases where extreme values are found in the same urban block, positive and negative, and where taking the average provides a visualization in which certain areas of potential risk are undervalued. Furthermore, there are areas that stand out disproportionately just because of their small urban form that includes very few buildings.

3.3. Proposed Methodology

A kernel density methodology is proposed for the zoning of areas with the worst state of conservation and therefore a greater need for rehabilitation. This methodology is used to reveal patterns of events that are concentrated in a space. Thus, the density of an unknown process is estimated by identifying the arrangement of nearby entities as a proximity pattern [33,34,35].
These methodologies have been applied in other fields generally related to risk detection mapping such as the detection of substandard housing and other extreme situations of inequality [36,37]. It is especially adequate in the present case as the objective of rehabilitation policies is to contribute to eradicate urban inequalities and to act in those areas where historic and present poverty situations make it difficult for local residents to improve their living conditions.
The starting point is the primary data on the building rehabilitation need index determined in the four pre-diagnosis studies available for the 25 vulnerable neighborhoods where rehabilitation promotion policies are proposed [36,37,38,39,40,41].
This is done using the GIS kernel density tool [42], which calculates the density of points (in this case, buildings) within a given radius with a certain value of the assigned rehabilitation need index. Thus, the tool allows the determination and visualization of the areas with the higher and lower concentration of buildings with a certain level of prioritization. In this way, it is possible at the city level to show not only which of the neighborhoods studied have the largest number of buildings with a high need for rehabilitation, but also the specific areas with the highest concentration of cases, and therefore the higher risk. In addition, it also allows for the more accurate analysis of data at the neighborhood level.
Kernel density methodology is a statistical methodology that advances patterns of areas; in this case those with the greatest need for rehabilitation. For the application proposed in this article, the main limitations are found in the difficulty of directly delimitating priority urban areas. The results obtained could be easily presented as curves of intensity, but they must be manually adapted to the form of the urban fabric in order to decide precisely upon the delimitated urban areas; although, the methodology rigorously identifies the points and areas with the highest risks. The accuracy has been checked by scanning narrow 5 × 5 bandwidths that outline areas where events are concentrated in a small space. A search value of 100 m2 and a small grid of 5 × 5 m are used to display the results. Nevertheless, it is still true that risk situations attaining a single building, or a very small group of very isolated buildings, could be missed using this methodology. Thus, disaggregated primary data results at the building scale are a mandatory complement to the analysis.
Two approximations have been made with the kernel density calculation:
  • Density of buildings with a higher need for rehabilitation index.
For this analysis, buildings with an index of need for rehabilitation of 1 (urgent) and 1.5 (high) are considered, corresponding to buildings that present a risk that is generalized in the first case and specific to some aspect of the building in the second [29]. First, the buildings are represented by georeferenced dots, each with its own priority level. Subsequently, those to be represented are filtered; in this case those with indices of 1 and 1.5. A search value of 100 m2 is given and a grid of 5 × 5 m results is displayed.
For a more accurate picture, a second version of the analysis is performed by adding the weighting of each point according to its priority level as a parameter of the kernel density tool. Thus, it is established that the rehabilitation need index is 1 = 5, 1.5 = 4, 2 = 3, 2.5 = 2, 3 = 1. In this way, in the final visualization of the result the buildings in worse condition take more weight in the plan.
2.
Density of dwellings in buildings with a higher need for rehabilitation index.
For this analysis, housing in buildings with an index of need for rehabilitation of 1 (urgent) and 1.5 (high) are considered, corresponding to those situations of greater risk.
First, the buildings are represented by dots, where each has its own level of prioritization. Then, the buildings to be represented are filtered; in this case those with indexes 1 and 1.5. A search value of 100 m2 is given and a grid of 5 × 5 m results is displayed. In addition, to obtain the density of dwellings it is necessary to use as a parameter of the kernel density tool the weighting of each point according to the number of dwellings (data provided by the cadaster database).
The second version of the housing density analysis, which aims to get a more accurate picture, contains a previous step in which the number of dwellings in each building is multiplied by the aforementioned weighting of the index of need for rehabilitation in which 1 = 5, 1.5 = 4, 2 = 3, 2.5 = 2, 3 = 1. The resulting value is used as a parameter of the kernel density tool to weight each home according to its priority level. This second type can be useful to address cases where a rehabilitation action may have an impact on improving the conditions of more homes.
For the performance of the two analyses, the buildings in areas affected by the planning, or which have already been demolished, have been discarded, not only to show the updated results, but also because they are areas with a high density of buildings in poor condition and would have masked the results of the rest of the city.

4. Results and Discussion

A kernel density methodology is proposed for the zoning of areas with the worst state of conservation, and therefore a greater need for rehabilitation. These methodologies have been applied in other fields generally related to risk detection mapping [36,37,38,39,40,41].

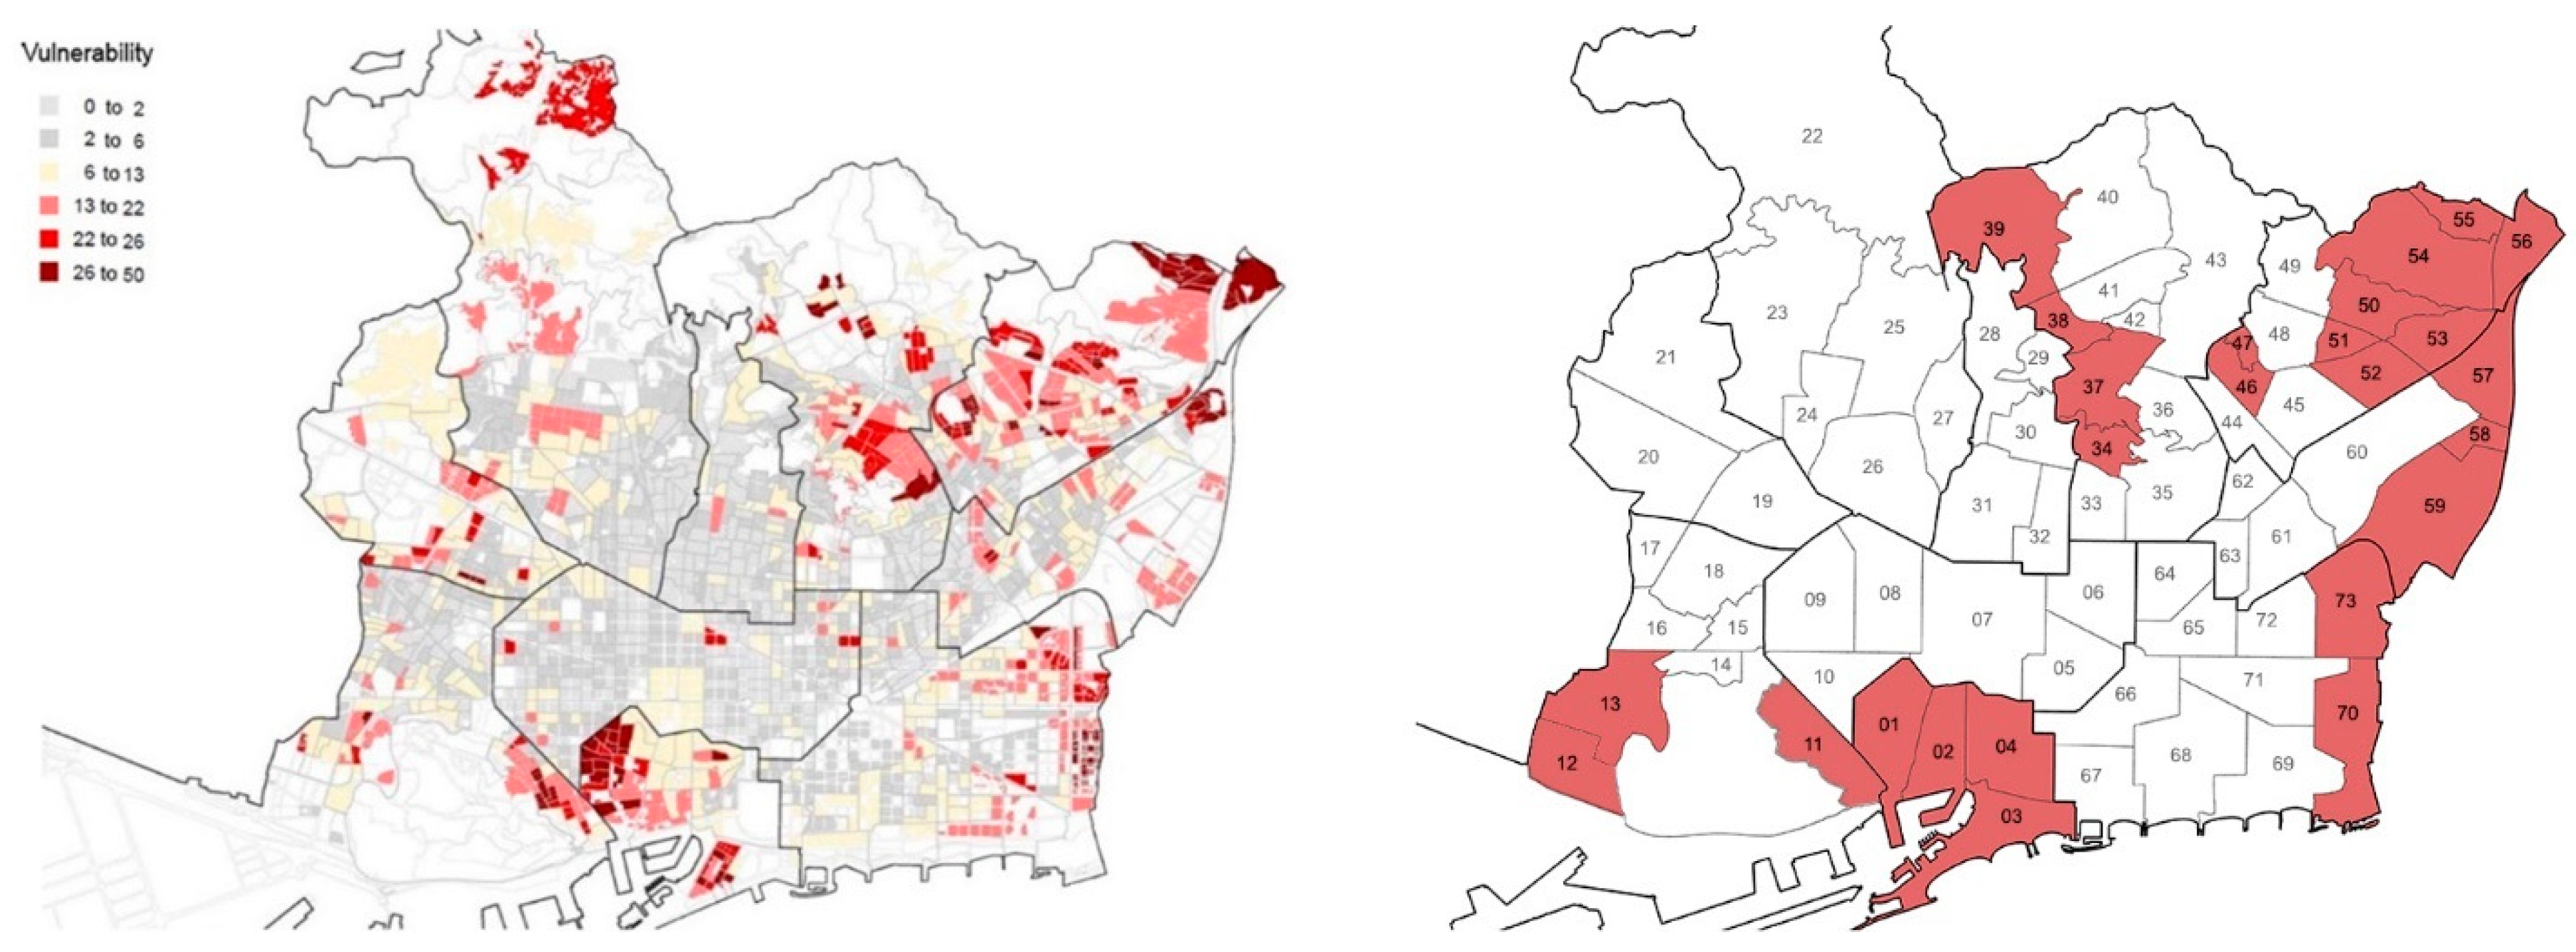
4.1. Results of the Density of Buildings with a Higher Need for Rehabilitation Index

The methodology described above has been applied at the city level, for the 25 neighborhoods for which data on the state of conservation of the buildings are available. The resulting plan (Figure 4) provides a view at the city scale of those areas where the lack of maintenance actions in buildings has led to situations of high risk. Therefore, it carefully identifies those locations with a higher concentration of needs, where rehabilitation actions need to be promoted.
Two main areas that stand out above the rest are (see Figure 1 and Table 1 for neighborhood locations):
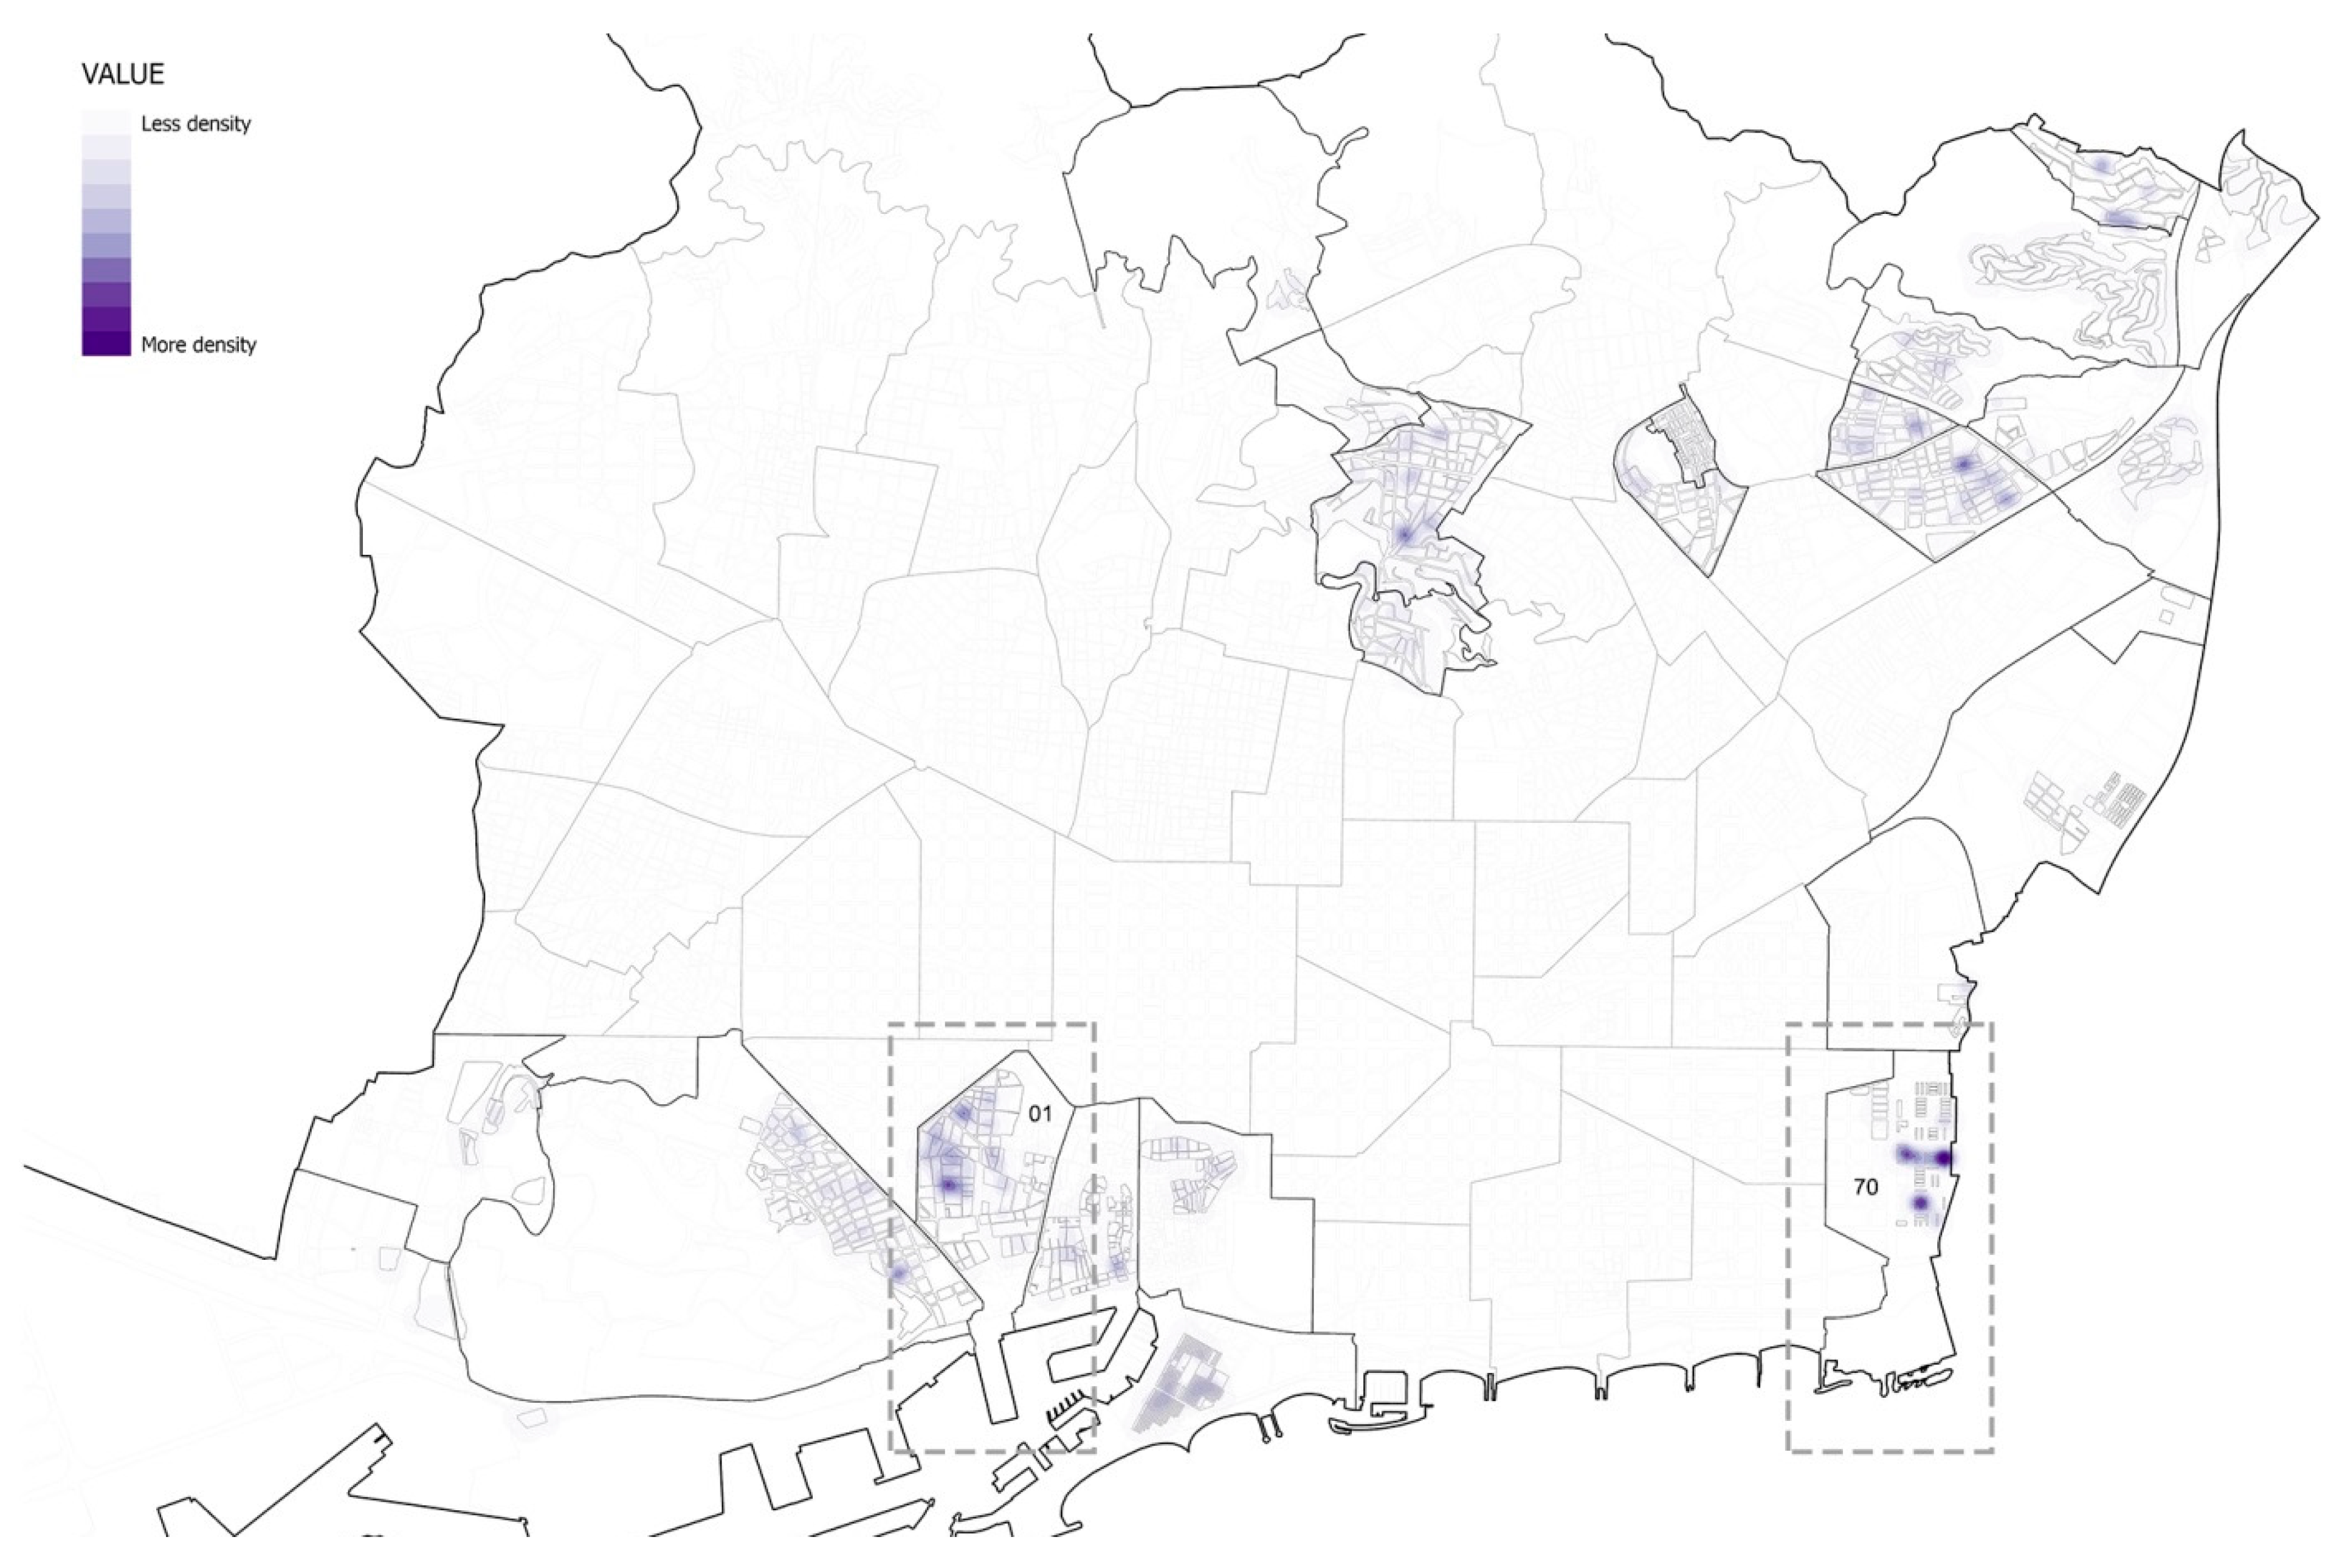
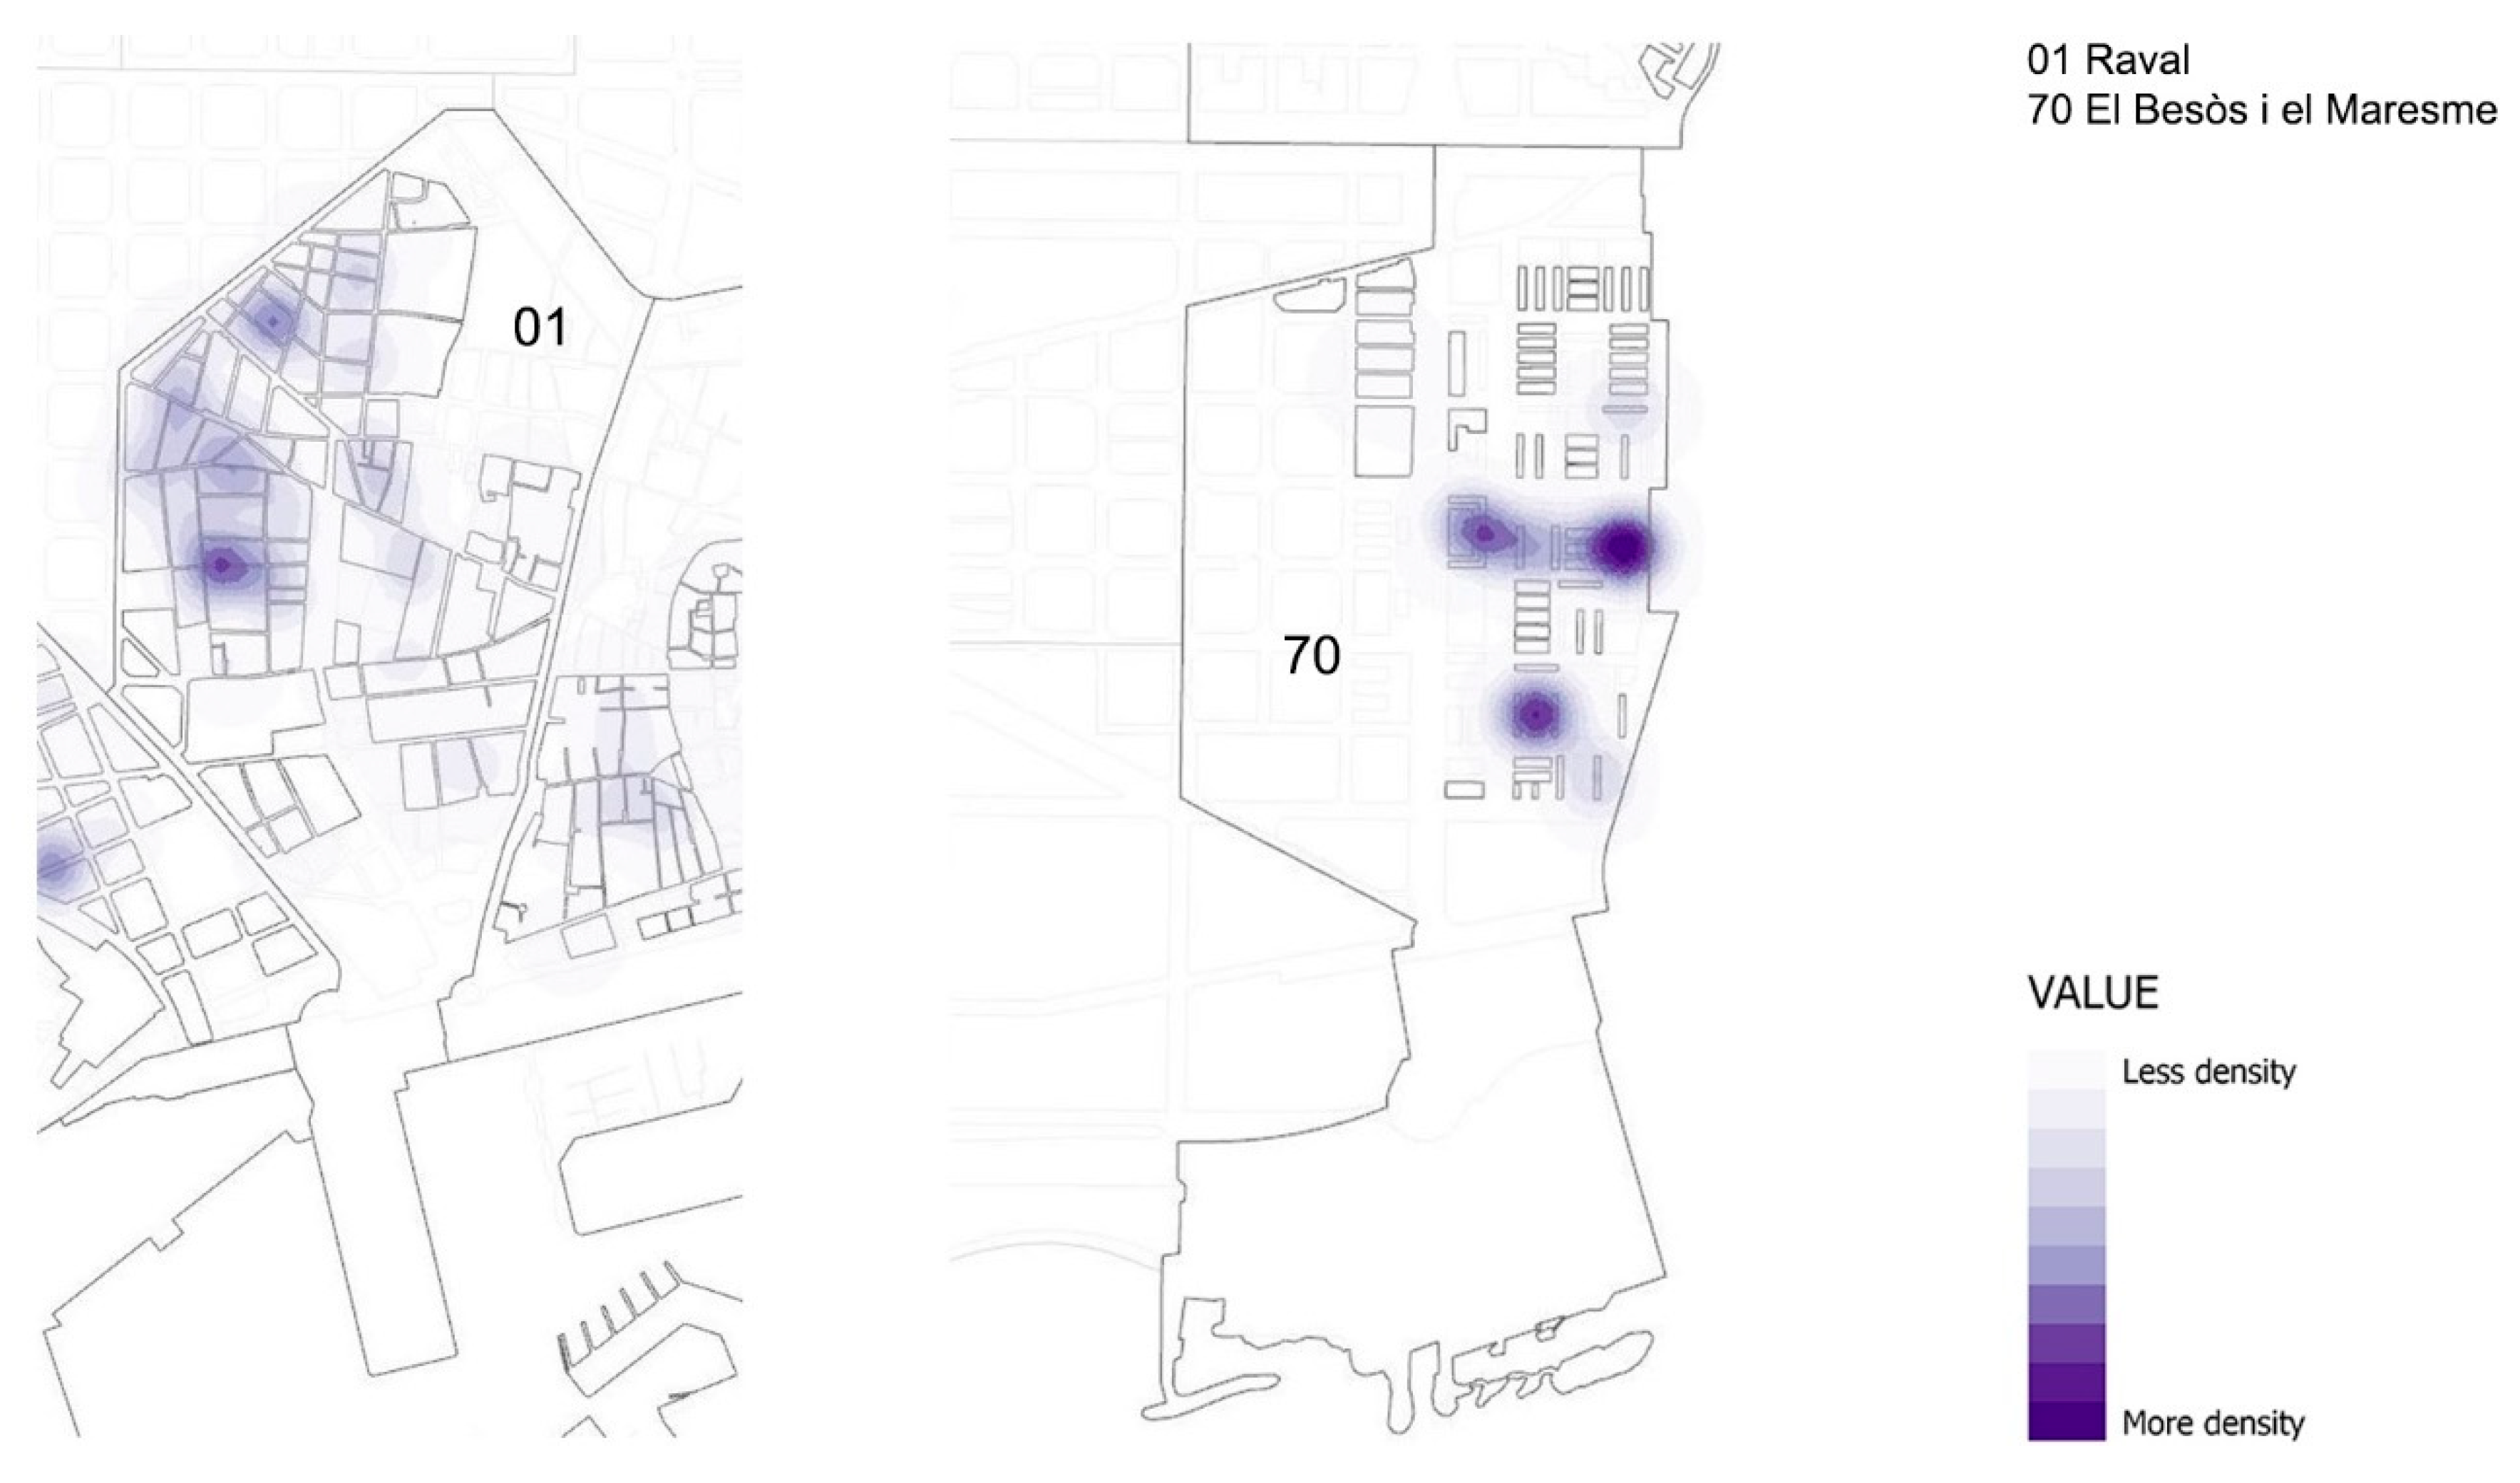
  • The Ciutat Vella district (historic center) (Figure 5), with intensified needs in the central-western area of the Raval neighborhood, with broad needs in the whole neighborhood of La Barceloneta, particularly in the central-eastern part, and finally in the south-eastern location of the Gòtic neighborhood near the seafront.
  • The northern periphery of Barcelona (Figure 6), with intensified problems in the western and highest locations in the neighborhoods of Torre Baró and Roquetes, less remarkably in some locations of Ciutat Meridiana, Trinitat Vella and el Verdum and most intensely in central and south-eastern locations of the El Carmel neighborhood.

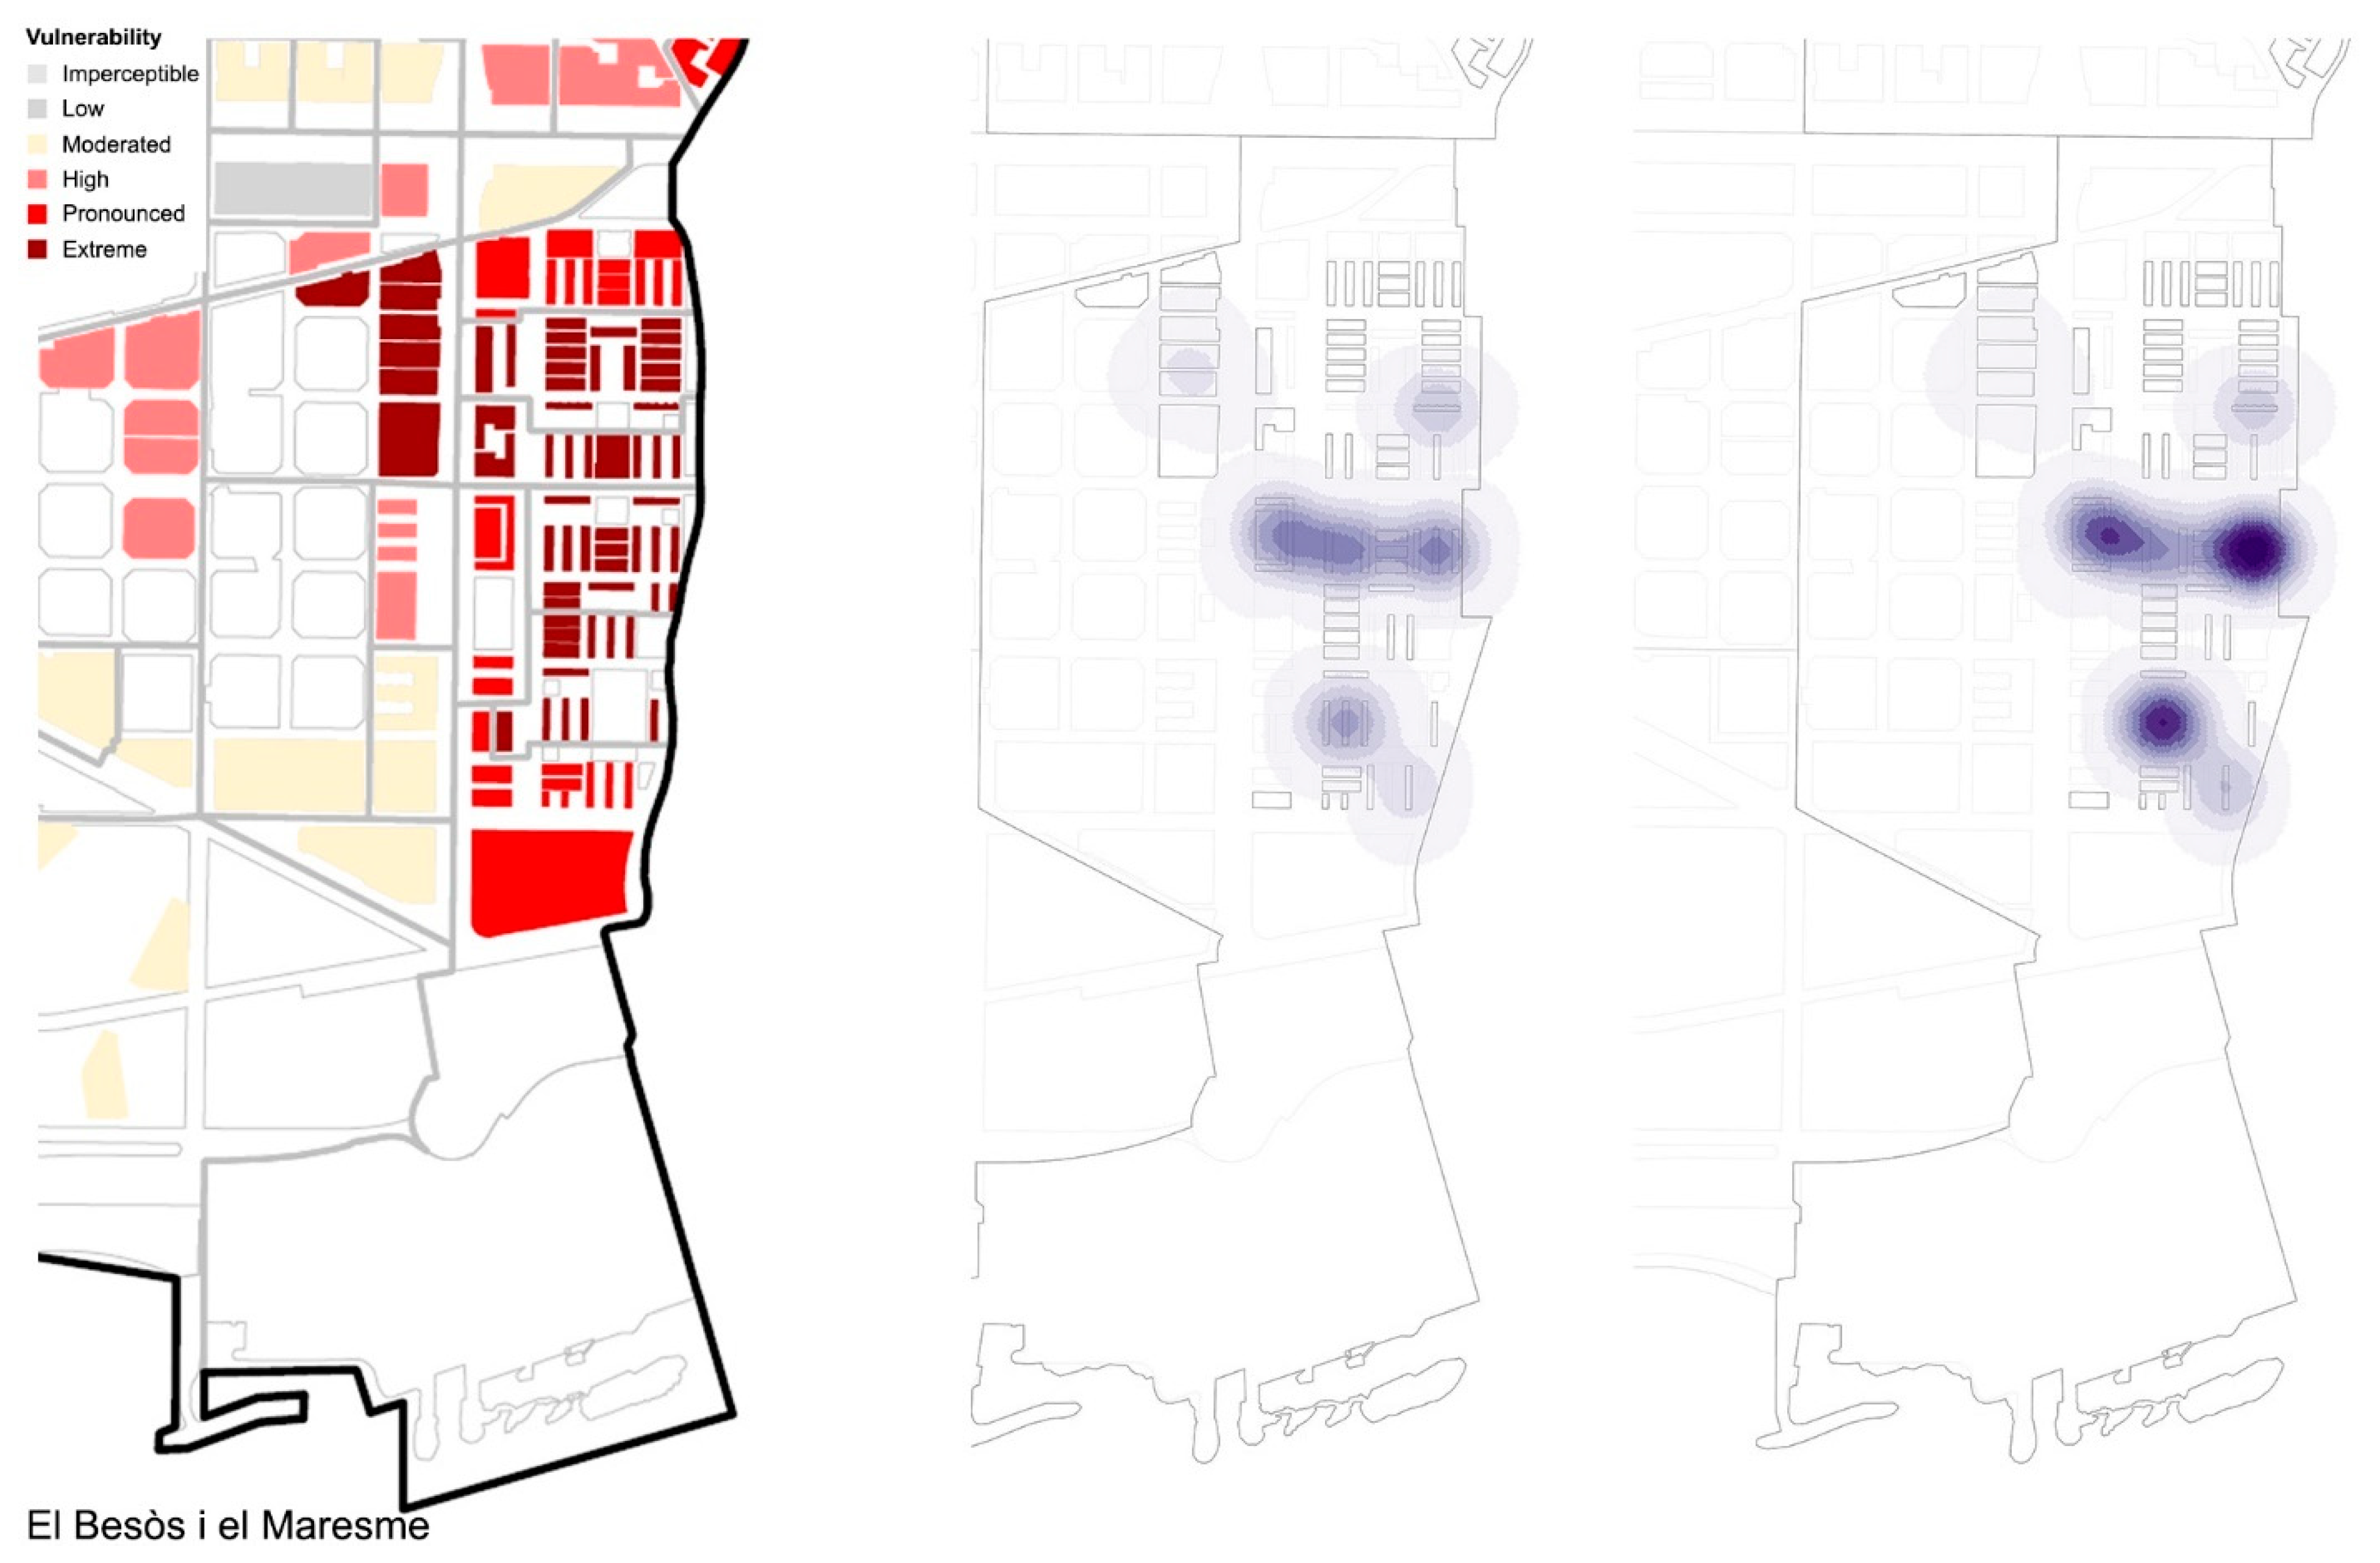
4.2. Results of the Density of Dwellings with a Higher Need for Rehabilitation Index

If the analysis is made considering the number of dwellings that are affected by the poor state of conservation of each building (Figure 7) the results obtained differ from the previous. In this type of analysis, groups of buildings in a poor state of conservation have much more influence in areas where there is a higher density of housing. The following areas stand out:
  • The El Besòs i el Maresme neighborhood (Figure 8, on the right), where the buildings are large linear blocks that contain a large number of dwellings. As a result, the poor condition of a block affects a large number of residents.
  • The El Raval neighborhood (Figure 8, on the left), in its central area, where the high urban density combined with buildings with an average height of 6 floors [30] involve a large number of dwellings affected.

4.3. Methodological Discussion

Figure 9 compares the visualization of results obtained for the Raval neighborhood according to the first disaggregated map of primary sources (on the left), a first attempt at synthesizing according to urban blocks (in the center) and the final map obtained by applying the purposed methodology (on the right).
The purposed methodology has proven to have important advantages when assessing the need of rehabilitation at both the city and the neighborhood scales. In contrast to synthetic maps or the disaggregated visualization explained above and presented on the left and at the center of Figure 9, the results obtained provide a visualization in which a certain concentration of risk cannot be masked by average or delimitation techniques. Thus, the visualization obtained provides an aggregated map that successfully represents more accurately the complex disperse reality; while the aggregation of cases into a nebulosus of density resolves the conflict of data privacy and risk of stigmatization that can occur when singular buildings are highlighted. Furthermore, the flexibility and capacity of the tool to provide analysis with a variable unit of analysis, be it building or dwelling, enables the different weighting of risk according to the number of dwellings and thus residents affected.
As main disadvantages, the provided visualization does not enable the definition of a physical or urban limit and thus a further process of decision making is needed to translate the obtained result into an urban form or urban perimeter; for example, by including all plots that are remarked with a same level of density regardless of their location in one, several or different urban blocks or streets. Although there is a high precision that incorporates disperse results, severe cases that can appear to be completely isolated may be easily diluted within the visualization; meaning that an individualized revision of the primary source of information is still needed. Finally, while zones with a high concentration of cases are very highlighted, areas with a lower density yet quite a serious amount of cases appear smooth and perhaps unweighted, particularly in the city general map.
While the visualization of the disaggregated results was not useful in order to delimitate zones nor to intuitively detect areas of higher risk, the synthetic analysis presenting average results per urban block provides a completely misleading image of the reality that privileges the smallest urban blocks with a high concentration of buildings in a poor state of conservation, while similar concentrations in bigger urban blocks appear diluted. Finally, the visualization obtained by applying the purposed methodology helps to identify areas of greater risk without explicitly highlighting single buildings, urban blocks or streets. It provides a much more accurate and useful tool with which to visualize and distinguish present inequalities within neighborhoods and the whole city that are specific to building conservation and the need of rehabilitation.

4.4. Applicability in the Design of Rehabilitation Policies

Interestingly, as observed in Figure 10, Figure 11 and Figure 12, the highlighted areas that resulted from the first vulnerability study, including a wide range of demographic, economic, urban and housing data based on secondary data, are quite coincidental with those highlighted as areas of higher need for urban rehabilitation. This fact reinforces the premise of this research, that areas of a higher complexity in terms of demography, economic resources and urban deficiencies happen to be also areas in which the state of conservation of buildings has proven to be poorer. Nevertheless, while urban blocks and larger areas were highlighted in the first study, the greater precision provided by an exhaustive fieldwork providing primary disaggregated data helps to incorporate and further distinguish smaller areas that stand out. Finally, the purposed methodology incorporates a tool that enables the consideration of the number of dwellings and thus the impact of the results according to housing density.
In comparison to the zoning obtained by the first integrated database analysis that provided the vulnerability map and proved to be extremely useful to inform the design process of public investment in urban, housing and rehabilitation policies, the obtained results provide a more specific tool that can help to inform specific rehabilitation policies at their stage of decision making and design, as well as at the stage of area delimitation. Nevertheless, it is important to remark that the disaggregated presentation of results at the building scale (Figure 2 and Figure 9 left map) is not replaceable and is still fundamental at the implementation stage of rehabilitation polices, for which it is important to distinguish which individual buildings call for urgent intervention.
Current rehabilitation policies could incorporate this methodology in order to inform at least two different lines of actuation:
  • Area-based interventions that call for the delimitation of areas with a high concentration of needs, where a focused and simultaneous intervention can foster important improvement such as those that are being tested currently in the areas of Sud-Oest del Besòs (Besòs-Maresme) or Trinitat Vella (Figure 13) in Barcelona [43,44,45].
  • Thematic interventions that call for discontinuous sectors such as the issue of accessibility (lift incorporation), programs that aim at upgrading the energy efficiency of the building stock or even more integral programs such as the Program for High-Complexity Buildings [32] that aim at selecting discontinuous buildings with the highest concentration of problems within the larger vulnerable areas such as the Raval (Figure 14) and Ciutat Meridiana among others in Barcelona.

5. Conclusions

We are nowadays facing an increasing challenge in the urban agendas of local governments that are addressing public policies according to three basic axes: economic development, territorial planning and people-centered services [46,47]. The structural turn from the traditional parameters of the functioning of public administrations and decision making in our cities is emphasizing on social emergency situations in order to try to diminish the hardest effects of the 2008 financial crisis and turning point. Urban entrepreneurship is a proactive strategy that, in contrast to traditional actions, local governments purpose with the pursuit of sovereignty to overcome situations of social, residential and economic vulnerability and risk [46,47].
In this context, the public intervention in urban rehabilitation and regeneration is especially necessary and is not cost-effective. Thus, because public resources are very limited, the proactive search for areas in which a public limited intervention can be most effective and efficient becomes fundamental.
The main value of the present work is to highlight that we start to count with data that is precise and valuable enough to develop qualitative methodologies that are very useful to complement and further contrast local government intuitions and complex and wide database current research.
The kernel methodology, usually employed for risk detection and visualization such as for the case of substandard housing and other severe situations of inequality, is also particularly adequate to analyze and present risk regarding the state of conservation of the building stock. It can help to inform the new trend of public policies that aim to eradicate urban inequalities and to take action on sites where poverty situations make it almost impossible for residents to improve their living and housing conditions.
Situations at an extreme and urgent need of intervention are found in a very disperse urban distribution, presenting high concentrations in some cases. The results obtained highlight relatively small areas of extremely high concentrations within areas that had already been defined as widely vulnerable, for example some parts of the Raval, Carmel and Besòs-Maresme neighborhoods. Through area-based interventions, the found dispersity and disparity of results can provide opportunities for compensation and balancing that reinforce the interest for qualitative improvements that foster the socio-residential equity of the city.
Public policies are increasingly calling to fundament their decision making with scientifically based arguments and well-informed sources. Different actors and stakeholders need to know and understand with precision the urban reality. Scientific methodologies provide an interesting picture that can be contrasted and contested with citizens and neighbors as well as non-scientific publics. Given that the present methodology identifies key areas without pointing at building units or streets, it can be incorporated in neighbor participatory processes and actions. The proximity of public administrations and citizens fosters citizenship compromise and participation and can reduce current levels of political dissatisfaction. New systems of open and participatory data are a crucial element in this trend that needs to provide tools that enable learning and gain understanding on data-based results and gain experience based on implemented interventions that can be contrasted and tracked to understand the obtained results, side-effects and consequences.
Thus, the purposed methodology could further incorporate a temporal tracking of the evolution of the analyzed sites. Moreover, although the present research is focused on the need of rehabilitation, and thus concentrates on the state of conservation of the building stock, the purposed methodology is opened enough to incorporate further information such as the state and availability of facilities, public spaces, green areas, etc. The possibility to amplify the analyzed information and incorporate further databases if available in a sufficiently disaggregated scale would enable the informing of other types of more integral policies.
To conclude, the main achievements of this research are:
  • The purposed methodology provides a cartography of risk situations that is based on a fieldwork research of proximity, which enables to precisely identify and delimitate higher levels of concentration of socio-residential and habitational risks.
  • It contributes to the vision of how homogeneous approaches to detected areas are not sufficient, while it highlights the present heterogeneity of small urban delimitations and their buildings and dwellings; a very useful contribution for decision making at the stage of the design of rehabilitation policies.
  • It contributes to a more comprehensive approach to complex urban problems that are assessed in urban rehabilitation and renewal with an opened vision of governance. It is possible to further integrate knowledge on the state of conservation of the building stock with sociodemographic and economic aspects that are relevant when fostering social inclusion and equity in urban vulnerable areas.
  • This experience is a step forward towards a rigorous bottom-up analysis of our urban environments based on the proximity that can contribute and acknowledge the increasingly relevant role of local governments in the improvement of individual and collective welfare.

Author Contributions

Conceptualization, C.C. and P.G.-A.; methodology, P.G.-A., C.C. and S.V.-G.; formal analysis, C.C.; investigation, A.U.; resources, A.U.; data curation, M.d.l.A.; writing—original draft preparation, C.C. and S.V.-G.; writing—review and editing, C.C. and S.V.-G.; visualization, S.V.-G. and M.d.l.A.; supervision, P.G.-A. and A.U.; project administration, P.G.-A.; funding acquisition, P.G.-A. All authors have read and agreed to the published version of the manuscript.

Funding

This research was funded by the ongoing R&D project Re-Inhabit. Indicadores socio-espaciales para la mejora del stock habitacional en zonas vulnerables. Criterios de actuación en los casos de las áreas metropolitanas de Barcelona y Bilbao. RTI 2018-101342-BI00, supported and funded by the Spanish Ministry of Science and Innovation. The second author counts with an FPU-Grant, funding from the Ministry of Education.

Data Availability Statement

The data presented in this study is available on request from the first author. The data are not publicly available due to privacy protection.

Conflicts of Interest

The authors declare no conflict of interest.

References

  1. Turkington, R.; Watson, C. (Eds.) Renewing Europe’s Housing; Policy Press: Bristol, UK, 2015; ISBN 978-1-44731-012-9. [Google Scholar]
  2. URBEX Programme. The Spatial Dimensions of Urban Social Exclusion and Integration: A European Comparison; University of Amsterdam: Amsterdam, The Netherlands, 2000. [Google Scholar]
  3. Brown, T.; Turkington, R. Changing approaches to policy making in housing renewal. In Renewing Europe’s Housing, 1st ed.; Turkington, R., Watson, C., Eds.; Policy Press: Bristol, UK, 2015; pp. 245–258. [Google Scholar]
  4. Pareja-Eastway, M.; Simó-Solsona, M. From isolated programmes to an integrated approach: The case of La Barceloneta, Spain. In Renewing Europe’s Housing, 1st ed.; Turkington, R., Watson, C., Eds.; Policy Press: Bristol, UK, 2015; pp. 187–214. [Google Scholar]
  5. Uzqueda, A.; Garcia-Almirall, P.; Cornadó, C.; Vima-Grau, S. Critical Review of Public Policies for the Rehabilitation of Housing Stock: The Case of Barcelona. Buildings 2021, 11, 108. [Google Scholar] [CrossRef]
  6. Guidelines on Evidence-Based Policies and Decision-Making for Sustainable Housing and Urban Development How These Inhabitants Perceive the Space. Available online: https://unece.org/DAM/hlm/documents/Publications/2020_Guidelines_on_evidence-based_policies.pdf (accessed on 12 January 2022).
  7. United Nations. UN-Habitat, “A Guide to Assist National and Local Governments to Monitor and Report on SDG Goals 11 Indicators”. p. 11. Available online: http://localizingthesdgs.org/library/60/SDG-Goal-11-Monitoring-Framework-A-guideto-assist-nationaland-local-governments-to-monitor-and-report-on-SDG-goal-11-indicators.pdf (accessed on 12 February 2022).
  8. Morrone, A.; Scrivens, K.; Smith, C.; Balestra, C. Measuring vulnerability and resilience in OECD countries. In Proceedings of the IARW-OECD Conference on Economic Insecurity, Paris, France, 22–23 November 2011. [Google Scholar]
  9. Birkmann, J.; Wisner, B. Measuring the Un-Measurable: The Challenge of Vulnerability; United Nations University Institute for Environment and Human Security: Bonn, Germany, 2006. [Google Scholar]
  10. Scuderi, G. Managing the vulnerability of the residential stock in Europe. J. Build. Sustain. 2019, 1, 1–9. Available online: http://www.insightcore.com/journal/managing_vulnerability_residential_stock_europe_scuderi_2019.html (accessed on 9 December 2021).
  11. Alguacil, J.; Camacho, J.; Hernández, A. La vulnerabilidad urbana en España. Identificación y evolución de los barrios vulnerables. EMPIRIA Rev. Metodol. Cienc. Soc. 2014, 27, 73–94. [Google Scholar] [CrossRef]
  12. Subirats, J.; Martí-Costa, M. Ciudades Vulnerables y Crisis en España; Centro de Estudios Andaluces: Seville, Spain, 2014. [Google Scholar]
  13. Hernández Aja, A.; Matesanz, A.; Córdoba Hernández, R.; Rodríguez Suárez, I.; Díez Bermejo, A.; Sánchez Toscan, G.; Álvarez del Valle, L. Observatorios de la Vulnerabilidad Urbana y su Vinculación con las Políticas Urbanas de Regeneración de Barrios; Observatorio de la Vulnerabilidad Urbana, Ministerio de Transportes, Movilidad y Agenda Urbana: Madrid, Spain, 2020. [Google Scholar]
  14. Rubio del Val, J. Informe de Evaluación Sobre Políticas Públicas de Rehabilitación Residencial en España (2013–2017); Reflexiones Sobre El Desafío 2020/2030; Observatorio Ciudad 3R-ECODES-Ministerio para la Transición Ecológica, Gobierno de España: Zaragoza, Spain, 2020; ISBN 978-84-09-19847-4. [Google Scholar]
  15. Observatorio Vasco de la Vivienda. Políticas de Rehabilitación y Regeneración Urbana en Europa; Servicio de Estudios, Planificación y Presupuestos—Azterlan, Plangintza eta Aurrekontuen Zerbitzua. 2010. Available online: https://www.etxebide.euskadi.eus/contenidos/informacion/ovv_administracion129/es_ovv_admi/adjuntos/Politicas_rehab_reg_urbana_europa_es.pdf (accessed on 10 January 2022).
  16. Observatori Metropolità de l’Habitatge Bcn Observatori Metropolità de l’Habitatge de Barcelona. Available online: https://www.ohb.cat/ (accessed on 2 February 2022).
  17. Ignjatović, D.; Bojana, Z.; Ćuković Ignjatović, N.; Đukanović, L.; Radivojević, A.; Rajčić, A. Methodology for Residential Building Stock Refurbishment Planning—Development of Local Building Typologies. Sustainability 2021, 13, 4262. [Google Scholar] [CrossRef]
  18. Biere-Arenas, R.; Spairani-Berrio, S.; Spairani-Berrio, Y.; Marmolejo-Duarte, C. One-Stop-Shops for Energy Renovation of Dwellings in Europe—Approach to the Factors That Determine Success and Future Lines of Action. Sustainability 2021, 13, 12729. [Google Scholar] [CrossRef]
  19. Burdett, R.; Rode, P. Shaping Cities in an Urban Age; Pahidon: London, UK, 2018. [Google Scholar]
  20. Burdett, R. London: Creating Integrated Communities. Available online: https://www.youtube.com/watch?v=_PVneQ8dyaQ (accessed on 10 January 2022).
  21. Hernández Aja, A. Áreas vulnerables en el centro de Madrid. Cuad. Investig. Urbanística 2007, 53, 5–97. Available online: http://polired.upm.es/index.php/ciur/article/view/268 (accessed on 5 January 2022).
  22. VV.AA. Madrid Recupera. Estrategia de Regeneración Urbana. Área de Gobierno de Desarrollo Urbano SostenibleDirección General de Planificación Estratégica—Ayuntamiento de Madrid. 2018. Available online: http://www.observatorio2030.com/sites/default/files/2019-11/BP_20_2018_ES_19_Plan%20Madrid%20Recupera.pdf (accessed on 5 January 2022).
  23. VV.AA. Mapa de Áreas Preferentes de Impulse a la Regeneración Urbana (APIRU). Memoria Justificativa de la Propuesta de Identificación de “Áreas Preferentes de Impulse a la Regeneración Urbana (APIRU)” en el Marco de la Política de Cohesión Territorial de la Ciudad de Madrid. Área de Gobierno de Desarrollo Urbano Sostenible, Dirección General de Estrategia de Regeneración Urbana. Available online: https://www.madrid.es/UnidadesDescentralizadas/UrbanismoyVivienda/Urbanismo/Destacamos/ficheros/MapaAreasPreferentes.pdf (accessed on 10 January 2022).
  24. Garcia-Almirall, P.; Cornadó, C.; Vima-Grau, S. Residential Vulnerability of Barcelona: Methodology Integrating Multi-Criteria Evaluation Systems and Geographic Information Systems. Sustainability 2021, 13, 13659. [Google Scholar] [CrossRef]
  25. Palacios, A.; Mellado, A.; León, Y. Qualitative Methodologies for the Analysis of Intra-Urban Socio-Environmental Vulnerability in Barcelona (Spain): Case Studies. Urban Sci. 2018, 2, 116. [Google Scholar] [CrossRef] [Green Version]
  26. Matesanz-Parellada, A.; Hernández-Aja, A. Evolución de los parámetros del enfoque integrado en las políticas urbanas en los barrios vulnerables en España. Gestión Análisis Políticas Públicas 2018, 10, 82–99. [Google Scholar] [CrossRef]
  27. Piñeira-Mantiñán, M.; Durán-Villa, F.; Taboada-Failde, J. Urban vulnerability in Spanish medium-sized cities during the post-crisis period (2009–2016). The cases of A Coruña and Vigo (Spain). Urban Sci. 2018, 2, 37. [Google Scholar] [CrossRef] [Green Version]
  28. Navas Carrillo, D.; Del Espino Hidalgo, B.; Rodríguez-Lora, J.-A.; Pérez-Cano, T. Analysis of urban vulnerability as a tool for cultural heritage preservation. The cases of the medium-sized historical ensembles in Andalusia. Ge-Conservacion 2020, 17, 171–185. [Google Scholar] [CrossRef]
  29. Cornadó, C.; Vima-Grau, S.; Garcia-Almirall, P. Pre-diagnosis Protocol for Large Residential Building Stock. The Case of Barcelona’s Vulnerable Areas. In Hygrothermal Behaviour and Building Pathologies. Building Pathology and Rehabilitation; Delgado, J., Ed.; Springer: New York, NY, USA, 2021; Volume 14. [Google Scholar] [CrossRef]
  30. Vima-Grau, S.; Cornadó, C.; Ravetllat, P.-J.; Garcia-Almirall, P. Multiscale Integral Assessment of Habitability in the Case of El Raval in Barcelona. Sustainability 2021, 13, 4598. [Google Scholar] [CrossRef]
  31. El Pla de Barris de Barcelona. Available online: https://pladebarris.barcelona/cat (accessed on 6 February 2022).
  32. Ajuts a la Rehabilitació Per a Finques D’alta Complexitat. Available online: https://habitatge.barcelona/ca/serveis-ajuts/rehabilitacio/ajuts/finques-alta-complexitat (accessed on 7 January 2021).
  33. Diggle, P. A Kernel Method for Smoothing Point Process Data. J. R. Stat. Soc. Ser. C (Appl. Stat.) 1985, 34, 138–147. [Google Scholar] [CrossRef]
  34. Baddeley, A.; Turner, R. Modelling Spatial Point Patterns in R. Available online: https://www3.uji.es/~mateu/badturn.pdf (accessed on 2 January 2022).
  35. McSwiggan, G.; Nair, G.; Baddeley, A. Kernel Density Estimation on a Linear Network: Kernel estimation on a linear network. Scand. J. Stat. 2016, 44, 324–345. [Google Scholar] [CrossRef]
  36. Lasocki, S. Kernel Density Estimation in Seismology. In Statistical Methods and Modeling of Seismogenesis; Nikolaos, L., Eleftheria, P., Eds.; ISTE Ltd.—John Wiley & Sons, Inc.: London, UK, 2021. [Google Scholar] [CrossRef]
  37. Hu, Y.; Wang, F.; Guin, C.; Zhu, H. A spatio-temporal kernel density estimation framework for predictive crime hotspot mapping and evaluation. Appl. Geogr. 2018, 99, 89–97. [Google Scholar] [CrossRef]
  38. Anderson, T.K. Kernel density estimation and K-means clustering to profile road accident hotspots. Accid. Anal. Prev. 2009, 41, 359–364. [Google Scholar] [CrossRef] [PubMed]
  39. Chainey, S.P. Examining the influence of cell size and bandwidth size on kernel density estimation crime hotspot maps for predicting spatial patterns of crime. Bull. Geogr. Soc. Liege 2013, 60, 7–19. Available online: https://discovery.ucl.ac.uk/id/eprint/1388639 (accessed on 7 January 2021).
  40. Kuter, N.; Yenilmez, F.; Kuter, S. Forest Fire Risk Mapping by Kernel Density Estimation. Croat. J. For. Eng. 2011, 32, 599–610. Available online: https://hrcak.srce.hr/72661 (accessed on 13 January 2022).
  41. Rezazadegan Tavakoli, H.; Rahtu, E.; Heikkilä, J. Fast and Efficient Saliency Detection Using Sparse Sampling and Kernel Density Estimation. In Image Analysis. SCIA 2011. Lecture Notes in Computer Science; Heyden, A., Kahl, F., Eds.; Springer: Berlin/Heidelberg, Germany, 2011; Volume 6688, pp. 666–675. [Google Scholar] [CrossRef] [Green Version]
  42. ArcGis for Desktop. How Kernel Density Works. Available online: https://desktop.arcgis.com/es/arcmap/10.3/tools/spatial-analyst-toolbox/how-kernel-density-works.htm (accessed on 10 February 2022).
  43. AA.VV. Proyectos de Intervención integral en Barcelona 2004–2019; Actuaciones en Trinitat Vella; Ajuntament de Barcelona, Generalitat de Catalunya: Barcelona, Spain, 2019. [Google Scholar]
  44. AA.VV. El Pla de Rehabilitació Municipal “Santa Coloma Renovem els Barris”. Available online: https://media-edg.barcelona.cat/wp-content/uploads/2019/03/28131902/02-FHAR_20190321_Joan-M-Gonzalez_Santa-Coloma.pdf (accessed on 2 January 2022).
  45. AA.VV. L’Ajuntament Posa en Marxa un Programa de Regeneració Urbana a L’antic Barri del Sud-OEST del BESÒS. Nota de Premsa, Ajuntament de Barcelona. 2020. Available online: https://ajuntament.barcelona.cat/premsa/wp-content/uploads/2020/07/200710-NP-DEF-regeneracio%CC%81-urbana-SOBesos.pdf (accessed on 6 February 2022).
  46. da Cruz, N.F.; Rode, P.; McQuarrie, M. New urban governance: A review of current themes and future priorities. J. Urban Aff. 2018, 41, 1–19. [Google Scholar] [CrossRef]
  47. Subirats, J. El Poder de lo Próximo. Las virtudes del Municipalismo; Los Libros de la Catarata Coleccion Mayor: Madrid, Spain, 2016. [Google Scholar]
Figure 1. Vulnerability map (left) (Adapted from Ref. [24]) and map of Barcelona where studied neighborhoods are highlighted (right). See Table 1 for the numbered list of neighborhoods.
Buildings 12 00247 g001
Figure 2. Examples of the disperse distribution of buildings in a poor state of conservation in the El Raval neighborhood (Adapted from Ref. [29]).
Buildings 12 00247 g002
Figure 3. Integration of the disperse results into a synthetic index by urban block.
Buildings 12 00247 g003
Figure 4. Density of buildings with a higher need for rehabilitation index.
Buildings 12 00247 g004
Figure 5. Density of buildings with a higher need for rehabilitation index in Ciutat Vella.
Buildings 12 00247 g005
Figure 6. Density of buildings with a higher need for rehabilitation index in the north of the city (Nou Barris, Zona Nord and El Carmel).
Buildings 12 00247 g006
Figure 7. Density of dwellings with a higher need for rehabilitation index city plan.
Buildings 12 00247 g007
Figure 8. Density of dwellings with a higher need for rehabilitation index in the Raval (left) and the Besòs-Maresme (right) neighborhoods.
Buildings 12 00247 g008
Figure 9. Visualization of results in the Raval neighborhood. On the left, disperse distribution of disaggregated data results (Adapted from Ref. [29]); in the center, synthetic visualization of results aggregated by average per urban block; on the right, visualization of results obtained by the purposed methodology.
Buildings 12 00247 g009
Figure 10. Comparison of maps of results obtained in the study of detection of areas of vulnerability (on the left) (Adapted from Ref. [24]) and the present study (on the right).
Buildings 12 00247 g010
Figure 11. Comparison of maps of results obtained in the study of detection of areas of vulnerability (on the left) (Adapted from Ref. [24]) and the present study (density of buildings in the center, and density of dwellings on the right) in the El Raval neighborhood.
Buildings 12 00247 g011
Figure 12. Comparison of maps of results obtained in the study of detection of areas of vulnerability (on the left) (Adapted from Ref. [24]) and the present study (density of buildings in the center, and density of dwellings on the right) in the El Besòs i el Maresme neighborhood.
Buildings 12 00247 g012
Figure 13. Area-based rehabilitation being implemented in the Trinitat Vella neighborhood (Adapted from Ref. [43]).
Buildings 12 00247 g013
Figure 14. Map of the Program for High-Complexity Buildings first implementation in the Raval neighborhood (Adapted from Ref. [32]).
Buildings 12 00247 g014
Table 1. Number of buildings and dwellings with pre-diagnosis data available per neighborhood.
NeighborhoodNumber of Buildings StudiedNumber of Dwellings Studied
01 Raval1.11710.282
02 Gòtic3251.861
03 Barceloneta7345.264
04 Sant Pere, Santa Caterina i La Ribera4733.415
11 Poble Sec1.42615.259
12 La Marina del Prat Vermell2940
13 La Marina de Port1081.052
34 Can Baró6524.070
37 El Carmel1.81813.109
38 La Teixonera102479
39 Sant Genís dels Agudells14311
46 Turó de la Peira3056.856
47 Can Peguera627899
50 Roquetes5763.769
51 Verdum5575.555
52 Prosperitat1.10011.343
53 Trinitat Nova1072.032
54 Torre Baró387461
55 Ciutat Meridiana532.482
56 Vallbona95109
57 Trinitat Vella3451.962
58 Baró de Viver13345
59 El Bon Pastor5731.452
70 El Besòs i el Maresme1823.297
73 La Verneda i la Pau20603
TOTAL11.73896.307
1 The list of neighborhoods is numbered according to the administrative numbering (see map on the right in Figure 1).
Publisher’s Note: MDPI stays neutral with regard to jurisdictional claims in published maps and institutional affiliations.

