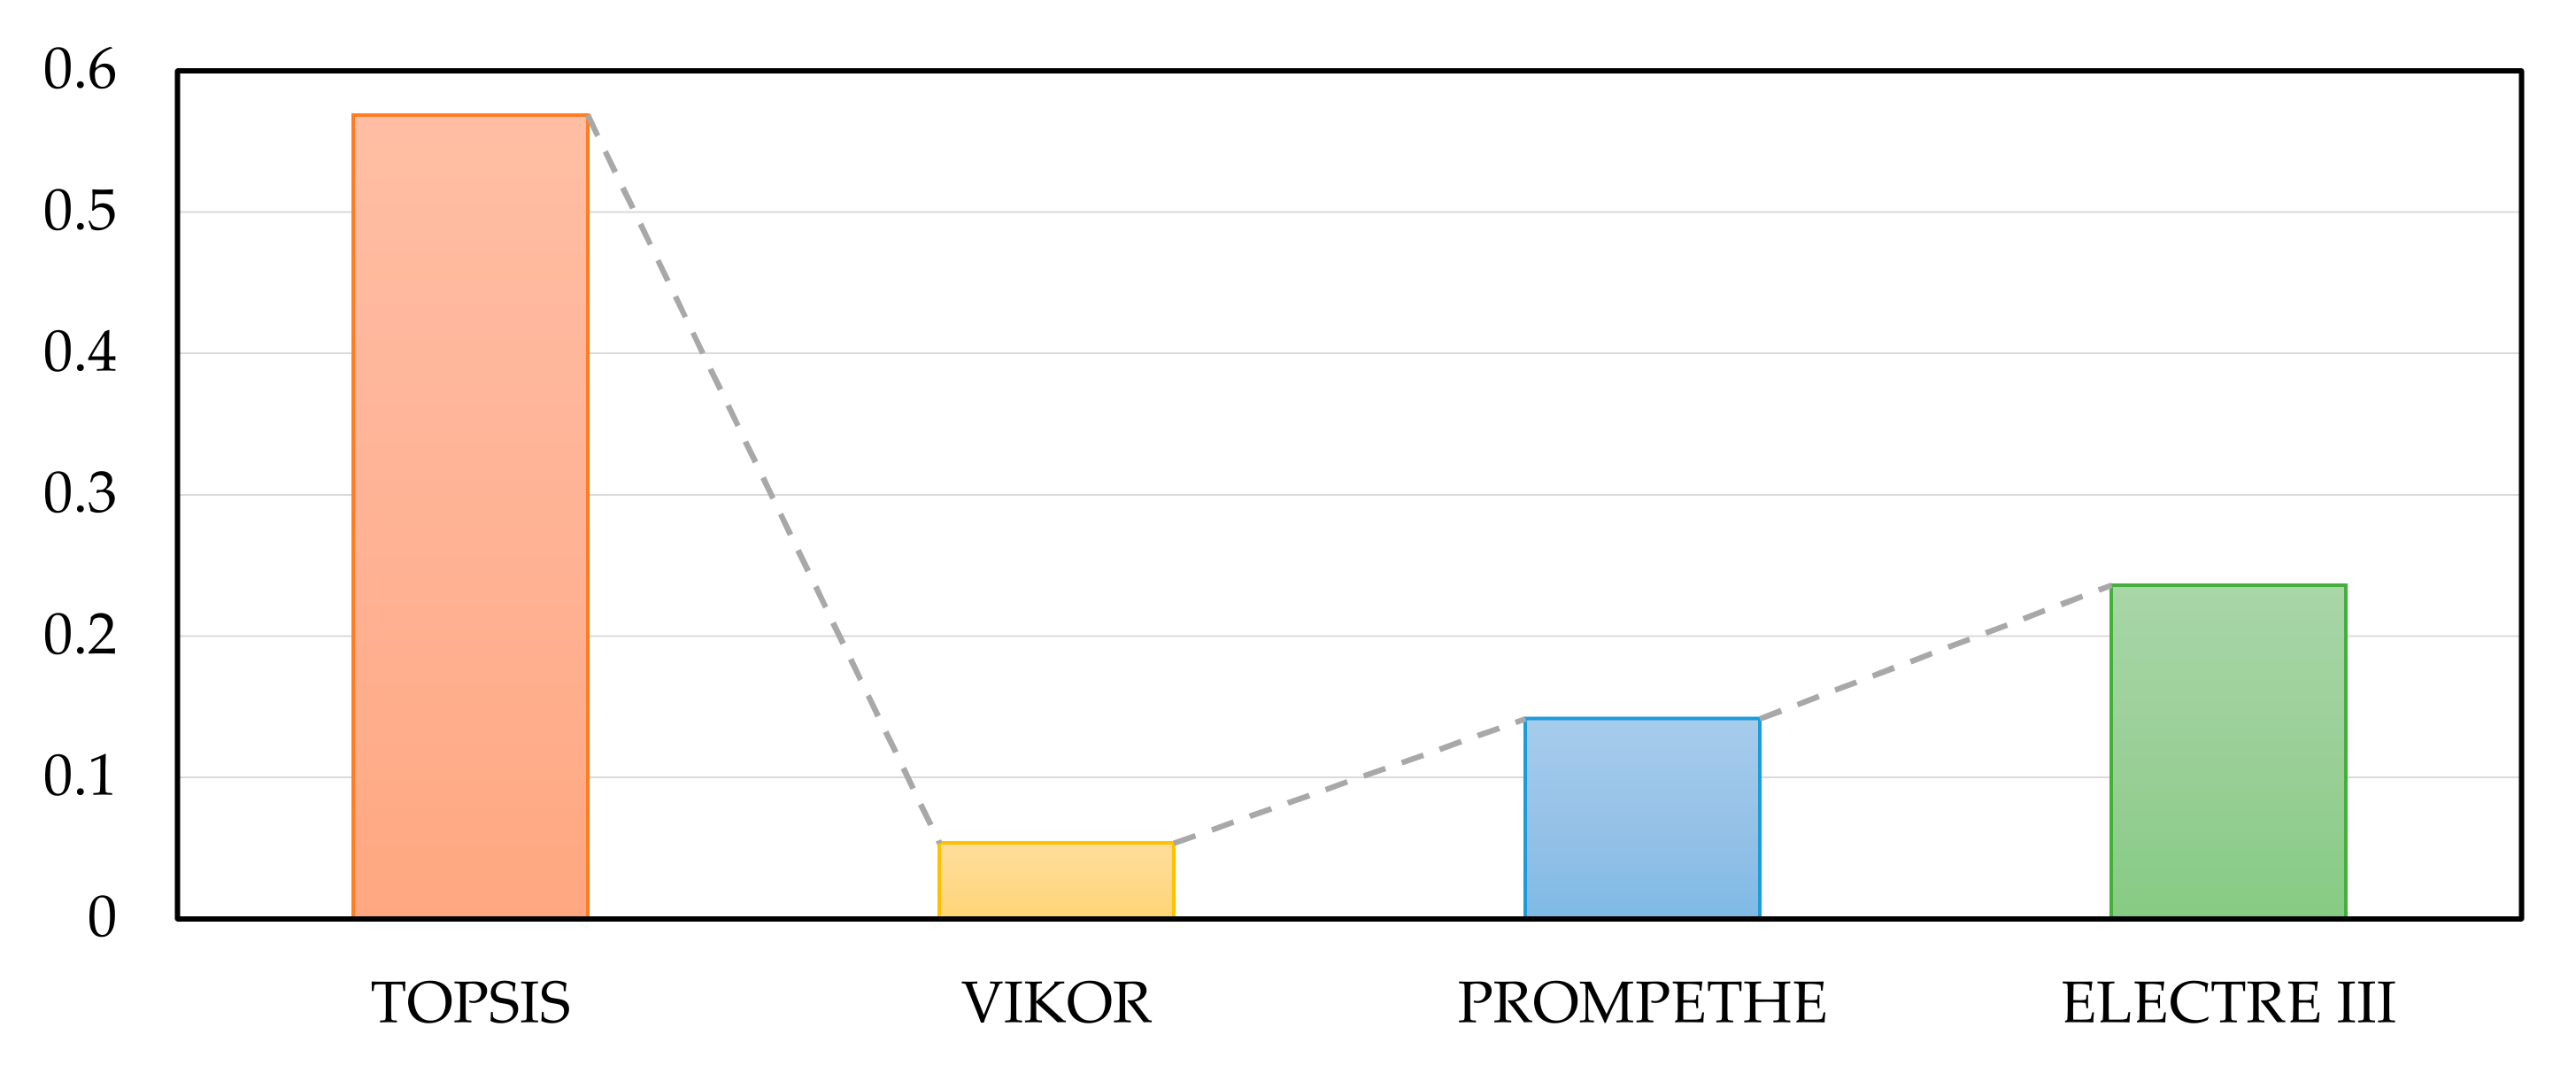
Article

Prioritizing Post-Disaster Reconstruction Projects Using an Integrated Multi-Criteria Decision-Making Approach: A Case Study

by
Zahra Mohammadnazari
1,
Mobina Mousapour Mamoudan
1,
Mohammad Alipour-Vaezi
1,
Amir Aghsami
1,2,*,
Fariborz Jolai
1 and
Maziar Yazdani
3
1
School of Industrial and Systems Engineering, College of Engineering, University of Tehran, Tehran 1439955961, Iran
2
School of Industrial Engineering, K. N. Toosi University of Technology (KNTU), Tehran 1999143344, Iran
3
School of Built Environment, University of New South Wales, Sydney 2052, Australia
*
Author to whom correspondence should be addressed.
Buildings 2022, 12(2), 136; https://doi.org/10.3390/buildings12020136
Submission received: 21 December 2021 / Revised: 21 January 2022 / Accepted: 25 January 2022 / Published: 27 January 2022
(This article belongs to the Special Issue Construction Management and Disaster Risk Management)

Abstract

:
As the destructive impacts of both human-made and natural disasters on societies and built environments are predicted to increase in the future, innovative disaster management strategies to cope with emergency conditions are becoming more crucial. After a disaster, selecting the most critical post-disaster reconstruction projects among available projects is a challenging decision due to resource constraints. There is strong evidence that the success of many post-disaster reconstruction projects is compromised by inappropriate decisions when choosing the most critical projects. Therefore, this study presents an integrated approach based on four multi-criteria decision-making (MCDM) techniques, namely, TOPSIS, ELECTRE III, VIKOR, and PROMETHEE, to aid decision makers in prioritizing post-disaster projects. Furthermore, an aggregation approach (linear assignment) is used to generate the final ranking vector since various methods may provide different outcomes. In the first stage, 21 criteria were determined based on sustainability. To validate the performance of the proposed approach, the obtained results were compared to the results of an artificial neural network (ANN) algorithm, which was applied to predict the projects’ success rates. A case study was used to assess the application of the proposed model. The obtained results show that in the selected case, the most critical criteria in post-disaster project selection are quality, robustness, and customer satisfaction. The findings of this study can contribute to the growing body of knowledge about disaster management strategies and have implications for key stakeholders involved in post-disaster reconstruction projects. Furthermore, this study provides valuable information for national decision makers in countries that have limited experience with disasters and where the destructive consequences of disasters on the built environment are increasing.

1. Introduction

Over the last several decades, there has been a remarkable increase in the frequency, magnitude, and severity of human-made and natural disasters such as terrorist attacks, earthquakes, hurricanes, and large floods, which have had severe immediate and long-term consequences on the economy, society, and built environment [1]. Such events have challenged critical infrastructures in many countries [2]. Recent disasters have highlighted the vulnerability of many countries to disasters [3]. For example, the extent and severity of damage to city infrastructure during extreme floods in Golestan, Iran, in 2019 had a negative impact on healthcare services [4]. Similar challenges have been reported across the world in recent years, such as the damage caused by the recent earthquake in Indonesia [5].
Many cities around the world are being built in areas prone to natural disasters [6]. Moreover, population growth and increased demand for facilities and buildings exacerbate the exposure of cities to the direct effects of natural disasters such as floods. For example, according to Yazdani et al. [7], many health infrastructures in Australia are located near rivers and oceans or in cyclone belts. As a result, various organizations are increasing the pressure on disaster management research to develop effective strategies for making cities resilient.
Despite the evolution of disaster risk management plans and strategies in recent years, the development of disaster risk management in the context of construction and built environments has not been sufficiently explored in the literature [8]. Following a disaster, the construction sector is often involved in various critical services, including providing temporary housing in the immediate aftermath and reconstructing permanent shelter and public infrastructure [9,10]. International organizations are designed to provide adequate humanitarian support, but they are not well experienced in the challenges associated with reconstruction projects, which is often complicated by a lack of planning and poor management [11,12].
Due to limited resources following a disaster, humanitarian organizations are unable to select and initiate all potential reconstruction projects [13,14]. As a result, selecting one or more projects from all possible projects is always one of the most challenging decisions in project-oriented companies and organizations. To ensure their success and survival, all humanitarian organizations seek the best decision to achieve their short-term and long-term goals. Reconstruction projects are chosen based on existing circumstances, long-term goals, and many other critical factors [15,16]. Project selection, as a combination of planning and decision making, can become a very complex process. One of the factors complicating the project selection process is the need to decide within the framework of an enterprise’s strategic goals and organizational structure while considering each project’s financial and strategic benefits. Each humanitarian organization should choose an appropriate model for selecting post-disaster projects based on its main approach and macro goals, taking into account internal and environmental conditions, as well as the constraints and considerations of effective and comprehensive criteria [17]. Many methods have come to the aid of managers to overcome the complexities of project selection, which in addition to simplifying decision making, have helped in the long-term sustainable development of humanitarian organizations by reducing costs and risk. As a consequence, in order to achieve a more consistent and reliable outcome in the process of selecting the most suitable project, it is required to first precisely identify the context of analysis and then employ an effective tool to analyze criteria that are inconsistent with the humanitarian organization’s strategic goals [18].
Multi-criterion decision-making (MCDM) techniques are mathematical tools that help decision makers (DMs) evaluate and rank potential options for multiple conflicting criteria in very complex situations [19]. MCDM is one of the best and most practical methods among existing methods for selecting and ranking projects [20]. In MCDM techniques, DMs’ basic problem concerns how the final decision should be made [21]. In many cases, this problem is posed in reverse: that is, assume that a decision has been made, find a reasonable basis for the decision, and evaluate the DM’s preferences [22,23].
Briefly, in view of the literature given above, this study aims to contribute to the literature by proposing an innovative methodology to predict the post-disaster project performance in addition to MCDM methods. To the best of our knowledge, no prior studies have considered criteria of sustainability to select optimal projects using Technique for Order Preference by Similarity to Ideal Solution (TOPSIS), Kriterijumsk Optimizacija Kompromisno Resenje (VIKOR), and Elimination et Choice in Translating to Reality (ELECTRE) methods and compared their results with Artificial Neural Network (ANN) methodology. To determine the weights of the criteria, the Best Worst Method (BWM) is applied, and the linear assignment method is formulated to compare the different possible results of the methods and achieve the final optimal ranking vector. It is worth noting that we applied several MCDM techniques in order to highlight two important points. Firstly, the supplier selection process is high risk, which is due to the fact that several criteria should be considered, and the way that these criteria are taken into account is significant. Having used several MCDM techniques, we attempt to consider several ways to collate all valuable criteria for managers. Secondly, because managers want to identify the most optimal solution for project selection, they explore various methodologies. In this vein, this study will provide them with good insights for making their decisions.
A real data set was used in this study to train an ANN algorithm, and the outcome was compared with the results of MCDM methods. To evaluate the application of the proposed method, this study investigated a real-life case study.
To fulfill the objectives of this study, Section 2 explores the literature on this research area, including a review of the literature on the project evaluation and ranking approach, the project evaluation and ranking hybrid approach, and sustainability and sustainable development. Section 3 outlines the problem, while Section 4 is dedicated to the case study. Section 5 examines the findings, while Section 6 concludes the research.
As a matter of convenience, all of the nomenclature used in this study is listed in Table 1.

2. Literature Review

This section explores the literature on the subject, including a review of the literature on the project evaluation and ranking approach, as well as sustainability and sustainable development.

2.1. Construction Project Evaluation and Ranking Approach

There are several methods for estimating and evaluating a project portfolio, but the inability to consider all aspects of the selection of the project portfolio and the difficulty in using some of these methods have made scientists conclude that the best and the most optimal solution for finding the best project has yet to be identified. Hess (1993) stated that management science has failed to provide functional models for selecting project portfolios; despite this fact, the main reasons that different models fail in the evaluation and selection of a project portfolio are:
  • Not considering the judgment and experience of DMs;
  • Focusing on financial methods and ignoring the importance of combined methods;
  • Not choosing criteria appropriate to the company’s strategy;
  • Weaknesses in dealing with non-financial aspects.
When considering hybrid methods for selecting a sustainable project, DMs consider environmental, economic, and social dimensions as targets for evaluation. In this approach, each decision maker has preferences and attitudes that may conflict with others [24]. Sustainability can examine investment risk, the organizational ability to invest, and strategic investment unions in a unique framework [25].
Ameyaw and Chan [26] used the fuzzy synthetic evaluation approach to examine significant risk factors in the three main factors (financial/commercial, legal and socio-political, and technical) and evaluate the risk level of public–private partnerships’ water supply projects. They generated input variables by FSE analysis. Li et al. [27] developed a TOPSIS-based approach to assess water quality. Since finding optimal solutions usually requires MCMD optimization, another study was conducted in the same year using the sum of ranking differences algorithm [28]. Because of the complexity of ranking concrete bridge projects and the similarity of solving this problem to the use of MCDM methods, Gao et al. [29] used the VIKOR method to prioritize various bridge repair projects.
Alabool et al. [30] used MCDM methods to solve the problems of cloud service evaluation. They used MCDM methods to select energy policies. Amin et al. [31] modeled a feature selection method as an MCDM process. They used the TOPSIS method to evaluate properties based on relationships. In 2020, a comparative analysis of some MCDM techniques was performed for the management of public procurement tenders [32].
Mohanty et al. [33] started to assess projects in the R&D field. Owing to the fact that risks and uncertainties are also inseparable parts of R&D projects, they combined the application of fuzzy analytic network process (ANP) with fuzzy cost analysis in project selection. Another study in the research and development (R&D) environment was conducted by Rahmani et al. [34]. Chiang and Che [35] used a fuzzy analytical hierarchy procedure (AHP) and fuzzy data envelopment analysis (DEA) to develop a method for evaluating and ranking new product development. They also used the Bayesian belief network to create risk assessment models to assist senior executives in analyzing and measuring new product development risks in the literature.

2.2. Sustainability and Sustainable Development

A triple bottom line approach can be used to assess corporate social responsibility, economic value, and environmental impact. Companies can use this approach to appraise the profits that they are making. Running businesses using the triple bottom line can represent the profitability and sustainability of a business [36]. The problem of implementing and measuring sustainability principles in the early stages of organizational assessment, like many technical and conceptual problems, remains unresolved [37,38,39]. Needless to say, practices to support decision making are important for systematically including sustainability criteria in project evaluation, selection, and processes [40,41].
Implementing sustainability can improve our quality of life and thus contribute to a healthy life and improve economic, social, and environmental conditions [42,43]. There is ample justification for the elucidation of sustainable development, the nature of which must be interdisciplinary [44].
In 2020, researchers from the United States applied MCDM methods to analyze and compare the potential success of different projects in different dimensions of an organization to study and select projects from a sustainability perspective in an uncertain three-column decision environment. They addressed economic, environmental, and social aspects and used the TOPSIS method to achieve the most sustainable solution [45]. In the same year, Akbari et al. [46] created a strategic decision-making model for sustainable marine renewable energy development, combining renewable energy portfolio selection and multi-objective methods. Table 2 shows a summary of the reviewed papers. Valipour et al. [47] used several MCDM techniques in order to assess the risks of projects in the area of construction and public–private partnerships. Their results indicated that all applied MCDM techniques led to relatively the same ranking of risk assessment.

2.3. Research Gaps and Contributions

The critical literature review above shows that there remain unresolved challenges and research gaps in the area of post-disaster reconstruction. Existing studies can only be considered the first steps towards a more profound understanding of post-disaster reconstruction planning, and many questions, particularly regarding project selection, remain to be addressed. However, the main gaps can be highlighted as follows.
Despite the many challenges in the scope of disaster operation management, particularly the barriers associated with post-disaster reconstruction projects, less attention has been paid to project selection in post-disaster conditions when certain constraints do not allow all available projects to begin concurrently. Furthermore, while sustainability factors are crucial in project selection, few previous studies have explored sustainability criteria for humanitarian construction projects. Additionally, there are numerous gaps in the use of methodologies and techniques for project selection. Existing studies have mainly relied on one technique, despite each method having some advantages and disadvantages. As a result, more integrated techniques for challenging project selection problems, particularly post-disaster reconstruction projects, which may follow specific goals, are required. Furthermore, while sophisticated machine learning methods are widely used to assist decision makers in a variety of areas of the construction industry, less attention has been paid to using these methods in project selection problems, even though they have a promising potential to deal with situations in which managers lack sufficient knowledge of such problems.
The aim of this study is to contribute to this developing area of research while also filling gaps in the existing post-disaster reconstruction literature. Therefore, this study developed an integrated MCDM method for project ranking based on four well-known methods that fit the context of post-disaster reconstruction projects. As a result, a thorough review was carried out to identify criteria that may influence decision making in the project selection process. The Best Worst Method (BWM) was used to determine the weights of criteria, and the final post-disaster project ranking was obtained by applying the proposed approach. The results of MCDM were then analyzed, and conclusions were drawn to allow managers to better decide on post-disaster construction project selection using a machine learning technique (ANN). The assessment framework was applied to a case study, and the effectiveness of various methods was evaluated and compared.

3. Problem Description and Methodology

In this research, the humanitarian portfolio selection of post-disaster construction projects is considered. In this regard, two applicable methods were utilized. Using MCDM techniques, which are presented in Section 2, DMs can evaluate their alternatives. Predicting the most successful project to manage is the main objective. Although MCDM approaches help DMs in this process, some other prediction tools, such as ANN, are of great importance in the prediction of the best project. In this study, MCDM approaches and ANN were used, which will remove the barriers in construction management to help DMs to make better decisions with more revenue. This study included two main stages: in the first stage, a hybrid MCDM approach was applied to find the best post-disaster project; in the second stage, an ANN algorithm was used to predict the success rate of each project. The obtained results of ANN and the hybrid MCDM approach were compared to confirm the validity of the proposed methodology. The proposed hybrid MCDM approach consists of linear assignment, VIKOR, BWM, and TOPSIS methods. With the help of VIKOR, BWM, and TOPSIS methods, the ranking of the projects is obtained. Furthermore, these rankings are considered inputs for the linear assignment method. As the contractor pays attention to resilience engineering while considering the triple bottom line of sustainable development and the balanced scorecard, the process of finding criteria took place at the beginning of the study. The procedure of criteria selection is pivotal. After reviewing articles on project portfolio management, sustainability, resiliency, and the balanced scorecard and using experts’ opinions, the desired criteria were found. The above-mentioned criteria are discussed in the next section. In the second stage, which is related to ANN application for the prediction of construction projects’ success, the inputs and outputs of the ANN algorithm are identified, and the project success based on the predetermined outputs is shown. Figure 1 demonstrates the research methodology.

3.1. Criteria

The criteria that were considered in this study are divided into two parts: input criteria and output criteria. Input criteria include financial, qualitative, environmental, and social factors, which are discussed in this section. Financial factors are one of the most critical aspects of selecting post-disaster projects for humanitarian managers. In this study, this factor consists of human resources, machinery and equipment, material, and energy costs. This is an undesirable factor, meaning that the lower its value, the better. The next factor in the input criteria is quality. Quality is an essential factor due to its direct impact on the project’s outcome. Quality consists of two sub-criteria: materials and certifications. The quality of the material in construction activities has direct impacts on output criteria such as robustness and recovery time. Quality controls, standards, and certifications such as ISO 9000 are necessary to prevent and resolve problems. This criterion is a desirable factor. In recent years, there has been increasing attention to environmental issues. Hence, we consider this factor with the following sub-criteria: standards, staff, technologies, energy, greenhouse gas (GHG) emissions, and materials. The first sub-criteria are the associated environmental standards and certifications applied by constructors and managers to prevent environmental contamination and control environmental activities. The level of environmental awareness of staff and endeavors such as staff training for the environmental objective is another sub-criterion for the environmental factor. The next sub-criteria are for the technologies used in construction activities. It is important to use environmentally friendly technologies to consume material and energy more efficiently. Using renewable energy and reusable and recyclable materials are another two sub-criteria of this factor. The last and the most common sub-criterion to evaluate the environmental factor is GHG emissions, such as CO2. As CO2 is the most important undesirable environmental pollutant, we use the method of Zhang et al. [49] to calculate the amount of CO2 emissions from construction activities. Except for these sub-criteria, the other five sub-criteria are desirable. To consider sustainability, social factors should be added to the input factors too. This factor includes four sub-criteria: the interests and rights of the employees; health, safety, and environment (HSE); and job creation. The interests and rights of employees consist of sub-criteria too. Workers’ wages, working hours in comparison to international standards, the safety conditions of employees, extra benefits that the company provides to its employees, and possible compensations and health services in case of an accident are the sub-criteria. The construction industry is associated with several risks in construction and operation. HSE helps constructors and managers to control these risks to prevent the most common reasons for accidental death and injury. Hence, this factor is a desirable sub-criterion. The number of job opportunities caused by approving a project is another sub-criterion that is considered in social criteria.
The output criteria consist of resilience and financial factors. Among resilience criteria, robustness is the first and foremost criterion. Robustness is defined as the ability to tolerate the impact of an event with high severity. The critical point of resilience assessment for robustness is at the beginning of the impact of an event, and its steps should be taken at the design phase. The resilience criterion is a desirable factor. One of the most attractive output criteria is the profit of the project. In this study, this criterion is considered to be the gross output value that demonstrates the gross amount of revenue of a project in a predetermined period. This criterion examines total floor space and the price of the building under construction. The next criterion is customer satisfaction. In every organization, customers play a decisive role. Hence, customers are pivotal in the decision-making process. Table 3 and Table 4 indicate the input and output criteria.

3.2. Multi-Criteria Decision-Making Methods

Project selection is a complex task, and many construction companies choose to handle it by using more analytical and reliable approaches. In this context, it is apparent that MCDM approaches are useful tools for ranking alternatives and selecting a suitable one among them by analyzing them against a variety of criteria. Construction project evaluation is another MCDM process that necessitates the consideration of various factors. At present, MCDM approaches are seen as suitable methods for assessing all aspects of decision-making problems and obtaining a satisfying result for decision makers. Some of the most well-known MCDM techniques in decision-making and policy-making problems are briefly explained below:
  • TOPSIS (Technique for Order Preference by Similarity to Ideal Solution) was first proposed by Hwang and Yoon [50]. The distances of the alternatives to positive- and negative-ideal solutions are used to select the optimal option. The TOPSIS approach computes a similarity index to the positive-ideal solution and a distance index from the negative-ideal solution. The alternative whose value is closest to the positive-ideal solution is chosen as the best alternative at the conclusion of the stages [51]. The TOPSIS technique is based on the assumption that each characteristic has a monotonically rising or falling utility. This makes it simple to find the best and worst possible options [52]. For more information, please refer to Appendix A.
  • ELECTRE III is an MCDM approach that allows for the handling of both quantitative and qualitative discrete criteria as well as the ordering of options throughout the decision-making process [53]. The dominance relations between alternatives are the focus of this strategy. This outranking approach employs a pairwise comparison matrix among choices. Several variants of ELECTRE have been developed for use in various decision-making circumstances [54,55]. One of the primary strengths of ELECTRE is that both quantitative and qualitative criteria are considered. For more information, please refer to Appendix B.
  • VIKOR was designed for the multi-criteria optimization of complex systems. It computes the compromise ranking list, the compromise solution, and the weight stability intervals for preference stability of the compromise solution produced with the initial (provided) weights [56]. In the context of conflicting criteria, this strategy focuses on ranking and selecting from a set of alternatives. It introduces the multi-criteria ranking index, which is based on a specific measure of “closeness” to the “ideal” solution. The authors of [57,58] pioneered the concept of a compromise solution in MCDM. For more information, please refer to Appendix C.
  • The PROMETHEE method is one of the most well-known and extensively used outranking strategies for comparing alternatives for each separate criterion. In PROMETHEE I, partial ranking is achieved by computing the positive and negative outranking flows [59], which do not always convey the same rankings. PROMETHEE II was chosen for the evaluation because the decision maker always needs a full ranking [60]. This approach begins with the formulation of options and a set of criteria, which are then transformed into an m × n decision matrix. It proposes six forms of preference functions to express the importance of the relative difference between alternatives for a given criterion, as well as weights to reflect the criterion’s relative relevance. For more information, please refer to Appendix D.
Table 5 summarizes the advantages and disadvantages of several MCDM approaches, as presented by [61].

3.3. Artificial Neural Network

A wide range of complex and difficult tasks are addressed by ANNs in technology and construction. ANNs can be viewed as influential learning models capable of revealing desired outcomes in the face of numerous supervised/unsupervised machine learning challenges. Machine perception problems in which the given primary features cannot be interpreted individually are ideal for the use of ANN. As a result, they have been extensively studied and applied to a wide variety of tasks [62].
Neural architectures and paradigms come in a wide variety of shapes and sizes. Feedforward neural networks (FNNs) are one of the most widely accepted and straightforward methods for approximating various functions, including continuous and integrable ones. Multi-layer perceptron (MLP) neural networks are a clear and concise type of FNN. There are numerous benefits to MLP, including the ability to learn and generalize, a smaller training set, quick performance, and ease of implementation. One input layer, at least one hidden layer, and an output layer comprise an MLP [63]. Figure 2 depicts a typical neuron inside an ANN framework.
MLP is a non-parametric technique that can be used to perform a wide range of prediction and estimation tasks. The input values are sent to the hidden layer(s) via the input layer. Assume there are L hidden layers. There are N l neurons in the hidden layer L . The weight of the connection between the j th neuron of the L 1   th hidden layer and the i th neuron of the L th hidden layer is represented by w i j L . In addition, θ i L is the bias parameter of the i th neuron of the L th hidden layer. Assume x i is the i th input parameter.   y ¯ l i represents the output of the i th neuron of the l th hidden layer, which can be calculated as:
  y ¯ l i = F j = 1 N L 1 w i j l   y ¯ l i 1 + θ i l ,   i = 1 , , N L ,       L = 1 , , L
  y ¯ i 0 = x i   , i = 1 , , N x ,       N x = N 0
In Equation (2), f 0 is the activation function. Assume that B k is the bias parameter of the k th output neuron, and v k i is the weight of the connection between the i th neuron of the l th hidden layer and the   k th neuron of the output layer. The following is a formula for calculating MLP outputs:
y k = i = 1 N l v k i y i L + B k   ,   k = 1 , , N Y
Training is a process that can be used to construct an NN model. Assume that the training data are made up of N p sample pairs, x p a n d d p ) ,   p = 1 , 2 , , N P , where x p and d p are N x and N y dimensional vectors that represent the inputs and the anticipated outputs of the constructed model, respectively. Assume that w is a weight vector that contains all of the N w weights of the NN. In training, the aim is to pursue a value for w such that the error between the NN predictions and the desired outputs is as minimal as possible,
min w E w ,
where
E W =   1 2 p = 1 N p k = 1 N Y ( y p k ( X p , w ) d p k ) 2 =   1 2 p = 1 N p e p w
d p k represents the k th element of the vector d p , y p k x p w , shows the k th output of the model when the input presented to the network is x p , and e p w represents the error in the output due to the p th sample. For updating the weights of the NN, each training method has a unique set of rules [64].
The development of an ANN model relies heavily on the use of training algorithms. Even a good topology may fail to produce an effective model without proper training. Accuracy and efficiency will both improve with a good training algorithm. As a result, ANNs have a built-in training process that involves repeatedly feeding representative examples of the input data into the network so that it can understand and accept new information. Searching an error surface for points with the lowest error using gradient descent can be used to train an MLP. This is a straightforward method. However, there are some drawbacks. As a result, gradient descent cannot guarantee that it will find the error function’s global minimum. An appropriate weight solution frequently necessitates lengthy training sessions. Levenberg–Marquardt and other advanced techniques were proposed as a result. The Gauss–Newton approach is combined with the steepest-descent algorithm in a way that minimizes its drawbacks. Slow convergence has no effect on it [64].
The application of ANN in this article goes back to the prediction of the success rate for projects. Due to the importance of identifying managers’ preferences and previous project selection, a method should be applied that is able to consider previous decision making; ANN is chosen in this regard. The application of ANN will also provide substantial managerial implications. The output of this method is the prediction of projects’ success, which is then compared to the integrated MCDM results. To the best of our knowledge, historical data pave the path of decision making for DMs in ANN.

4. Case Study

In this section, we present a real-life case study to investigate the application of the proposed methodology for selecting and ranking post-disaster construction projects. Khakpey Company (KP) was selected as a case study since it has been active in various fields of civil engineering and has carried out various projects. Since the establishment of this company in Iran in 1992, KP has been continuously working in the field of technical and engineering services, including geotechnical studies and the design, supervision, and implementation of geotechnical projects, including stabilization of pits, tunnels, piles, and jacked piles. The hiring of professional staff has led to the company’s capabilities for analysis, design, construction, and supervision of various structures, including the construction of underground structures, deep drilling, and deep facilities. KP has also worked on many projects in Iraq, such as designing the first building for a steel structure in Sulaymaniyah. A project of Baghdad’s Al-Akhwa residential complex, which includes the construction and refurbishment of 9000 concrete piles, along with a static and dynamic loading test, is underway. In addition, the company designed the Baghdad Airport Project Building. It is noteworthy that due to its participation in a large number of projects in Iraq, Darya Khak has established offices in Basra and Baghdad. In recent years, specialized geotechnical contracting has been an important part of the company’s activities, and the company provides consulting, design, and implementation management services to the public and private sectors. Figure 3 shows areas of some projects in Iraq. Due to the presence of geotechnical, structural, architectural, road construction, and port construction specialties in this company, a practically suitable platform in terms of analysis, design, testing, supervision, and implementation of underground structures (e.g., tunnels, underground infrastructure stations, coastal facilities, and deep excavations), as well as the design and execution of deep foundations (piles), including bored piles and pile driving, is in the company’s executive body.
KP is active in post-disaster projects as well, and since several post-disaster projects are underway, it is difficult to choose which projects to work on according to the organization’s criteria. This study assisted the company by using data from completed successful projects and applying the methodology described in the previous sections. It is noted that data were collected mostly through surveys. For this purpose, some questionnaires were designed and sent to the top managers and decision makers in the organization. After filling out the questionnaire based on the identified criteria, the decision-making process and further analysis were initiated. The validity of the questionnaire was calculated through Cronbach’s alpha test. The result of the evaluation is 0.83, which indicates that the questionnaire is acceptable and valid, and further steps of the analysis can be carried out.

5. Results and Discussion

5.1. MCDM Results

In the first step, with the help of some MCDM techniques, we aimed to rank the possible alternatives in KP. The company is trying to identify the discriminant features of 10 post-disaster projects as possible alternatives and then select two of them. We designed a questionnaire for the decision-making process. This questionnaire was completed with the help of a top manager in the company to complete the decision-making process. As a result, 21 criteria and 10 possible alternatives were identified. The criteria that were used in the designed questionnaire are mentioned in Section 3.1. The validity of the questionnaire was confirmed through Cronbach’s alpha test. The Cronbach’s alpha test shows a score of 0.93, which indicates that our obtained scores for projects can be regarded as valid for the next phase. Using the obtained scores for each project based on DMs’ opinions, we applied the linear assignment method for ranking the alternatives. As the linear assignment is a method that aggregates multiple decision-making methods, we used TOPSIS, ELECTRE III, VIKOR, and PROMETHEE. First, we obtained the ranking and weights of each project by TOPSIS, ELECTRE III, VIKOR, and PROMETHEE separately, and then with the help of linear assignment, we aggregated the results to find a unique ranking.
The results of these four methods are shown in Table 6. In the aggregation process, PROMETHEE is considered to be the best method, while VIKOR is the least favored. With the help of BWM, we assigned preference levels to each method to find their weights (based on the assumption that PROMETHEE is considered the best method while VIKOR is the worst). After obtaining the weights of each method by BWM, the linear assignment was applied. The final results of the linear assignment show that among the possible construction projects, the first project is the most ideal one. The sixth project is in the second rank. By scrutinizing the obtained decision matrix and comparing the final project selection results, we observed that robustness, gross income, and customer satisfaction play a great role in construction project selection. Here, it has to be mentioned that BWM is discussed in Appendix E to provide a better understanding of this method.

5.2. ANN Results

The data set was first split into four divisions, and then one division was taken as the validation and test sample, and the remaining data were the training set. To gather the required data, the research objective was explained to the top managers in the humanitarian organization. Based on the previous analysis that was carried out, they were well aware of the present situation of the humanitarian organization and its shaping factors in decision making. The data collected included 200 previous projects that were previously implemented. These projects vary in some features, such as duration, budget, dependencies, and contradictions.
In MLP, the outputs are considered to be the degree of project success, while the input is a vector of project managers’ evaluations. The design of neural networks for classification problems is the basis of the application of MLP. In this study, with the help of 200 previous projects, we aimed to estimate the success factor of the following 10 projects. DMs needed to identify the success factors of these 10 projects to decide which one was worthy of investment. The identification procedure was based on the 200 previous projects with the help of MLP. Figure 4 and Figure 5 show the error and R-value results for all data and training data, respectively. The results show that the given data are valid and can be used for ANN modeling. The results are valid when the R-value is high and the MSE value is as low as possible. Based on the obtained results, the modeling phase was initiated. Via ANN modeling, we obtained the degree of success for each project. The final ANN results are shown in Table 7. As the results show, the second project is of high importance relative to others, and in the second stage, the fourth project is preferred. The final results of ANN show the similarity of the VIKOR-based linear assignment method and ANN.

5.3. Further Discussion

In this section, we evaluate the efficiency of different methods over the other ones. Moreover, this section presents different strategies for DMs to make better decisions when it comes to identifying the best MCDM method to rank their future projects. Once we prioritized the projects with the ANN method, we prioritized the projects again with MCDM. We used BWM and weighed the projects. Then, we used the linear assignment method to integrate the priorities that we obtained from each method and obtain a final ranking. In BWM, we first considered the importance of all variables, which are the results of our methods (TOPSIS, ELECTRE III, VIKOR, and PROMETHEE), to be equal. Then, we tried to change the importance of each method and reviewed the results. Table 8 shows the priority of project selection by considering different priorities in different ways.
As can be seen in Table 8, if we consider the same weights for each method, the priority for selecting our projects will be in the order A1, A6, A3, A10, A4, A5, A2, A9, A8, and A7. If we increase the weight of the TOPSIS method, the prioritization of our projects does not change. Once again, we set a higher weight for the VIKOR method. We see that the changes that have taken place in the selection of projects are very significant. Project A1, which was our priority in the previous two methods, has changed to our last priority. The A6 project, which was our second priority, has also dropped to eighth place. If we increase the weight of the PROMETHEE method, we will not find much difference in the prioritization of projects from the first two parts. This difference is only in the superiority of project A10 over project A3. In this method, the A10 project has a higher priority for selection, while the A3 project selection priority was higher in the first two methods. If we increase the weight of the ELECTRE III method, our prioritization will change considerably. In this method, projects A9, A1, A6, A3, A4, and A5 have almost the same position as in the first two parts.

6. Conclusion and Managerial Insight

This study applied a novel hybrid methodology for project selection after the occurrence of a disaster. In the first step, we aimed to identify criteria that are applicable to the project selection procedure. We used a literature review and an interview with an expert. After this step, to find the weights of each criterion, BWM was applied. Figure 6 shows the results obtained by BWM regarding the comparison of methods.
After determining the weights, the ranking phase was initiated. In this phase, both compromise and non-compromise methods were utilized to help DMs in the decision-making process. TOPSIS, VIKOR, ELECTRE, and PROMRTHEE were used in this step. Among these methods, TOPSIS and VIKOR are compromise decision-making tools. In non-compromise methods, a trade-off between criteria is not allowed. In other words, a large value for one of the criteria cannot compensate for other values. The final ranking vector was obtained using the linear assignment method. Afterward, an ANN algorithm was applied to predict the projects’ performance using projects’ historical data.
The results of the methods indicate that the non-compromise method and TOPSIS method (s compromise method) produce almost the same results, and alternatives A1 and A6 are chosen to work on. In addition, VIKOR and ANN methods produce almost the same ranks, too. In these methods, alternatives A2 and A7 are chosen. The results demonstrate that VIKOR and ANN methods pay more attention to the quality criterion in input criteria, and robustness and customer satisfaction in output criteria regarding the alternatives have the highest ranks using these methods. However, TOPSIS and non-compromise models such as ELECTRE and PROMRTHEE consider sustainability criteria as environmental and social factors in addition to output criteria and quality criteria. Based on consultations with company managers, sustainability criteria have a considerable impact on decision making. Hence, alternatives A1 and A6 are chosen to work on in the company, and the linear assignment method, which is a model that aggregates the methods, is chosen as the final model for decision making.
In summary, the following managerial insights can be helpful for DMs.
  • The most critical criteria in post-disaster project selection are quality, robustness, and customer satisfaction. Therefore, it is suitable for DMs to pursue a project with higher humanitarian benefits.
  • Applying this method can be helpful for DMs not only in post-disaster construction project portfolio selection but in any construction project selection.
  • DMs can use ANN to predict their optimal portfolio if they lack access to relevant experts.
  • Having used several MCDM techniques, we attempted to consider several ways to consider all valuable criteria for managers. Because managers want to identify the most optimal solution for project selection, they explore various methodologies. In this regard, this study will provide them with good insights to support their decision making.
It is worth noting that the ranking of alternatives (construction projects) based on the above-mentioned methodology has two different results: the first one was derived using equal weights of applied MCDM methods, and the second one was obtained using optimized weights. Comparing these two results is important for managers when choosing the most appropriate approach for their case; Figure 7 shows these results.
This research is associated with the following limitations:
  • The investigated case study was related to several different disasters. Therefore, the characteristics of the disaster were not taken into account.
  • The real-life case study, described in Section 4, is related to the Middle East, especially Iran and Iraq. If this method is used to investigate other projects in different locations, different results may be obtained.
Furthermore, we strongly recommend that researchers pursue the following issues:
  • Considering the post-disaster projects of a specific disaster;
  • Using other methods for the integration of MCDM results, including ensemble ranking [65];
  • Investigating the proposed methodology in a different geographical location.

Author Contributions

All authors contributed to the study’s conception and design. Material preparation, data collection, and analysis were performed by Z.M., M.M.M., M.A.-V., A.A., F.J. and M.Y. The first draft of the manuscript was written by Z.M., M.M.M. and M.A.-V. and all authors commented on previous versions of the manuscript. Z.M., M.M.M. and M.A.-V.: Conceptualization, writing, methodology, and software. A.A., F.J. and M.Y.: supervision, project administration, and review and editing. All authors have read and agreed to the published version of the manuscript.

Funding

This research received no external funding.

Institutional Review Board Statement

Not applicable.

Informed Consent Statement

Not applicable.

Data Availability Statement

The data used in the study are available from the authors and can be shared upon reasonable request.

Conflicts of Interest

The authors declare no conflict of interest.

Appendix A. TOPSIS

Hwang and Yoon initially proposed TOPSIS (Technique for Order Preference by Similarity to Ideal Solution) in 1981. The goal of this strategy is to rank the alternatives by calculating the distance between each alternative and the positive- and negative-ideal solutions for decision-making issues and then determining the best option. The following steps describe the approach provided by [66]:
Step 1: Decision matrix R = { r i j }s, where r i j (i = 1, 2, …, m; j = 1, 2, …, n) is the value of the j th attribute in the i th alternative, is identified in this step.
Step 2: The difference in attributes and the order of magnitude should be considered; then, decision matrix R is normalized, and the normalized matrix is transformed to R ´ = { r i j } ´ v   .
Step 3: The weighted normalized decision matrices are found: v i j = W j   r i j ´ .
Step 4: D I S   and D N I S are identified by the following equations:
S i + = j = 1 n v i j v j + 2 S i = j = 1 n v i j v j 2  
Step 5: The relative closeness of each alternative is calculated in this step by the following equation:
R C i = S i S i + + S i
The value of relative closeness reflects the relative superiority of the alternatives. A larger R C i indicates that alternative i is better, whereas a smaller R C i indicates that this alternative is poorer.

Appendix B. ELECTRE III

Let us imagine that we want to compare options A and B and determine which is the better alternative. ELECTRE is a self-contained procedure that does not require compensation. Procedures that are not compromise methods are frequently split into two halves. The first stage is outranking, and the second is exploitation. In the first step, we want to see if option A is better than option   B . We attempt to figure out how they compare in the second step.
To accomplish this, we must first examine the ELECTRE family’s preference structure. The ELECTRE’s preference structure is denoted by the letters P, I, and R. The problem is that we aim to keep superiority apart from superiority. During the technique under consideration, we assert that choice A is superior to option B . When we make a decision, however, we use the word preference, which implies that option A is preferable to option B . This preference structure is depicted in Equations (A3)–(A6), which we explore. As stated in Equation (1), option A is superior to option B ; however, option B is not superior to option A . As a result, option A is chosen over option B .
a S b   a n d   n o t   b S a ,   i e   ,   a P b     a   is   strictly   preferred   to   b
Equation (A4) shows that option B is superior to option   A , and option A is not superior to option   B . As a result, option B is strictly preferred to   A .
b S a   a n d   n o t   a S b ,   i e   ,   b P a     b   is   strictly   preferred   to   a
Equation (A5) shows that both option A is superior to option B and option B is superior to option   A , so option A and option B are equivalent or indifferent to each other.
b S a   a n d   a S b ,   i e   , a I b   (   a   i s   indifferent   to   b )
Equation (A6) shows that option A is not superior to option   B , nor is option B superior to option   A . This relationship does not mean that the two options are indifferent to each other, but it does mean that the two options are not comparable.
n o t   b S a   a n d   n o t   a S b ,   i e   , a R b   (   a   i s   incomparable   to   b )
When there is not enough information regarding an issue’s alternatives, we can add one or more criteria to the options. Adding one or more criteria to the mix may be enough to solve the problem.
ELECTRE should be used to solve problems that have at least 3 and no more than 13 criteria. It is also better if the criteria are varied or have specific numerical values. In ELECTRE, each criterion is compared to itself.
The ELECTRE approach is based on the calculation of two criteria. The declaration of these two conditions gives rise to the difference between the ELECTRE types. Let us assume that we want to evaluate options A and B and determine if option A is better than option B . We must consider the following two conditions:
  • Concordance. This condition tells us that to show the superiority of option A over option   B , we must show the concordance between this pair. Let us show the evidence that supports the superiority of option A over   B .
  • Non-discordance. In this condition, we gather evidence that indicates the superiority of option A over   B .
These two conditions suggest that option A must first meet the concordance criterion before being regarded as superior to option   B . In that instance, we have evidence that option A is better than option B . Second, there is no evidence that option A is preferable to option B . As a result, option A is superior to option B .
The aim is to have a total weight of one for all of the criteria.
Another factor to consider is the lack of veto power. In the non-discordance situation, we determine the disadvantages. When criteria are vetoed, if an option exceeds most of the requirements without a criterion being rejected, that criterion may veto the supremacy of all criteria. This is seen in Equation (A7).
g j b   g j a v j
As long as the difference in veto criteria between the two choices does not exceed   v j , this relation shows that option A is preferable to option B . v j is referred to as a veto limit in this context. The difference between options A and B should be less than the veto limit under this criterion. We use ELECTRE III to solve this problem since it considers uncertainty.
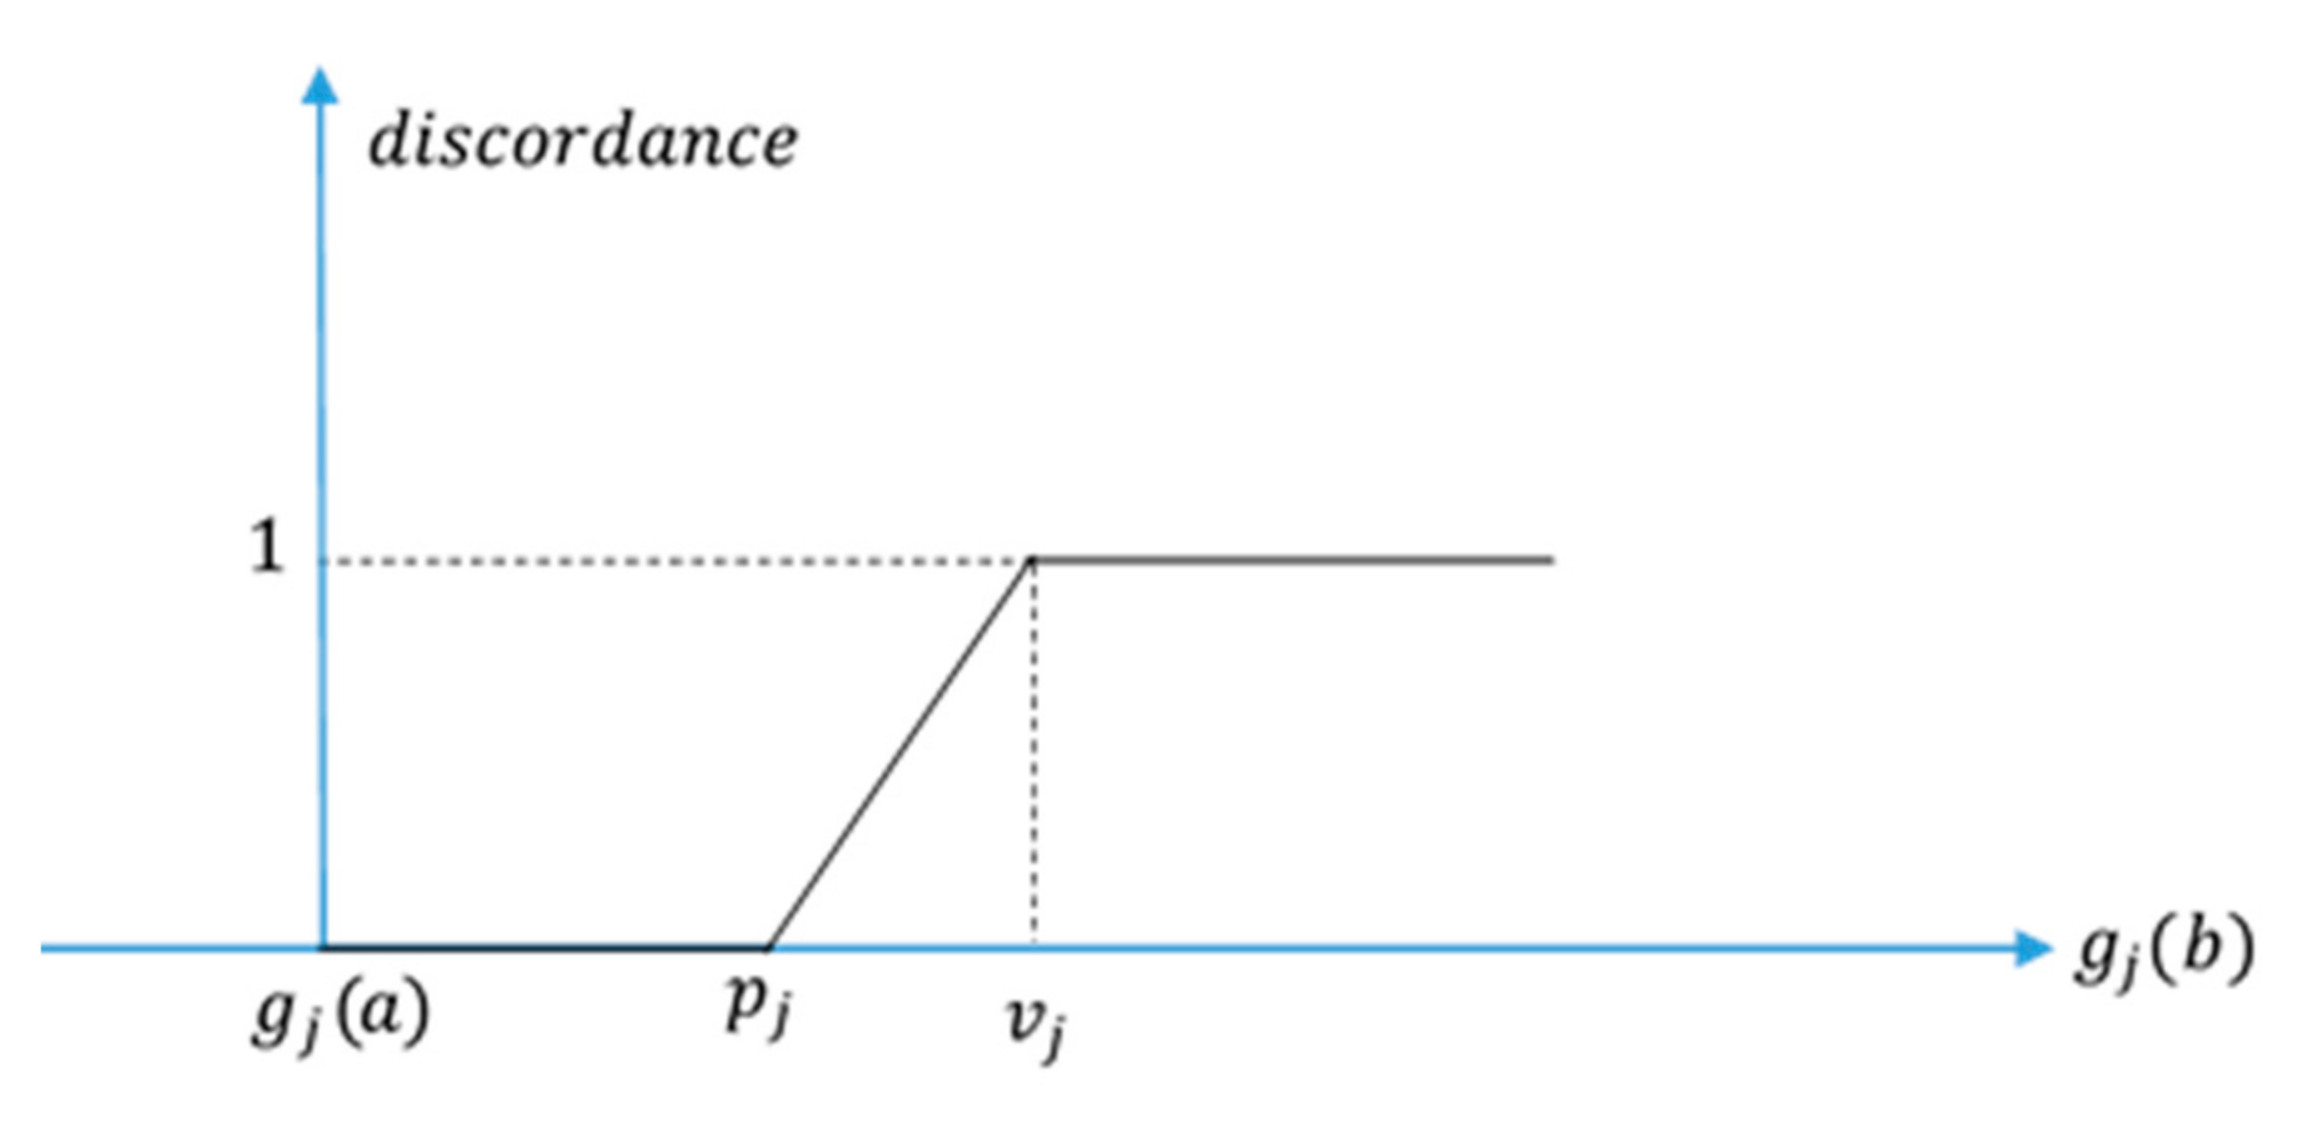
Let us say that we think option A is better than option B . We also suppose that   g j b   is variable and   g j a   is constant for criteria   j , which is a profit measure. As indicated in Figure A1,   g j b   represents our variable and the vertical axis of our discordance. Non-superiority is represented by a rejected alternative in this diagram. From   v j   onwards, we declare complete non-superiority. That is, we combine the no-veto condition with the non-discordance condition. Equation (A8) represents the relationships in Figure A1.
Figure A1. Preference function in ELECTRE III.
Buildings 12 00136 g0a1
d j a S b = 1               i f     g j b   >   g j a   +   v j g j a 0               i f     g j b     g j a   +   p j g j a   g j b g j a p j g j a v j g j a p j g j a             o t h e r w i s e
The bigger the   g j b   , as stated in Equation (A8), the larger the proportion. That is, our evidence of inferiority grows. The closer g j b   is to p j , the less we lack. Finally, we construct a parameter or variable called p , which is termed validity, to analyze the superiority of A over B . That is, Equation (A9) equals the validity of our assertion that option A is preferable to option B :
p a S b = c a S b   { j J :   d j a S b > c a S b } 1 d j a S b 1 c a S b
If the difference between options A and B in criterion j exceeds a veto limit, it becomes p = 0   and d = 1, which means that our claim that option A is superior to B has no validity.
If none of j is in the form of Equation (A10), this claim is eliminated, and we measure the value of this claim only by the value of concordance.
d j a S b > c a S b
In fact, p   is the degree to which option A claims superiority over option B in the fuzzy set of preferences. The higher this value of   p , the higher the degree of belonging. This ELECTRE goes out of the range between zero and one because it takes into account uncertainty. When we say accept g j , we are defining a safe margin for   j .

Appendix C. VIKOR

The VIKOR suggested by Opricovic [56] is explained here. As briefly mentioned previously, it focuses on ranking alternatives and determines compromise solutions for a problem with conflicting criteria.
Step 1. Construct the performance matrix and weight vector:
D ˜ = f ˜ 11 f ˜ 1 n f ˜ m 1 f ˜ m n
Additionally, W = w 1 ,   w 2 ,   ,   w n and j = 1 n w j = 1 , where A i denotes the alternative i ,   i = 1 ,   ,   m ; C j represents the criterion (or attribute) j ,   j = 1 ,   ,   n ; f i j indicates the fuzzy performance rating of alternative A i (district in this study) with respect to criterion C j (indicator in this study); and w j indicates the weight for each criterion.
Step 2. Determine the ideal f i + and the nadir f i values of all criteria functions according to benefit or cost functions. The set of criteria representing benefits (good effects) is denoted by I b , and the set I c   represents costs. (Equations (A11) and (A12)).
f i + = max f i j ,                   f i = max f i j               i I b
f i + = max f i j ,                   f i = max f i j               i I c
Step 3. Compute the normalized fuzzy difference   d ˜ i j : (Equations (A13) and (A14)).
d i j = f i + f i j r i + l i                                         i I b
d i j = f i j f i + r i l i +                                         i I b
Step 4. Compute the values of s j and R j by the relations in Equations (A15) and (A16).
S j = i = 1 n w j     d i j
R j = max w j     d i j
Step 5. Compute the values of Q j by the relation in Equation (A17).
Q j = ϑ R j   S + S r S + l     1 ϑ R j   R + R r R + l
where S + = min S ˜ j ,   S r = max S j r ,   R + = min R j and R r = max R j r . Additionally, ϑ is introduced as a weight for the strategy of “the majority of criteria” s j , whereas 1 ϑ is the weight of the individual regret R j .
The weighting parameter ϑ is the maximum utility of a group; its value can be between 0 and 1 and is considered 0.5 in this research.
Step 6. Rank the alternatives, sorting in decreasing order. The results are three ranking lists A S , A R , and A Q according to crisp( s ), crisp( R ), and crisp( Q ), respectively.
Step 7. Propose a compromise solution the alternative A 1 , which is the best-ranked solution by the measure Q , if the following two conditions are satisfied:
In this step, we decide according to the R , S , and Q values of the options that are sorted in descending order. In order to decide, the following two conditions are considered:
C1. “Acceptable advantage”: A d ϑ D Q .
Where A d ϑ = Q A 2 Q A 1 Q A m Q A 1 is the advantage rate of alternative A 1 ranked first compared with the alternative with the second position A 2 in A Q and the threshold D Q = 1 m 1
C2. “Acceptable stability in decision making”:
Alternative A 1 must also be the best ranked by S or R .
If one of the conditions is not satisfied, then a set of compromise solutions is proposed, which consists of:
CS1. Alternatives A 1 and A 1 if only condition C 2 is not satisfied, or
CS2. Alternatives A 1 ,   A 2 , … ,   A M if condition C 1 is not satisfied; A M is determined by the relation Q A M Q A 1 Q A m Q A 1 < D Q for maximum M . The positions of these alternatives are close.

Appendix D. PROMETHEE

PROMETHEE is a compromise strategy that uses the preference function to select the best option. It is used in a wide range of fields. This approach, in general, gives options and criteria, turns qualitative indicators into quantitative indicators, and weights the indicators so that the total weight equals one. The PROMETHEE II method is employed. Each option is given a numerical value in this method.
The preference function P is used to compare the two options a i and a j in the k index due to the distance between them. That is, it is dependent on the distance between the two possibilities, as shown in Equations (A18) and (A19).
P k a i , a j = P d k a i , a j
Equation (A19) shows that the preference function   p , which is for comparing the two options a i and a j in terms of the index   h , is due to the distance between the two options. That is, it depends on the distance between options a i and   a j . In this respect, D represents the distance. The distance between the value of option a i and a j and the value of option a j is stepwise. The general form of this preference function is shown in Table A1.
d k a i , a j = f k a i f k a j
Table A1. Preference function.
f 1 0 f 2 0 f j 0 f q 0
a 1 f 1 a 1 f 2 a 1 f j a 1 f q a 1
a 2 f 1 a 2 f 2 a 2 f j a 2 f q a 2
a i f 1 a i f 2 a i f j a i f q a i
a n f 1 a n f 2 a n f j a n f q a n
Suppose that A and B are two hypothetical options, and we denote the performance of option A for criterion j by g j α . Our dominance relationship between the two available options can be shown by one of the defined in Equations (A20)–(A22):
a P b   g j a     g j b ;   j J g k a   >   g k b ;   k J
  p means complete superiority or mastery. One option has complete precedence or dominance over the other when, for each criterion, option A is better than B and there is a criterion called h in which criterion option A is strictly superior to option B .
a I b     g j a   = g j   b ;     j J
Equation (A21) states that two options are equal when they are the same for each number in different criteria.
a R b   g s a g s b ;   s J g r a > g r b ;   r J
R denotes incomparability in relation A15. We cannot determine which choice is better when option A has absolute supremacy over option B in a set of criteria, while option B has absolute superiority over option A in a set of criteria.
When option A is superior to option B , the magnitude of its superiority is not discernible from the aforementioned relationships. Preference functions are used in the PROMETHEE technique to eliminate this flaw and influence the intensity of the superiority of the choices. The larger the gap between the two possibilities in one criterion, the higher the degree of preference, according to several preference functions. The difference between the two alternatives with   d j a , b in the j criteria is positive if the criterion is positive.
d j a , b = g j a g j b
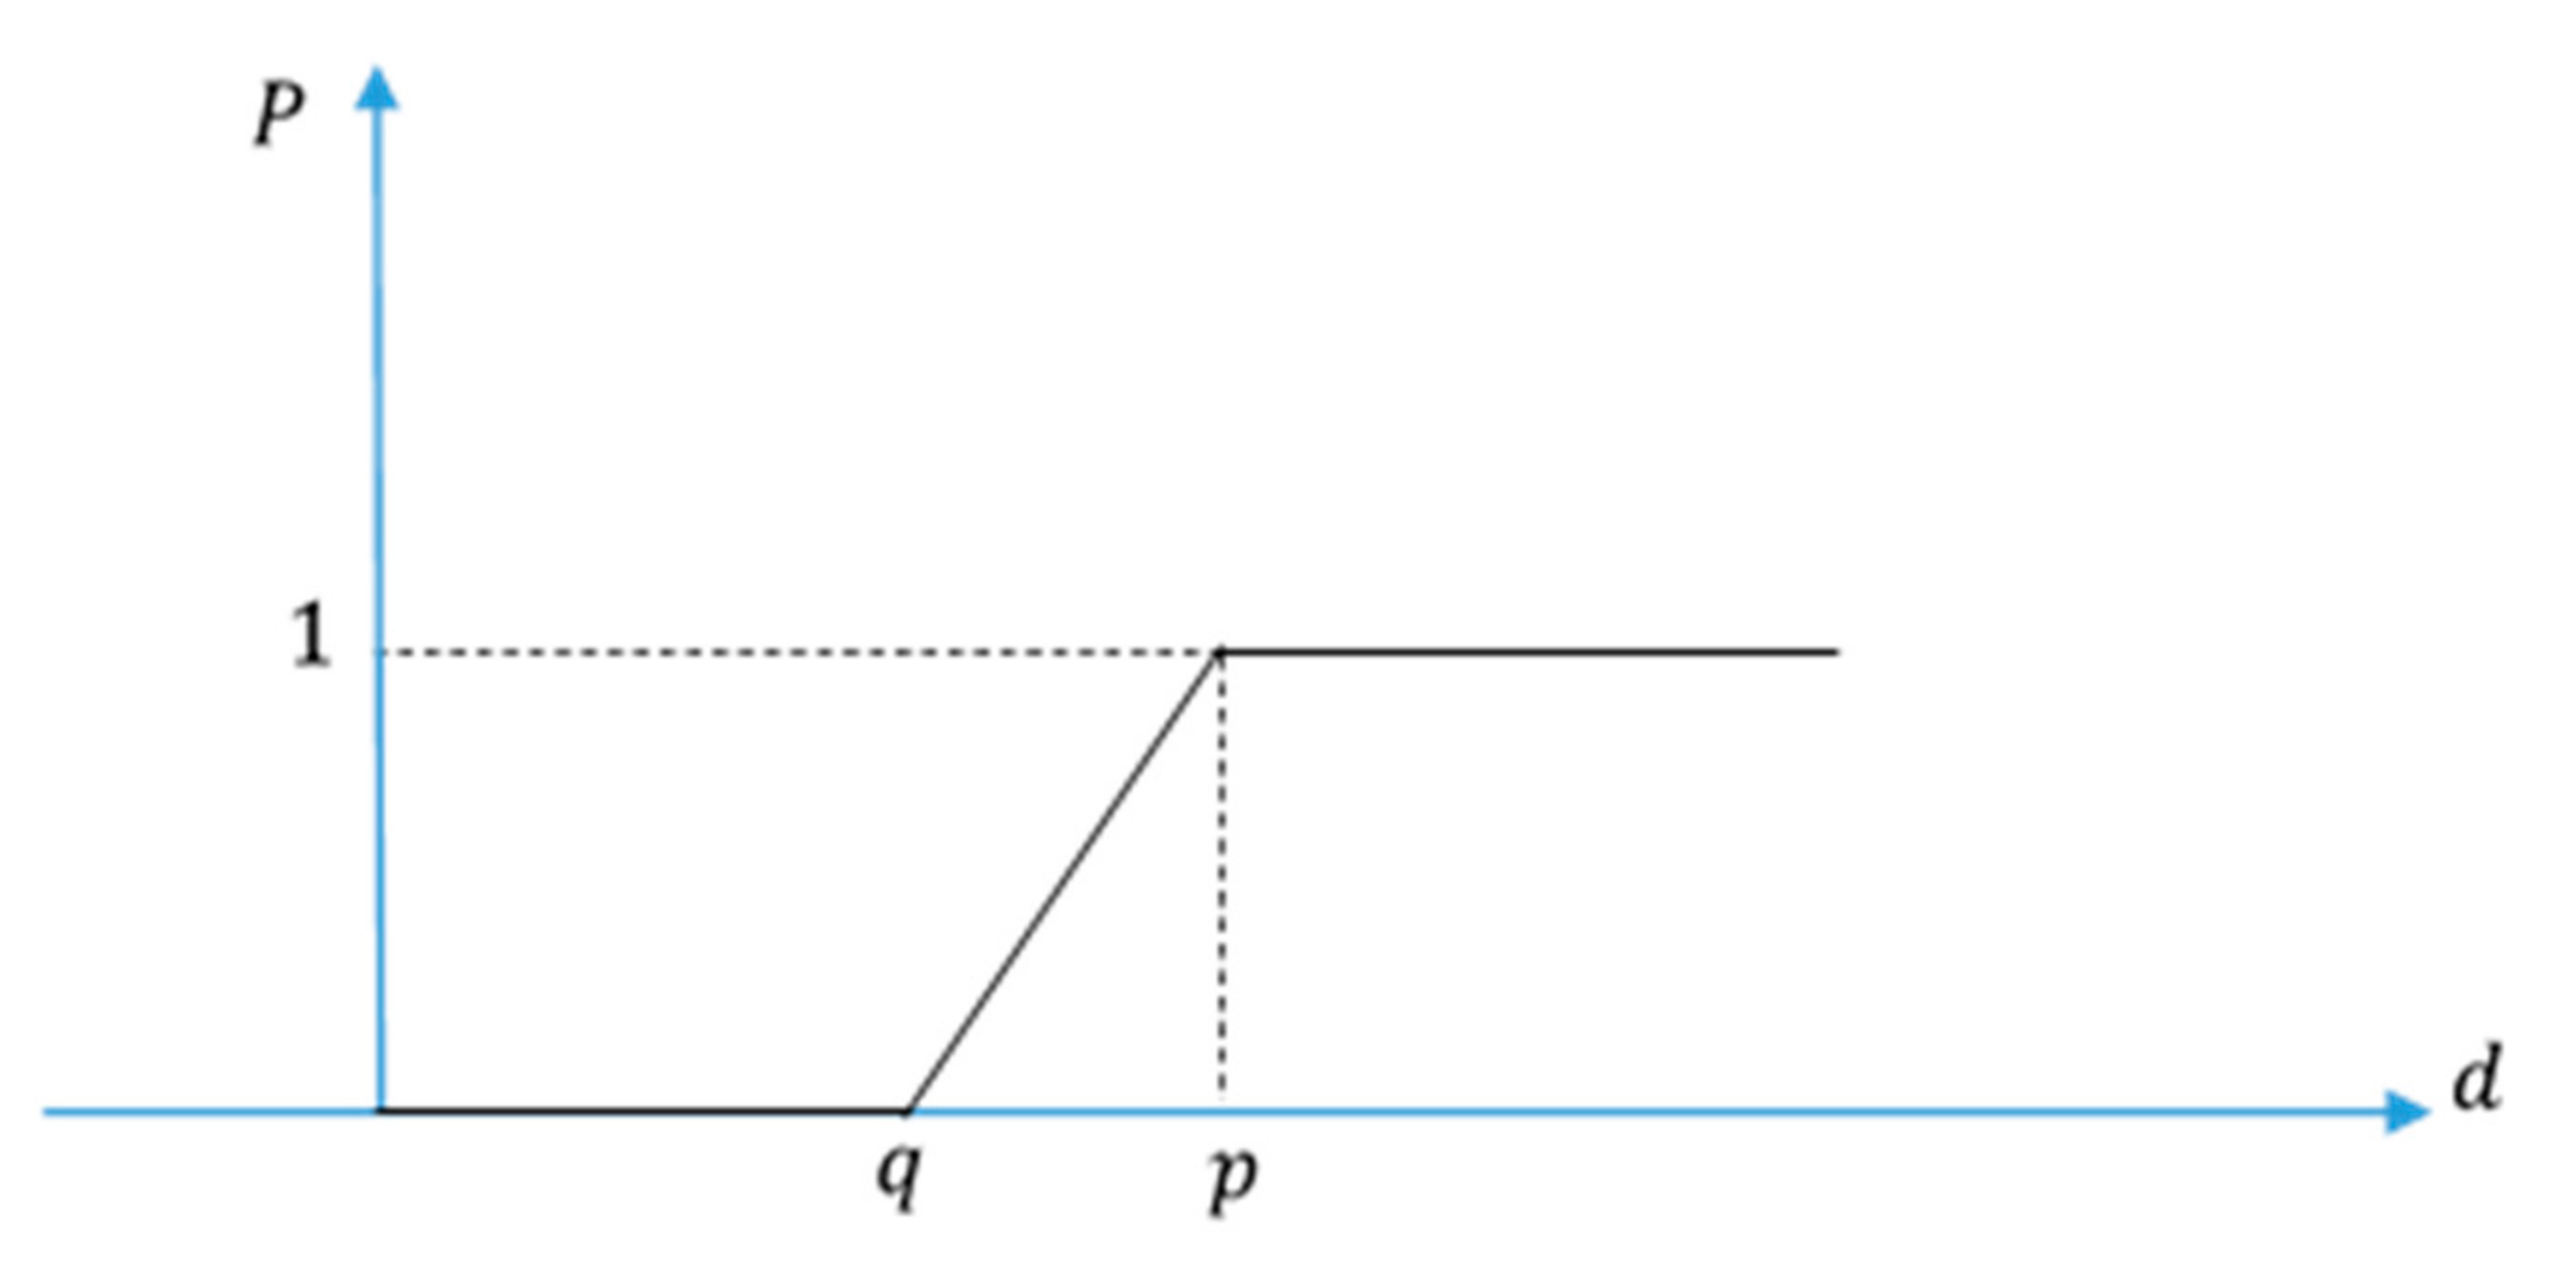
Figure A2 shows our preference function in this problem. Equation (A24) shows the relations of the preference function in Figure A2.
  • p   o r   p j a , b is the degree of preference of a over b based on criterion j .
  • d   o r   d j a , b is the distance between a and b based on criterion   j .
  • q ,   p , and s represent the indifference threshold, the preference threshold, and the midpoint between q and p , respectively.
Figure A2. Preference function in PROMETHEE method.
Buildings 12 00136 g0a2
To solve this problem, we use the function with the indifference threshold. As shown in the figure, we have a threshold such as p and   q , which is a linear function.
p = 0                                         d q d q p q               q < d p 1                                           d > p
The weight of criteria w j , the performance of each option in g j 0 , and the preference function for each criterion p j 0 must all be defined by the DM before employing the PROMETHEE techniques. Then, the next step is to simply follow the instructions below:
Step 1: Calculate the overall preference index of each option to the other options.
The overall preference index should be calculated for each pair of options according to Equations (A25) and (A26). The closer this index is to one, the stronger the overall preference of option a over   b . Equation (A25) indicates the superiority of option A over option   B .
π a , b = j = 1 n p j a , b w j j = 1 n w j
π b , a = j = 1 n p j b , a w j j = 1 n w j
There are a few aspects worth mentioning. Option A normally has no benefit over option A since the distance is zero, as indicated in Equation (A27). Depending on the value of the distance stated in Equation (A28), the benefit of option A over option B is anywhere between zero and one. Option B ’s superiority over option A is also demonstrated in this way. In addition, the total of option A ’s superiority over option B and option B ’s superiority over option A is between zero and one, as indicated in Equation (A29).
π a , a = 0
0 π b , a 1
0 π a , b   +   π b , a 1
Step 2: Calculate implicit dominance flows.
In this section, we calculate the positive and negative implicit dominance flows for each option. The positive implicit dominance flow is shown in Equation (A30).
It should be noted that A represents the sum of all options. ϕ + a also represents the average degree of mastery of A over other options.
ϕ + a = 1 m 1   x ϵ A x a π a , x
The negative implicit dominance flow equation is shown in Equation (A31). ϕ a indicates the average degree of mastery of the other options over   A .
ϕ a = 1 m 1   x ϵ A x a π x , a
The lower ϕ + a is, and the higher ϕ a is, and the better the choice.
Step 3: Perform ranking with PROMETHEE II.
In the PROMETHEE II method, using the   I I I and P I I interface and the results obtained from the first and second steps, a complete ranking is obtained in the form of Equations (A32) and (A33).
a P I I b     ϕ a   >   ϕ b
a I I I b     ϕ a   =   ϕ b
ϕ ( a ) or net flow is the implicit dominance of option   A , which is represented by Equation (A34).
ϕ a   = ϕ + a     ϕ a
In general, PROMETHEE II requires calculating ϕ for each of the options and then subtracting the advantage from the failure to achieve a net dominance. The higher this   ϕ , the better. In this method, we have a final and complete ranking, and we can determine the position of each option.

Appendix E. BWM

Rezaei [67,68] suggested BWM as one of the unique strategies in multi-criteria decision making (MCDM). This approach has the benefit of requiring less comparison data than similar methods and having a significantly greater level of dependability. The BWM technique is broken down into the following steps:
I.
Establish a list of decision criteria. Different actors in the project are, of course, required for this step because so many criteria have been left out.
II.
Decide which criteria are the best and worst (without comparison).
III.
Using numbers 1–9, select the best criteria preference over all others.
IV.
Using numbers 1–9, choose the worst criteria preference above all others.
V.
Compute the optimized weight of each criterion. Model (A35) is the linear best worst method. Using this model, the optimized weight of criteria can be calculated.
min ε l S.t. min max j W B W j a B j , W j W w a j w j w j a j w w w ε l j j W j = 1 W j 0 j
In the above model, a b j . a j w .   w b . w w . w j shows the relative preference of the best criteria to criterion j , the relative preference of criterion i to the worst criteria, the weight of best criteria and the weight of the worst criteria, and the weight of criteria j , respectively. In addition, ε l represents the consistency index as a decision variable of BWM.

References

  1. Bahmani, H.; Zhang, W. Comprehensive Success Evaluation Framework for Socio-Natural Disaster Recovery Projects. Buildings 2021, 11, 647. [Google Scholar] [CrossRef]
  2. Wei, W.; Mojtahedi, M.; Yazdani, M.; Kabirifar, K. The Alignment of Australia’s National Construction Code and the Sendai Framework for Disaster Risk Reduction in Achieving Resilient Buildings and Communities. Buildings 2021, 11, 429. [Google Scholar] [CrossRef]
  3. Anshuka, A.; van Ogtrop, F.F.; Sanderson, D.; Thomas, E.; Neef, A. Vulnerabilities shape risk perception and influence adaptive strategies to hydro-meteorological hazards: A case study of Indo-Fijian farming communities. Int. J. Disaster Risk Reduct. 2021, 62, 102401. [Google Scholar] [CrossRef]
  4. Sarani, M.; Safi-Keykaleh, M.; Safarpour, H.; Honarvar, M.R.; Kalteh, E.; Jahangiri, K. Tractor Ambulance: An Initiative of Emergency Medical Services Response to the Flood of Golestan, Iran in 2019. Disaster Med. Public Health Prep. 2021, 1–3. [Google Scholar] [CrossRef]
  5. Kurnio, H.; Fekete, A.; Naz, F.; Norf, C.; Jüpner, R. Resilience learning and indigenous knowledge of earthquake risk in Indonesia. Int. J. Disaster Risk Reduct. 2021, 62, 102423. [Google Scholar] [CrossRef]
  6. Pelling, M. The Vulnerability of Cities: Natural Disasters and Social Resilience; Earthscan: London, UK, 2003. [Google Scholar]
  7. Yazdani, M.; Mojtahedi, M.; Loosemore, M.; Sanderson, D.; Dixit, V. Hospital evacuation modelling: A critical literature review on current knowledge and research gaps. Int. J. Disaster Risk Reduct. 2021, 66, 102627. [Google Scholar] [CrossRef]
  8. Tavakoli Taba, S.; Mojtahedi, M.; Newton, S. Disaster risk management approaches in construction and built environment. Int. J. Disaster Resil. Built Environ. 2019, 11, 85–99. [Google Scholar] [CrossRef]
  9. Safapour, E.; Kermanshachi, S.; Pamidimukkala, A. Post-disaster recovery in urban and rural communities: Challenges and strategies. Int. J. Disaster Risk Reduct. 2021, 64, 102535. [Google Scholar] [CrossRef]
  10. Wang, W.; van de Lindt, J.W. Quantitative modeling of residential building disaster recovery and effects of pre- and post-event policies. Int. J. Disaster Risk Reduct. 2021, 59, 102259. [Google Scholar] [CrossRef]
  11. Rouhanizadeh, B.; Kermanshachi, S.; Nipa, T.J. Exploratory analysis of barriers to effective post-disaster recovery. Int. J. Disaster Risk Reduct. 2020, 50, 101735. [Google Scholar] [CrossRef]
  12. Rouhanizadeh, B.; Kermanshachi, S.; Nipa, T.J. Identification, Categorization, and Weighting of Barriers to Timely Post-Disaster Recovery Process. In Computing in Civil Engineering 2019; American Society of Civil Engineers: Reston, VA, USA, 2019; pp. 41–49. [Google Scholar]
  13. Patanakul, P. Key attributes of effectiveness in managing project portfolio. Int. J. Proj. Manag. 2015, 33, 1084–1097. [Google Scholar] [CrossRef]
  14. Masoumi, M.; Aghsami, A.; Alipour-Vaezi, M.; Jolai, F.; Esmailifar, B. An M/M/C/K queueing system in an inventory routing problem considering congestion and response time for post-disaster humanitarian relief: A case study. J. Humanit. Logist. Supply Chain. Manag. 2021. [Google Scholar] [CrossRef]
  15. Biedenbach, T.; Müller, R. Absorptive, innovative and adaptive capabilities and their impact on project and project portfolio performance. Int. J. Proj. Manag. 2012, 30, 621–635. [Google Scholar] [CrossRef]
  16. Hadjinicolaou, N.; Dumrak, J. Investigating Association of Benefits and Barriers in Project Portfolio Management to Project Success. Procedia Eng. 2017, 182, 274–281. [Google Scholar] [CrossRef]
  17. Meade, L.M.; Presley, A. R&D project selection using the analytic network process. IEEE Trans. Eng. Manag. 2002, 49, 59–66. [Google Scholar] [CrossRef] [Green Version]
  18. Kudratova, S.; Huang, X.; Zhou, X. Sustainable project selection: Optimal project selection considering sustainability under reinvestment strategy. J. Clean. Prod. 2018, 203, 469–481. [Google Scholar] [CrossRef]
  19. Alipour Vaezi, M.; Tavakkoli-Moghaddam, R. A new methodology for COVID-19 preparedness centers based on a location-allocation platform. J. Ind. Syst. Eng. 2020, 13, 35–41. [Google Scholar]
  20. Tavakkoli-Moghaddam, R.; Alipour-Vaezi, M.; Mohammad-Nazari, Z. A New Application of Coordination Contracts for Supplier Selection in a Cloud Environment. In Proceedings of the IFIP International Conference on Advances in Production Management Systems, Nantes, France, 5–9 September 2020; pp. 197–205. [Google Scholar]
  21. Alipour-Vaezi, M.; Aghsami, A.; Rabbani, M. Introducing a novel revenue-sharing contract in media supply chain management using data mining and multi-criteria decision-making methods. Soft Comput. 2022, 1–18. [Google Scholar] [CrossRef]
  22. Ehsanifar, M. The Development of UTASTAR Method in Fuzzy Environment for Supplier Selection. Eur. J. Sci. Res. 2013, 108, 317–326. [Google Scholar]
  23. Mohammadnazari, Z.; Ghannadpour, S.F. Employment of multi criteria decision making techniques and mathematical formulation for Construction of the sustainable hospital. Int. J. Hosp. Res. 2018, 7, 112–127. [Google Scholar]
  24. Fernandes, G.; Moreira, S.; Araújo, M.; Pinto, E.B.; Machado, R.J. Project Management Practices for Collaborative University-Industry R&D: A Hybrid Approach. Procedia Comput. Sci. 2018, 138, 805–814. [Google Scholar] [CrossRef]
  25. Khalili-Damghani, K.; Sadi-Nezhad, S. A hybrid fuzzy multiple criteria group decision making approach for sustainable project selection. Appl. Soft Comput. 2013, 13, 339–352. [Google Scholar] [CrossRef]
  26. Ameyaw, E.E.; Chan, A.P.C. Evaluation and ranking of risk factors in public–private partnership water supply projects in developing countries using fuzzy synthetic evaluation approach. Expert Syst. Appl. 2015, 42, 5102–5116. [Google Scholar] [CrossRef]
  27. Li, Z.; Yang, T.; Huang, C.-S.; Xu, C.-Y.; Shao, Q.; Shi, P.; Wang, X.; Cui, T. An improved approach for water quality evaluation: TOPSIS-based informative weighting and ranking (TIWR) approach. Ecol. Indic. 2018, 89, 356–364. [Google Scholar] [CrossRef]
  28. Gere, A.; Rácz, A.; Bajusz, D.; Héberger, K. Multicriteria decision making for evergreen problems in food science by sum of ranking differences. Food Chem. 2021, 344, 128617. [Google Scholar] [CrossRef]
  29. Gao, Z.; Liang, R.Y.; Xuan, T. VIKOR method for ranking concrete bridge repair projects with target-based criteria. Results Eng. 2019, 3, 100018. [Google Scholar] [CrossRef]
  30. Alabool, H.; Kamil, A.; Arshad, N.; Alarabiat, D. Cloud service evaluation method-based Multi-Criteria Decision-Making: A systematic literature review. J. Syst. Softw. 2018, 139, 161–188. [Google Scholar] [CrossRef]
  31. Hashemi, A.; Dowlatshahi, M.B.; Nezamabadi-Pour, H. MFS-MCDM: Multi-label feature selection using multi-criteria decision making. Knowl. -Based Syst. 2020, 206, 106365. [Google Scholar] [CrossRef]
  32. Dotoli, M.; Epicoco, N.; Falagario, M. Multi-Criteria Decision Making techniques for the management of public procurement tenders: A case study. Appl. Soft Comput. 2020, 88, 106064. [Google Scholar] [CrossRef]
  33. Mohanty, R.P.; Agarwal, R.; Choudhury, A.K.; Tiwari, M.K. A fuzzy ANP-based approach to R&D project selection: A case study. Int. J. Prod. Res. 2005, 43, 5199–5216. [Google Scholar] [CrossRef]
  34. Rahmani, N.; Talebpour, A.; Ahmadi, T. Developing aMulti Criteria Model for Stochastic IT Portfolio Selection by AHP Method. Procedia-Soc. Behav. Sci. 2012, 62, 1041–1045. [Google Scholar] [CrossRef] [Green Version]
  35. Chiang, T.-A.; Che, Z.H. A fuzzy robust evaluation model for selecting and ranking NPD projects using Bayesian belief network and weight-restricted DEA. Expert Syst. Appl. 2010, 37, 7408–7418. [Google Scholar] [CrossRef]
  36. Sierra, L.A.; Pellicer, E.; Yepes, V. Method for estimating the social sustainability of infrastructure projects. Environ. Impact Assess. Rev. 2017, 65, 41–53. [Google Scholar] [CrossRef] [Green Version]
  37. El-Haram, M.; Walton, J.; Horner, M.; Hardcastle, C.; Price, A.; Bebbington, J.; Thomson, C.; Atkin-Wright, T. Development of an Integrated Sustainability Assessment Toolkit. 2007. Available online: https://www.researchgate.net/publication/228427932_Development_of_an_integrated_sustainability_assessment_toolkit_’ (accessed on 20 December 2021).
  38. Singh, R.K.; Murty, H.R.; Gupta, S.K.; Dikshit, A.K. An overview of sustainability assessment methodologies. Ecol. Indic. 2012, 15, 281–299. [Google Scholar] [CrossRef]
  39. Thomson, C.S.; El-Haram, M.A.; Emmanuel, R. Mapping sustainability assessment with the project life cycle. Proc. Inst. Civ. Eng. -Eng. Sustain. 2011, 164, 143–157. [Google Scholar] [CrossRef]
  40. Martens, M.L.; Carvalho, M.M. Key factors of sustainability in project management context: A survey exploring the project managers’ perspective. Int. J. Proj. Manag. 2017, 35, 1084–1102. [Google Scholar] [CrossRef]
  41. Parfitt, M.K. Why buildings fail: Are we learning from our mistakes? Buildings 2012, 2, 326–331. [Google Scholar] [CrossRef] [Green Version]
  42. Sahlol, D.G.; Elbeltagi, E.; Elzoughiby, M.; Abd Elrahman, M. Sustainable building materials assessment and selection using system dynamics. J. Build. Eng. 2021, 35, 101978. [Google Scholar] [CrossRef]
  43. Cannavale, A.; Martellotta, F.; Fiorito, F. Novel technologies to enhance energy performance and indoor environmental quality of buildings. Buildings 2021, 11, 303. [Google Scholar] [CrossRef]
  44. Hummels, H.; Argyrou, A. Planetary demands: Redefining sustainable development and sustainable entrepreneurship. J. Clean. Prod. 2021, 278, 123804. [Google Scholar] [CrossRef]
  45. Ma, J.; Harstvedt, J.D.; Jaradat, R.; Smith, B. Sustainability driven multi-criteria project portfolio selection under uncertain decision-making environment. Comput. Ind. Eng. 2020, 140, 106236. [Google Scholar] [CrossRef]
  46. Akbari, N.; Jones, D.; Arabikhan, F. Goal programming models with interval coefficients for the sustainable selection of marine renewable energy projects in the UK. Eur. J. Oper. Res. 2020, 293, 748–760. [Google Scholar] [CrossRef]
  47. Valipour, A.; Sarvari, H.; Tamošaitiene, J. Risk assessment in PPP projects by applying different MCDM methods and comparative results analysis. Adm. Sci. 2018, 8, 80. [Google Scholar] [CrossRef] [Green Version]
  48. Balali, A.; Valipour, A.; Edwards, R.; Moehler, R. Ranking effective risks on human resources threats in natural gas supply projects using ANP-COPRAS method: Case study of Shiraz. Reliab. Eng. Syst. Saf. 2021, 208, 107442. [Google Scholar] [CrossRef]
  49. Zhang, J.; Li, H.; Xia, B.; Skitmore, M. Impact of environment regulation on the efficiency of regional construction industry: A 3-stage Data Envelopment Analysis (DEA). J. Clean. Prod. 2018, 200, 770–780. [Google Scholar] [CrossRef]
  50. Hwang, C.-L.; Yoon, K. Methods for Multiple Attribute Decision Making. In Multiple Attribute Decision Making; Springer: Berlin/Heidelberg, Germany, 1981; pp. 58–191. [Google Scholar]
  51. Rafiei-Sardooi, E.; Azareh, A.; Choubin, B.; Mosavi, A.H.; Clague, J.J. Evaluating urban flood risk using hybrid method of TOPSIS and machine learning. Int. J. Disaster Risk Reduct. 2021, 66, 102614. [Google Scholar] [CrossRef]
  52. Luu, C.; von Meding, J.; Mojtahedi, M. Analyzing Vietnam’s national disaster loss database for flood risk assessment using multiple linear regression-TOPSIS. Int. J. Disaster Risk Reduct. 2019, 40, 101153. [Google Scholar] [CrossRef]
  53. Noori, A.; Bonakdari, H.; Salimi, A.H.; Gharabaghi, B. A group Multi-Criteria Decision-Making method for water supply choice optimization. Socio-Econ. Plan. Sci. 2021, 77, 101006. [Google Scholar] [CrossRef]
  54. Chen, Z.-S.; Zhang, X.; Pedrycz, W.; Wang, X.-J.; Skibniewski, M.J. Bid evaluation in civil construction under uncertainty: A two-stage LSP-ELECTRE III-based approach. Eng. Appl. Artif. Intell. 2020, 94, 103835. [Google Scholar] [CrossRef]
  55. Chen, Z.-S.; Zhang, X.; Rodríguez, R.M.; Pedrycz, W.; Martínez, L. Expertise-based bid evaluation for construction-contractor selection with generalized comparative linguistic ELECTRE III. Autom. Constr. 2021, 125, 103578. [Google Scholar] [CrossRef]
  56. Opricovic, S.; Tzeng, G.-H. Compromise solution by MCDM methods: A comparative analysis of VIKOR and TOPSIS. Eur. J. Oper. Res. 2004, 156, 445–455. [Google Scholar] [CrossRef]
  57. Yu, P.-L. A class of solutions for group decision problems. Manag. Sci. 1973, 19, 936–946. [Google Scholar] [CrossRef]
  58. Zeleny, M. Compromise Programming. In Multiple Criteria Decision Making; Springer: Berlin/Heidelberg, Germany, 1973. [Google Scholar]
  59. Brans, J.-P. L’ingénierie de la Décision: L’élaboration D’instruments D’aide a la Décision; Université Laval, Faculté des sciences de l’administration: Québec, QC, Canada, 1982. [Google Scholar]
  60. Vinodh, S.; Jeya Girubha, R. PROMETHEE based sustainable concept selection. Appl. Math. Model. 2012, 36, 5301–5308. [Google Scholar] [CrossRef]
  61. Wu, Y.; Tao, Y.; Zhang, B.; Wang, S.; Xu, C.; Zhou, J. A decision framework of offshore wind power station site selection using a PROMETHEE method under intuitionistic fuzzy environment: A case in China. Ocean. Coast. Manag. 2020, 184, 105016. [Google Scholar] [CrossRef]
  62. Afram, A.; Janabi-Sharifi, F.; Fung, A.S.; Raahemifar, K. Artificial neural network (ANN) based model predictive control (MPC) and optimization of HVAC systems: A state of the art review and case study of a residential HVAC system. Energy Build. 2017, 141, 96–113. [Google Scholar] [CrossRef]
  63. Shahmansouri, A.A.; Yazdani, M.; Ghanbari, S.; Akbarzadeh Bengar, H.; Jafari, A.; Farrokh Ghatte, H. Artificial neural network model to predict the compressive strength of eco-friendly geopolymer concrete incorporating silica fume and natural zeolite. J. Clean. Prod. 2021, 279, 123697. [Google Scholar] [CrossRef]
  64. Übeylı, E.D.; Güler, İ. Multilayer perceptron neural networks to compute quasistatic parameters of asymmetric coplanar waveguides. Neurocomputing 2004, 62, 349–365. [Google Scholar] [CrossRef]
  65. Mohammadi, M.; Rezaei, J. Ensemble ranking: Aggregation of rankings produced by different multi-criteria decision-making methods. Omega 2020, 96, 102254. [Google Scholar] [CrossRef]
  66. Chen, P. Effects of normalization on the entropy-based TOPSIS method. Expert Syst. Appl. 2019, 136, 33–41. [Google Scholar] [CrossRef]
  67. Rezaei, J. Best-worst multi-criteria decision-making method. Omega 2015, 53, 49–57. [Google Scholar] [CrossRef]
  68. Rezaei, J. Best-worst multi-criteria decision-making method: Some properties and a linear model. Omega 2016, 64, 126–130. [Google Scholar] [CrossRef]
Figure 1. Research methodology.
Buildings 12 00136 g001
Figure 2. A standard neuron used in an ANN.
Buildings 12 00136 g002
Figure 3. Map of the area.
Buildings 12 00136 g003
Figure 4. Error and R-value results for all data.
Buildings 12 00136 g004
Figure 5. Error and R-value results for training data.
Buildings 12 00136 g005
Figure 6. Weights of each method obtained by BWM.
Buildings 12 00136 g006
Figure 7. Comparison of results of alternatives selection.
Buildings 12 00136 g007
Table 1. Table of nomenclature.
AbbreviationTermAbbreviationTerm
MCDM Multi-criteria decision makingDEAData envelopment analysis
DMDecision makerPROMETHEEPreference Ranking Organization Method for Enrichment Evaluation
ANNArtificial neural networkGHGGreenhouse gas
BWMBest worst methodHSEHealth, safety, and environment
TOPSISTechnique for Order Preference by Similarity to Ideal SolutionIREInterests and rights of employees
VIKORVlse Kriterijumsk Optimizacija Kompromisno ResenjeFNNFeedforward neural networks
ELECTREEElimination et Choice in Translating to RealityMLPMulti-layer perceptron
ANPAnalytic network processKPKhakpey Company
AHPAnalytical hierarchy procedure
Table 2. A comparison between previous studies and the current study.
ReferenceTOPSISELECTRE IIIVIKORPROMETHEEBWMANNANPSustainabilityOther methods
Ma, Harstvedt, Jaradat, and Smith [45]
Akbari, Jones, and Arabikhan [46]
Dotoli, Epicoco, and Falagario [32]
Hashemi, Dowlatshahi, and Nezamabadi-pour [31]
Li, Yang, Huang, Xu, Shao, Shi, Wang, and Cui [27]
Balali et al. [48]
Valipour, Sarvari, and Tamošaitiene [47]
This study
Table 3. Input criteria.
CriteriaIndexDescription
FinancialC1Manpower: total wages of construction workers
C2Machinery and Equipment: total cost of machines and equipment utilized
C3Material: total cost of consumed materials
C4Energy consumption: total cost of consumed energy (e.g., electricity and fuel)
QualityC5Materials: the quality of the materials used in construction in comparison to global standardization
C6Certifications: standards and certifications that can be applied in the construction industry, such as ISO 9000
EnvironmentalC7Standards: environmental standards and certification
C8Staff: the level of environmental awareness of the staff and training endeavors for environmental objectives
C9Energy: renewable energy consumption
C10GHG emissions: the evaluation of carbon emission rates caused by construction activities
C11Materials: using reusable and recyclable materials
SocialC12Interests and
Rights of
Employees (IRE):
Workers’ pay: the wages of workers in comparison to international levels
C13Working hours: working hours in comparison to global standards
C14Safety: safe working conditions
C15Benefits: additional benefits for labor such as health services, humanitarian benefits in a post-disaster construction environment
C16Compensation: regulation of compensation
C17HSE: HSE standards and regulations to manage health and safety risks
C18Job creation: the number of job opportunities caused by the project
Table 4. Output criteria.
CriteriaIndex Description
Gross output valueC19Gross amount of revenue gained by a specific construction project in a predetermined period
RobustnessC20The ability to tolerate the impact of an event with high severity
Customer satisfactionC21In every organization, customers play a decisive role. Hence, customers play a pivotal role in the decision-making process.
Table 5. Advantages and disadvantages of MCDM methods.
MethodsAdvantagesDisadvantages
TOPSISSimple to use and understand; no restrictions on sample size or index quantity.Difficult to demonstrate decision makers’ preferences; Fails to consider the relative importance of distances.
ELECTREDecision making based on indifference and preference thresholds; capable of dealing with the problem of index compensation; applicable when incomparable alternatives exist.Many parameters are required; the computational processes are complex; determining the preferred alternatives is difficult.
VIKORReflects DMs’ subjective preferences; behaves well in criterion conflict situations and provides compromise solutions.Complex computational process in dealing with sparse data; failure to identify the weaknesses or improvement schemes of alternatives.
PROMETHEEThere is no need to process raw data, resulting in less information loss; reflects various attributes’ properties.Ignores decision makers’ psychological behaviors.
Table 6. Results of methods.
TOPSISVIKORPROMETHEEELECTRE IIILinear Assignment
AlternativesRankAlternativesRankAlternativesRankAlternativesRankAlternativesRank
A11A21A11A11A11
A62A72A62A82A62
A33A103A33A102A33
A104A94A84A33A84
A45A45A45A94A45
A55A56A56A65A56
A26A87A107A46A107
A97A68A98A57A98
A88A39A79A28A79
A79A110A210A79A210
Table 7. Results of ANN.
AlternativesA2A4A7A5A9A10A1A3A8A6
Rank1234556789
Table 8. The priority of project selection by considering different priorities in different ways.
Equal Weights TOPSIS   VIKOR   PROMETHEE   ELECTRE   III  
AlternativesRankAlternativesRankAlternativesRankAlternativesRankAlternativesRank
A11A11A21A11A11
A62A62A72A62A62
A33A33A103A103A33
A104A104A94A34A84
A45A45A45A45A45
A56A56A56A56A56
A27A27A87A27A107
A98A98A68A98A98
A89A89A39A89A79
A710A710A110A710A210
Publisher’s Note: MDPI stays neutral with regard to jurisdictional claims in published maps and institutional affiliations.

