Article

Mechanical Performances and Frost Resistance of Alkali-Activated Coal Gangue Cementitious Materials

1
Key Laboratory of Concrete and Prestressed Concrete Structures of Ministry of Education, Southeast University, Nanjing 210096, China
2
Jiangsu ZYZ Intelligent Operation & Maintenance Institute, Nanjing 210003, China
3
College of Architectural Science and Engineering, Yangzhou University, Yangzhou 225127, China
4
School of the Environment and Safety Engineering, Jiangsu University, Zhenjiang 212013, China
*
Authors to whom correspondence should be addressed.
Buildings 2022, 12(12), 2243; https://doi.org/10.3390/buildings12122243
Submission received: 11 November 2022 / Revised: 7 December 2022 / Accepted: 9 December 2022 / Published: 16 December 2022
(This article belongs to the Special Issue High-Performance Concrete: Constituents, Properties and Applications)

Abstract

:
The coal gangue after composite activation treatment is considered a potential low-carbon and green cementitious material, so the feasibility of employing composite-activated gangue to partially or entirely replace cement for building materials is systematically studied in this paper. The effects of alkali content, slag content, and water-to-binder ratio on the mechanical properties and frost resistance of alkali-activated coal gangue mortar (AACGM) were experimentally investigated. An ESEM was employed to observe the microstructure of the AACGM. Moreover, the microstructure damage to the AACGM was analyzed by a pixel-based image processing algorithm. The research was carried out in accordance with standards JGJ/T70-2009 and GB/T 50082-2009. Experimental results indicated that the mechanical properties and frost resistance of the AACGM were superior to those of ordinary Portland cement mortar (OPCM). Compared with the OPC group, the compressive and flexural strength of the W0.50 group increased by 16.01% and 14.19%. Moreover, the loss rate of mass, flexural strength, compressive strength, and microstructure damage of the AACGM were less than those of the OPCM. Between freeze–thaw cycles 25 and 100, the cracks and pores of specimens gradually grew, and the maximum crack width increased by 277.78%. In addition, the slag was beneficial in improving the flexural strength, compressive strength, and frost resistance of the AACGM. Finally, the freeze–thaw damage mechanism of the CGBG mortar was systematically analyzed.

1. Introduction

Coal is one of the essential energy sources in modern society. The main by-product of coal is coal gangue, accounting for 15–20% of the total production mass [1]. Coal gangue has become one of the most massive industrial solid wastes in the United States, Britain, Russia, and China. Among them, China’s coal gangue has reached 7 billion tons and is expanding at a rate of 150 million tons/year [2]. Unfortunately, coal gangue imposes a tremendous environmental burden, such as occupying land, polluting soil and groundwater, and discharging harmful gases [3,4,5]. Therefore, the resource treatment of coal gangue is a hot issue in current research [6,7,8].
Properly treated coal gangue is regarded as a potential resource rather than a solid waste. Li et al. adopted broken coal gangue as backfill material in the goaf of a coal mine and analyzed the influence of particle size on the compressive deformation of backfill materials [9]. Dong et al. pointed out that calcined coal gangue could be used as fine aggregate and evaluated the influence of fineness modulus on the strength of mortar [10]. Ma et al. analyzed the effects of coal gangue before and after calcination on the strength and durability of concrete [11]. Song et al. studied the impacts of coal gangue dimensions on the structure and performance of coal gangue-fired bricks [12]. In addition, coal gangue contains more than 80% alumina and silica in its total chemical composition [13]. It is reported that the stable crystal structure of kaolinite is destroyed at 500–700 °C and gradually transformed into unstable silica and alumina [14]. Therefore, scholars adopted calcined coal gangue to partially replace cement for preparing concrete. However, due to its lack of interactions with cementitious materials, calcined coal gangue reduces the mechanical properties and durability of concrete, resulting in its replacement level being less than 30% [15]. Given the excellent performance of alkali-activated materials, scholars began to apply calcined coal gangue to prepare alkali-activated materials [11,16,17]. Wu et al. studied the effects of different activators (NaOH, CaCl2, Na2SO4, KOH, and NaCl) on the cementitious materials activity of coal gangue and found that NaOH can remarkably increase the strength of specimens [18]. Zhang et al. found that compared with NaOH and KOH, Na2SiO3 could produce more hydration products with calcined coal gangue [19]. Zhao et al. and Ma et al. employed composite-activated coal gangue to entirely replace ordinary Portland cement for preparing concrete [20,21]. Moreover, compared to 800–1000 kg of CO2 emissions per ton of ordinary Portland cement, the CO2 emissions from alkali-activated coal gangue cement materials are reduced by 25–50% [22,23]. Additionally, the energy consumption and natural resource consumption of alkali-activated coal gangue cementitious materials are low. Thereby, alkali-activated gangue cementitious material can be considered as a low-carbon and green building material.
To fulfill the low-carbon emission target, an eco-friendly alkali-activated coal gangue mortar (AACGM) was fabricated by composite-activated coal gangue (CACG), which was proposed to replace conventional ordinary Portland cement mortar. Various influential parameters were considered to evaluate the mechanical performances and freeze–thaw resistance of the AACGM. Moreover, the microstructural changes in AACGM after freeze–thaw cycles were compared and analyzed. Finally, the freeze–thaw damage mechanism of the AACGM was investigated.

2. Test Design

2.1. Test Materials

In this research, slag, coal gangue, and ordinary Portland cement (OPC) were adopted as cementing materials. Their main chemical compositions are listed in Table 1. Coal gangue was taken from Changxu Coal Mine of Jungar Banner, China. Refer to the research results of Zhang et al. [24] and Mog et al. [25]. The cementitious material activity of raw coal gangue was improved by a composite activation method. Firstly, coal gangue was ground to below 0.075 mm by mechanical activation. Then, coal gangue powders were calcined at 700 °C for 2 h in a muffle furnace.
Figure 1 shows the gradation cure of test sand, and its fineness modulus was 2.62. In addition, water glass with a modulus of 1.2 was employed as an alkali activator.

2.2. Mix Proportions

The mix proportions of the AACGM and ordinary Portland cement mortar (OPCM) with different parameters are displayed in Table 2. Twenty-four specimens were poured for each group, of which 9 were used to test the mechanical properties and 15 were used to test the frost resistance. In addition, all specimens were maintained in a standard conditioning tank (20 ± 2 °C, RH > 95%).

2.3. Test Methods

2.3.1. Strength Tests

With reference to the Chinese code [26], the compressive and flexural strength of the AACGM were investigated by a YDW-10 microcomputer mortar flexure tester and a WAW-300 compression testing machine. In addition, the loading rates of the compression and bending tests were 50 N/s and 0.5 MPa/s, respectively.

2.3.2. Freeze–Thaw Cycles Test

Referring to GB/T 50082-2009, the effects of W/B, A, and S on the frost resistance of the AACGM were carried out by a fast freeze–thaw cycles test [27]. Fifteen standard specimens were poured into each group. All specimens were first maintained in a normal tank for twenty-four days and subsequently immersed in water for four days. A total of 100 freeze–thaw cycles were performed. The surface change, mass, flexural strength, and compressive strength of specimens were determined per twenty-five cycles. The mass loss ratio ( m ) and strength loss ratio ( f ) were calculated with Equation (1) and Equation (2), respectively.
m = m 0 m n m 0 × 100 %
f = f 0 f n f 0 × 100 %
where m 0 and m n were the weights of test samples before and after the freezing and thawing cycle test; f 0 and f n were the strengths of test samples before and after the freezing and thawing cycle test.

3. Results and Discussion

3.1. Mechanical Performances

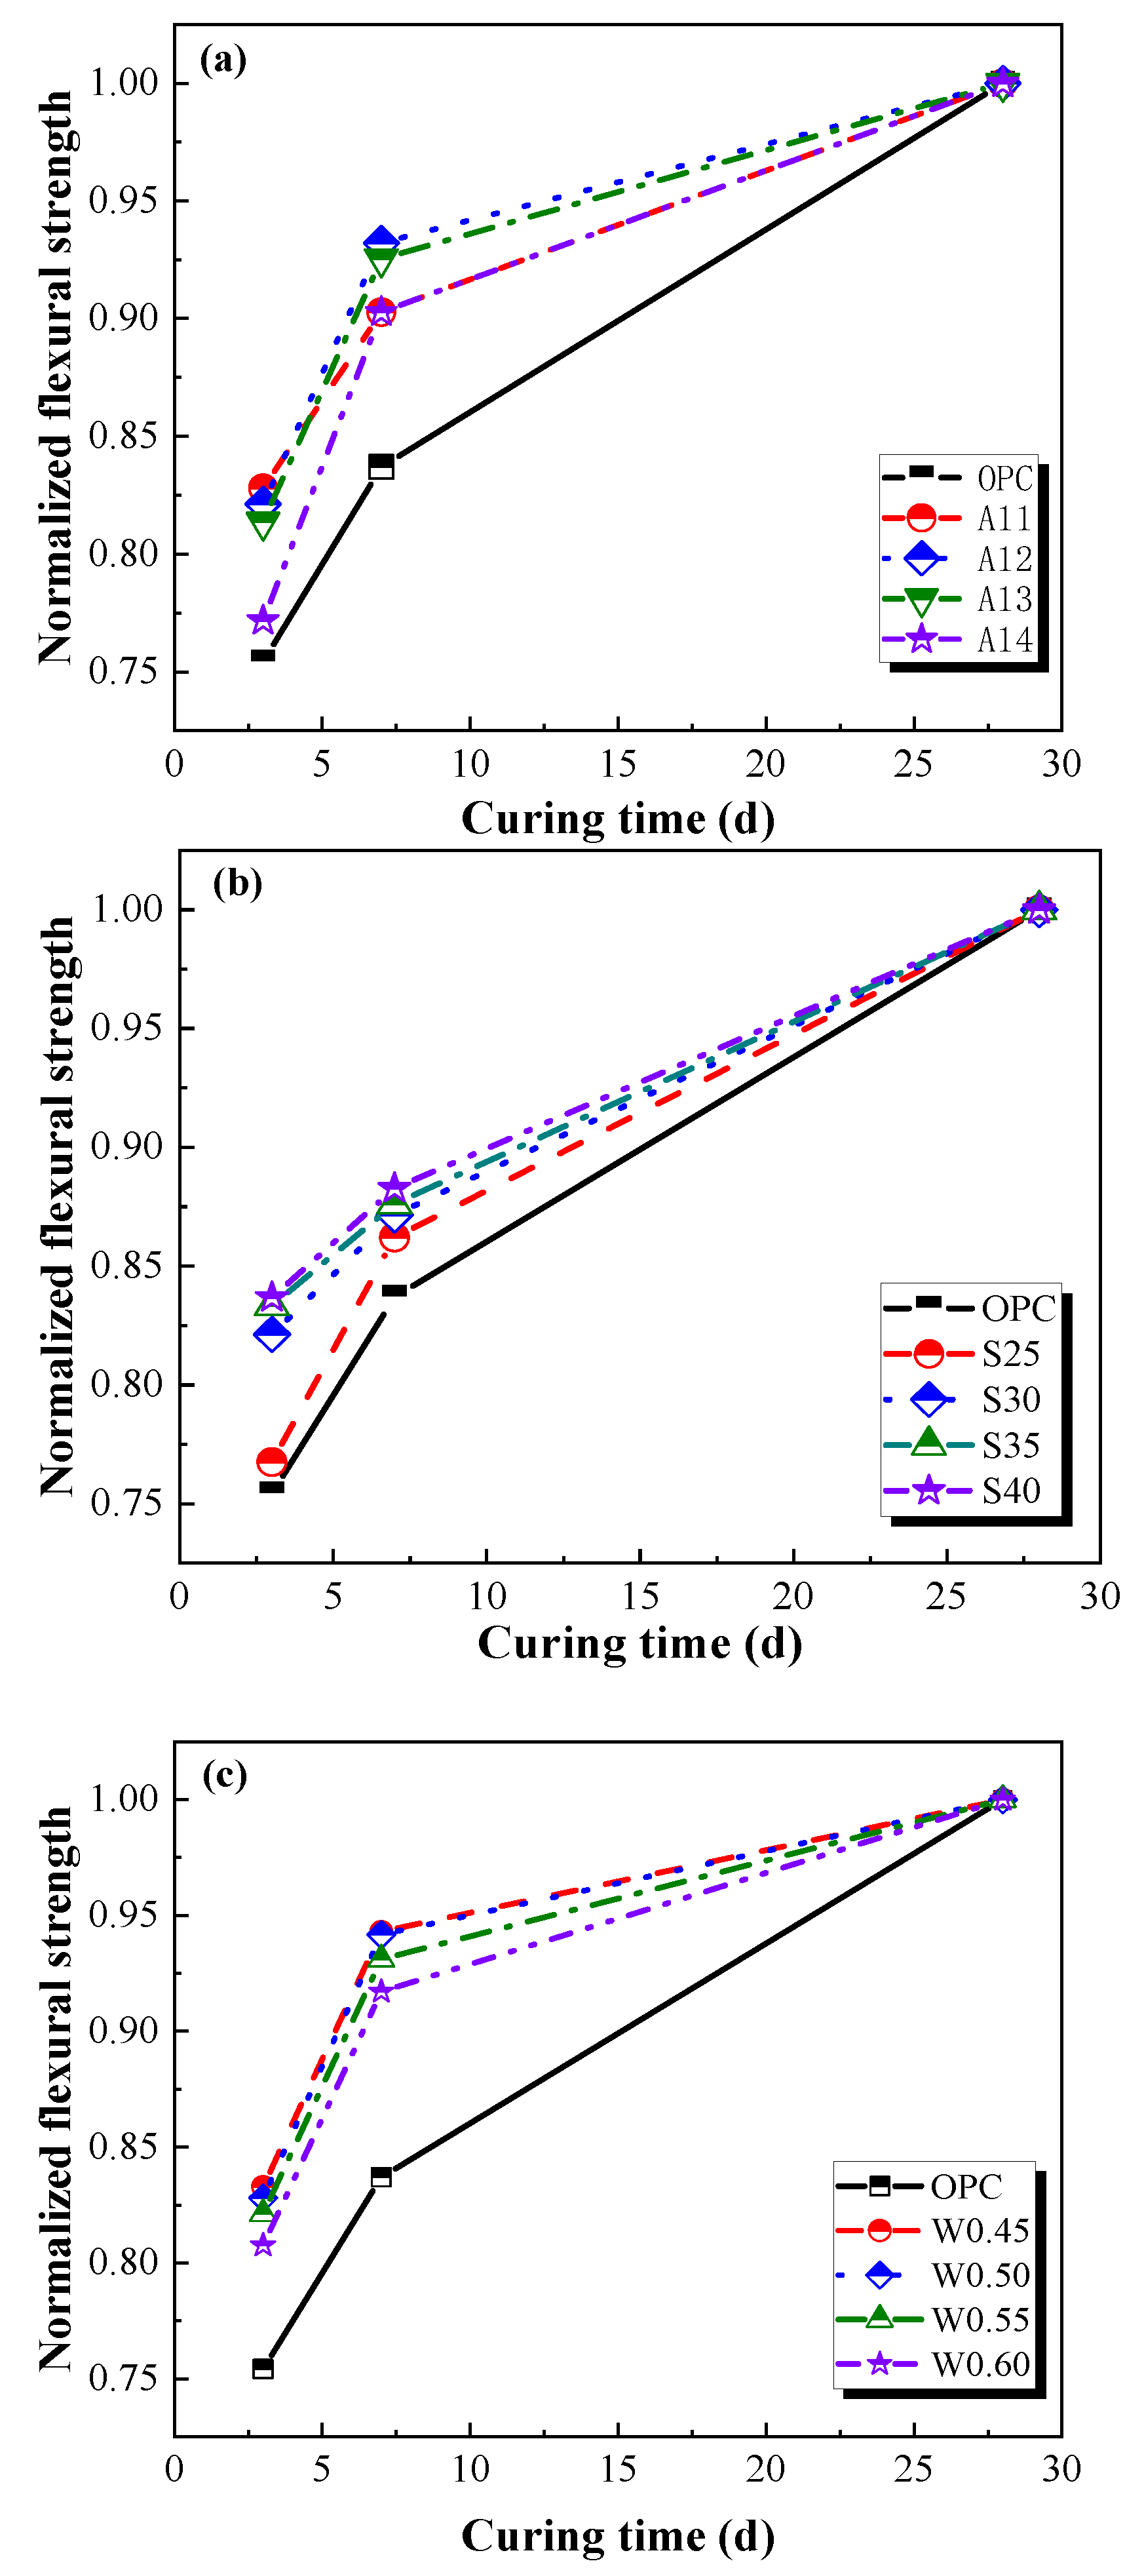
3.1.1. Flexural Strength

Table 3 and Figure 2 display the flexural and normalized flexural strength of the various AACGM. When the alkali content is 12%, the flexural strength of specimens had an inflection point. The flexural strength of the A12 group at 28 d was 1.07, 1.10, and 1.11 times that of the A11, A13, and A14 groups, respectively. This conclusion is consistent with Ma et al. [28] and Zheng et al. [29]. Hence, it could be concluded that excessive or inadequate alkali content does not benefit the hydration degree of geopolymer composites. Moreover, the flexural strength of the specimens displayed a positive relationship with slag content. Compared to the S25 group, the flexural strength levels of the S25, S30, and S35 groups at 28 days increased by 3.63%, 4.60%, and 5.33%, respectively. However, the flexural strength of specimens showed a negative relationship with the W/B. Compared to the W/B0.60 group, the flexural strength of the W/B0.45, W/B0.50, and W/B0.55 groups at 28 days increased by 47.89%, 42.13%, and 20.22%, respectively. With the increase in the W/B, the concentration of hydroxide ions decreased, reducing the hydration reaction rate. In addition, the free water content gradually increased, weakening the particle-to-particle cementation force and decreasing the flexural strength of AACGM [2].
In addition, compared to the OPCM, the flexural strength of AACGM developed remarkably in the early stage (<seven days) and grew slightly after seven days. The three-day flexural strength of AACGM was 0.77–0.84 times the twenty-eight-day value, and the seven-day flexural strength of the AACGM was in a range of 0.86–0.96 times the twenty-eight-day value.

3.1.2. Compressive Strength

Table 3 and Figure 3 display the compressive strength and normalized compressive strength of the various AACGM. When the alkali content was 12%, the compressive strength of specimens had an inflection point. The compressive strength of the A12 group at 28 d was 1.23, 1.15, and 1.18 times that of the A11, A13, and A14 groups, respectively. Moreover, the compressive strength of specimens gradually increased along with the increase in slag content. Compared to the S25 group, the compressive strength of the S25, S30, and S35 groups at 28 days increased by 14.18%, 19.55%, and 24.60%, respectively. However, the compressive strength of the AACGM exhibited a negative correlation with the W/B. Compared to the W/B0.60 group, the compressive strength of the W/B0.45, W/B0.50, and W/B0.55 groups at 28 days increased by 45.94%, 21.29%, and 12.97%, respectively.
In addition, compared to OPCM, the compressive strength of AACGM developed remarkably in the first seven days and grew slightly after seven days. The three-day compressive strength of AACGM could reach 70.97–78.96% of the twenty-eight-day value. Meanwhile, the seven-day compressive strength of the AACGM was in a range of 88.66–94.66% of the twenty-eight-day value.

3.2. Mechanical Properties after Freeze–Thaw Cycles

3.2.1. Mass-Loss Rate

To investigate the effects of the S, W/B, and A on the mass change during the freezing and thawing cycles, the masses of all specimens were determined per twenty-five cycles. Previous studies have shown that the quality loss of mortars mainly consists of the dissolution of soluble salts and surface flaking [30,31]. Figure 4 displays the mass-loss rate of the AACGM with different parameters.
Figure 4 illustrates that the mass-loss rates of all specimens gradually increased with the increase in freeze–thaw cycles. It is noteworthy that the mass-loss rate of the AACGM was less than that of the OPCM. Moreover, the mass-loss rate exhibited a trend of decreasing first and then increasing, and alkali content =12% was the inflection point. This conclusion is consistent with Ma et al. [21]. The mass loss rate of alkali-activated materials exhibited a negative correlation with strength. As shown in Figure 4b, the higher the slag content, the lower the mass-loss rate of specimens. This is because the concentration of calcium ions in the system will increase gradually with the growth of the slag content. Additionally, calcium ions can replace sodium ions in N-A-S-H gels to produce C-A-S-H with higher density, which improves the compactness and freeze–thaw resistance of the AACGM [32]. In addition, the water-to-binder ratio and the mass-loss rate exhibited overall ascending trends. That is because increasing the W/B will increase free water and pores inside specimens, decreasing their freeze–thaw resistance. When the water-to-binder ratio is low (≤0.50), the mass-loss rate of specimens is lower in the first 50 cycles. Therefore, a low W/B is beneficial to enhancing the frost resistance of AACGM.
The surface damage of specimens of the W0.50 group is depicted in Figure 5. Specimens remained stable after 50 cycles, but the edges and corners of specimens began to spill off after 75 cycles. After 100 cycles, the surface damage was further aggravated, including increased spalling of edges and corners and surface cracking. Therefore, the mass change in the early cycles (≤50) was caused by the dissolution of soluble salt and resulted from the spalling of specimens in the late cycles (>50) [33]. Moreover, the mass reduction of specimens after 100 cycles was less than 5%, which satisfied the requirements of JGJ/T70-2009 [34].

3.2.2. Flexural Strength after Freeze–Thaw Cycles

Figure 6 displays the effects of the alkali content, slag content, and water-to-binder ratio on the flexural strength of specimens. With the increase in cycles, the flexural-strength-loss rates of all specimens gradually increased. The flexural-strength-loss rate of the AACGM was lower than that of the OPCM. After 100 cycles, the flexural-strength-loss rate of the W/B0.50 group was 20.72%, and that of the OPC group was 100%. It should be mentioned that the flexural-strength-loss rate of specimens was lower in the early stage (≤50 cycles). This is consistent with the result of the mass-loss rate. The damage of the specimens was slight, and the influence on flexural strength was minor in the early stage. In the later stage, the damage to the samples was enormous, so the flexural strength decreased rapidly. In addition, the flexural strength change of the AACGM showed an evident inflection point with alkali content at a value of 12%. The higher the slag content, the lower the flexural-strength-loss rate of specimens. Compared with the S25 group, the flexural-strength-loss rate of the S30, S35, and S40 groups at 100 cycles was reduced by 7.45%, 11.08%, and 14.86%, respectively. Therefore, increasing slag content can improve the frost resistance of the AACGM. This is attributed to the increase in CASH gel with high density in the system with the increase in slag content, which improves the frost resistance of specimens. Additionally, the flexural-strength-loss rate demonstrated a positive relationship with the water-to-binder ratio. After 100 freeze–thaw cycles, the flexural-strength-loss rate of the W0.60 group is 1.36 times, 1.34 times, and 1.19 times that of the W0.45, W0.50, and W0.55 groups, respectively. This is because the free water content in the system increased, leading to greater thermal expansion stress and more strength loss in the freezing stage [11,35].

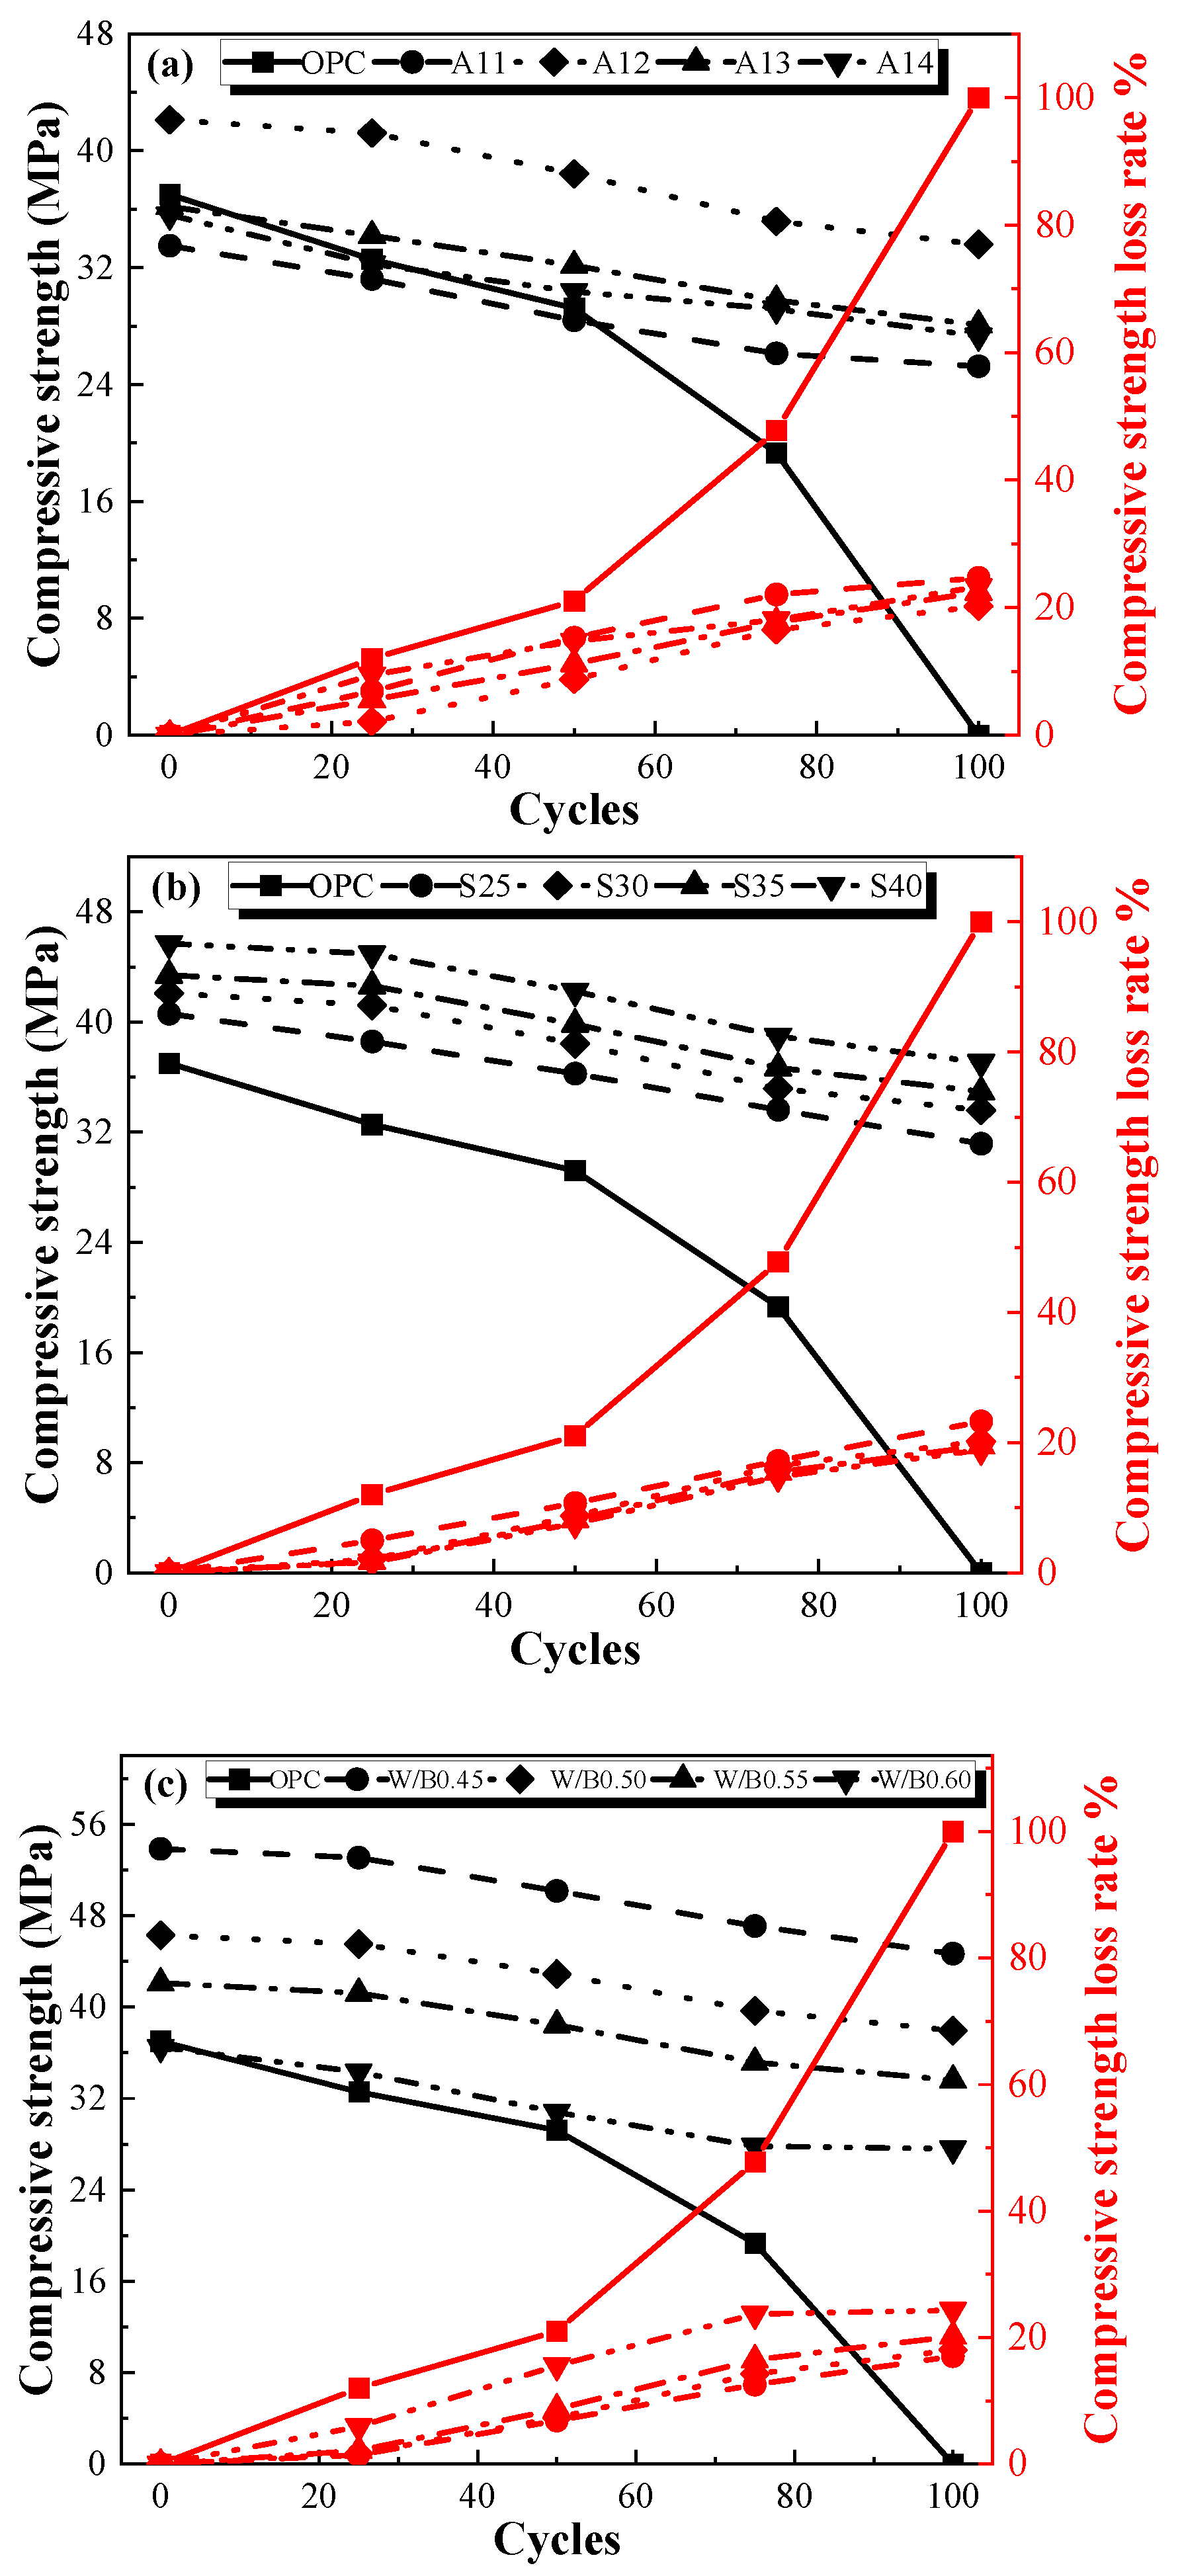
3.2.3. Compressive Strength after Freeze–Thaw Cycles

Figure 7 exhibits the effects of the alkali content, slag content, and water-to-binder ratio on the compressive strength of specimens. With the increase in cycles, the compressive-strength-loss rate of all specimens gradually increased. It is noteworthy that the compressive-strength-loss rate of the AACGM was less than that of the OPCM. Moreover, the compressive-strength-loss rate exhibited a trend of decreasing first and then increasing, and alkali content =12% was this inflection point. The compressive-strength-loss rate of the A12 group at 100 cycles was 81.98%, 90.26%, and 86.91% to the A11, A13, and A14 groups, respectively. In addition, the higher the slag content, the lower the compressive-strength-loss rate of specimens. Compared to the S25 group, the compressive-strength-loss rate of the S30, S35, and S40 groups at 100 cycles decreased by 13.06%, 16.16%, and 18.69%, respectively.
Moreover, the compressive-strength-loss rate demonstrated a positive relationship with the W/B. Compared with the W0.60 group, the compressive-strength-loss rates of the W0.45, W0.50, and W0.55 groups were reduced by 29.97%, 25.88%, and 16.96%, respectively. Furthermore, the compressive strength change of the AACGM was lower than 20% after 50 cycles, which is consistent with previous findings [30,36].

3.3. Microstructure Analysis

The microstructures of the W/B0.50 group were achieved by an Environment Scanning Electron Microscope (ESEM) scanner. Moreover, the changes in cracking morphologies of specimens were obtained by the pixel-based image processing algorithm [37]. The crack width was determined by six typical points of samples, which can be calculated by Equation (3).
L i = L 0 P 0 × P i
where Li is the crack width (μm); L0 is the width of the scaleplate (μm); P0 is the pixel value corresponding to the scaleplate; Pi is the pixel value corresponding to point i. Figure 8 displays the microstructure damage of specimens of the W/B0.50 group. Figure 9 exhibits the maximum crack widths of specimens.
Figure 8 and Figure 9 demonstrate that the quantity and width of cracks and the number of pores on the surface of specimens gradually increased. The surface of the initial specimen was smooth, with few cracks and pores. After 25 freezing and thawing cycles, a few cracks occurred at the edges of the specimens. The maximum crack width was 1.98 μm, but the damage to the specimens was minor, which was consistent with the loss rates of mass and strength. After 75 freezing and thawing cycles, the maximum crack width reached 3.30 μm, and a large number of pores appeared in the specimens. When the cycles were increased from 25 to 100 cycles, the maximum crack width increased from 1.98 to 7.48 μm, an increase of 277.78%. In addition, the microstructure evolution is consistent with the changes in macro performances. The damage of microstructure and the loss rate of macro-performances of the AACGM increased slowly in the first 50 cycles and then developed rapidly after 50 cycles.

3.4. Freeze–Thaw Damage Mechanisms

Figure 10 shows the schematic diagram of the freeze–thaw damage mechanism. The AACGM is composed of three-phase media of water, alkali-activated cementitious material, and sand, but the thermophysical properties of these three-phase media are different. The freeze–thaw cycle test includes two stages: the freezing stage and the thawing stage. In the freezing stage, the water in the pores and cracks freezes and expands the volume, causing the expansive thermal stress of the ice (σa) to the AACGM around the pores, as shown in Figure 10 [38,39]. In addition, the chemical compositions of different media were generally different, and different thermal shrinkage stresses were generated. The σb is the thermal shrinkage stress of the AACGM, and the σc is the thermal shrinkage stress of sand. All three stresses mentioned above can lead to varying degrees of microcracking in the AACGM. At the thawing stage, the σa, σb, and σc were gradually released as the temperature increases. However, water can enter the microcracks that have formed and further aggravate the damage of specimens in the following freezing and thawing cycles.
In addition, the surfaces of specimens are more sensitive to temperature than their interior, which causes a temperature gradient to form inside to outside the specimen and generates tensile stress on the local surface of the mortar specimen. When the tensile stress generated by the temperature gradient exceeds the ultimate tensile stress of specimen, cracks begin to appear on the surface. As more cycles were performed, specimens began to become loose and fragile, and the mineral particles gradually peeled off and continued to the interior of the mortar samples.

4. Conclusions

In the current research, the feasibility of the preparation of AACGM with composite-activated coal gangue completely replacing cement was systematically studied. The effects of alkali content, slag content, and water-to-binder ratioon mechanical properties and frost resistance of AACGM were experimentally investigated. In addition, the microstructure evolution and freeze–thaw damage mechanisms were also analyzed. Several conclusions can be drawn, as follows:
(1)
Compared with ordinary Portland cement mortars, the AACGM has higher mechanical strength. Compared with the OPC group, the compressive and flexural strength of the W/B0.50 group were improved by 14.19% and 16.01%. In addition, the strength of the AACGM rose quickly in the front seven days and grew slightly beyond seven days.
(2)
The frost resistance of the AACGM was superior to that of the OPCM. After one hundred freezing and thawing cycles, the loss rates of mass, flexural strength, and compressive strength of the OPC group were 1.84 times, 5.43 times, and 5.54 times those of the W0.50 group, respectively.
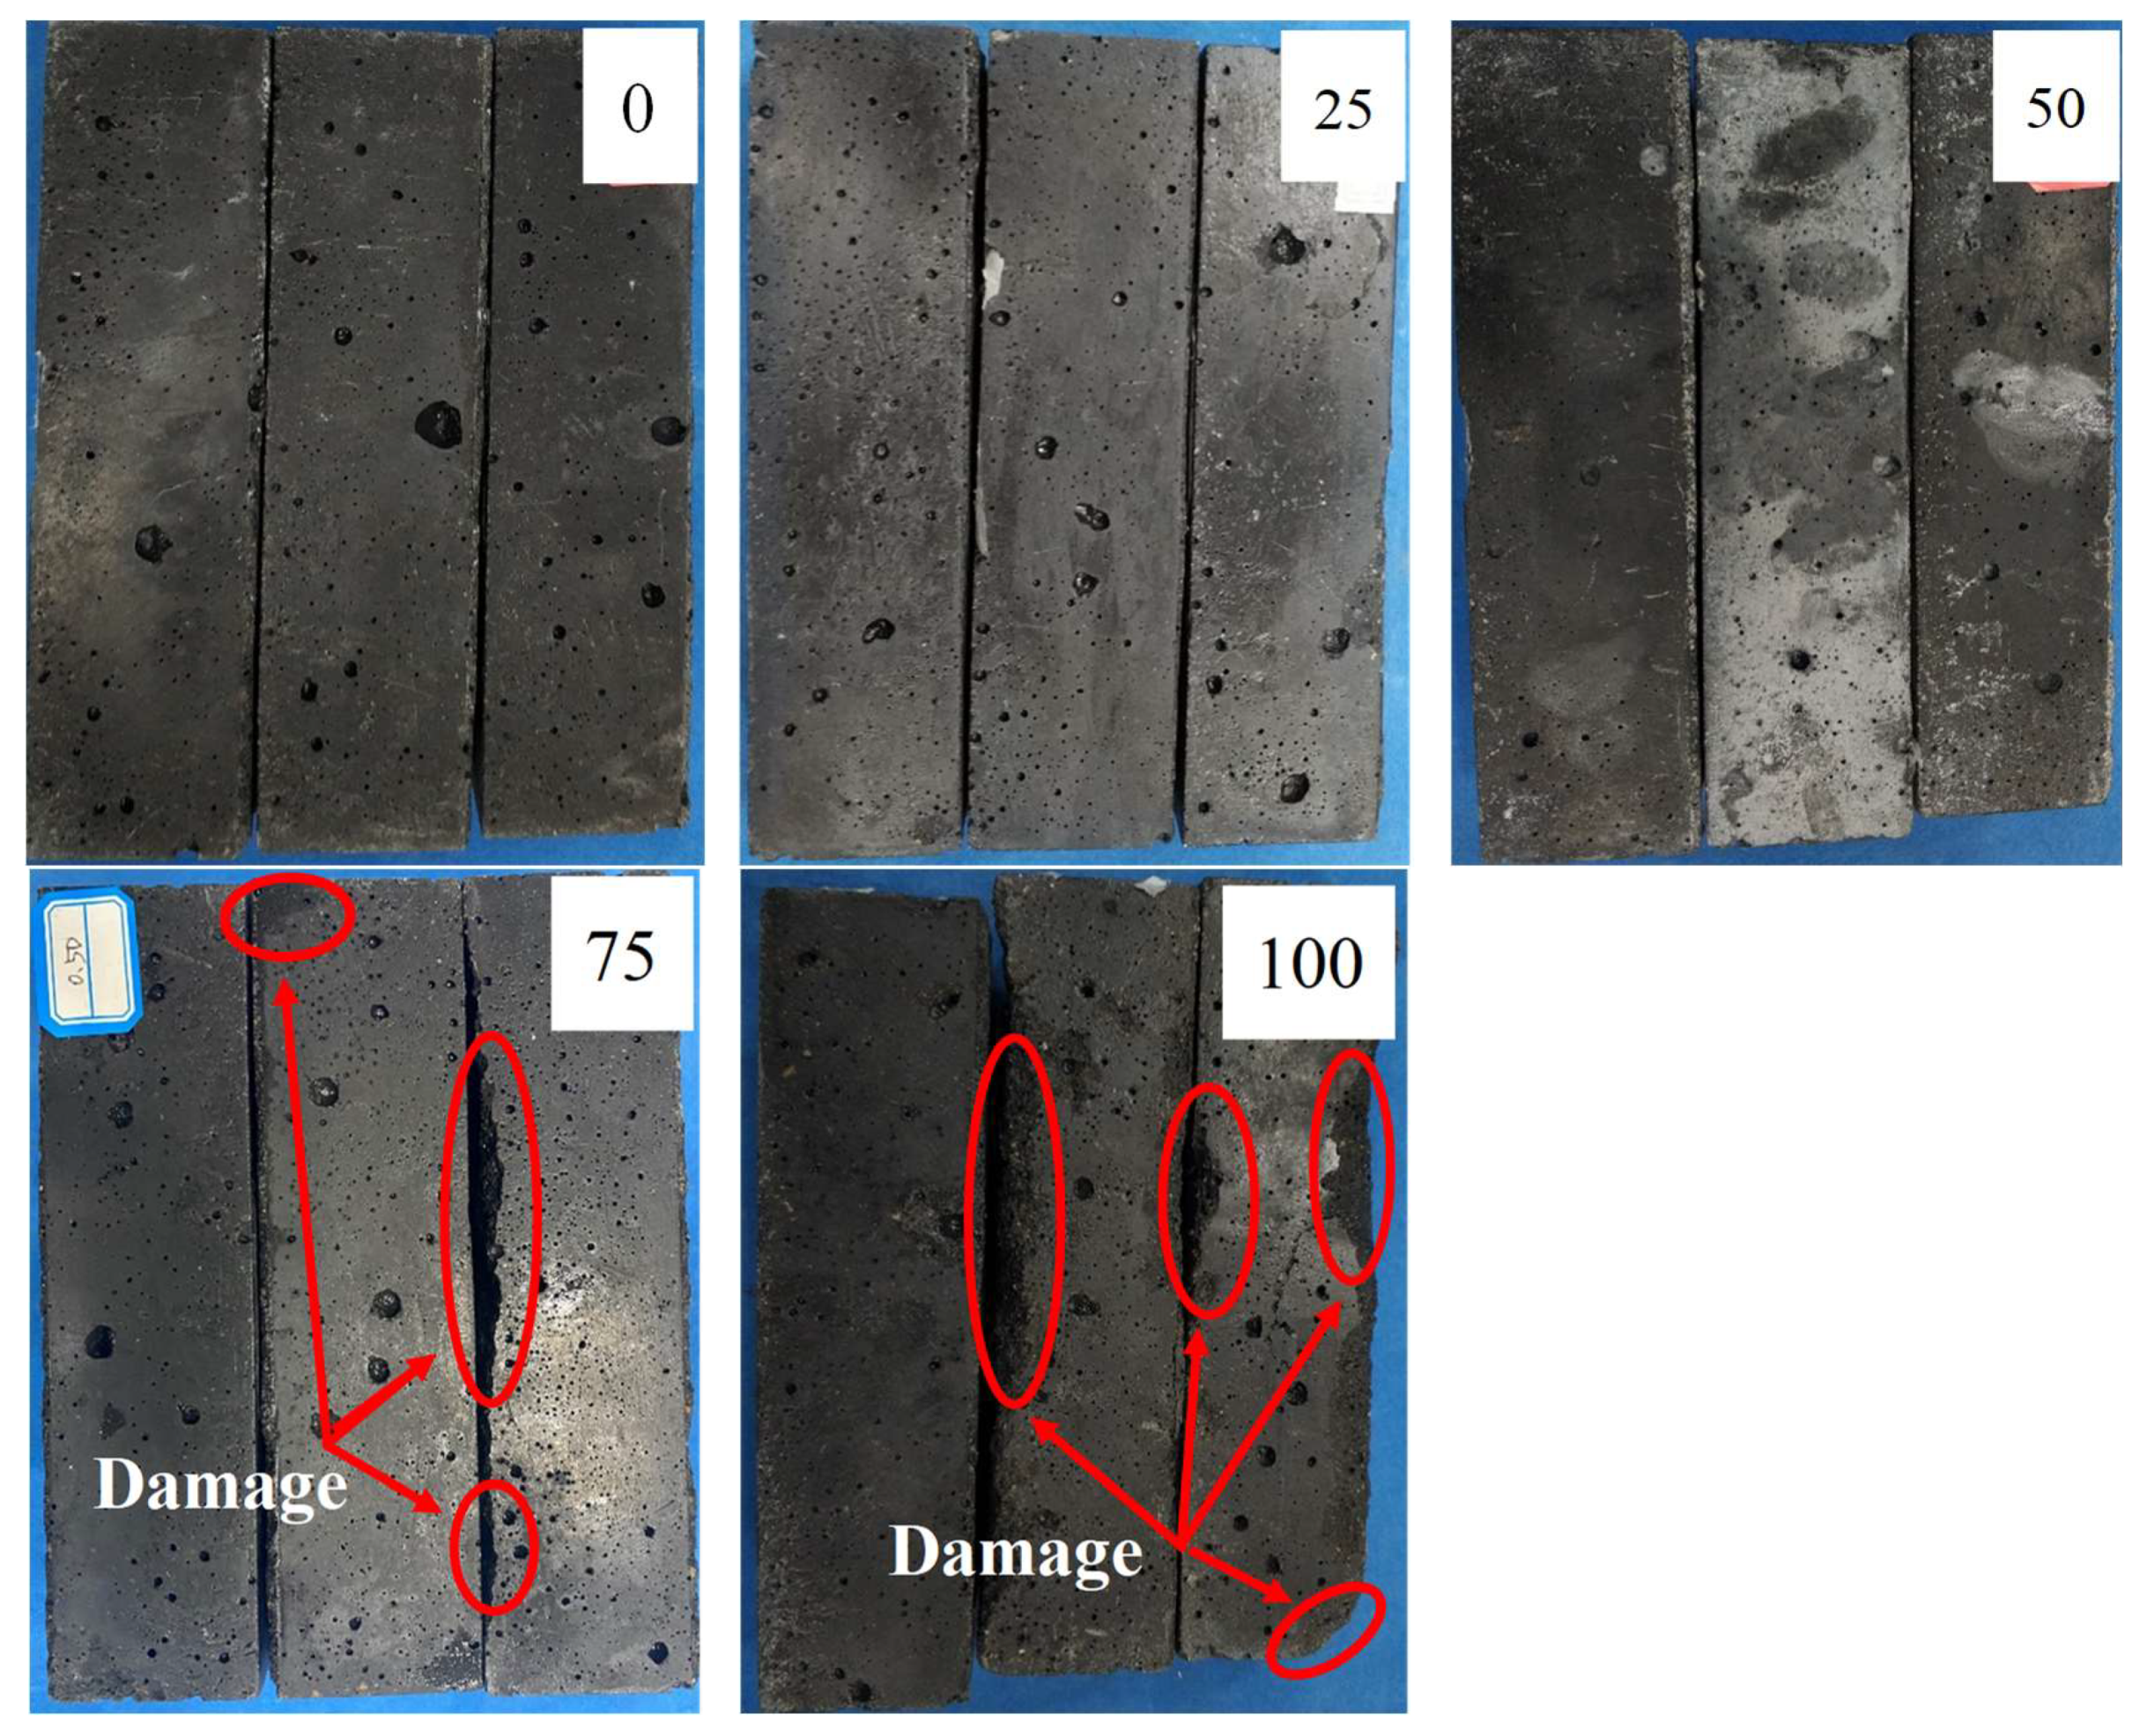
(3)
As the number of freezing and thawing cycles increased, the cracks and pores of specimens increased. When the number of freezing and thawing cycles increased from 25 to 100, the maximum crack width increased from 1.98 to 7.48 μm, an increase of 277.78%.

Author Contributions

Conceptualization, C.Y. (Caiqian Yang) and Z.W.; Investigation, Y.Z., K.L., J.Y. and C.Y. (Chengyu Yan); Resources, J.Y.; Data curation, C.Y. (Chengyu Yan); Writing—original draft, Y.Z.; Writing—review & editing, Y.Z. and K.L.; Project administration, C.Y. (Caiqian Yang) and Z.W. All authors have read and agreed to the published version of the manuscript.

Funding

This research was funded by the Nanjing International joint research and development project of China (2022SX00001057), the Zhungeer Banner Science and Technology Plan Project of China (2019003), and the National Natural Science Foundation of China (52078122).

Institutional Review Board Statement

Not applicable.

Data Availability Statement

Not applicable.

Conflicts of Interest

The authors declare no conflict of interest.

References

  1. Peng, B.; Li, X.; Zhao, W.; Yang, L. Study on the release characteristics of chlorine in coal gangue under leaching conditions of different pH values. Fuel 2018, 217, 427–433. [Google Scholar] [CrossRef]
  2. Zhao, Y.; Yang, C.; Yan, C.; Yang, J.; Wu, Z. Design and Properties of Coal Gangue-Based Geopolymer Mortar. Buildings 2022, 12, 1932. [Google Scholar] [CrossRef]
  3. Li, J.; Wang, J. Comprehensive utilization and environmental risks of coal gangue: A review. J. Clean. Prod. 2019, 239, 117946. [Google Scholar] [CrossRef]
  4. Kasassi, A.; Rakimbei, P.; Karagiannidis, A.; Zabaniotou, A.; Tsiouvaras, K.; Nastis, A.; Tz Af Eiropoulou, K. Soil contamination by heavy metals: Measurements from a closed unlined landfill. Bioresour. Technol. 2008, 99, 8578–8584. [Google Scholar] [CrossRef]
  5. Zhao, Y.; Yang, C.; Cheng, S.; Wu, Z.; Wang, B. Performance and Hydration Mechanism of Modified Tabia with Composite-Activated Coal Gangue. Crystals 2022, 12, 150. [Google Scholar] [CrossRef]
  6. Jablonska, B.; Kityk, A.V.; Busch, M.; Huber, P. The structural and surface properties of natural and modified coal gangue. J Environ. Manag. 2017, 190, 80–90. [Google Scholar] [CrossRef]
  7. Li, M.; Zhang, J.; Li, A.; Zhou, N. Reutilisation of coal gangue and fly ash as underground backfill materials for surface subsidence control. J. Clean. Prod. 2020, 254, 120113. [Google Scholar] [CrossRef]
  8. Rybak, J.; Gorbatyuk, S.M.; Bujanovna-Syuryun, K.C.; Khairutdinov, A.M.; Tyulyaeva, Y.S.; Makarov, P.S. Utilization of Mineral Waste: A Method for Expanding the Mineral Resource Base of a Mining and Smelting Company. Metallurgist 2021, 64, 851–861. [Google Scholar] [CrossRef]
  9. Li, M.; Li, A.; Zhang, J.; Huang, Y.; Li, J. Effects of particle sizes on compressive deformation and particle breakage of gangue used for coal mine goaf backfill. Powder Technol. 2020, 360, 493–502. [Google Scholar] [CrossRef]
  10. Dong, Z.; Xia, J.; Fan, C.; Cao, J. Activity of calcined coal gangue fine aggregate and its effect on the mechanical behavior of cement mortar. Constr. Build. Mater. 2015, 100, 63–69. [Google Scholar] [CrossRef] [Green Version]
  11. Ma, H.; Yi, C.; Zhu, H.; Dong, Z.; Chen, H.; Wang, J.; Li, D. Compressive strength and durability of coal gangue aggregate concrete. Mater. Rep. B 2018, 32, 2390–2395. [Google Scholar]
  12. Song, W.J.; Xu, H.L.; Guo, H.; Lu, H.X.; Cao, W.B.; Zhang, Y.; Wu, Y.N.; Zhang, H.Z. Effect of particle size of coal gangue on microstructure and property of coal gangue fired brick. China Ceram. 2011, 47, 8–11. [Google Scholar]
  13. Zhao, Y.; Yang, C.; Li, K.; Qu, F.; Yan, C.; Wu, Z. Toward understanding the activation and hydration mechanisms of composite activated coal gangue geopolymer. Constr. Build. Mater. 2022, 318, 125999. [Google Scholar] [CrossRef]
  14. Guo, W.; Li, D.; Chen, J.; Yang, N. Structure and pozzolanic activity of calcined coal gangue during the process of mechanical activation. J. Wuhan Univ. Technol.-Mater. Sci. Ed. 2009, 24, 326–329. [Google Scholar] [CrossRef]
  15. Zhou, M.; Shen, M.Y.; Wu, J.H.; Gao, S.; Sun, X.H.; Liu, X.; Niu, M.N.; Zhang, J.Q. Preparation and effect of coal-gangue admixture on alkali-aggregate reaction of concrete. Bull. Chin. Ceram. Soc. 2017, 36, 1713–1717. [Google Scholar]
  16. Zhang, P.; Gao, Z.; Wang, J.; Guo, J.; Hu, S.; Ling, Y. Properties of fresh and hardened fly ash/slag based geopolymer concrete: A review. J. Clean. Prod. 2020, 270, 122389. [Google Scholar] [CrossRef]
  17. Zhang, B.; Zhu, H.; Wang, Q.; Shah, K.W.; Wang, W. Design and properties of seawater coral aggregate alkali-activated concrete. J. Sustain. Cem.-Based Mater. 2021, 11, 187–201. [Google Scholar] [CrossRef]
  18. Wu, H.; Zhang, X.Y.; Kong, D.S.; Xu, L.F. Cementing performance of activated coal gangue based unburned brick. Bull. Chin. Ceram. Soc. 2017, 36, 359–364. [Google Scholar]
  19. Zhang, C.; Xue, J.; Fang, L. Mechanical properties and microstructures of alkali activated burned coal gangue cementitious material. J.-Chin. Ceram. Soc. 2004, 32, 1276–1280. [Google Scholar]
  20. Zhao, Y.; Yang, C.; Qu, F.; Li, K.; Yang, J.; Wu, Z. Mechanical Properties and Drying Shrinkage of Alkali-Activated Coal Gangue Concrete. Sustainability 2022, 14, 14736. [Google Scholar] [CrossRef]
  21. Ma, H.; Zhu, H.; Wu, C.; Chen, H.; Liu, J. Study on compressive strength and durability of alkali-activated coal gangue-slag concrete and its mechanism. Powder Technol. 2020, 368, 112–124. [Google Scholar] [CrossRef]
  22. Frías, M.; De Rojas, M.S.; García, R.; Valdés, A.J.; Medina, C. Effect of activated coal mining wastes on the properties of blended cement. Cem. Concr. Compos. 2012, 34, 678–683. [Google Scholar] [CrossRef]
  23. Duxson, P.; Provis, J.L.; Lukey, G.C.; Van Deventer, J.S. The role of inorganic polymer technology in the development of ‘green concrete’. Cem. Concr. Res. 2007, 37, 1590–1597. [Google Scholar] [CrossRef]
  24. Zhang, Y.; Ling, T.C. Reactivity activation of waste coal gangue and its impact on the properties of cement-based materials—A review. Constr. Build. Mater. 2020, 234, 117424. [Google Scholar] [CrossRef]
  25. Moghadam, M.J.; Ajalloeian, R.; Hajiannia, A. Preparation and application of alkali-activated materials based on waste glass and coal gangue: A review. Constr. Build. Mater. 2019, 221, 84–98. [Google Scholar] [CrossRef]
  26. GB/T 17671-199; Ministry of Housing and Urban-Rural Construction of the People’s Republic of China. Method of Testing Cements-Determination of Strength; China Architecture & Building Press: Beijing, China, 1999.
  27. GB/T 50082-2009; Ministry of Housing and Urban-Rural Construction of the People’s Republic of China. Standard for Test Methods of Long-Term Performance and Durability of Ordinary Concrete; China Architecture & Building Press: Beijing, China, 2009.
  28. Hongqiang, M.; Hongyu, C.; Hongguang, Z.; Yangyang, S.; Yadong, N.; Qingjie, H.; Zetao, H. Study on the drying shrinkage of alkali-activated coal gangue-slag mortar and its mechanisms. Constr. Build. Mater. 2019, 225, 204–213. [Google Scholar] [CrossRef]
  29. Zheng, W.; Zou, M.; Wang, Y. Literature review of alkali-activated cementitious materials. J. Build. Struct 2019, 40, 28–39. [Google Scholar]
  30. Wang, Q.; Kang, R.S.; Wu, L.M.; Tang, N.; Zhang, Q. Molecular Simulation of N-A-S-H and C-A-S-H Structures in Geopolymer gel Systems. J. Build. Mater. 2020, 23, 8. [Google Scholar]
  31. Jia, Q. Study on Preparation and Properties of Na-Fly Ash Geopolymer. Ph.D. Thesis, China University of Mining & Technology, Beijing, China, 2009. [Google Scholar]
  32. Provis, J.L.; Deventer, J. Geopolymerisation kinetics. 1. In situ energy-dispersive X-ray diffractometry. Chem. Eng. Sci. 2007, 62, 2309–2317. [Google Scholar] [CrossRef]
  33. Provis, J.L.; Deventer, J. Geopolymerisation kinetics. 2. Reaction kinetic modelling. Chem. Eng. Sci. 2007, 62, 2318–2329. [Google Scholar] [CrossRef]
  34. JGJ70-90; Standard for Test Method of Perormance on Building Mortar. China Architecture & Building Press: Beijing, China, 2009.
  35. Luo, D.; Wang, Y.; Zhang, S.; Niu, D.; Song, Z. Frost resistance of coal gangue aggregate concrete modified by steel fiber and slag powder. Appl. Sci. 2020, 10, 3229. [Google Scholar] [CrossRef]
  36. Slavik, R.; Bednarik, V.; Vondruska, M.; Nemec, A. Preparation of geopolymer from fluidized bed combustion bottom ash. J. Mater. Process. Technol. 2008, 200, 265–270. [Google Scholar] [CrossRef]
  37. Yang, X.; Wang, J.; Zhu, C.; He, M.; Gao, Y. Effect of wetting and drying cycles on microstructure of rock based on SEM. Environ. Earth Sci. 2019, 78, 1–10. [Google Scholar] [CrossRef]
  38. Han, T.; Shi, P.J.; Chen, Y.; Zhong, L.; Pu, C.; Li, Z.; Li, C. Experimental investigation on mechanical characteristics of mortar under different chemical solutions and freeze-thaw cycles. J. Ecperimental Mech. 2019, 34, 489–500. [Google Scholar]
  39. Gao, Y. The research on damage of concrete under the salt scaling. Master’s Thesis, Lanzhou University of Technology, Lanzhou, China, 2009. [Google Scholar]
Figure 1. Gradation cure of sand.
Buildings 12 02243 g001
Figure 2. Normalized flexural strength of various specimens: (a) alkali content; (b) slag content; (c) water-to-binder ratio.
Buildings 12 02243 g002
Figure 3. Normalized compressive strength of various specimens: (a) alkali content; (b) slag content; (c) water-to-binder ratio.
Buildings 12 02243 g003
Figure 4. Mass-loss rates of specimens: (a) alkali content; (b) slag content; (c) water-to-binder ratio.
Buildings 12 02243 g004
Figure 5. Appearance of the damage to the specimens.
Buildings 12 02243 g005
Figure 6. Effects of (a) alkali content, (b) slag content, and (c) water-to-binder ratio on the flexural strength of specimens.
Buildings 12 02243 g006
Figure 7. Effects of (a)alkali content, (b)slag content, and (c) water-to-binder ratio on the compressive strength of specimens.
Buildings 12 02243 g007
Figure 8. Microstructural cracking patterns of specimens after (a) 0, (b) 25, (c) 50, (d) 75, and (e) 100 freeze–thaw cycles.
Buildings 12 02243 g008aBuildings 12 02243 g008b
Figure 9. Maximum crack width of the AACGM.
Buildings 12 02243 g009
Figure 10. Schematic diagram of freeze–thaw damage mechanism.
Buildings 12 02243 g010
Table 1. Main compositions of test materials (wt%).
ComponentsSiO2Al2O3MgONa2OFe2O3CaOK2OSO3OthersLOI
Coal gangue55.1440.960.300.091.230.410.200.431.2415.33
Slag36.1016.3211.32--35.58--0.682.30
OPC21.087.102.110.21460.2060.201.163.850.842.1%
Table 2. Mix proportions.
NO.Alkali Content/%Slag Content/gCACG/gCement/gSand/gWater/Binder
A1111300700-30000.55
A1212300700-30000.55
A1313300700-30000.55
A1414300700-30000.55
S2512250700-30000.55
S3512350650-30000.55
S4012400600-30000.55
W/B0.4512300700-30000.45
W/B0.5012300700-30000.50
W/B0.6012300700-30000.60
OPC---100030000.50
Table 3. Test results for each type of mortar.
Specimens Numberfc (MPa)ft (MPa)
3 Days7 Days28 Days3 Days7 Days28 Days
OPC20.94 ± 0.8625.01 ± 0.8037.08 ± 0.855.37 ± 0.255.96 ± 0.177.12 ± 0.15
A1127.11 ± 0.8932.10 ± 0.7134.50 ± 0.666.64 ± 0.227.64 ± 0.178.02 ± 0.15
A1231.62 ± 1.3638.83 ± 1.0942.34 ± 1.407.03 ± 0.307.97 ± 0.238.56 ± 0.32
A1326.83 ± 0.6433.47 ± 0.6036.87 ± 0.966.33 ± 0.187.20 ± 0.177.78 ± 0.16
A1425.55 ± 1.1031.92 ± 0.9936.00 ± 1.015.95 ± 0.276.96 ± 0.257.71 ± 0.16
S2529.20 ± 1.0535.16 ± 0.9137.08 ± 1.116.34 ± 0.237.12 ± 0.158.26 ± 0.18
S3533.34 ± 0.9740.91 ± 1.7244.33 ± 1.027.20 ± 0.178.20 ± 0.338.64 ± 0.20
S4036.48 ± 1.3143.00 ± 1.1246.20 ± 0.797.28 ± 0.248.32 ± 0.238.70 ± 0.17
W/B0.4542.31 ± 1.4851.78 ± 1.1954.70 ± 0.988.77 ± 0.349.93 ± 0.2210.53 ± 0.18
W/B0.5034.74 ± 1.2942.32 ± 1.1845.46 ± 0.868.38 ± 0.279.53 ± 0.2810.12 ± 0.20
W/B0.6026.75 ± 0.9433.78 ± 0.9837.48 ± 0.825.75 ± 0.216.53 ± 0.197.12 ± 0.15
Publisher’s Note: MDPI stays neutral with regard to jurisdictional claims in published maps and institutional affiliations.

