Article

Optimizing the Air Conditioning Layouts of an Indoor Built Environment: Towards the Energy and Environmental Benefits of a Clean Room

1
Department of Mechanical Engineering, Faculty of Mechanical and Aeronautical Engineering, University of Engineering and Technology Taxila, Rawalpindi 47080, Pakistan
2
Department of Chemical Engineering, Faculty of Mechanical and Aeronautical Engineering, University of Engineering and Technology, Peshawar, Pakistan
3
Department of Energy Engineering, University of Engineering and Technology Taxila, Rawalpindi 47080, Pakistan
4
School of Computing, Engineering and Digital Technologies, Teesside University, Middlesbrough TS1 3BX, UK
5
Facultad de Ingeniería, Universidad Autónoma de Yucatán, Av. Industrias No Contaminantes por Anillo Periférico Norte, Apdo. Postal 150, Cordemex, Mérida 97203, Mexico
6
Departamento de Sistemas y Computación, Tecnológico Nacional de México/IT de Mérida, Mérida, Mexico
7
Faculty of Science and Technology, Jan Dlugosz University in Czestochowa, Armii Krajowej 13/15, 42-200 Czestochowa, Poland
*
Authors to whom correspondence should be addressed.
Buildings 2022, 12(12), 2158; https://doi.org/10.3390/buildings12122158
Submission received: 14 October 2022 / Revised: 21 November 2022 / Accepted: 30 November 2022 / Published: 7 December 2022

Abstract

:
Reducing energy consumption in buildings has received intensified research impetus since the introduction of the decarbonization goals set in the Paris agreement. Many domestic and specialized applications require clean rooms (indoor built environments) for safe and clean operation. Energy efficiency in clean room spaces depends on maintaining livable or required conditions such as temperature, humidity, and particle concentration with minimal use of energy and new carbon dioxide (CO2) emissions. In the literature, parameters such as temperature, relative humidity, particle concentrations, and CO2 emissions are not able to be properly controlled in clean room systems. The designed system in the literature involves high energy consumption and high economic costs. All these factors add novelty to this research, which was a significant research gap in previous studies. This clean room is directly linked to environmental parameters such as ambient temperature, relative humidity, etc. The clean room is also related directly to the building and infrastructure in such a way that there are certain regulatory requirements for designing a clean room. For designing and constructing the controlled environment in a clean room, the English (EN) documents, ISO 9000, and various other standards allow for clean rooms for different types of products. In this research, the designed control configurations properly control the system. Additionally, this system is energy efficient, with positive environmental aspects regarding CO2 emissions. Three control configurations were designed in this research, option A, option B, and option C, and three parameters are controlled in the study. These parameters are room temperature, relative humidity, and CO2 emissions (outside the room). CO2 emissions are controlled outside the room (in the environment). In the last research phase, a comparative analysis of these three control configurations was performed to find an energy-efficient system with fewer CO2 emissions. Control configuration B (option B) provides reliable results regarding an energy-efficient system and fewer CO2 emissions emitted to the environment. In this study, an optimized configuration for the air conditioning system was developed for a clean room (volume 185.6 m3) with a required temperature of 23 °C, relative humidity of 40%, and a particle size of less than 0.3 μm. Three different design configurations were analyzed using TRNSYS simulation software. The minimization of energy use and CO2 emissions were the objective functions. Energy loads were calculated for each of the configurations by varying the fixed air change per hour and the minimum outdoor air flow rate. The results of a whole year simulation run for control configurations A, B, and show that, on the one hand, the ambient weather conditions of temperature and relative humidity (RH) is varied throughout year and, on the other hand, the clean room temperature was maintain at exactly 23 °C, which is the required set point temperature, for all the three configurations (A, B, and C). Furthermore, the clean room relative humidity was maintained at 36% for configuration A, below the 40% which was the set point for clean room relative humidity, and at 40% for configurations B and C. Configuration B exhibited the minimum energy use (7300 kWh), at a fixed air change per hour value of 20 and a minimum outdoor air flow rate of 150 L/s, with the least amount of CO2 emissions, offering an overall 25% improvement over configurations A and C.

1. Introduction

Recent years have seen an increase in the demand for clean rooms. Many domestic and specialized applications require clean rooms for safe and clean operation, such as in the pharmaceutical industries, the aerospace sector, medical device manufacturers, optics, nanotechnology, biological safety areas, university labs, and research facilities. This has been inspired by an increased emphasis on product quality and clean production. In the United States alone, the total clean room area has increased from 4.2 million square meters in 1993 to 15.5 million square meters in 2015. Similar trends can also be seen in the Far East and South Asia [1]. One of example of clean room domestic applications includes domestic air conditioners (ACs). The filters are already installed in an AC, and, with the concerned area being the quality of air conditioning, the concentration of particulate matter is also important to some extent in ACs. It is difficult to achieve effective air conditioning quality without controlling the concentration of particulate matter in household applications in the indoor environment, and the concentration of particulate matter used in filters of domestic ACs is one of the parameters that affects air conditioning quality. It should be noted that particulate matter has a minor impact on air conditioning quality; however, it is not a major parameter in terms of the need for control. Other clean room applications include the medical field and industry. The clean room has a major role play in ensuring patient health and product safety in the medical field. Clean room technology is used by pharmacies, treatment facilities, hospitals, and manufacturing plants of medical devices to reduce the airborne particulate level. Clean room industrial applications includes the manufacturing of optics, to ensure humidity control and cleanliness upon lenses. Another industrial application of clean rooms is in the electronics industry and the manufacturing of small components such as nanotechnology, CPU’s, and high-precision devices.
A clean room is a controlled space where the quality is controlled directly by modulating various physical parameters that include temperature, humidity, particle contamination, ventilation noise, vibration, and space pressurization. Such special requirements make the operation of clean rooms highly energy intensive, as they may require 30–50 times more energy than a common air-conditioned building [2]. Clean room environments consume approximately 30–65% of the total energy consumed in a whole building [3]. High energy consumption represents high overall costs. For example, establishing a class 10 clean room (ISO 14644-1 clean room standards) costs $2000 per square foot, and an additional $1 million is required to operate it annually [4]. In comparison with non-classified rooms, a clean room requires a huge amount of energy. Considering the scientific literature, it is worth highlighting that a clean room requires 25.3 times more energy in comparison with non-classified rooms. HVAC systems require 50–75% more electricity consumption purely because of clean production spaces [5,6]. If a classical economic theory is followed, it would be logical to adopt an energy source that costs the minimum. However, with the introduction of decarbonization protocols [7]. It is now necessary to opt for systems that produce lower CO2 emissions. This means that process configurations that were assumed to be the best in the past are no longer applicable. Among many CO2 emission reduction strategies, one is to optimize the system design and improve process efficiency [8]. This is marked as one of the key targets in the European Unions’ 2030 climate and energy framework [9]. Inadequate system design and control in engineering practice for energy intensive processes lead to wastages in terms of energy. For example, in Hong Kong, 42% of the annual energy consumption was reduced in pharmaceutical units by system retrofitting/optimization, without hardware modifications [10]. Many systems for clean rooms have been analyzed for energy use minimization, with good results, showing the huge energy saving potential for air-conditioning systems in control rooms [11,12,13,14]. However, to fully utilize the saving potential of air conditioning systems, many problems need to be addressed, due to complexity of their system design and operation.
Any experimental work related to the development of clean rooms is not only cost intensive but requires human and material inputs beyond the resources of most research and academic organizations. It is, therefore, reasonable to rely on established modeling and simulation methods for the analysis of energy consumption/minimization. TRNSYS software is a reliable tool for modeling and simulation [15]. The software has been used for performance analysis and cost reduction in solar thermal systems [16], hybrid space cooling systems [17], and the application of phase change materials in building design [18]. Kircher et al. [19] developed a TRNSYS model of a clean room located in a US nanoscience research facility. They presented different strategies such as a heat recovery system, the solar heating of ingoing air, upgraded lighting and equipment, and controlled filtration in response to different levels of particulate matters in the clean room. The results were encouraging in terms of energy efficiency and carbon emissions in the sunnier states (California and Texas) of the US. Shan and Wang [2] reported a reduction in cooling and heating consumption of up to 69.6% and 87.8%, respectively, when they retrofitted a partially decoupled clean room system. Zhuang et al. [13] presented a new ventilation strategy (ADV) and reported energy savings of 21.64%, 15.63% and 7.77% as compared to a partially decoupled control strategy.
The TRNSYS software has been extensively applied across various demographic regions with excellent results. Thanks to its capability to interconnect system components in any desired manner and quickly solve system differential equations, the component models of TRNSYS are flexible and can be either selected from libraries or written by the user and linked to the model [20].
TRNSYS has been effectively used for the simulation and testing of the air conditioning systems, for both the normal/academic buildings [21,22,23,24,25] and clean rooms [10,26,27], with a variety of technology options being tested [28,29,30,31,32]. Moreover, the inclusion of weather data (with flexibility and many options [33]) allows for the direct analysis of the effect of system’s surroundings [34,35], especially when weather conditions vary throughout the year. Pakistan’s weather is no different; however, there has only been limited research carried out on the design of clean room systems using the TRNSYS model. Asim et al. [36] developed a TRNSYS simulation for a solar cooling system for the hot temperate regions of Pakistan. An absorption-based chiller is operated using hot water from an evacuated tube collector. The TRNSYS model helped to determine the exact collector area for the system to maintain a cooling temperature of 26 °C during the summer season. Fatima et al. [37] designed a combined solar thermal water and space heating system for a commercial building in the climatic conditions of Islamabad, Pakistan. They used TRNSBuild model to design the commercial building, while the combined solar thermal and space heating system was designed in the TRNSYS environment with acceptable results. Recently, Mehmood et al. [38] presented an energetic, economic, and environmental (3E) assessment and design of a solar-powered HVAC system for Pakistani conditions. The research features the linking of Python coding with the TRNSYS model to simulate and analyze the solar powered HVAC system for an industrial manufacturing building situated in climate conditions of Lahore, Pakistan.
Although the TRNSYS-based modeling of air-conditioning systems in Pakistan has been studied enough to establish a base case, the results cannot be extrapolated for air conditioning requirements for clean rooms. Therefore, this research developed a control design and operational mechanism for an air-conditioning system to be used in clean rooms. To incorporate the effects of variations in weather throughout the year on the said air-conditioning systems, Islamabad, Pakistan (33.6844° N, 73.0479° E) was selected as the location for the said clean room. The TRNSYS environment was used to develop three air-conditioning design configurations (following the research work of [10]), which are then tested for a range of weather conditions.
Any given contained space with provisions to limit contaminated particles and control other key environmental conditions such as humidity, temperature, and pressure is described as a clean room [39,40]. Clean rooms are classified on the basis of number and size of particulate matter per volume of air. The ISO 14644-1 clean room standards are shown in Table 1 [39].
Dipti Trivedi et al. researched occupation detection systems using various communication technologies and methods of estimation. However, the modelling of occupancy information in a correct manner remained challenging because of underlying cost and hardware deployment limitations. As a result, they provided a comparative analysis of accuracy, cost, and intrusiveness [41]. Wenzhuo Li et al. presented a paper that is based on a system of multi-zone ventilation featuring the energy use and indoor air quality. The complex optimization problem was broken down into problems of simple optimization by using the distributed approach. Using TRNSYS-MATLAB, two control tests were conducted under various outdoor weather conditions [42].
Sustainable building performance integration and optimization was performed by the Elie Azar et al. using modelling based on a human focus agent. The framework of “agent based modelling (ABM)” was created in this research to develop the actions and movement of peoples in the environment by developing an urban area model. Furthermore, the consumption levels in terms of energy and key aspects of performance, such as thermal comfort (indoor/outdoor), were also calculated in this research. The optimization of operations in terms of sustainable building was also a key objective of this research [43].
The daylight balancing of office spaces by considering the indoor thermal environment was performed by Ali Ahmed et al. Multi-optimization scenarios were used in this research. The scenario of available of daylight provides an increase in temperature. The obtained results revealed optimized design parameters for the light shelf [44]. The selection of HVAC systems for residential buildings and envelope optimization was performed by the Youssef Bichiou. The features of a building design that reduces costs in terms of life cycle were also determined in this paper using building environment simulations [45]. Toke Rammer developed a methodology of building design that assists the building design optimizations during the initial stages of design process. The reason behind this was to achieve a building design that is cost effective approach with better performance. Optimal design in terms of buildings meets all the demands required by society [46].
When it comes to controlling the temperature, particulate contamination, as well as the humidity, the most optimal system to reassure manufacturers would be a clean room. Clean room control particle retention, introduction, and generation in a room and protect the product or process from human-borne or air contaminants. A clean room is directly linked to environmental parameters such as ambient temperature, relative humidity, etc. The major difference between a clean room and a controlled environment is that a clean room should be recognized by an independent agency such as the “institute of environmental earth sciences”, while a controlled environment is a working area that usually controls more than one chemical, physical, and biological variable. In discussing a clean room, the term ‘controlled’ defines certain parameters such as temperature, humidity, or air quality. This is one of the reasons for clean room being linked to the environment Clean rooms are also directly related to the building and infrastructure in such a way there are some regulatory requirements for designing a clean room. For designing and constructing the controlled environment in a clean room, the EN documents, ISO 9000, and various other standards allow for clean rooms for different types of products. Products are manufactured in a controlled environment by acquiring the standards of ISO documents and GMPS [47].
In this research, a cleanroom environment control system was designed for the climatic conditions of Islamabad, the capital of Pakistan, using TRNSYS software. Three different process configurations were examined for optimal results targeting the least amount of energy consumption [42] and CO2 emissions. The system was designed for class 1000 and class 10,000 HEPA filters with a dust spot efficiency of 99.97% of 0.3 µm particles. A volume of 185.6 m3 was selected, as compared to 162.5 m3 used by Shan and Wang [2]. Other parameters were kept same as those used by Shan and Wang [2]. The research serves as a first-of-its-kind study for the city of Islamabad, which uniquely represents a mixed temperate and humid sub-tropical climate. It has four different seasons, with June being the warmest (39 °C as average) and January being the coldest (19 °C). The humidity changes throughout the year, with the most humid month being July, where humidity remains above 65%.
Although clean rooms have been designed in the literature, the problem is such that these systems consume a high amount of energy, so the economic cost of these systems is also high. These designed systems do not have sufficient control over parameters, and there is also the issue of carbon emissions being released into the environment. The novelty of this research includes the control of different parameters such as the temperature, relative humidity, particle concentration, and CO2 emissions and the designing of a control room. This research deals with the control of each parameter along in an energy-efficient system. The designed clean room in this research is energy efficient and involves a small economic cost. The clean room designed in this research has no adverse effects on the environment, such as CO2 emissions released into the environment. All of these factors are monitored and controlled in this research, which fills a gap in the literature. The next sections explains the design of the tested process configurations and their outcomes.
Table 1 presents the federal standards for designing a clean room at different particle sizes. The ISO 3 and ISO 4 standards (Class 1000 and 10000) were used in this research for designing the clean room. This is because this designed clean room aspect lies in between these federal standards (Class 1000 and 1000).

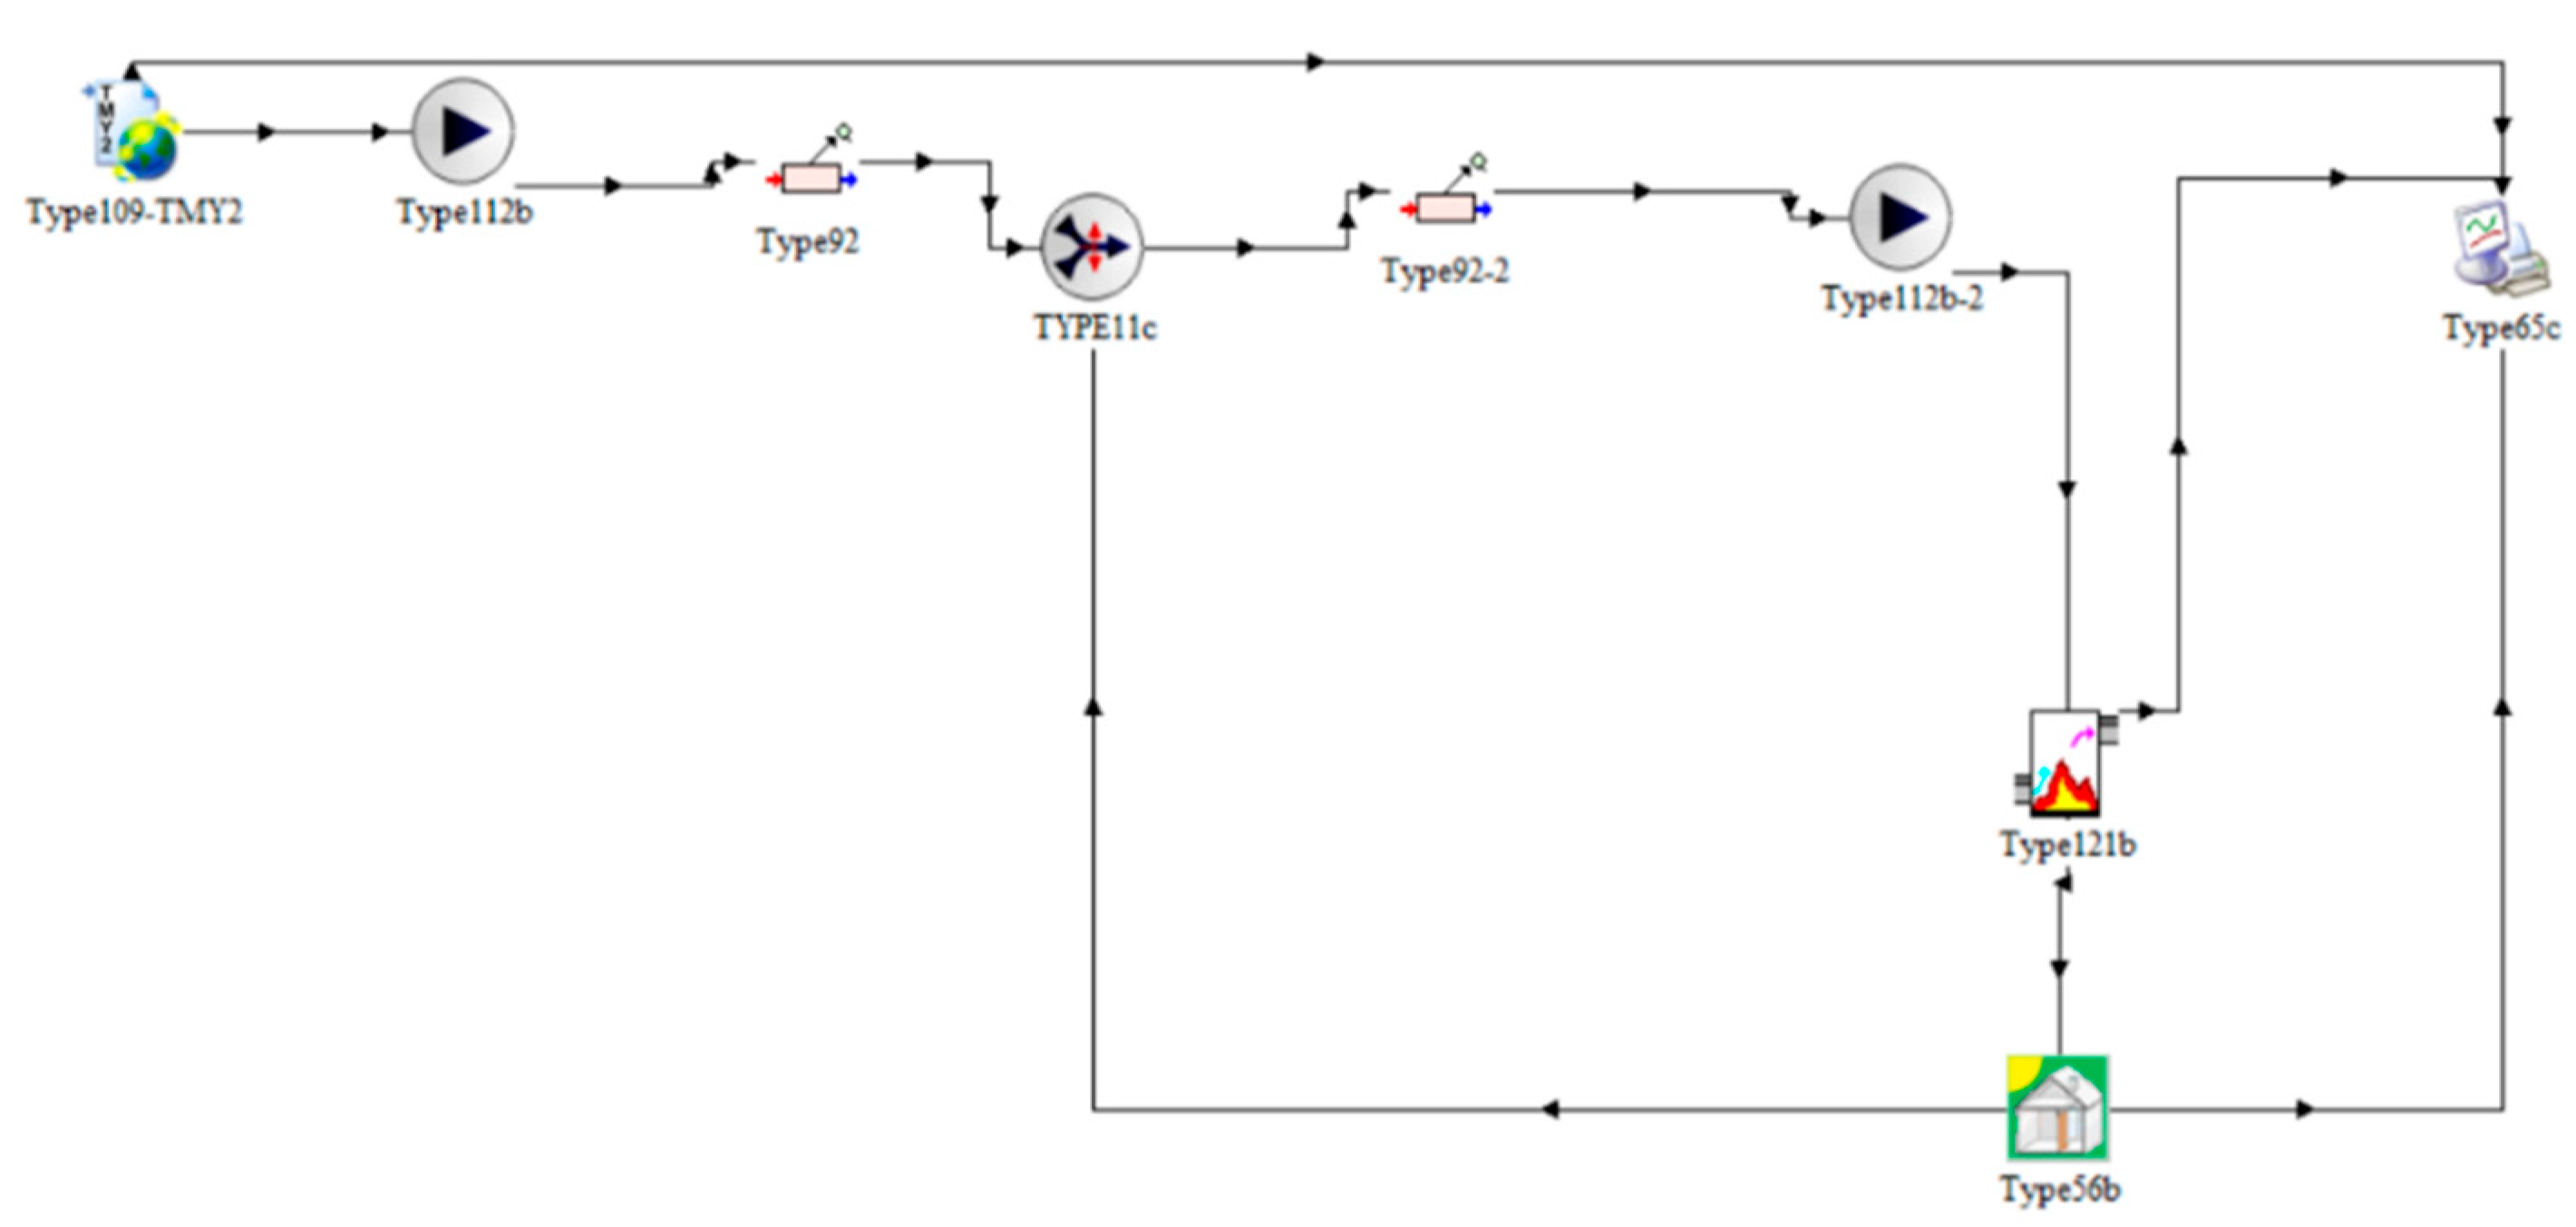
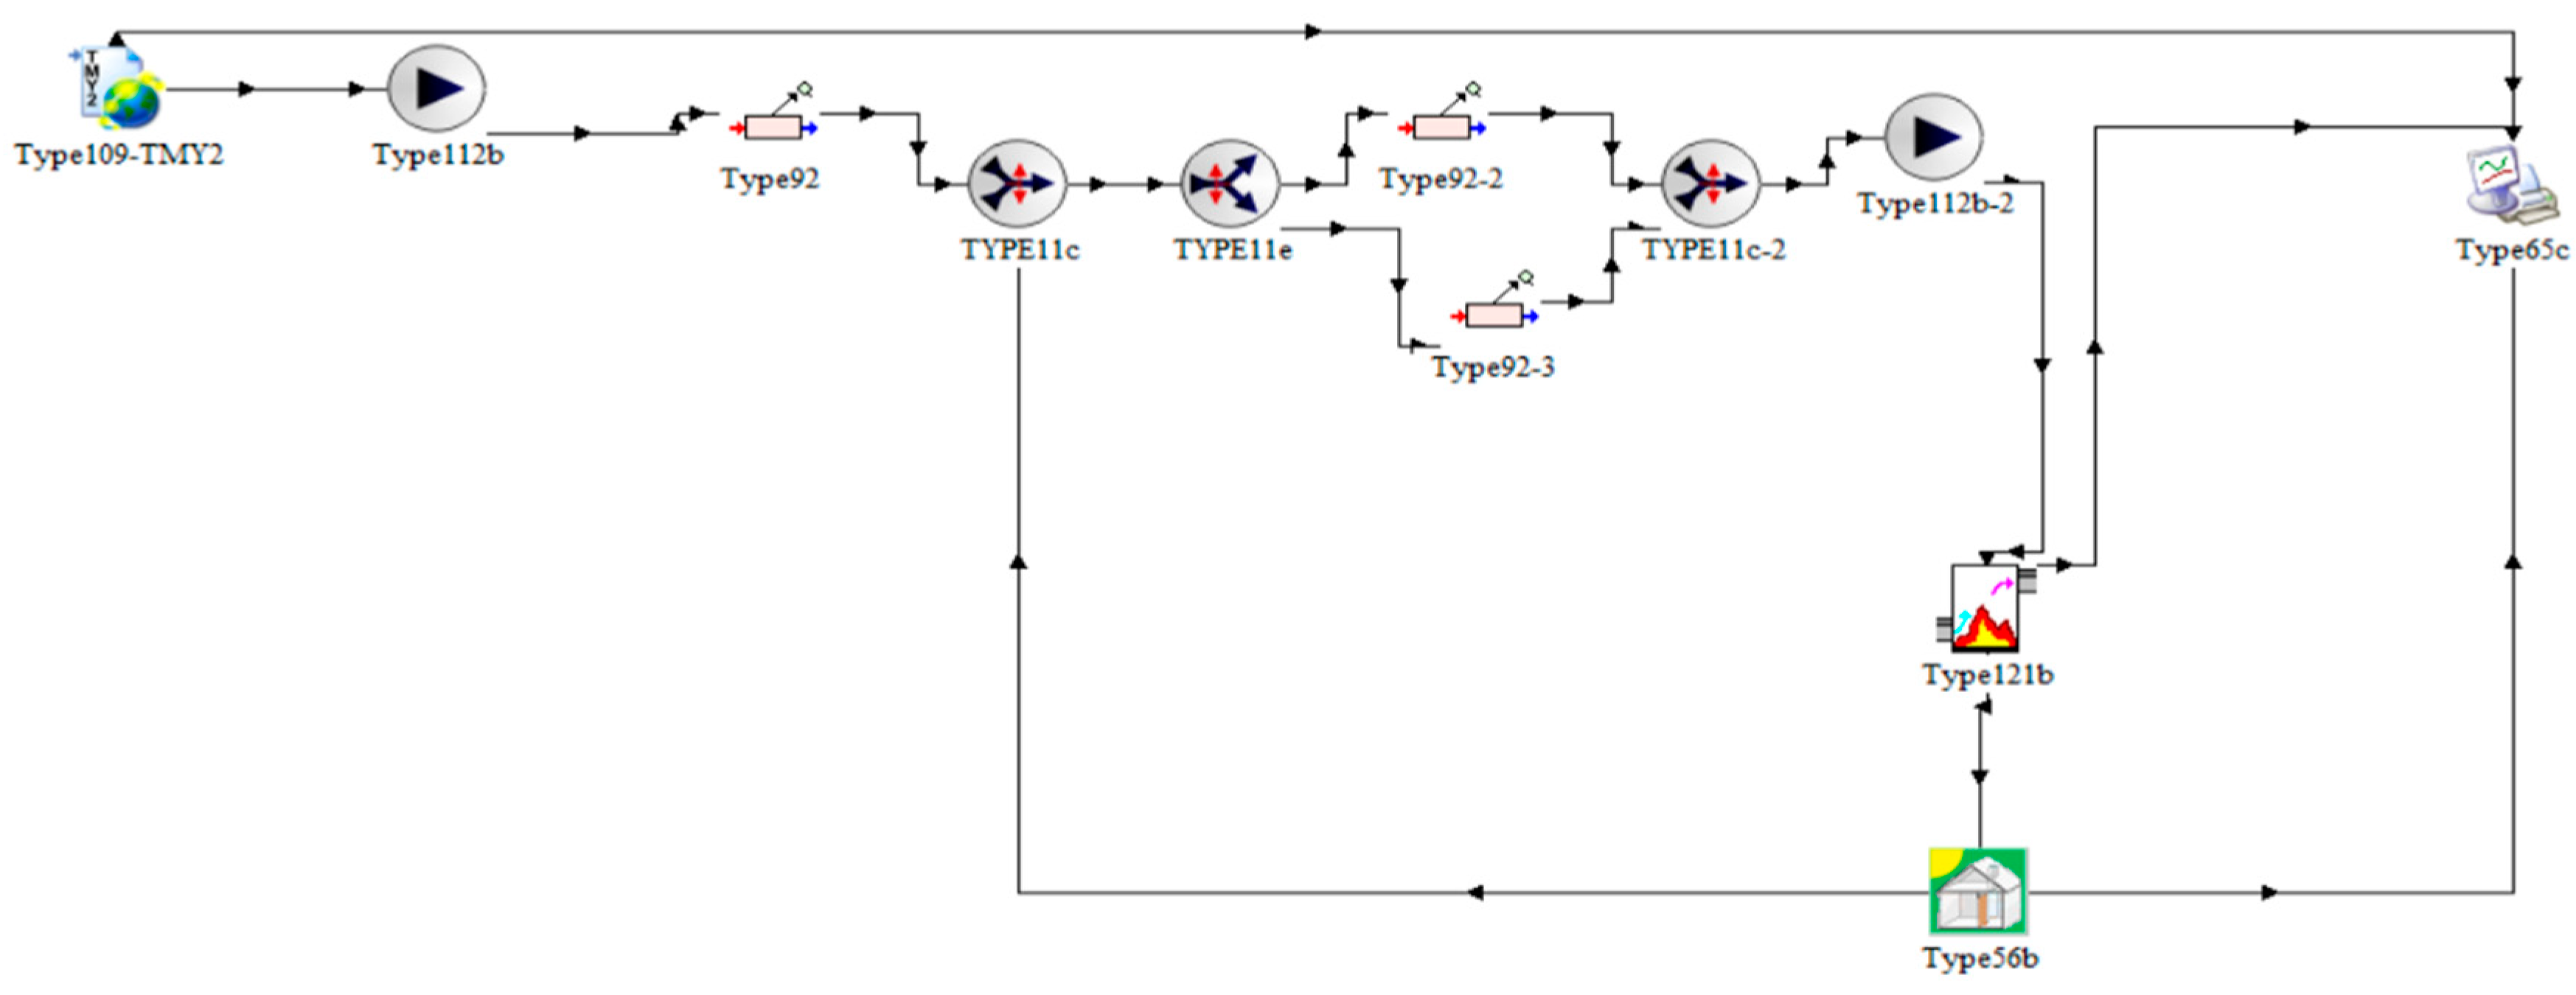
2. Materials and Methods: Design of the Process Configurations in TRNSYS Environment

An analysis of different configurations of a clean room system design for the purpose of an optimal utilization approach was performed. A clean room of a volume of 185.6 m3 was designed, and the air change per hour was 20. The minimum outdoor flow rate of air was 150 L/s. A heat ratio of 0.98 was fixed. The weather of Islamabad was considered for the simulations, with the data taken from the NREL database. Ambient and clean room temperatures and relative humidities for the were plotted for comparison (see Table 2). The set point for the room temperature was taken as 23 °C and the RH was taken as 40%. These configurations were termed as option A, option B, and option C. The performance of these three air conditioning systems was compared for different weather and load conditions. The analysis was conducted based on moist air properties and the air handling process [2]. All configurations were modeled and simulated in TRNSYS 16, while TRNBuild was used for designing the clean room.

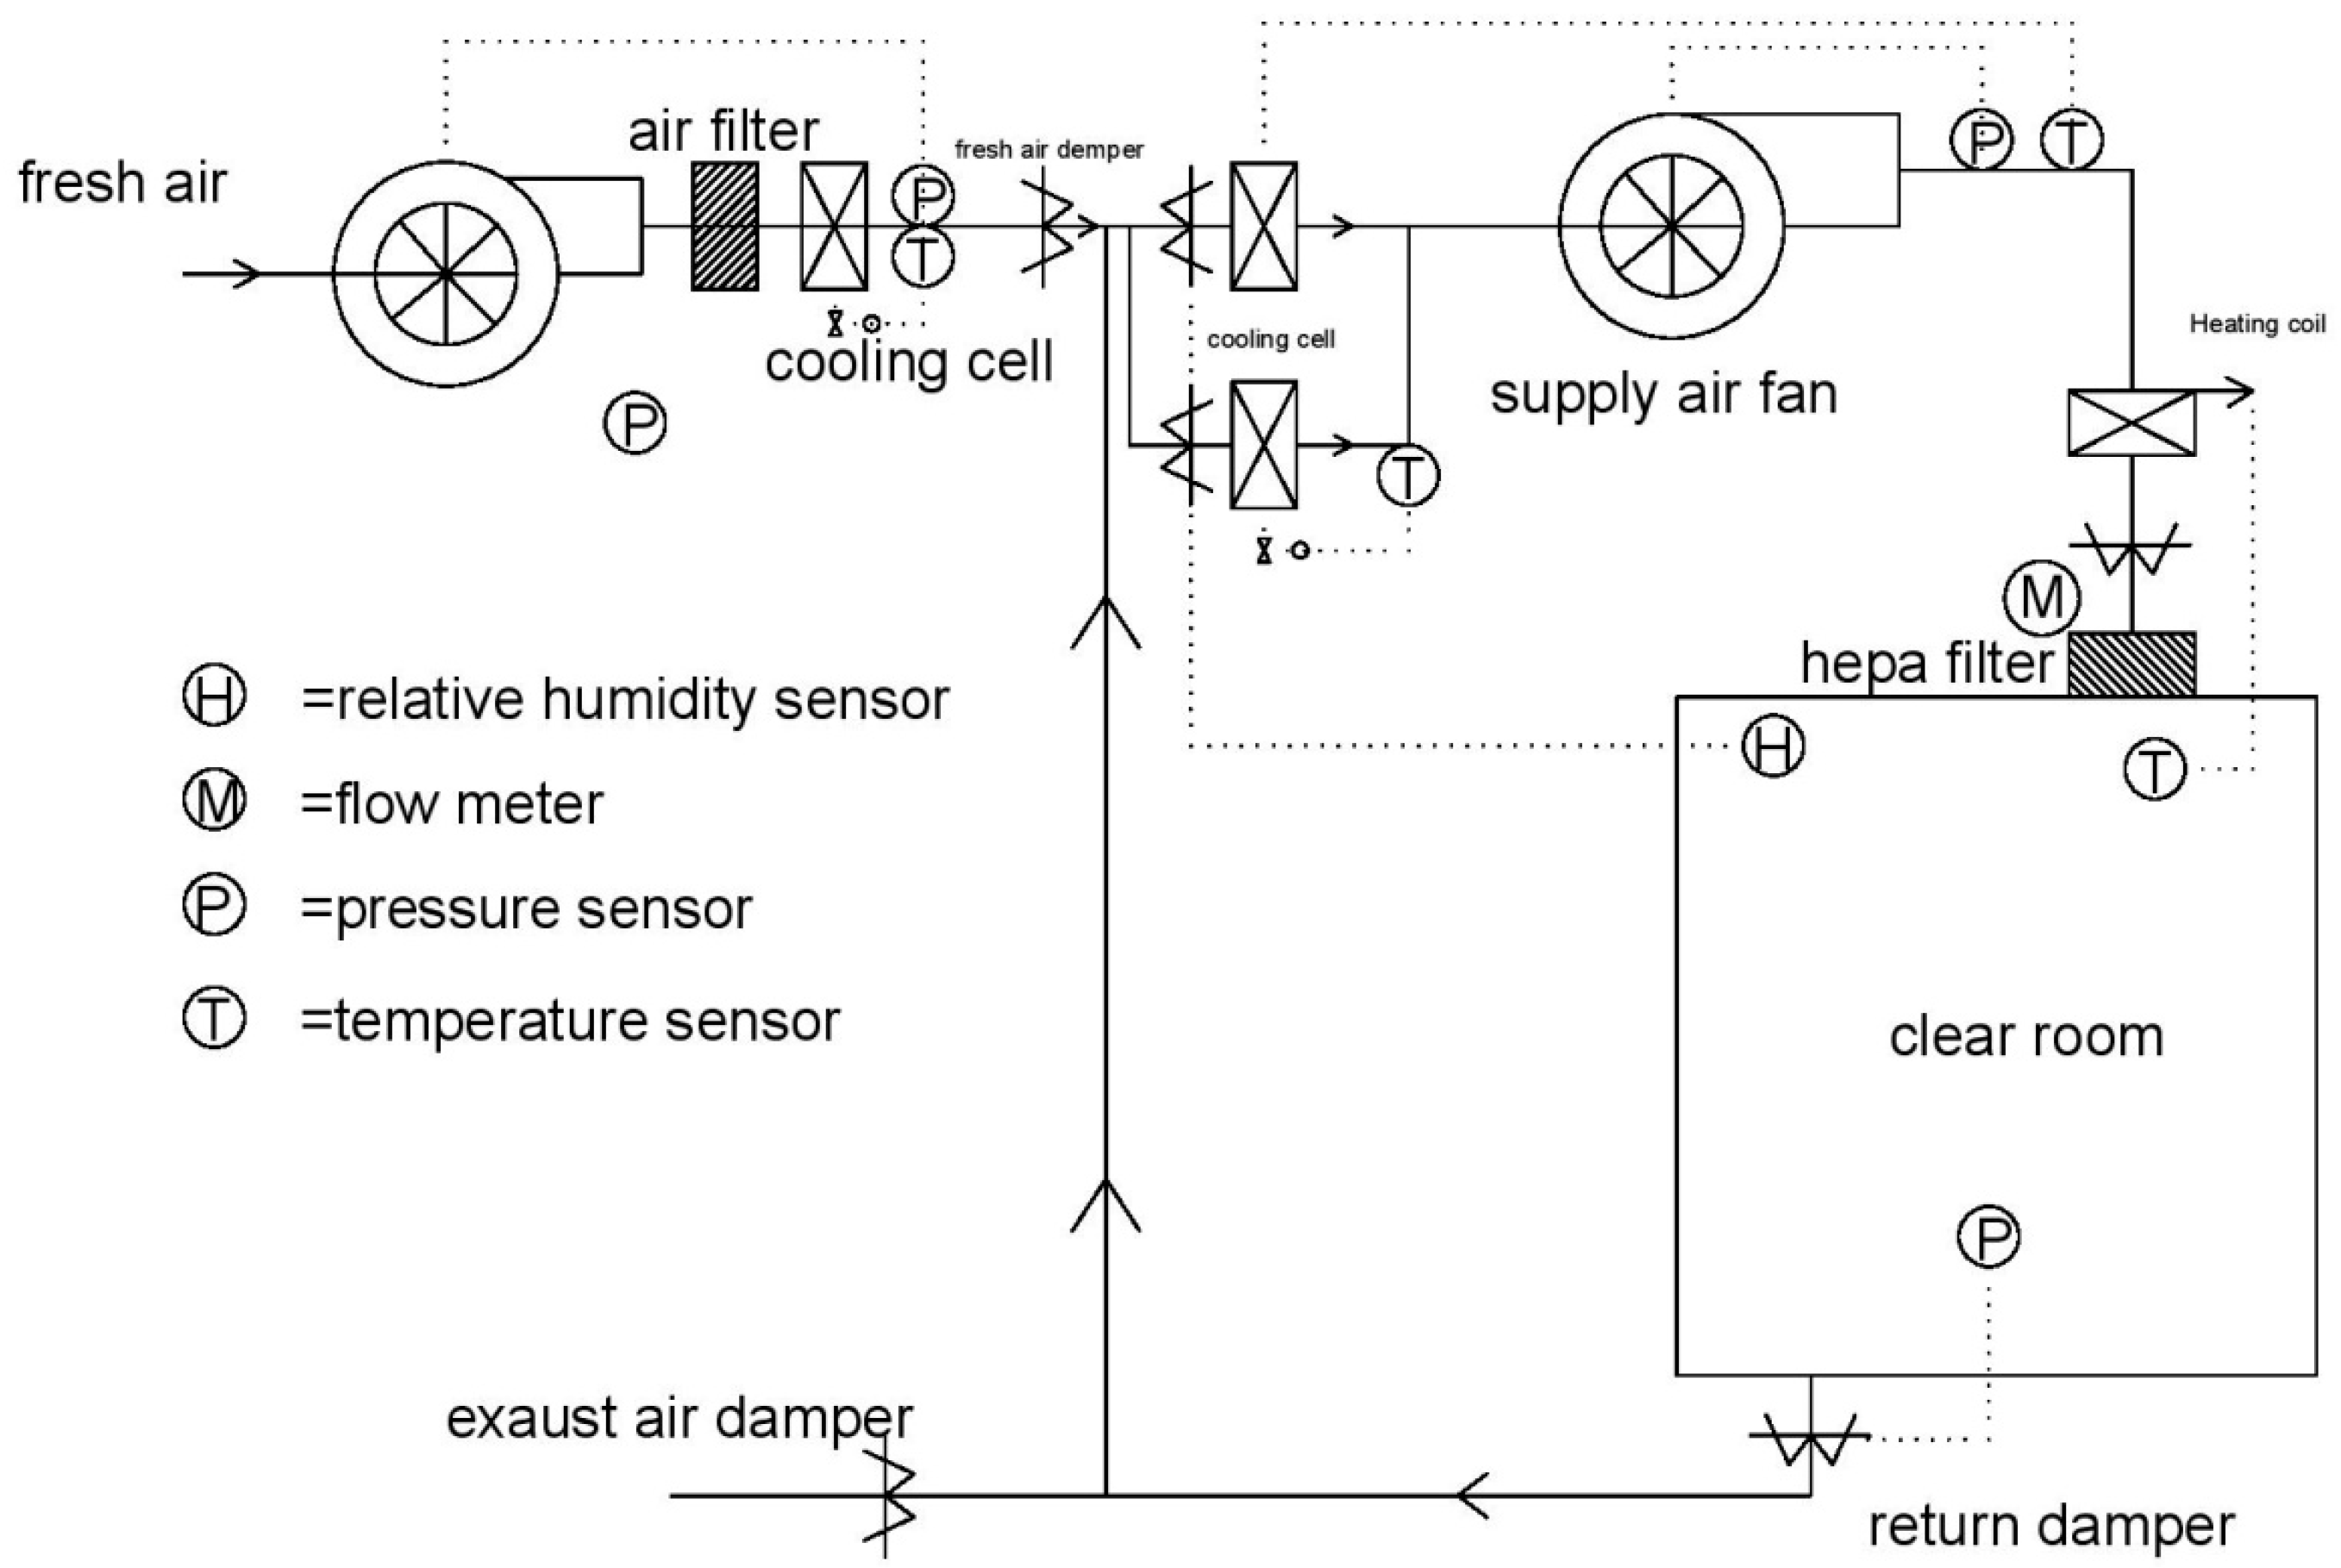
2.1. Clean Room Components and Model Assumptions

The model was integrated to simulate the air handling process and the thermodynamics of the clean room air such as its temperature, relative humidity, and static pressure. The list of components used in the TRNSYS are as follows:
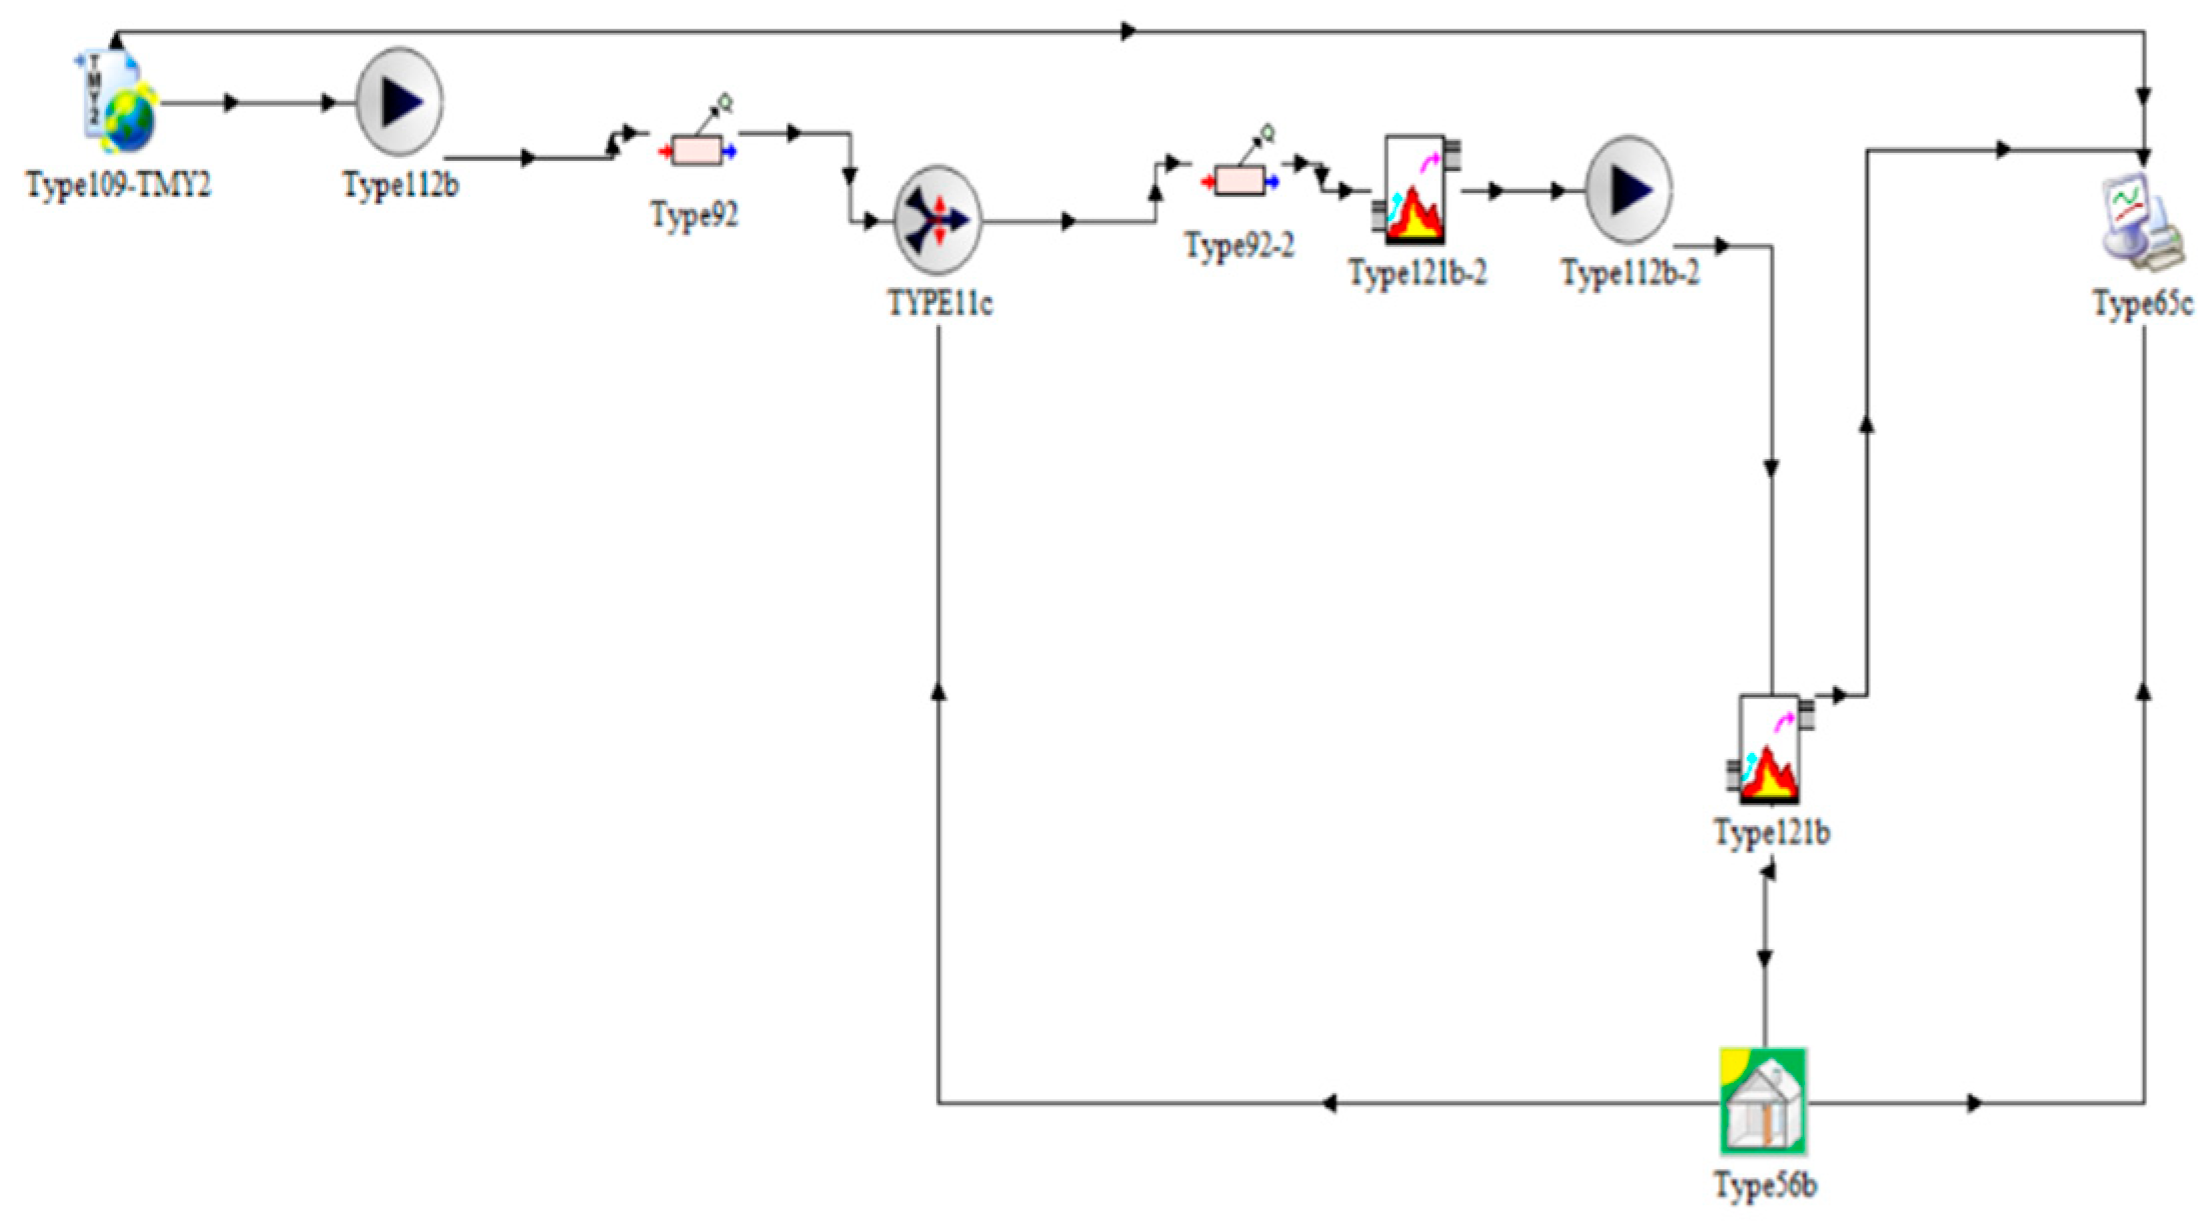
  • Type 109—Weather file to test the model under Islamabad’s weather conditions. The data was taken from National Renewable Energy Laboratory (NREL).
  • Type 112b—Fans used to blow in the air in the clean room. Single speed fans were used in the simulation.
  • Type 92—Cooling units used to ensure that the desired temperature and relative humidity (%) was maintained in the clean room.
  • Type 121b—Heating units used to ensure that the desired temperature and relative humidity (%) was maintained in the clean room.
  • Type 56b—Structure designed to simulate the clean room itself. This component was designed separately in TRNBuild and later integrated into the TRNSYS models. The room’s dimensions, volume, occupancy, and heating and cooling loads, and the building materials used were kept the same throughout this research.
  • Type 11c—Flow mixer used to mix two different air streams to be fed into other components.
  • Type 11e—Flow diverter used to separate a single stream to be fed into two different components.
The model assumptions include:
  • The simulated clean room had no direct sunlight on it.
In air conditioning design, it is always a priority that the air conditioning load should be low. If directly exposed to sunlight, then the load will definitely increase and the energy waste will also increase. This is the reason behind the assumption that the simulated clean room had no direct sunlight on it.
  • The room was airtight
Clean rooms have a special area that can include electronic applications or medical applications, and in medical applications there can be a high amount of infection or dust particles. If the room is not airtight from indoors and outdoors, then this may affect the quality of the micro processing of a chip. The purpose behind the room being airtight is that the indoor and outdoor environments become totally separate from each other.
  • Only two people were working in the clean room at a time.
Only two people should be working in a clean room at a time, i.e., only two people can be working during operational activity. For a standard clean room working environment, it is necessary to limit the occupants to two people. This limit of two occupants is only for the clean room designed in this research, not other standard clean rooms.
  • The schedule for the clean room was set from 9 am to 5 pm for five working days a week.
Clean room classes define a schedule for the operation of a clean room. The reason behind the above selected schedule time was optimization and minimum energy consumption.

2.2. TRNBuild Model

The TRNSYS model simulates the performance of the entire energy system by breaking it into individual components and is primarily used for analyzing single projects, renewable energy engineering, and building simulations. TRNSYS is the best software for building models and simulations, while other software programs such as ANSYS software are good for solving problems related to heat transfer, fluid problems, and static/dynamic structural analysis. This is the reason behind us using the TRNSYS software.
The type 56b was first modelled in TRNBuild to ensure the accurate architecture of the clean room. The following considerations were taken into account in the program: the height of the room was taken as 8 ft; the thickness of the walls was maintained at 80 mm; the walls were each 20 ft in length had three layers (a 2 mm stainless steel layer on both sides and a 76 mm polyurethane layer as an insulating material); the floor and roof were both taken from the TRNBuild built-in library; the roof had a thickness 141 mm and was composed of plaster board, fiberglass, and roof deck; the floor, of 80 mm, was a concrete slab; and the comfort factor was kept as standard for a normal laboratory. The reason for choosing these parameter values is that in the literature, the selected parameter values do not result in either sufficient control or inadequate control of air conditioning systems. Moreover, the control configurations A, B, and C discussed below have sufficient control over the system, so this is the reason behind us choosing these configurations and not selecting other configurations. In these three control configurations A, B, and C, control configuration B is best because it is energy efficient and involves fewer CO2 emissions.

2.3. Control Configuration A (Option A)

The arrangement of option A is shown in Figure 1, and an explanation of the control process in terms of air handling is depicted on a psychometric chart shown in Figure 2. The psychometric chart represents the thermal as well as physical properties of moist air in the form of a graph. Psychometric charts are beneficial tools in the troubleshooting of problems related to environmental building or greenhouse problems. The concepts of environmental control can easily examined by understanding a psychometric chart. In this research, the problem is related to a building’s/clean room’s energy; thus, a psychometric chart is the ideal tool to monitor and troubleshoot this building-related problem. The system consists of a primary air handling unit (PAHU) and one or more air handling units (AHUs). The outside air enters the primary air handling unit (PAHU) and cools the outside air to its dew point, e.g., 15 °C. This process is shown as O-A1 on the psychometric chart. After this process, the cooled air is mixed with clean room-recirculating air in specifically defined ratios. In this research, the makeup air and recirculation air ratio was maintained at 7/93. This mixed air is further cooled with the help of a cooling coil for the purpose of dehumidification. The mixing, cooling, and dehumidification process are shown on the psychometric chart and are defined as (A1-M), (I-M), and (M-A2). When cooling for dehumidification, sometimes there is a need to heat the air to reach the set point of supply air temperature. This process is shown as (A2-S) on Figure 2. If different clean rooms have different set point temperatures to handle such a situation, then there is the need to further reheat the air to maintain the individual clean room temperature set points. The entire control mechanism for option A is controlled by a proportional–integral–derivative (PID) controller. The fan speed, air damper, and the opening of cooling and heating coils are regulated by a PID controller. This controls the pressure, temperature, and relative humidity settings of a clean room optimally.

2.4. Control Configuration B (Option B)

The arrangement of option B is shown in Figure 3, and an explanation of the control process for handling air is shown on the psychometric chart in Figure 4. It should be noted that the arrangement of control configuration B is similar to option A except that it does not have a heating coil in the air handling unit. In control configuration B, dry outside air is used for the dehumidification of inside humid air. The humidity ratio of the outside air is high compared to the inside air. The outside temperature set point in the primary air handling unit (PAHU) is set low so that the air in the clean room can be dehumidified effectively by the primary air handling unit (PAHU). In other words, the air is dehumidified by the supply of dry air from outside without any cooling in the primary air handling unit. The flow rate of air from outside is adjusted according to the need to control the relative humidity in the clean room. The control arrangement of option B is also carried out with proportional–integral–derivative (PID) controllers. The pressure temperature and humidity control settings are regulated via the fan speed, air damper, and the opening of cooling and heating coils by the PID controller.

2.5. Control Configuration C (Option C)

The arrangement of control configuration C is shown in Figure 5, and the control process for handling air is shown on the psychometric chart in Figure 6. In option C, the air handling unit consists of two parallel coils used for cooling. The air handling process of option C is complex when compared to other two options. In this system, the primary air handling unit (PAHU) cools the outside air to a pre-defined temperature for dehumidification purposes. The cooled air from the primary air handling unit (PAHU) is mixed with clean room recirculation air with a pre-defined ratio and goes into the two cooling coils, which are parallel to each other, before the stream is mixed again. In the air handling unit (AHU), one cooling coil is used as a wet coil for dehumidification purposes and a second coil is used for temperature control purposes. Option C has an advantage of improved humidity control when compared to other two options.

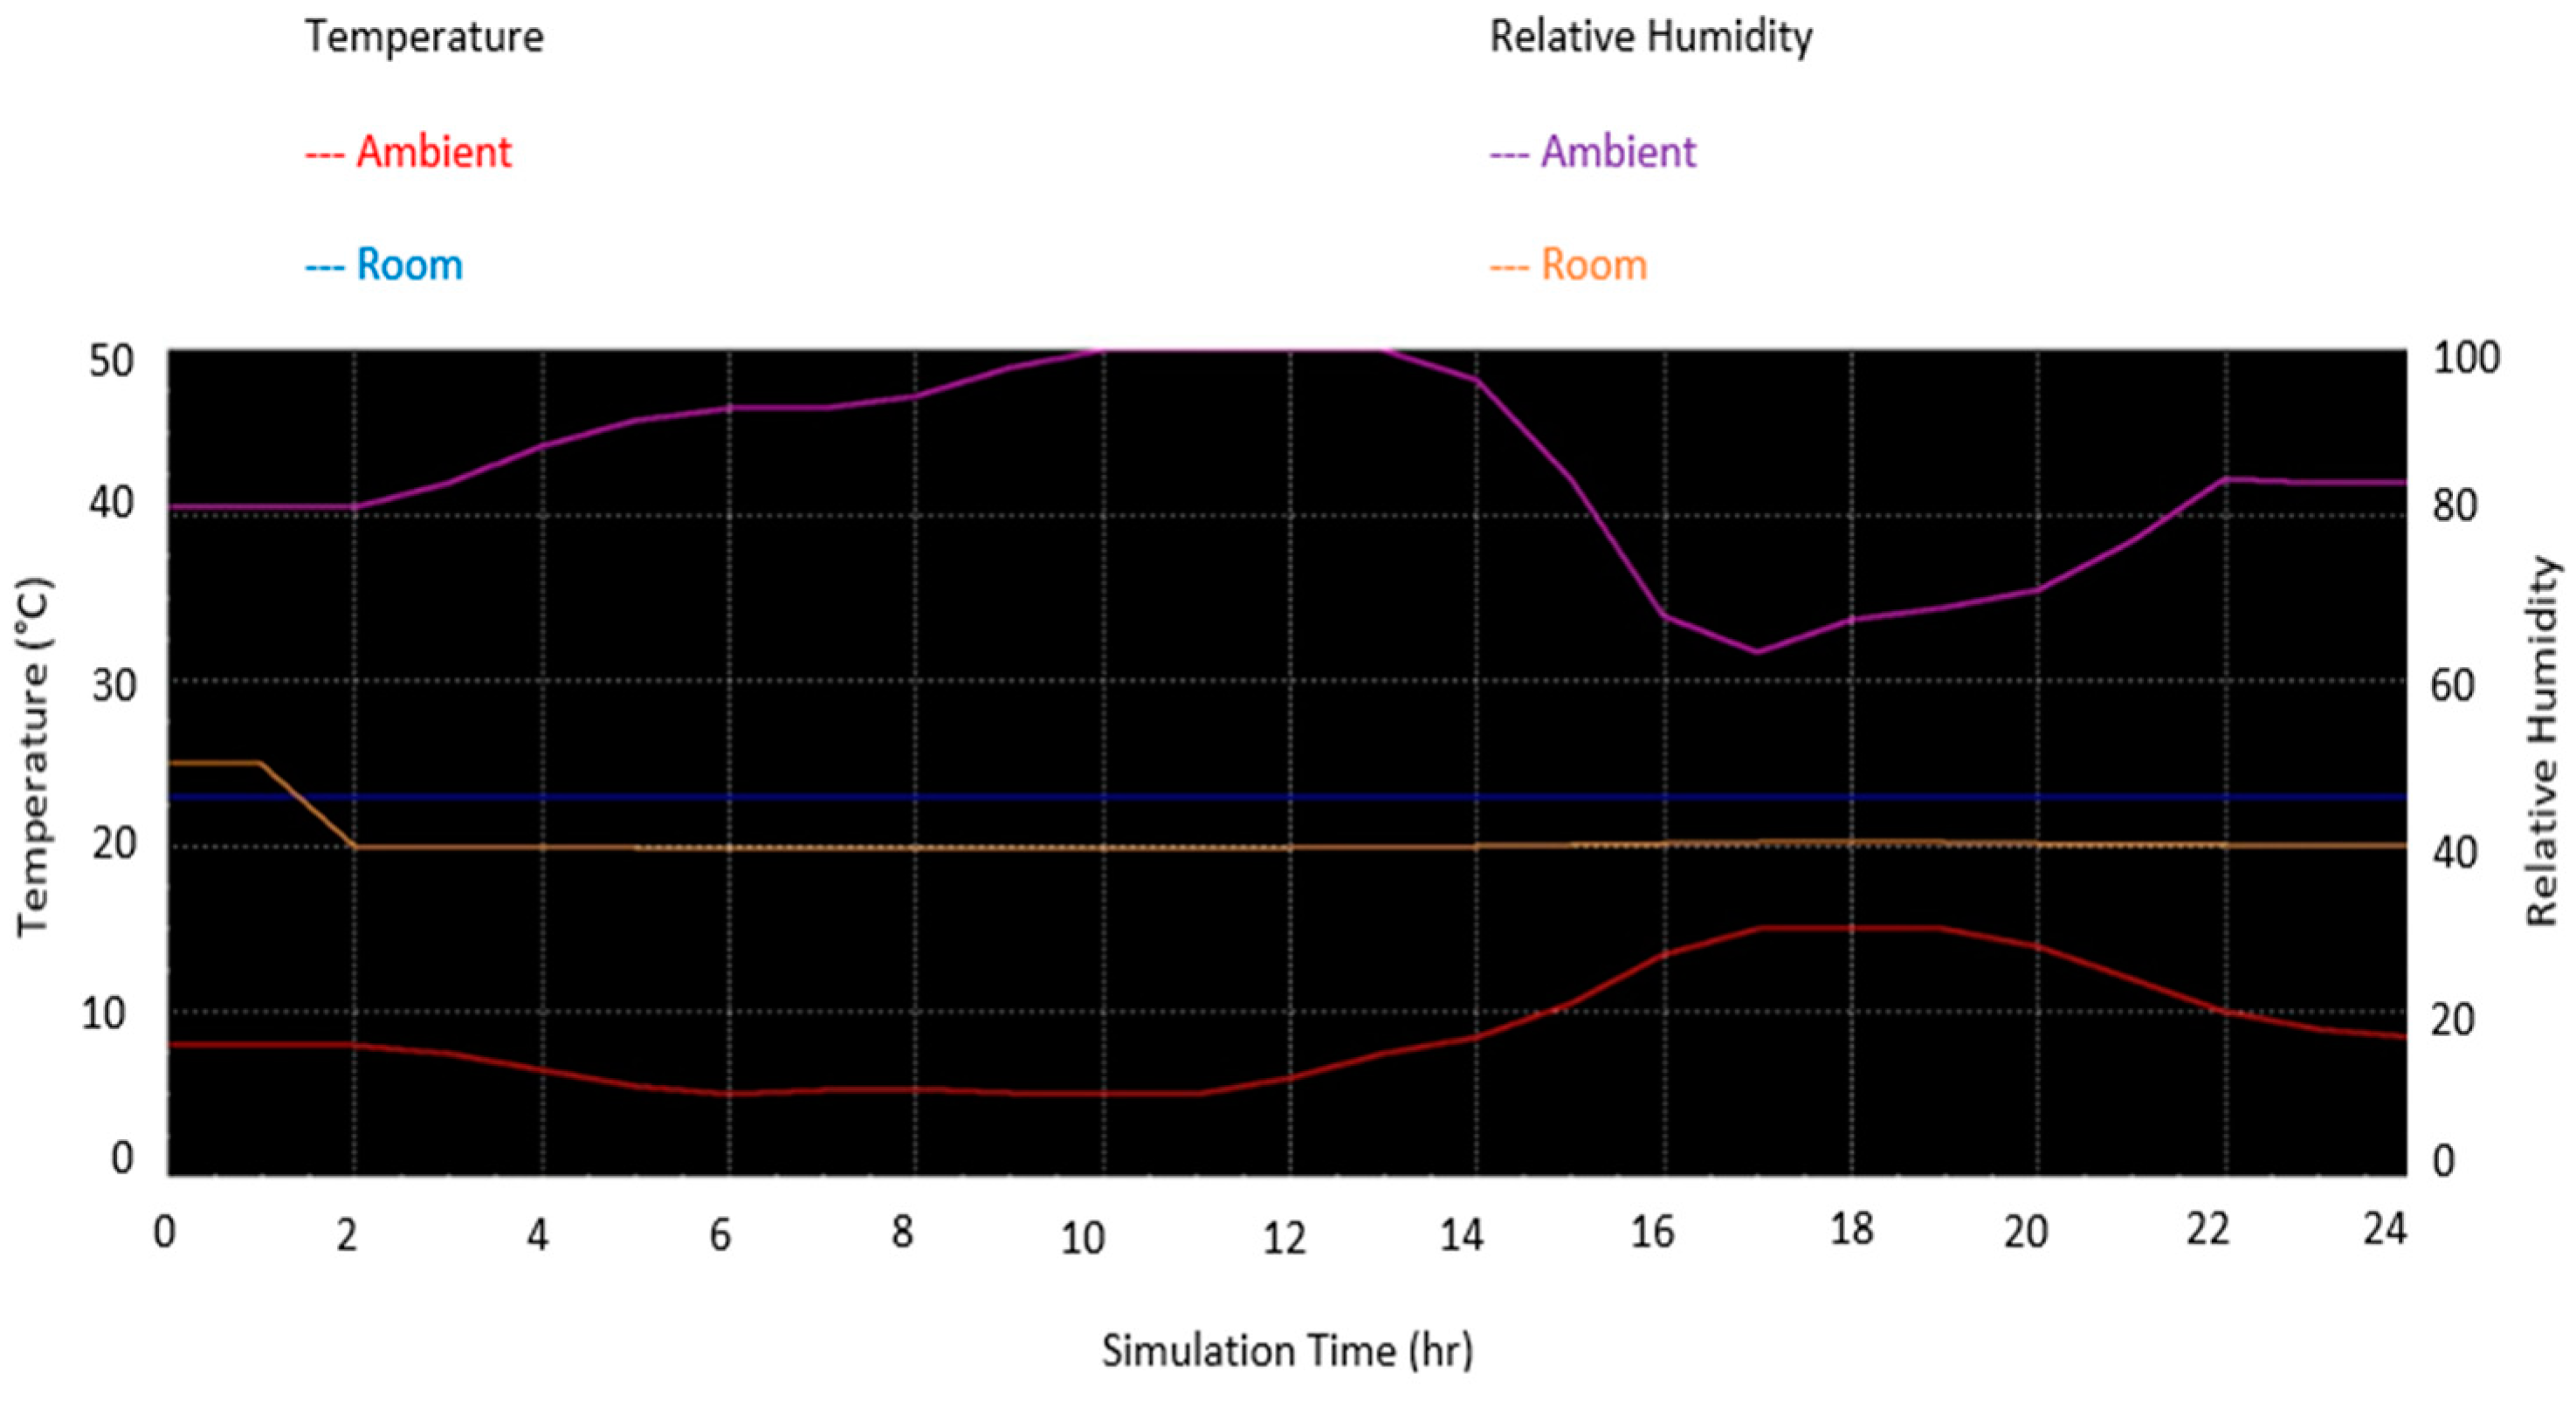
3. Results and Discussion

3.1. Control Configuration A (Option A)

The model was simulated for 24-h (one day), 720-h (one month), and 8760-h (one year) time steps. The layout used is shown in Figure 7. Figure 8 shows a 1st January simulation that was run for option A. The red line shows the ambient temperature as it changes throughout a day. The blue line remains constant at 23 °C, which was the set point temperature of the room. The relative humidity (RH) for the atmosphere, shown in purple, also changed during the day, and the relative humidity (RH) for inside the room, shown in yellow, stays at around 36% inside the room, which is just below the set point RH (40%).
Figure 9 shows the results of a simulation run for the month of January for option A. The red line represents the ambient temperature, which varied throughout the month. It may be noted that the ambient temperature varied between 1 °C and 22 °C, whereas the blue line stays at 23 °C, which was the set point temperature for the clean room. Similarly, the purple line indicates the ambient relative humidity (RH), which varied between 25% and 100% throughout the month, whereas the yellow line, which represents the clean room relative humidity (RH), remains constant at 36%, which is a little below the set point but within an acceptable limit. This data shows that the month of January is the coldest month.
Figure 10 shows the results for a 1st June simulation run for control configuration A. The reason behind selecting 1st June for analysis is that it is the hottest day of the year and includes the maximum heating load of the year. The red line, which represents the ambient temperature, is varied throughout the day, and the blue line remains at 23 °C, which was the set point temperature for the clean room. Similarly, the ambient relative humidity (RH), shown by the purple line, varied between 25% and 60% throughout the day, and the yellow line, which represents the clean room relative humidity (RH), remains at 36%, which is little below the set point but within acceptable limits.
Figure 11 shows the results of a simulation run for the month of June for control configuration A. The ambient temperature in the month of June varied between 24 °C and 44 °C, and the clean room set point temperature was maintained at exactly 23 °C. Similarly, the ambient relative humidity (RH) fluctuated between 18% and 95% throughout the month, whereas the clean room relative humidity remained at 36%, which is again below 40%, which was the set point for relative humidity (RH).
Figure 12 shows the results of a simulation run one complete year for control configuration A, which shows that the extreme days in terms of cooling and heating in the context of Islamabad weather lies between January and June. In other words, the most extreme month regarding ambient weather conditions is important when designing a clean room because it defines the maximum capacity of the system. The results of the whole year simulation run for control configuration A show that the ambient weather conditions of temperature and relative humidity (RH) varied throughout the year. On the other hand, the clean room temperature was maintained at exactly 23 °C, which is the required set point temperature, and the clean room relative humidity was maintained at 36%, below 40%, which was the set point for clean room relative humidity. The temperature of 23 °C and relativity humidity of 36% merge so that only one yellow line is displayed in the figure below (Figure 12).

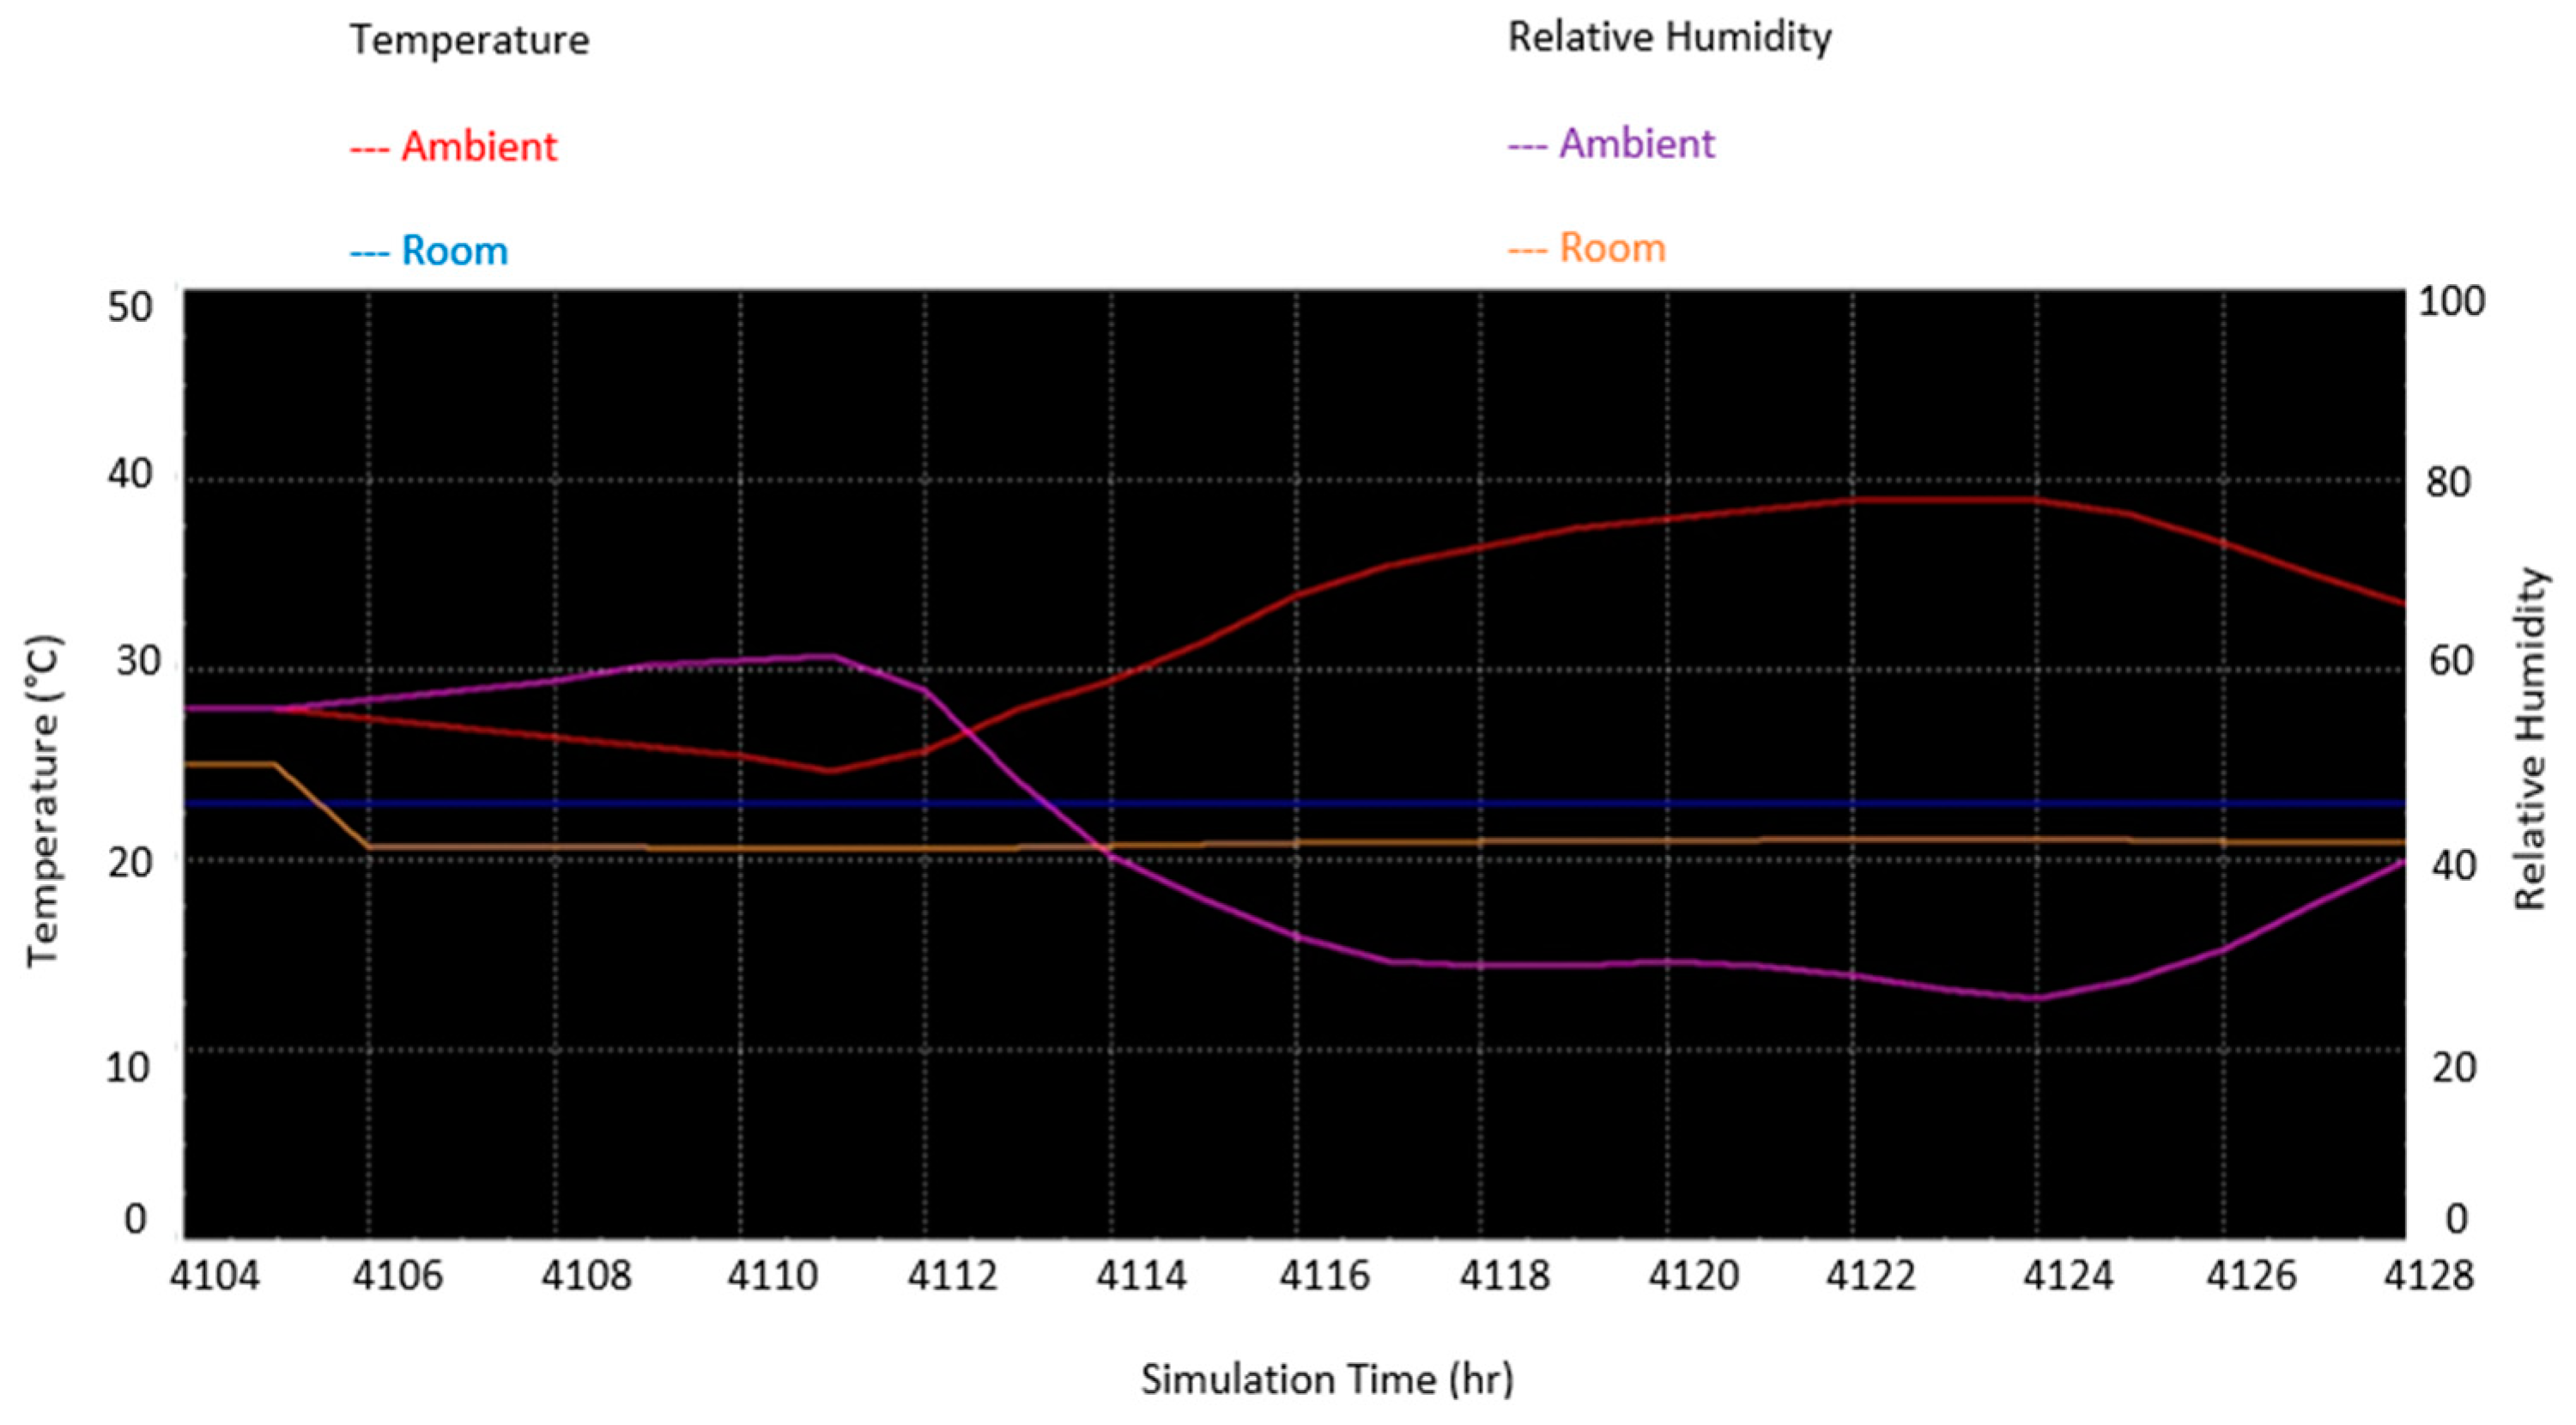
3.2. Control Configuration B (Option B)

The model was simulated for 24-h (one day), 720-h (one month), and 8760-h (one year) time steps. The layout used is shown in Figure 13. Figure 14 shows the results of a 1st January simulation run for control configuration B. The line in red represents the ambient temperature as it changes throughout a day. The blue line remains constant at 23 °C, which was the set point temperature of the room. The relative humidity (RH) for the atmosphere, shown in purple, also changed during the day; however, the yellow line, which represents the clean room relative humidity (RH), was maintained at 40%, which was the set point.
Figure 15 shows results of a 1st June simulation run for control configuration B. The red line, which represents the ambient temperature, is varied throughout the day, and the blue line remains at 23 °C, which was the set point temperature for the clean room. Similarly, the ambient relative humidity (RH), represented by the purple line, varied between 25% and 60% throughout the day, and the yellow line, which represents the clean room relative humidity (RH), remains at 40%, which is equal to the set point.
Figure 16 shows the results of a January simulation run for control configuration B. The red line, which represents the ambient temperature, is varied throughout the month because the ambient temperature range for the month of January is between 1 °C and 22 °C. The clean room temperature, on the other hand, was maintained at 23 °C, which was the set point temperature. Similarly, the purple line, which represents the ambient relative humidity (RH), varies between 25% and 100% throughout the month, whereas the yellow line, which represents the clean room relative humidity (RH), remains constant at 40%, which was the set point for the clean room.
Figure 17 shows the results of a June simulation run for control configuration B. The red line, which represents the ambient temperature, is varied throughout the day, and the blue line remains at 23 °C, which was the set point temperature for the clean room. Similarly, the ambient relative humidity (RH), represented by the purple line, varied between 25% and 60% throughout the day, and the yellow line, which represents the clean room relative humidity (RH), remains constant at 40%, which was the set point for the clean room.
Figure 18 shows the results of a simulation run for one complete year for control configuration B, which shows that the extreme days in terms of cooling and heating in the context of Islamabad weather lie between January and June. In other words, the most extreme month in terms of ambient weather conditions is important when designing a clean room because its defines the maximum capacity of the system. The results of the whole year simulation run for control configuration B show that the ambient weather conditions in terms of temperature and relative humidity (RH) varied throughout year. The clean room temperature, on the other hand, was maintain at exactly 23 °C, which is the required set point temperature, and the clean room relative humidity was maintain at 40%, which was the set point for the clean room relative humidity. The temperature of 23 °C and relativity humidity of 36% merge so that only one yellow line of yellow is displayed in the figure below (Figure 18).

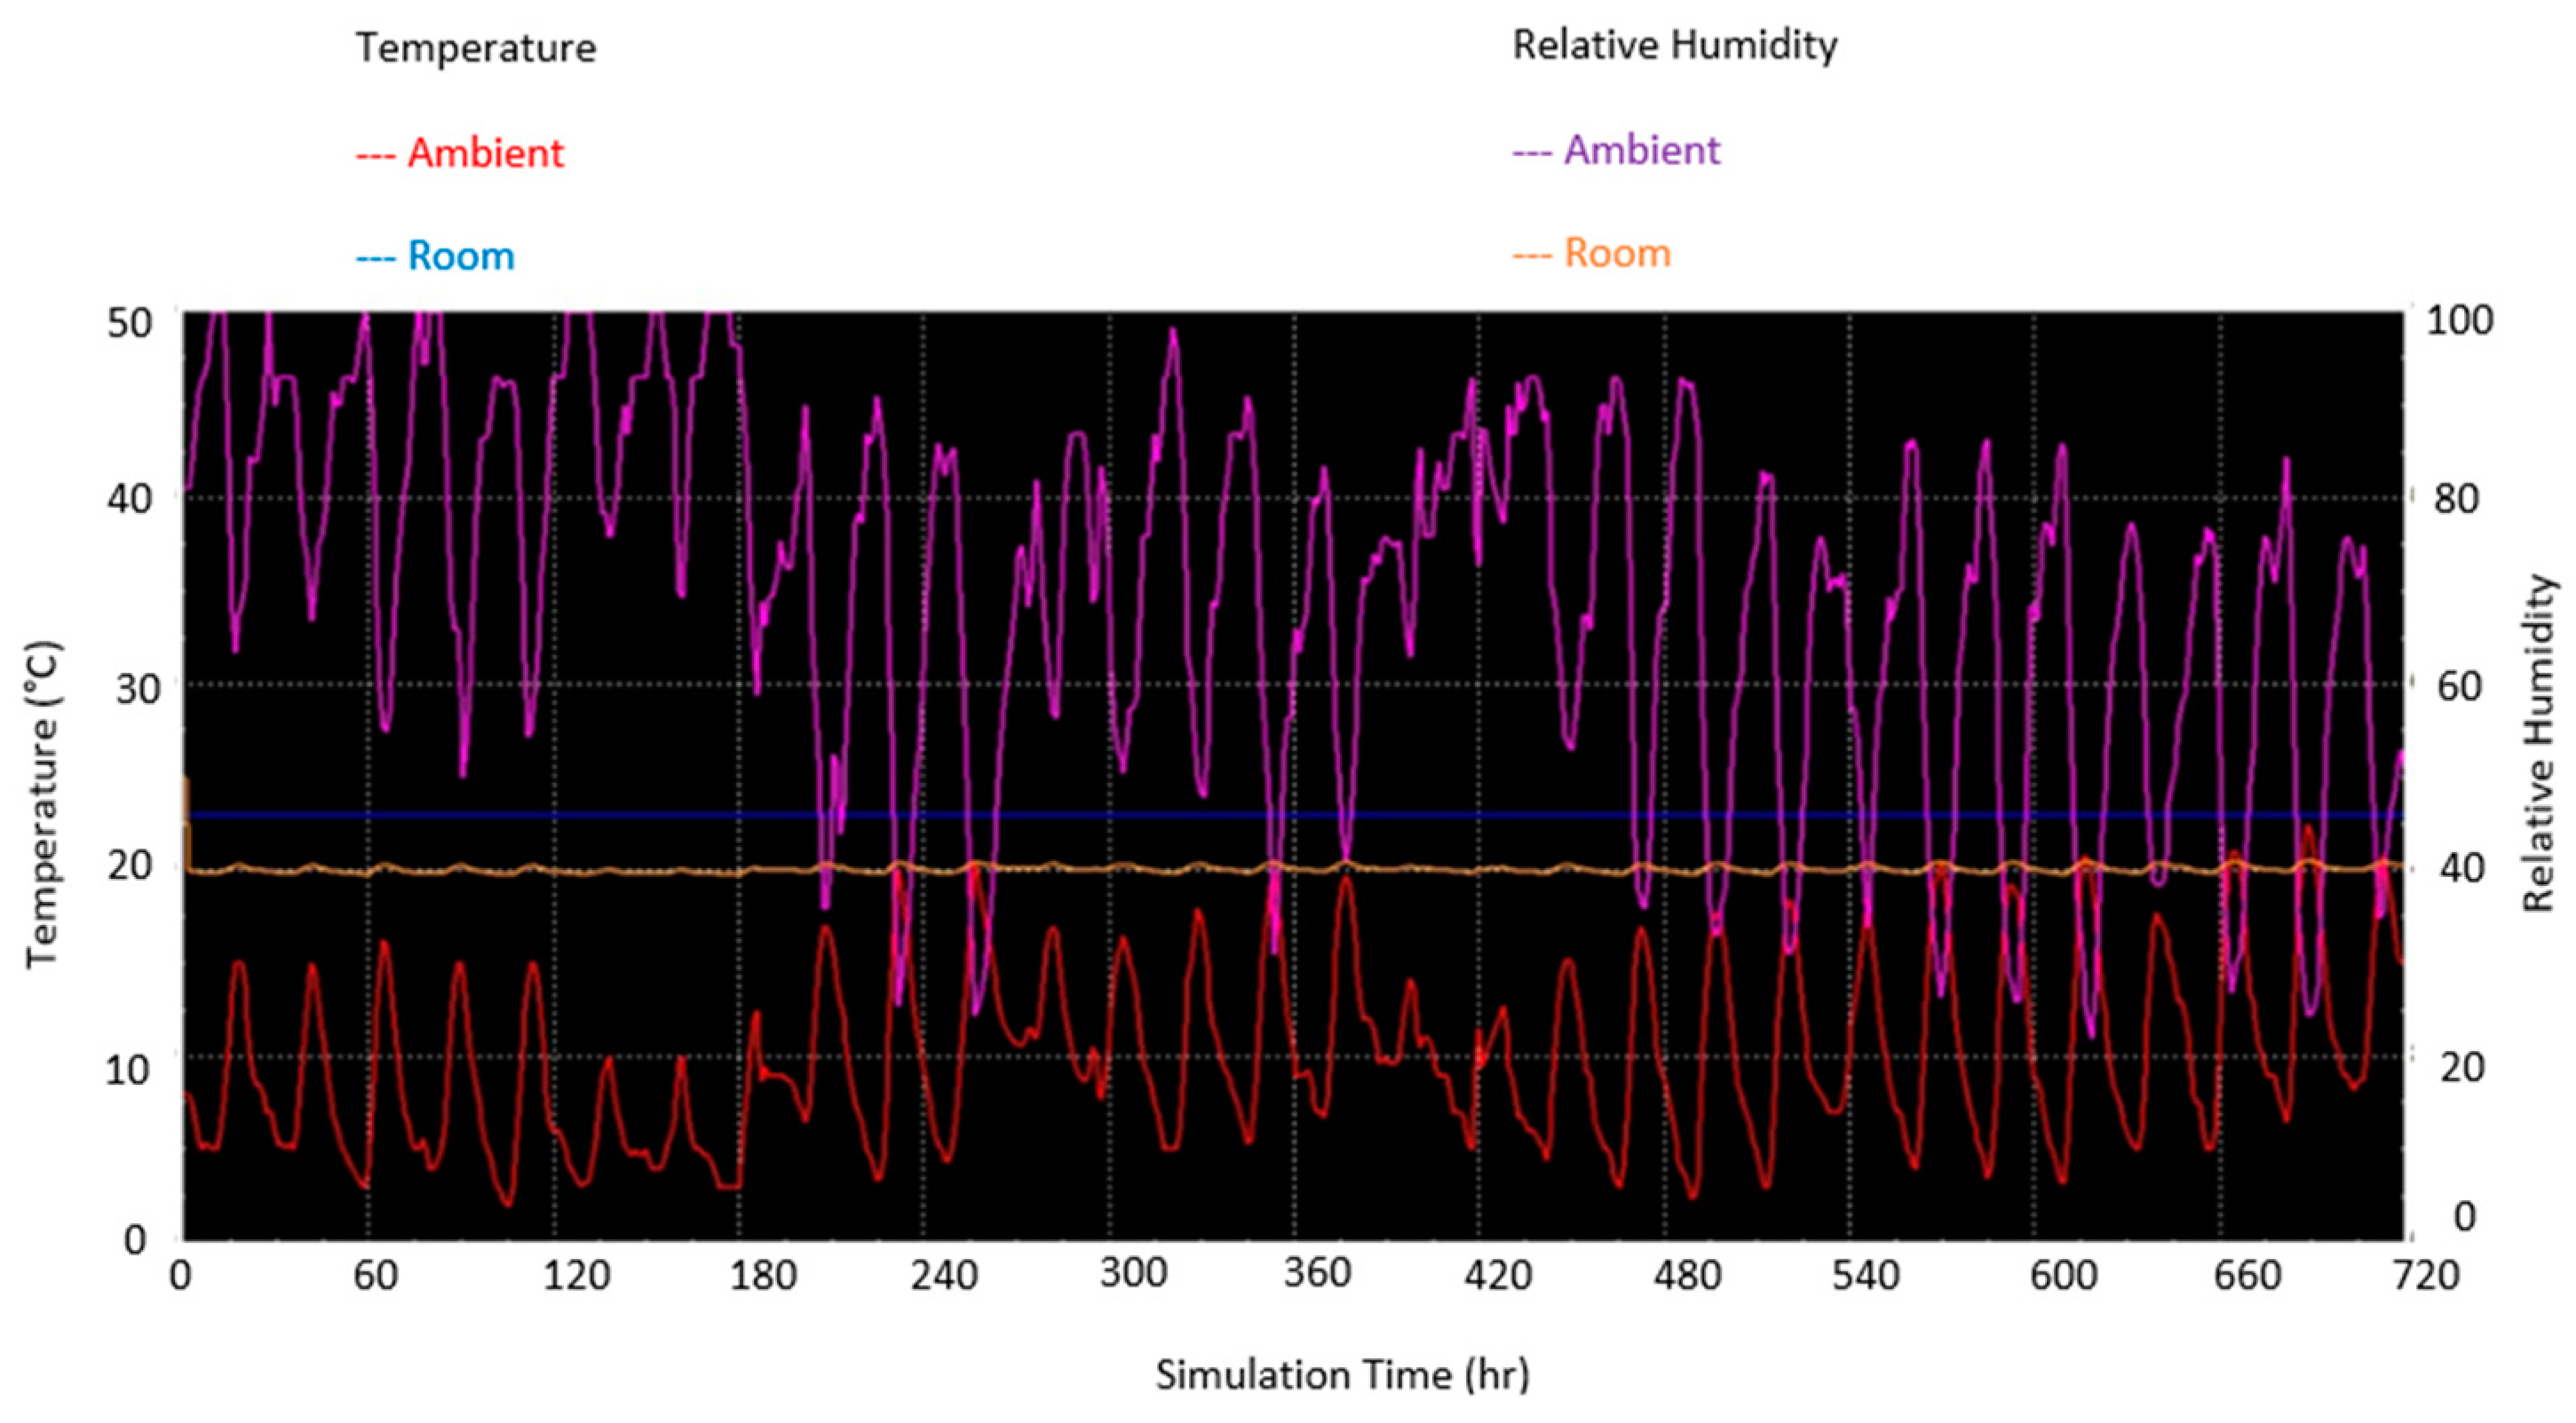
3.3. Control Configuration C (Option C)

The layout of the configuration C simulations is shown in Figure 19, and the time steps was kept same as for configurations A and B. Figure 20 shows the simulation run on 1st January for control configuration C. The line in red represetns the ambient temperature as it changes through a day, and the blue line remains constant at 23 °C, which was the set point temperature of the room. The relative humidity (RH) for the atmosphere, shown in purple, also changed during the day, and the room relative humidity (RH), shown in yellow, was maintained at the set point, which is 40% in this model.
Figure 21 shows the results of the month of January simulation run for control configuration C. The red line, which represents the ambient temperature, varies throughout month, and the clean room temperature was maintained at 23 °C, which was the set point for the clean room. Similarly, the purple line, which represents, the ambient relative humidity, varies throughout the whole month, and the clean room relative humidity (RH), represented by the yellow line, was maintained at 40%, which was the set point for relative humidity.
Figure 22 shows the results of a 1st June simulation run for control configuration C, in which the red line, which represents the ambient temperature, varies throughout the day and the blue line remains at 23 °C, which was the set point temperature for the clean room. Similarly, the ambient relative humidity (RH), represented by the purple line, varied between 25% and 60% throughout the day, and the yellow line, which represents the clean room relative humidity (RH), remains at 40%, which is equal to the set point.
Figure 23 shows the results of a June month simulation run for control configuration C. It may be noted that the ambient temperature and relative humidity fluctuated throughout the month and the clean room temperature and relative humidity (RH) were maintain at 23 °C and 40%, respectively, which are the required set points for the clean room.
Figure 24 shows the results of a one year simulation run for control configuration C, which shows that the extreme days in terms of cooling and heating season in the context of Islamabad weather lie between January and June. In other words, the most extreme month regarding ambient weather conditions is important when designing a clean room because its defines the maximum capacity of the system. The results of the whole year simulation run for control configuration C show that the ambient weather conditions in terms of temperature and relative humidity (RH) varied throughout the year. The clean room temperature, on the other hand, was maintained at exactly 23 °C, which is the required set point temperature, and the clean room relative humidity was maintained at 40%, which was the set point for the clean room relative humidity. The temperature of 23 °C and relativity humidity of 36% merge so that only one yellow line is displayed in the figure below (Figure 24).

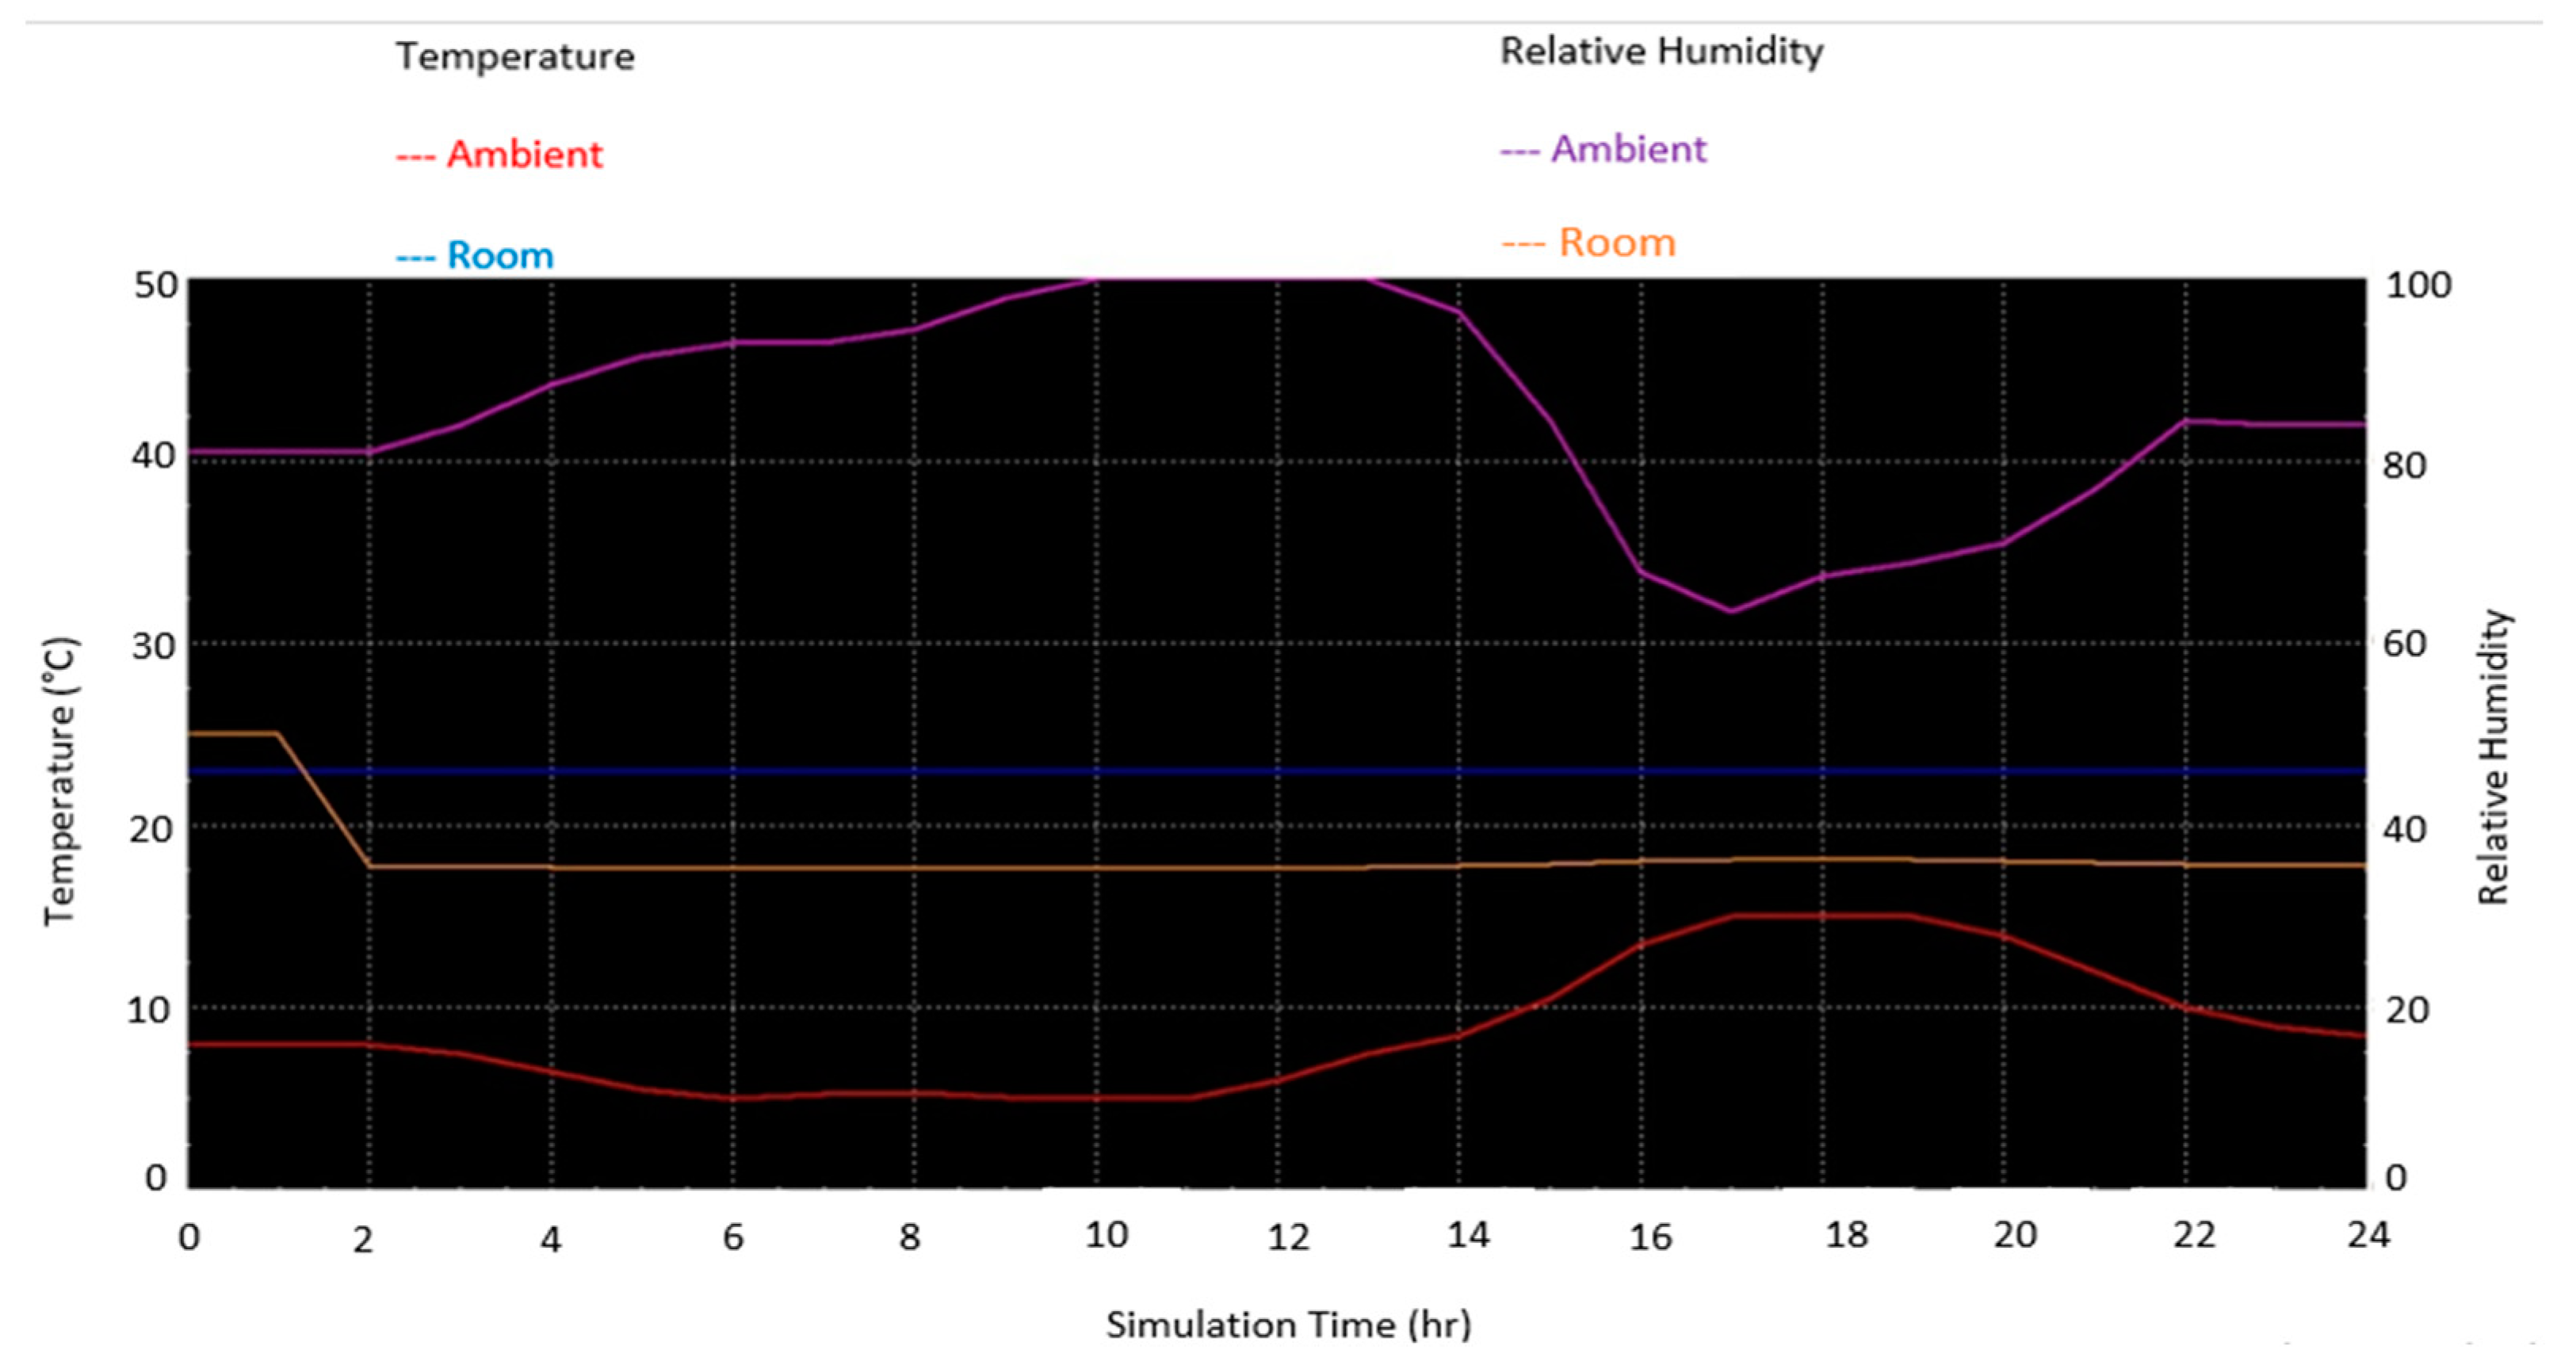
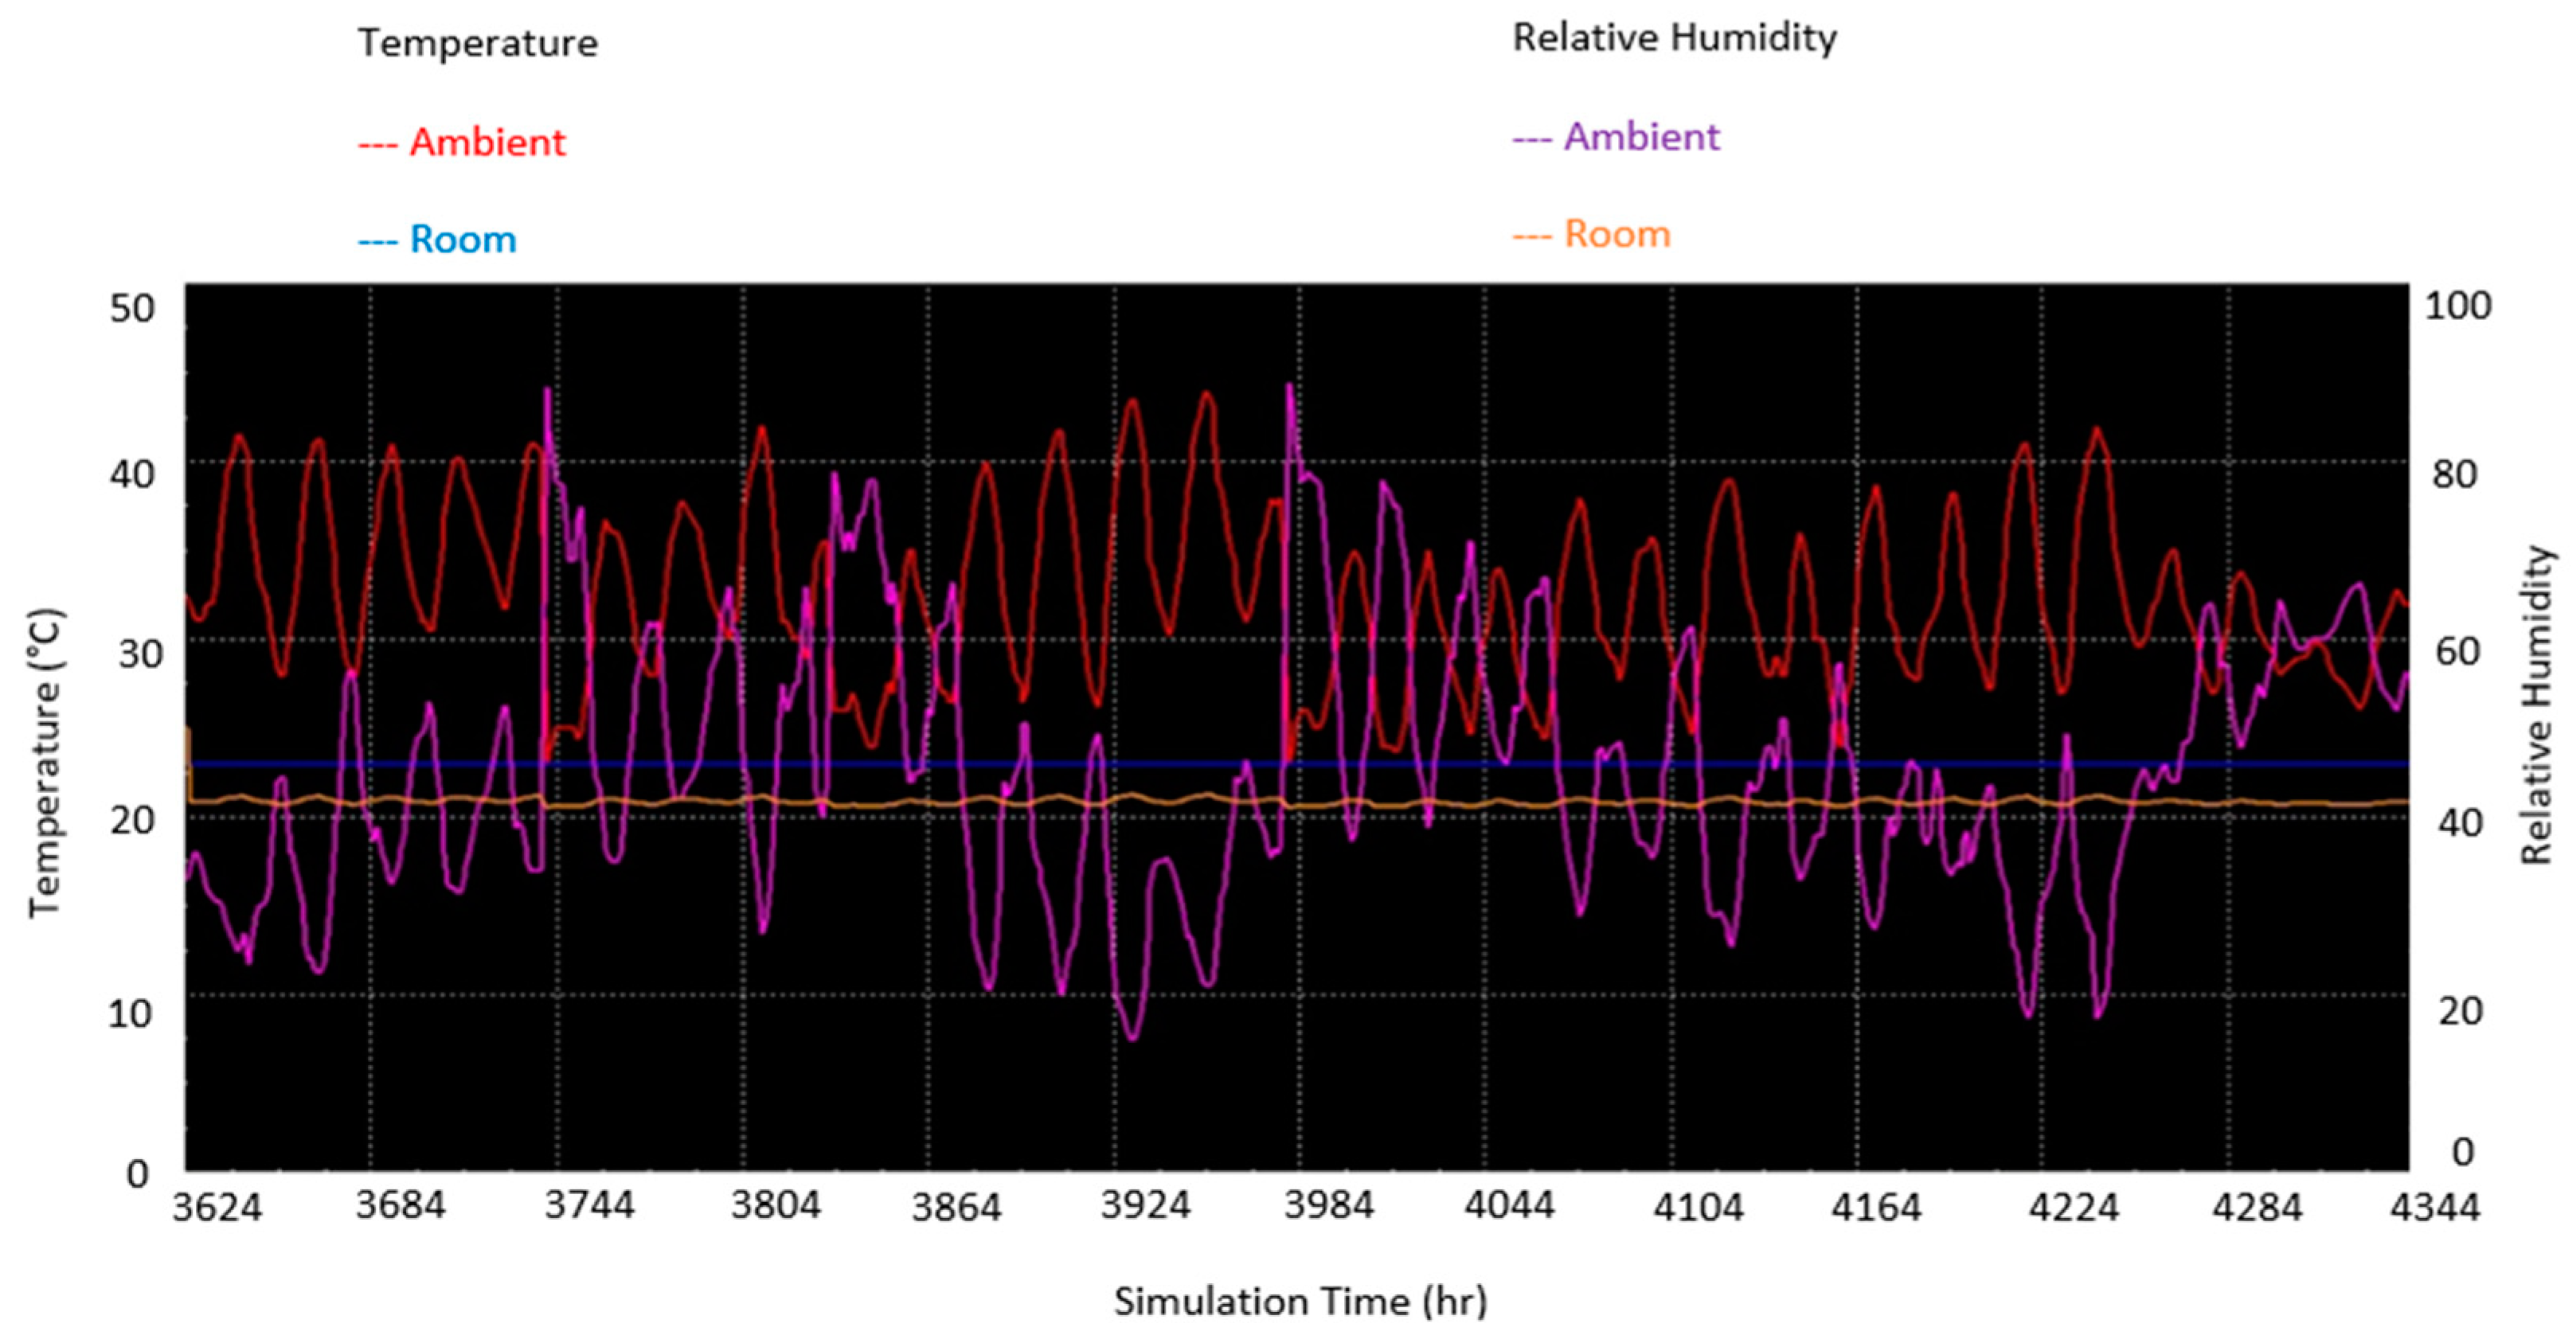
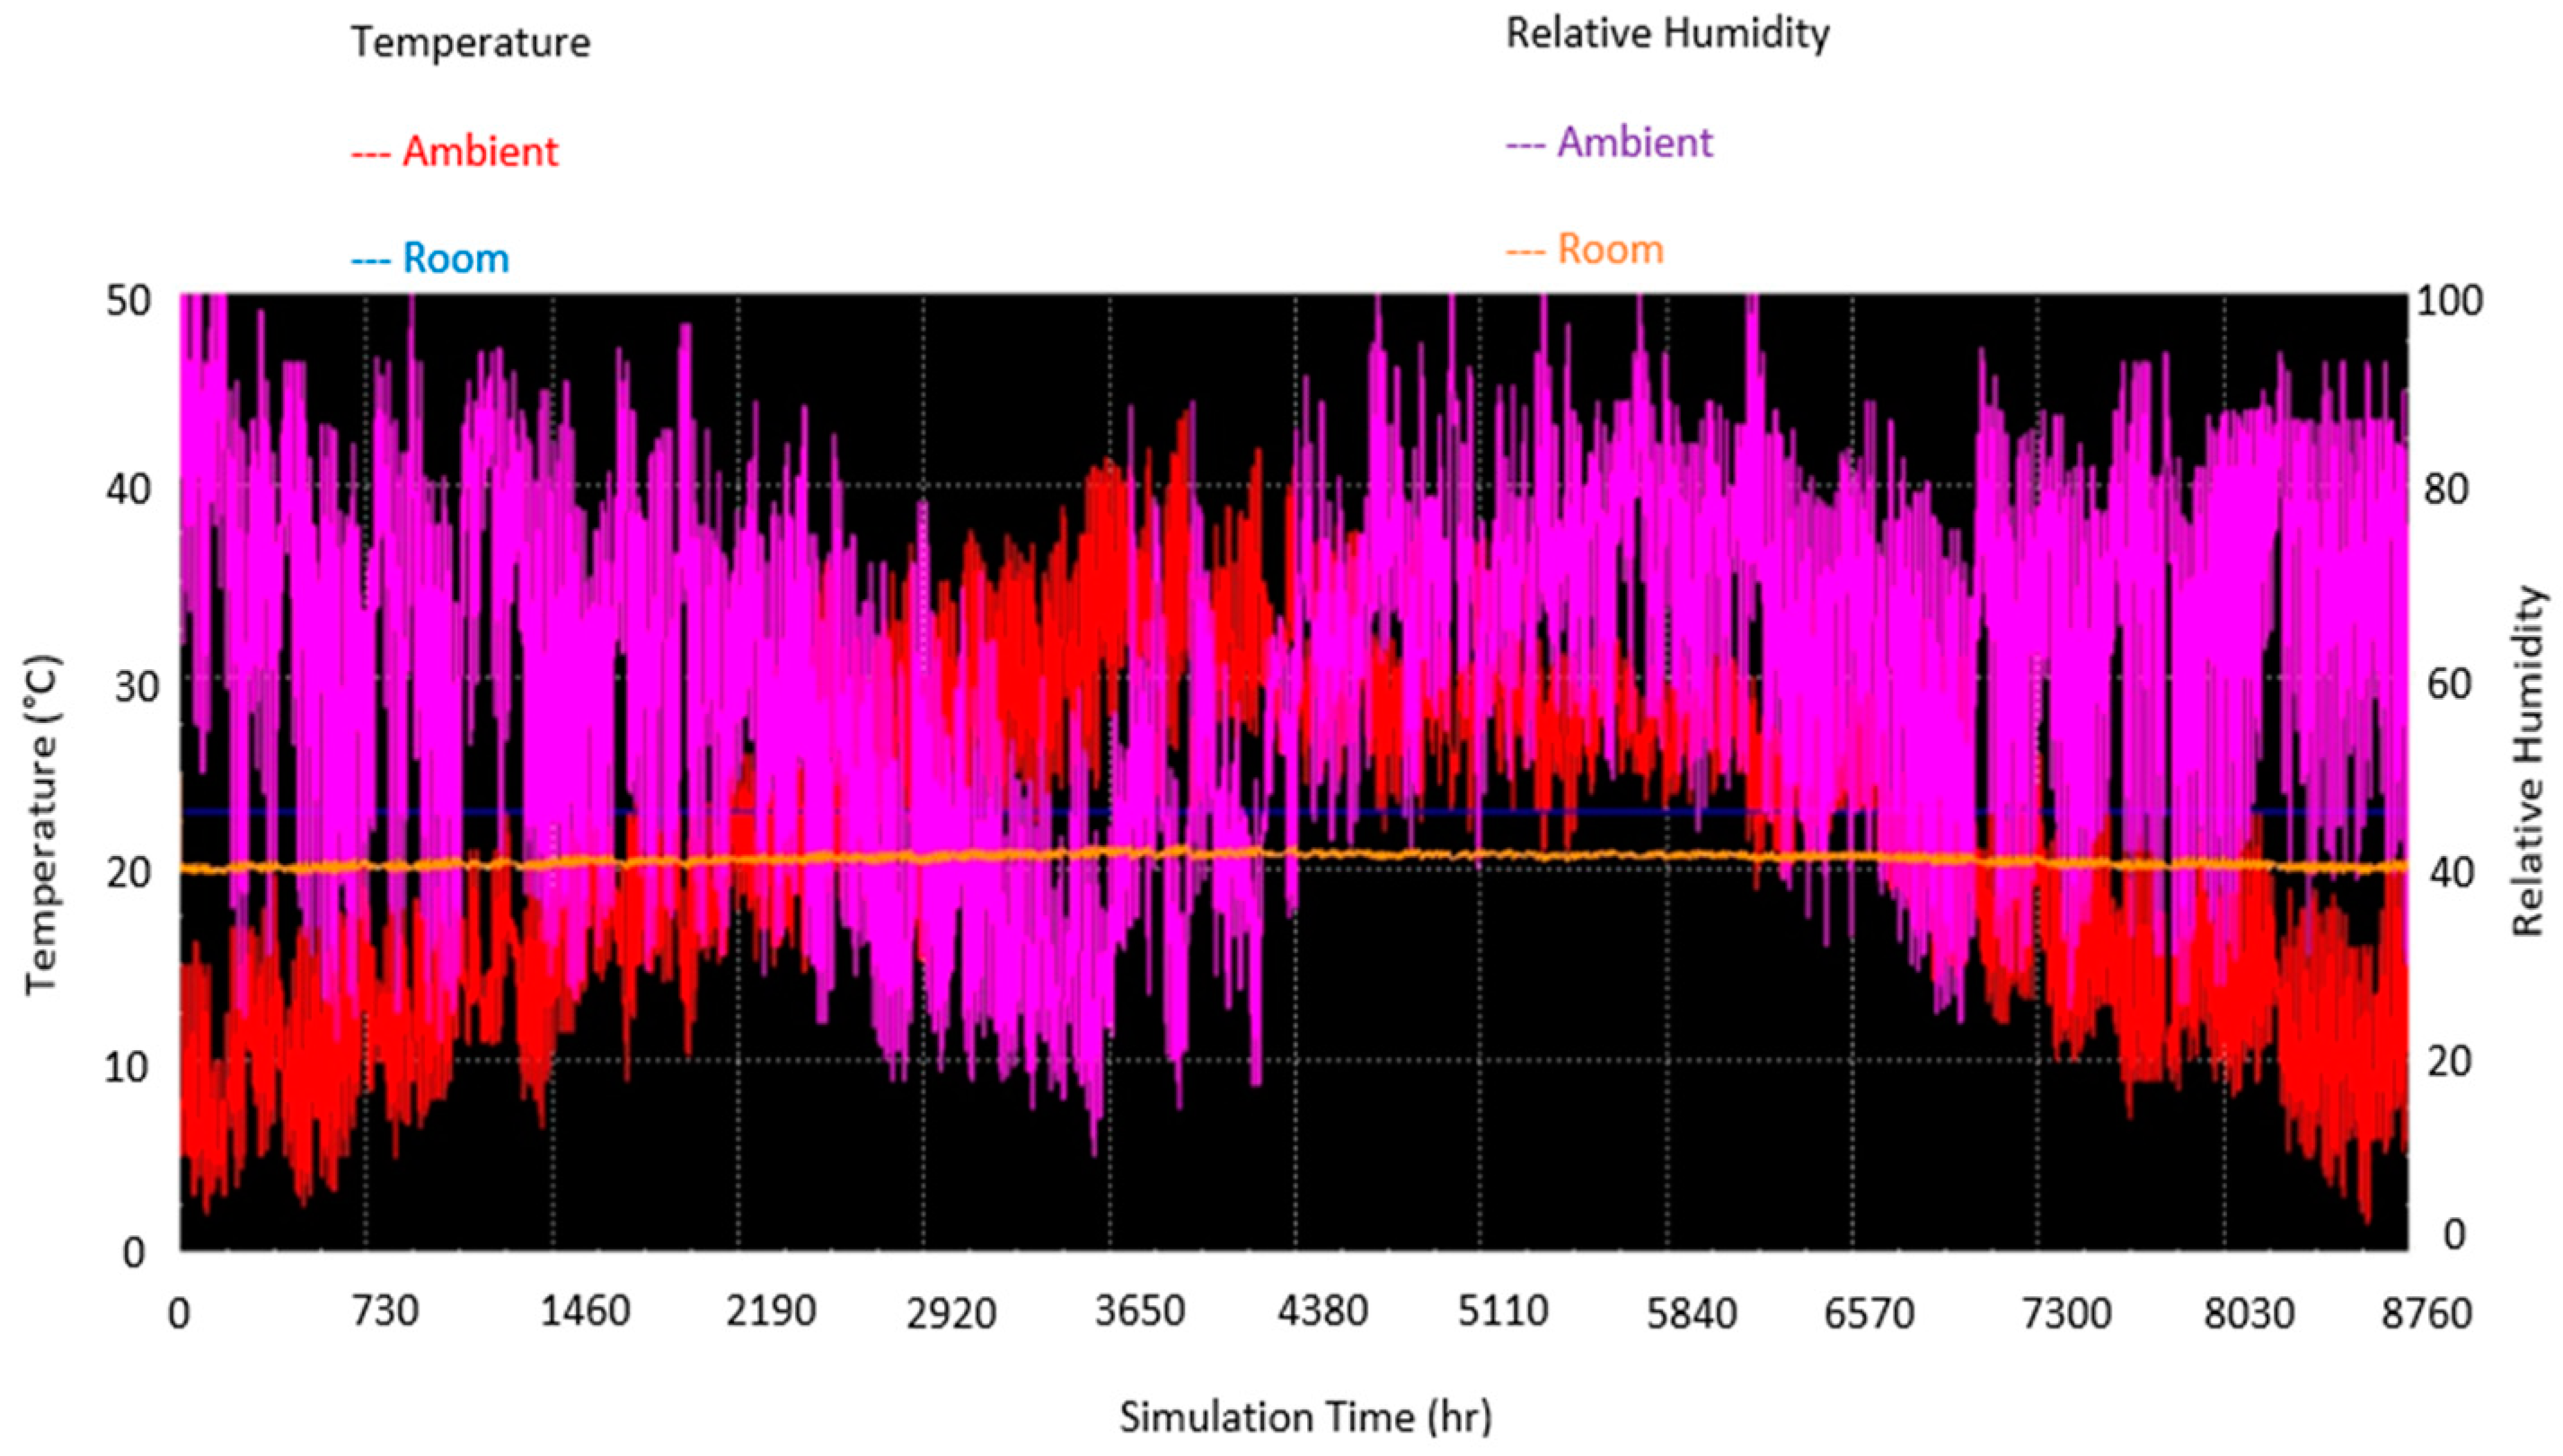
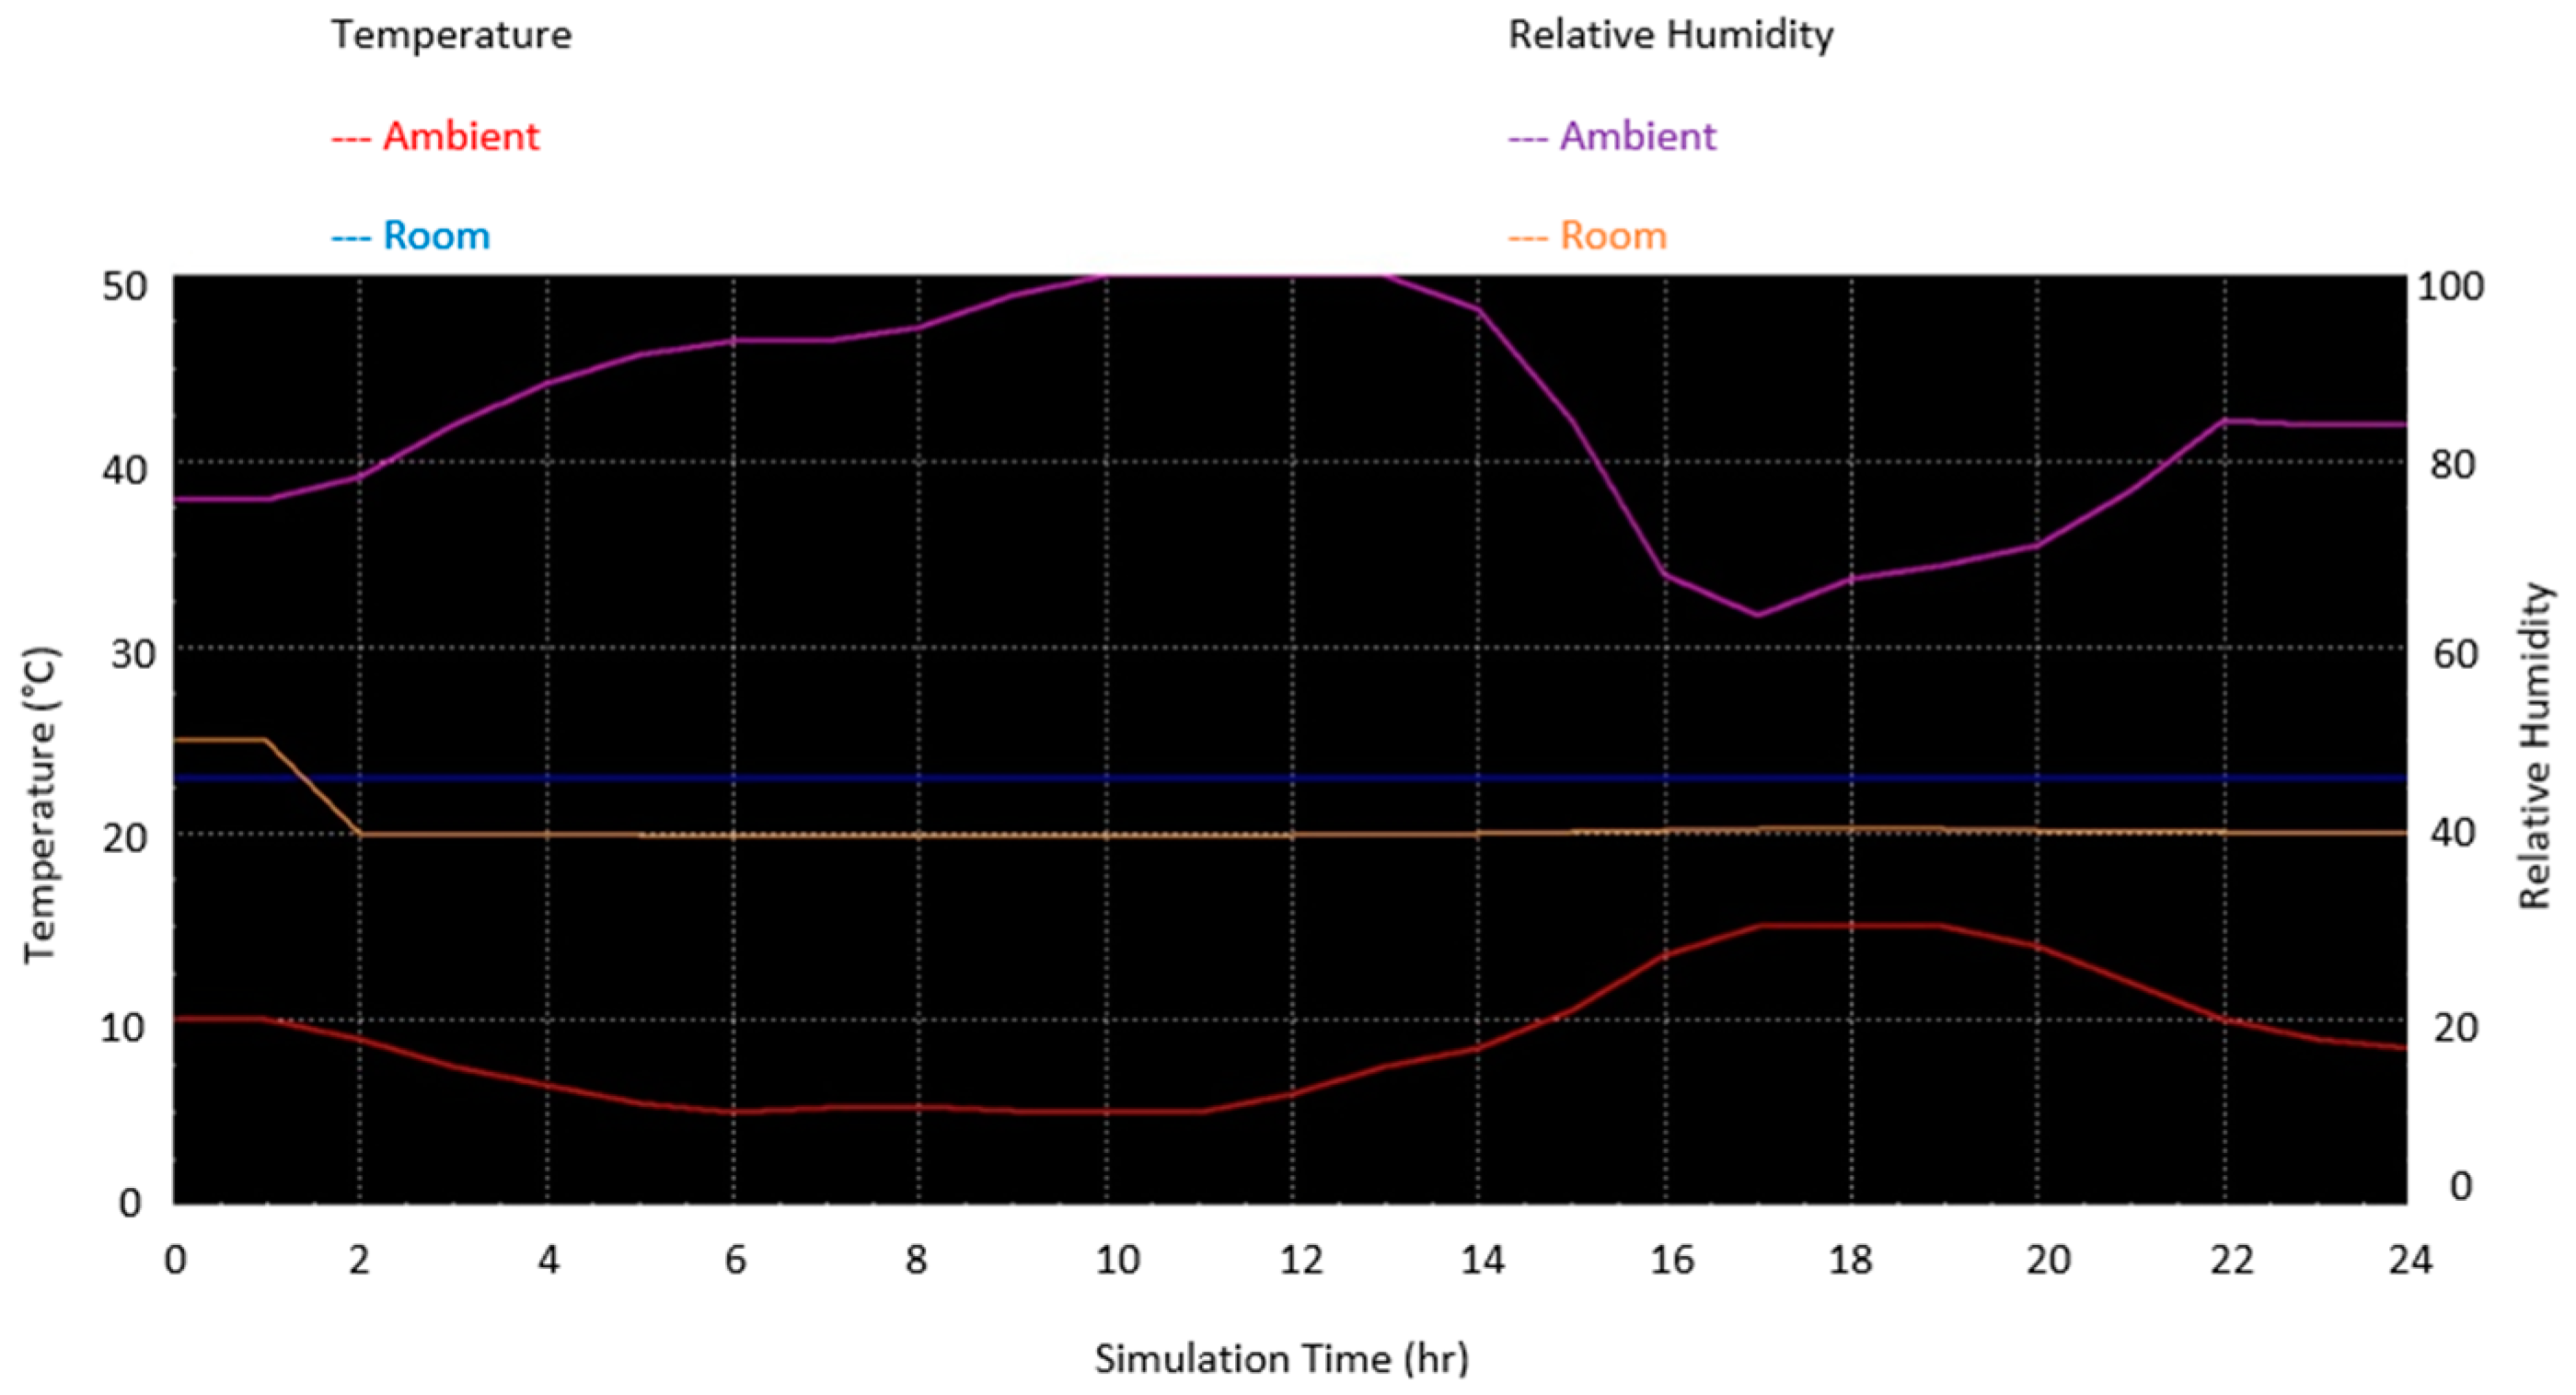
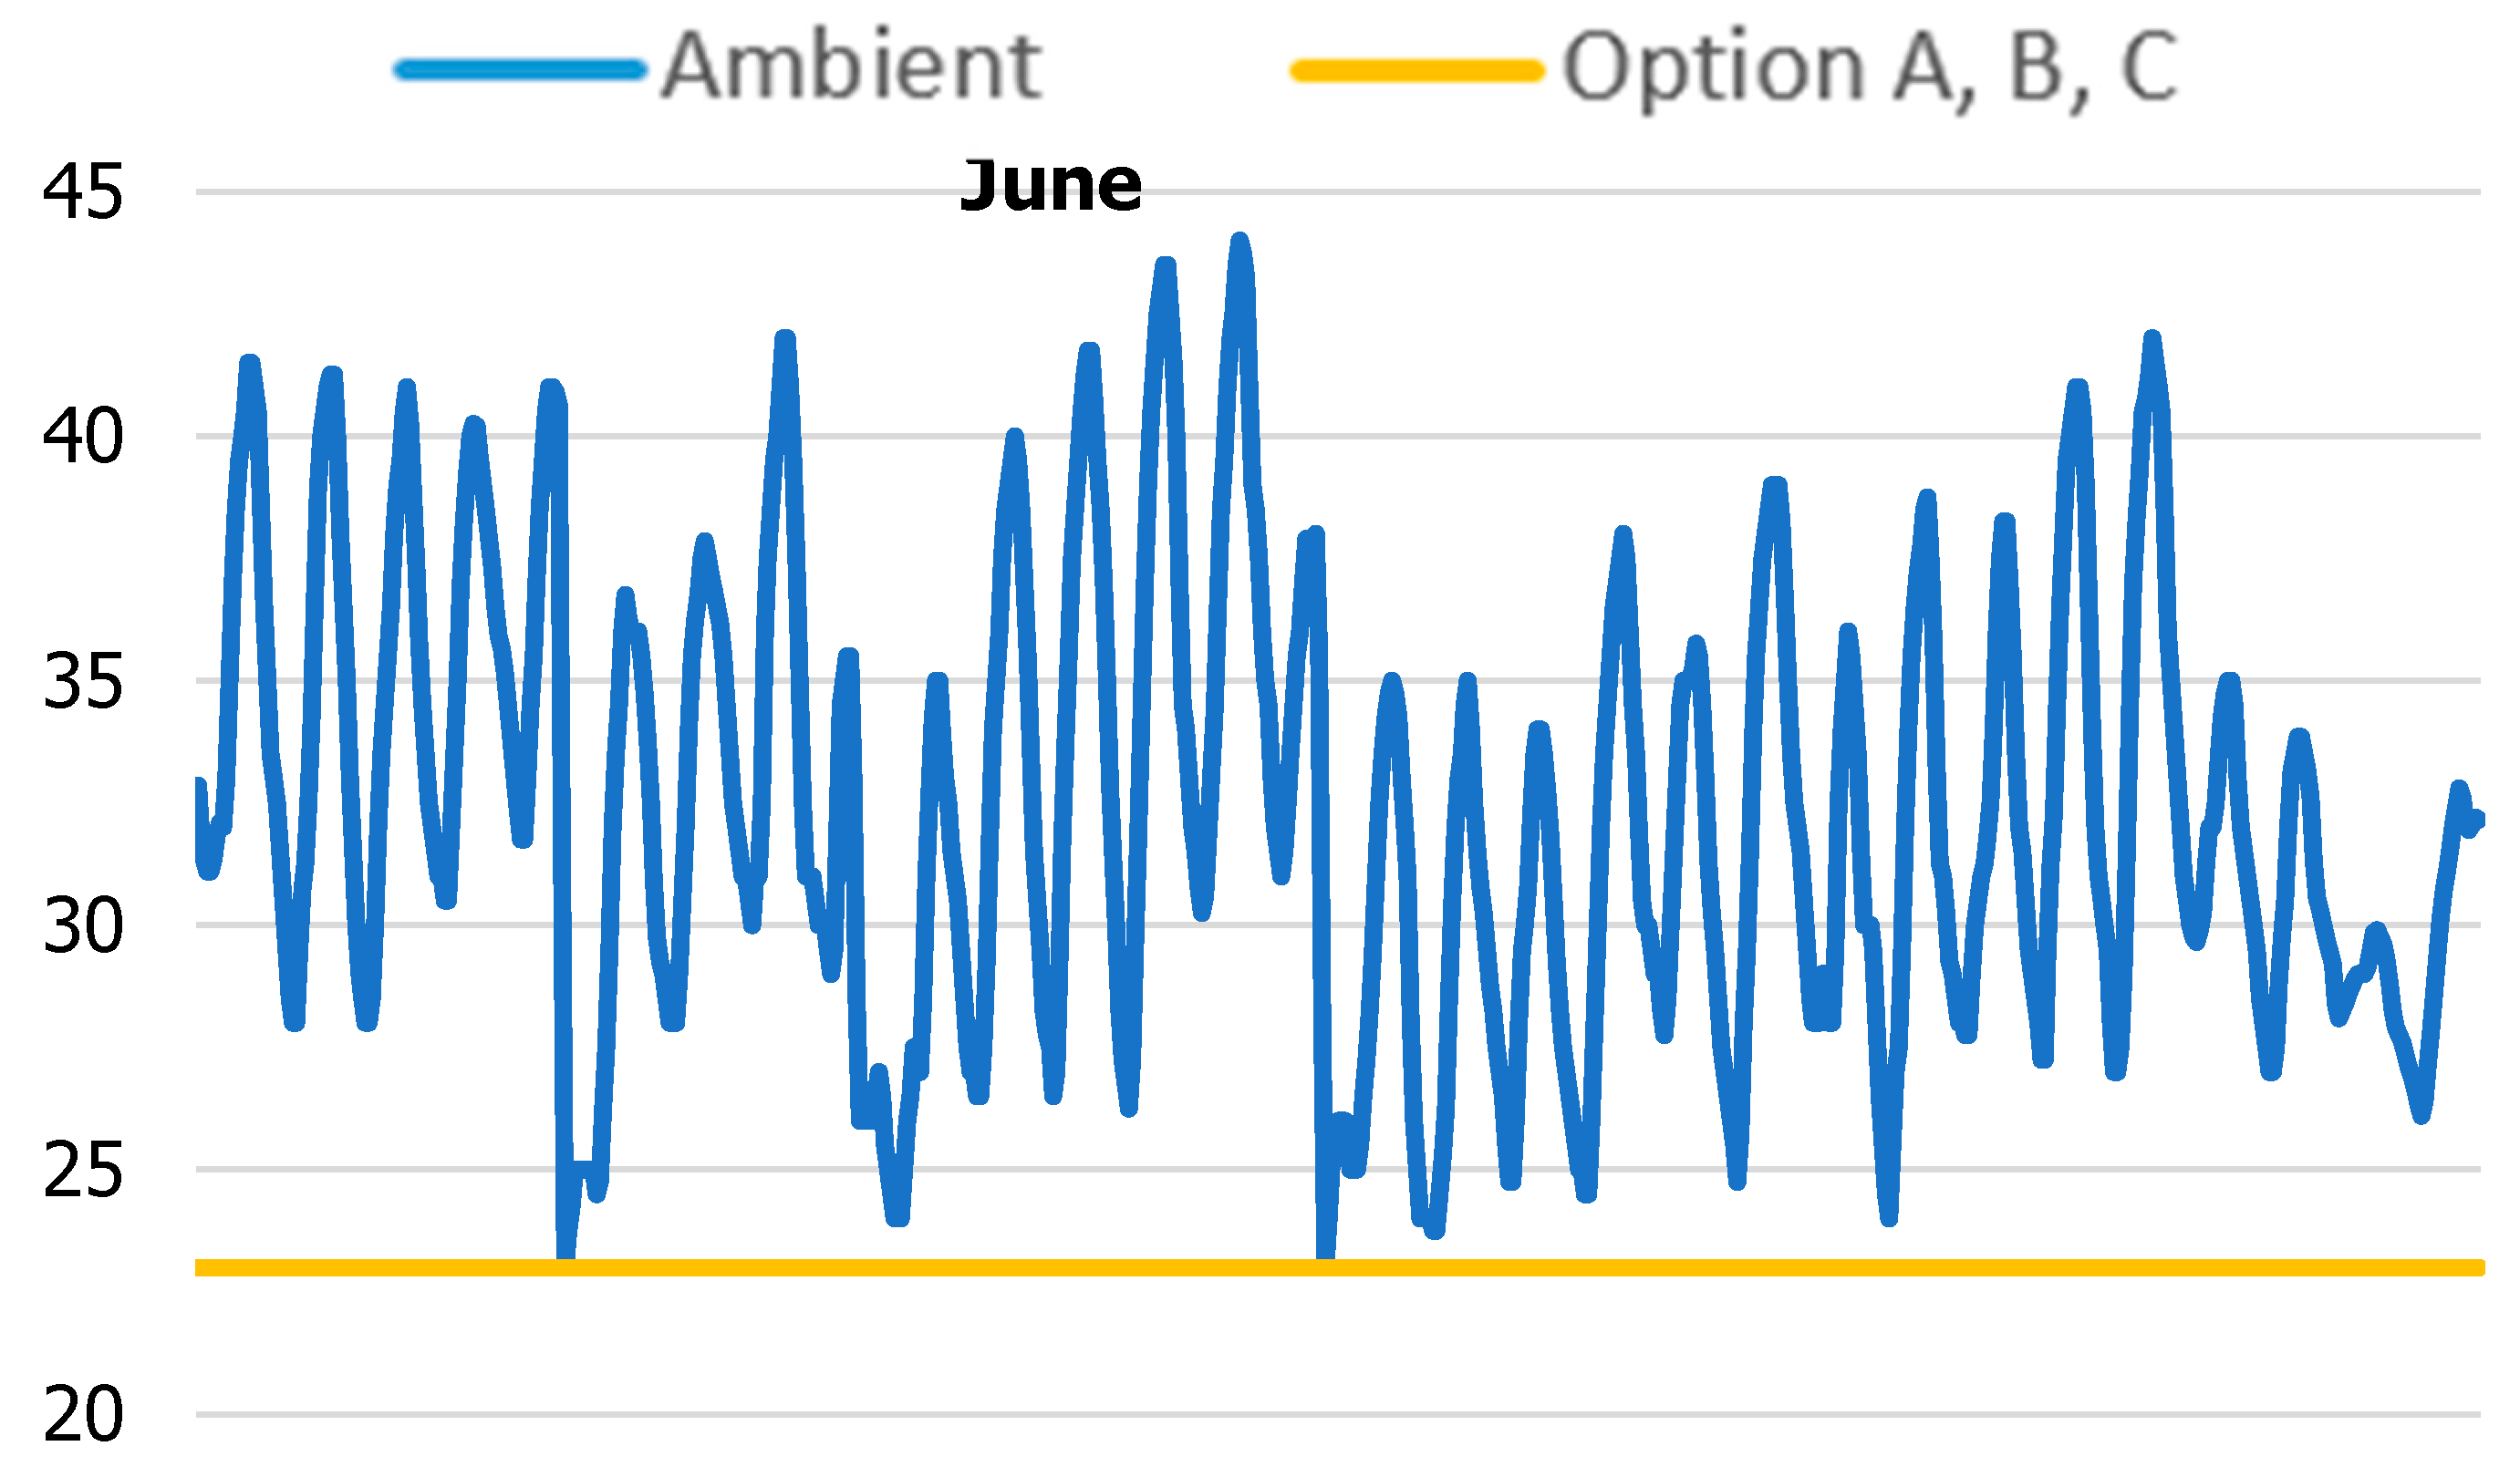
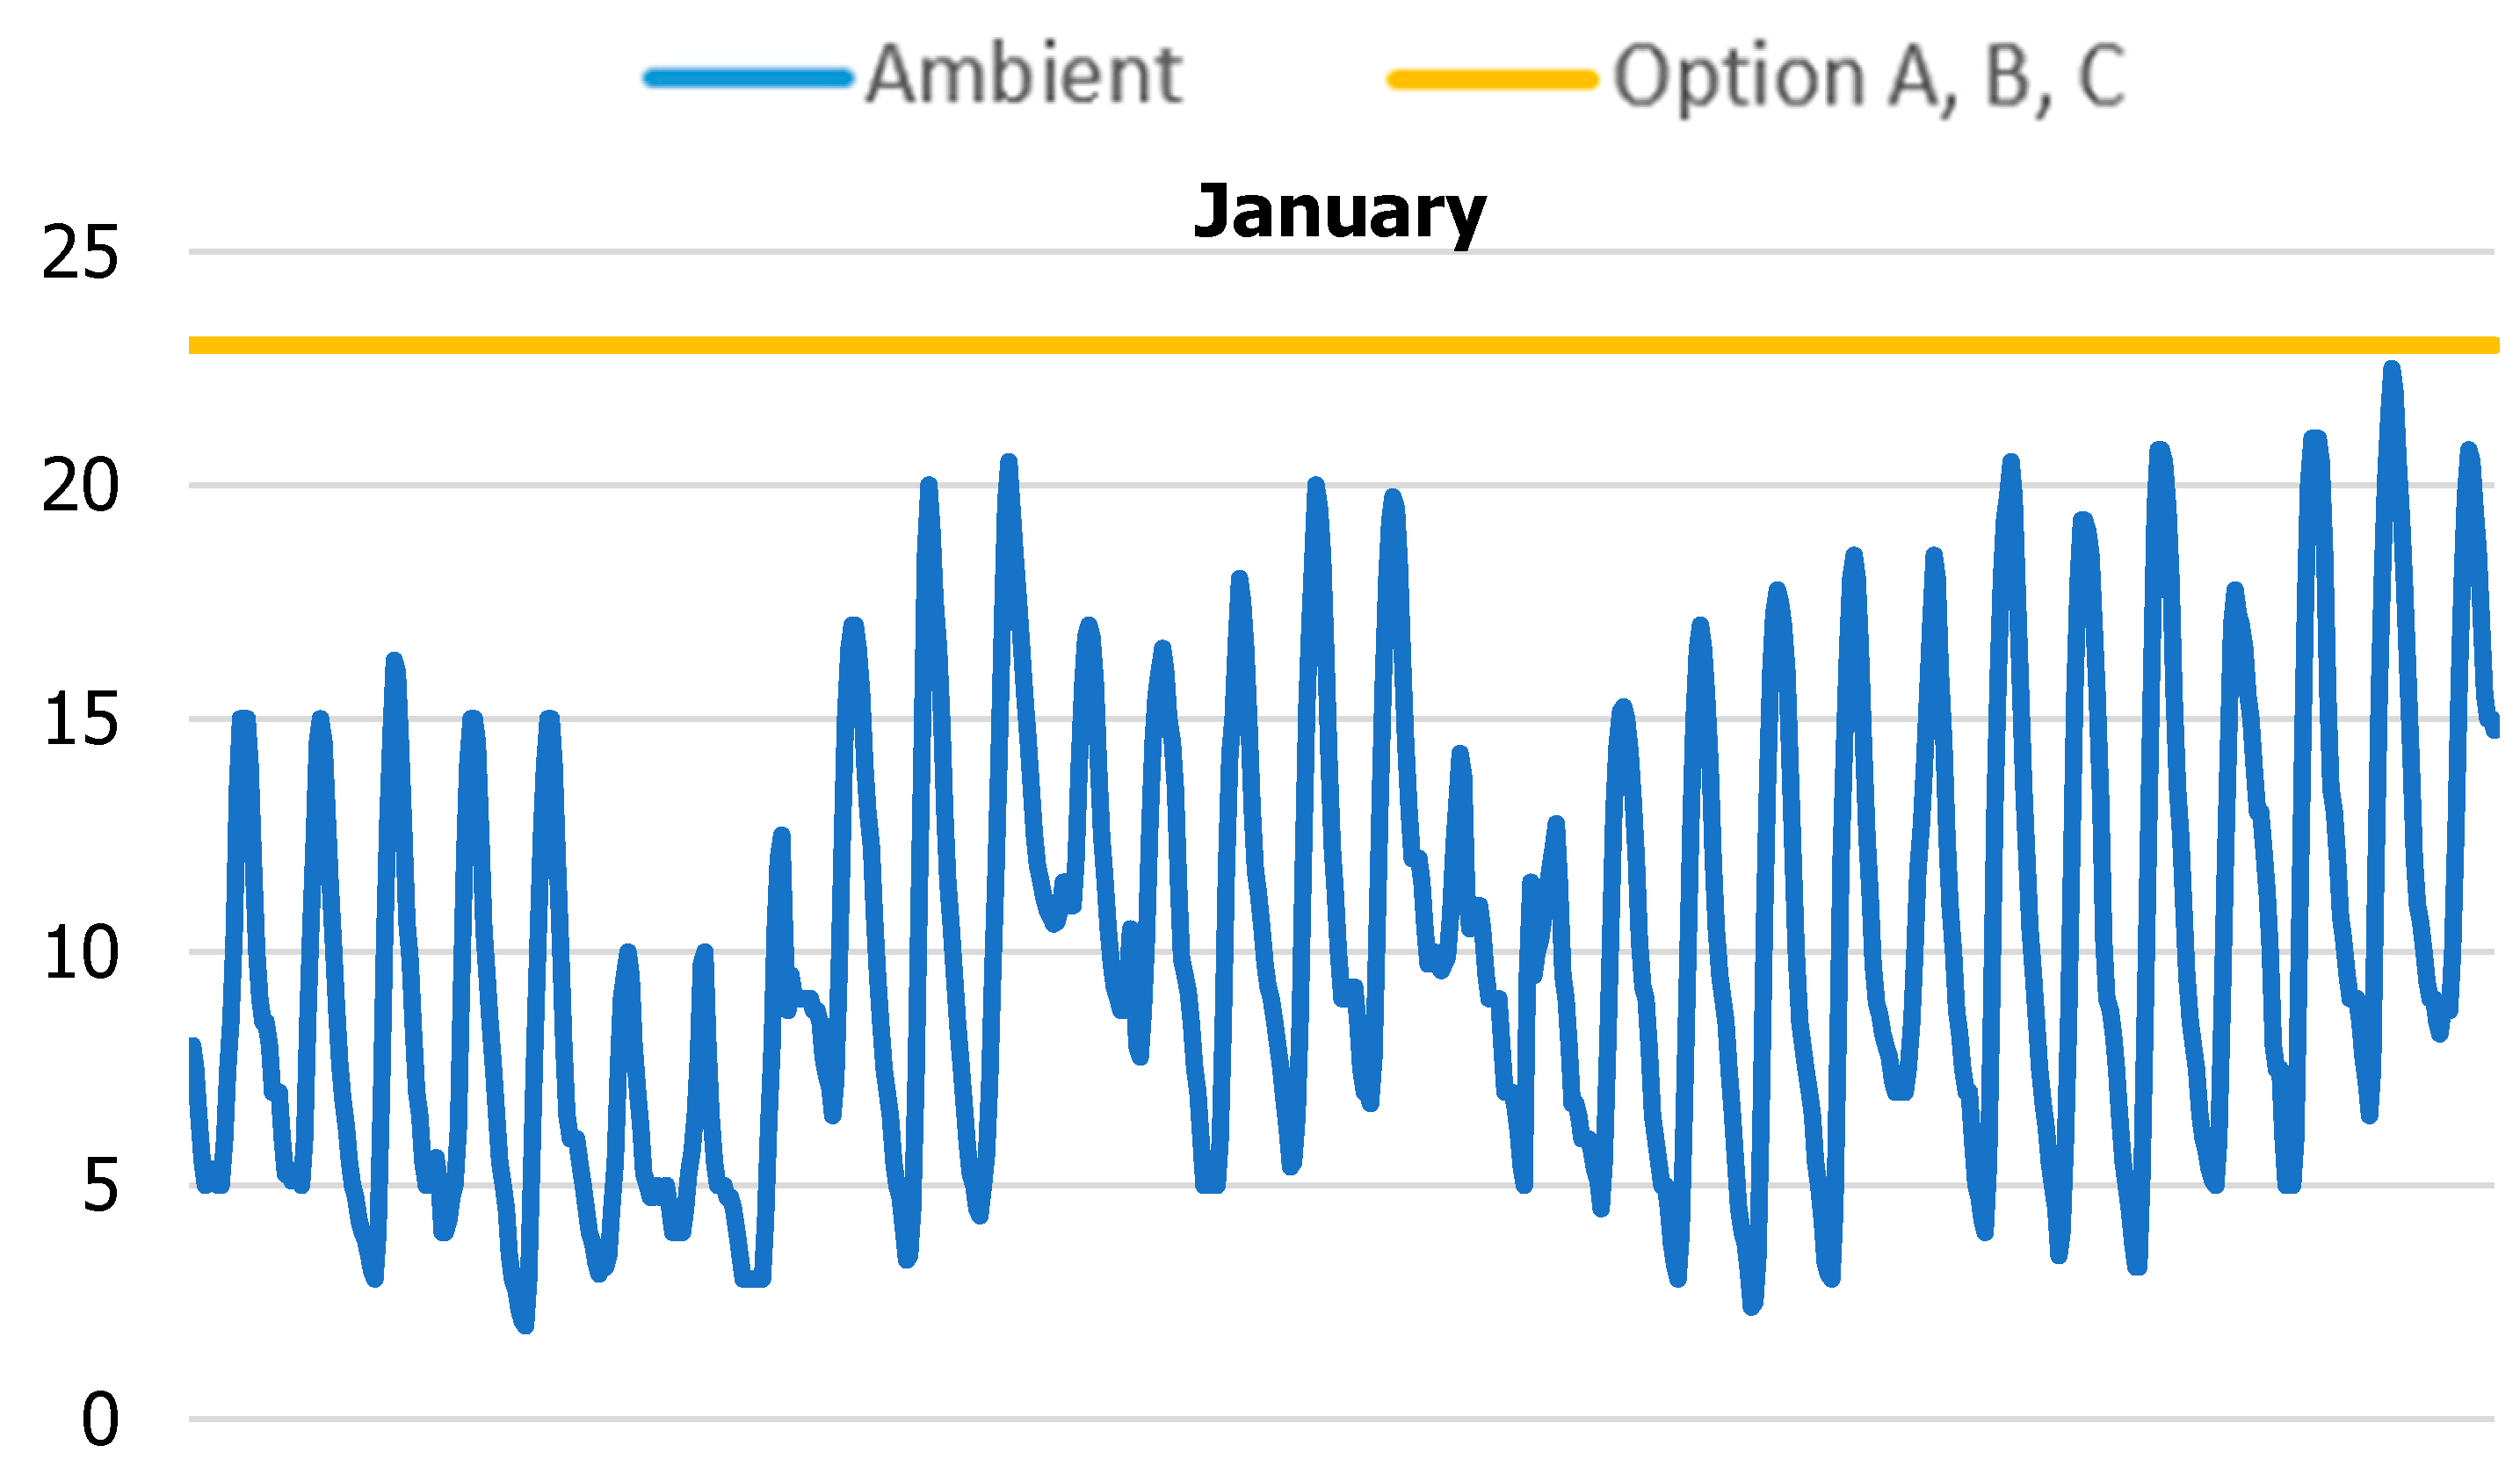
3.4. Comparison of Temperature among Three Control Configurations

The temperatures for all three configurations were plotted for the months of January and June. All the configurations successfully managed to maintain the set point temperature of 23 °C, even as the temperature throughout the month varied. Figure 25 and Figure 26 show a comparison of the temperatures for all three control configurations for the months of June and January, respectively.

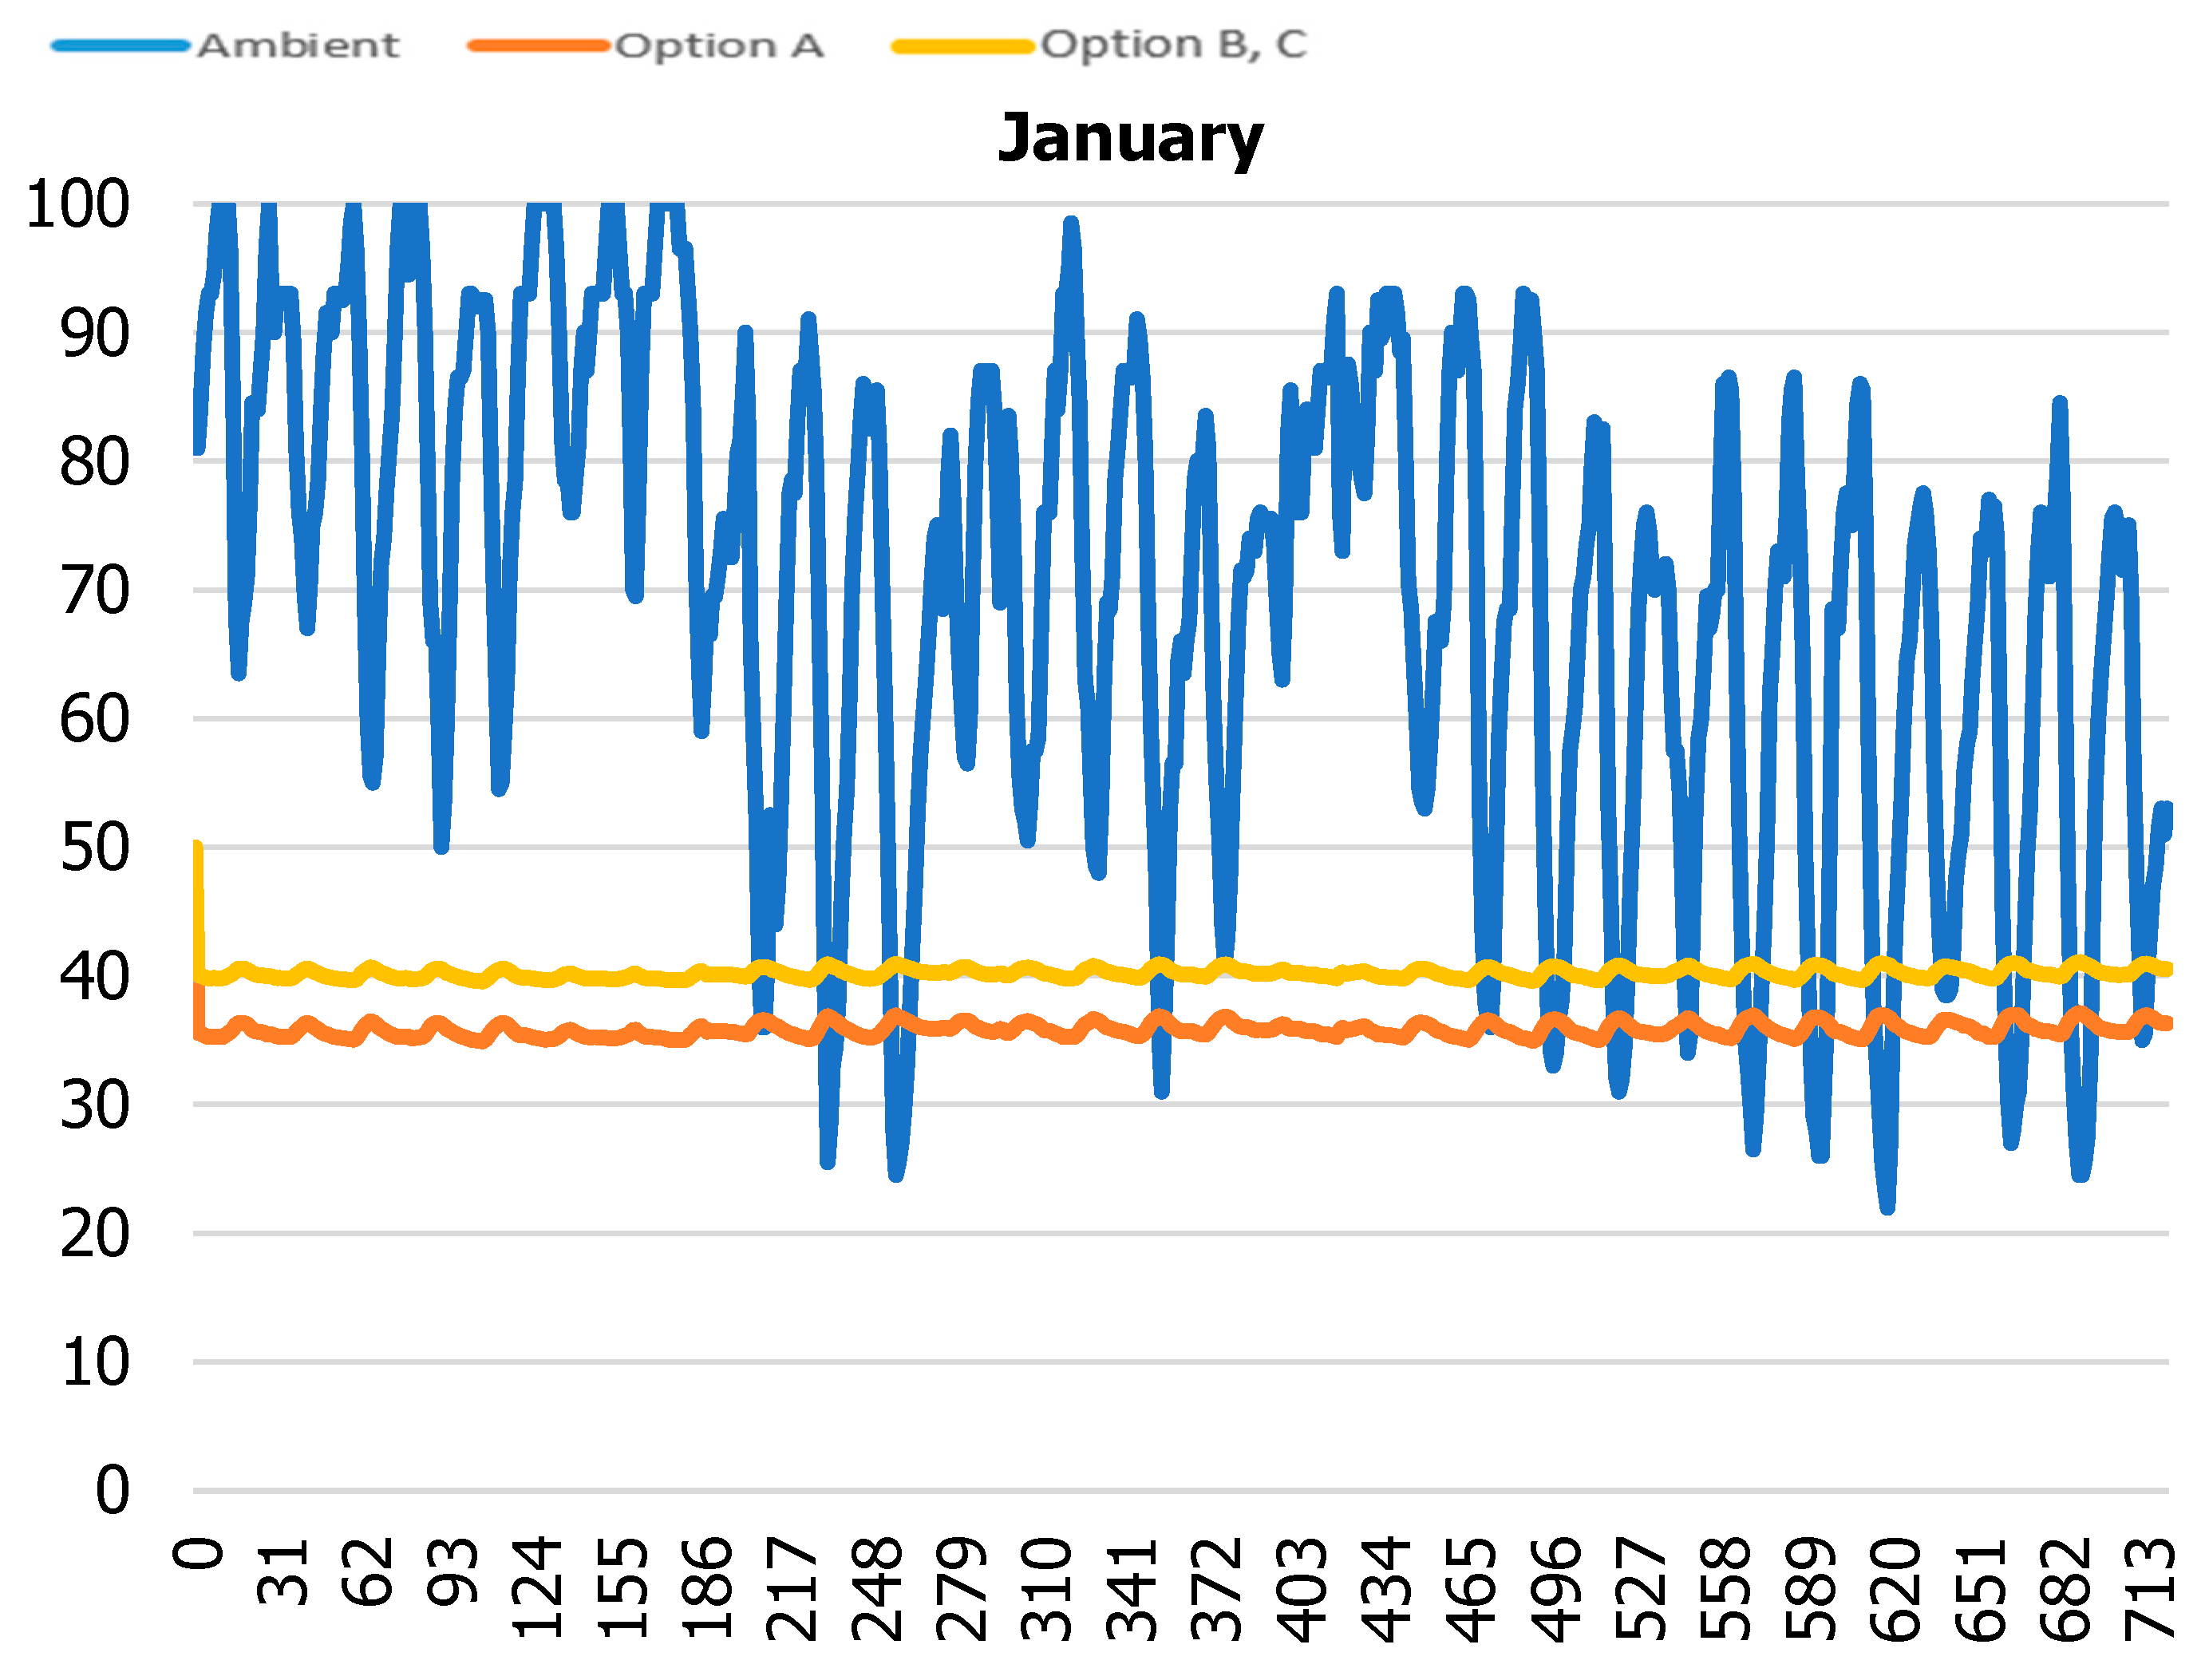
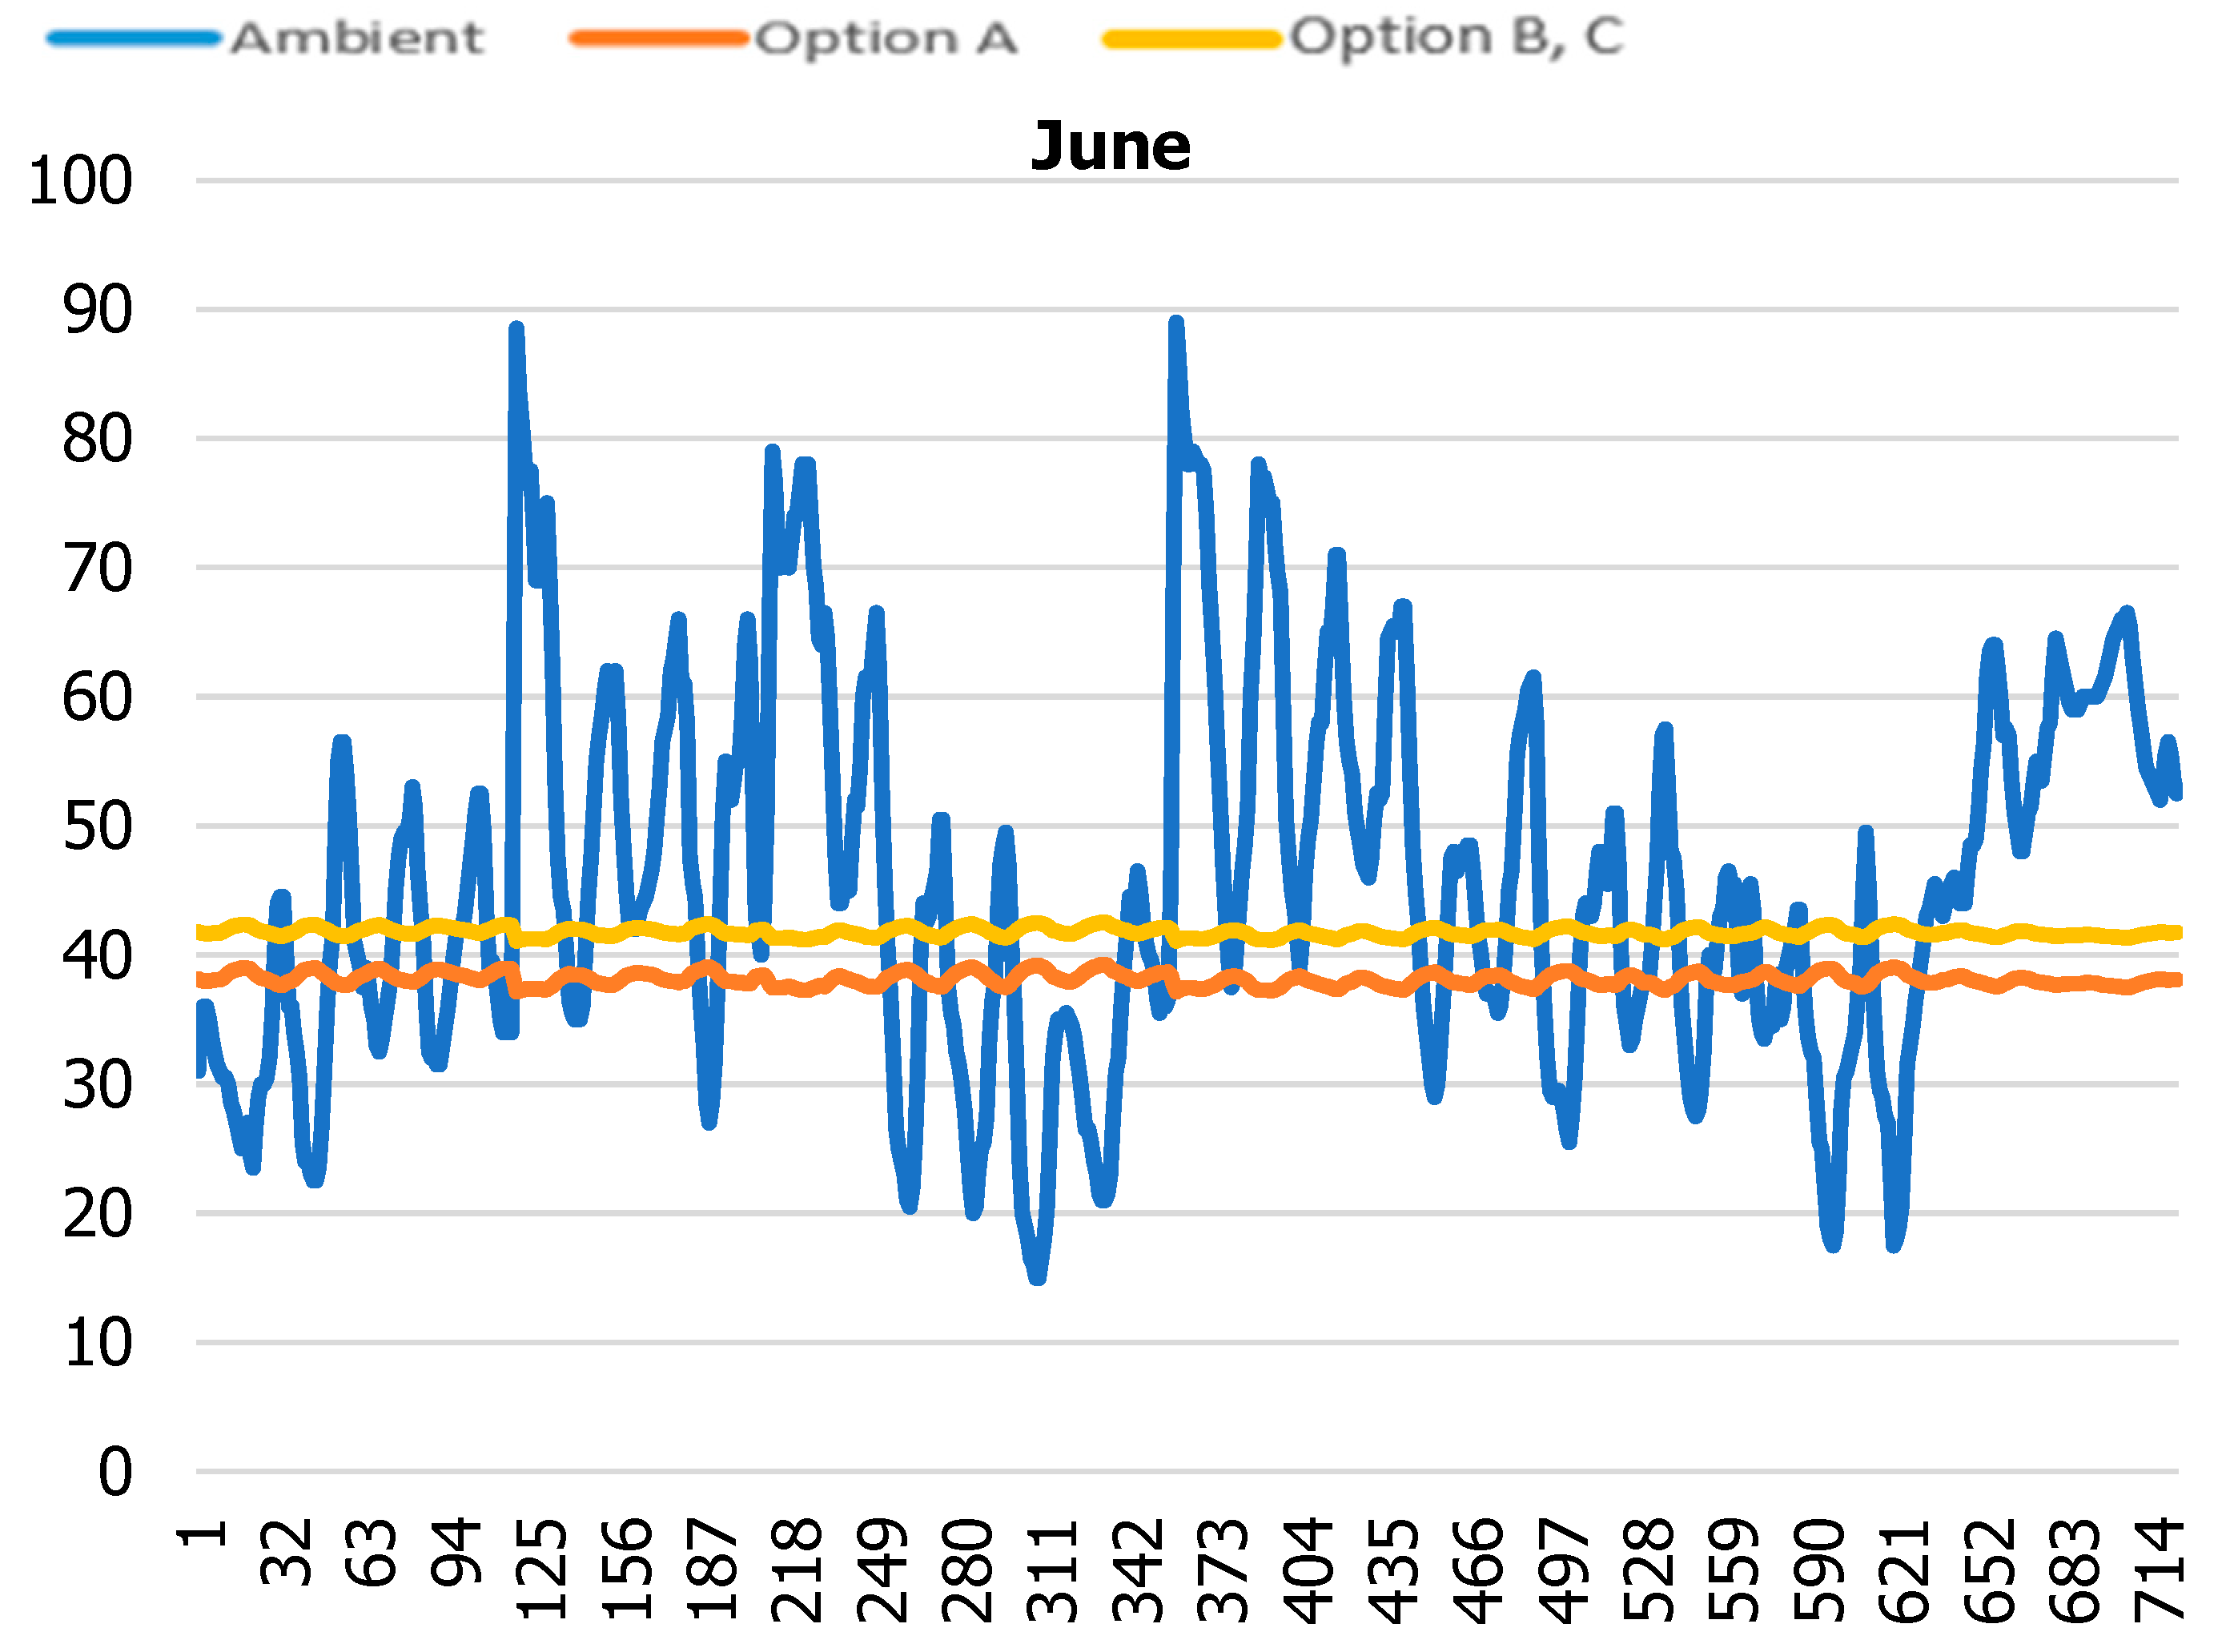
3.5. Comparison of Relative Humidity (RH) among Three Control Configurations

The relative humidity (RHs) for all three configurations was also plotted for a period of one month with a set point for RH at 40%. Figure 27 and Figure 28 show the relative humidity (RH) comparison for all control configurations for the months of January and June. Option A managed to maintain the RH at around 36%. Option B managed to maintain the RH at around 40%. Option C managed to maintain the RH at around 40%

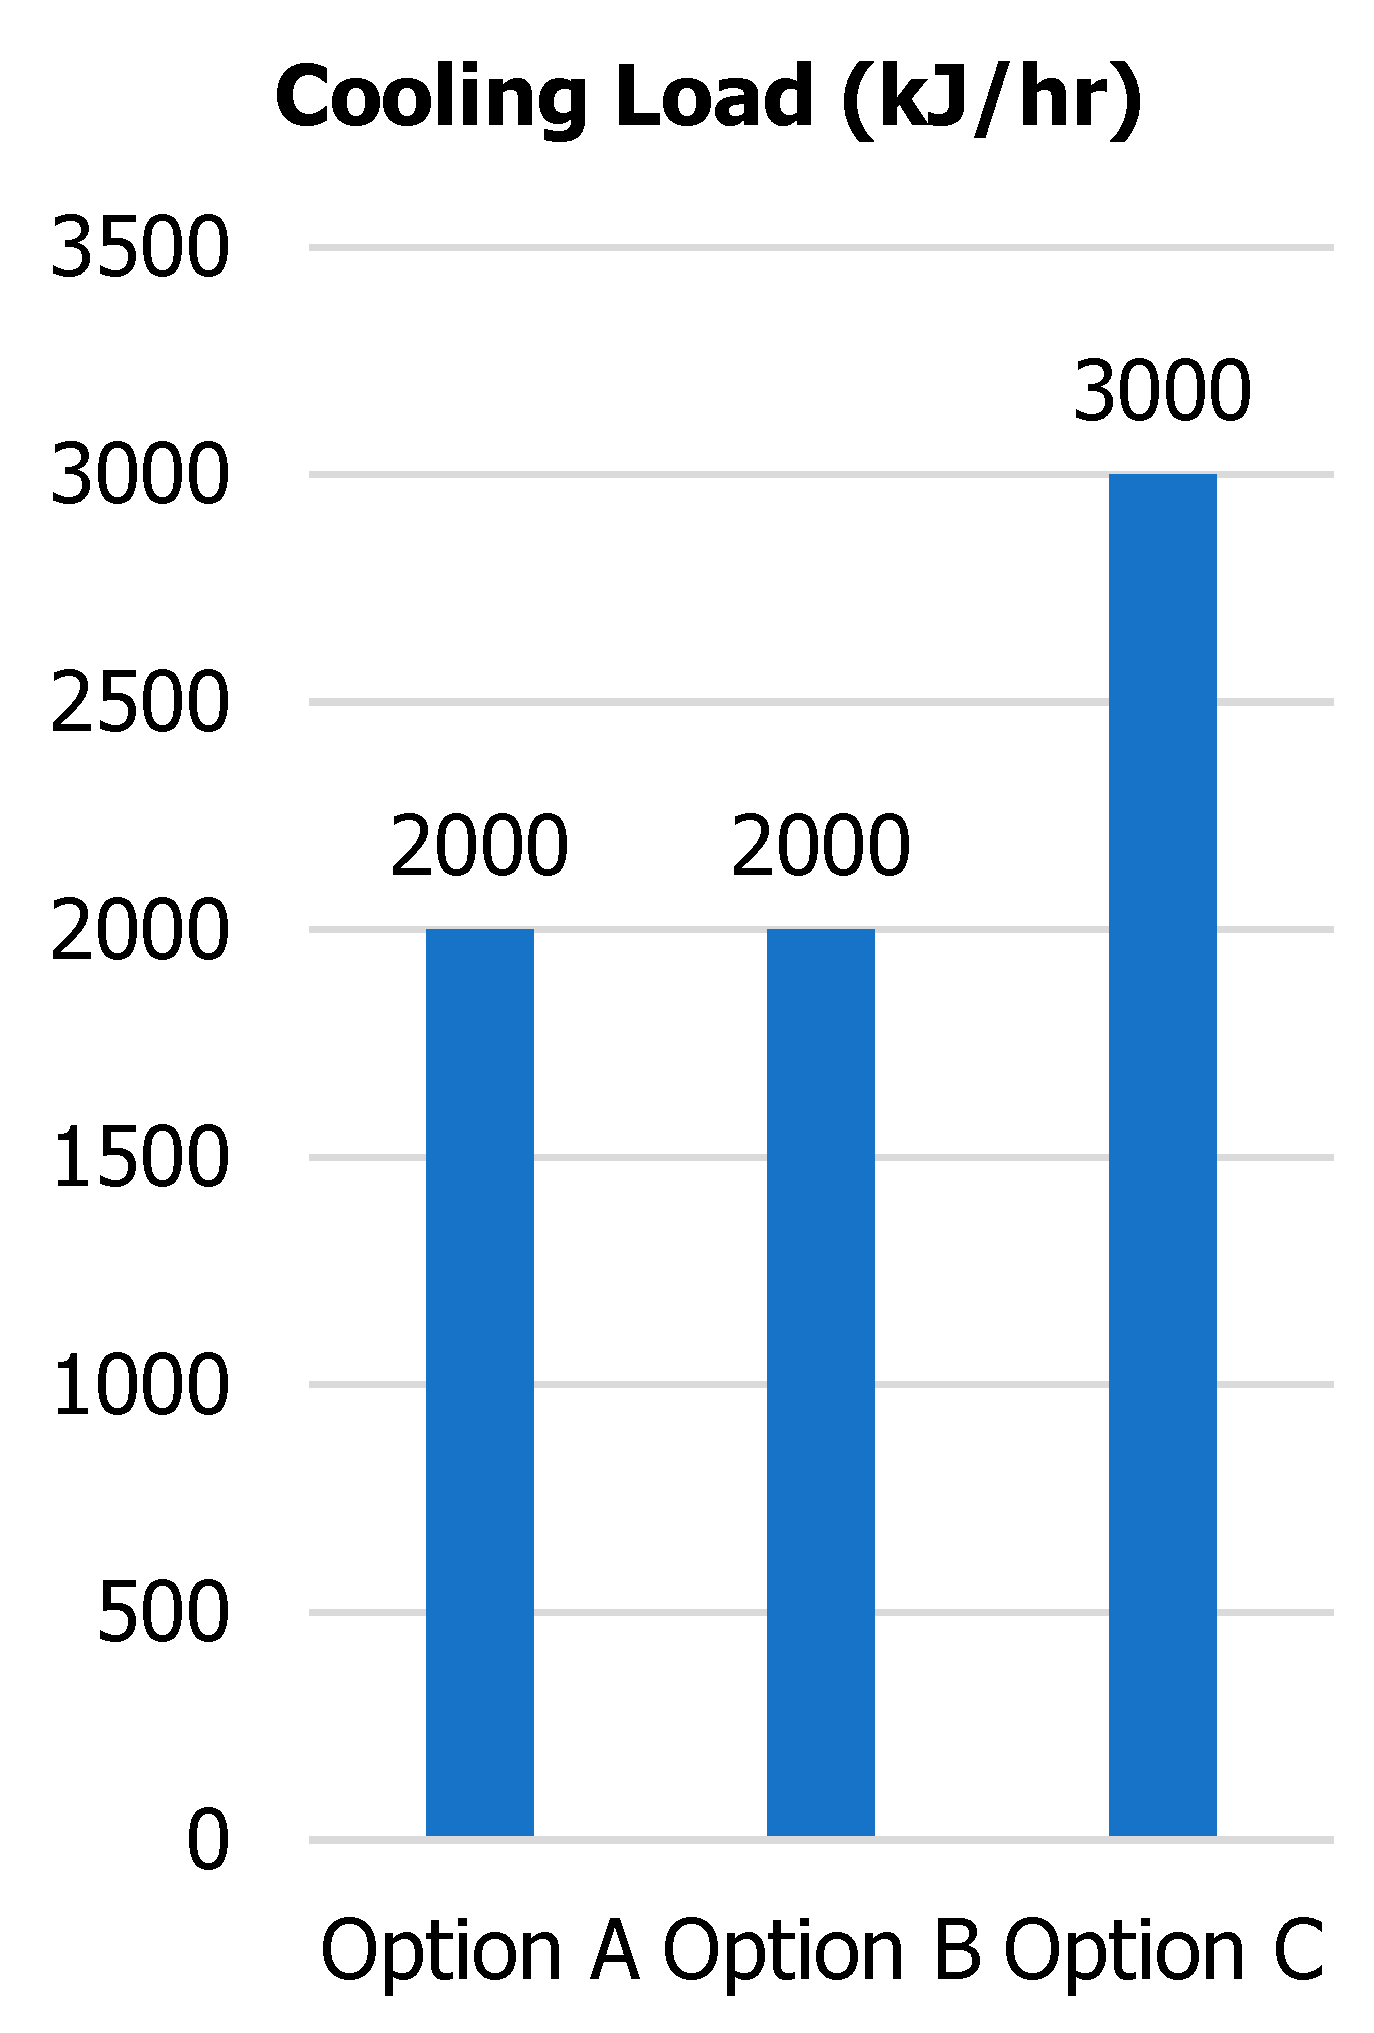
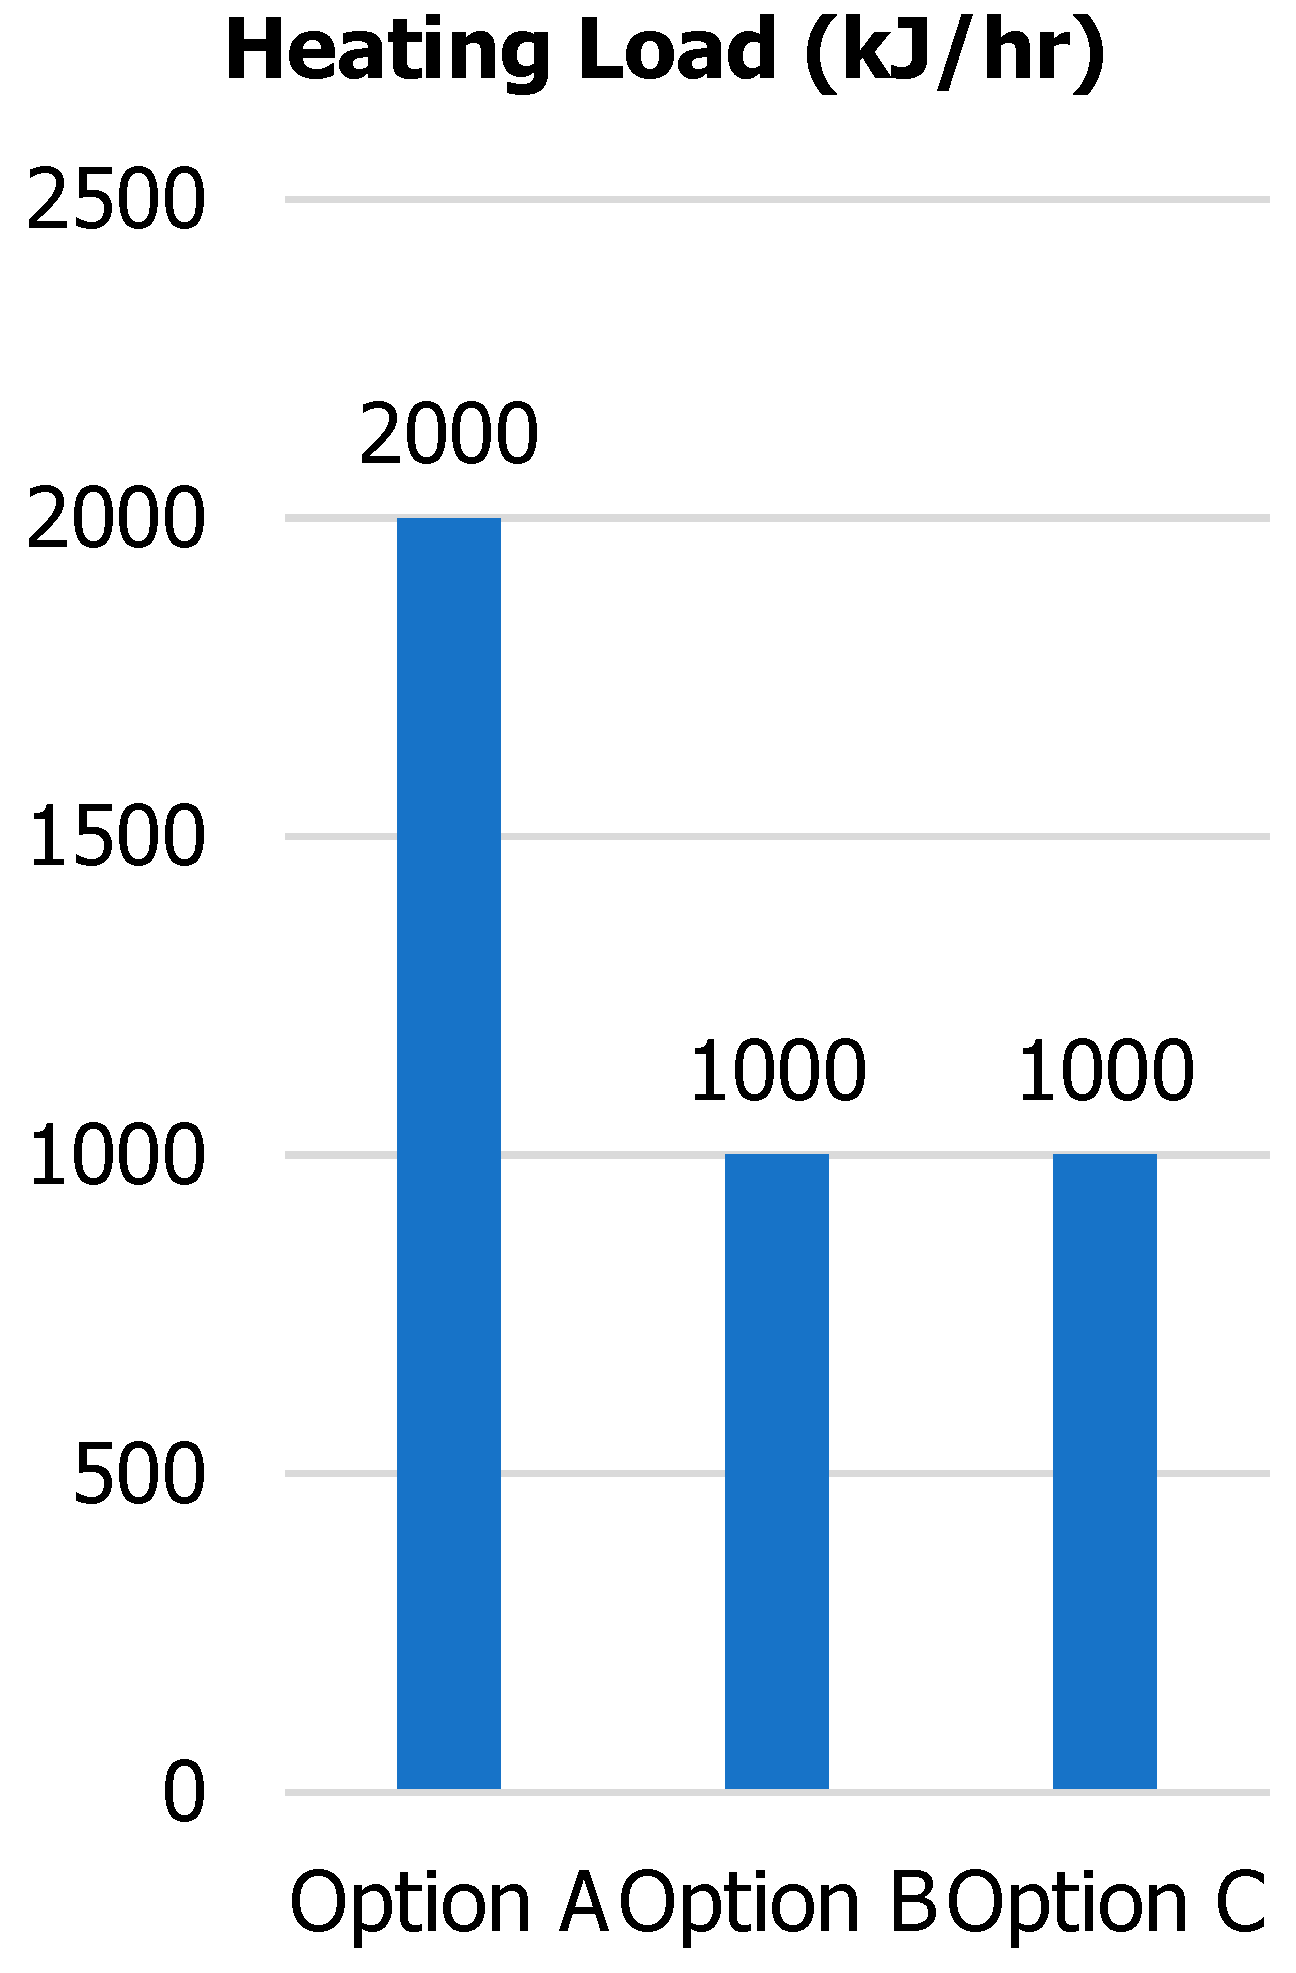
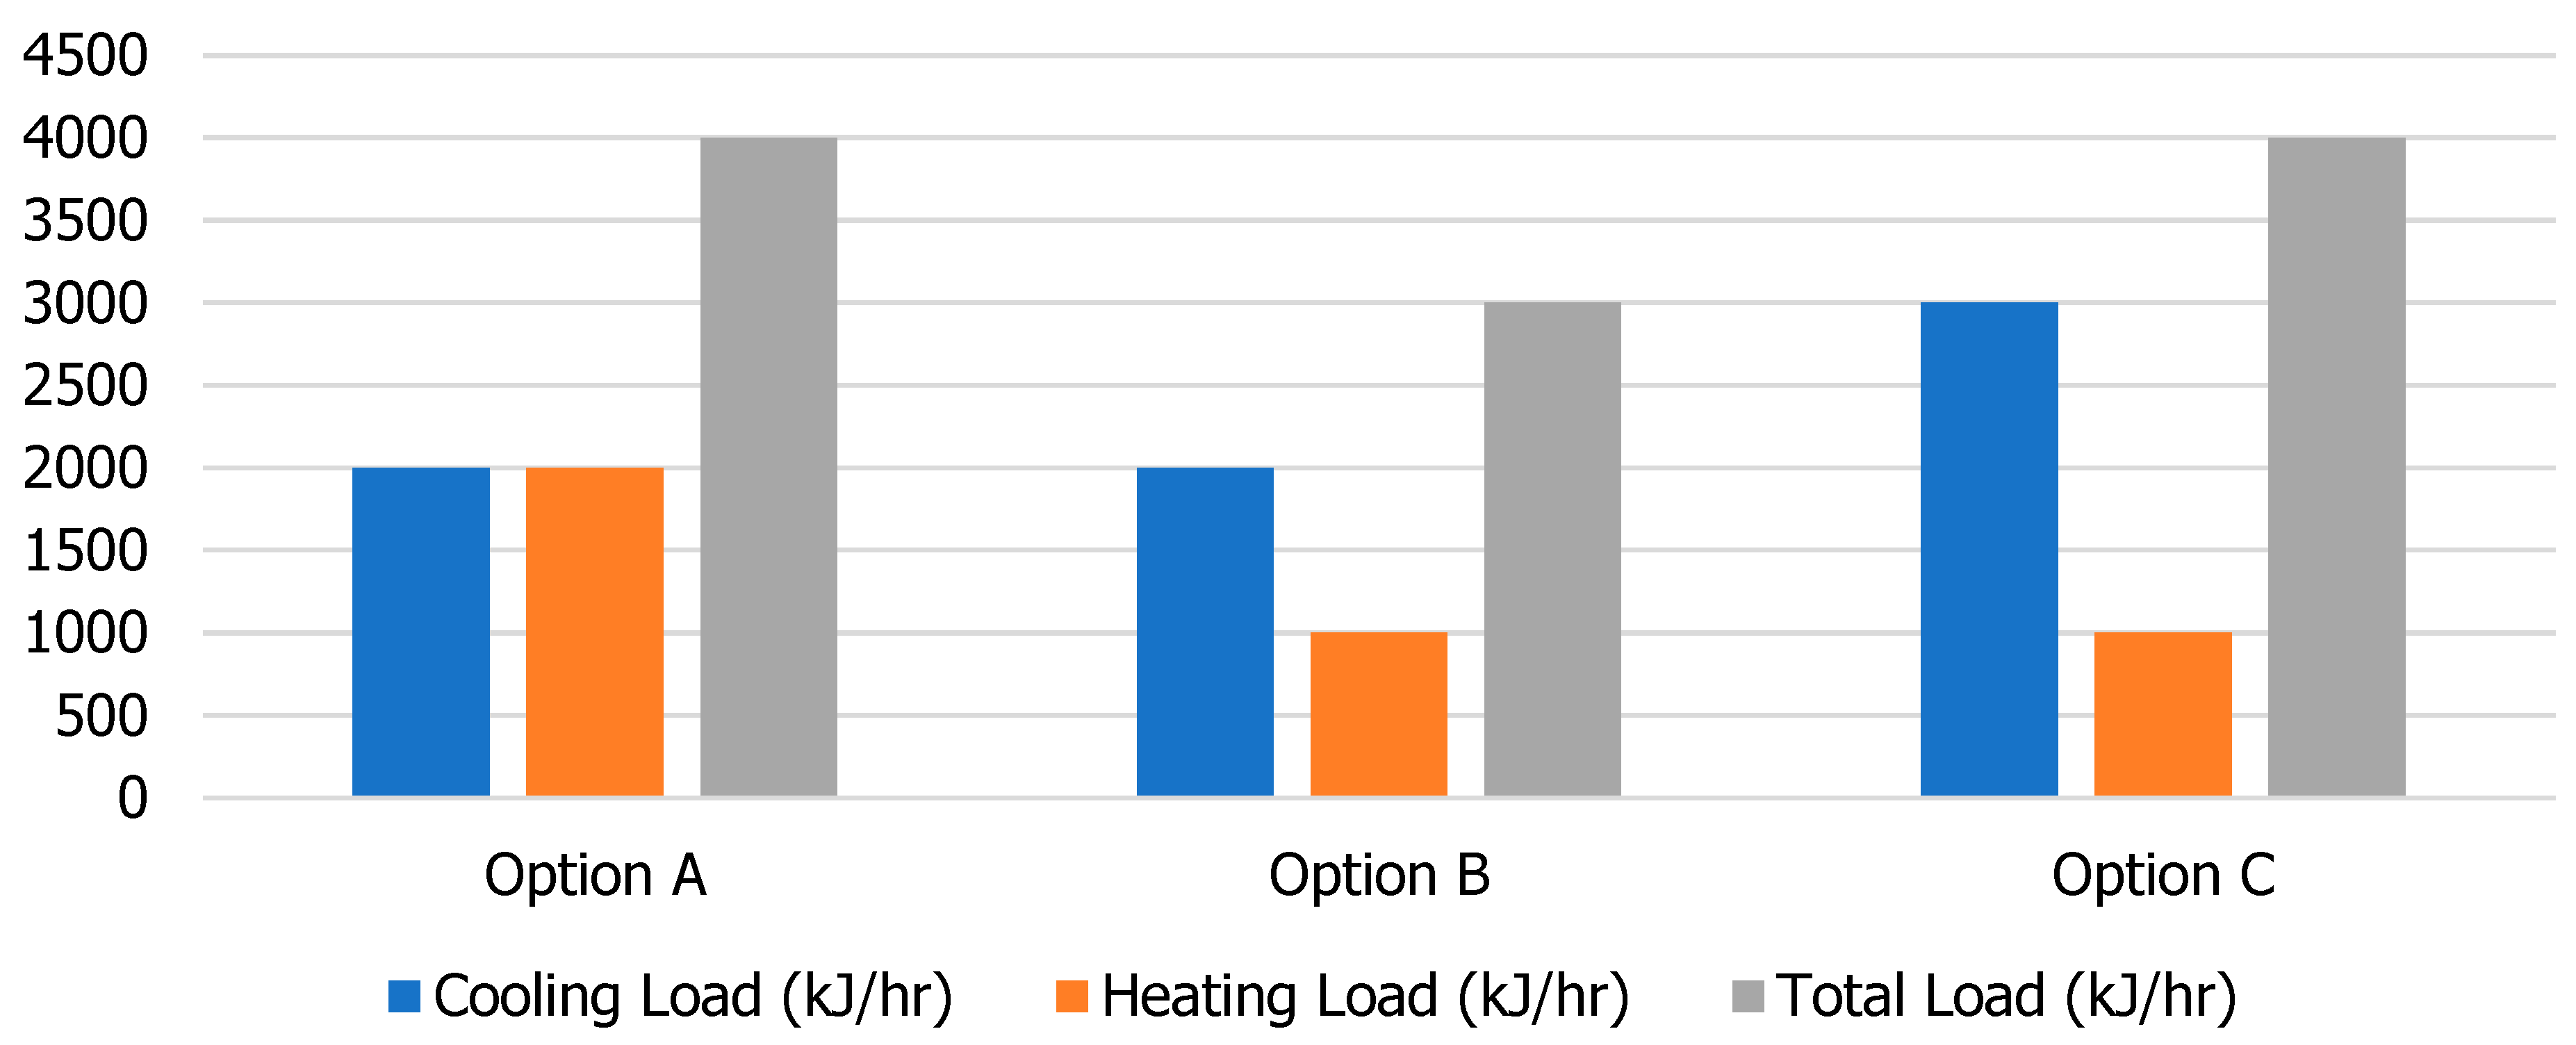
3.6. Cooling and Heating Loads for All Three Configurations

As the number of components vary in the simulation, the heating and cooling loads vary with it. In TRNSYS, the heating and cooling loads were set at a standard value of 1000 kJ/h. Option A and C both had a total load of 4000 kJ/h. Option B was the most energy efficient in terms of this, as its total load was 3000 kJ/h. Figure 29 and Figure 30 show a comparison of the cooling and heating loads of all three control configurations, and Figure 31 shows a comparison of the overall loads of all three control configurations.

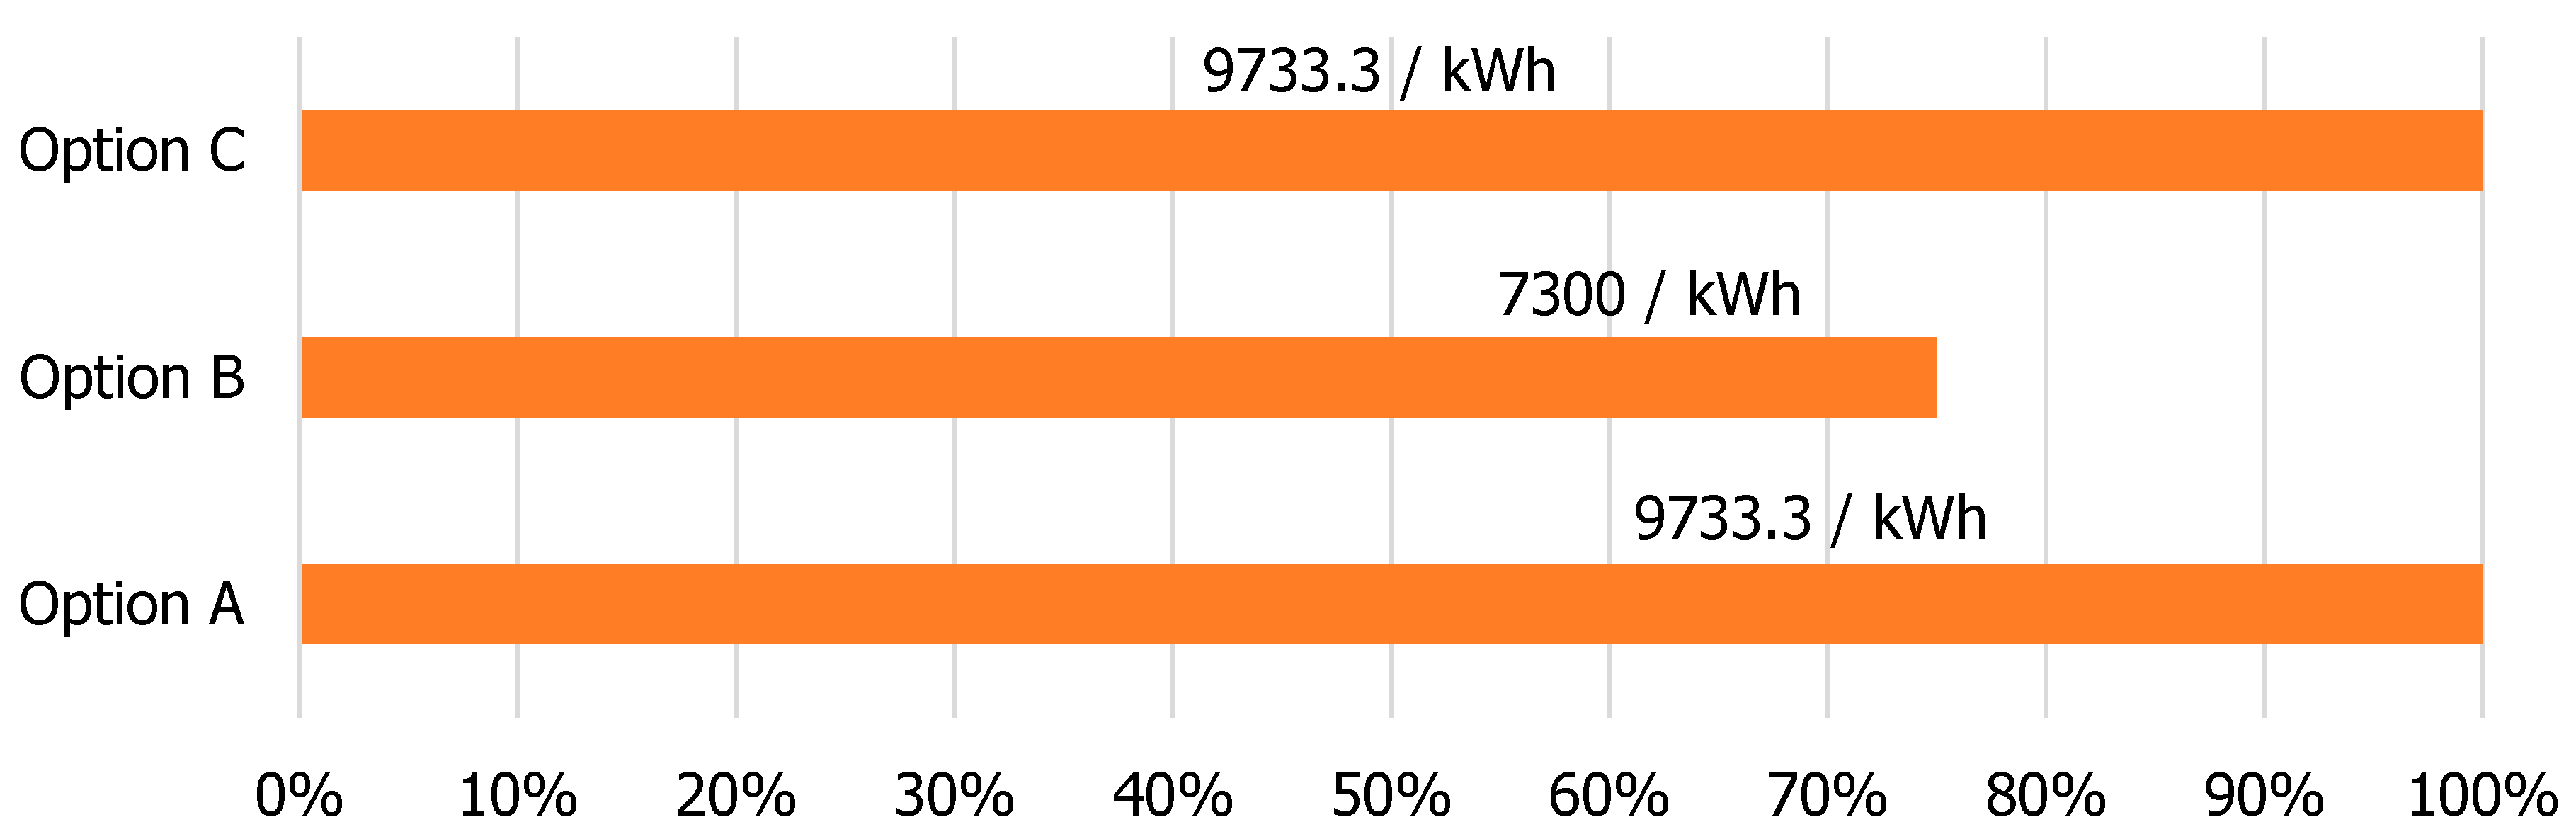
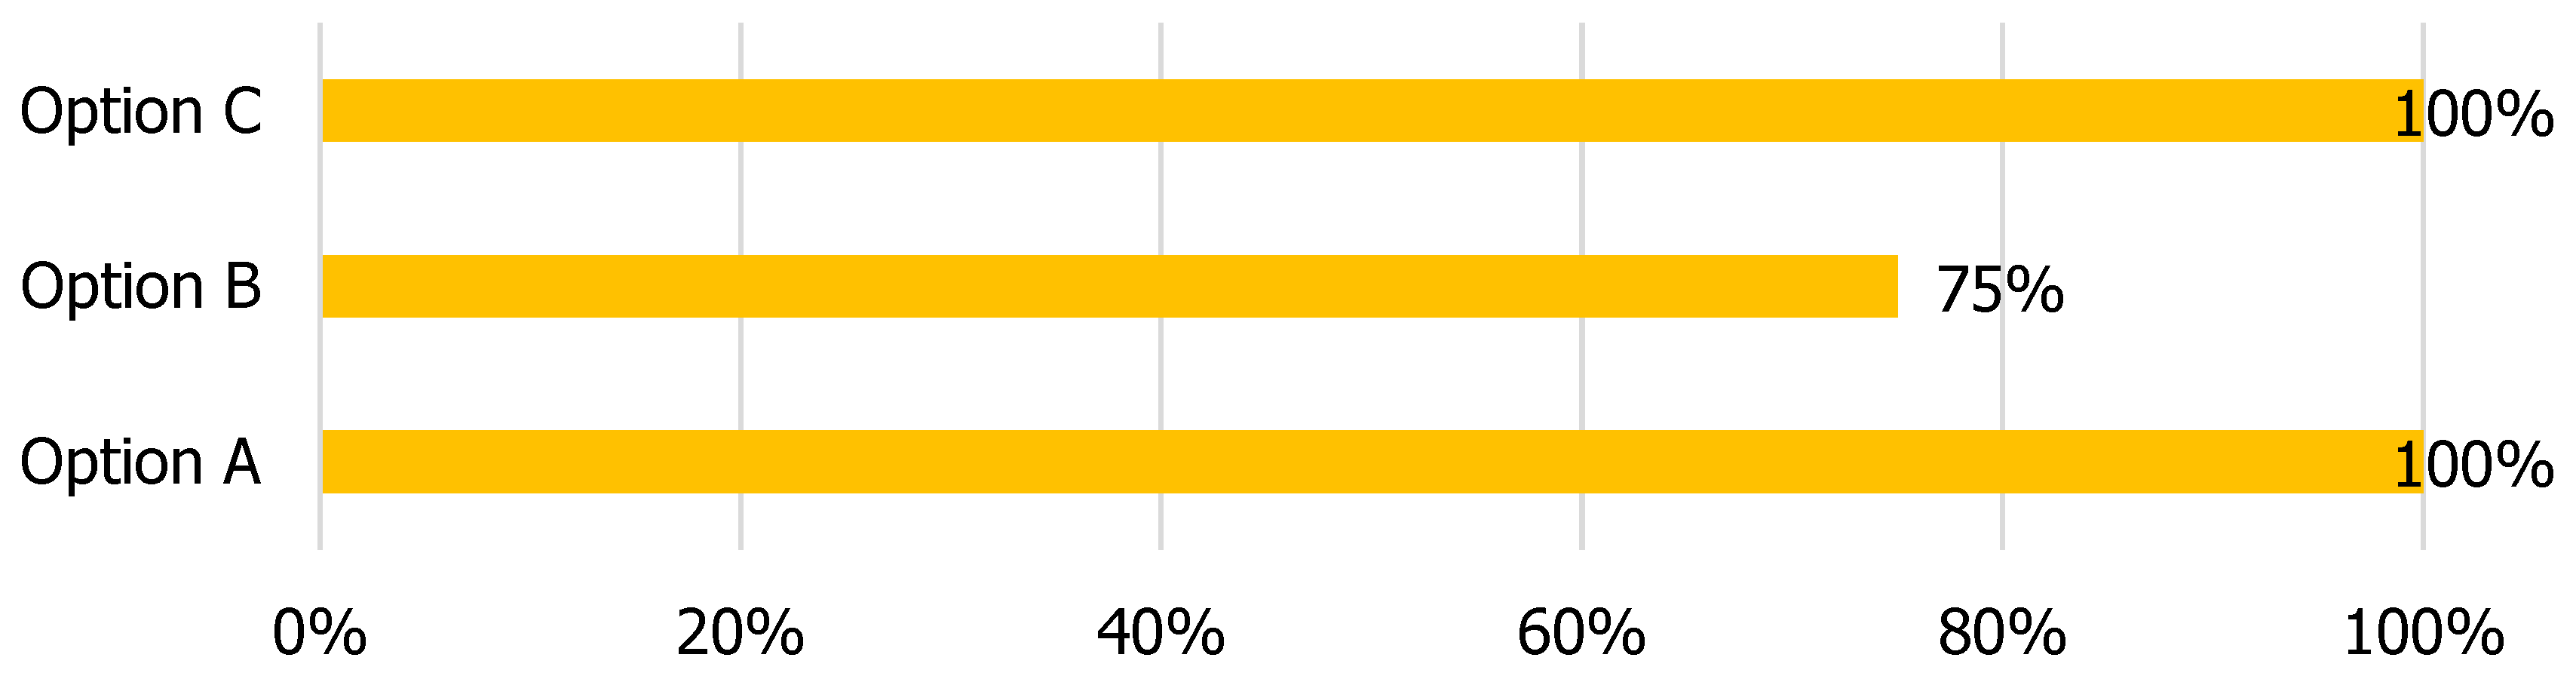
3.7. Energy Savings for All Three Configurations

Out of all the three configurations, option B was the more energy efficient. Option B’s annual energy consumption was 7300/kWh, which is 25% less energy when compared to the energy consumption of options A and C at 9733.3/kWh. This is because option B uses the minimum number of components to achieve the set point temperature and RH%. Figure 32 provides a comparison of the overall energy consumptions of all three control configurations.

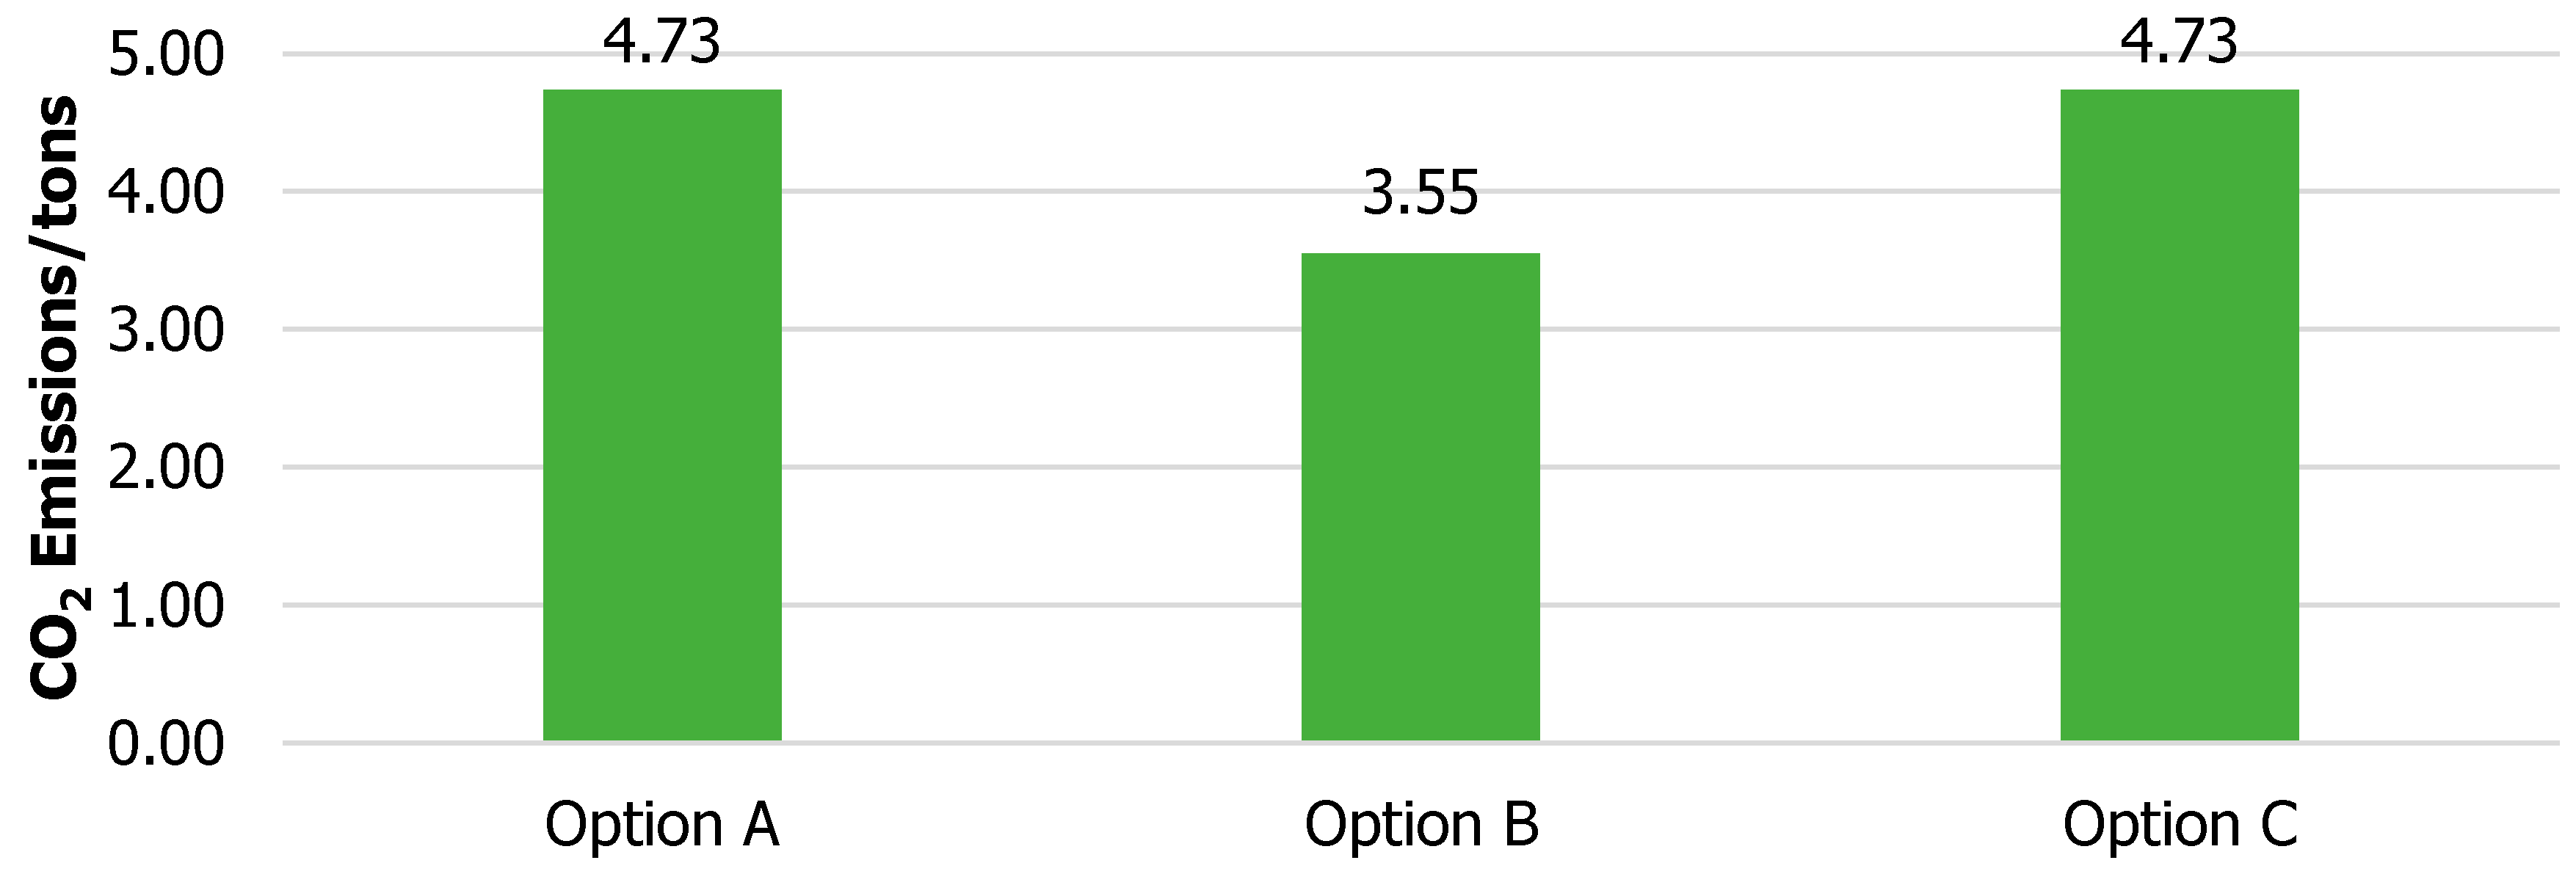
3.8. GHG Mitigation for All Three Configurations

Standard data was taken from EPA for the calculation of CO2 emissions. The energy loads were taken for a year for each of the configurations. Table 3 shows the annual energy consumption in (kWh) and CO2 emissions in Tons. It can be seen in Figure 33 that option B causes the least amount of CO2 to be released when compared to options A and C. Figure 34 shows that by using control configuration B, there were 3.55 tons of CO2 emissions, which is 25% less than options A and C at includes 4.73 tons of CO2 emissions. The CO2 emissions were calculated by using the formula described below.
x kWh × 998.4 lbs. CO2/MWh generated × 1/(1 − 0.069) MWh delivered/MWh generated × 1 MWh/100
kWh × 1 metric ton/2204.6 lb.

4. Conclusions

A control system for a clean room environment was designed and evaluated for optimal performance for the climatic conditions of Islamabad, Pakistan. Three process control configurations were developed and designated as A, B and C. A process temperature of 23 °C, relative humidity of 40%, and an acceptable particle limit of less than 0.3 μm were selected as conditions to be met for a room volume of 185.6 m3. All three of the control configurations (A, B, and C) successfully managed to maintain the set-point temperature. Control configurations B and C achieved the relative humidity at 40% successfully; however, the control configuration A only achieved a relative humidity of 36%, which is within acceptable limits (~10%). Control configuration B resulted the most energy savings, as it consumed 25% less energy than control configurations A and C. Configuration B is also most environment friendly, as it emitted 25% fewer CO2 emissions compared to the other two. Hence, the simulation indicates that control configuration B is the most energy and environmentally friendly configuration for a control system for a clean room environment for the climatic conditions of Islamabad, Pakistan.
The next research step in this area would be to include digital twin optimization based on data-driven methods, as adapted in other energy systems [48,49,50,51].

Author Contributions

All authors equally contributed to the conceptualization, methodology, software, validation, formal analysis, investigation, resources, data curation, writing—original draft preparation, writing—review and editing, visualization, supervision, project administration, and funding acquisition. All authors have read and agreed to the published version of the manuscript.

Funding

This research received no external funding.

Institutional Review Board Statement

Not applicable.

Informed Consent Statement

Not applicable.

Data Availability Statement

Not applicable.

Conflicts of Interest

The authors declare no conflict of interest. The funders had no role in the design of the study; in the collection, analyses, or interpretation of data; in the writing of the manuscript; or in the decision to publish the results.

References

  1. Mills, E. Energy efficiency in California laboratory-type facilities. In Energy and Environment Division; Ernest Orlando Lawrence Berkeley National Laboratory: Berkeley, CA, USA, 1996. [Google Scholar]
  2. Shan, K.; Wang, S. Energy efficient design and control of cleanroom environment control systems in subtropical regions–A comparative analysis and on-site validation. Appl. Energy 2017, 204, 582–595. [Google Scholar] [CrossRef]
  3. Brown, W.K. Makeup air systems energy-saving opportunities. ASHRAE Trans. 1990, 96. [Google Scholar]
  4. Zaragoza, S. Need for clean rooms growing rapidly. Dallas Bus. J. 2002, 21, B10. [Google Scholar]
  5. Nelissen, J. Five Forces Driving Energy Efficiency in Next-Gen Cleanroom Design. Available online: https://www.google.com/url?sa=t&rct=j&q=&esrc=s&source=web&cd=&cad=rja&uact=8&ved=2ahUKEwiFgZGzurX7AhWqi_0HHfe0DiUQFnoECA8QAw&url=https%3A%2F%2Fwww.cleanroomtechnology.com%2Fnews%2Farticle_page%2FFive_forces_driving_energy_efficiency_in_next-gen_cleanroom_design%2F151385%23%3A~%3Atext%3DCleanrooms%2520consume%2520large%2520amounts%2520of%2C0.06kW%252Fsqm).&usg=AOvVaw18bmky3QH4X_tAA6oXecJ1 (accessed on 17 November 2022).
  6. Tschudi, W.; Mills, E.; Xu, T.; Rumsey, P. Measuring and Managing Cleanroom Energy Use; Lawrence Berkeley National Lab. (LBNL): Berkeley, CA, USA, 2005; ISSN 0017-940X. [Google Scholar]
  7. Masson-Delmotte, V.; Zhai, P.; Pörtner, H.O.; Roberts, D.; Skea, J.; Shukla, P.R.; Pirani, A.; Moufouma-Okia, W.; Péan, C.; Pidcock, R.; et al. An IPCC Special Report on the impacts of global warming of 1.5°C above pre-industrial levels and related global greenhouse gas emission pathways, in the context of strengthening the global response to the threat of climate change, sustainable development, and efforts to eradicate poverty. In IPCC Special Report: Global Warming of 1.5 °C Intergovernmental Panel on Climate Change; IPCC: Geneva, Switzerland, 2018. [Google Scholar]
  8. Sreekanth, K. Review on integrated strategies for energy policy planning and evaluation of GHG mitigation alternatives. Renew. Sustain. Energy Rev. 2016, 64, 837–850. [Google Scholar] [CrossRef]
  9. Union, E. 2030 Climate & Energy Framework. Available online: https://ec.europa.eu/clima/policies/strategies/2030_en (accessed on 6 July 2021).
  10. Zhuang, C.; Wang, S.; Shan, K. Probabilistic optimal design of cleanroom air-conditioning systems facilitating optimal ventilation control under uncertainties. Appl. Energy 2019, 253, 113576. [Google Scholar] [CrossRef]
  11. Levy, J.M.; Ohadi, M.M.; Choo, K. Energy Analysis of Cleanrooms in an Academic Research Building. ASHRAE Trans. 2015, 121, 71–84. [Google Scholar]
  12. Kim, M.-H.; Kwon, O.-H.; Jin, J.-T.; Choi, A.-S.; Jeong, J.-W. Energy saving potentials of a 100% outdoor air system integrated with indirect and direct evaporative coolers for clean rooms. J. Asian Archit. Build. Eng. 2012, 11, 399–405. [Google Scholar] [CrossRef] [Green Version]
  13. Zhuang, C.; Wang, S.; Shan, K. Adaptive full-range decoupled ventilation strategy and air-conditioning systems for cleanrooms and buildings requiring strict humidity control and their performance evaluation. Energy 2019, 168, 883–896. [Google Scholar] [CrossRef]
  14. Satoshi, U.; Iijima, K.; Takahashi, M.; Ohmi, T. Estimate on CO2 emissions reduction effects achieved by the adoption of a water spray humidification system to clean rooms. In Proceedings of the 2007 International Symposium on Semiconductor Manufacturing, Santa Clara, CA, USA, 15–17 October 2007; pp. 1–4. [Google Scholar]
  15. TRNSYS. TRNSYS Applications TRNSYS. Available online: http://www.trnsys.com/#2 (accessed on 6 July 2021).
  16. Raza, H.A.; Ahmed, A.B.; Janjua, A.K.; Ali, M.; Sattar, M.; Afridi, M.Z.U.A. Performance analysis and cost reduction of Brayton Cycle based Solar Thermal Tower Power Plant using TRNSYS. In Proceedings of the 2020 IEEE 23rd International Multitopic Conference (INMIC), Bahawalpur, Pakistan, 5–7 November 2020; pp. 1–6. [Google Scholar]
  17. Jani, D.; Mishra, M.; Sahoo, P. Performance analysis of a solid desiccant assisted hybrid space cooling system using TRNSYS. J. Build. Eng. 2018, 19, 26–35. [Google Scholar] [CrossRef]
  18. Ibanez, M.; Lázaro, A.; Zalba, B.; Cabeza, L.F. An approach to the simulation of PCMs in building applications using TRNSYS. Appl. Therm. Eng. 2005, 25, 1796–1807. [Google Scholar] [CrossRef]
  19. Kircher, K.; Shi, X.; Patil, S.; Zhang, K.M. Cleanroom energy efficiency strategies: Modeling and simulation. Energy Build. 2010, 42, 282–289. [Google Scholar] [CrossRef]
  20. Beckman, W.A.; Broman, L.; Fiksel, A.; Klein, S.A.; Lindberg, E.; Schuler, M.; Thornton, J. TRNSYS The most complete solar energy system modeling and simulation software. Renew. Energy 1994, 5, 486–488. [Google Scholar] [CrossRef]
  21. Shirazi, A.; Pintaldi, S.; White, S.D.; Morrison, G.L.; Rosengarten, G.; Taylor, R.A. Solar-assisted absorption air-conditioning systems in buildings: Control strategies and operational modes. Appl. Therm. Eng. 2016, 92, 246–260. [Google Scholar] [CrossRef]
  22. Yu, K.; Cao, Z.; Liu, Y. Research on the optimization control of the central air-conditioning system in university classroom buildings based on TRNSYS software. Procedia Eng. 2017, 205, 1564–1569. [Google Scholar] [CrossRef]
  23. Sun, J.; Hu, G.; Spanos, C.J. Development and verification of a multizone building HVAC model with TRNSYS. In Proceedings of the 2017 12th IEEE Conference on Industrial Electronics and Applications (ICIEA), Siem Reap, Cambodia, 18–20 June 2017; pp. 887–894. [Google Scholar]
  24. Thomas, S.; André, P. Dynamic simulation of a complete solar assisted air-conditioning system in an office building using TRNSYS. In Proceedings of the Eleventh International IBPSA Conference, Glasgow, Scotland, 27–30 July 2009. [Google Scholar]
  25. Bogatu, D.-I.; Carutasiu, M.-B.; Ionescu, C.; Necula, H. Validation of a TRNSYS Model for a Complex HVAC System Installed in a Low-Energy Building. Upb Sci. Bull. Ser. C Electr. Eng. Comput. Sci. 2019, 81, 245–260. [Google Scholar]
  26. Ahmadzadehtalatapeh, M.; Yau, Y. The application of heat pipe heat exchangers to improve the air quality and reduce the energy consumption of the air conditioning system in a hospital ward—A full year model simulation. Energy Build. 2011, 43, 2344–2355. [Google Scholar] [CrossRef]
  27. Zhuang, C.; Wang, S. Uncertainty-based robust optimal design of cleanroom air-conditioning systems considering life-cycle performance. Indoor Built Environ. 2020, 29, 1214–1226. [Google Scholar] [CrossRef]
  28. Bouzenada, S.; McNevin, C.; Harrison, S.; Kaabi, A. Performance of a liquid desiccant air-conditioner driven by evacuated-tube, flat-plate, or hybrid solar thermal arrays. Energy Build. 2016, 117, 53–62. [Google Scholar] [CrossRef]
  29. Li, Q.; Zheng, C.; Shirazi, A.; Mousa, O.B.; Moscia, F.; Scott, J.A.; Taylor, R.A. Design and analysis of a medium-temperature, concentrated solar thermal collector for air-conditioning applications. Appl. Energy 2017, 190, 1159–1173. [Google Scholar] [CrossRef]
  30. Al-Hyari, L.; Kassai, M. Development of TRNSYS model for energy performance simulation of variable refrigerant flow air-conditioning system combined with energy recovery ventilation. Int. J. Green Energy 2021, 18, 390–401. [Google Scholar] [CrossRef]
  31. Wei, H.; Liding, C. Modeling and simulation of a water-cooled central air conditioning system based on Trnsys. System Simul. Technol. 2011, 218–222. [Google Scholar]
  32. Jani, D.B.; Bhabhor, K.; Dadi, M.; Doshi, S.; Jotaniya, P.V.; Ravat, H.; Bhatt, K. A review on use of TRNSYS as simulation tool in performance prediction of desiccant cooling cycle. J. Therm. Anal. Calorim. 2020, 140, 2011–2031. [Google Scholar] [CrossRef]
  33. Eguía, P.; Granada, E.; Alonso, J.; Arce, E.; Saavedra, A. Weather datasets generated using kriging techniques to calibrate building thermal simulations with TRNSYS. J. Build. Eng. 2016, 7, 78–91. [Google Scholar] [CrossRef]
  34. Vuong, E.; Kamel, R.S.; Fung, A.S. Modelling and simulation of BIPV/T in EnergyPlus and TRNSYS. Energy Procedia 2015, 78, 1883–1888. [Google Scholar] [CrossRef] [Green Version]
  35. Kalogirou, S.A. Use of TRNSYS for modelling and simulation of a hybrid pv–thermal solar system for Cyprus. Renew. Energy 2001, 23, 247–260. [Google Scholar] [CrossRef]
  36. Asim, M.; Dewsbury, J.; Kanan, S. TRNSYS simulation of a solar cooling system for the hot climate of Pakistan. Energy Procedia 2016, 91, 702–706. [Google Scholar] [CrossRef]
  37. Fatima, H.M.; Sajid, M.B.; Badar, A.W. Design of a combined solar thermal water and space heating system for a commercial building in climatic conditions of Islamabad, Pakistan. In Proceedings of the 2017 13th International Conference on Emerging Technologies (ICET), Islamabad, Pakistan, 27–28 December 2017; pp. 1–6. [Google Scholar]
  38. Mehmood, S.; Maximov, S.A.; Chalmers, H.; Friedrich, D. Energetic, Economic and Environmental (3E) Assessment and Design of Solar-Powered HVAC Systems in Pakistan. Energies 2020, 13, 4333. [Google Scholar] [CrossRef]
  39. Whyte, W. Cleanroom Technology: Fundamentals of Design, Testing and Operation, 2nd ed.; John Wiley & Sons: Hoboken, NJ, USA, 2010; p. 321. [Google Scholar]
  40. Sosnowski, M.; Gnatowska, R.; Grabowska, K.; Krzywański, J.; Jamrozik, A. Numerical analysis of flow in building arrangement: Computational domain discretization. Appl. Sci. 2019, 9, 941. [Google Scholar] [CrossRef] [Green Version]
  41. Trivedi, D.; Badarla, V. Occupancy detection systems for indoor environments: A survey of approaches and methods. Indoor Built Environ. 2020, 29, 1053–1069. [Google Scholar] [CrossRef]
  42. Li, W.; Wang, S. A multi-agent based distributed approach for optimal control of multi-zone ventilation systems considering indoor air quality and energy use. Appl. Energy 2020, 275, 115371. [Google Scholar] [CrossRef]
  43. Azar, E.; Nikolopoulou, C.; Papadopoulos, S. Integrating and optimizing metrics of sustainable building performance using human-focused agent-based modeling. Appl. Energy 2016, 183, 926–937. [Google Scholar] [CrossRef]
  44. Bahdad, A.A.S.; Fadzil, S.F.S.; Onubi, H.O.; BenLasod, S.A. Balancing daylight in office spaces with respect to the indoor thermal environment through optimization of light shelves design parameters in the tropics. Indoor Built Environ. 2022, 2022, 1420326X221086537. [Google Scholar]
  45. Bichiou, Y.; Krarti, M. Optimization of envelope and HVAC systems selection for residential buildings. Energy Build. 2011, 43, 3373–3382. [Google Scholar] [CrossRef]
  46. Nielsen, T.R. Optimization of Buildings with Respect to Energy and Indoor Environment; BYG. DTU: Kongens Lyngby, Denmark, 2002. [Google Scholar]
  47. Pellizzi, R.J. Environmental Control: Building the Right Cleanroom Environment. Available online: https://www.mddionline.com/contract-manufacturing/environmental-control-building-right-cleanroom-environment (accessed on 21 September 2022).
  48. Tariq, R.; Abatal, M.; Bassam, A. Computational intelligence for empirical modeling and optimization of methylene blue adsorption phenomena using available local zeolites and clay of Morocco. J. Clean. Prod. 2022, 370, 133517. [Google Scholar] [CrossRef]
  49. Tariq, R.; Torres-Aguilar, C.E.; Sheikh, N.A.; Ahmad, T.; Xamán, J.; Bassam, A. Data engineering for digital twining and optimization of naturally ventilated solar façade with phase changing material under global projection scenarios. Renew. Energy 2022, 187, 1184–1203. [Google Scholar] [CrossRef]
  50. Tariq, R.; Torres-Aguilar, C.E.; Xamán, J.; Zavala-Guillén, I.; Bassam, A.; Ricalde, L.J.; Carvente, O. Digital twin models for optimization and global projection of building-integrated solar chimney. Build. Environ. 2022, 213, 108807. [Google Scholar] [CrossRef]
  51. Tariq, R.; Cetina-Quiñones, A.J.; Cardoso-Fernández, V.; López, D.A.H.; Soberanis, M.A.E.; Bassam, A.M.; de Lille, V. Artificial intelligence assisted technoeconomic optimization scenarios of hybrid energy systems for water management of an isolated community. Sustain. Energy Technol. Assess. 2021, 48, 101561. [Google Scholar] [CrossRef]
Figure 1. Layout for option A.
Buildings 12 02158 g001
Figure 2. Psychometric chart for option A.
Buildings 12 02158 g002
Figure 3. Layout for option B.
Buildings 12 02158 g003
Figure 4. Psychometric chart for option B.
Buildings 12 02158 g004
Figure 5. Layout for option C.
Buildings 12 02158 g005
Figure 6. Psychometric chart for option C.
Buildings 12 02158 g006
Figure 7. TRNSYS layout for option A.
Buildings 12 02158 g007
Figure 8. 1st January simulation run for option A.
Buildings 12 02158 g008
Figure 9. January simulation run for option A.
Buildings 12 02158 g009
Figure 10. 1st June simulation run for configuration A.
Buildings 12 02158 g010
Figure 11. June simulation run for configuration A.
Buildings 12 02158 g011
Figure 12. One year simulation run for option A.
Buildings 12 02158 g012
Figure 13. TRNSYS layout for option B.
Buildings 12 02158 g013
Figure 14. 1st January simulation run for option B.
Buildings 12 02158 g014
Figure 15. 1st June simulation run for option B.
Buildings 12 02158 g015
Figure 16. January simulation run for Option B.
Buildings 12 02158 g016
Figure 17. June simulation run for option B.
Buildings 12 02158 g017
Figure 18. One year simulation run for Option B.
Buildings 12 02158 g018
Figure 19. TRNSYS layout for option C.
Buildings 12 02158 g019
Figure 20. 1st January simulation run for option C.
Buildings 12 02158 g020
Figure 21. January month simulation run for option C.
Buildings 12 02158 g021
Figure 22. June 1st simulation run for option C.
Buildings 12 02158 g022
Figure 23. June simulation run for option C.
Buildings 12 02158 g023
Figure 24. One year simulation run for option C.
Buildings 12 02158 g024
Figure 25. Temperature comparison for the month of June. Note: All the options, A, B and C, have a same set point temperature of 23 °C, so that is why all the lines are merged and displayed as a single yellow line.
Buildings 12 02158 g025
Figure 26. Temperature comparison for the month of January. Note: All the options, A, B and C, have a same set point temperature of 23 °C, so that is why all the lines are merged and displayed a single yellow line.
Buildings 12 02158 g026
Figure 27. RH% comparison for the month of January. Note: option B and option C had the same relative humidity, with a value of 40%. The results for option B and option C are merged and displayed a single yellow line.
Buildings 12 02158 g027
Figure 28. RH Comparison for the month of June. Note: option B and option C had the same relative humidity, with a value of 40.5%. The results for option B and option C are merged and displayed a single yellow line.
Buildings 12 02158 g028
Figure 29. Cooling load comparison.
Buildings 12 02158 g029
Figure 30. Heating load comparison.
Buildings 12 02158 g030
Figure 31. Overall load comparison.
Buildings 12 02158 g031
Figure 32. Comparison of energy consumption.
Buildings 12 02158 g032
Figure 33. Comparison of CO2 emissions.
Buildings 12 02158 g033
Figure 34. Percentage of CO2 emissions released.
Buildings 12 02158 g034
Table 1. ISO 14644-1 cleanroom standards [39].
ClassMaximum Particles/μm.m−3FED STD 209E
Equivalent
≥0.1≥0.2≥0.3≥0.5≥1≥5
ISO 1102-----
ISO 210024104---
ISO 31000237102358-Class 1
ISO 410,0002.370102035283-Class 10
ISO 5100,00023,70010,200352083229Class 100
ISO 61,000,000237,000102,00035,2008320293Class 1000
ISO 7---352,00083,2002930Class 10,000
ISO 8---3,520,000832,00029,300Class 1,000,000
ISO 9---35,200,0008,320,000293,000Room Air
Table 2. Clean room construction details and the climate conditions of Islamabad.
ComponentU Value (W/m2.K)LocationTemperature (°F)
Wall0.30IslamabadAvgJanFebMarAprMayJuneJulyAugSepOctNovDec
Roof0.18High626675859599959291857566
Fenestration1.60 Temp505463738388868380 716052
Low394452 617075777570594840
Door1.8 Humidity (%)
MonJanFebMarAprMayJuneJulyAugSepOctNovDec
-666357494045667366586165
Average Precipitation
MonJanFebMarAprMayJuneJulyAugSepOctNovDec
mm6595110805580275290100352545
Inch2.63.74.33.12.23.110.811.43.91.411.8
Days5710108816169434
Wind Speed (kph)
MonJanFebMarAprMayJuneJulyAugSepOctNovDec
-9911131414161412975
Table 3. Annual energy consumption and CO2 emissions for three tested configurations.
ConfigurationAnnual Energy Consumption/kWhAnnual CO2 Emissions/Tons
A9733.34.73
B73003.55
C9733.34.73
Publisher’s Note: MDPI stays neutral with regard to jurisdictional claims in published maps and institutional affiliations.

