Article

Design Method for Reinforced Concrete Based on Bond-Slip Energy Consumption

1
Henan Province Engineering Laboratory for Eco-Architecture and the Built Environment, Henan Polytechnic University, Jiaozuo 454003, China
2
State Key Laboratory for Geomechanics and Deep Underground Engineering, China University of Mining and Technology, Xuzhou 221116, China
3
International Joint Research Laboratory of Henan Province for Underground Space Development and Disaster Prevention, Henan Polytechnic University, Jiaozuo 454003, China
4
Civil Engineering Department of Civil Engineering & Materials Science, University of Limerick, V94T9PX Dublin, Ireland
*
Author to whom correspondence should be addressed.
Buildings 2022, 12(12), 2065; https://doi.org/10.3390/buildings12122065
Submission received: 27 October 2022 / Revised: 19 November 2022 / Accepted: 23 November 2022 / Published: 25 November 2022

Abstract

:
To reveal the energy consumption characteristics of a steel bar and all-lightweight shale ceramsite concrete (ALWSCC), focusing on hot rolled crescent ribbed bars (CRB) and hot rolled plain steel bars (PSB), a series of pull-out tests were carried out. The bonding failure modes, the contribution of the ribs to bond-slip failure and the energy consumption characteristics were analyzed based on the curves of pull-out load F-slip displacement S and energy consumption W–slip displacement S. Results show that the splitting failure is the main failure of the CRB specimen, and the pulling out failure is the main failure of the PSB one. The ratio of the total energy dissipation of splitting failure to that of the pulling out failure is less than 30%. The mechanical bite force between CRB and concrete contributes more than 95% to the bond strength. The pull-out force is divided into four stages, such as the chemical adhesive force stage (elastic and micro-elastic strain stage), the common-effect stage of mechanical bearing force and static frictional force (plastic development stage), and the frictional force stage (crushed stage). The new design is proposed to guarantee the ductility of the reinforced concrete structure, which is based on the bond-slip energy consumption rather than the traditional strength design. The conclusions provide a reference to the reinforced concrete practice.

Graphical Abstract

1. Introduction

The bonding force is the result of cooperation between the bar and the concrete and also a basic condition of the reinforced concrete component. However, the bonding strengths differ with different kinds of bars [1,2,3]. In China, the most commonly used types of bars are CRB (crescent ribbed bar) and PSB (plain steel bar). Based on pull-out tests of CRB and PSB, the bond strength consists of a chemical cementing force, a frictional resistance, and a mechanical interlocking force [4,5].
Since the buildup of the bond force is not only complex but also has many influencing factors, the more accurate mathematical models on bond strength and bond-slip constitutive models are difficult to determine based on the limited test results. Therefore, the relevant models at present, including those just mentioned, are almost semi-empirical models. For example, some scholars have developed the bond-slip model through numerical simulation or physical tests [6,7,8,9]. Coccia et al. [10] proposed a model to forecast and assess the failure mode of reinforced concrete members based on the analysis of a bond-slip model confined with stirrups. Ichinosea et al. [11] studied the diameter effect of the bar and the shape of the rib on the bond strength and explained the bonding mechanism. The above publications gave different bond-slip models based on pull-out tests, but they are essentially some explanations of the bond-slip mechanism. There is a scarcity of studies into the bonding behavior between the bar and lightweight aggregate concrete (LWAC), especially ALWSCC.
Valente and Cruz [12] focused on the bonding behavior of the shear connection between steel and LWAC by push-out tests, and they found its tendency to a higher deformation capacity compared with normal weight concrete (NWC). Ma et al. [13] found the creep behavior of the reinforced concrete columns subjected to high sustained loads. Bogas et al. [14] studied the effect of material parameters of LWAC and steel on the bond strength compared with NWC and suggested a new approach to estimate the bond strength of LWAC. Casanova et al. [15] presented a new finite element method to simulate the bond behavior between steel and LWAC, which could improve the description of the cracking process. Tariq and Bhargava [16] investigated the bond-slip response for super ductile steel with concrete.
This study focused on the CRB and PSB usually used in engineering construction in China and pull-out tests based on ALWSCC. Two kinds of virtual ribs were proposed, and their energy consumption characteristics were analyzed, which could provide a reference for the design of new steel bars and bond-slip performance analysis. Moreover, to differentiate LWACs made of different kinds of LWAs, concrete made of lightweight coarse and fine aggregates was called all-lightweight aggregate concrete (ALWAC). The term “ALWAC” first appeared in 1972 based on [17], and then in 1976, and also includes the term “lightweight concrete (LWC)” [18]. In China, the terms “ALWAC” and “full lightweight aggregate concrete (FLWAC)” have been widely used [19,20], as in other countries [21,22,23].
LWAC has a wide range of sources, including expanded shale ceramsite, spontaneous combustion coal gangue, expanded clay ceramsite, expanded flash ash ceramsite, natural pumice, expanded perlite, plastic waste, expanded polystyrene (EPS) beads, expanded polyethylene (EPT) beads, oil palm shell (OPS), and oil-palm-boiler clinker (OPBC). However, due to the difference between the bulk density and the tube crushing strength, which leads to the complexity of the mix design of LWAC, the current standard (ASTM and FIB Model Code 2010) cannot solve the design problem of the mix ratio of all lightweight materials. However, for the bond-slip model, there has not been much change to date [24]. According to the Chinese standards and parameter requirements for the mix design of medium and low strength grade pumped concrete, the bond-slip performance of LWAC for different types of steel bars was studied by using shale ceramsite and shale terracotta produced in China as light aggregate.
Aiming to determine the internal mechanism of the bond-slip of the reinforced concrete structures, many scholars have focused on constitutive models for bond-slip performance between the steel bar and concrete in order to reflect the concrete material properties, the steel types and their protective thickness, the anchoring state, and constraint conditions. By discussing the energy dissipation in the process of bond-slip, this study was intended to reveal the internal relationship from the energy dissipation angle, and we researched the feasibility of using the energy method to design the reinforced concrete structures to put forward a new idea for the design of a similar engineering practice.

2. Materials and Methods

2.1. Materials

Shale ceramsite (SC): The nominal max-diameter of gravel coarse aggregates is 15 mm, the bulk density of which is 660 kg/m3. Shale pottery (SP): Fine aggregates, the nominal max-diameter of SP is 5 mm, the bulk density of which is 880 kg/m3. The SC and SP meet the Chinese standards GB/T17431.1-2010 and GB/T17431.2-2010 [25,26], and both of their colors are green-gray. The cumulative percentage retained (mass, %) used by a square hole sieve and cylinder compressive strength (MPa) for SC and SP are given in Table 1.
Cement (C): P·O42.5R Portland cement meets the Chinese standard GB175-2007 [27]. Fly ash (FA): Grade-Ⅱ fly ash meets the Chinese standard GB/T1596-2005 [28]. Superplasticizer (S-P): Naphthalene series superplasticizer meets the Chinese standard GB8076-2008 [29]. Water: The running water meets the Chinese standard JGJ63-2006 [30].
The proportions for the mixtures are given in Table 2 and meet the Chinese standard GB/T174131.2-2010 [26], lightweight aggregate concrete JGJ51-2002 [19], and normal weight concrete GB50010-2012 [31]. The concrete is compounded by pumping concrete, and the slump is 165–190 mm.
Compared with NWC, LWAC can not only reduce its own weight by 25–35% [32] or 15–30% [33] at the same strength level but also has greater deformability and better energy consumption, so it is widely used in various structures that reduce self-weight and resist deformation. The compressive strength of the shale ceramsite selected in Table 1 is low, and only the mix ratio of lower strength grade concrete is used as an example. Since the lower the strength of the concrete, the smaller the mechanical engagement force and friction coefficient with the steel, the peak slip and the total slip are relatively large, and the test results below also verify this rule. PSB and CRB were used in this study that meet Chinese standards GB1499.1-2012 [34] and GB1499.2-2012 [35], respectively. The external features, specifications, and mechanical parameters for CRB are shown in Figure 1, Table 3 and Table 4, respectively.
In this study, there were three groups of LWCB-1, LWCB-2, and LWCB-3 ribbed steel pull-out specimens; in each group, three kinds of pull-out specimens with steel diameters of 12 mm, 16 mm, and 20 mm were adopted. A total of nine ribbed steel pull-out specimens were selected. Three drawing specimens of LWCSB-1 with an anchorage length of 100 mm and different steel bar diameters were added, and a group of three optical circular steel bars were set, so there were a total of 15 drawing specimens.

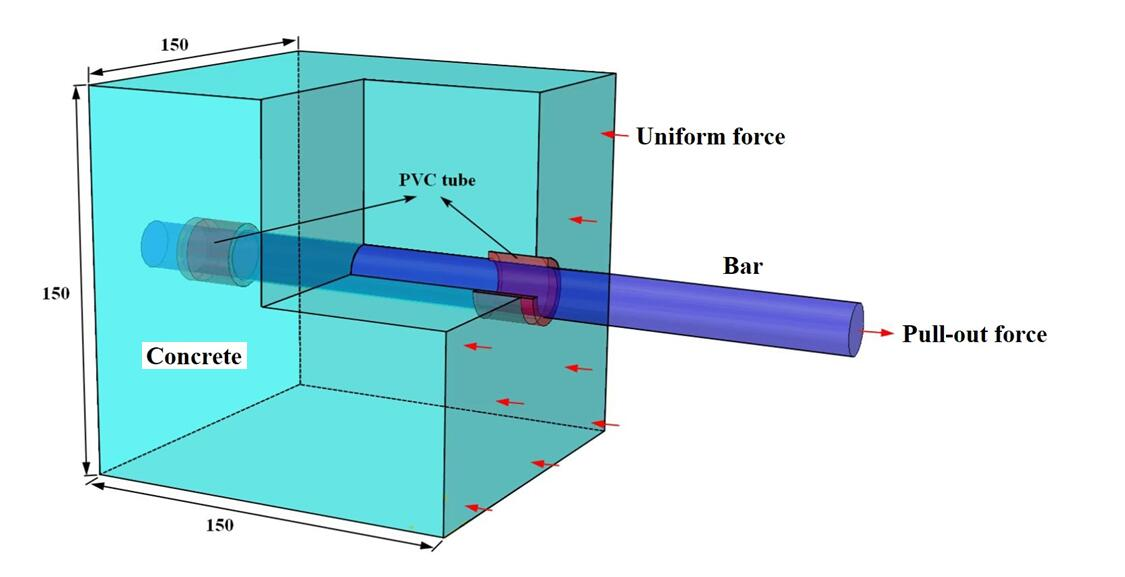
2.2. Pull-Out Test Procedure

The cube specimen was 150 × 150 × 150 mm3. The embedment length of steel bar la is 50 mm and 100 mm, respectively, and there is no lateral restraint. Two polyvinyl chloride (PVC) tubes were pre-embedded to avoid end effects [14,36], as shown in Figure 2. The pull-out test refers to SL352-2006 [37] and GB50152-2012 [38].
As seen from Figure 3, the electro-hydraulic servo universal testing machine was used for loading (the displacement sensor being calibrated before the test) in the test, and the specimen was placed in the designed hanging basket. The clamping rod of the hanging basket was clamped on the testing machine, and the long section of the steel bar of the specimen was clamped by the clamping head. The testing machine was used to preload the specimen with 5 kN to eliminate mechanical errors, and the formal loading mode was displacement loading until the specimen failed.
The maximum load capacity of the testing machine was 1000 kN, and the loading rate was 6 kN/min. The test was regarded as a failure and the loading stopped when the specimen experienced splitting failure (SF) or pull-out failure (POF). The curves of the pull-out load F to slip displacement S were automatically displayed on the computer.

3. Results and Discussion

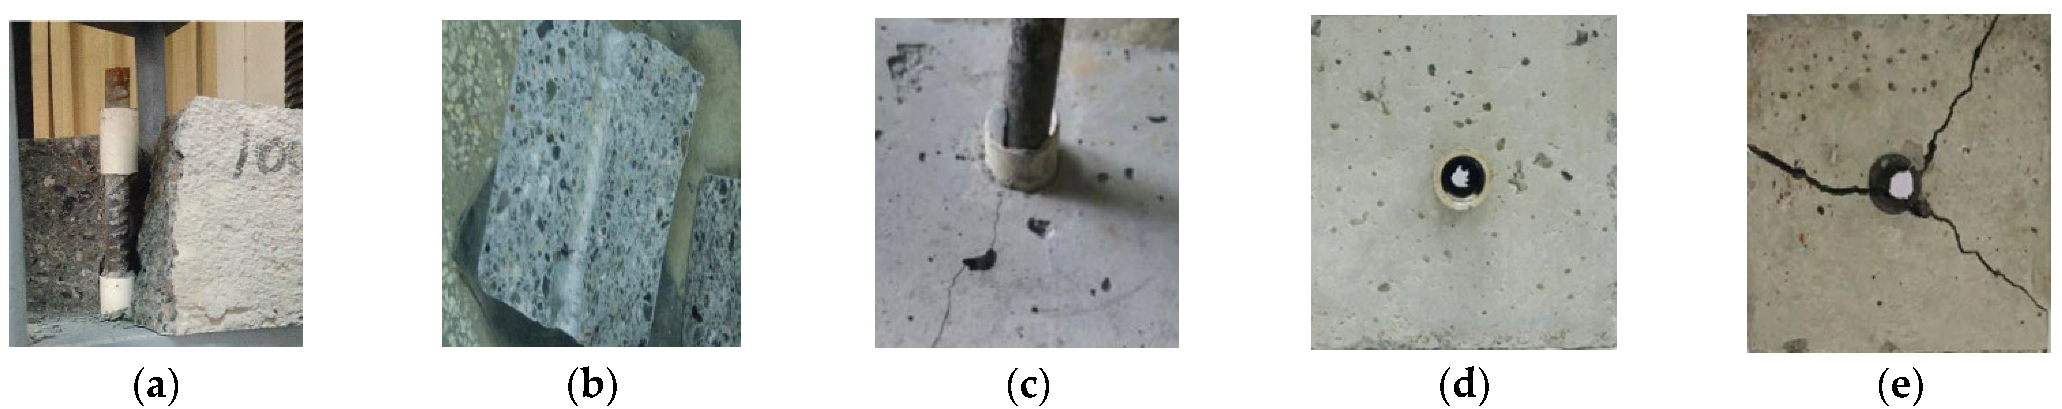
3.1. Failure Mode and Mechanical Characteristics

All specimens were cured by standard concrete for 28 days according to the Chinese standard (GB/T 50152-2012). For the pull-out specimens, only SF or POF occurred irrespective of which of the mixes in Table 2 was used, which of the bars listed in Table 3 and Table 4, or which anchorage length of la = 50 mm or la = 100 mm. However, only POF happened with the specimen used by PSB, as shown in Figure 4.
For example, in Figure 4a, there is a double rough surface, but a double smooth surface can be seen in Figure 4b. Although there is only a crack on the top and it seemed to be complete in Figure 4c, it will split into two separate parts when tapped slightly by a hammer and can be seen as a double smooth surface. As shown Figure 4d, there are no cracks on the surface, with only a hole left for PSB. As shown in Figure 4e, there is a penetrating crack and another almost vertical crack for CRB. The specimen could have burst from the bonding surfaces and separated into some parts, associated with a bang, when the SF occurred. However, when a POF occurred, the surface of the specimen had fewer or no cracks, which shows the bond stress was present, and the steel bar was pulled out with increasing pull-out load, which corresponds to the classic phenomenon of scrapping-type failure [39].
The correspondence between the pullout load F (kN) of a steel bar and the slip displacement S (mm) was directly obtained from the program-controlled computer of the hydraulic pressure testing machine. The classic FS curves for different pull-out specimens under different conditions are shown in Figure 5. Compared with the two failure modes shown as Figure 5, all of the failure modes are SFs, with only upward slopping curves in the FS curves, while the others are all POFs with complete upward and downward sloping curves in the FS curves. As can be seen from Figure 5, for la = 50 mm, compared with Figure 5a–f, the ultimate pull-out load is larger with larger d. Compared with Figure 5b,d,f, again, the ultimate load is smaller when d is 20 mm. The reason for this is that the coarse aggregates around the steel bar are undamaged, but the mortar interface is damaged according to the test, which causes the ultimate bonding force reduction. In Figure 5g, the mortar leaked because of the sealing leakage of the PVC tube, which affected the effective anchorage length, as in the equation for la = 50 mm and la =100 mm, and the two FS curves are similar.
In order to carry out a precise comparison, the specimens should be compared within a single batch and single group based on the above test phenomena and the analysis of the results. Taking Figure 5h as an example, compared with the two FS curves for group 2, the bonding forces between PSB and concrete are generally composed of chemical cementation force and frictional resistance before slippage and at the initial stage, and the mechanical bearing force [40] is very small relative to CRB during the initial slipping stage [14], which indirectly proves that the bonding force is the main force for the crescent-shaped rib. The interactions between the ribs and concrete are called the wedging actions of the ridges (ribs), including frictional and mechanical bearing force according to [40,41]. The same is shown below.
The bonding stress can be computed by Equation (1) using the mean stress as an approximation [37] because the test pertains to a short anchorage specimen.
τ = F 2 π r l a
where τ is the mean bond stress of the anchorage segment (MPa), F is the pull-out load (kN), r is the nominal radius of the steel bars (mm), and la is the length of anchorage section (mm).
According to the converted corresponding τS curves and the classic shape of fitting curves [42,43] (the typical τS curve was given by China Academy of Building Research through the statistical analysis of 334 pull-out tests for various steel bars and anchoring forms), the fitting curves of τS can be given as Equation (2).
τ = y 0 + A w π 2 e 2 S S c 2 w 2
where y0, A, w, and Sc are undetermined coefficients.

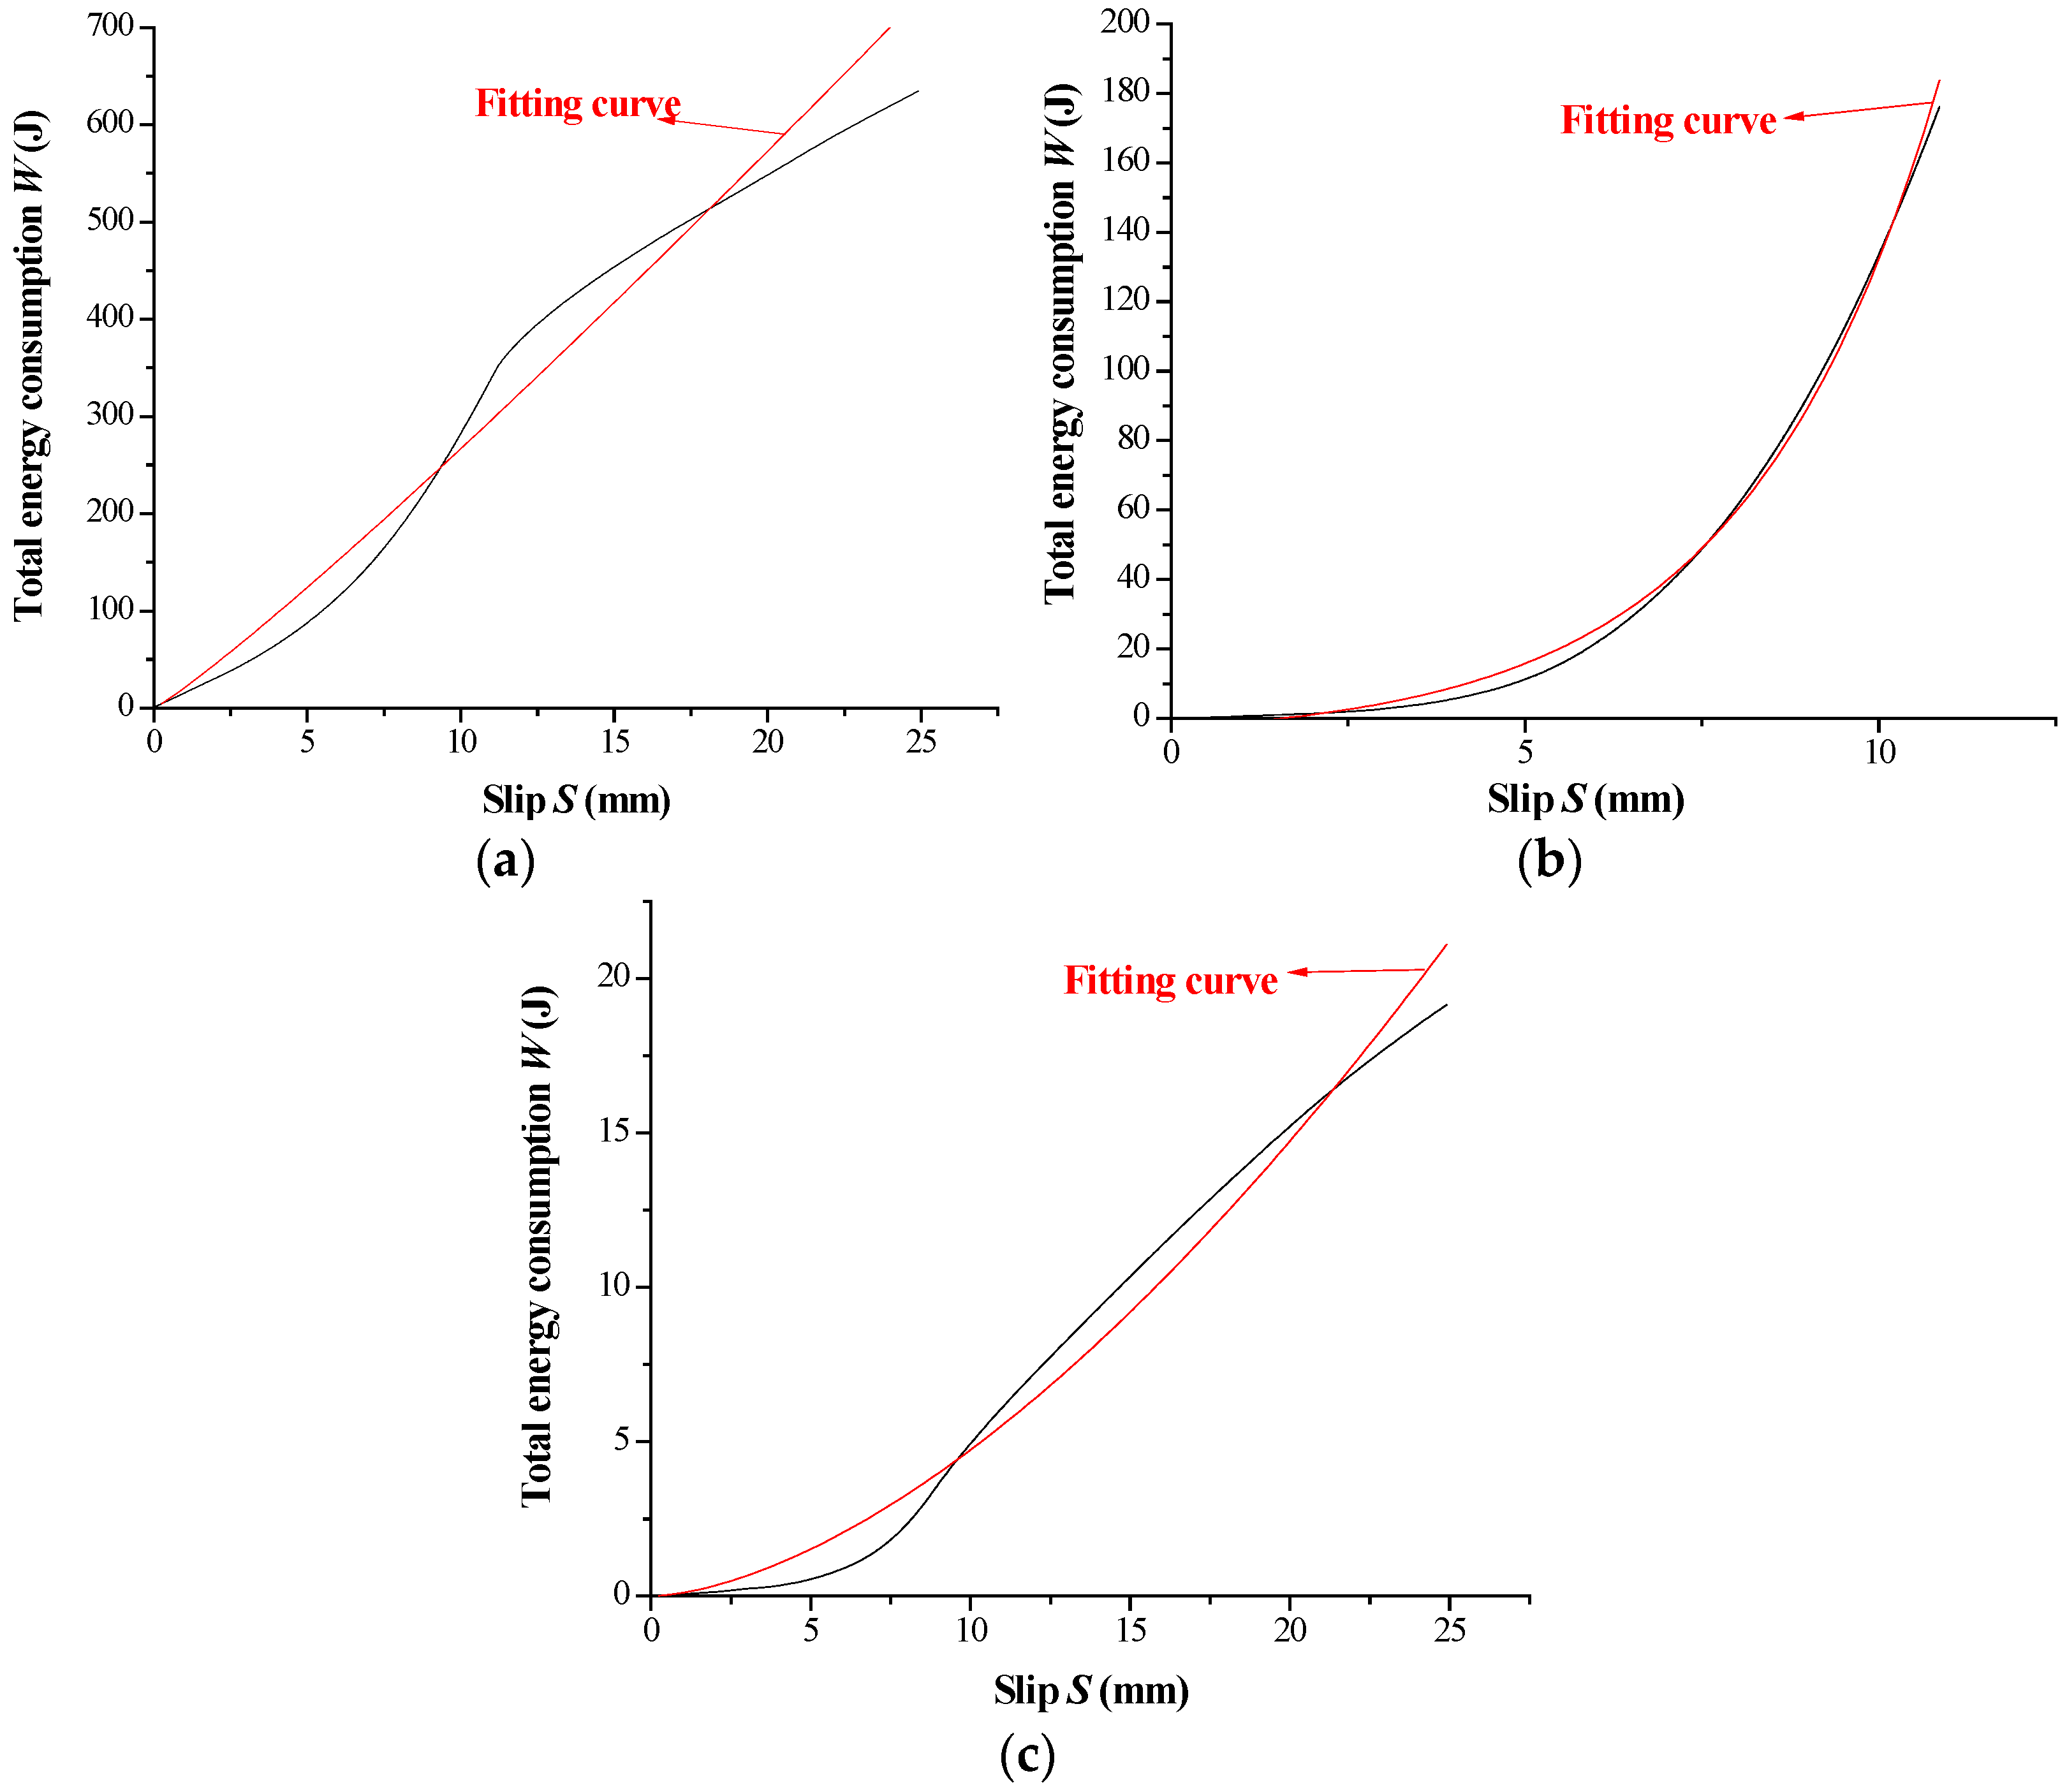
3.2. W-S Curves Analysis of Total Energy Consumption

According to the FS curves and characteristic curves of energy release tested by pull-out tests and acoustic emission (AE) tests for NWC in [30,43], there is a one-to-one relation between the energy features of AE and the force process during the total failure process of the pull-out test. Thus, the total energy consumption (W)–Slip (S) curve can be derived by the appropriate transformation based on the FSS curve. In this study, W is calculated by Equation (3), and the WS curves are shown in Figure 6.
W = F S
Comparing Figure 6 with Figure 5, the total energy consumption is smaller when SF happens than POF. So SF should be avoided in engineering structures in order to prevent fatigue failure and earthquake damage of the structure. For different batches of specimens, comparing their WS curves in Figure 6, the slope of the ascent stage is larger than that of the descent stage, which shows the speed rate of energy consumption is larger in the earlier stage than in the later stage. For the same batch of specimens, the total W increases with the increasing of d under the same S based on Ref. [44]. However, the change rule of total energy consumption is seen to differ by comparing Figure 6d (PSB), Figure 6f and Figure 6h (CRB). The main reason is a lower ultimate bonding force and energy consumption. At the same time, there is a cross point in part of the WS curves and the FSS curves, which shows the process of energy absorption is not homogeneous. But the general trend is similar to the law of energy absorption, which may reflect the difference of la and bond strength. Furthermore, Table 5 shows the contribution of the crescent-shaped ribs to the bonding action, because the total energy consumption of CRB differs by one order of magnitude from PSB.
Table 5 compares the total energy consumption under different failure states for group LWCSB-2 when la = 50 mm. Although the failures when d is 16 mm or 20 mm are all SFs, their total energy consumption is only 19.7—30% of the energy consumption of a POF event—when d is 12 mm, respectively. This also shows, from a different perspective, that an engineering structure should avoid SFs in order to improve ductility.
The relations between the Wd curves are shown in Figure 7 when S0 = 25 mm. The total energy consumption increases with increasing d, which is consistent with NWC [45]. At the same time, the WS curve when d is 12 mm to 16 mm is steeper than when d is 16 mm to 20 mm, which shows that the contribution of diameter growth Δd based on a smaller d to total energy consumption is larger than that of Δd based on a larger d, and the latter declines. This may provide a stimulus for structural engineering—the structure should have as small of a diameter as possible under the same steel ratio in order to improve total energy consumption when bonding failure happens. In any case, this opinion needs more relevant tests to be validated.
To compare when Stotal is 25 mm, the W–S curves are refitted by Equations (4) and (5) and shown in Figure 7.
W = a S b
where a and b are undetermined coefficients. For Figure 6a, a = 21.047, b = 1.103, and R2 = 0.982; For Figure 6c, a = 0.109, b = 1.638, and R2 = 0.980.
W = A 1 e S t 1 + y 0
where A1, t1, and y0 are undetermined coefficients. For Figure 6b, y0 = −6.222, A1 = 3.486, t1 = −2.716, and R2 = 0.997.
As shown in Figure 8, the fitting curves of WS can accurately reflect the test curves, which shows the test results are reliable and the theories are correct. In addition, comparing Figure 5 with Figure 7, the FS curve of ALWSCC is essentially in agreement with that of NWC, so the force process can also be divided into the several stages below; that is, the chemical adhesive force stage (elastic and micro-elastic strain stage), the common-effect stage of mechanical bearing force and static frictional force (plastic development stage), and the frictional force stage (crushed stage) [45,46,47]. Compared with AE energy lines of NWC [45,46], the FS curve discontinuity of ALWSCC is gentler, and the breakpoint also moves forward. The main reason is that the cracks are not only much greater than for NWC, when the cracks occurred in the interior of ALWSCC, but here they also emerge in the interface between the lightweight aggregates and the mortars, and the connectivity of cracks needs a process. For ALWSCC, because the aggregates and mortar have different natures from that of NWC, the cracks will expand into failure cracks and be fewer in number when the cracks occur.

3.3. Energy Analysis of Bonding Failure Process

The bonding failure process of ALWSCC meets the thermodynamics principle; that is, the mechanical energy and thermal energy are transformed into internal energy and potential energy. For the tests, because the temperature of the specimen agrees with the environmental temperature around the specimen, this study only considers the mechanical energy loads acting on the specimen, then transformed into elastic potential, plastic potential, surface, and radiant energies, etc.

3.3.1. Elastic and Micro-Elastic Strain Stage

There is no relative displacement between the bar and concrete, and the total energy change belongs to energy release. At that time, the work done by the outer load will be all stored internal energy but reversible under certain conditions [48]. As shown in Figure 9, although the elastic strain can be recovered, the elastic strain energy is accompanied by a certain amount of energy dissipation. In the plastic development stage, there is a larger slip between the bar and the concrete, but the total energy change process belongs to the energy dissipation and release process. Then, the cracks will emerge from the surface of the specimen and then transform from an unstable state to a relatively stable state. However, the scope of the change is smaller, and there is no break point, only accompanied with a little AE energy release, and a large proportion of the energy is stored as elastic strain energy and plastic strain energy [49].

3.3.2. Failure Stage

The concrete around the bar is crushed at first, then reaches the surface of the specimen, which shows that the bond has failed. On the other hand, the bond failure also shows that the concrete material perished because of energy absorption [50] and total energy dissipation.
Regarding the energy dissipation characteristics during the failure process, according to the thermodynamics principle, the energy dissipation is expressed as in Equation (6) [46].
D = D s + D d + D f
where DS is the plastic deformation energy, Dd is the surface energy, and Df is the radiant energy and elastic strain energy.
Analyzing Equation (6), Figure 6, and the AE test results of NWC together [41,45], the AE energy has a peak mutation when the load arrives at a peak point; that is, the load arrives at the ultimate bonding stress between the bar and the concrete, which leads to bonding failure and also shows that the old balance state is broken, and the radiant energy reaches a maximum value compared with the previous stable state [51]. As shown in Figure 9, the dissipation energy has not reached a peak point, but there is a delay. The reason is that the balance state is in a sub-critical stable state when the bonding stress reaches maximum load because of being squashed against the concrete by the rib of the bar [52]. As the bar steadily grinds against the concrete, the whole system will transform from one stable state to another one until the maximum radiant energy dissipation is reached.
The self-cohesive action of concrete largely depends on the surface characteristics [53]. Because all of the C-S-H, AFm, and C3AH6 crystals in the cement matrix have huge surface energy and adhesion, most of the work done by the external load is used to counteract the work done by Van der Waals force and dissipates before any cracks occur. With the cracks expanding and aggregates crushed, the potential energy dissipation between the molecules is transformed into molecular potential energy, thermal energy, and radiant energy dissipation by mechanical friction between the bar and the concrete until specimen failure.
Generally, the bonding stress between the bar and concrete can be calculated by Equation (7).
τ = F 2 π r l a
From Equations (3) and (7), then
W = 2 π τ r l a S
If the bonding stress in Equation (8) is assumed to be a maximum τmax, Stotal is assumed to be 25 mm, and F is assumed to be failure load, then with a pull-out cube specimen of 150 × 150 × 150 mm3 with la = 100 mm, the grade of the reinforced concrete can be classified according to the total energy consumption when failure has occurred, which is clearer and more reasonable than the traditional classification by concrete strength grade.
It is undeniable that the slip S0 is larger than in the general literature. For example, S0 is about 1 mm in [54] (self-consolidating lightweight concrete, SCLWC), and S0 is about 3-6 mm in [55,56] (NWC, A complete beam test). In the relevant LWAC pull-out tests just completed by our group, S0 is 10–15 mm under room temperature conditions, and S0 is 6–10 mm after high temperature (the compressive strength after high temperature is not less 60% than that under normal temperature). This may be determined by the physical and mechanical properties of the ALWSCC itself (two PVC tubes are used to reduce the effects of end bonding in the test (Figure 4)). As listed in Table 6, the elastic modulus of ALWSCC is about 50% of that of NWC, and its strain is about two times that value. The slip value of ALWSCC is much larger than that of the NWC.
In contrast to other researchers [4,5,6,7,9,10,11,12,13,15,16,21,22,23,44,45,46,47,48,49,50,54,56], the highlights and novel ideas of this study are as follows: (1) to determine the calculation basis of energy consumption, we try to explore the new design of the reinforced concrete based on the traditional pull-out test and the energy dissipation effect of bond-slip; (2) due to the porosity of shale ceramsite with low cylinder pressure strength and large deformation, the elastic modulus of the light shale ceramsite concrete is lower than that of normal concrete with strength grade (Table 6)—therefore, the bond mechanism of the reinforcement steel displays significant differences in the damage interface with ceramsite extrusion section; (3) in the design of specimens (Figure 2), PVC pipes were not installed at the lower end of specimens in many works [6,7,24,56,57,58], resulting in a local reinforcement effect at the lower end and an increased likelihood of causing the splitting failure of specimens.

4. Conclusions

To reveal the energy consumption characteristics of the steel bar and ALWSCC, a series of pull-out tests between steel and ALWSCC were experimentally investigated, and the main conclusions are presented below.
(1) The bonding failure process between a bar and ALWSCC is similar to NWC: there is a clear ascending stage, a descending stage, and a smoothing stage in the FS curve or the τ–S curve, which can be divided into SF and POF. Generally, a specimen with PSB only suffers POF, but with CRB, either SF or POF can occur. The ratio of the total energy dissipation of splitting failure to that of the pulling out failure is less than 30%, and the pulling out failure of the drawing specimen consumes more energy, which makes the structure have better toughness.
(2) Based on the FS curves, the pull-out force is divided into four stages, including the chemical adhesive force stage (elastic and micro-elastic strain stage), the common-effect stage of mechanical bearing force and static frictional force (plastic development stage), and the frictional force stage (crushed stage). The bond bearing capacity of rebar and concrete is mainly related to the diameter of rebar and the types of rebar rib and concrete. The bonding capacity between CRB and concrete is much higher than that of PSB, and the mechanical bite force between CRB and concrete contributes more than 95% to the bonding force.
(3) The energy mechanism of the bonding properties between the bar and ALWSCC is in general accordance with NWC, but the energy mutations of the former in the W–S curve is gentler than the latter. The former can release much more surface energy, and there is a strong energy dissipation and energy release when failure occurs. The traditional strength design method cannot meet the demand of the ductility design of the reinforced concrete; based on the energy dissipation mechanism of ALWSCC and the steel bar, the proposed new design method can take full account of the strength, ductility, and energy consumption of a variety of factors on the reinforced concrete, which has reference significance for engineering practice.
For frequent earthquake cases in cities, in view of the difficulty of city design, using the new design method based on the energy principle compared with the traditional strength design method has a wider application. Since the energy dissipation mechanism between the steel bar and concrete is still in the research area of macro-phenomena, it is necessary to conduct in-depth study into the interaction between the steel bar and concrete at the micro level in the next step.

Author Contributions

Conceptualization, J.Y.; data curation, N.Y. and X.L.; formal analysis, S.W.; funding acquisition, S.W. and J.Y.; investigation, N.Y.; methodology, J.Y.; resources, T.C. and P.H.; software, N.Y.; supervision, J.Y. and S.W.; validation, X.L.; writing—original draft, N.Y.; writing—review and editing, J.Y. and S.W. All authors have read and agreed to the published version of the manuscript.

Funding

This work was financially supported by the National Natural Science Foundation of China (51774112; 41172317), and the Fundamental Research Funds for the Universities of Henan Province (NSFRF200202), China.

Institutional Review Board Statement

Not applicable.

Informed Consent Statement

Not applicable.

Data Availability Statement

The data presented in this study are available on request from the corresponding author. The data are not publicly available due to the confidentiality requirements of the lab.

Acknowledgments

The authors are thankful for the help of A/Prof Jian Gong in the laboratory of Henan Polytechnic University, China.

Conflicts of Interest

The authors declare no conflict of interest. The funders had no role in the design of the study; in the collection, analysis or interpretation of data; in the writing of the manuscript or in the decision to publish the results.

References

  1. Wang, S.R.; Xiao, H.G.; Zou, Z.S.; Cao, C.; Wang, Z.L. Mechanical performances of transverse rib bar during pull-out test. In. J. Appl. Mech. 2019, 11, 1950048. [Google Scholar] [CrossRef]
  2. Wu, X.G.; Wang, S.R.; Yang, J.H.; Zhao, J.Q.; Chang, X. Damage characteristics and constitutive model of lightweight shale ceramsite concrete under static-dynamic loading. Eng. Fract. Mech. 2022, 259, 108137. [Google Scholar] [CrossRef]
  3. Wang, S.R.; Wang, Y.H.; Gong, J.; Wang, Z.L.; Huang, Q.X.; Kong, F.L. Failure mechanism and constitutive relation for an anchorage segment of an anchor cable under pull-out loading. Acta Mech. 2020, 231, 3305–3317. [Google Scholar] [CrossRef]
  4. Jeong, H.; Ji, S.; Kim, J.H.; Choi, S.H.; Heo, I.; Kim, K.S. Development of mapping function to estimate bond-slip and bond strength of RC beams using genetic programming. Int. J. Concr. Struct. Mater. 2022, 16, 46. [Google Scholar] [CrossRef]
  5. Bhuiyan, M.Z.I.; Wang, S.Y.; Carter, J.P. Experimental study of an innovative driven and grouted soil nail (x-Nail). Can. Geotech. J. 2021, 58, 1205–1215. [Google Scholar] [CrossRef]
  6. Nelson, L.A.; Al-Allaf, M.; Weekes, L. Analytical modelling of bond-slip failure between epoxy bonded FRP and concrete substrate. Compos. Struct. 2020, 251, 112596. [Google Scholar] [CrossRef]
  7. Moghaddas, A.; Mostofinejad, D.; Saljoughian, A.; Ilia, E. An empirical FRP-concrete bond-slip model for externally-bonded reinforcement on grooves. Constr. Build. Mater. 2021, 281, 122575. [Google Scholar] [CrossRef]
  8. Wang, S.R.; Xiao, H.G.; Cao, C.; Zou, Z.S.; Liu, X.L. Simulation verification analysis of anchoring characteristic of transverse rib steel bar during pull-out test. DYNA 2016, 91, 548–553. [Google Scholar] [CrossRef] [Green Version]
  9. Cairns, J. Local bond-slip model for plain surface reinforcement. Struct. Concr. 2021, 22, 666–675. [Google Scholar] [CrossRef]
  10. Coccia, S.; Maggio, E.D.; Rinaldi, Z. Bond slip model in cylindrical reinforced concrete elements confined with stirrups. Int. J. Adv. Struct. Eng. 2015, 7, 365–375. [Google Scholar] [CrossRef]
  11. Ichinosea, T.; Kanayama, Y.; Inoue, Y. Size effect on bond strength of deformed bars. Constr. Build. Mater. 2004, 18, 549–558. [Google Scholar] [CrossRef]
  12. Valente, I.B.; Cruz, P.J.S. Experimental analysis of shear connection between steel and lightweight concrete. J. Constr. Steel. Res. 2009, 65, 1954–1963. [Google Scholar] [CrossRef]
  13. Ma, W.C.; Tian, Y.; Zhao, H.L.; Orton, S.L. Time-dependent behavior of reinforced concrete columns subjected to high sustained loads. J. Struct. Eng. 2022, 148, 04022161. [Google Scholar] [CrossRef]
  14. Bogas, J.A.; Gomes, M.G.; Real, S. Bonding of steel reinforcement in structural expanded clay light weight aggregate concrete: The influence of failure mechanism and concrete composition. Constr. Build. Mater. 2014, 65, 350–359. [Google Scholar] [CrossRef]
  15. Casanovaa, A.; Jasona, L.; Davenne, L. Bond slip model for the simulation of reinforced concrete structures. Eng. Struct. 2012, 39, 66–78. [Google Scholar] [CrossRef]
  16. Tariq, F.; Bhargava, P. Post corrosion bond-slip models for super ductile steel with concrete. Constr. Build. Mater. 2021, 285, 122836. [Google Scholar] [CrossRef]
  17. Taylor, M.A.; Jain, A.K.; Ramey, M.R. Path dependent biaxial compressive testing of an all-lightweight aggregate concrete. Am. Concr. Inst. J. Proc. 1972, 69, 758–764. [Google Scholar]
  18. Mattock, A.H.; Li, W.K.; Wang, T.C. Shear transfer in lightweight reinforced concrete. PCI J. 1976, 21, 20–39. [Google Scholar] [CrossRef]
  19. JGJ51-2002; Technical Specification for Lightweight Aggregate Concrete. China Architecture & Building Press: Beijing, China, 2002. (In Chinese)
  20. Yao, W.J.; Pang, J.Y.; Liu, Y.S. Performance degradation and microscopic analysis of lightweight aggregate concrete after exposure to high temperature. Materials 2020, 13, 1566. [Google Scholar] [CrossRef] [Green Version]
  21. Cseh, A.; Balazs, G.L.; Kekanovi, M.; Milii, I.M. Effect of SCMs on heat transfer properties of LWAC. J. Therm. Anal. Calorim. 2020, 144, 1095–1108. [Google Scholar] [CrossRef]
  22. Lakhani, R. Industrial wastes-cum-strength enhancing additives incorporated lightweight aggregate concrete (LWAC) for energy efficient building: A comprehensive review. Sustainability 2022, 14, 331. [Google Scholar] [CrossRef]
  23. Dabbagh, H.; Delshad, M.; Amoorezaei, K. Design-oriented stress-strain model for FRP-confined lightweight aggregate concrete. KSCE J. Civil Eng. 2021, 25, 219–234. [Google Scholar] [CrossRef]
  24. Liu, X.; Liu, Y.; Wu, T.; Wei, H. Bond-slip properties between lightweight aggregate concrete and rebar. Constr. Build. Mater. 2020, 255, 119355. [Google Scholar] [CrossRef]
  25. GB/T174131.1-2010; Lightweight Aggregates and Its Test Methods-Part 1: Lightweight Aggregates. Standards Press of China: Beijing, China, 2010. (In Chinese)
  26. GB/T174131.2-2010; Lightweight Aggregates and Its Test Methods-Part 2: Test Methods for Lightweight Aggregates. Standards Press of China: Beijing, China, 2010. (In Chinese)
  27. GB175-2007; Common Portland Cement. Standards Press of China: Beijing, China, 2007. (In Chinese)
  28. GB/T1596-2005; Fly Ash Used for Cement and Concrete. China Architecture & Building Press: Beijing, China, 2005. (In Chinese)
  29. GB8076-2008; Concrete Admixtures. Standards Press of China: Beijing, China, 2008. (In Chinese)
  30. Jafari, S.; Mahini, S.S. Lightweight concrete design using gene expression programing. Constr. Build. Mater. 2017, 139, 93–100. [Google Scholar] [CrossRef]
  31. Mousa, A.; Mahgoub, M.; Mohab, H. Lightweight concrete in America: Presence and challenges. Sustain. Prod. Consump. 2018, 15, 131–144. [Google Scholar] [CrossRef]
  32. JGJ63-2006; Standard of Water for Concrete. China Architecture & Building Press: Beijing, China, 2006. (In Chinese)
  33. GB50010-2010; Code for Design of Concrete Structures. China Architecture & Building Press: Beijing, China, 2010. (In Chinese)
  34. GB1499.1-2012; Steel for the Reinforcement of Concrete-Part 1: Hot Rolled Plain Bars. Standards Press of China: Beijing, China, 2013. (In Chinese)
  35. GB1499.2-2012; Steel for the Reinforcement of Concrete-Part 2: Hot Rolled Ribbed Bars. Standards Press of China: Beijing, China, 2013. (In Chinese)
  36. Prince, M.J.R.; Singh, B. Bond behavior between recycled aggregate concrete and deformed steel bars. Mater. Struct. 2014, 47, 503–516. [Google Scholar] [CrossRef]
  37. SL352-2006; Test Code for Hydraulic Concrete. China Water & Power Press: Beijing, China, 2012. (In Chinese)
  38. GB50152-2012; Standard Methods for Testing of Concrete Structures. China Architecture & Building Press: Beijing, China, 2012. (In Chinese)
  39. Kaffetzakis, M.I.; Papanicolaou, C.G. Bond behavior of reinforcement in lightweight aggregate self-compacting concrete. Constr. Build. Mater. 2016, 113, 641–652. [Google Scholar] [CrossRef]
  40. Mo, K.H.; Alengaram, U.J.; Jumaat, M.Z. Bond properties of lightweight concrete—A review. Constr. Build. Mater. 2016, 112, 478–496. [Google Scholar] [CrossRef]
  41. Han, J.; Wang, S.R.; Chen, Y.; Cao, C. Analytical derivation of rib bearing angle of reinforcing bar subject to axial loading. Mag. Concr. Res. 2019, 71, 175–183. [Google Scholar] [CrossRef]
  42. Xu, Y.L.; Shao, Z.M.; Shen, W.D. Bond strength between reinforcing bars and concrete. Build Sci. 1988, 4, 8–14. (In Chinese) [Google Scholar] [CrossRef]
  43. Special Subject Group of Anchorage and Lap. Experimental study on anchorage and lap joint of steel bars in concrete. In Collection of Research Reports on Concrete Structures (Part 3); China Academy of Building Research, Ed.; China Building Industry Press: Beijing, China, 1994. (In Chinese) [Google Scholar]
  44. Maree, A.F.; Riad, K.H. Analytical and experimental investigation for bond behaviour of newly developed polystyrene foam particles lightweight concrete. Eng. Struct. 2014, 58, 1–11. [Google Scholar] [CrossRef]
  45. Wu, C.; Chen, G.D. Unified model of local bond between deformed steel rebar and concrete: Indentation analogy theory and validation. J. Eng. Mech. 2015, 141, 04015038. [Google Scholar] [CrossRef]
  46. Zhang, H.; Li, D.Y. Determination of interfacial bonding strength using a cantilever bending method with in situ monitoring acoustic emission. Surf. Coat. Technol. 2002, 155, 190–194. [Google Scholar] [CrossRef]
  47. Wang, X.; Su, C.; Deng, W.J.; Wu, Z.S. Bond behavior between corrugated BFRP shell and concrete under monotonic and cyclic loads. Constr. Build. Mater. 2019, 210, 596–606. [Google Scholar] [CrossRef]
  48. Xie, H.P.; Jv, Y.; Li, L.Y.; Peng, R.D. Energy mechanism of deformation and failure of rock masses. Chin. J. Rock Mech. Eng. 2008, 27, 1729–1740. (In Chinese) [Google Scholar] [CrossRef]
  49. Gao, F.; Cao, S.P.; Zhou, K.P.; Li, Y.; Zhu, L.O.Y. Damage characteristics and energy-dissipation mechanism of frozen-thawed sandstone subjected to loading. Cold Reg. Sci. Technol. 2020, 169, 102920. [Google Scholar] [CrossRef]
  50. Cao, K.; Ma, L.; Wu, Y.; Khan, N.M.; Yang, J. Using the characteristics of infrared radiation during the process of strain energy evolution in saturated rock as a precursor for violent failure. Infrared Phys. Technol. 2020, 109, 103406. [Google Scholar] [CrossRef]
  51. Ahmad, S.; Pilakoutas, K.; Rafi, M.M.; Khan, Q.U.Z.; Neocleous, K. Experimental investigation of bond characteristics of deformed and plain bars in low strength concrete. Sci. Iranica. 2018, 25, 2954–2966. [Google Scholar] [CrossRef] [Green Version]
  52. Tekle, B.H.; Cui, Y.F.; Khennane, A. Bond properties of steel and sand-coated GFRP bars in Alkali activated cement concrete. Struct. Eng. Mech. 2020, 75, 123–131. [Google Scholar] [CrossRef]
  53. Qing, L.B.; Hu, Y.; Miao, W. Stochastic cohesive law of concrete based on energy consumption equivalence. Eng. Fract. Mech. 2018, 202, 458–470. [Google Scholar] [CrossRef]
  54. Wang, B.; Bai, G.L. Energy mechanism of the bonding failure process between the rebars and the recycled concrete. Concrete 2011, 36, 66–69. (In Chinese) [Google Scholar] [CrossRef]
  55. Al-Shannag, M.J.; Charif, A. Bond behavior of steel bars embedded in concretes made with natural lightweight aggregates. J. King Saud Uni-Eng. Sci. 2017, 29, 365–372. [Google Scholar] [CrossRef]
  56. Nzambi, A.K.L.L.; de Oliveira, D.R.C.; de Oliveira, A.M.; Picanco, M.D. Pull-out tests of ribbed steel reinforcing bars embedded in concrete with steel fibres. Proc. Inst. Civ. Eng. Struct. Build. 2021, 174, 181–189. [Google Scholar] [CrossRef]
  57. Du, T.; Li, C.Y.; Wang, X.N.; Ma, L.; Qu, F.L.; Wang, B.W.; Peng, J.L.; Li, W.G. Effects of pipe diameter, curing age and exposure temperature on chloride diffusion of concrete with embedded PVC pipe. J. Build. Eng. 2022, 57, 104957. [Google Scholar] [CrossRef]
  58. Javed, M.F.; Rafiq, H.; Khan, M.A.; Aslam, F.; Musarat, M.A.; Vatin, N.I. Axial behavior of concrete-filled double-skin tubular stub columns incorporating PVC pipes. Crystals 2021, 11, 1434. [Google Scholar] [CrossRef]
Figure 1. The bar with crescent-shaped rib and its geometrical features. (a) Three-dimensional photograph; (b) top view; (c) cross-section; (d) crescent-shaped rib.
Buildings 12 02065 g001
Figure 2. Sketch for pull-out test based on a cube specimen.
Buildings 12 02065 g002
Figure 3. The testing machine and the specimen.
Buildings 12 02065 g003
Figure 4. The failure modes of CRB and PSB specimens, respectively. (a) SF for CRB; (b) POF for CRB; (c) POF for PSB; (d) POF for PSB; (e) POF for CRB.
Buildings 12 02065 g004
Figure 5. The FS curves of different specimens. (a) LWCSB-1, la = 50 mm; (b) LWCSB-1, la = 100 mm; (c) LWCSB-2, la = 50 mm; (d) LWCSB-2, la = 100 mm; (e) LWCSB-3, la = 50 mm; (f) LWCSB-3, la = 100 mm; (g) LWCSB-1, Φ12; (h) LWCSB-2, CRB, PSB, Φ16, la = 100 mm.
Buildings 12 02065 g005aBuildings 12 02065 g005b
Figure 6. The relationships between FS curves and WS curves for different specimens. (a) LWCSB-1-CRB-50; (b) LWCSB-1-CRB-100; (c) LWCSB-2-PSB-50; (d) LWCSB-2-PSB-100; (e) LWCSB-2-CRB-100; (f) LWCSB-3-CRB-50; (g) LWCSB-3-CRB-100; (h) LWCSB-3-CRB-50.
Buildings 12 02065 g006aBuildings 12 02065 g006b
Figure 7. The relations of Wd when S0 is 25 mm. (a) LWCSB-1-CRB-100; (b) LWCSB-3-CRB-100; (c) LWCSB-2-PSB-50.
Buildings 12 02065 g007
Figure 8. The fitting and test curves of WS when S0 is 25 mm and d is 16 mm. (a) LWCSB-1-CRB-100; (b) LWCSB-3-CRB-100; (c) LWCSB-2-PSB-50.
Buildings 12 02065 g008
Figure 9. Sketch of energy dissipation under elastic and micro-elastic deformation stages.
Buildings 12 02065 g009
Table 1. Cumulative percentage by sieving and cylinder compressive strength for SC and SP [2].
Shale Ceramsite (%)>16 mm16.0 mm9.50 mm4.75 mmPorous Rate
GB/T17431.1 (2010)≤5≤1020–6085–100SCSP
Test results0.11.634.299.751.323.9
IndexTube crushing strength (MPa)MeanOver meanGB/T17431.1-2010
≥9.50 mm3.633.673.683.663.622.0–3.0
≥4.75 mm3.543.583.593.57
Shale pottery (%)4.75 mm2.36 mm1.18 mm0.6 mm0.3 mm≤0.15 mm
GB/T17431.1 (2010)≤10≤3520–6030–8065–9075–100
Test results2.511.639.858.969.199.8
Notice: >16 mm indicates the sieve hole size.
Table 2. The mixes (1 m3) and strengths of ALWSCC [2].
NamemC
(kg)
mFA
(kg)
mSC
(kg)
mSP
(kg)
mW
(kg)
fcu28 d
(MPa)
SDcufts28 d
(MPa)
SDtsρd
(kg/m3)
LWCSB-1381158480412210.223.674.161.870.211652
LWCSB-2460188400453233.328.334.042.610.171696
LWCSB-3479202387446258.830.672.522.590.221712
Table 3. The geometrical parameters of CRB (mm).
Typedd1hh1lba
CRB1211.51.21.68.00.71.5
1615.41.51.510.00.91.8
2019.31.71.710.01.22.0
Notes: α = 60°, β = 70°, θ = 0° used to be counted according to GB1499.2-2012 [25].
Table 4. The strength values of two kinds of steel bars.
d (mm)CRBPSB
fy (MPa)fu (MPa)fy (MPa)fu (MPa)
12460580302420
16464604296411
20422572289401
Notes: fy is the yield strength (MPa). fu is the ultimate tensile strength (MPa).
Table 5. The total energy consumption with representative specimens.
NameLWCSB-1-CRBW1 (J)LWCSB-2
-CRB
W2 (J)LWCSB-3
-CRB
W3 (J)LWCSB-2-PSBW4 (J)
la = 50
(mm)
Stotal = 16
(mm)
Φ12363.8Stotal = 9.4
(mm)
Φ12988.0Stotal = 12.9
(mm)
Φ12215.4Stotal = 25
(mm)
Φ1212.9
Φ16391.2Φ16195.3
(SF)
Φ16395.4Φ1619.2
Φ20555.4Φ20297.3
(SF)
Φ20221.4 *Φ2019.7
la = 100
(mm)
Stotal = 25
(mm)
Φ12245.4Stotal =
12.3
(mm)
Φ12338.1Stotal = 25
(mm)
Φ12145.9Stotal = 25
(mm)
Φ1219.6
Φ16634.6Φ16206.9Φ16176.1Φ1613.9
Φ20643.1Φ20327.2Φ20182.0Φ206.3 *
Notes: Wi (i = 1, 2, 3, 4) is total energy consumption when SF or POF happens based on a specimen of the same batch, coming from Figure 5. If S is more than 25 mm, Stotal = 25 mm. The datum with a * is an outlier value.
Table 6. The modulus of ALWSCC and NWC.
ALWSCC/NWCLC25/C25LC30/C30LC35/C35
E (GPa)1.36/2.801.53/3.001.65/3.15
ELC/EC (%)48.6051.0052.40
Notes: E of NWC is from GB50010-2010 [33].
Publisher’s Note: MDPI stays neutral with regard to jurisdictional claims in published maps and institutional affiliations.

