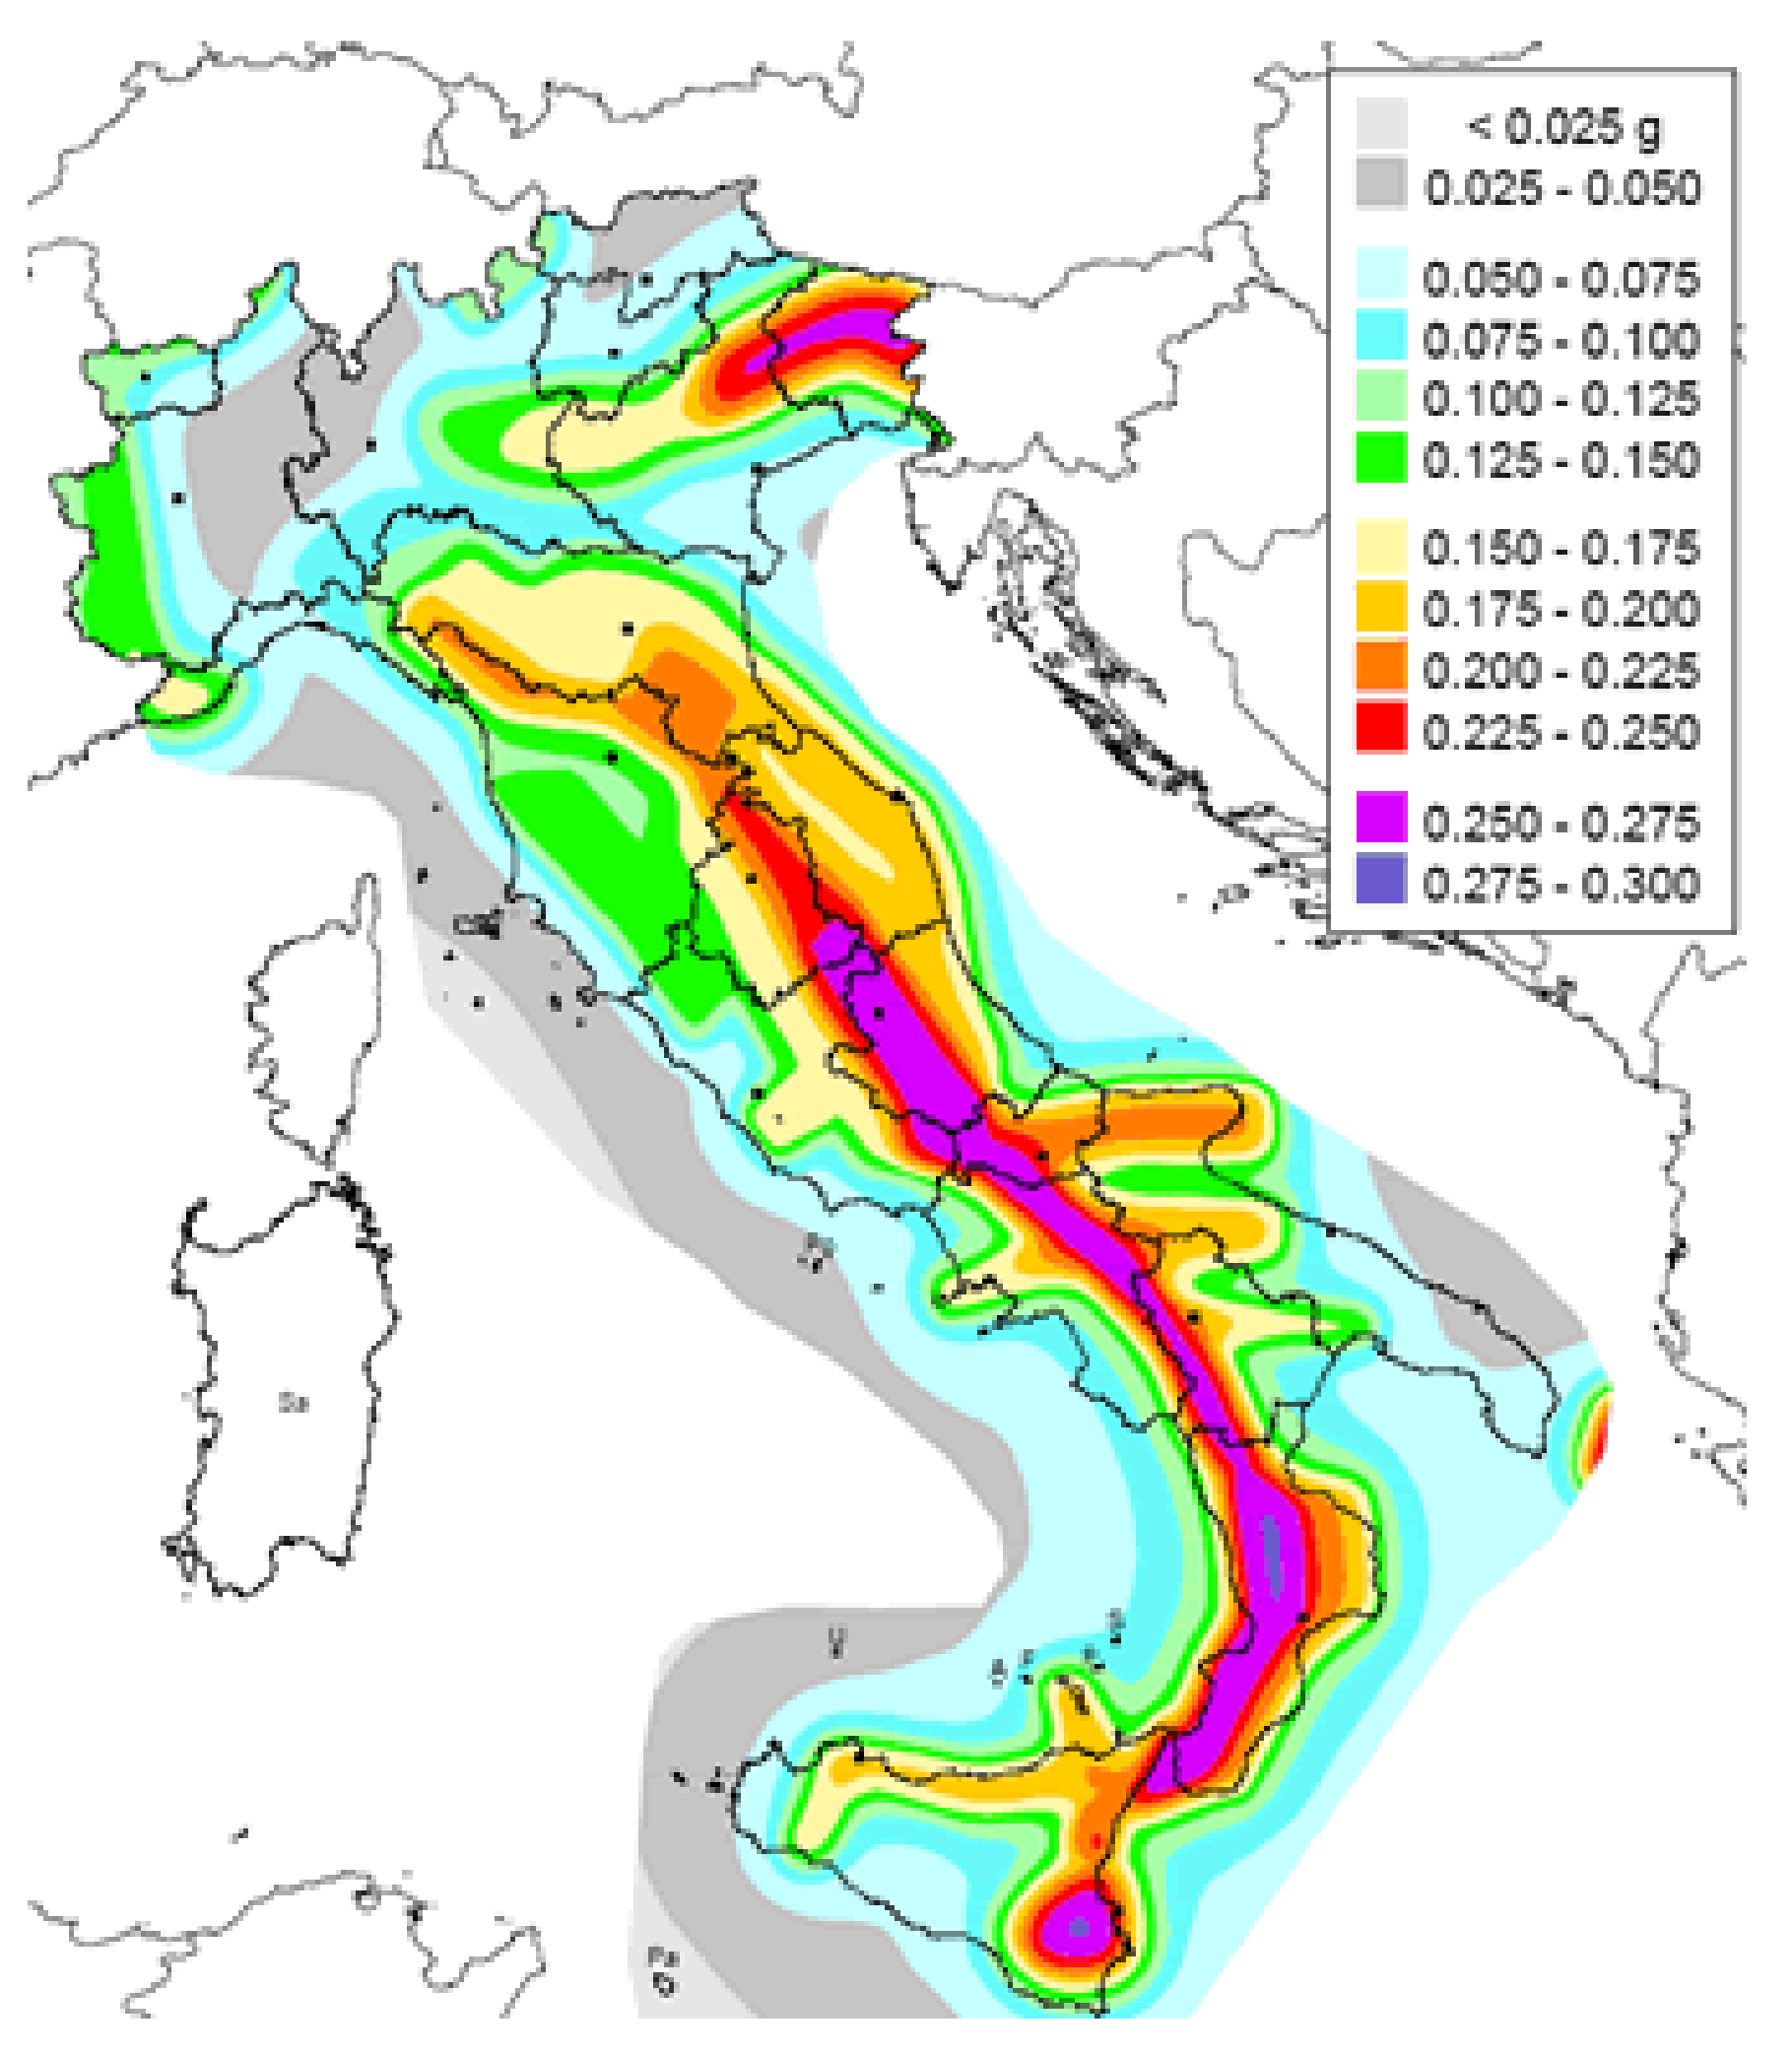
Figure 1.
Seismic hazard map of Italy (National Institute of Geophysics and Volcanology, 2006).
Figure 1.
Seismic hazard map of Italy (National Institute of Geophysics and Volcanology, 2006).
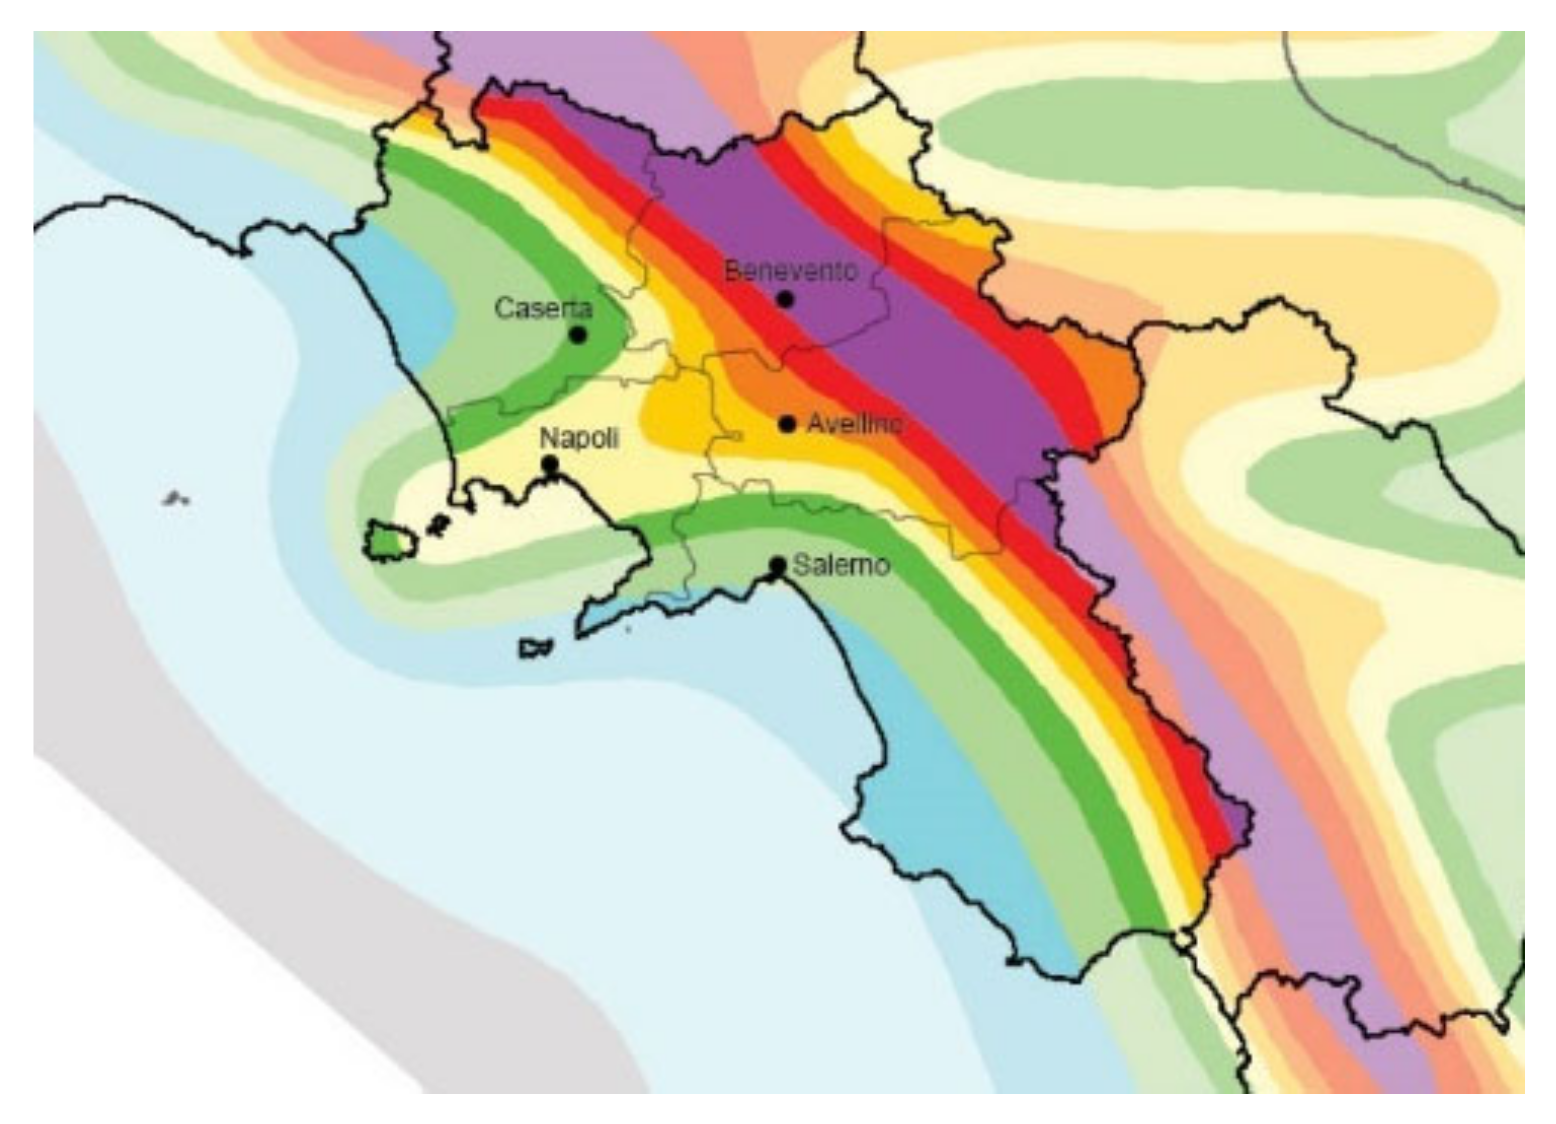
Figure 2.
Detail of the seismic hazard of the Campania region of Italy (Darkest colour are the highest seismic zones).
Figure 2.
Detail of the seismic hazard of the Campania region of Italy (Darkest colour are the highest seismic zones).
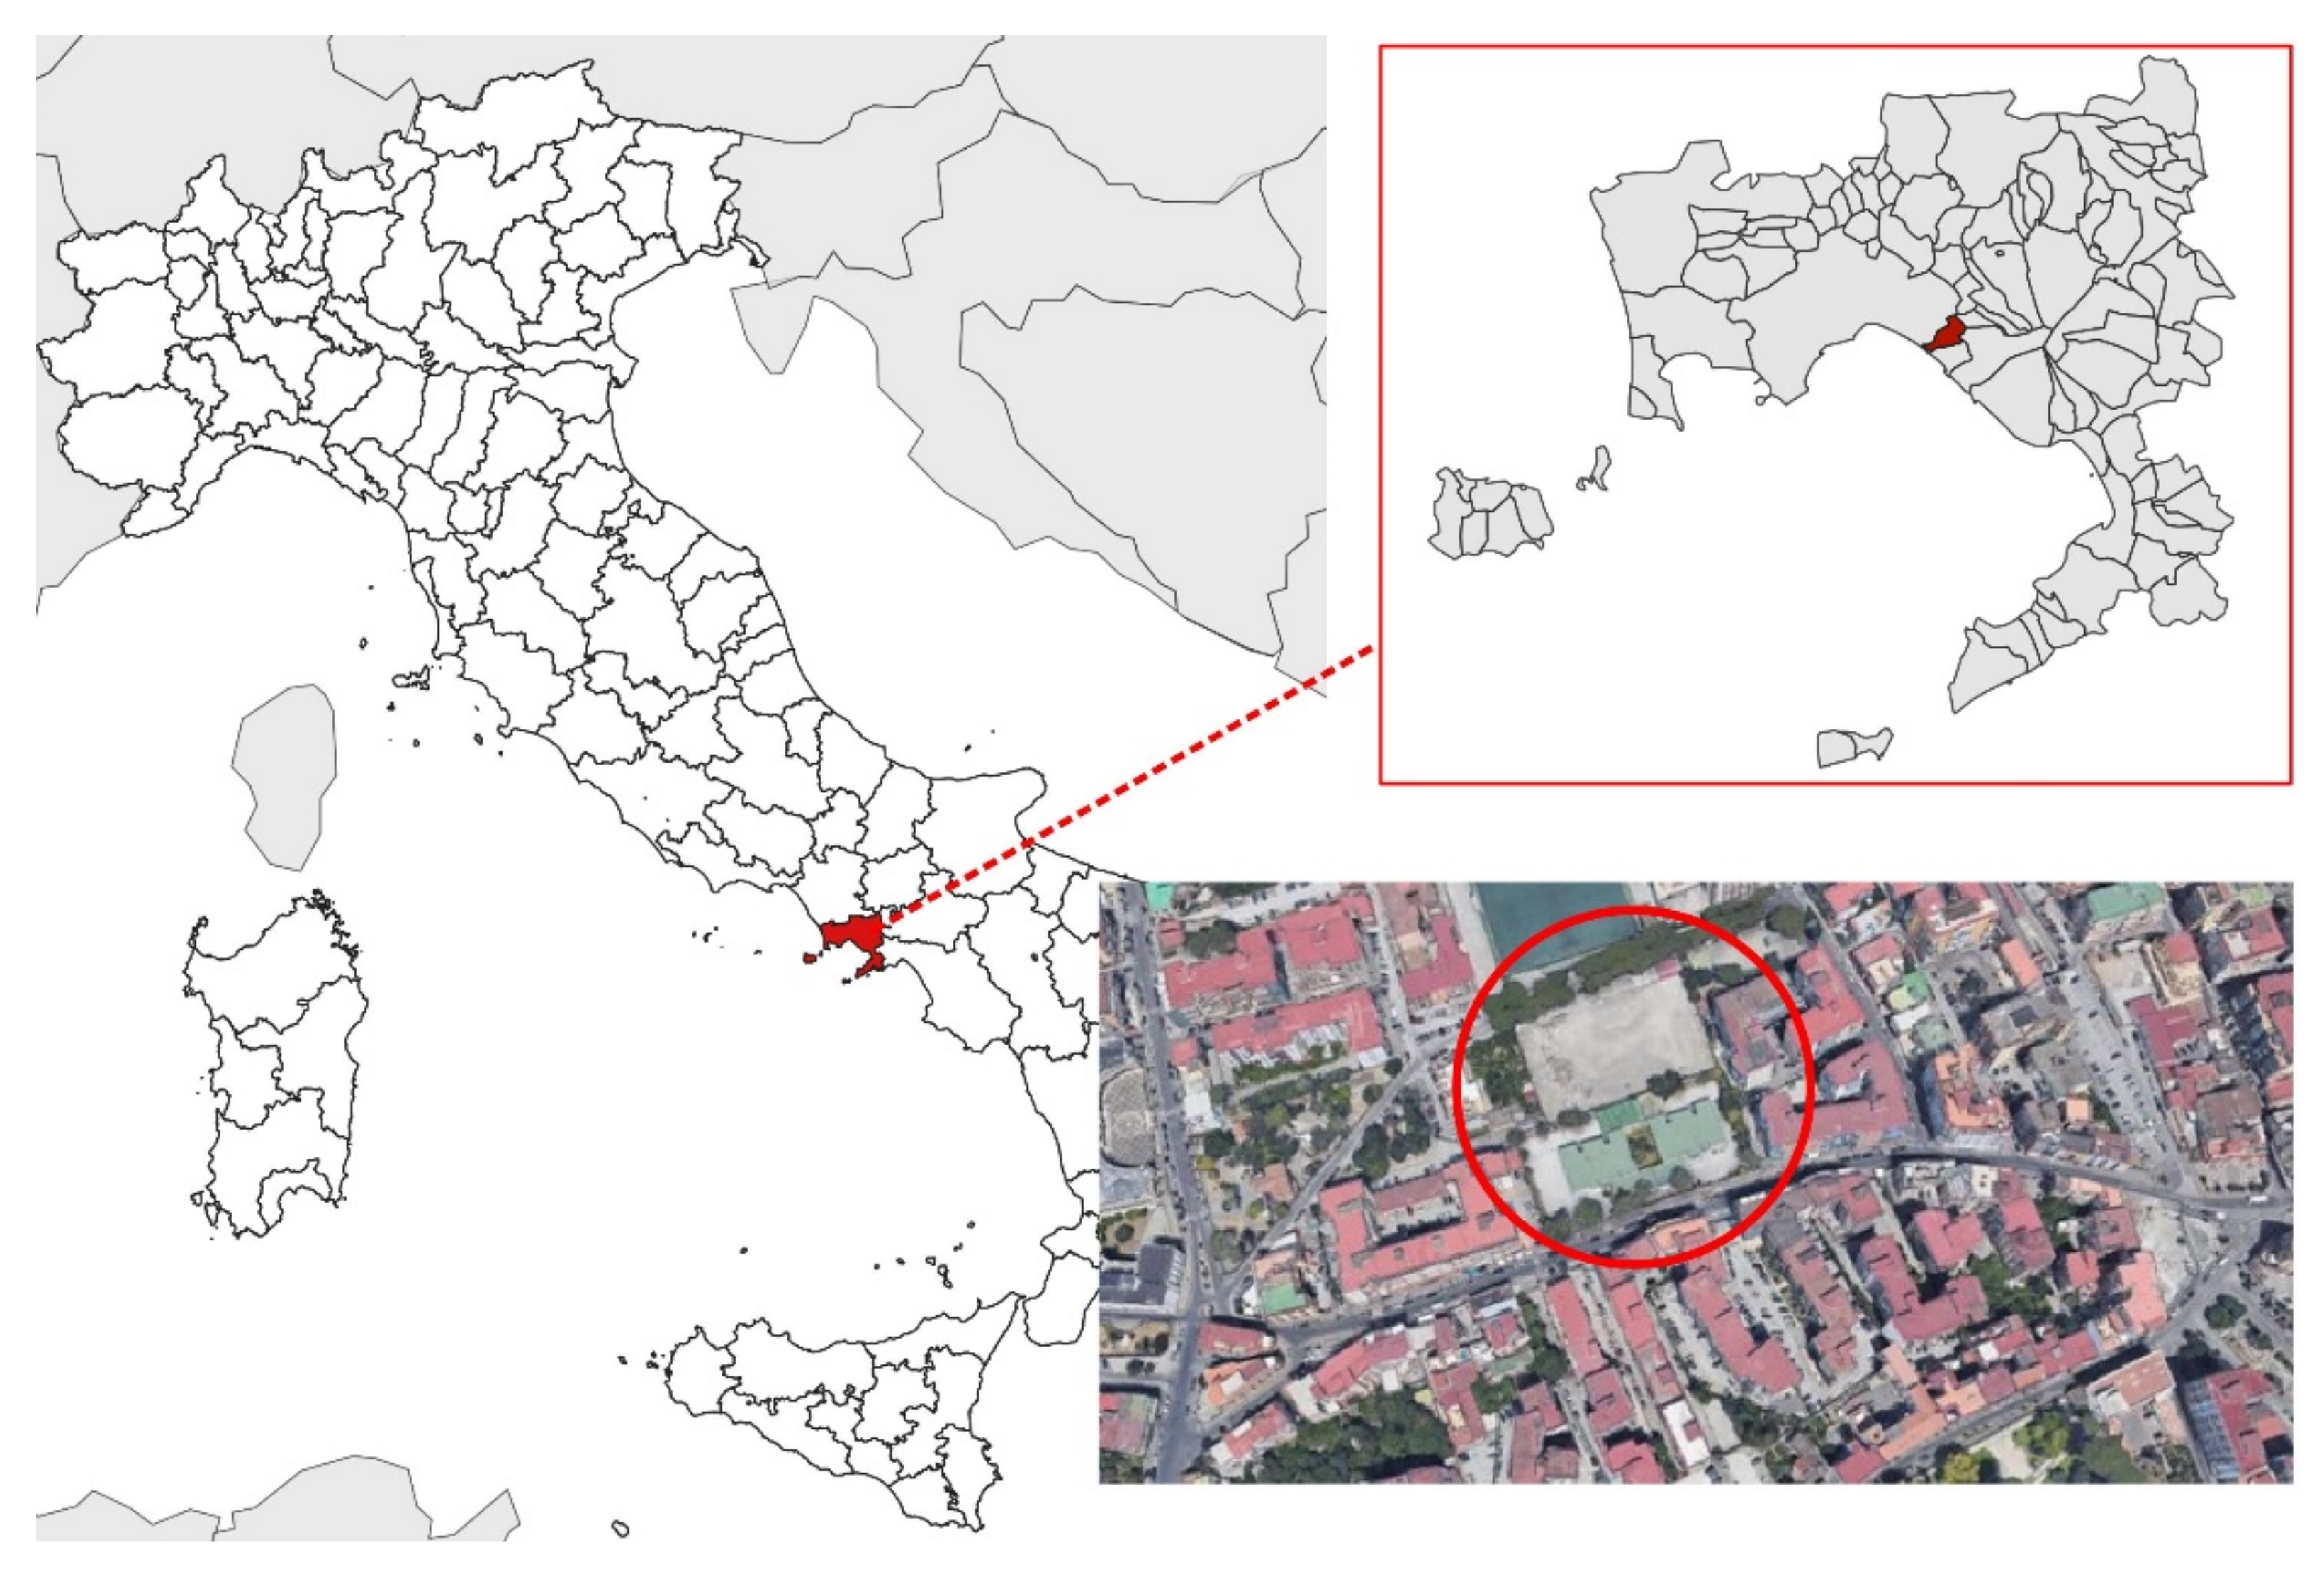
Figure 3.
Placement of the school examined in San Giorgio a Cremano, Naples (Red circle indicates the school).
Figure 3.
Placement of the school examined in San Giorgio a Cremano, Naples (Red circle indicates the school).
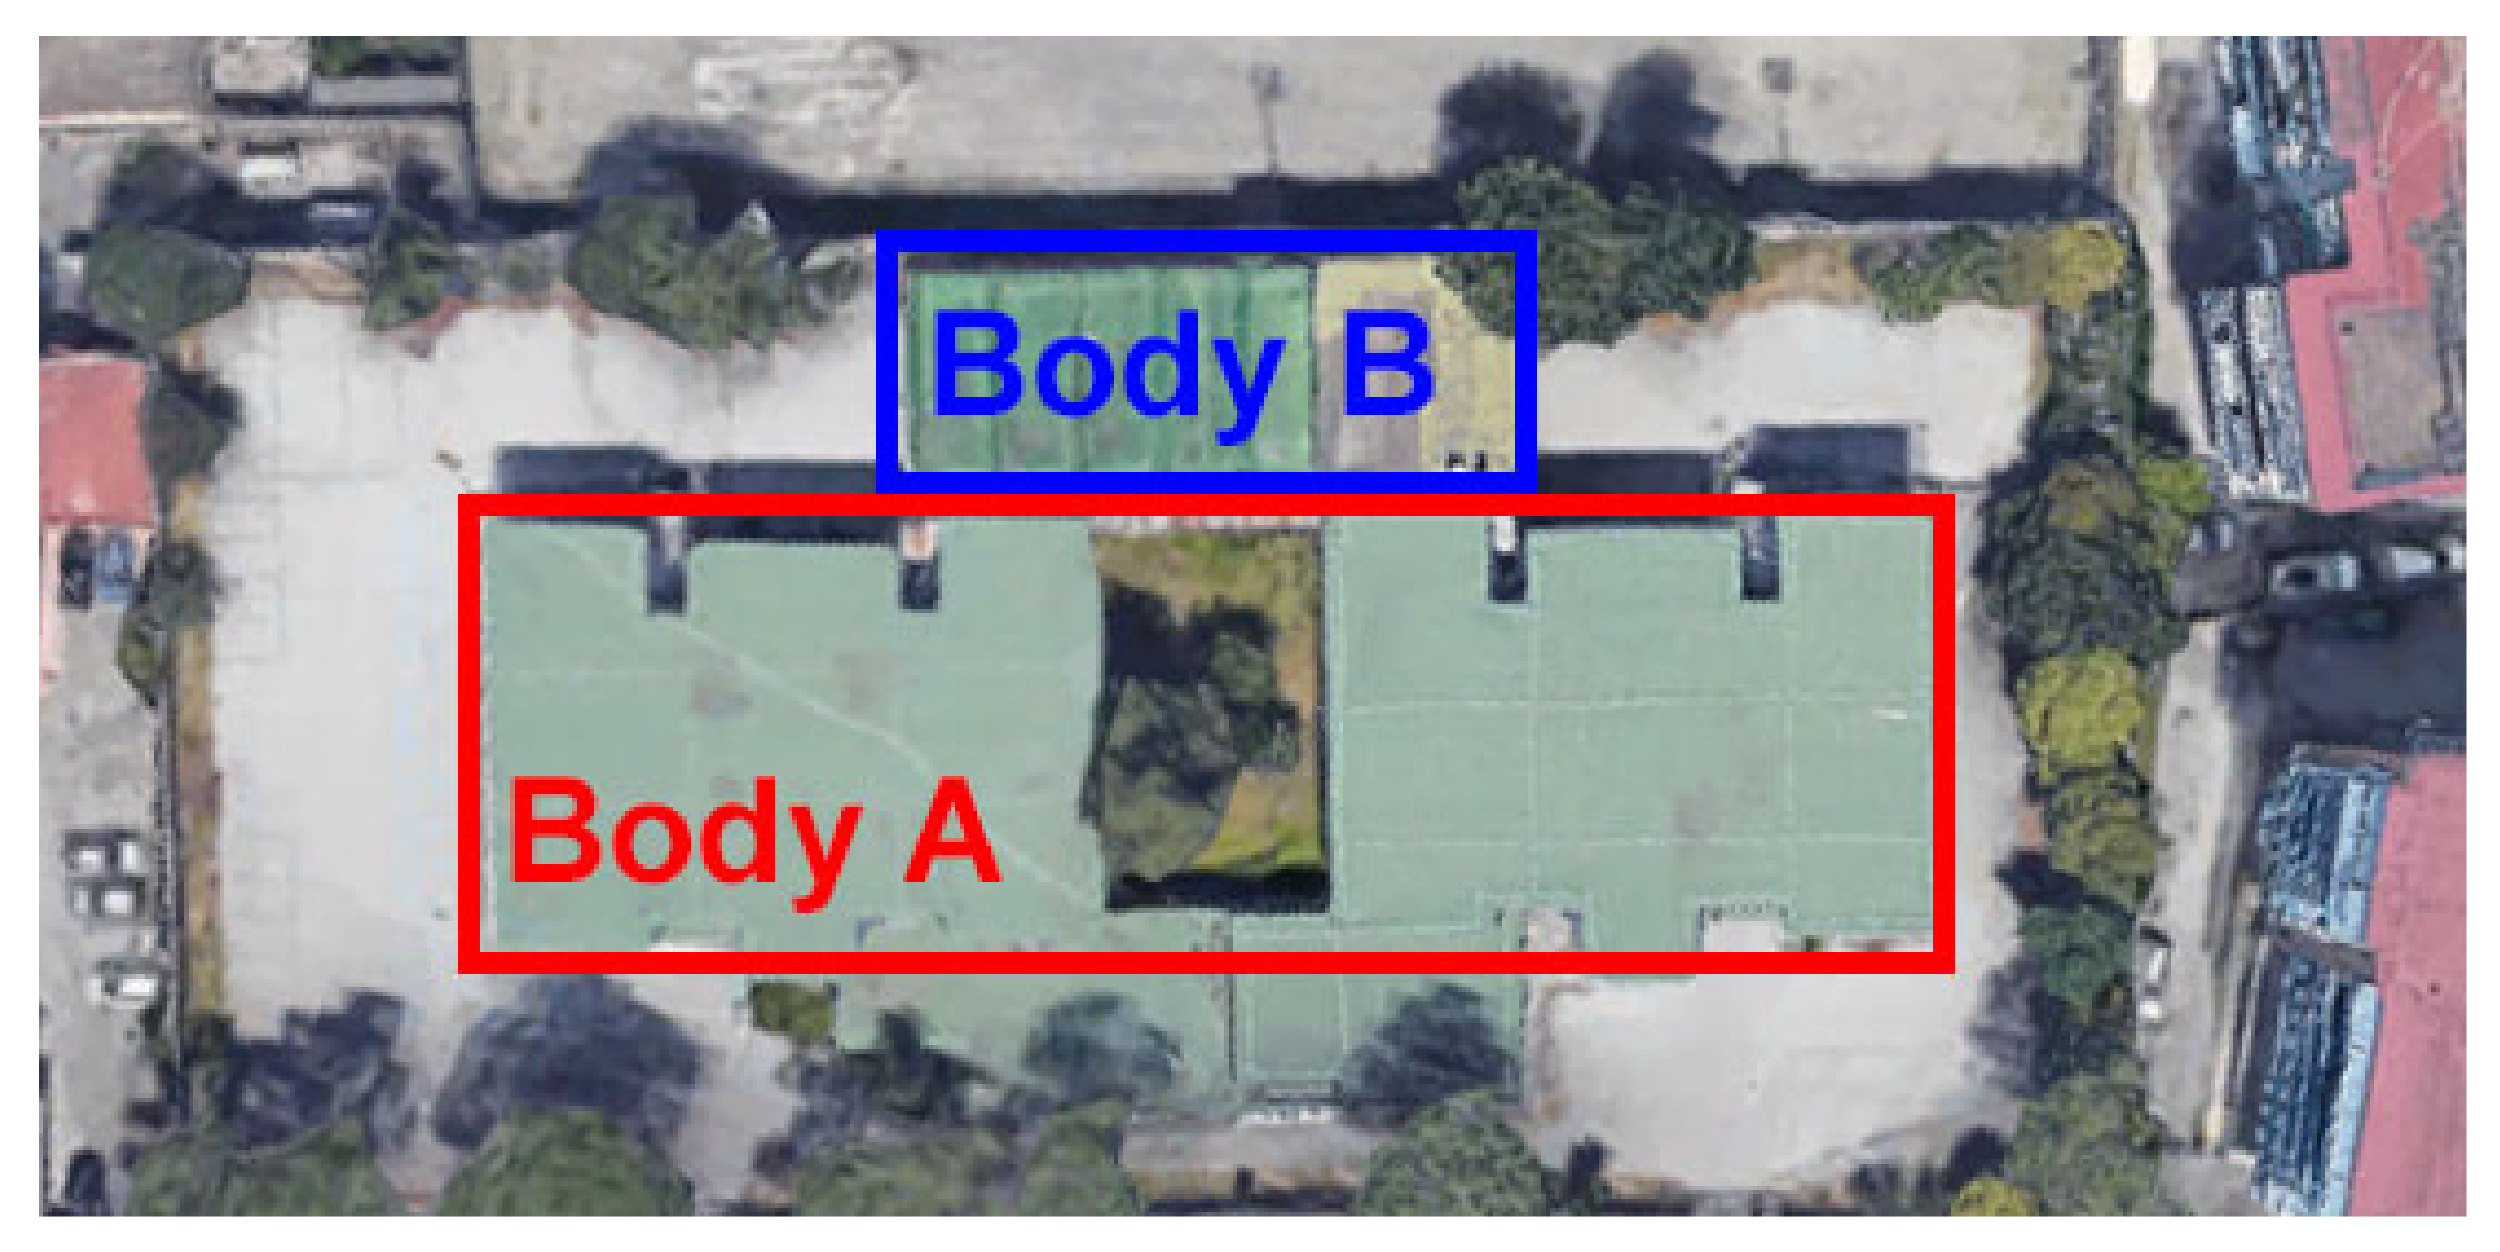
Figure 4.
Top view of the school’s plexus (Google Maps, 2021).
Figure 4.
Top view of the school’s plexus (Google Maps, 2021).
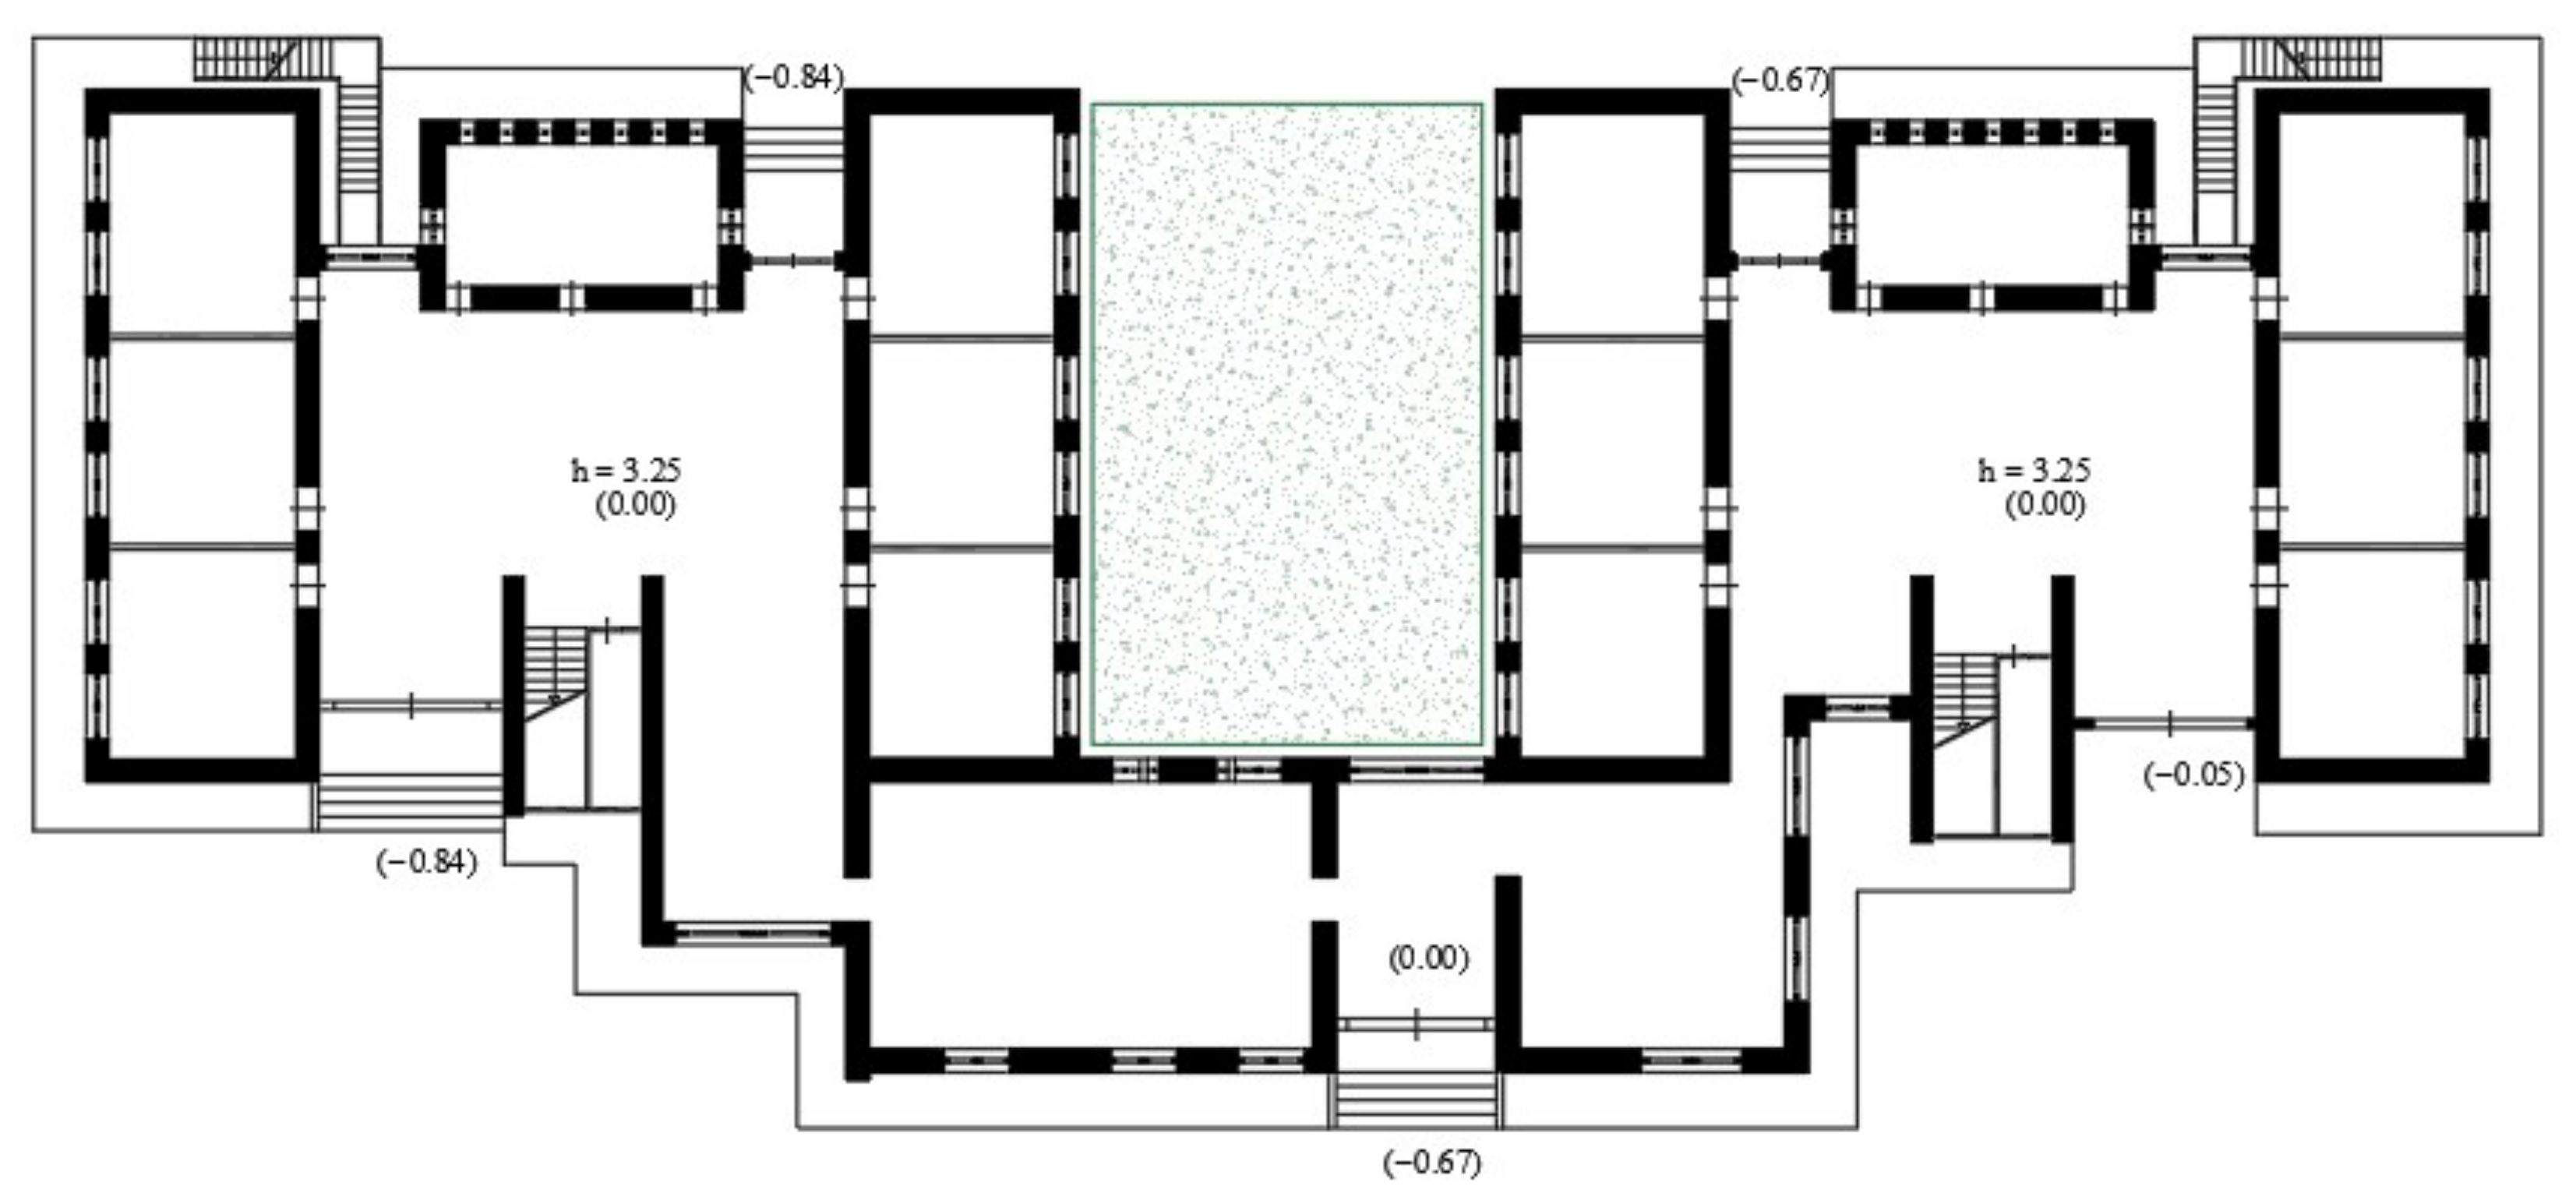
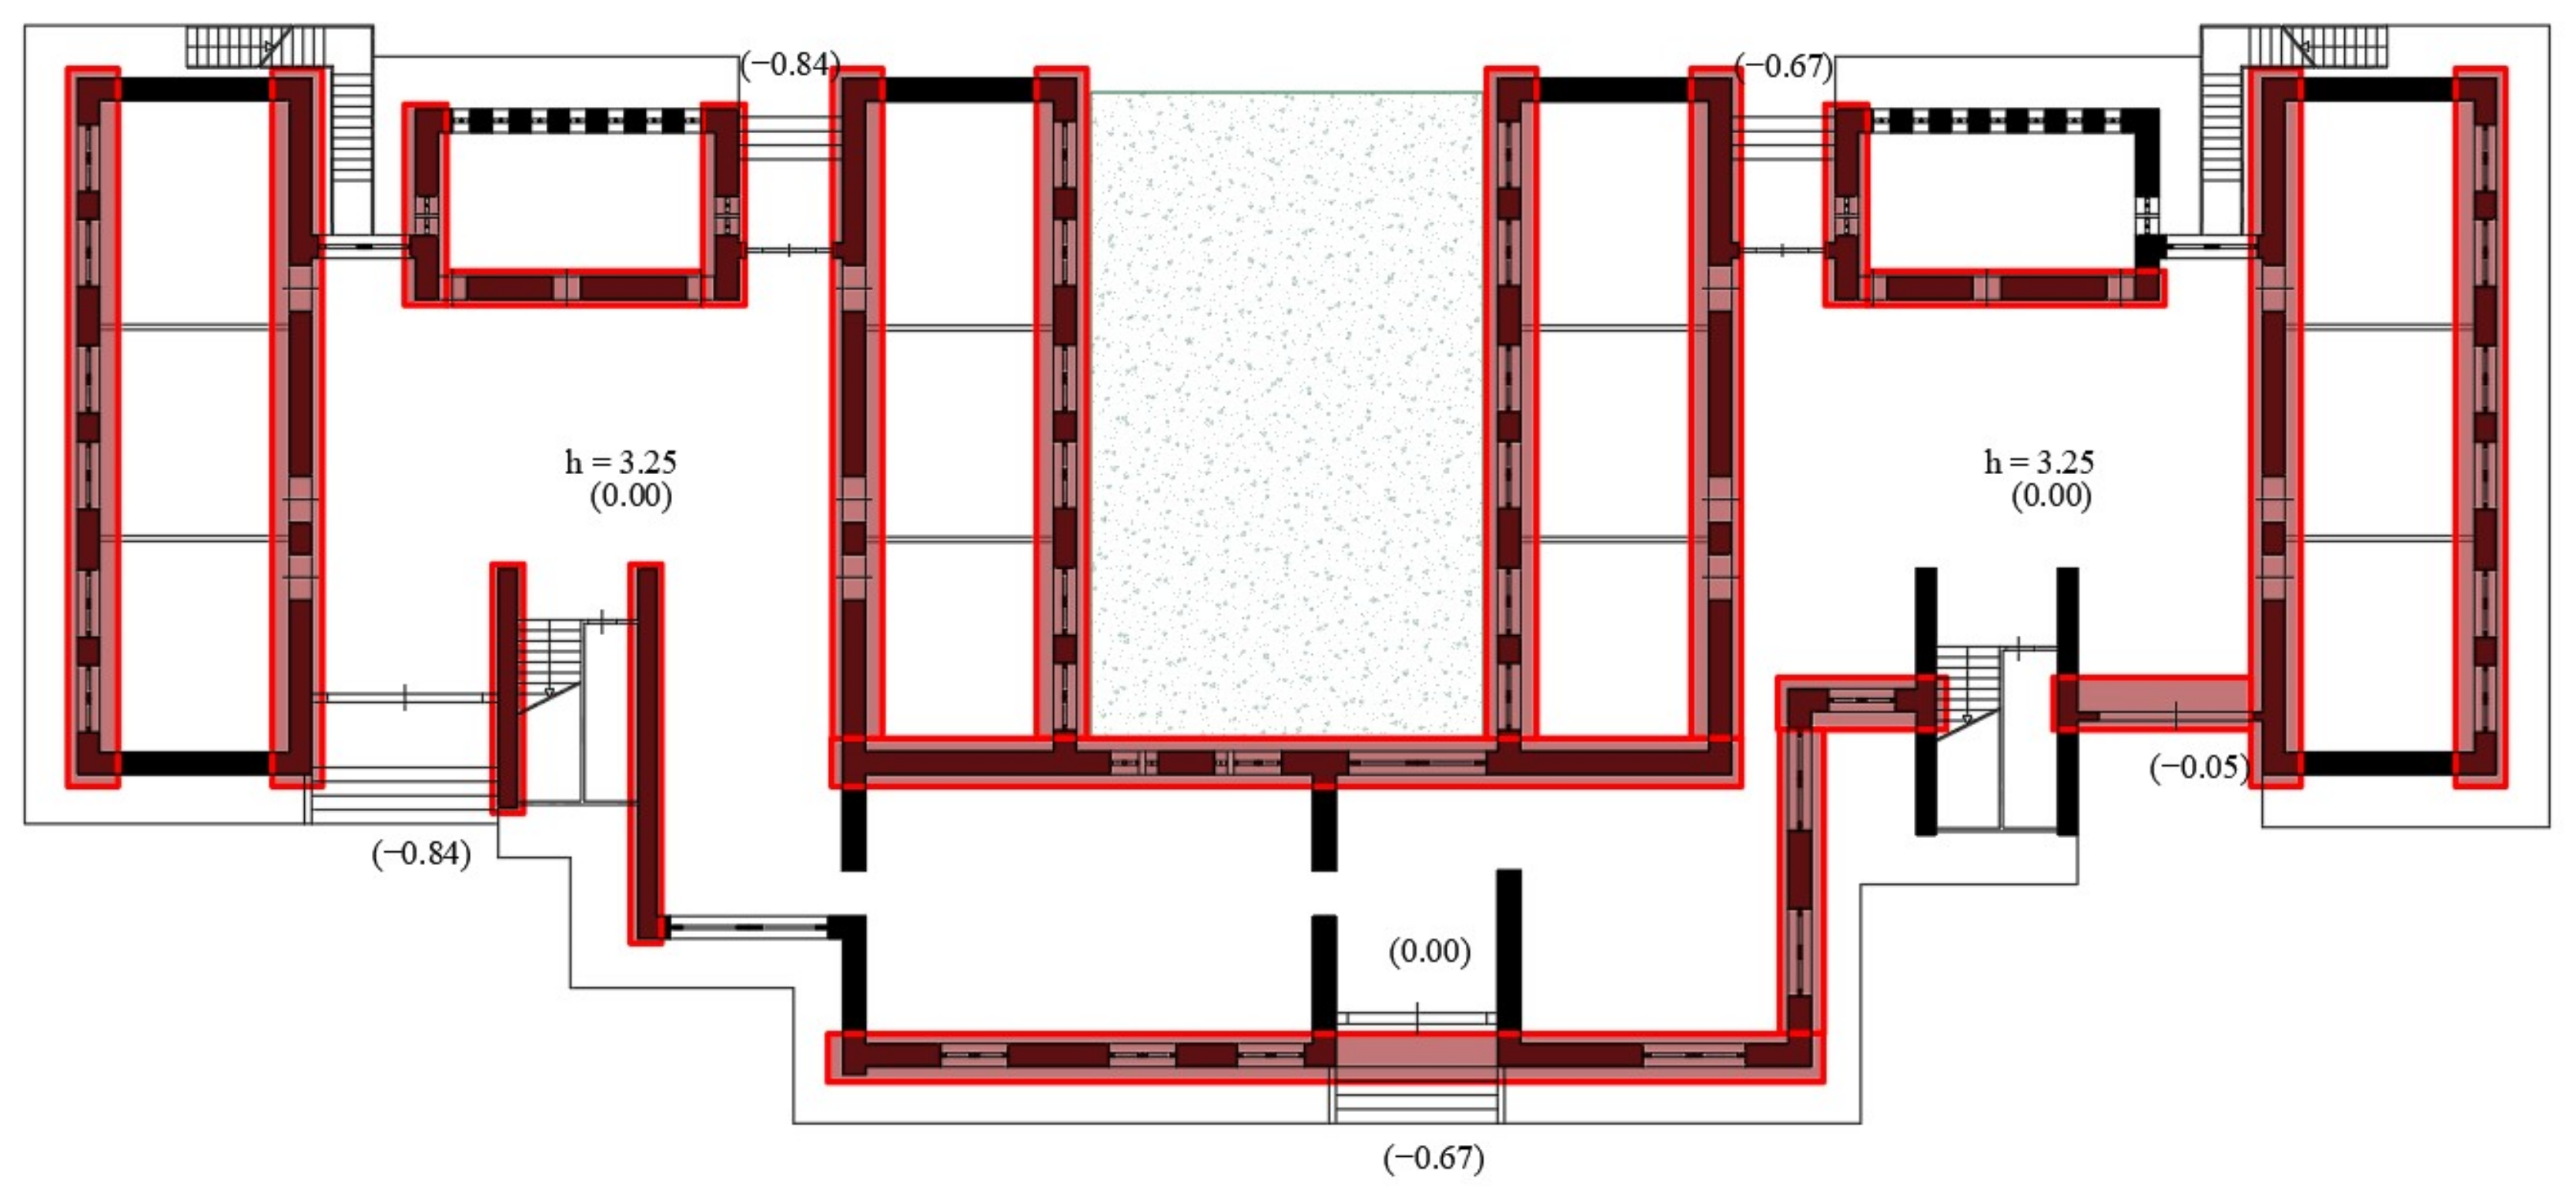
Figure 5.
First level plan layout.
Figure 5.
First level plan layout.
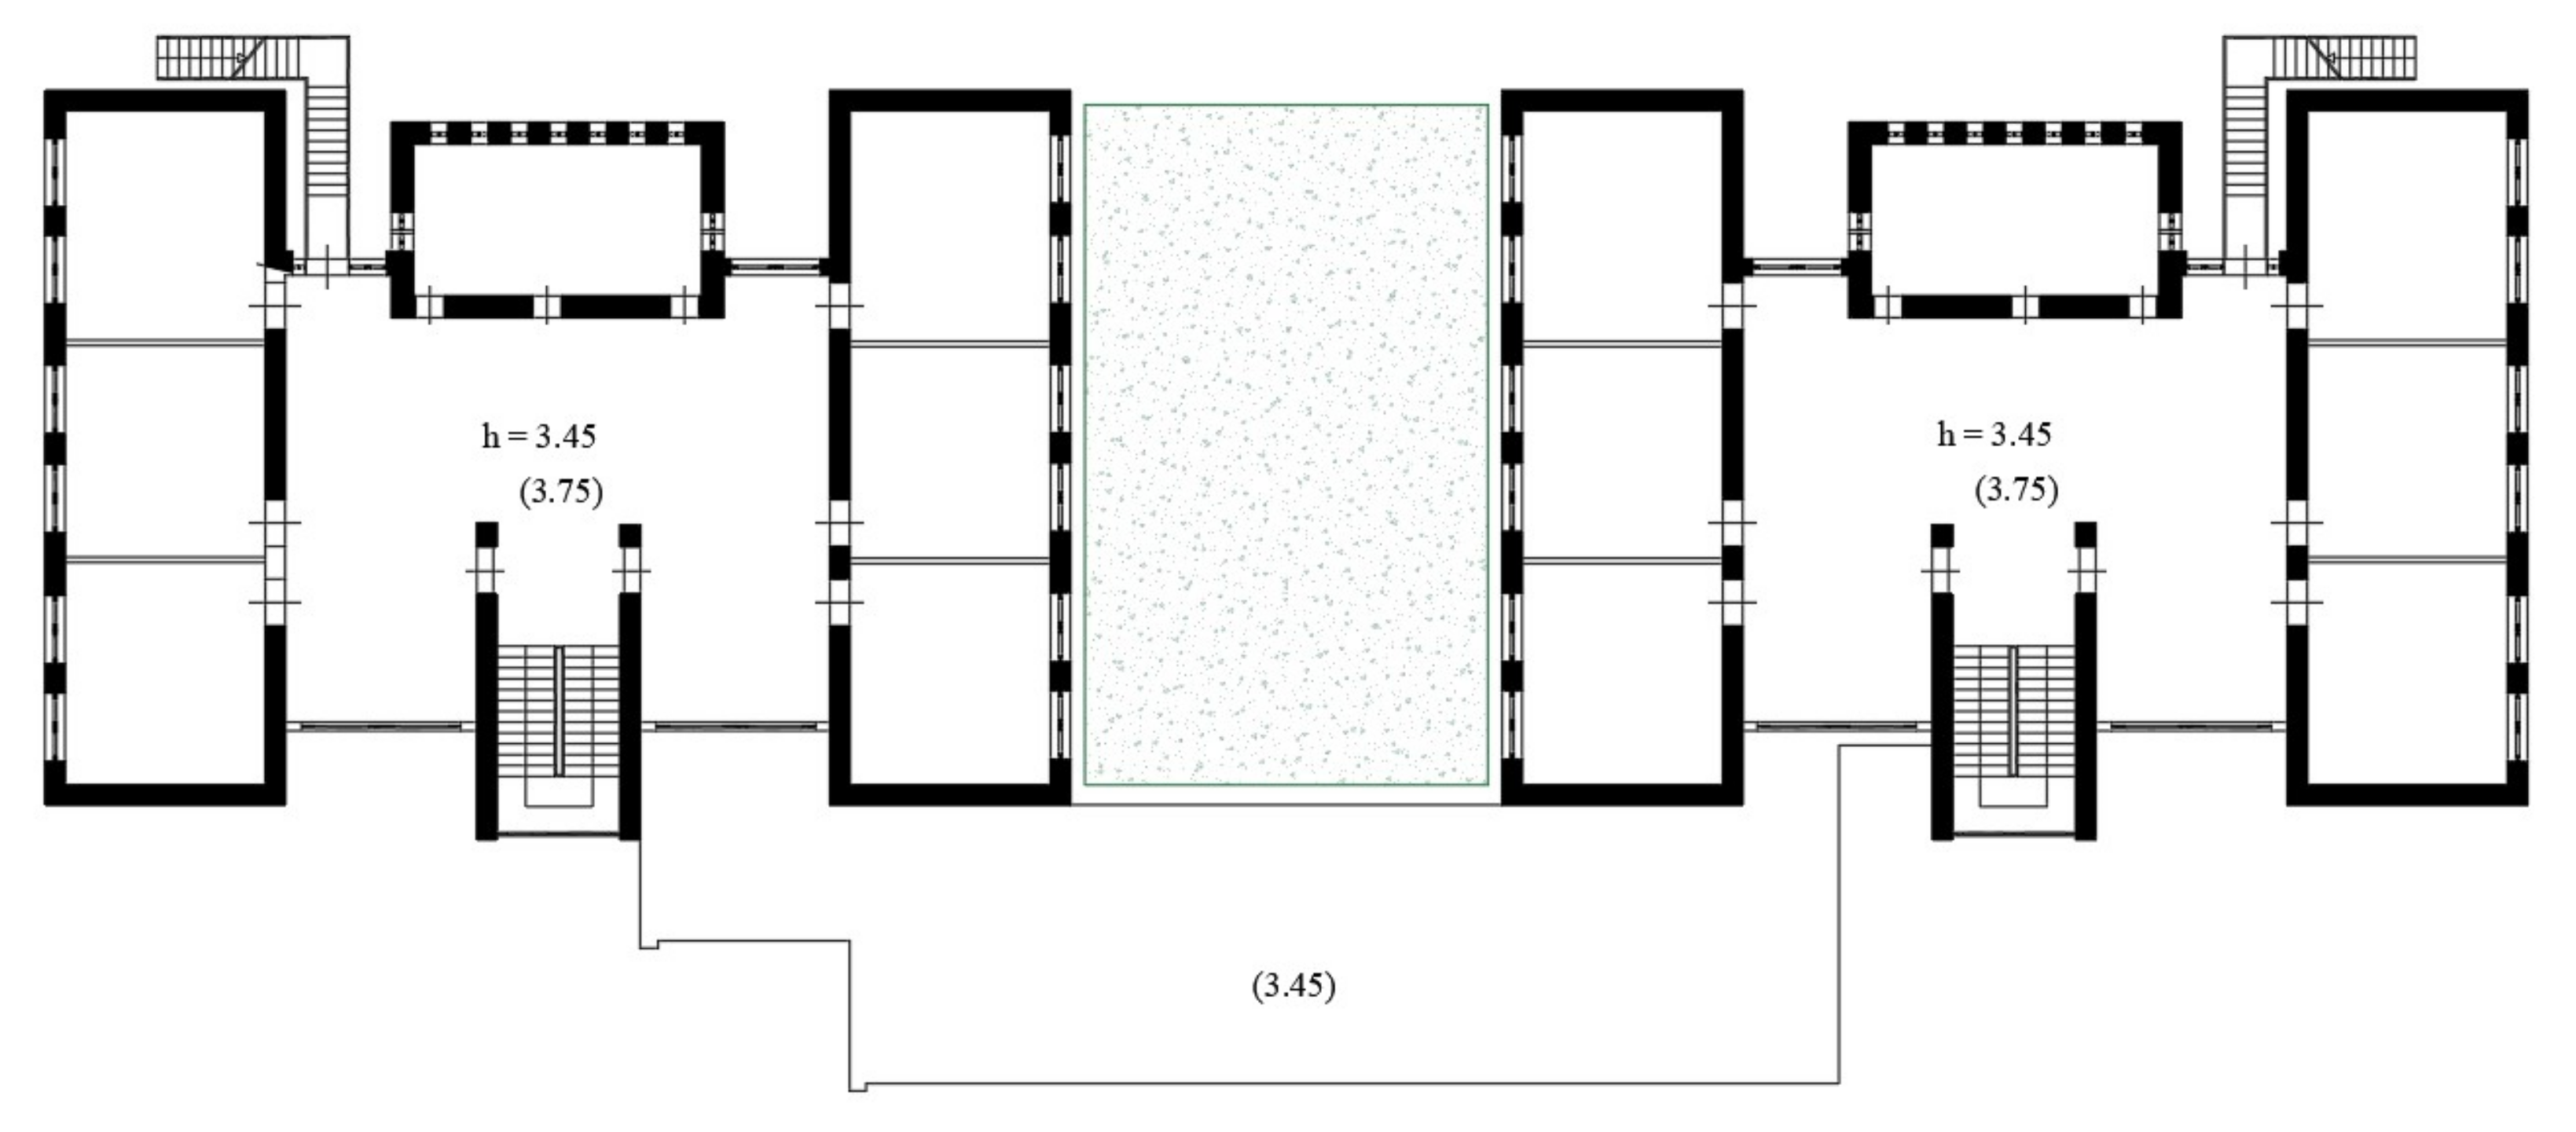
Figure 6.
Second level plan layout.
Figure 6.
Second level plan layout.
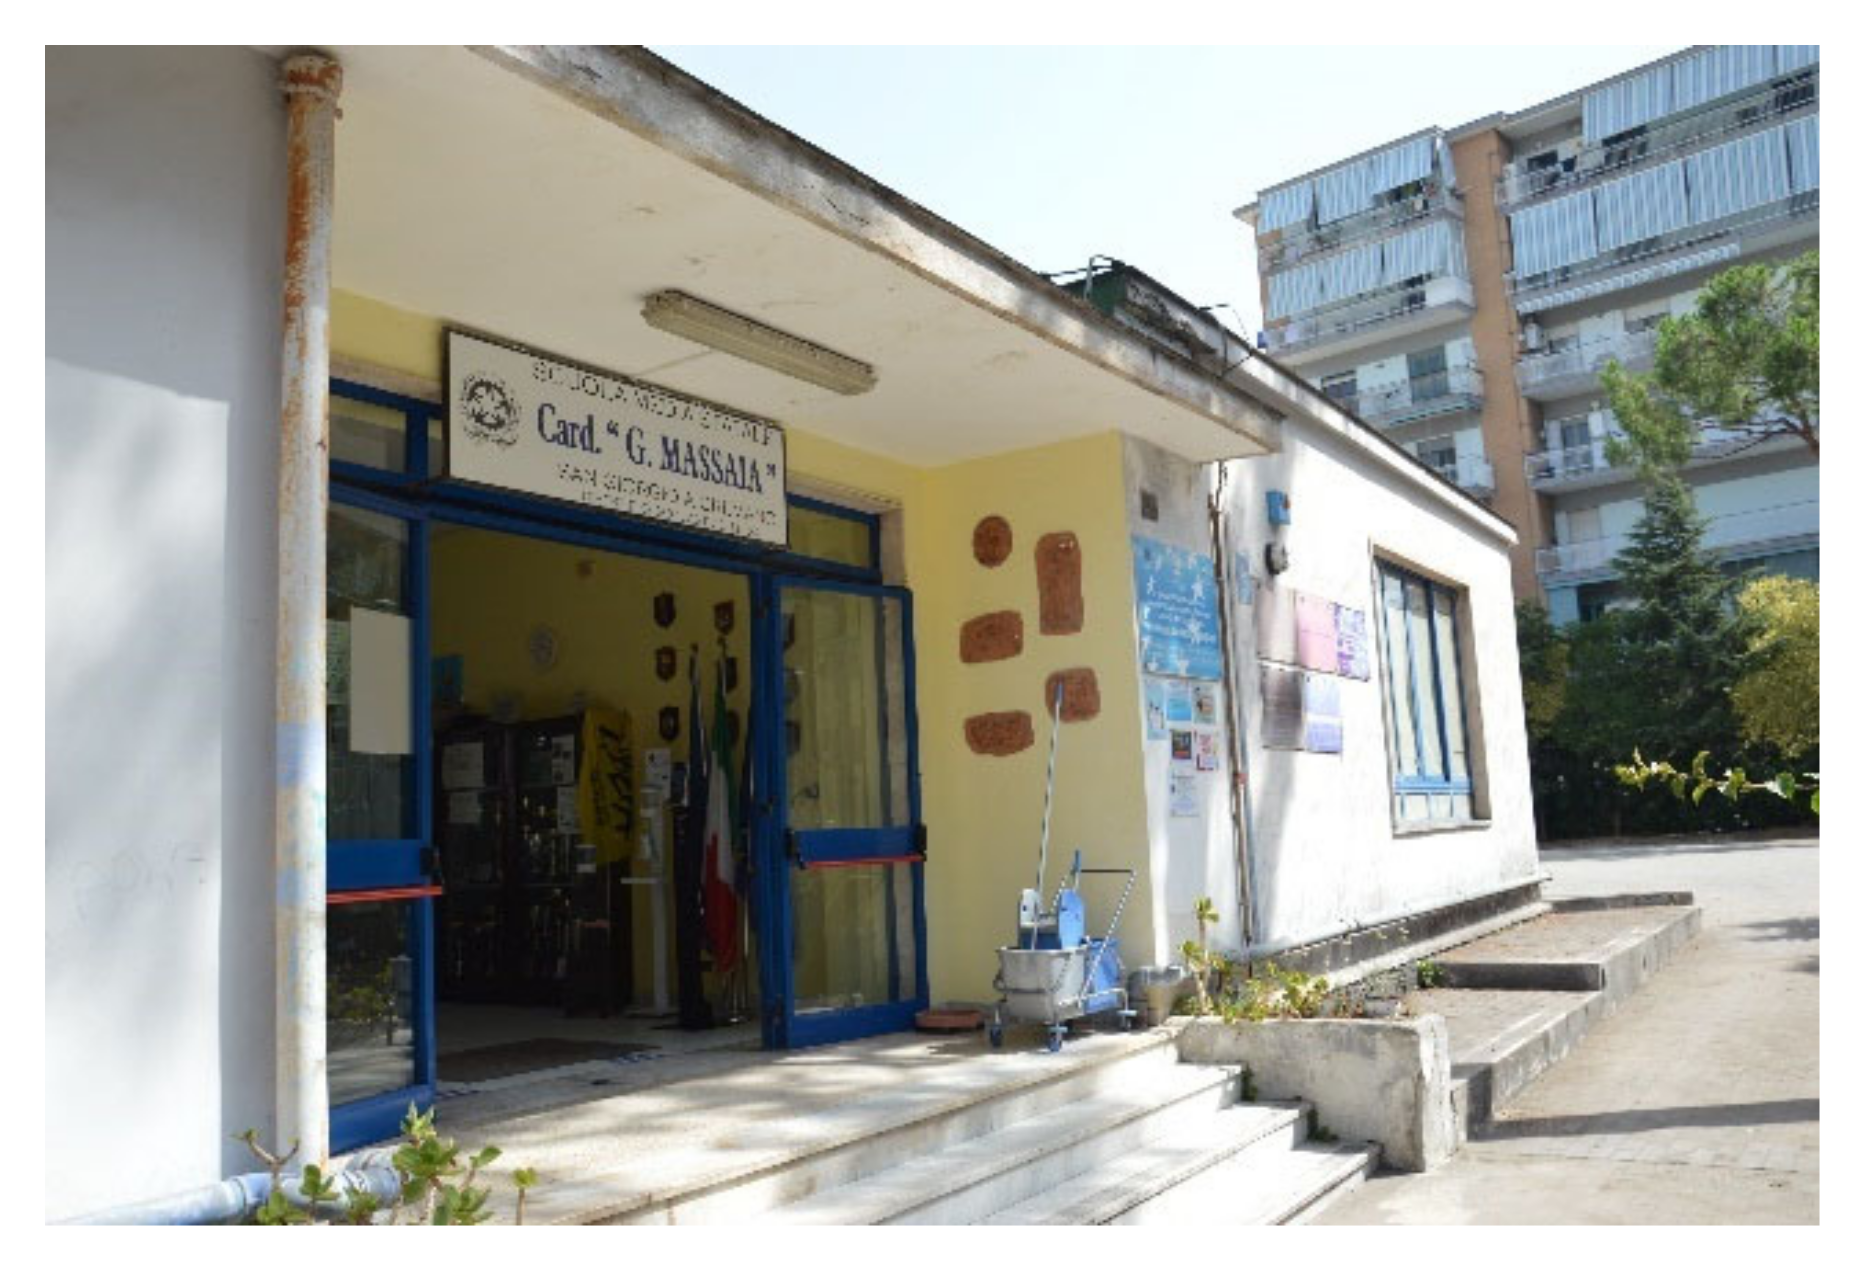
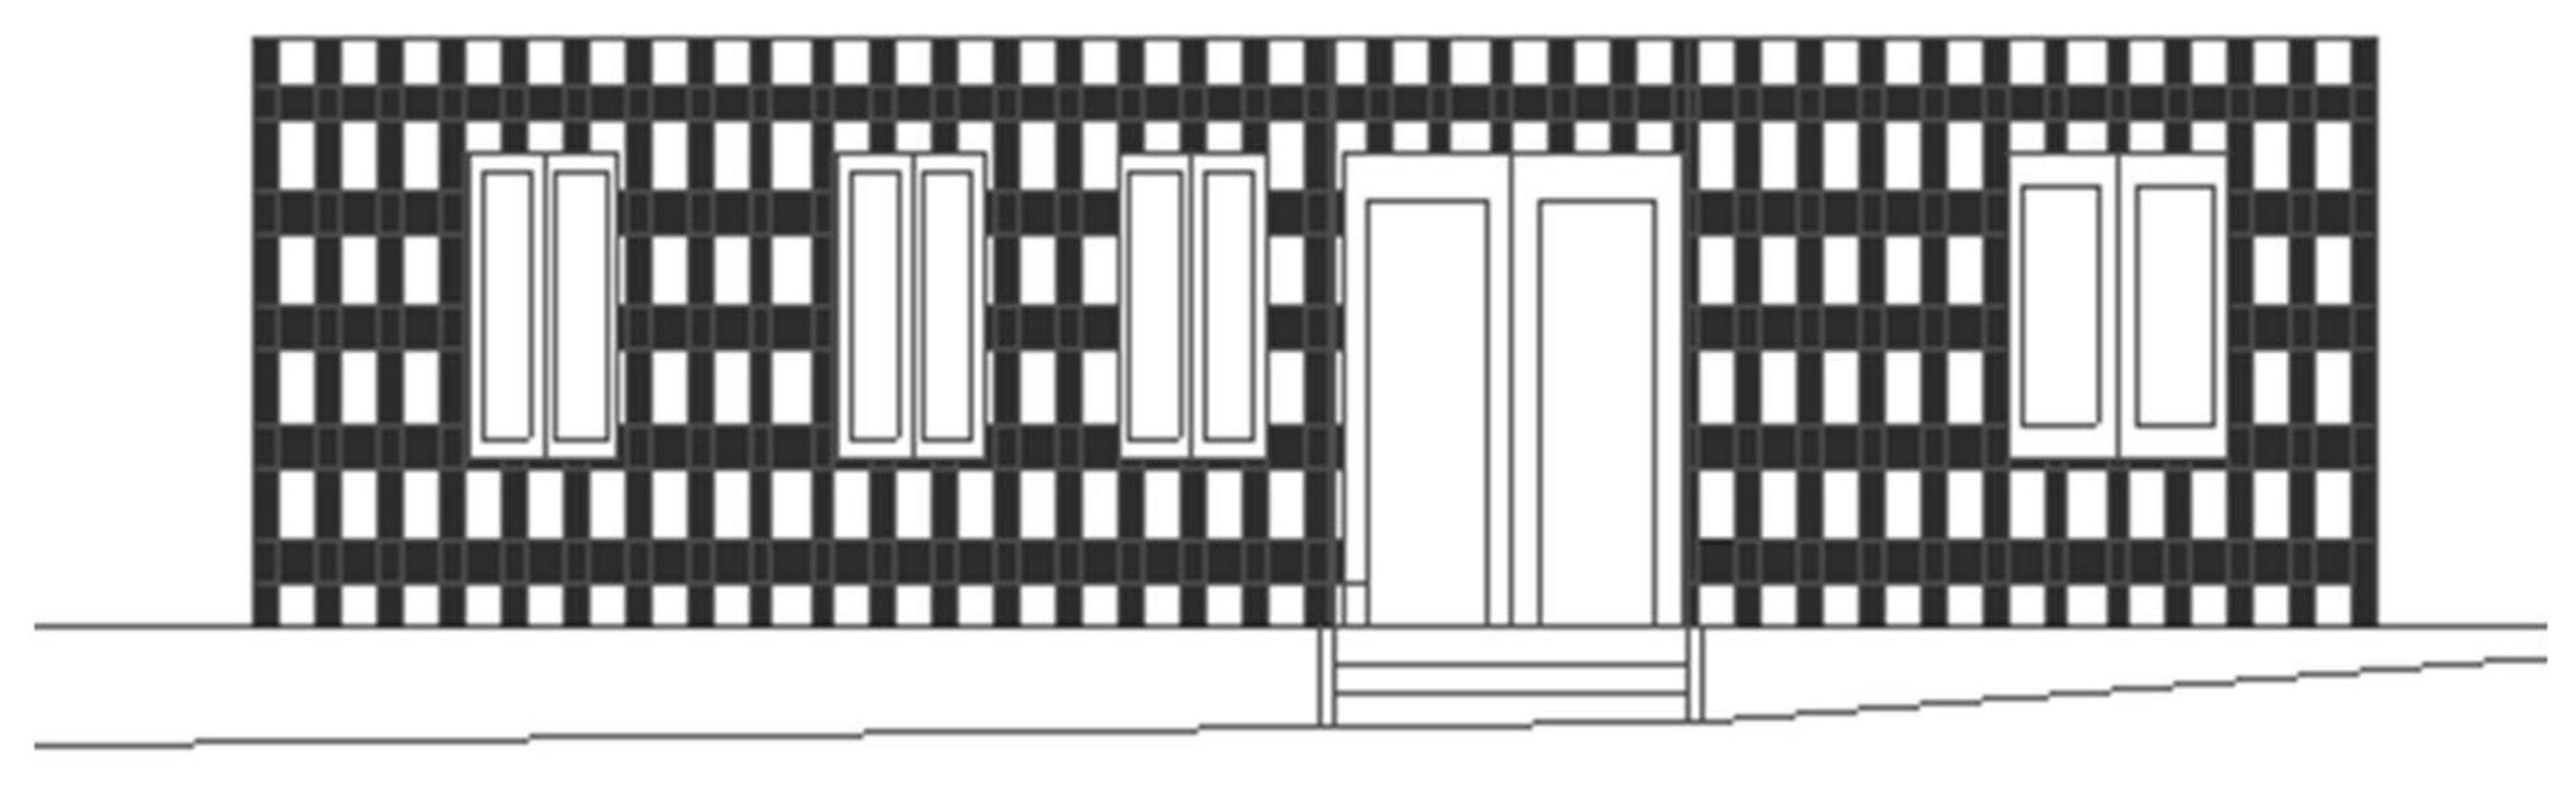
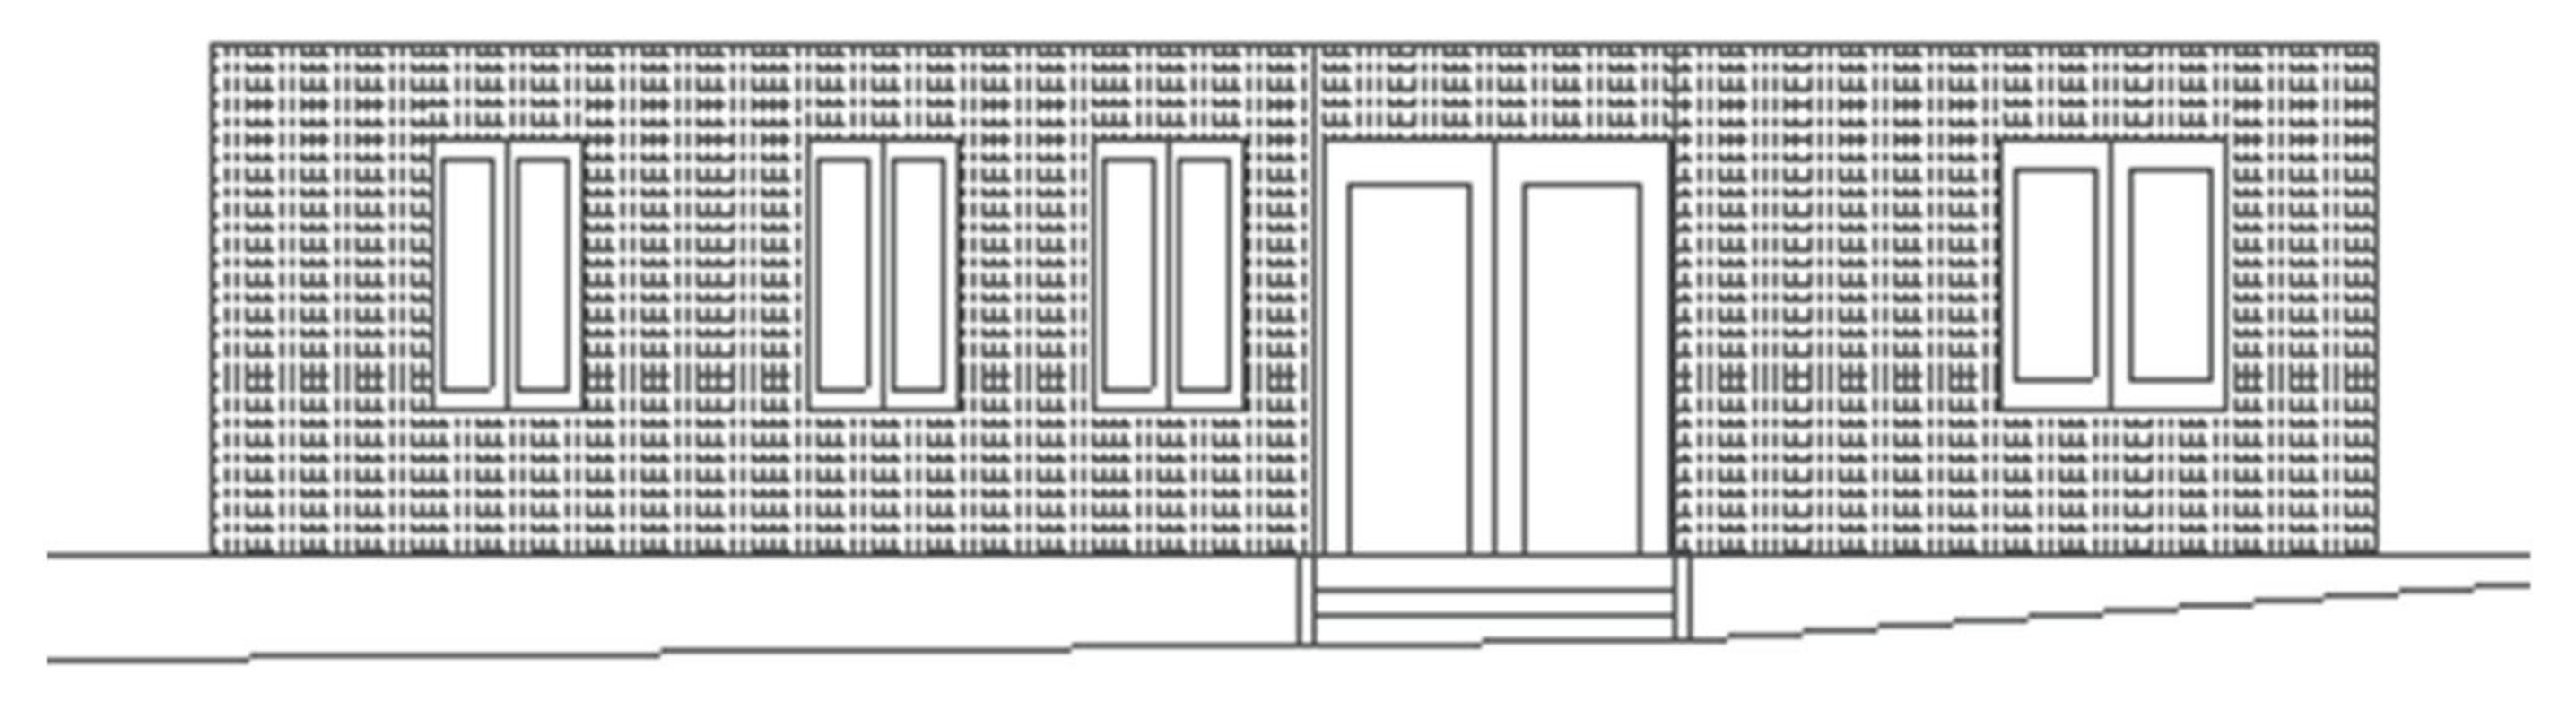
Figure 7.
The entrance of the school “Massaia”.
Figure 7.
The entrance of the school “Massaia”.
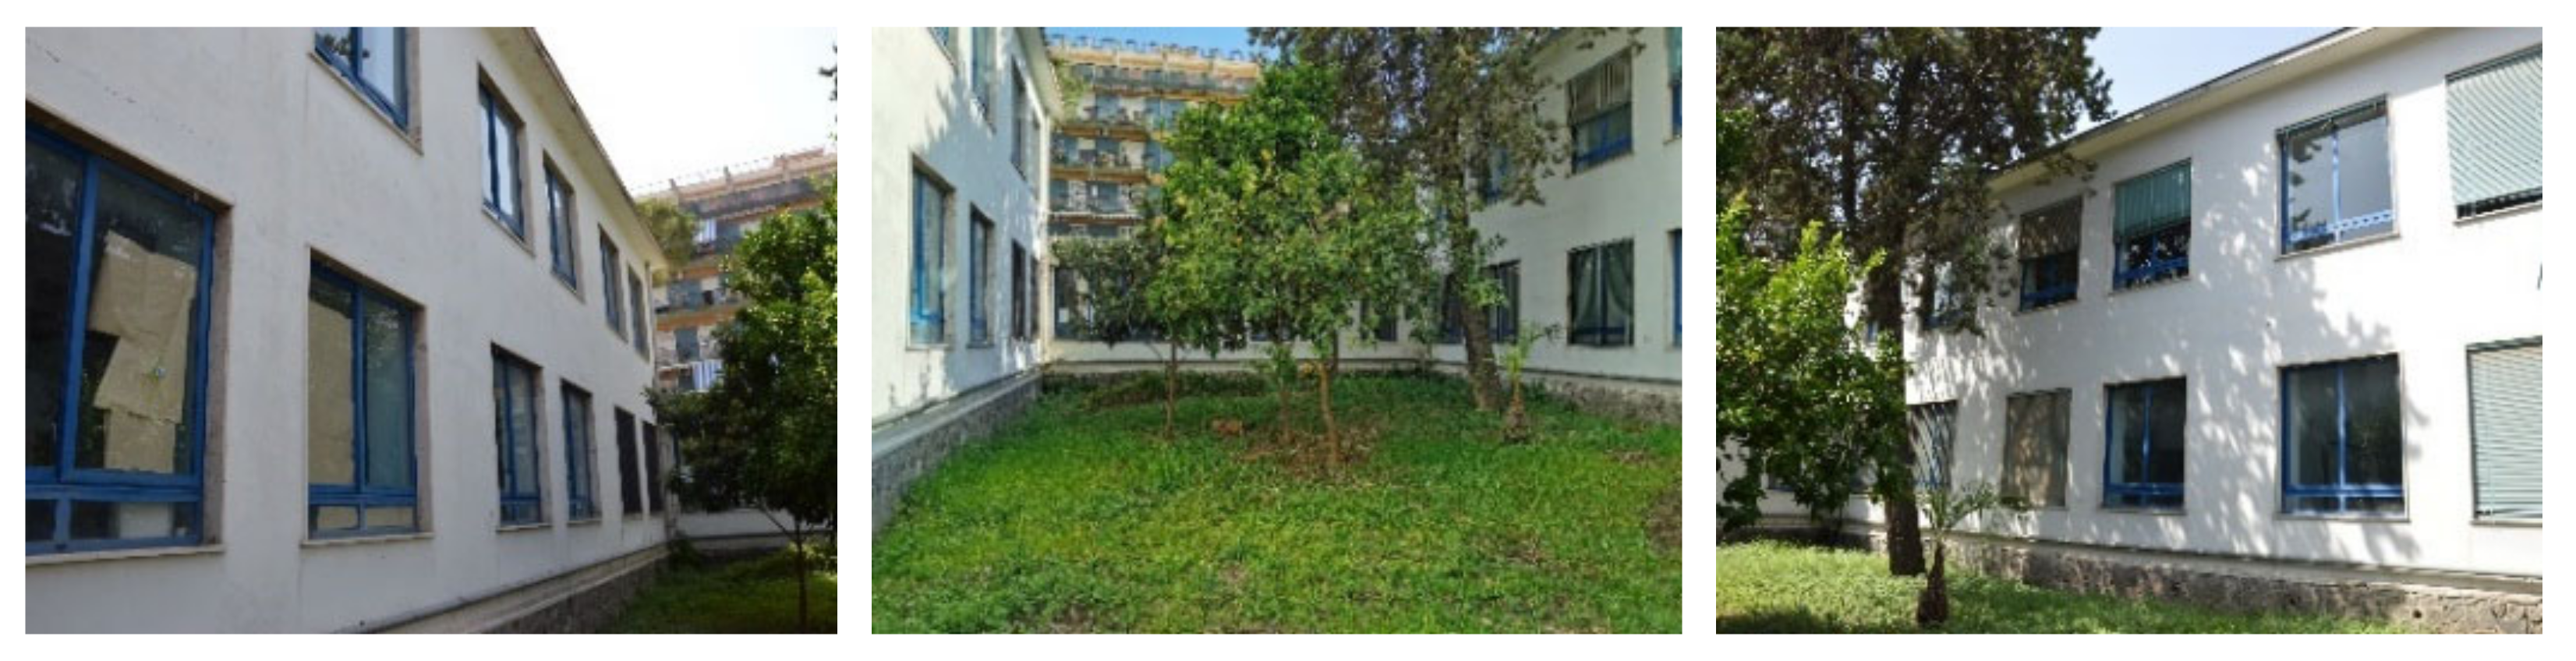
Figure 8.
Some internal courtyard/garden views.
Figure 8.
Some internal courtyard/garden views.
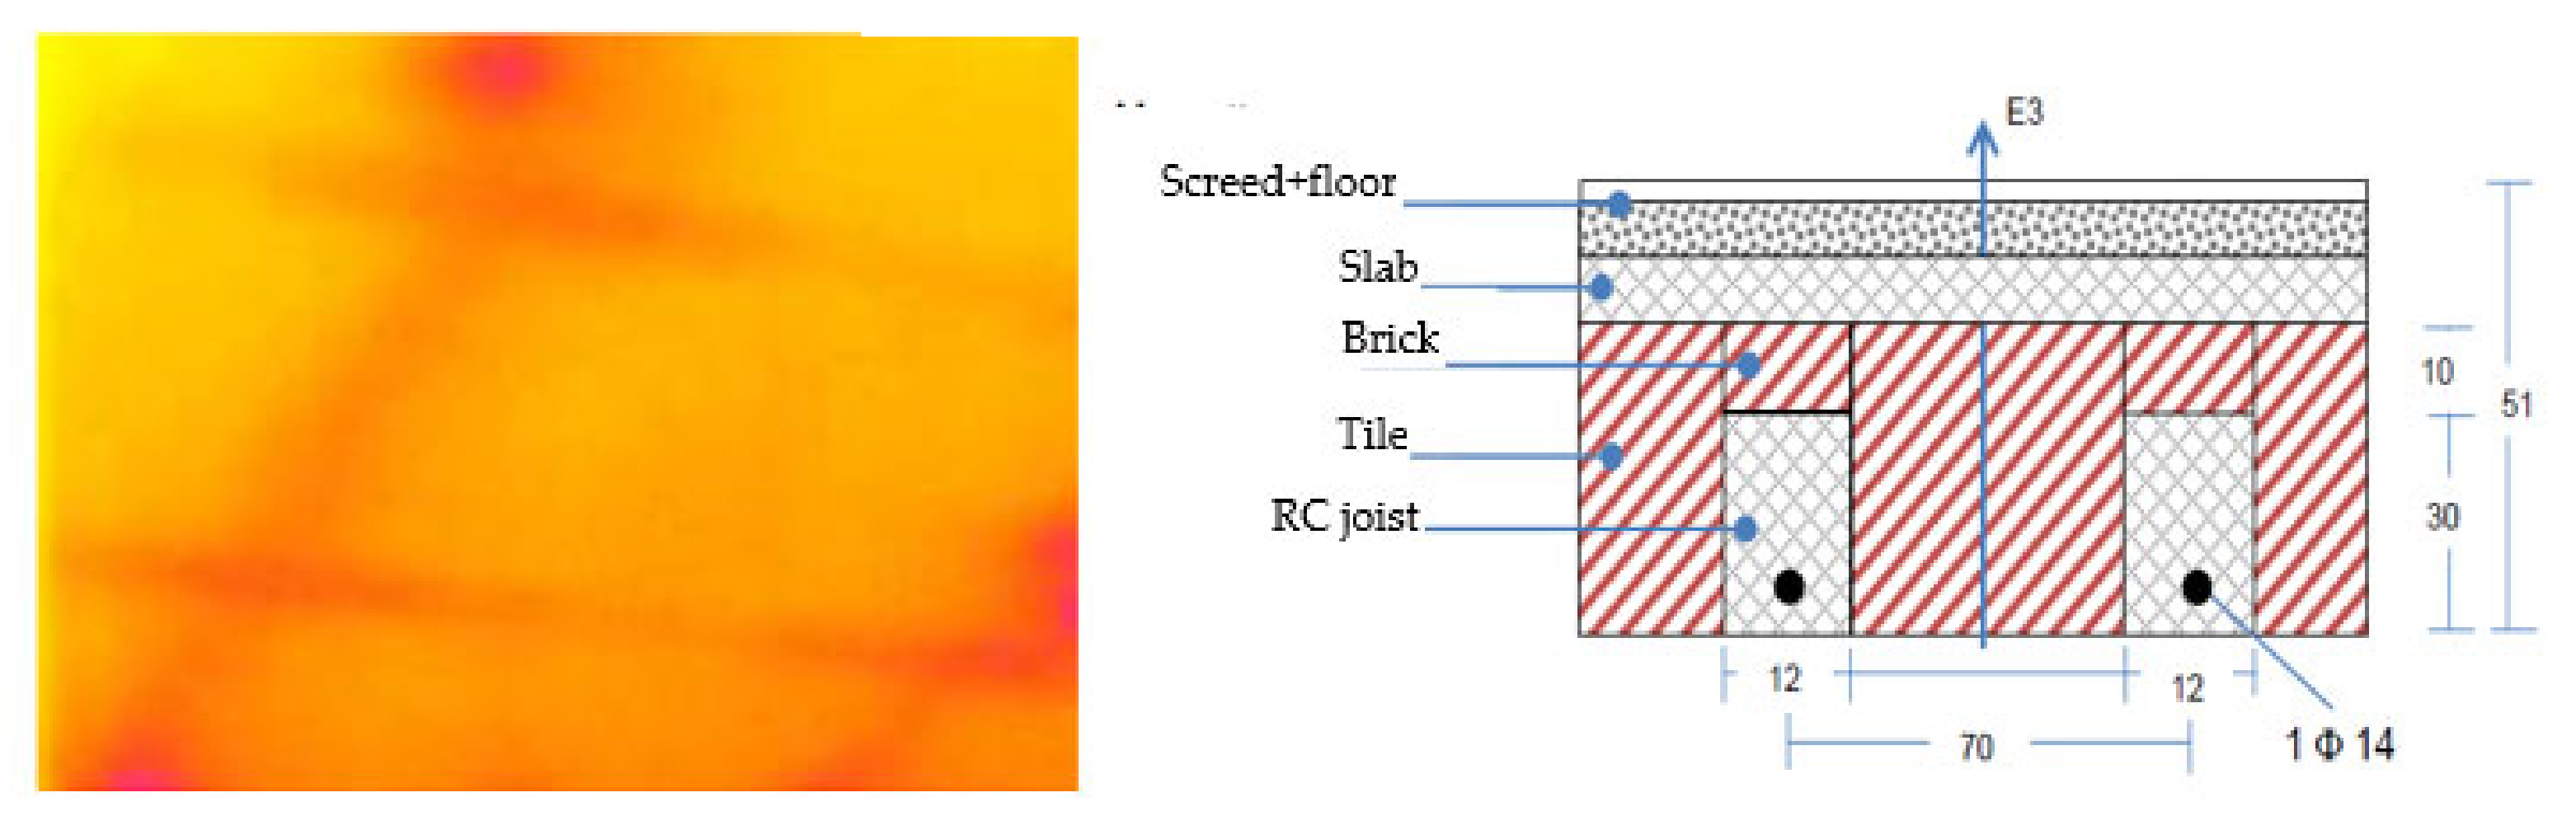
Figure 9.
Ground level floor made of RC joists and tiles.
Figure 9.
Ground level floor made of RC joists and tiles.
Figure 10.
First level ribbed floor.
Figure 10.
First level ribbed floor.
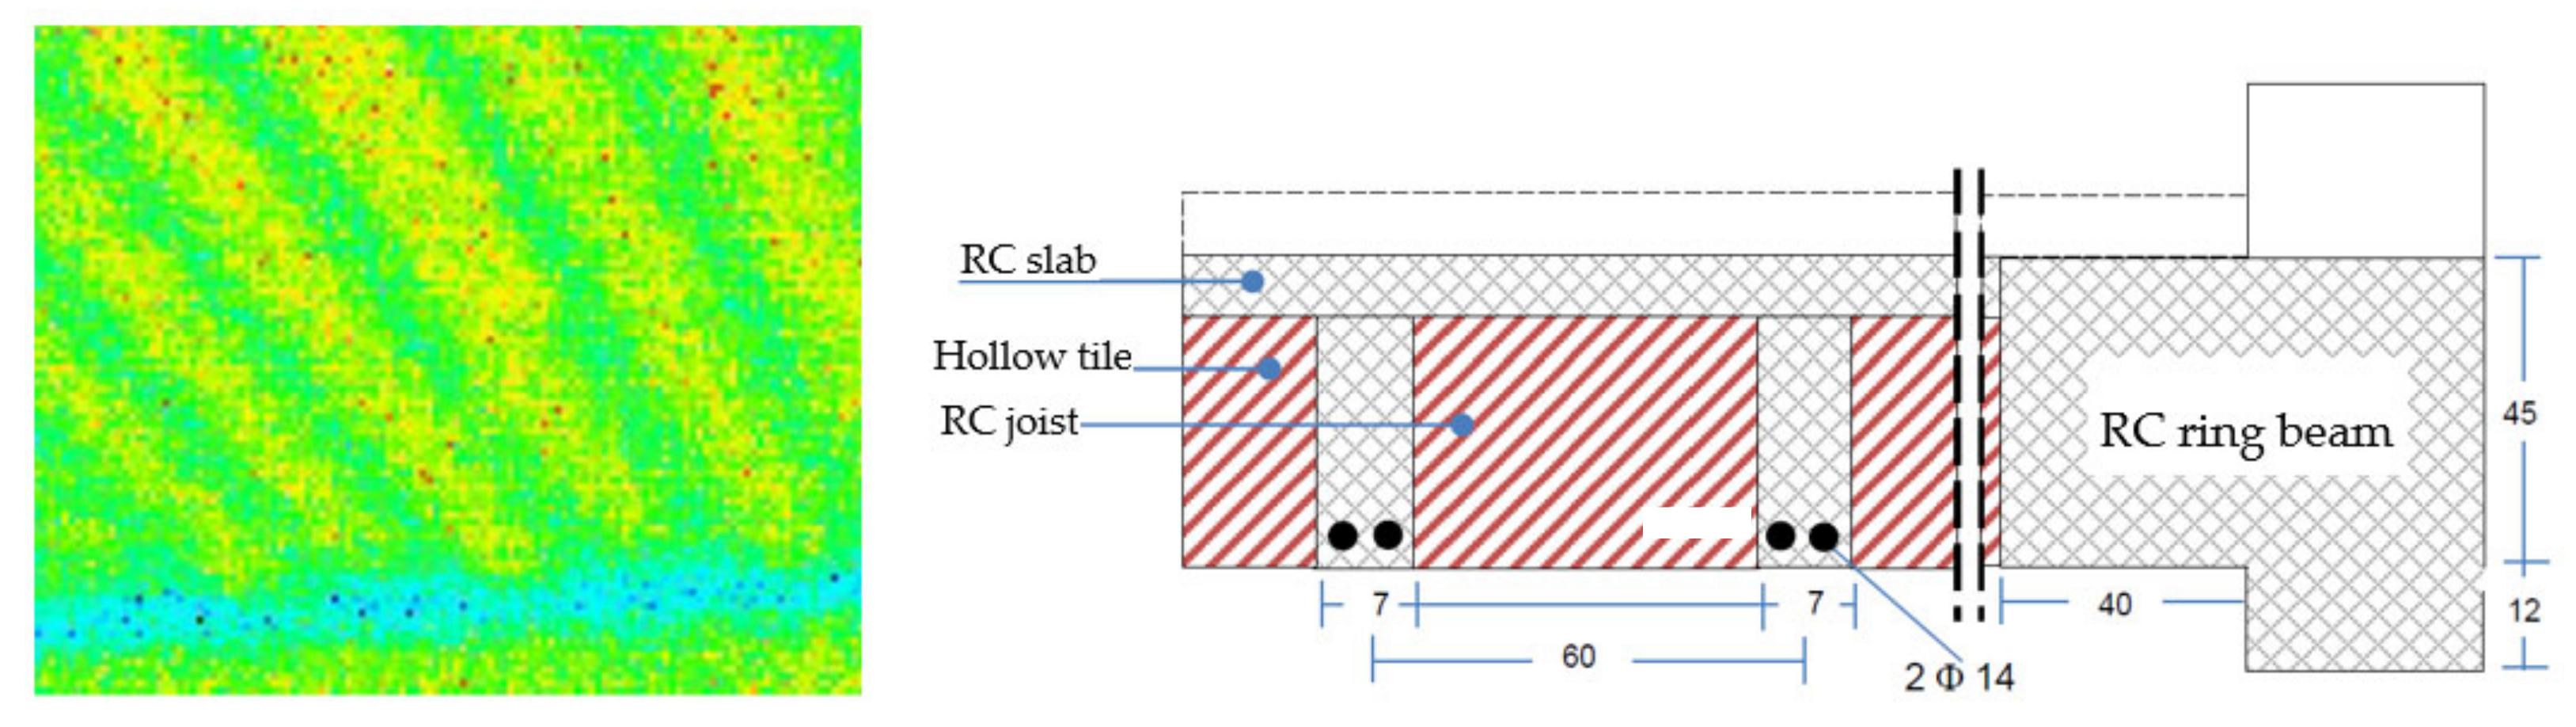
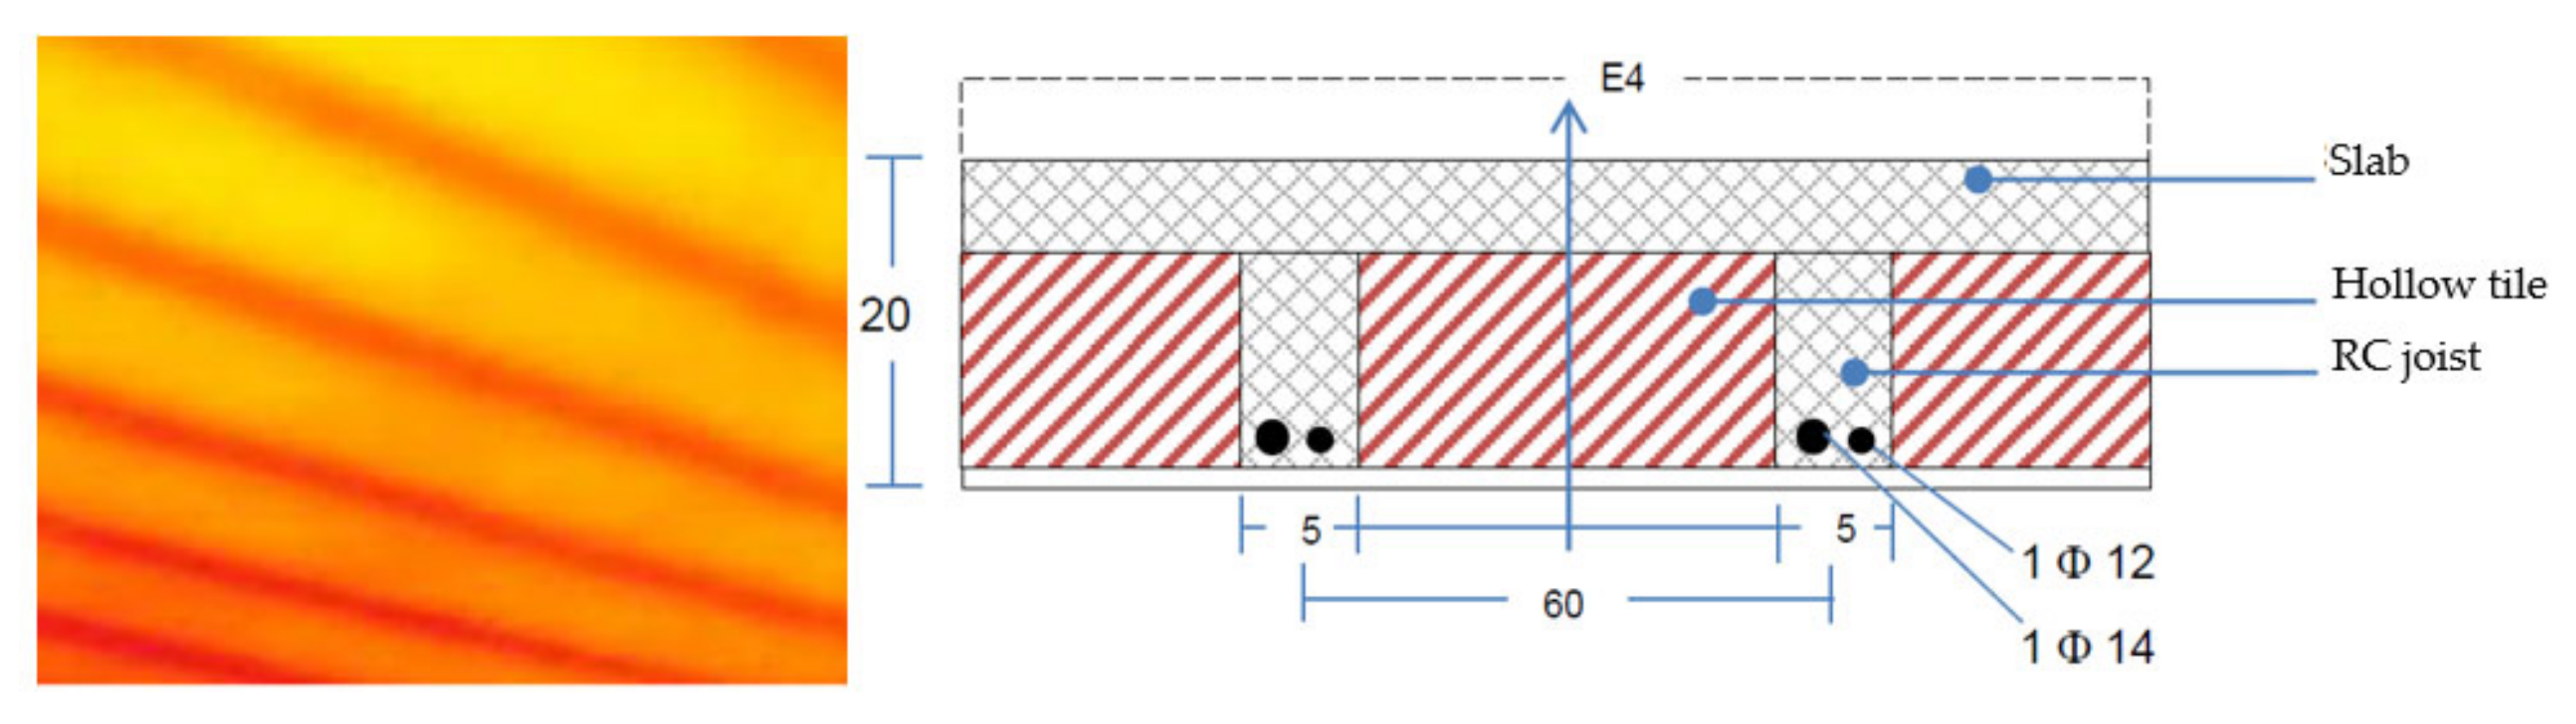
Figure 11.
Mixed RC joists-hollow tiles floor at first level.
Figure 11.
Mixed RC joists-hollow tiles floor at first level.
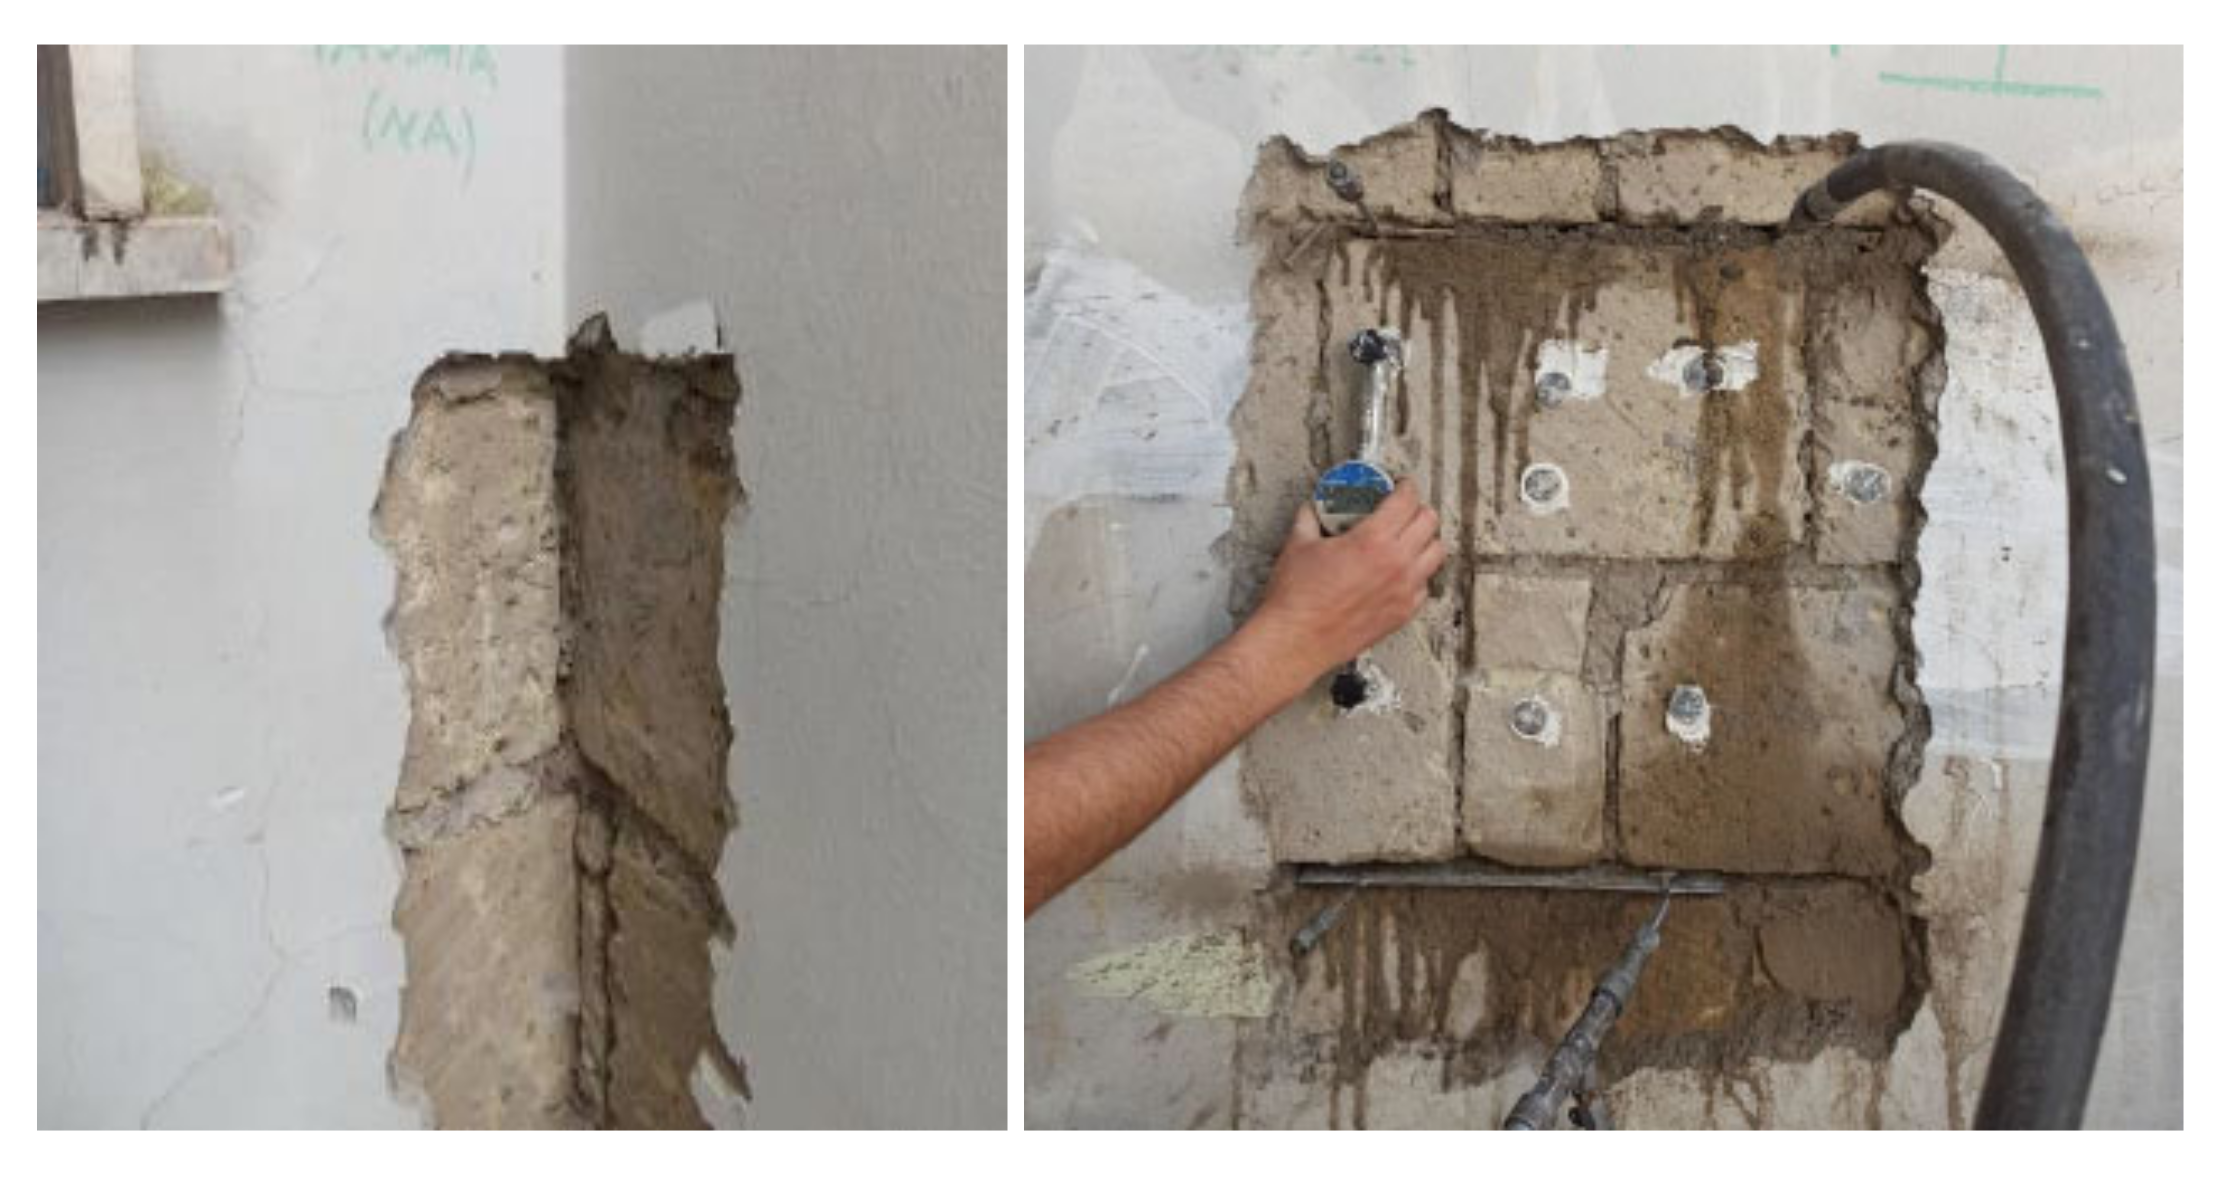
Figure 12.
Corner detail and flat jack test of masonry walls made of Neapolitan yellow tuff stones.
Figure 12.
Corner detail and flat jack test of masonry walls made of Neapolitan yellow tuff stones.
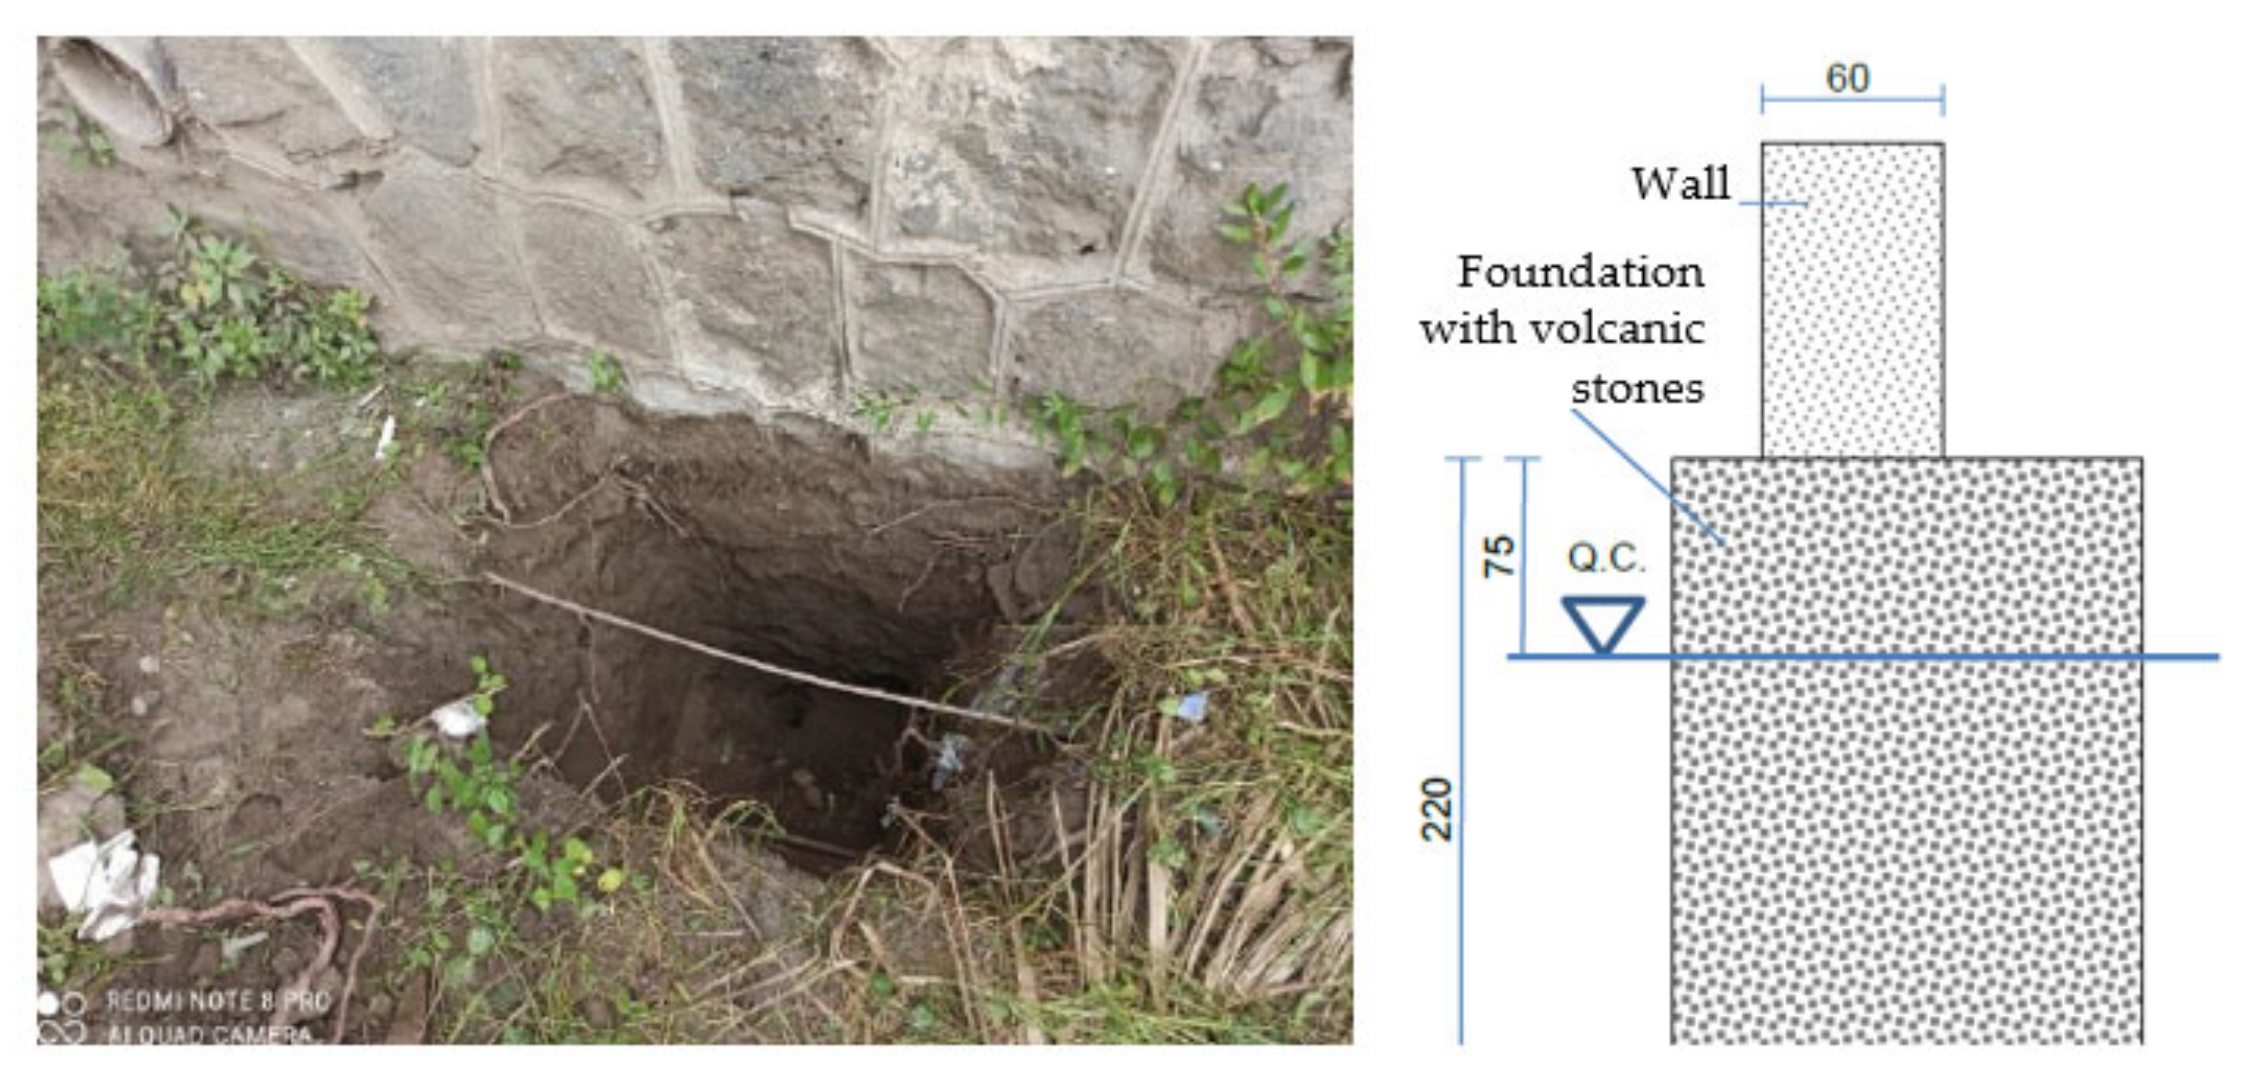
Figure 13.
Investigation on foundation.
Figure 13.
Investigation on foundation.
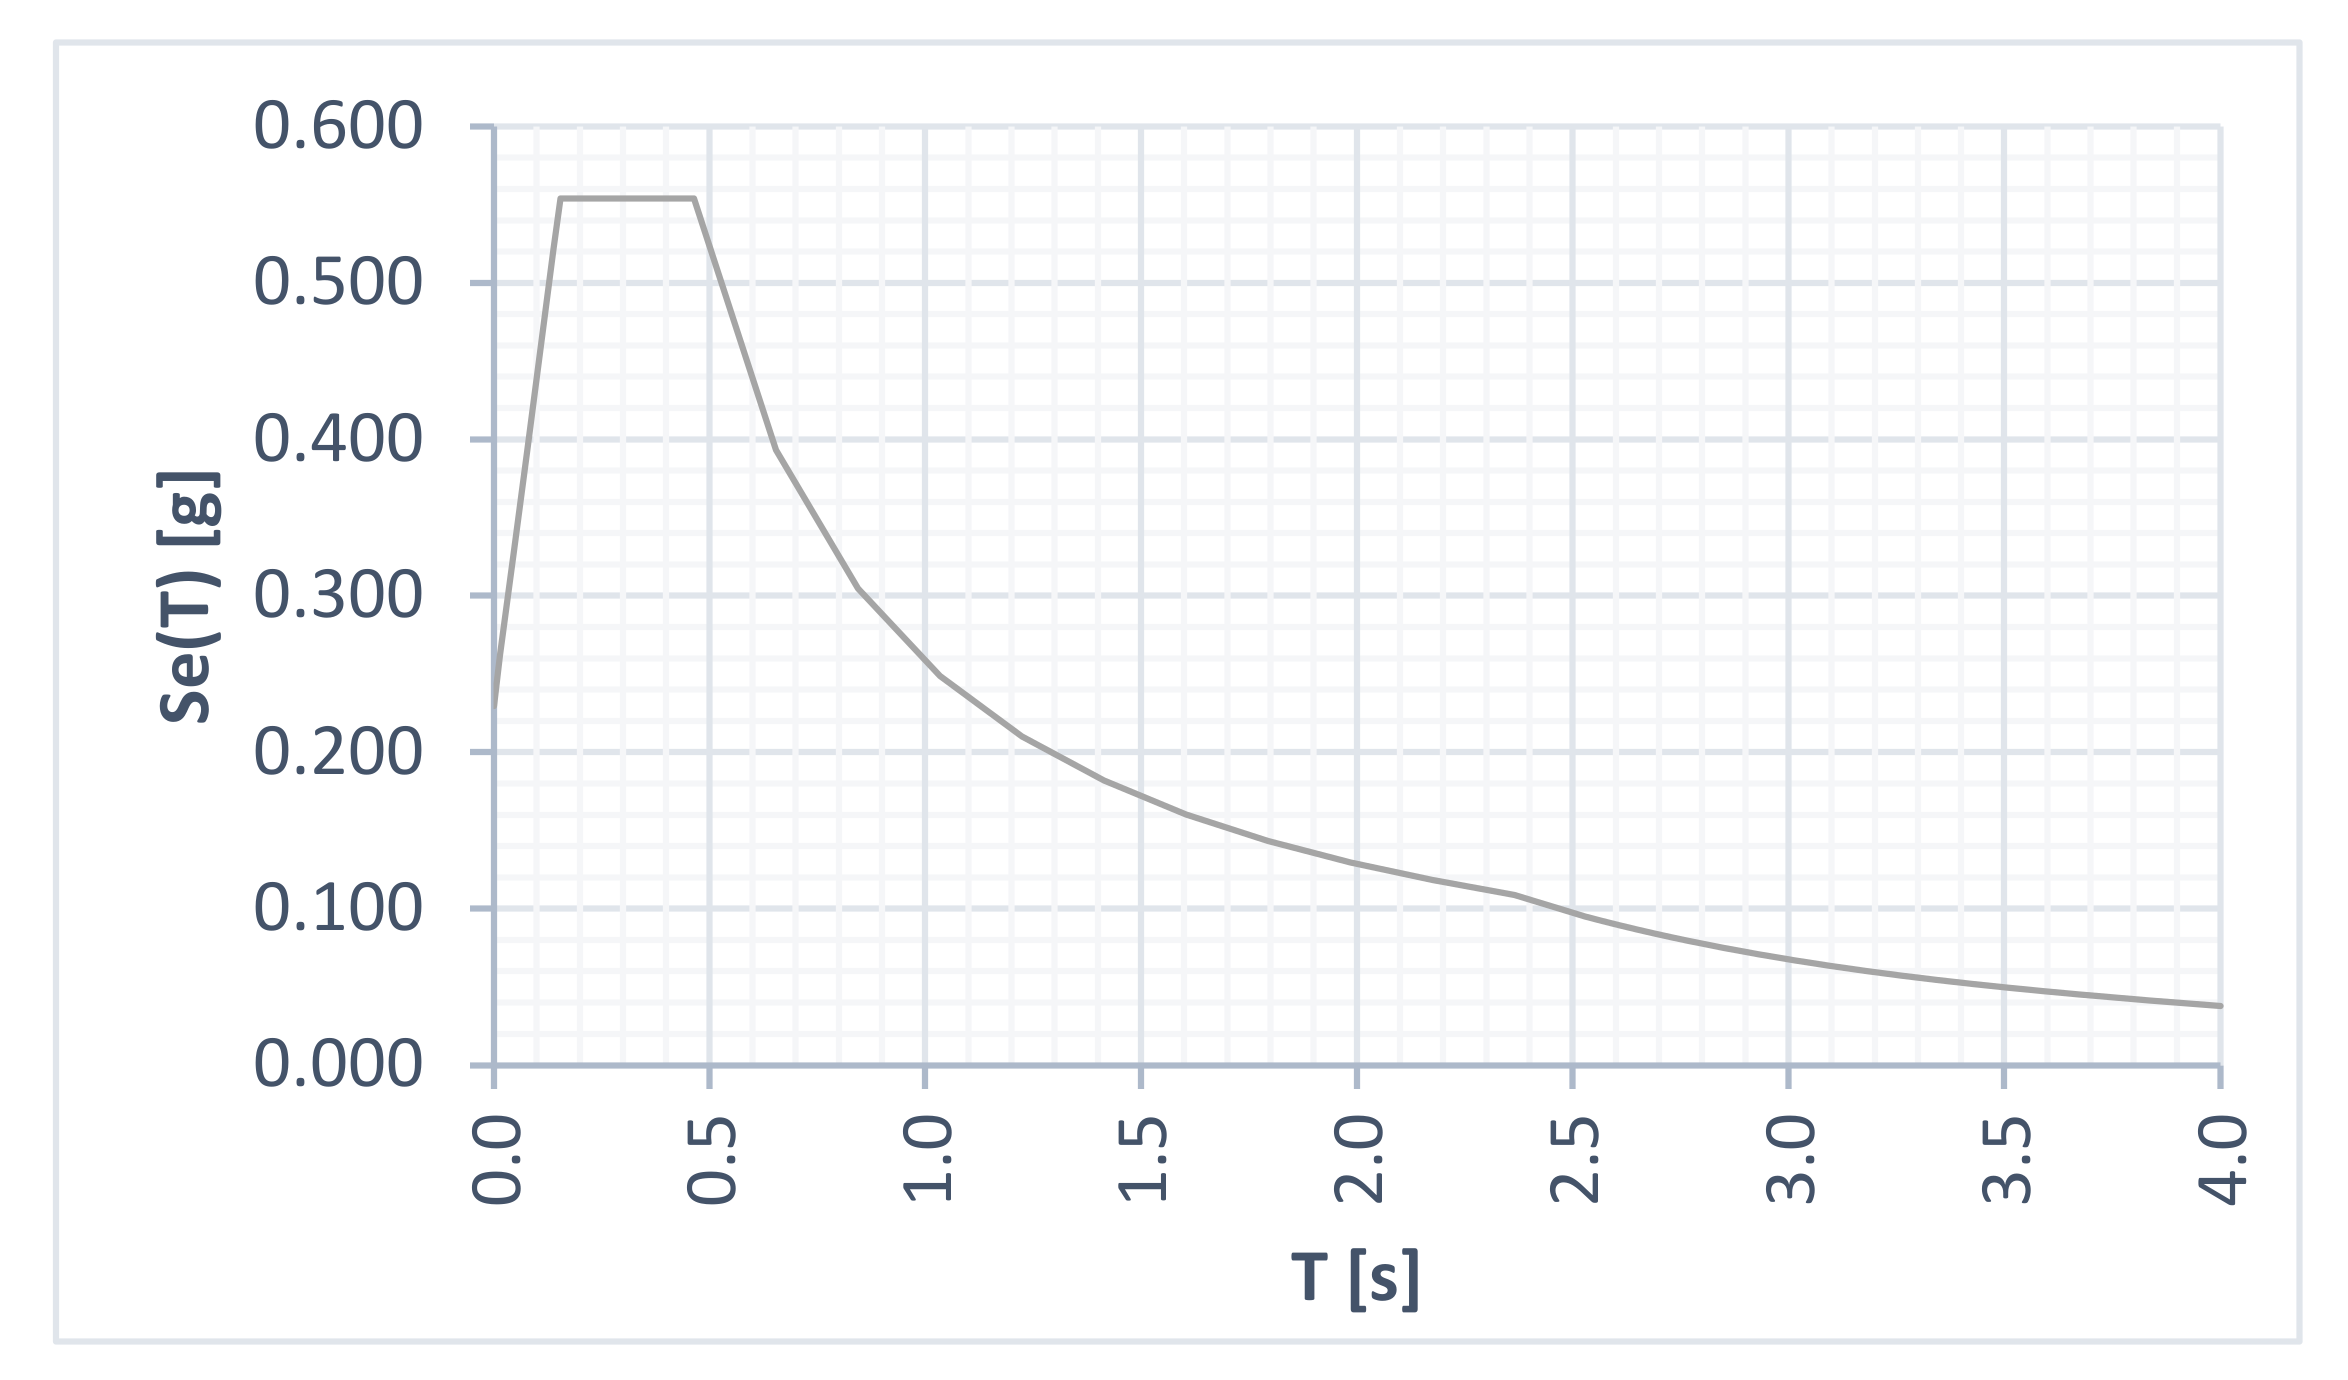
Figure 14.
Elastic response spectrum at LS limit state.
Figure 14.
Elastic response spectrum at LS limit state.
Figure 15.
View of the 3Muri model of the school building.
Figure 15.
View of the 3Muri model of the school building.
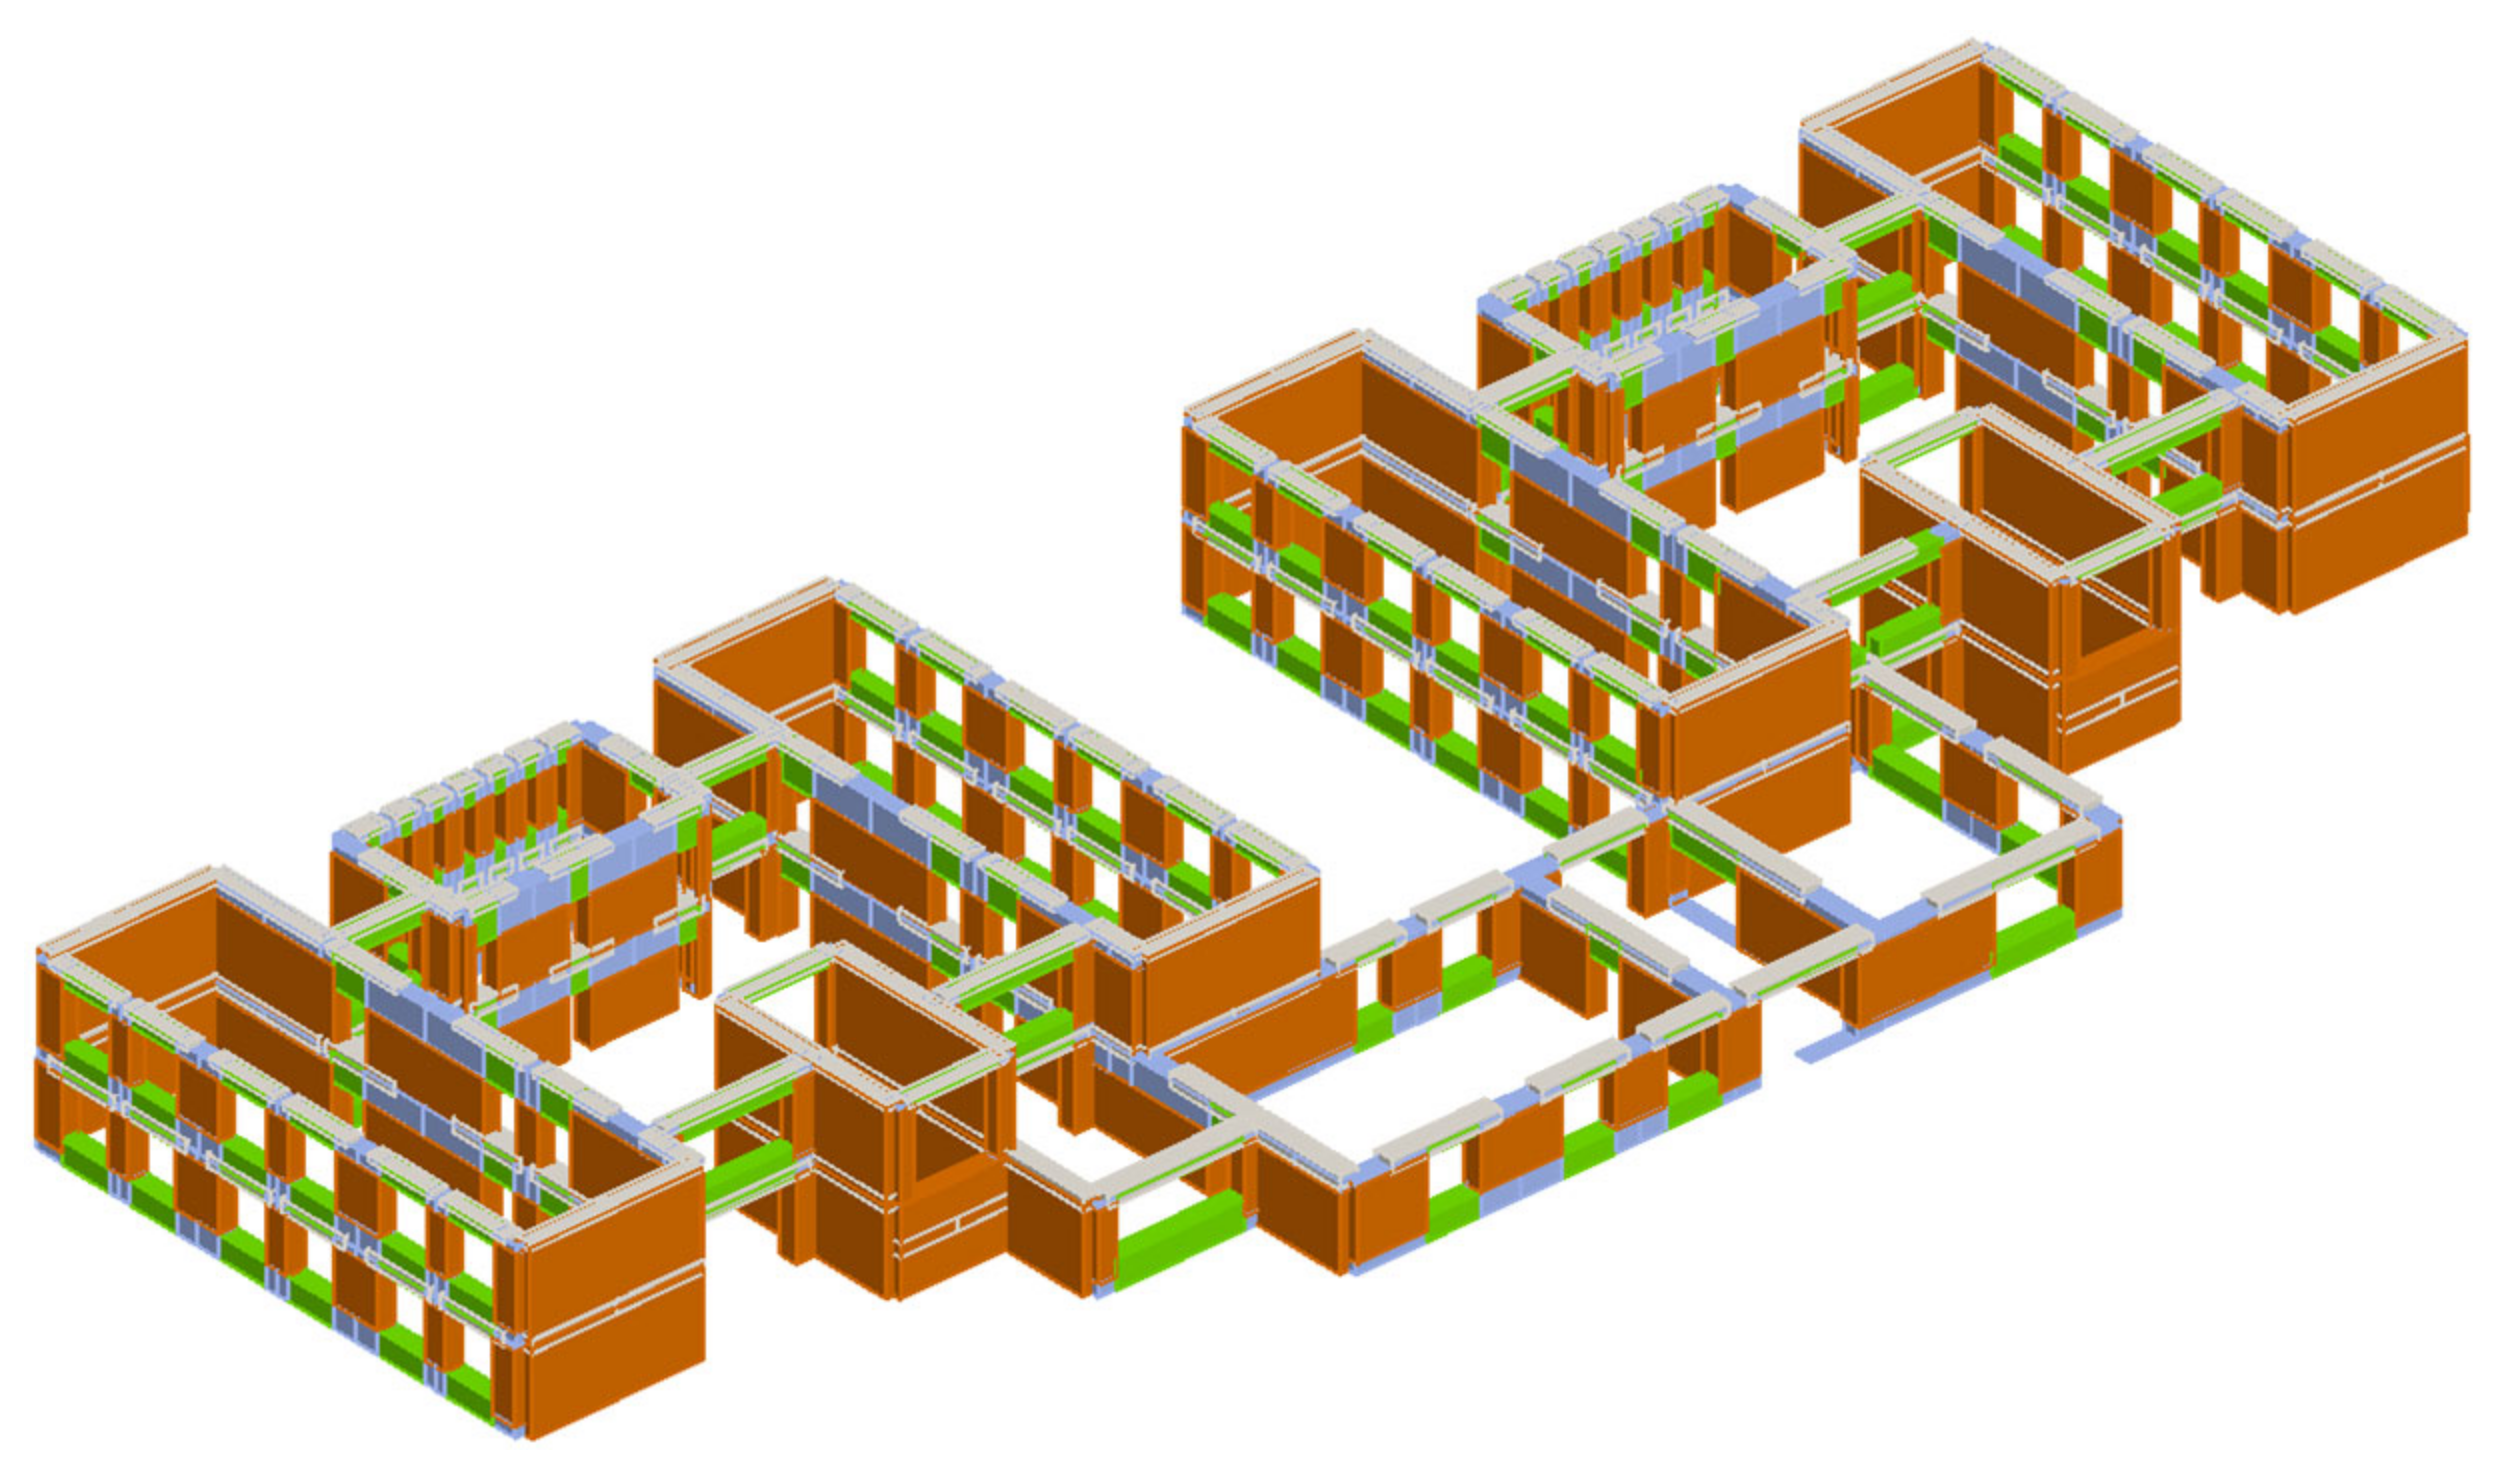
Figure 16.
3D view of the macro-elements model of the school building.
Figure 16.
3D view of the macro-elements model of the school building.
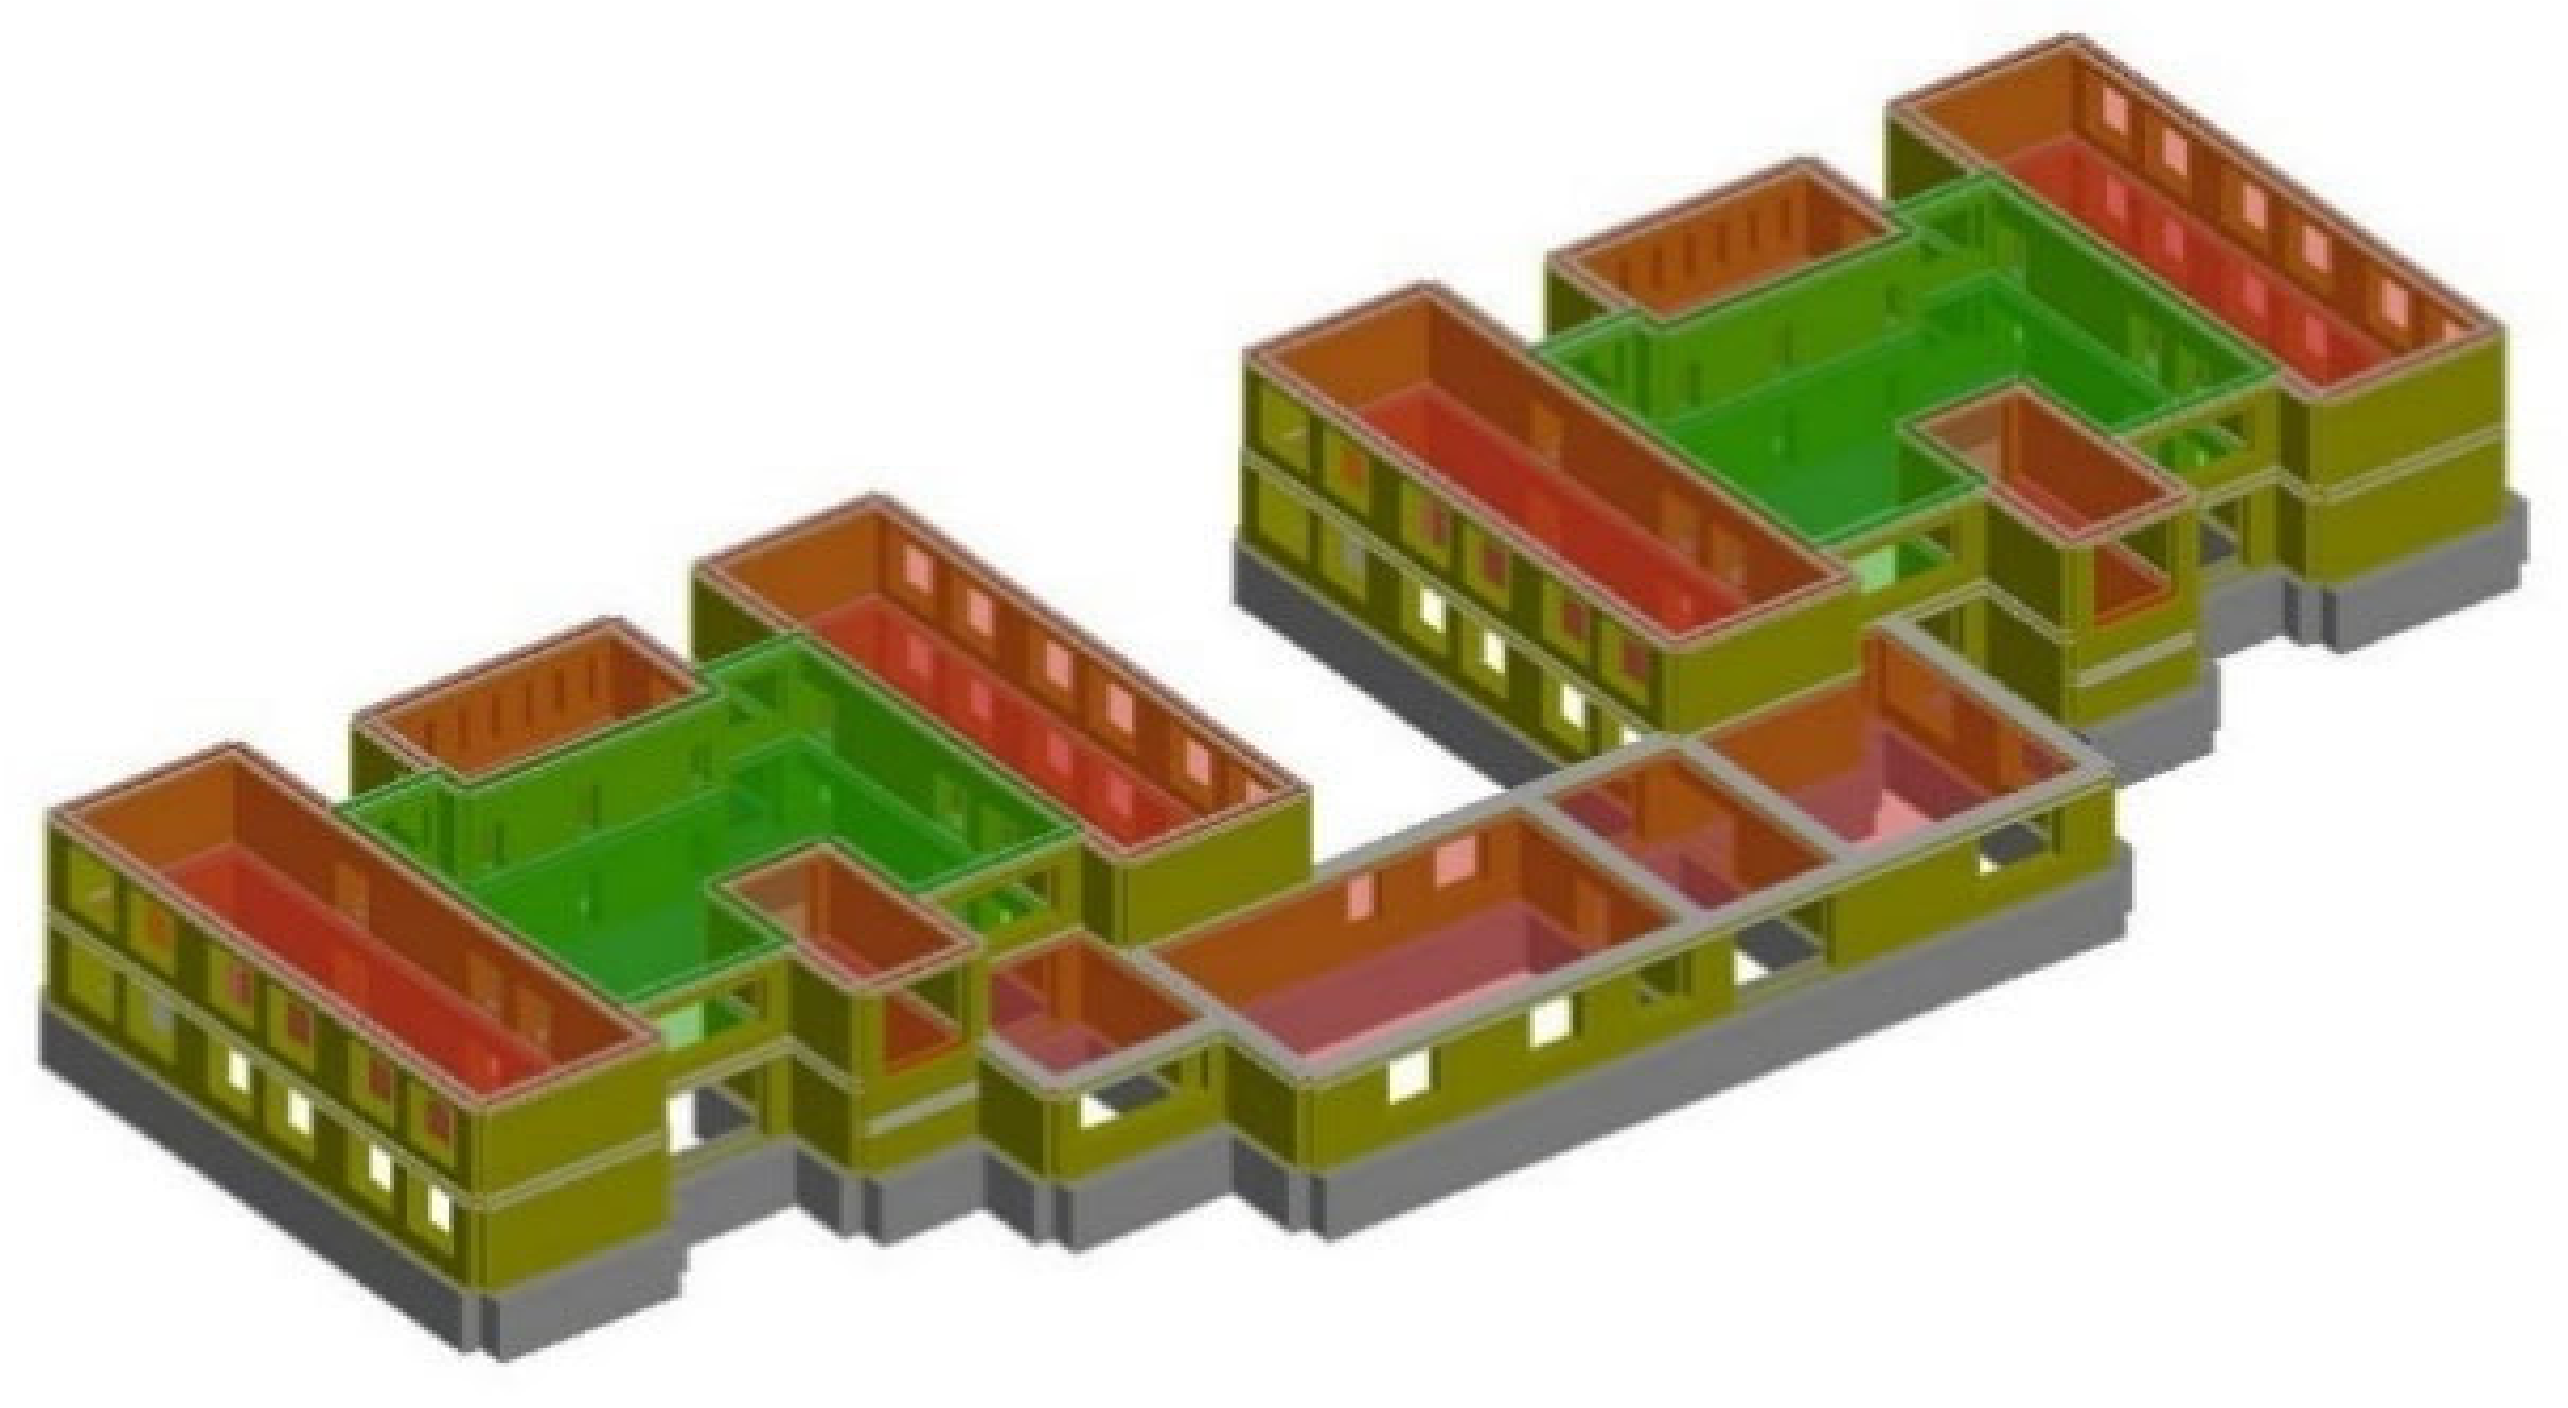
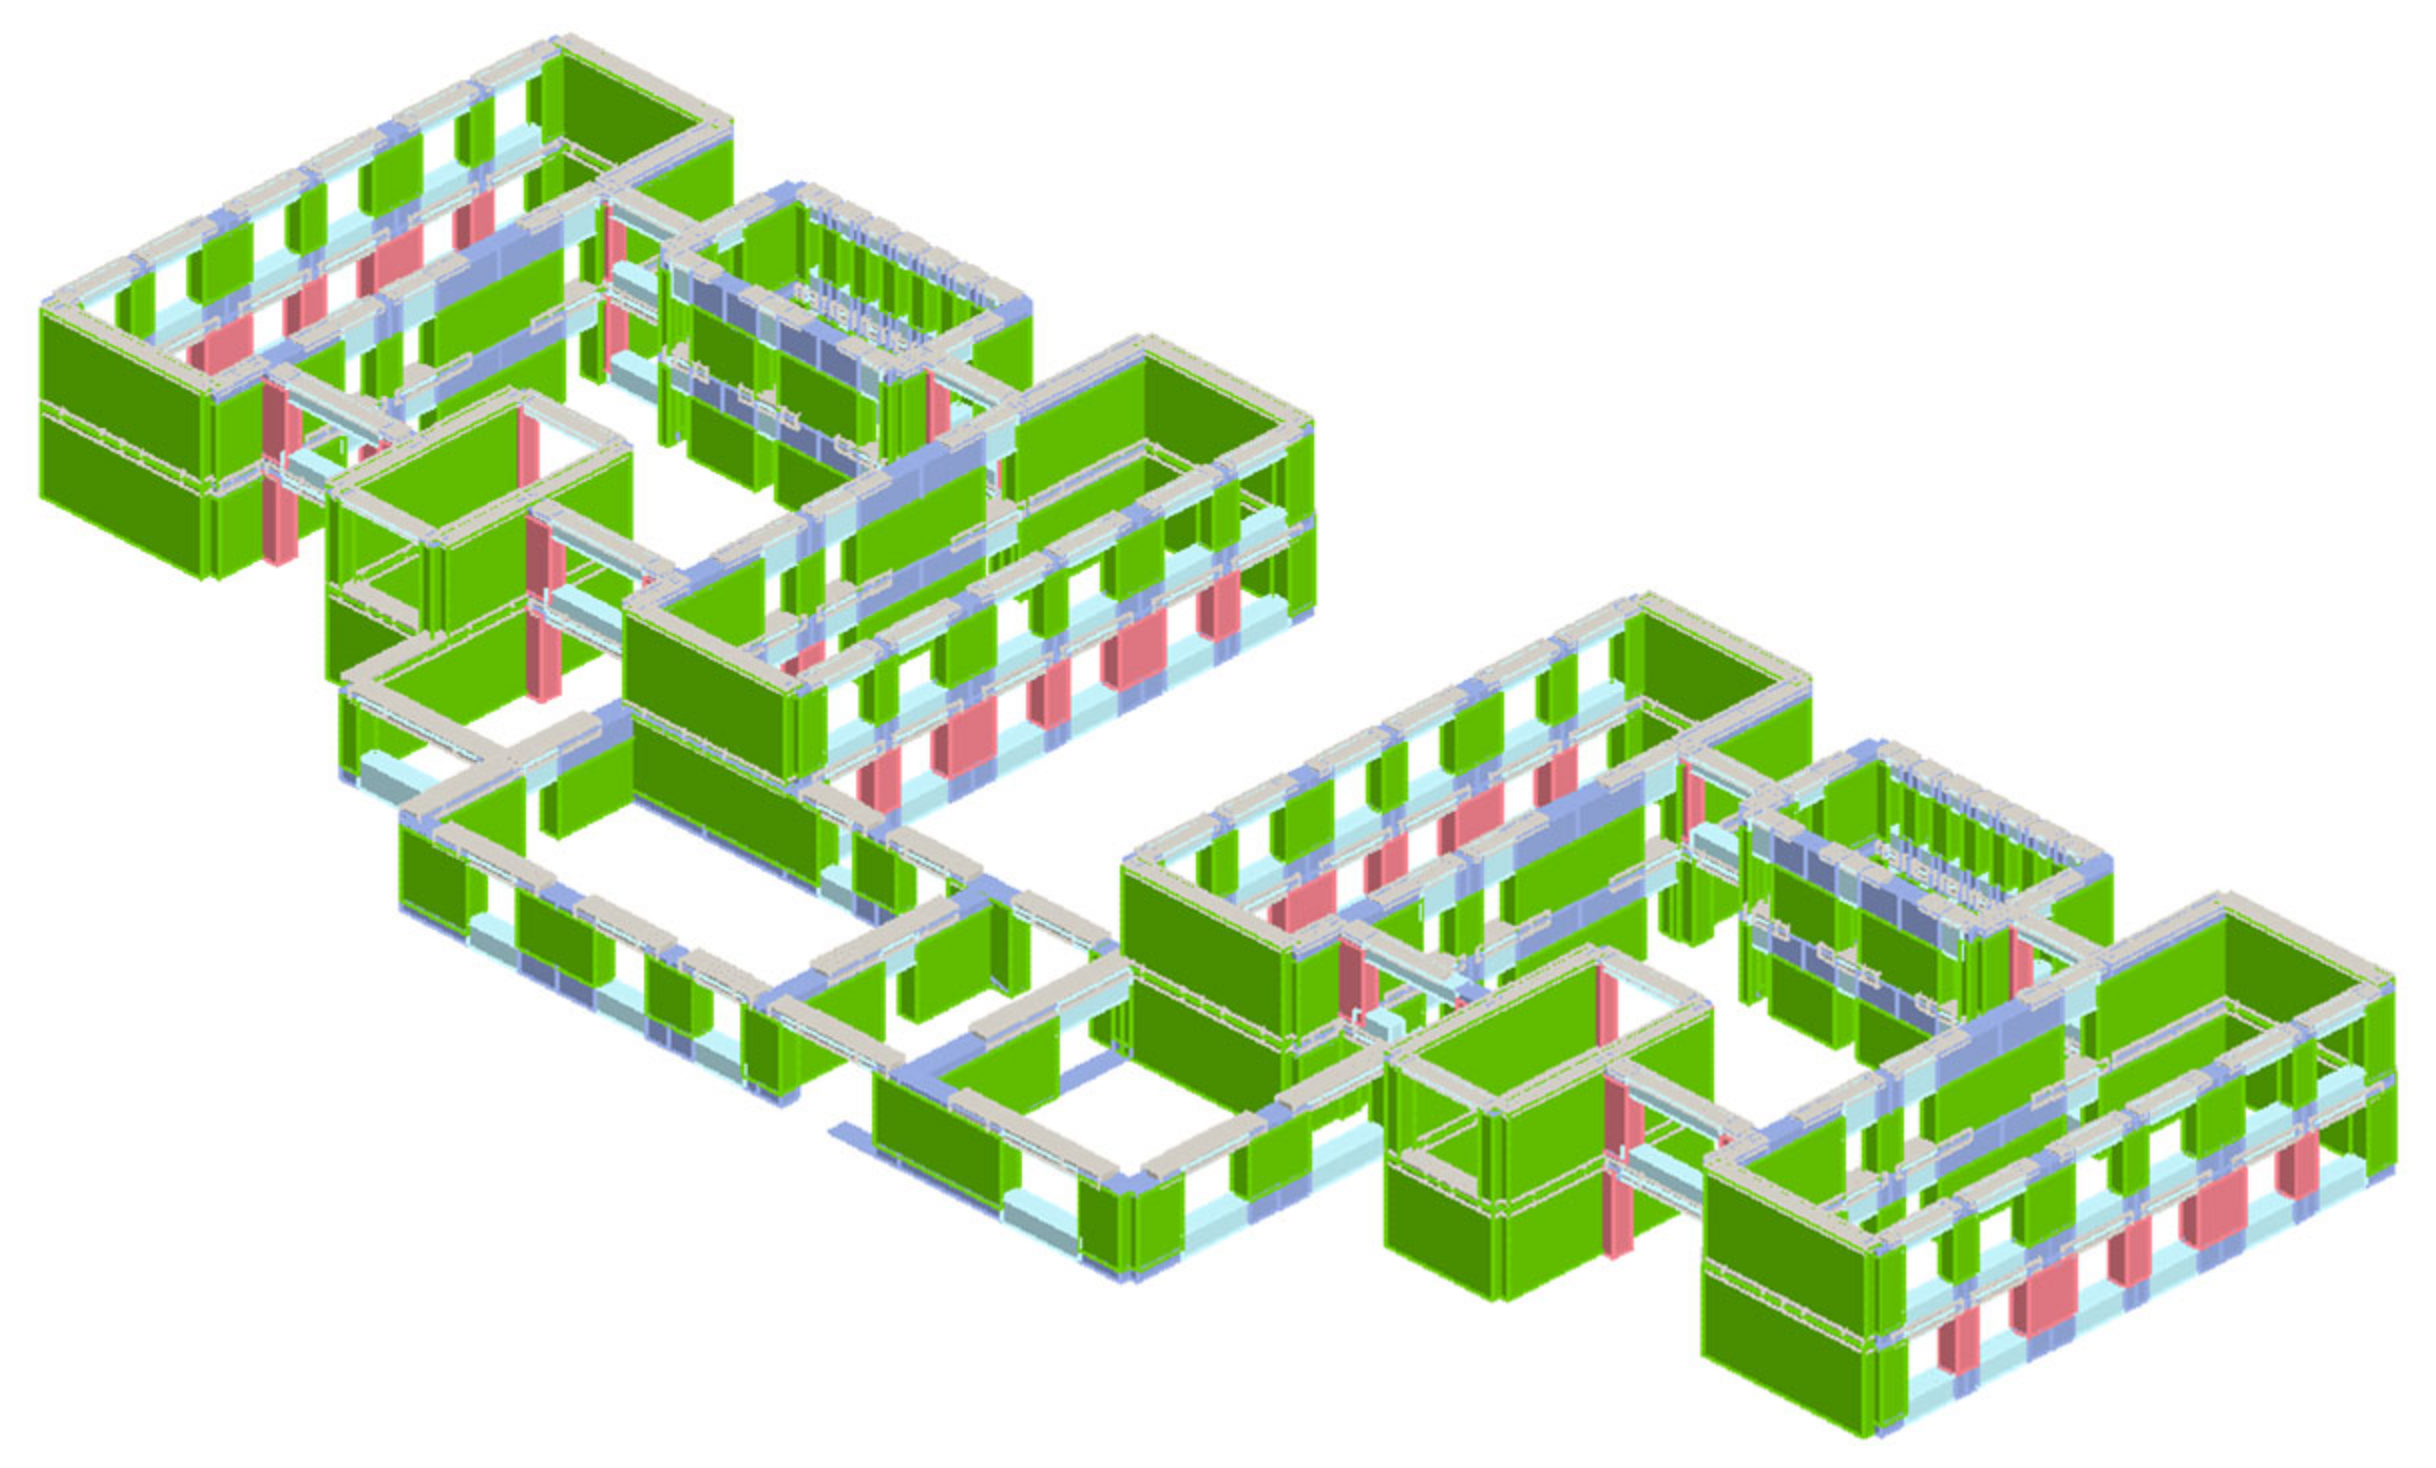
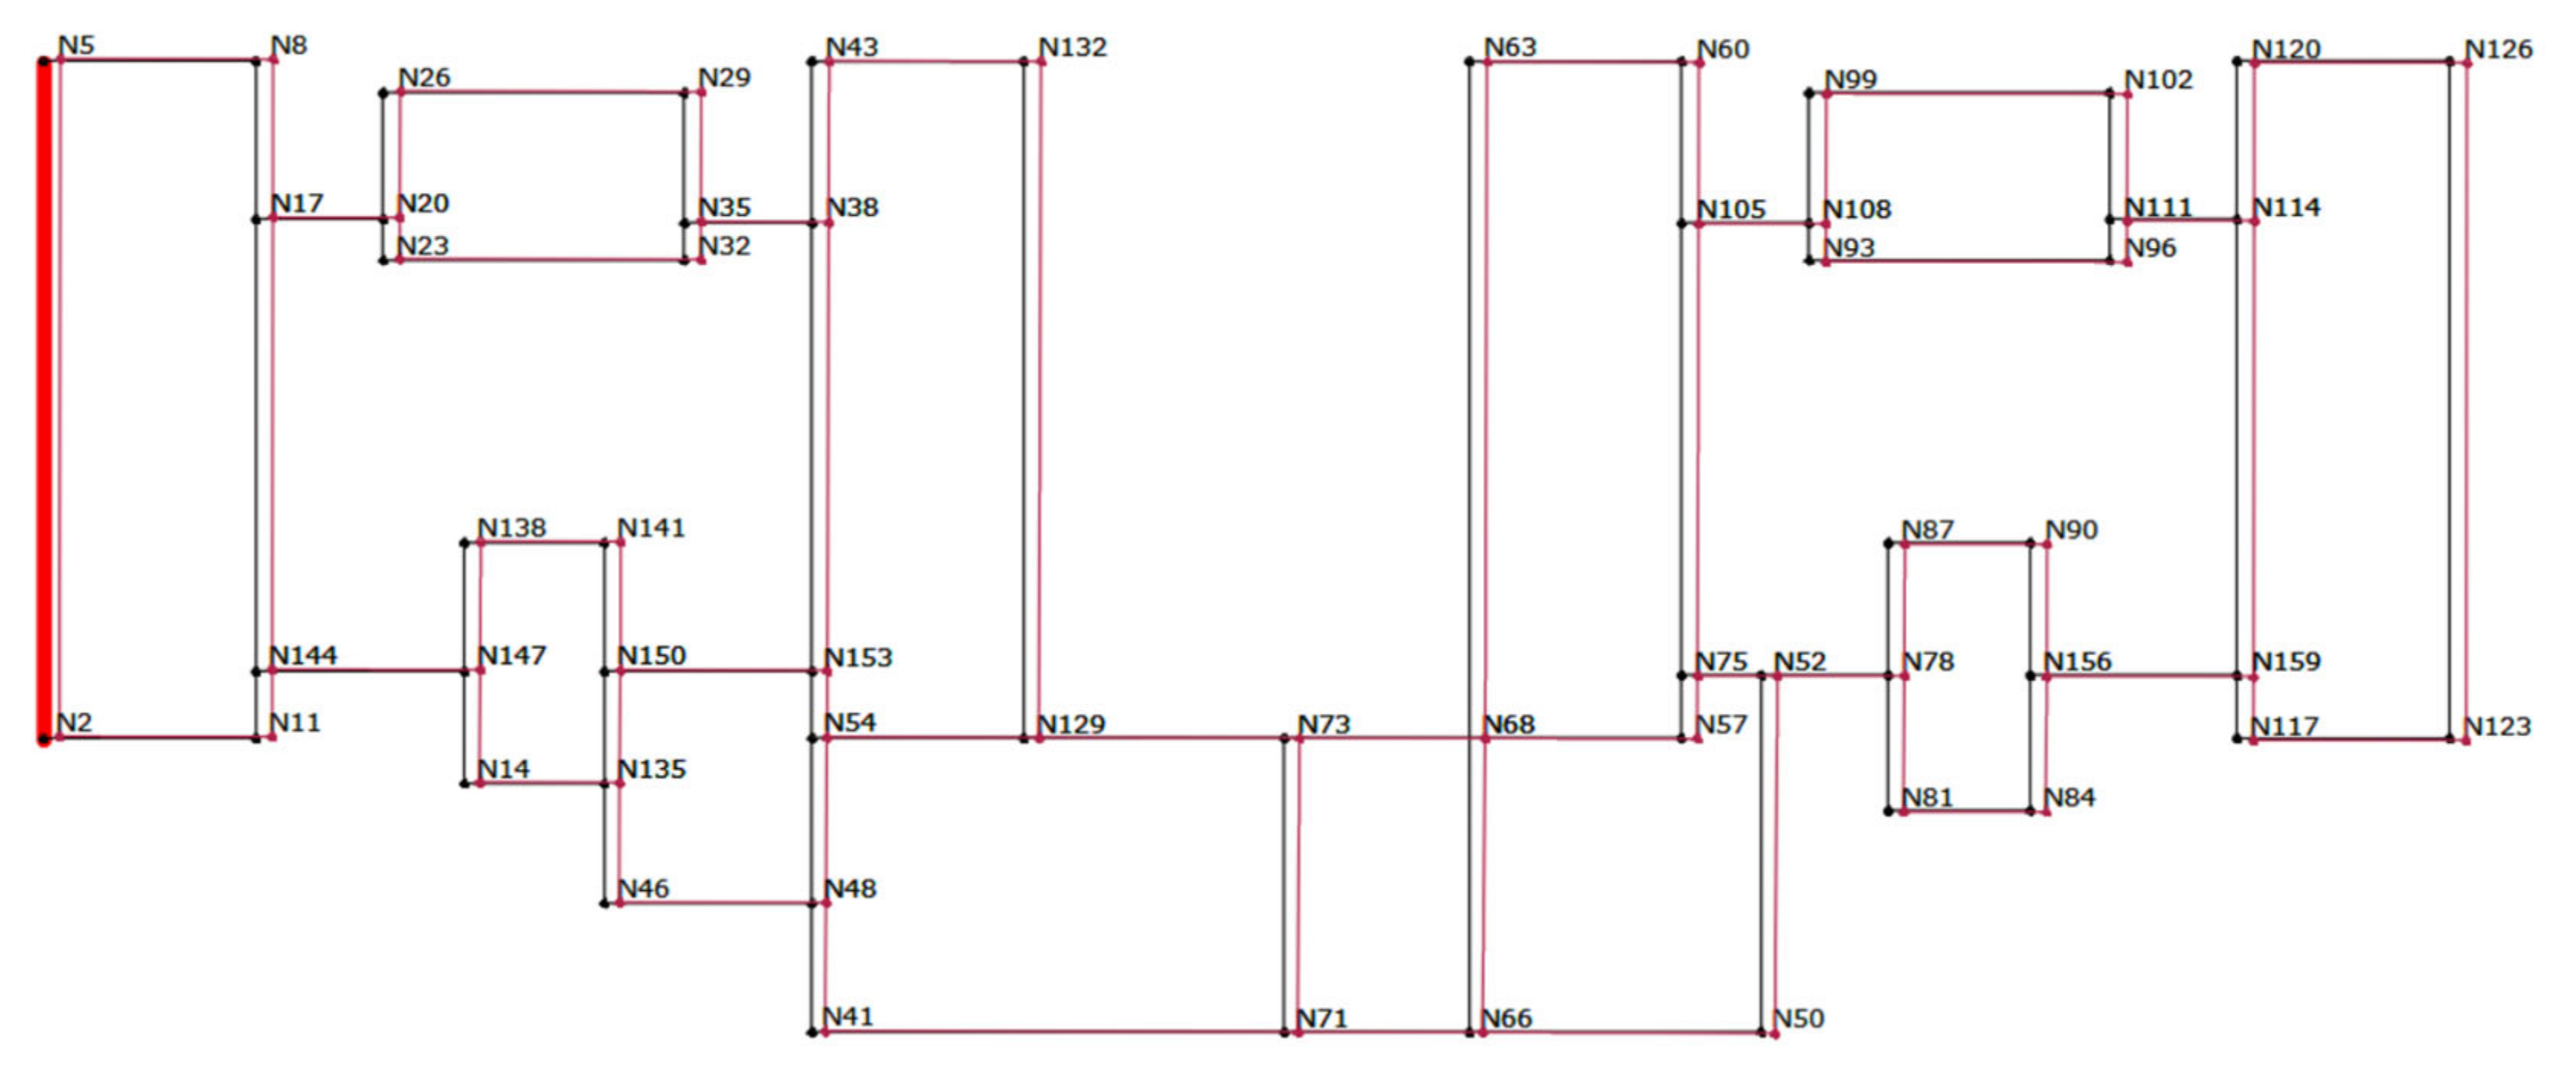
Figure 17.
Deformed shape of the original building in the x direction.
Figure 17.
Deformed shape of the original building in the x direction.
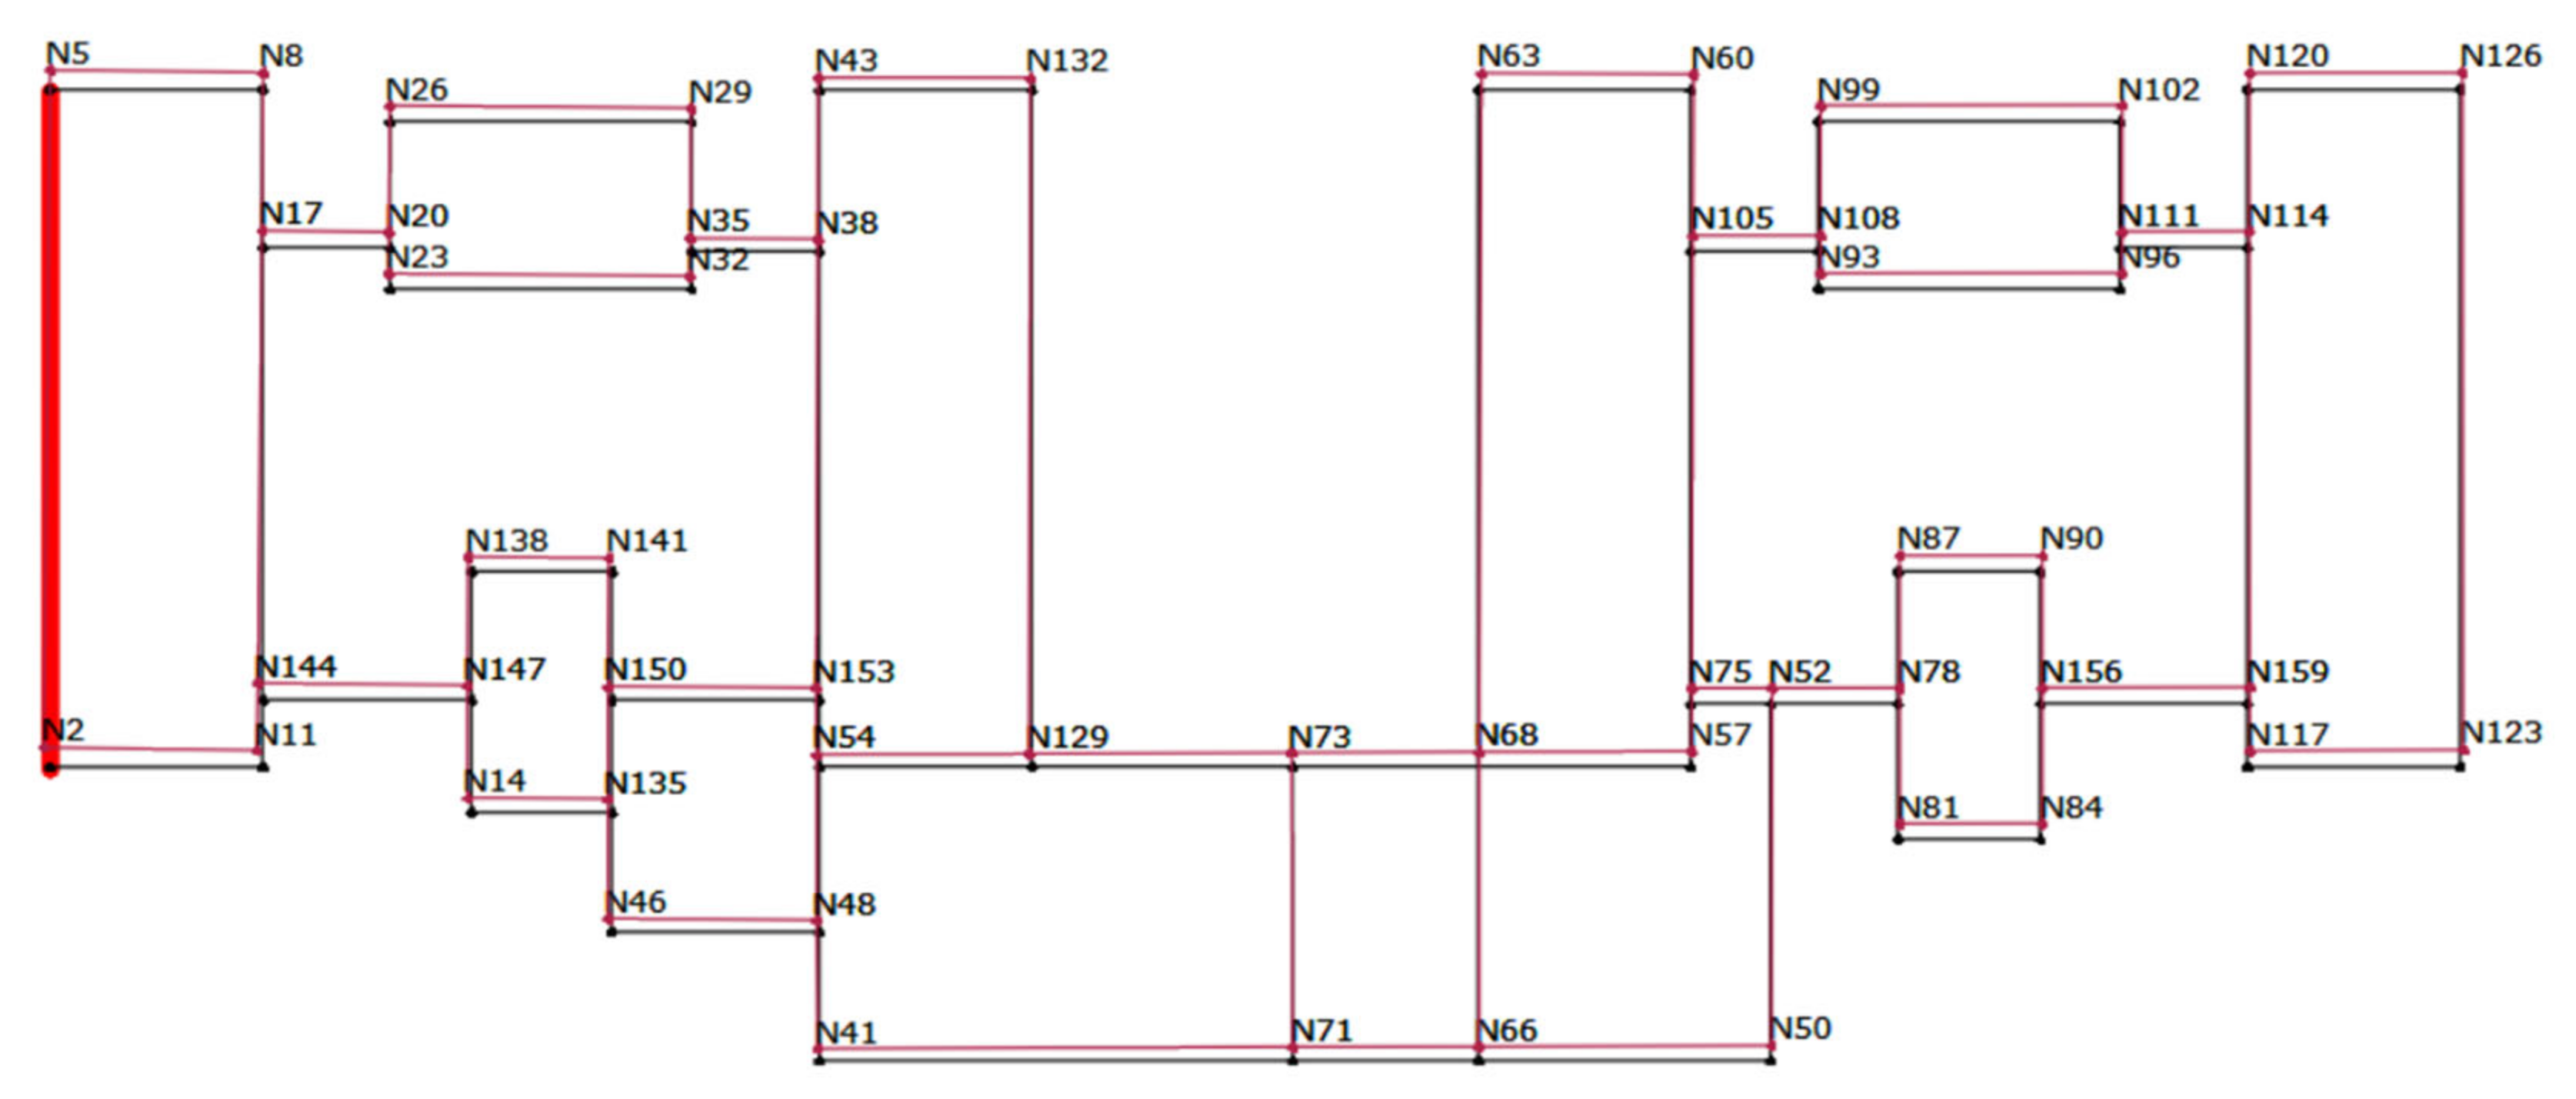
Figure 18.
Deformed shape of the original building in the y direction.
Figure 18.
Deformed shape of the original building in the y direction.
Figure 19.
Static verification mapping at the Ultimate Limit State.
Figure 19.
Static verification mapping at the Ultimate Limit State.
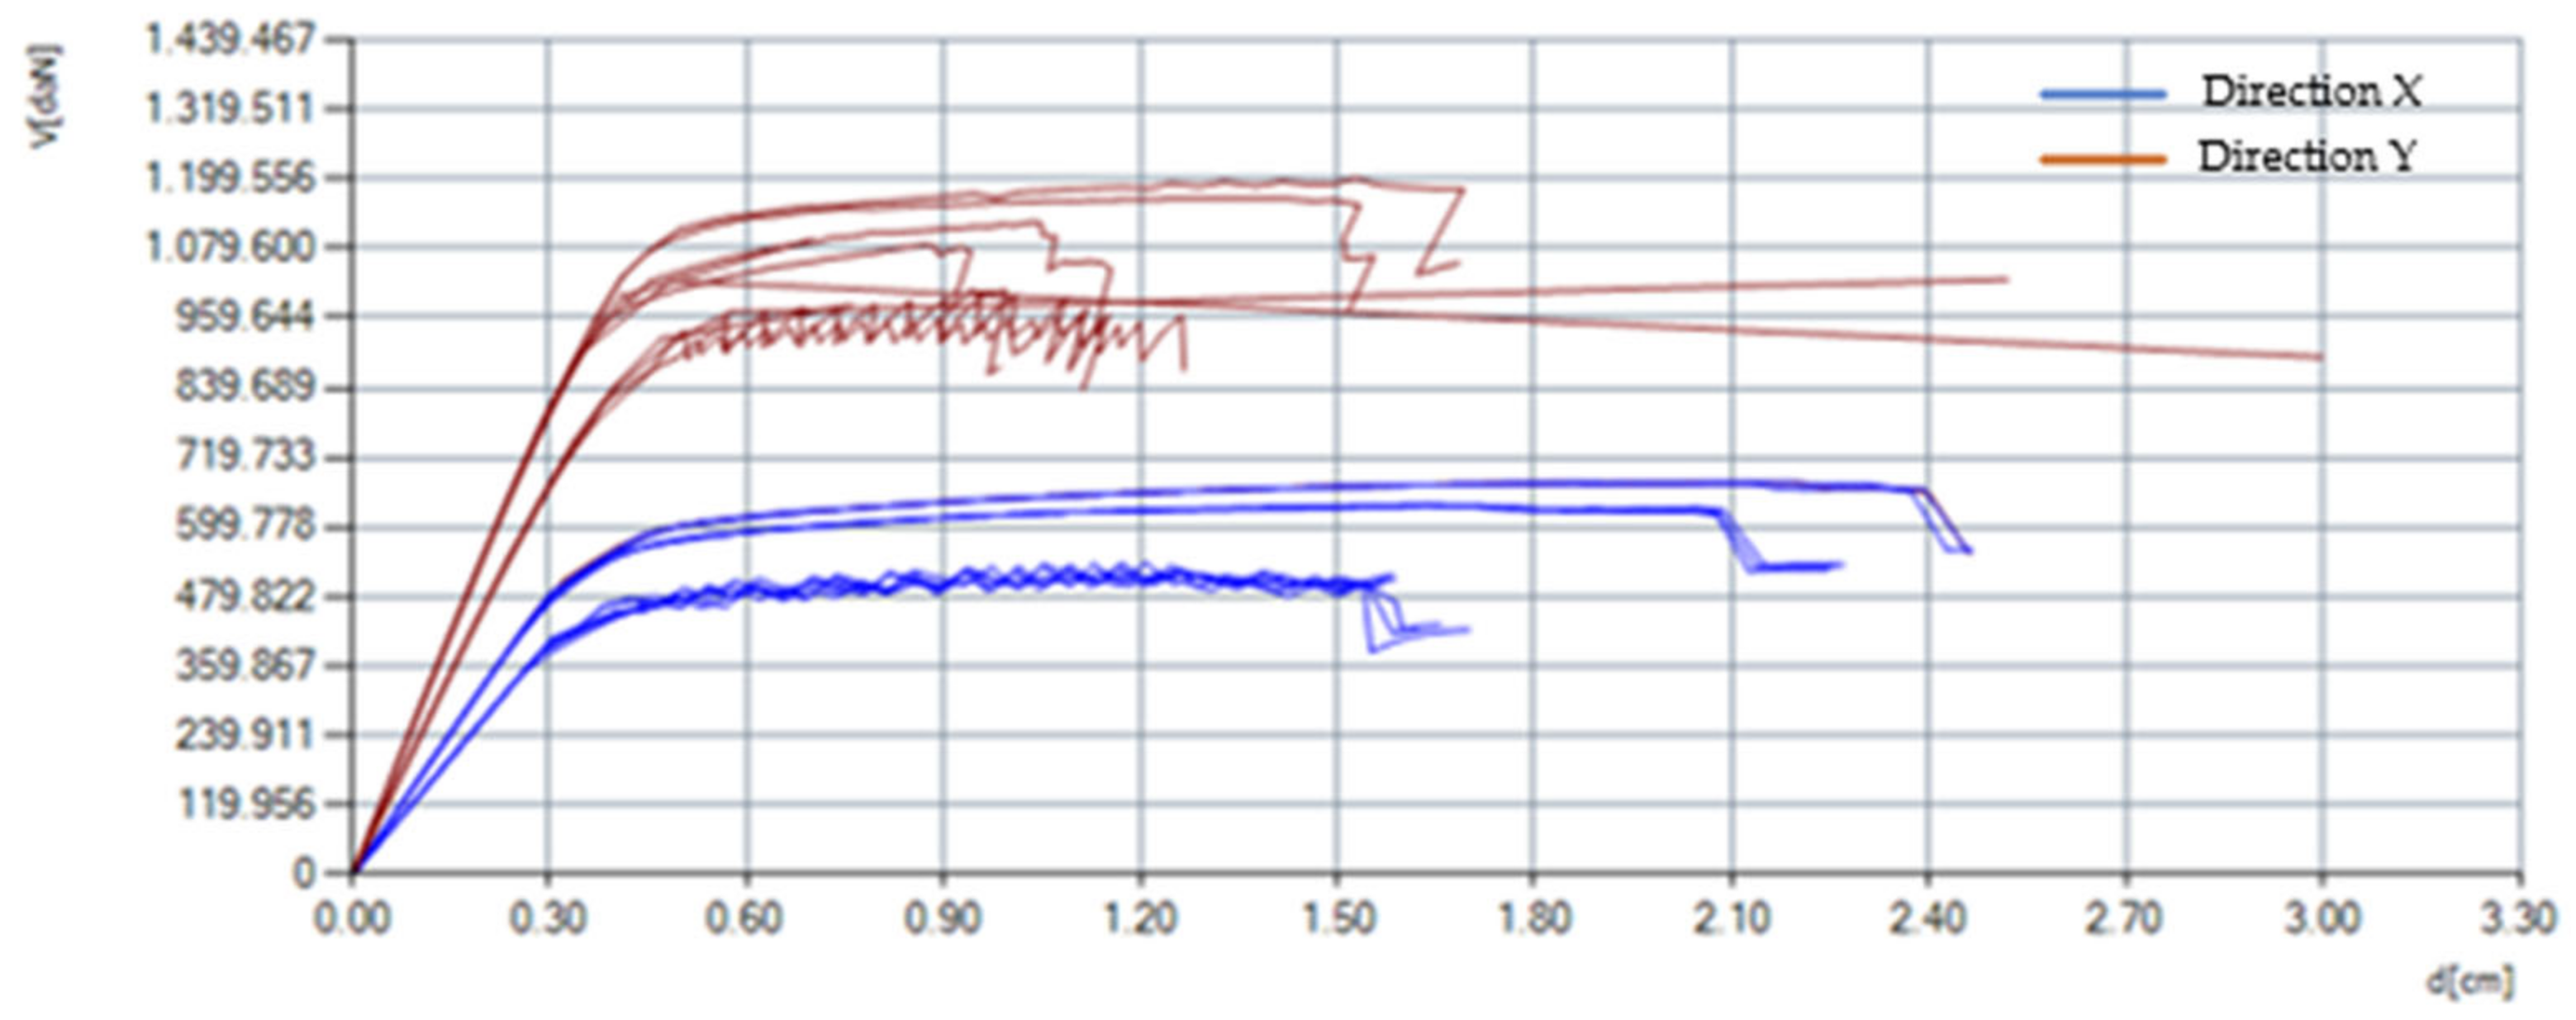
Figure 20.
Results of pushover analyses.
Figure 20.
Results of pushover analyses.
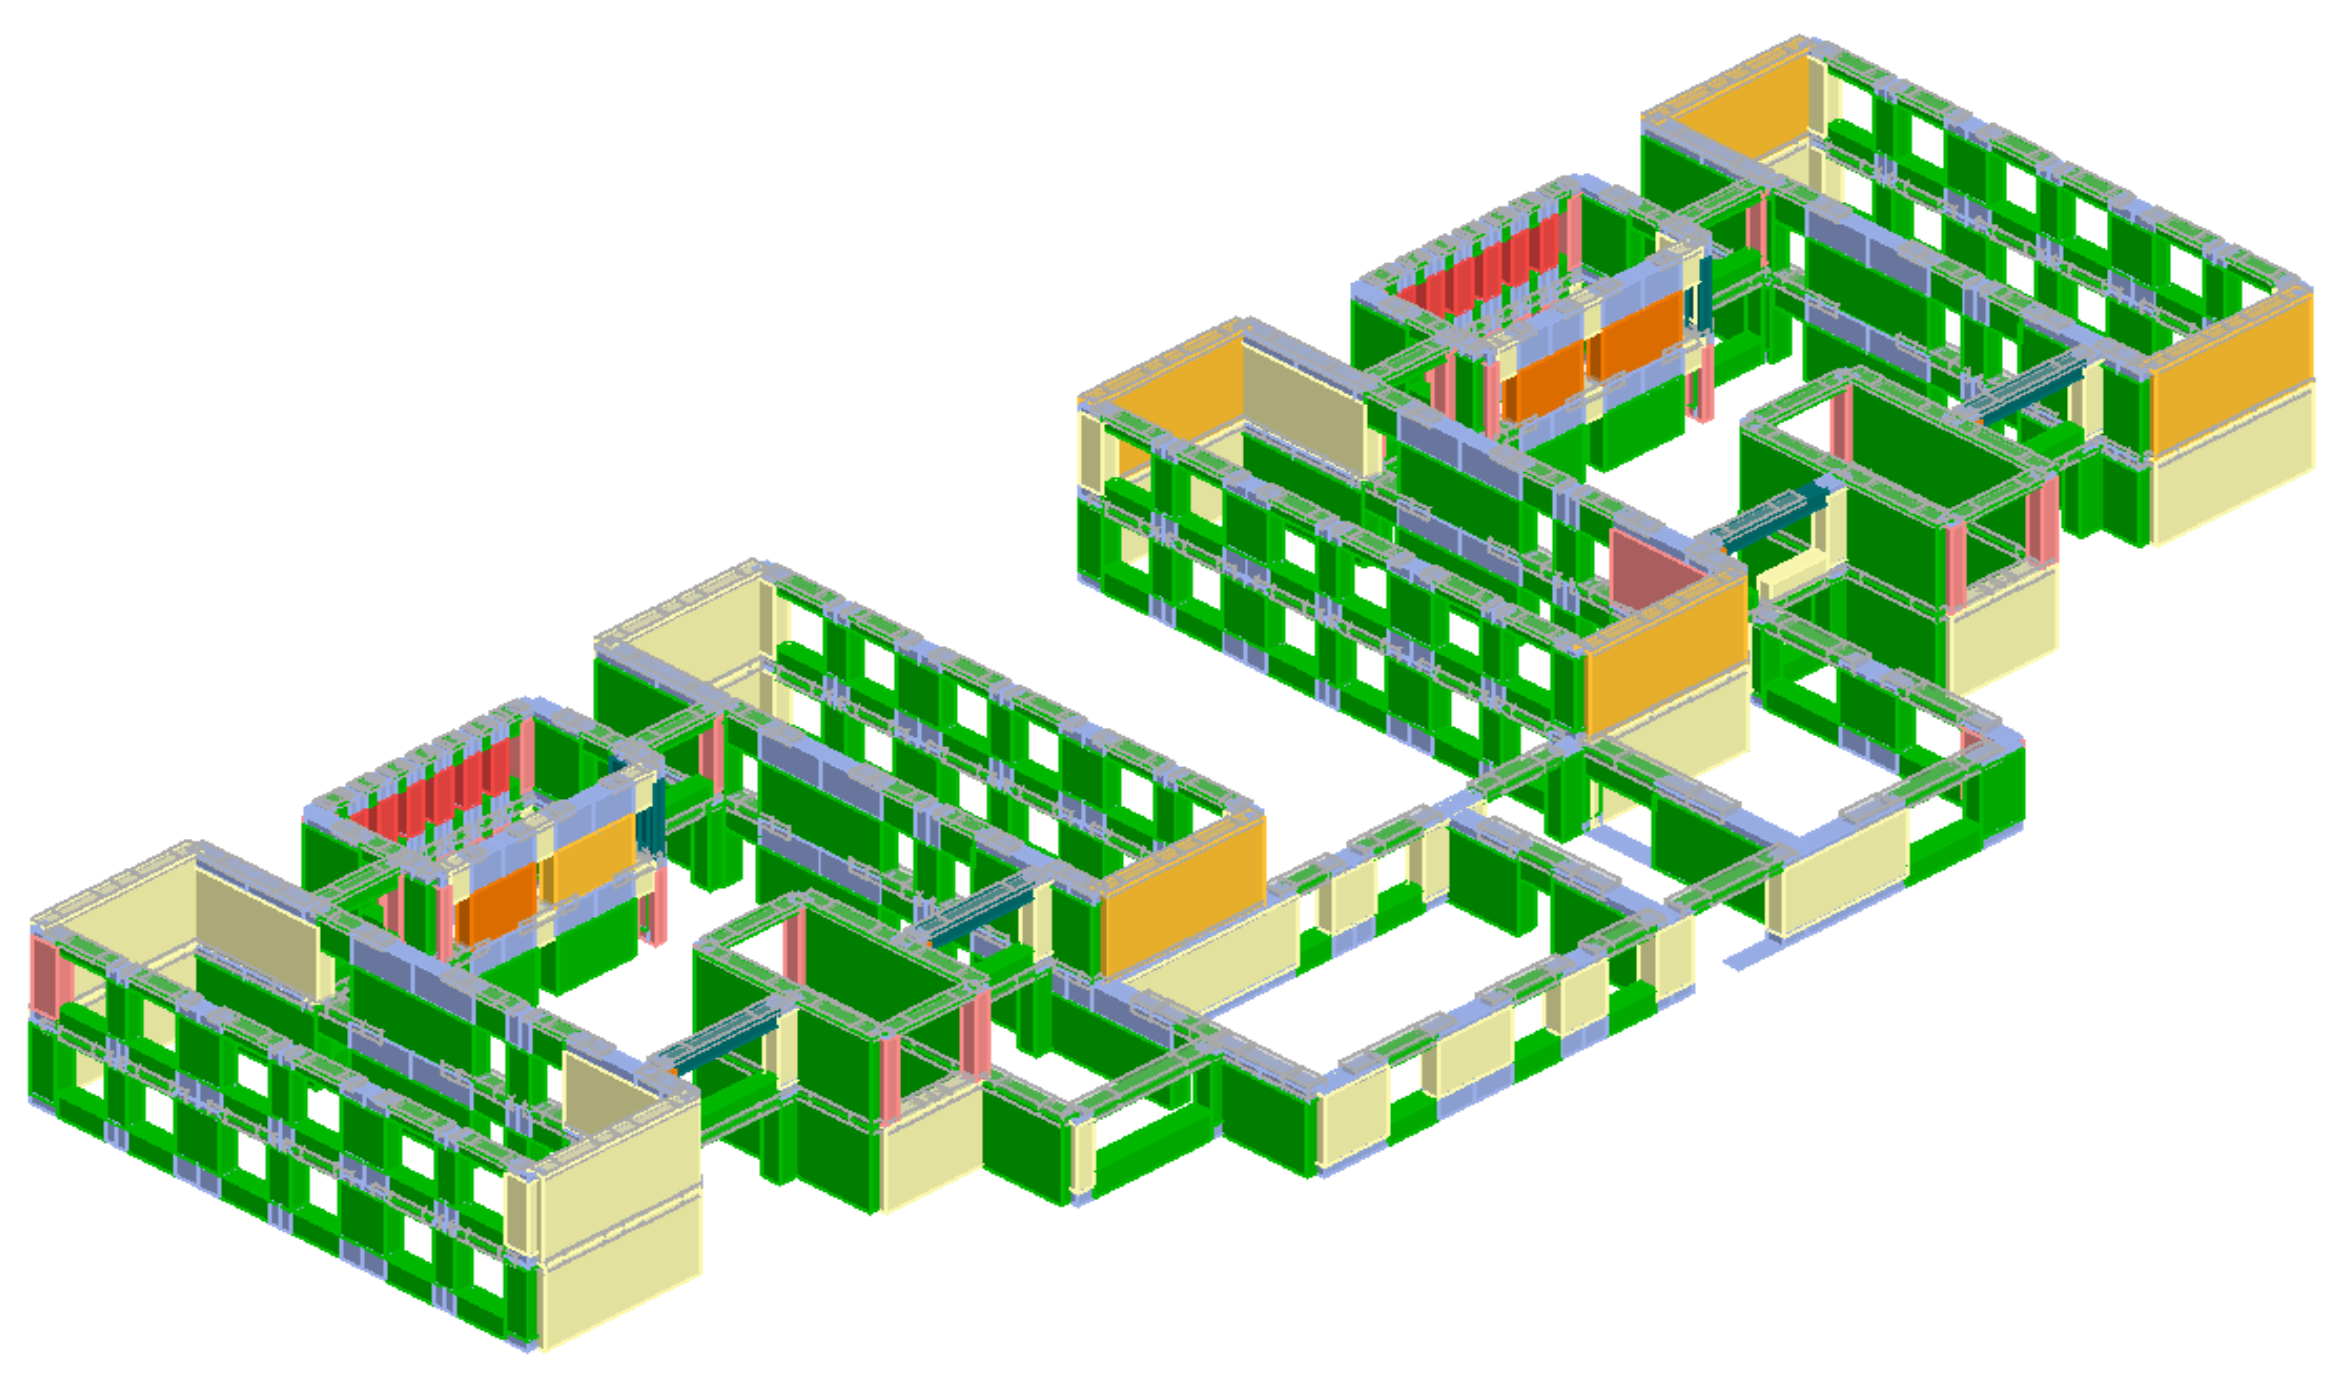
Figure 21.
Damage state of the building in the worst analysis case in longitudinal (X) direction. Legend: green and grey: no damage; dark green: incipient plasticity; pink: compressive-bending plastic; magenta: serious crisis; yellow: shear plastic; orange: incipient shear failure; dark orange: shear failure.
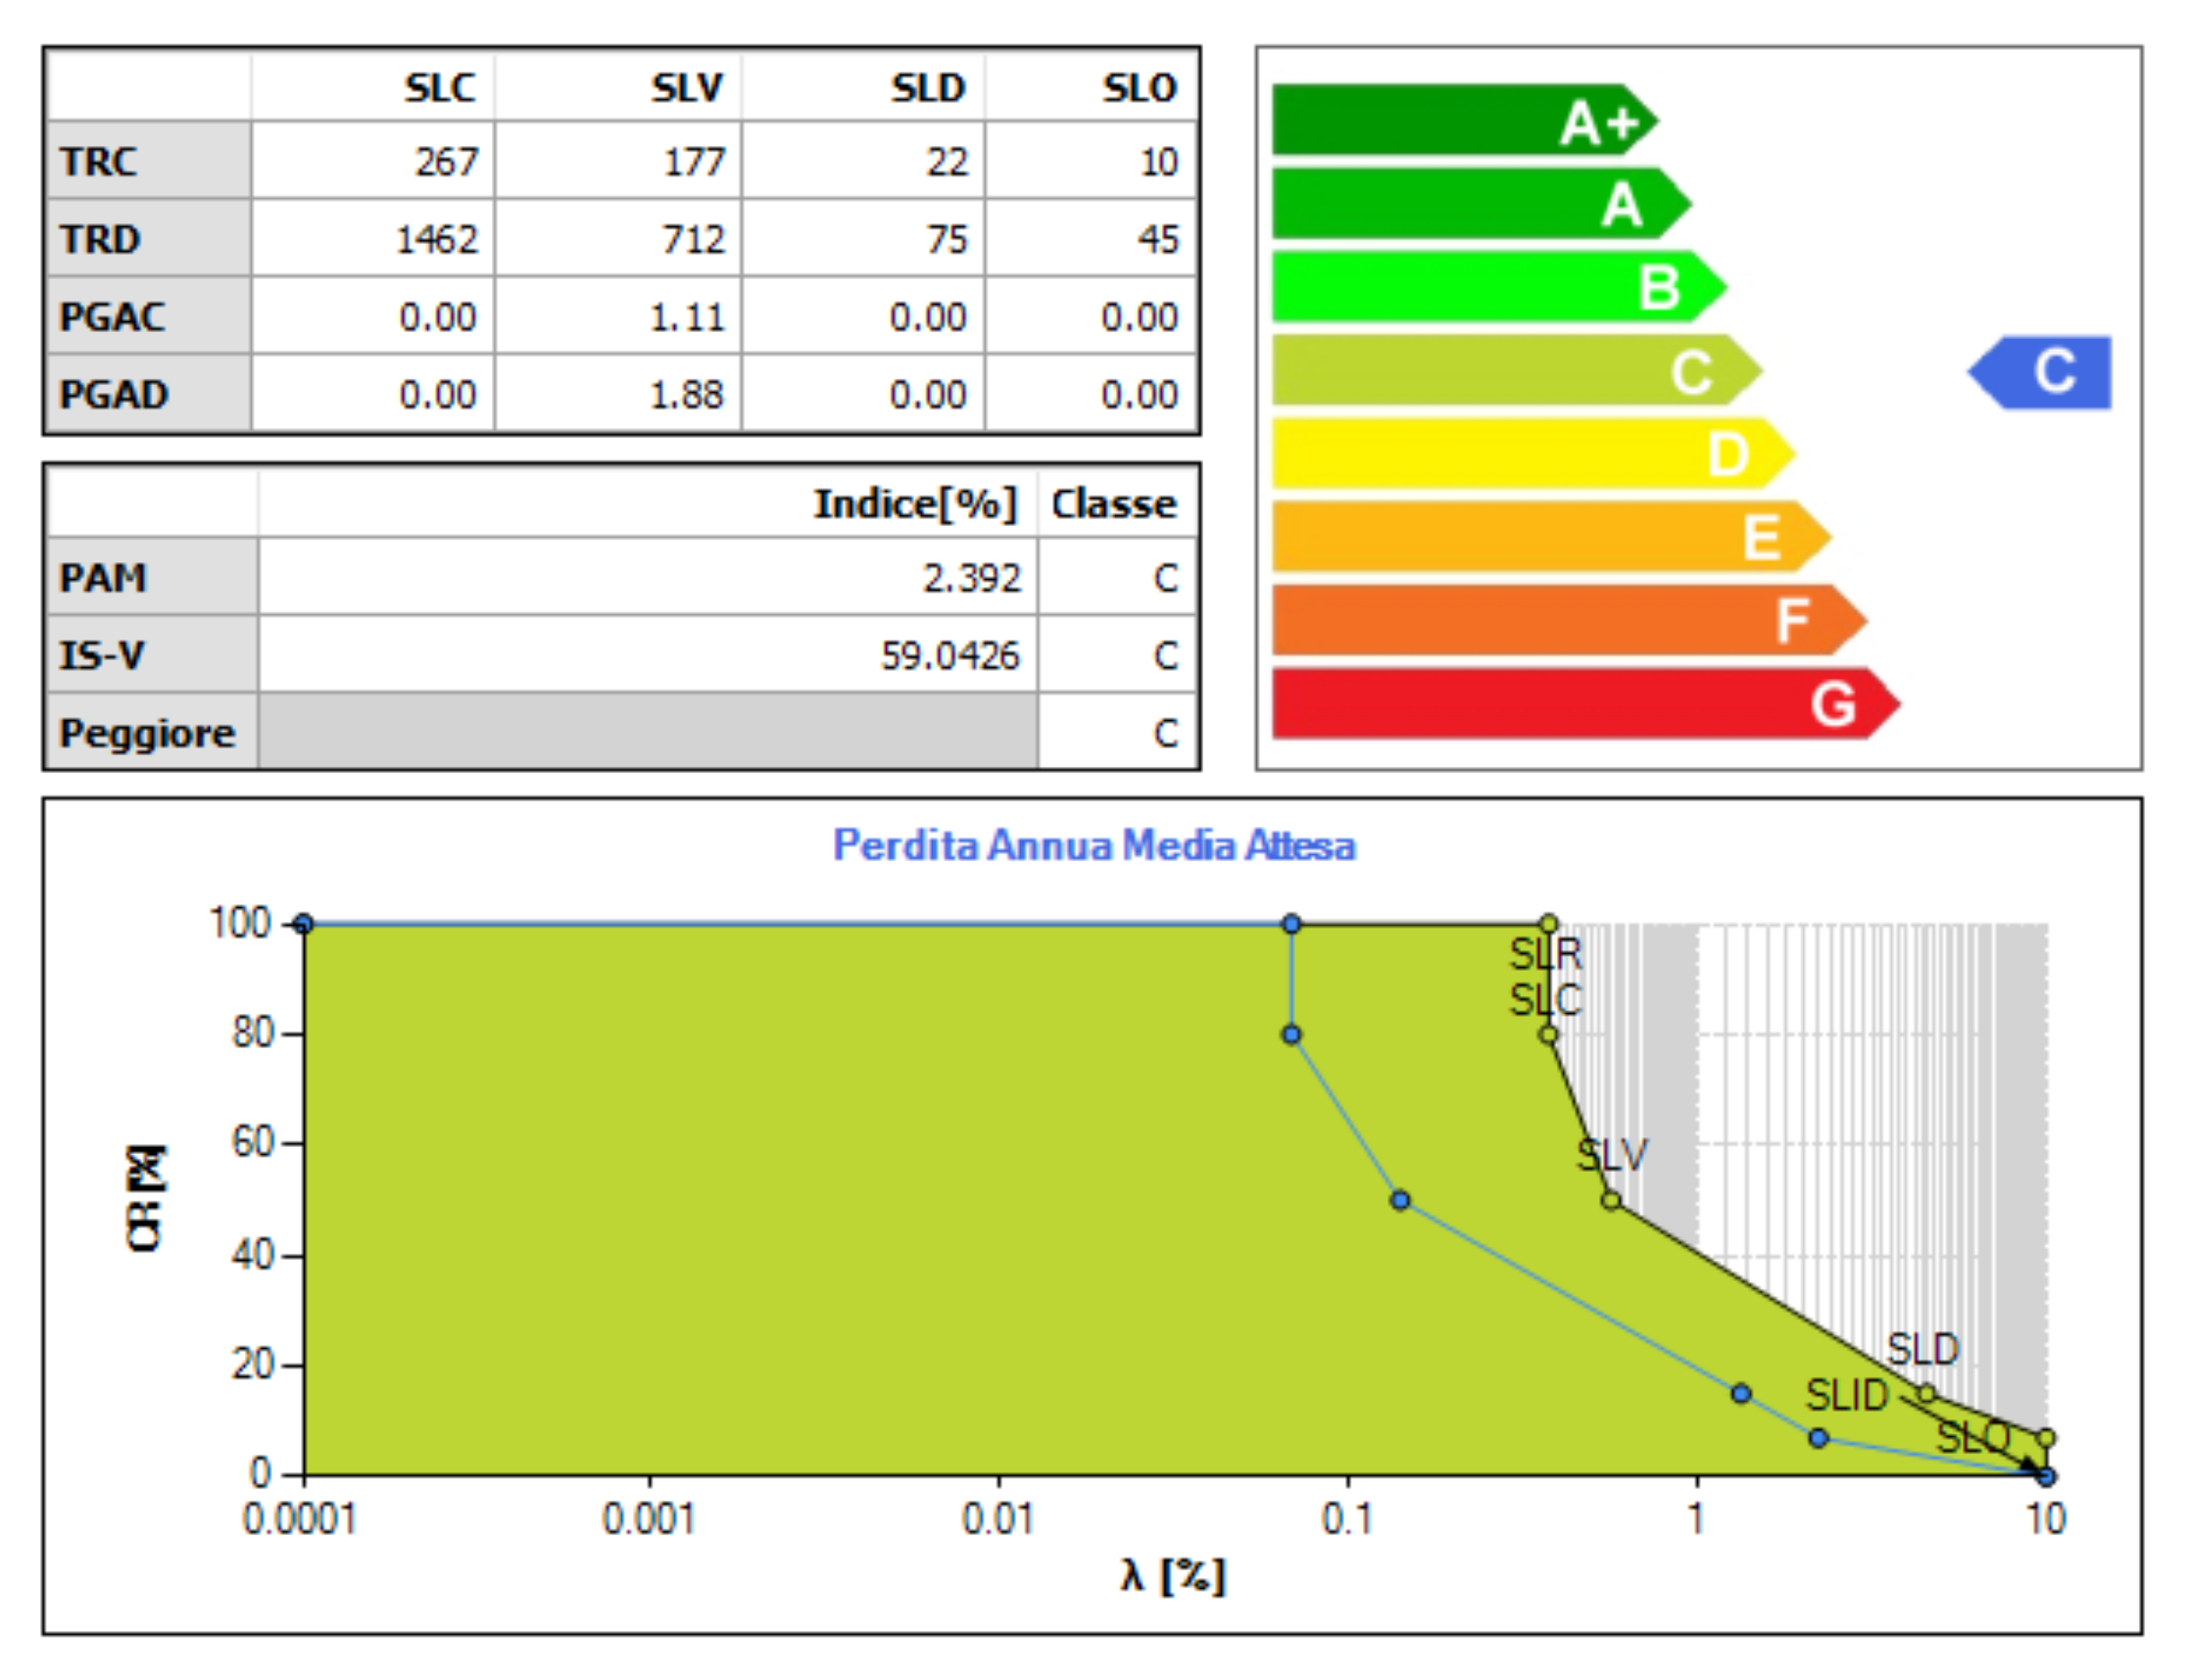
Figure 22.
Seismic classification of the school building in the current state.
Figure 22.
Seismic classification of the school building in the current state.
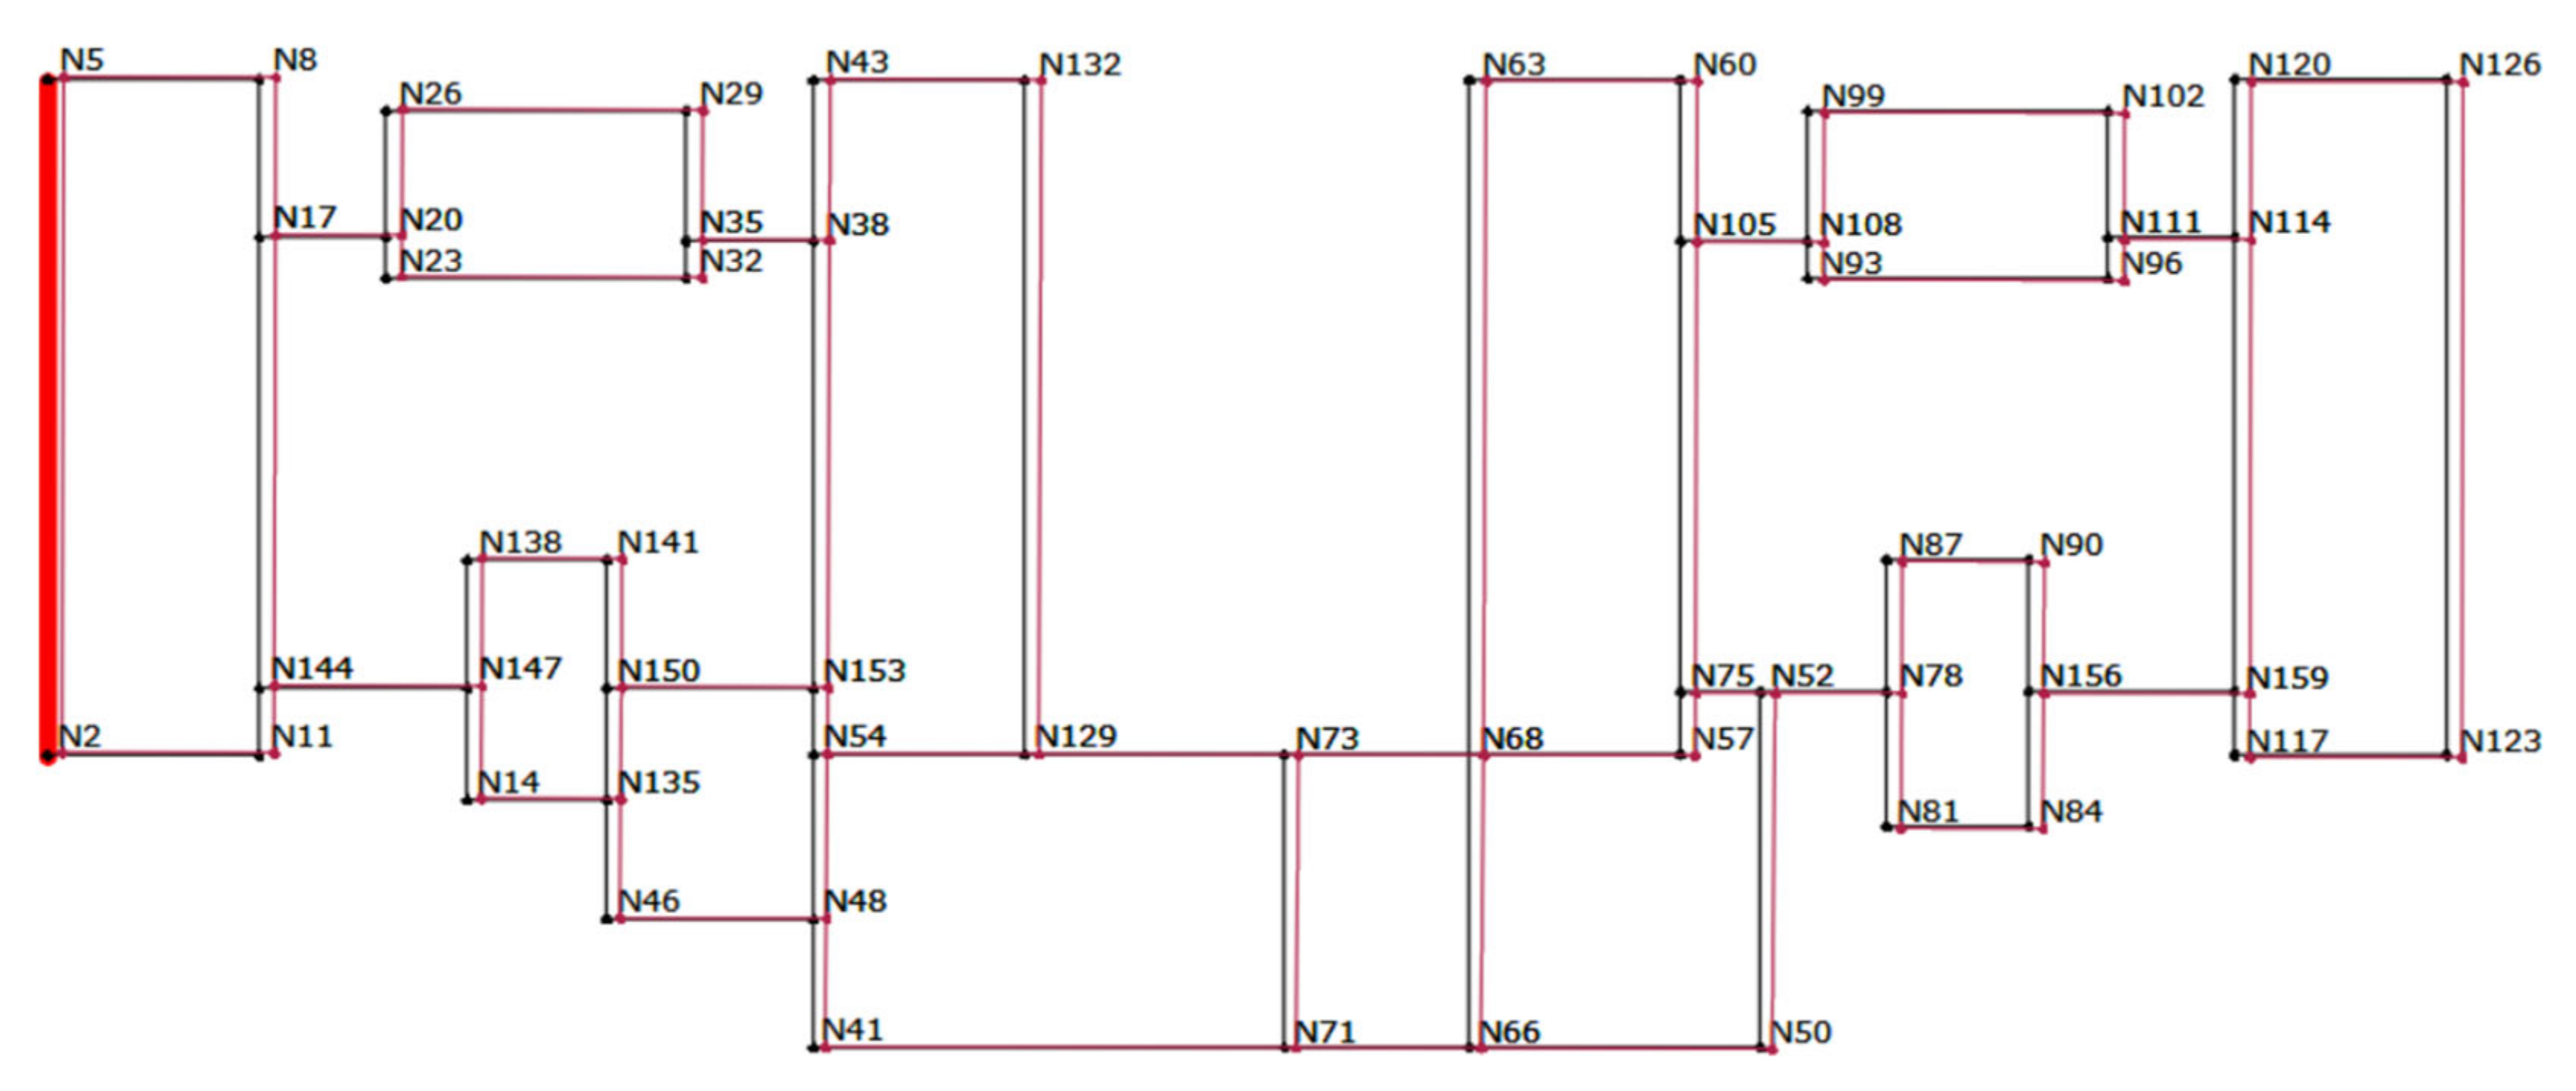
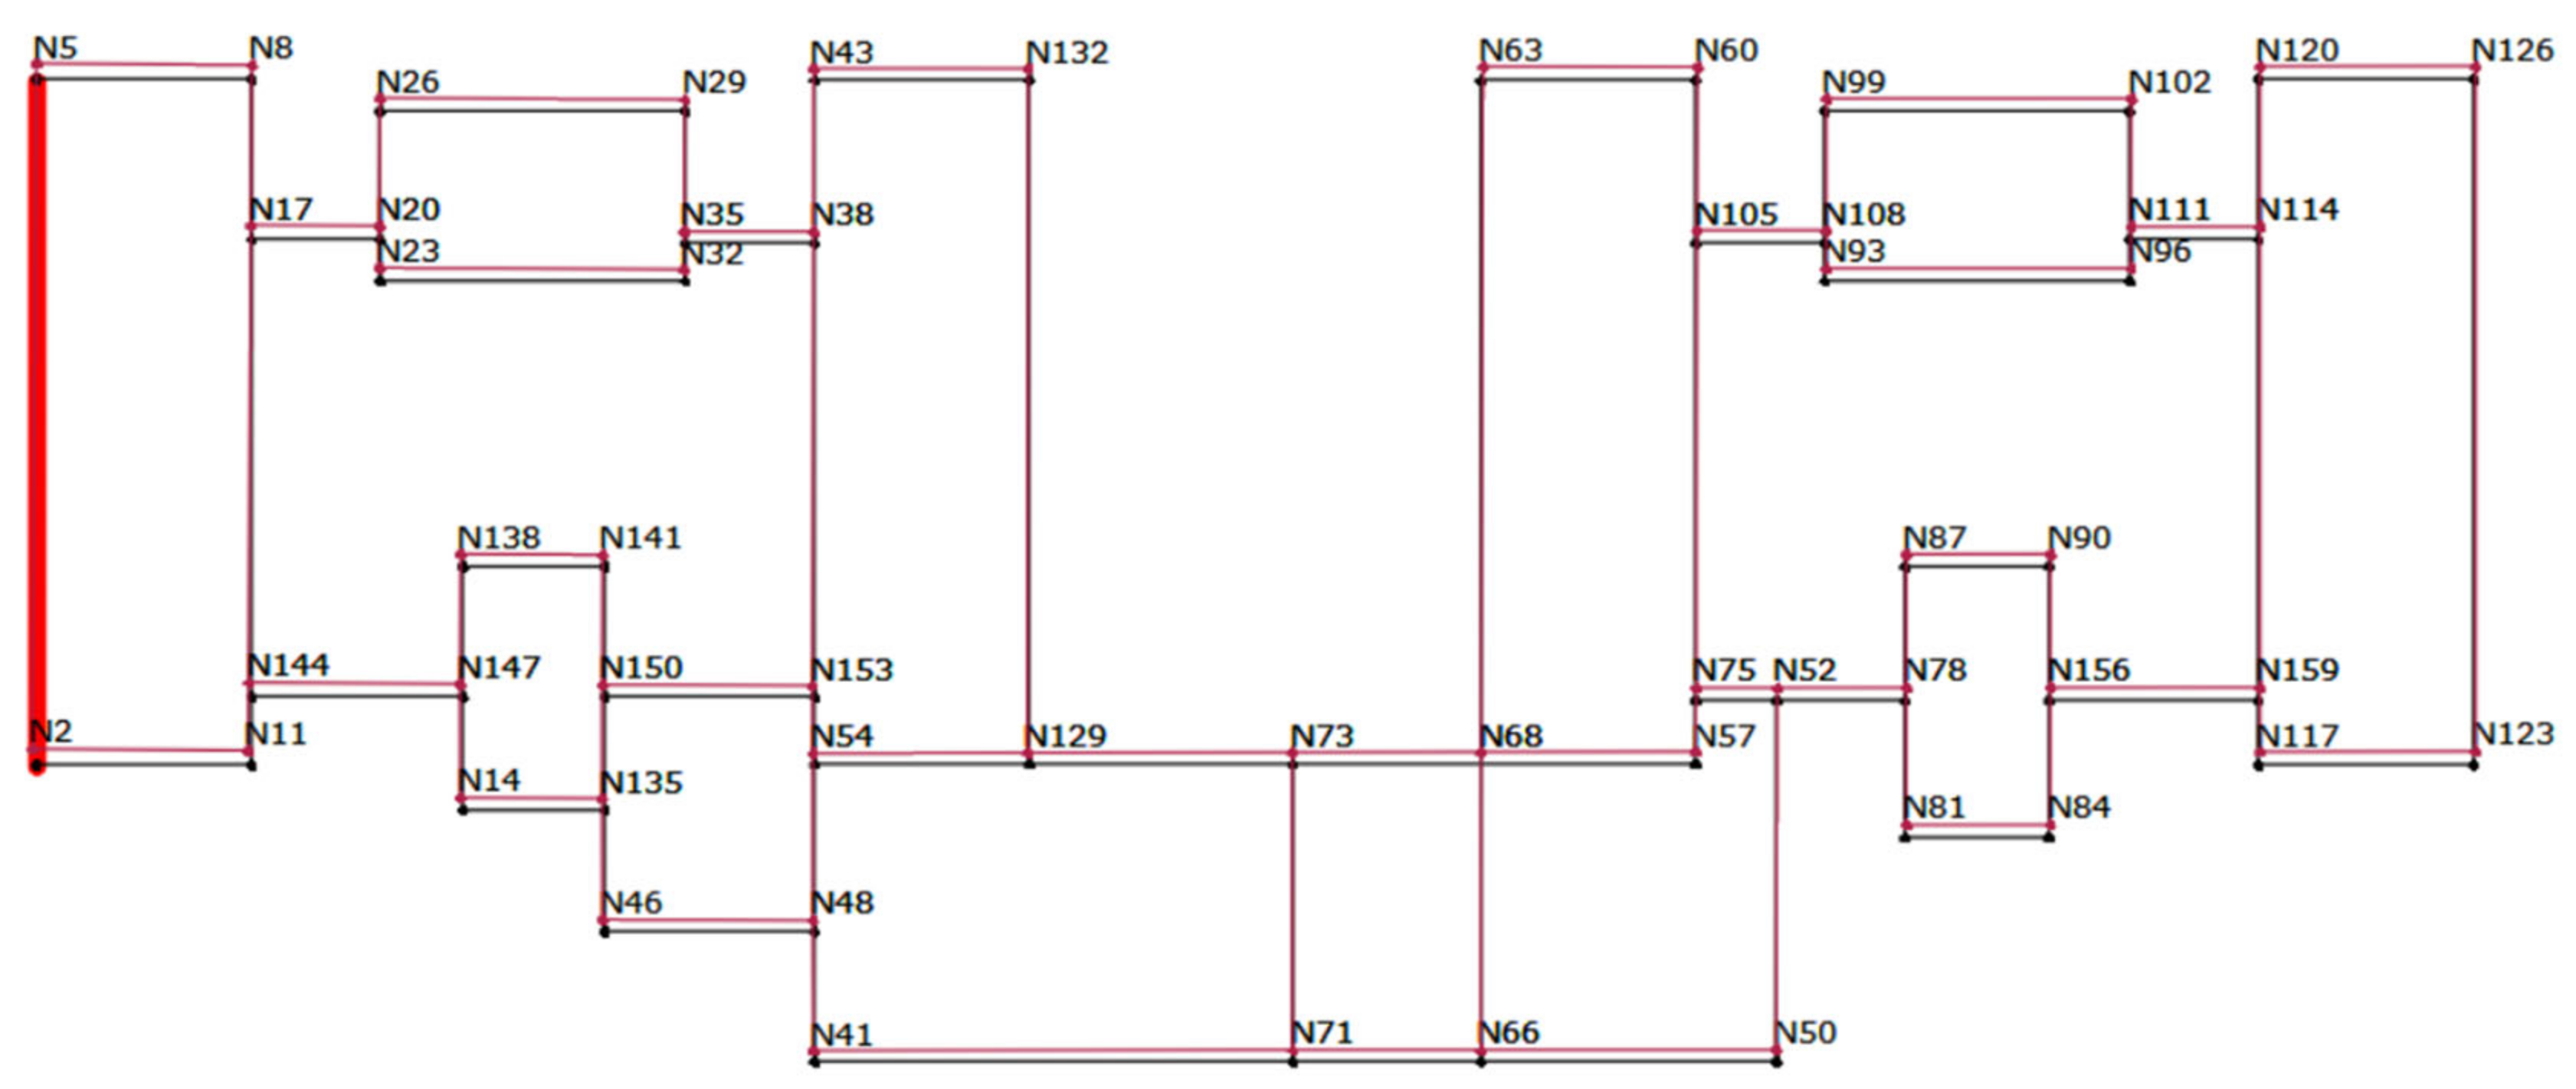
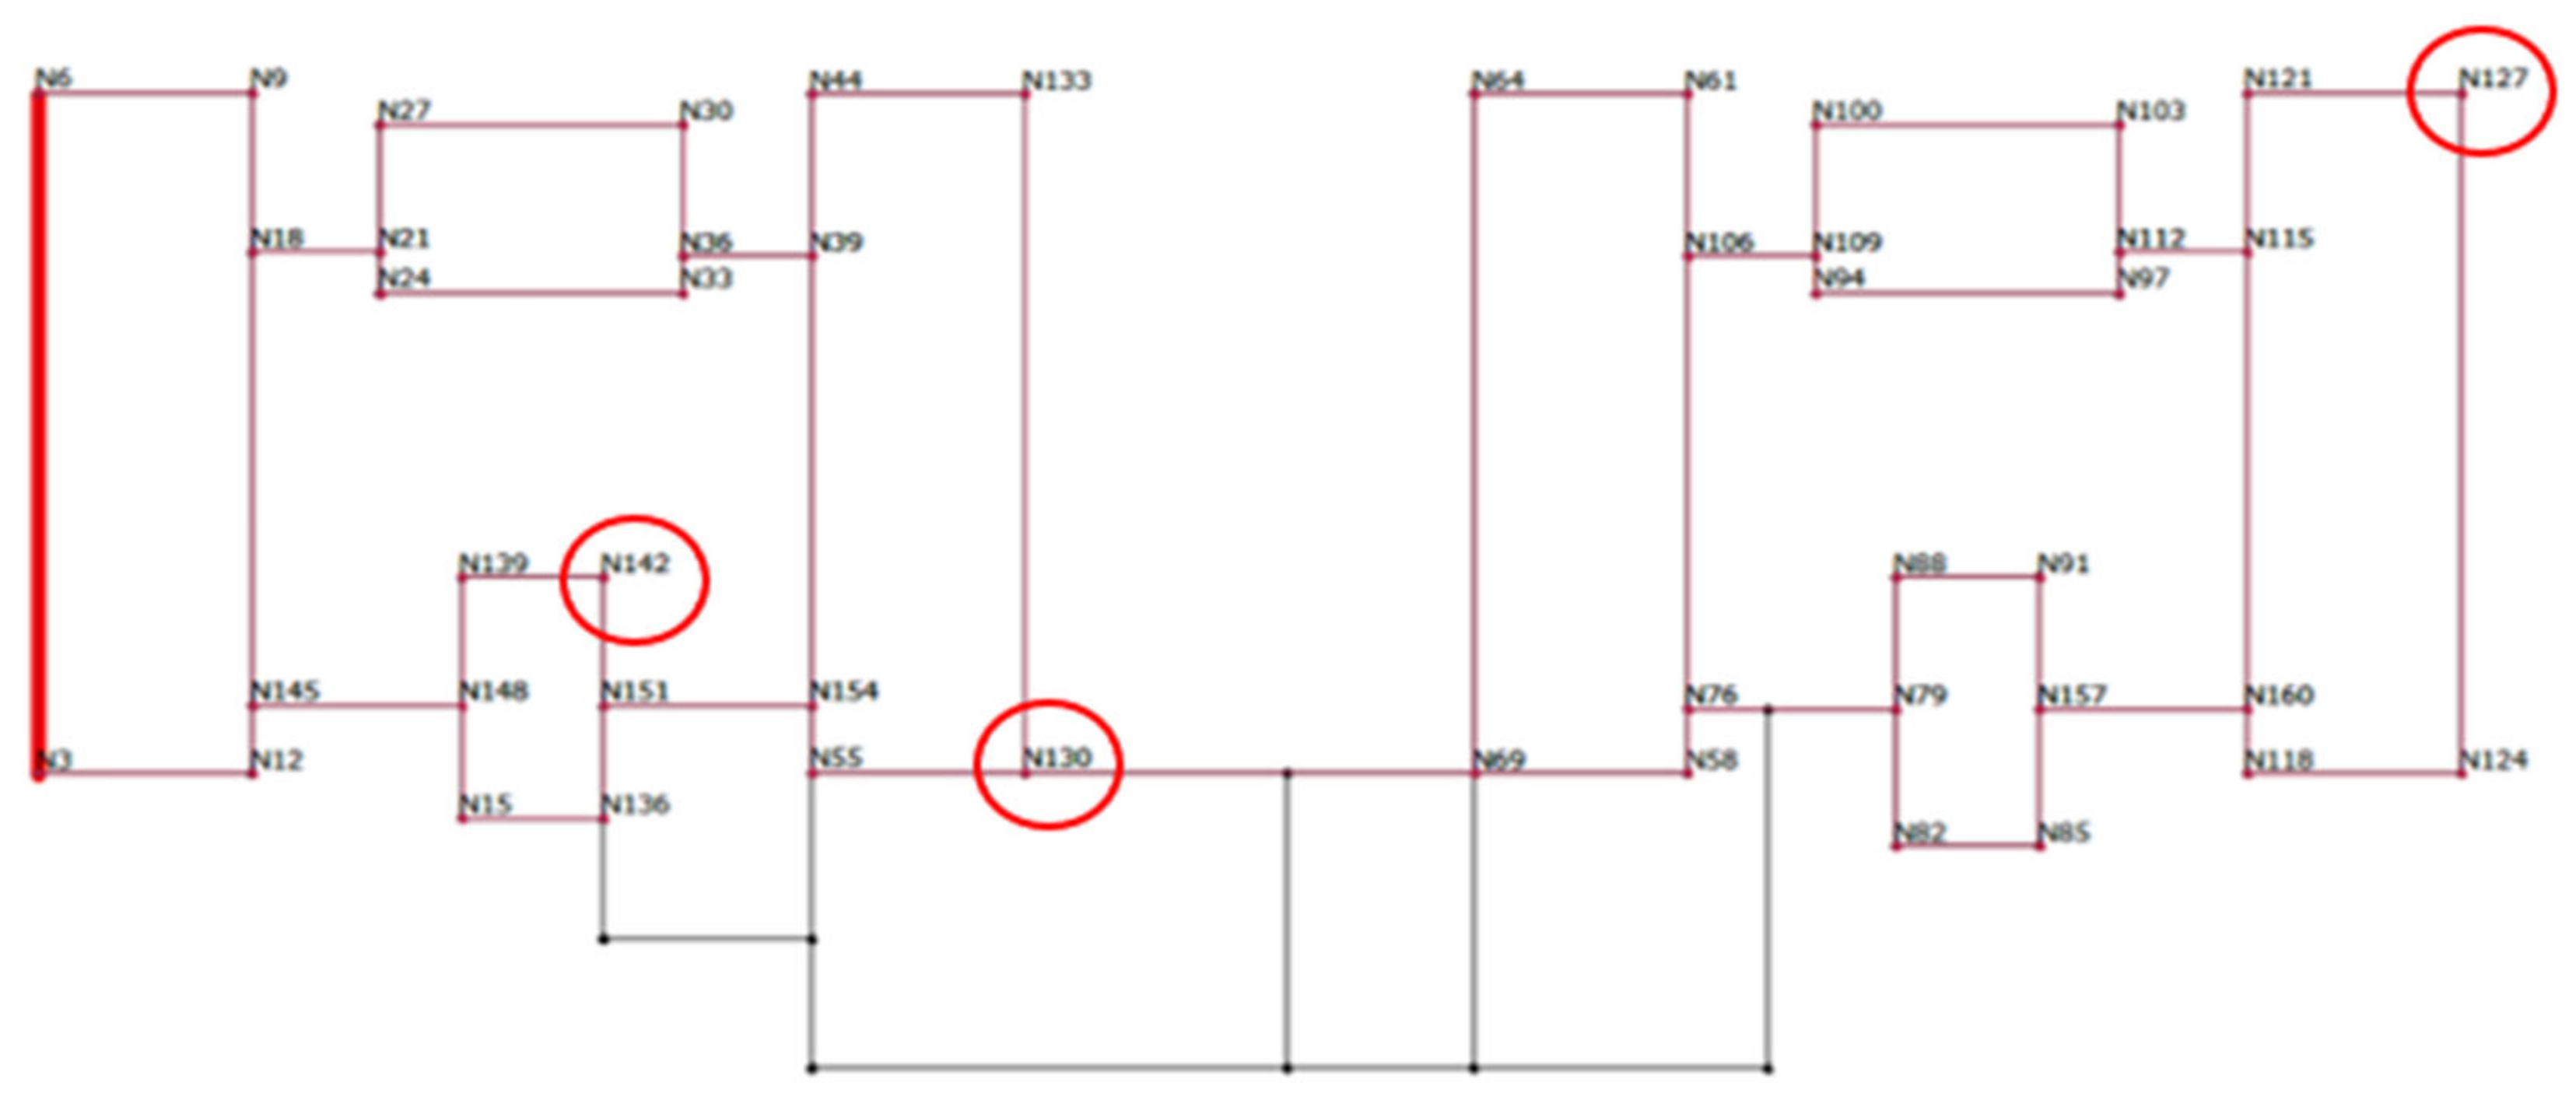
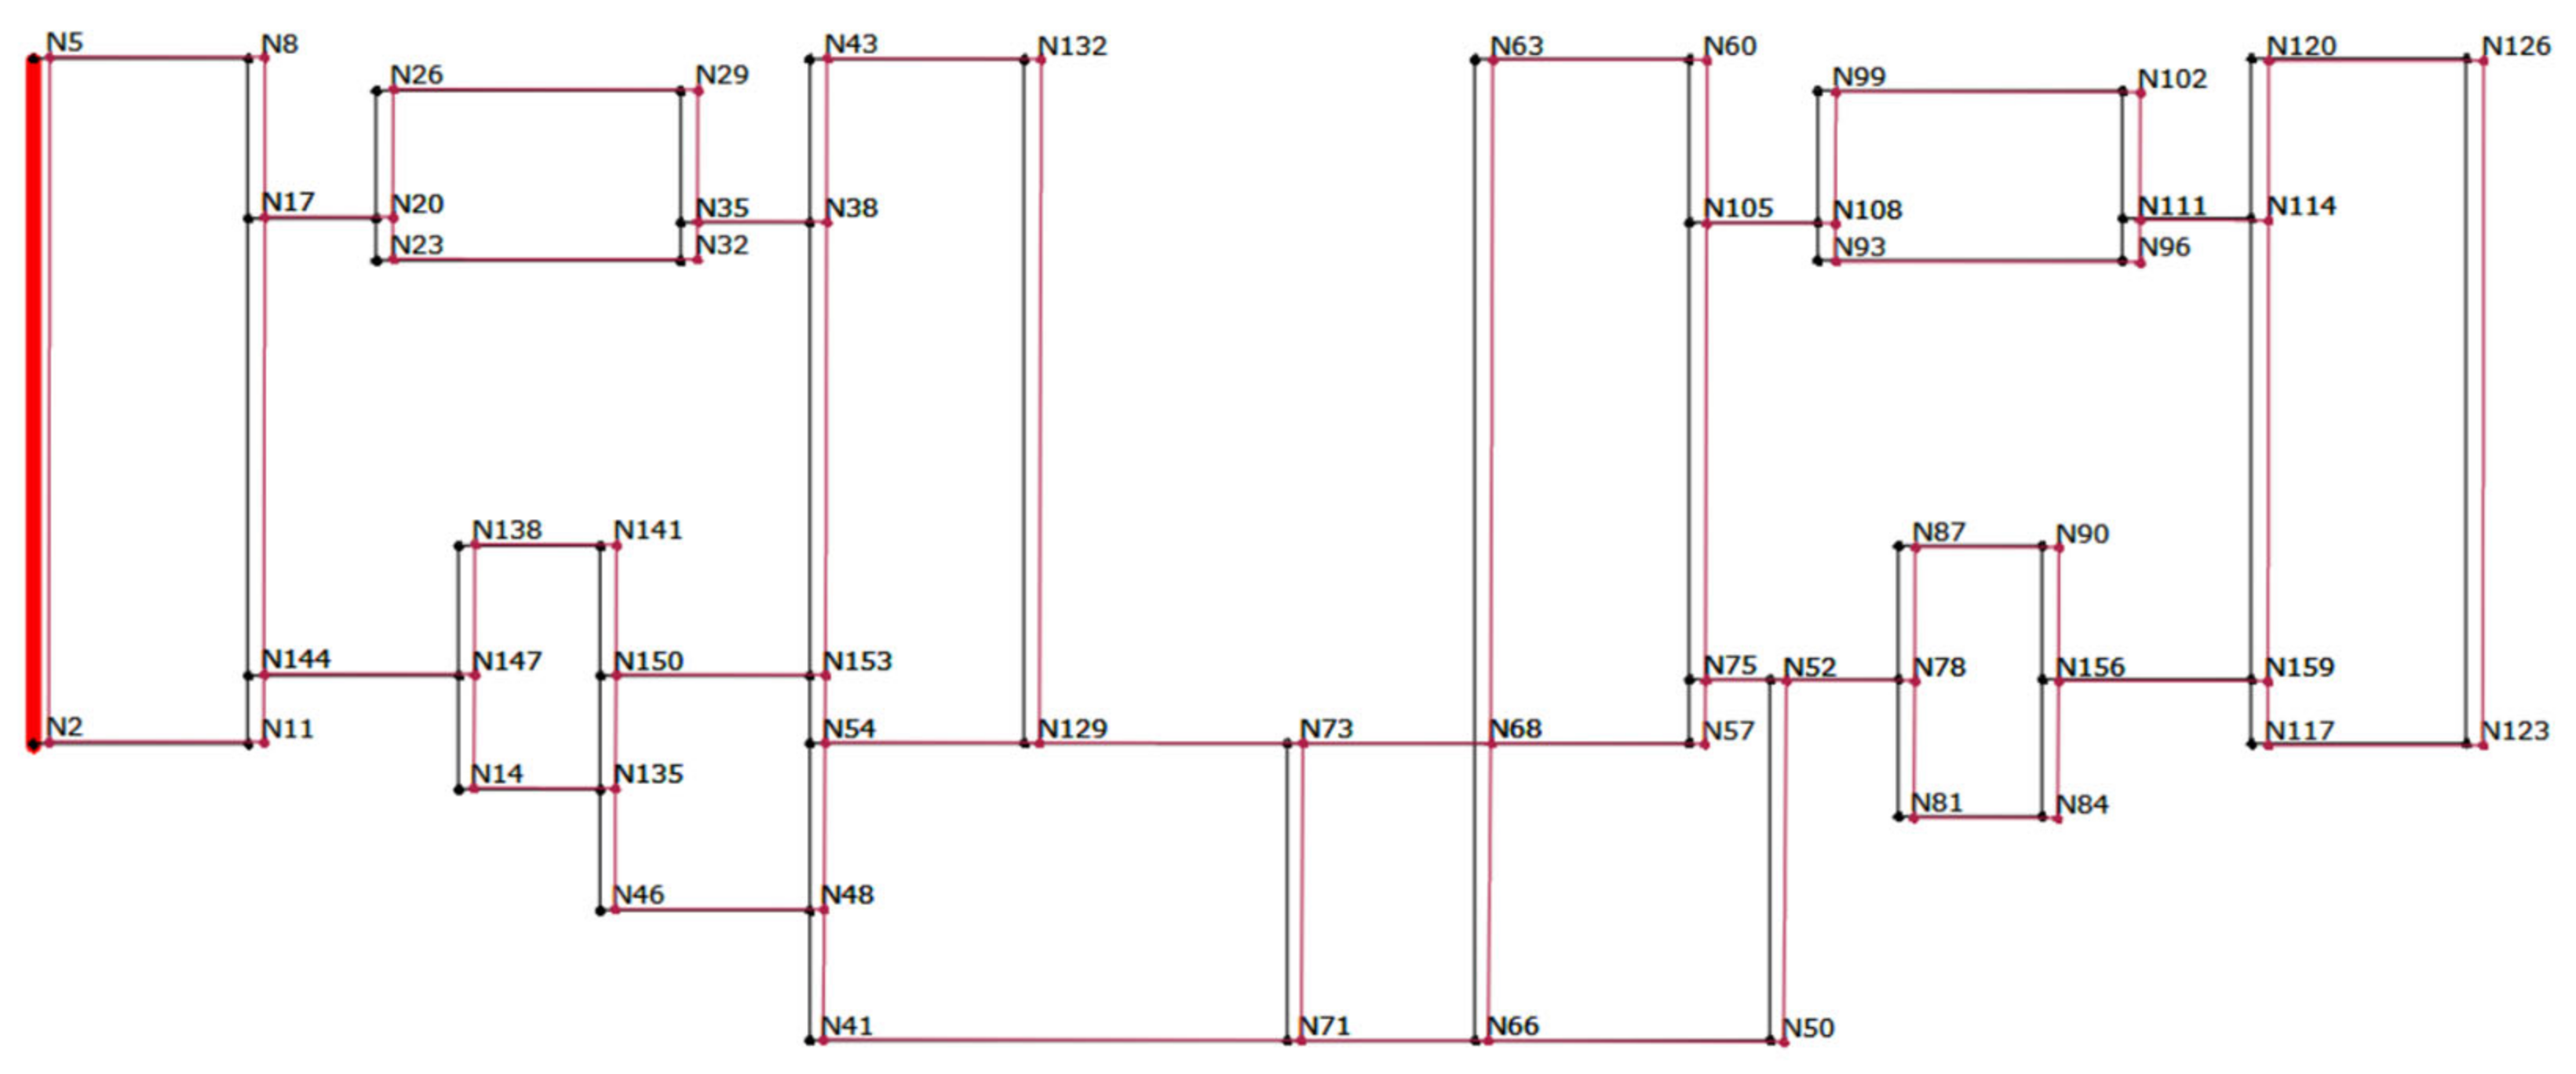
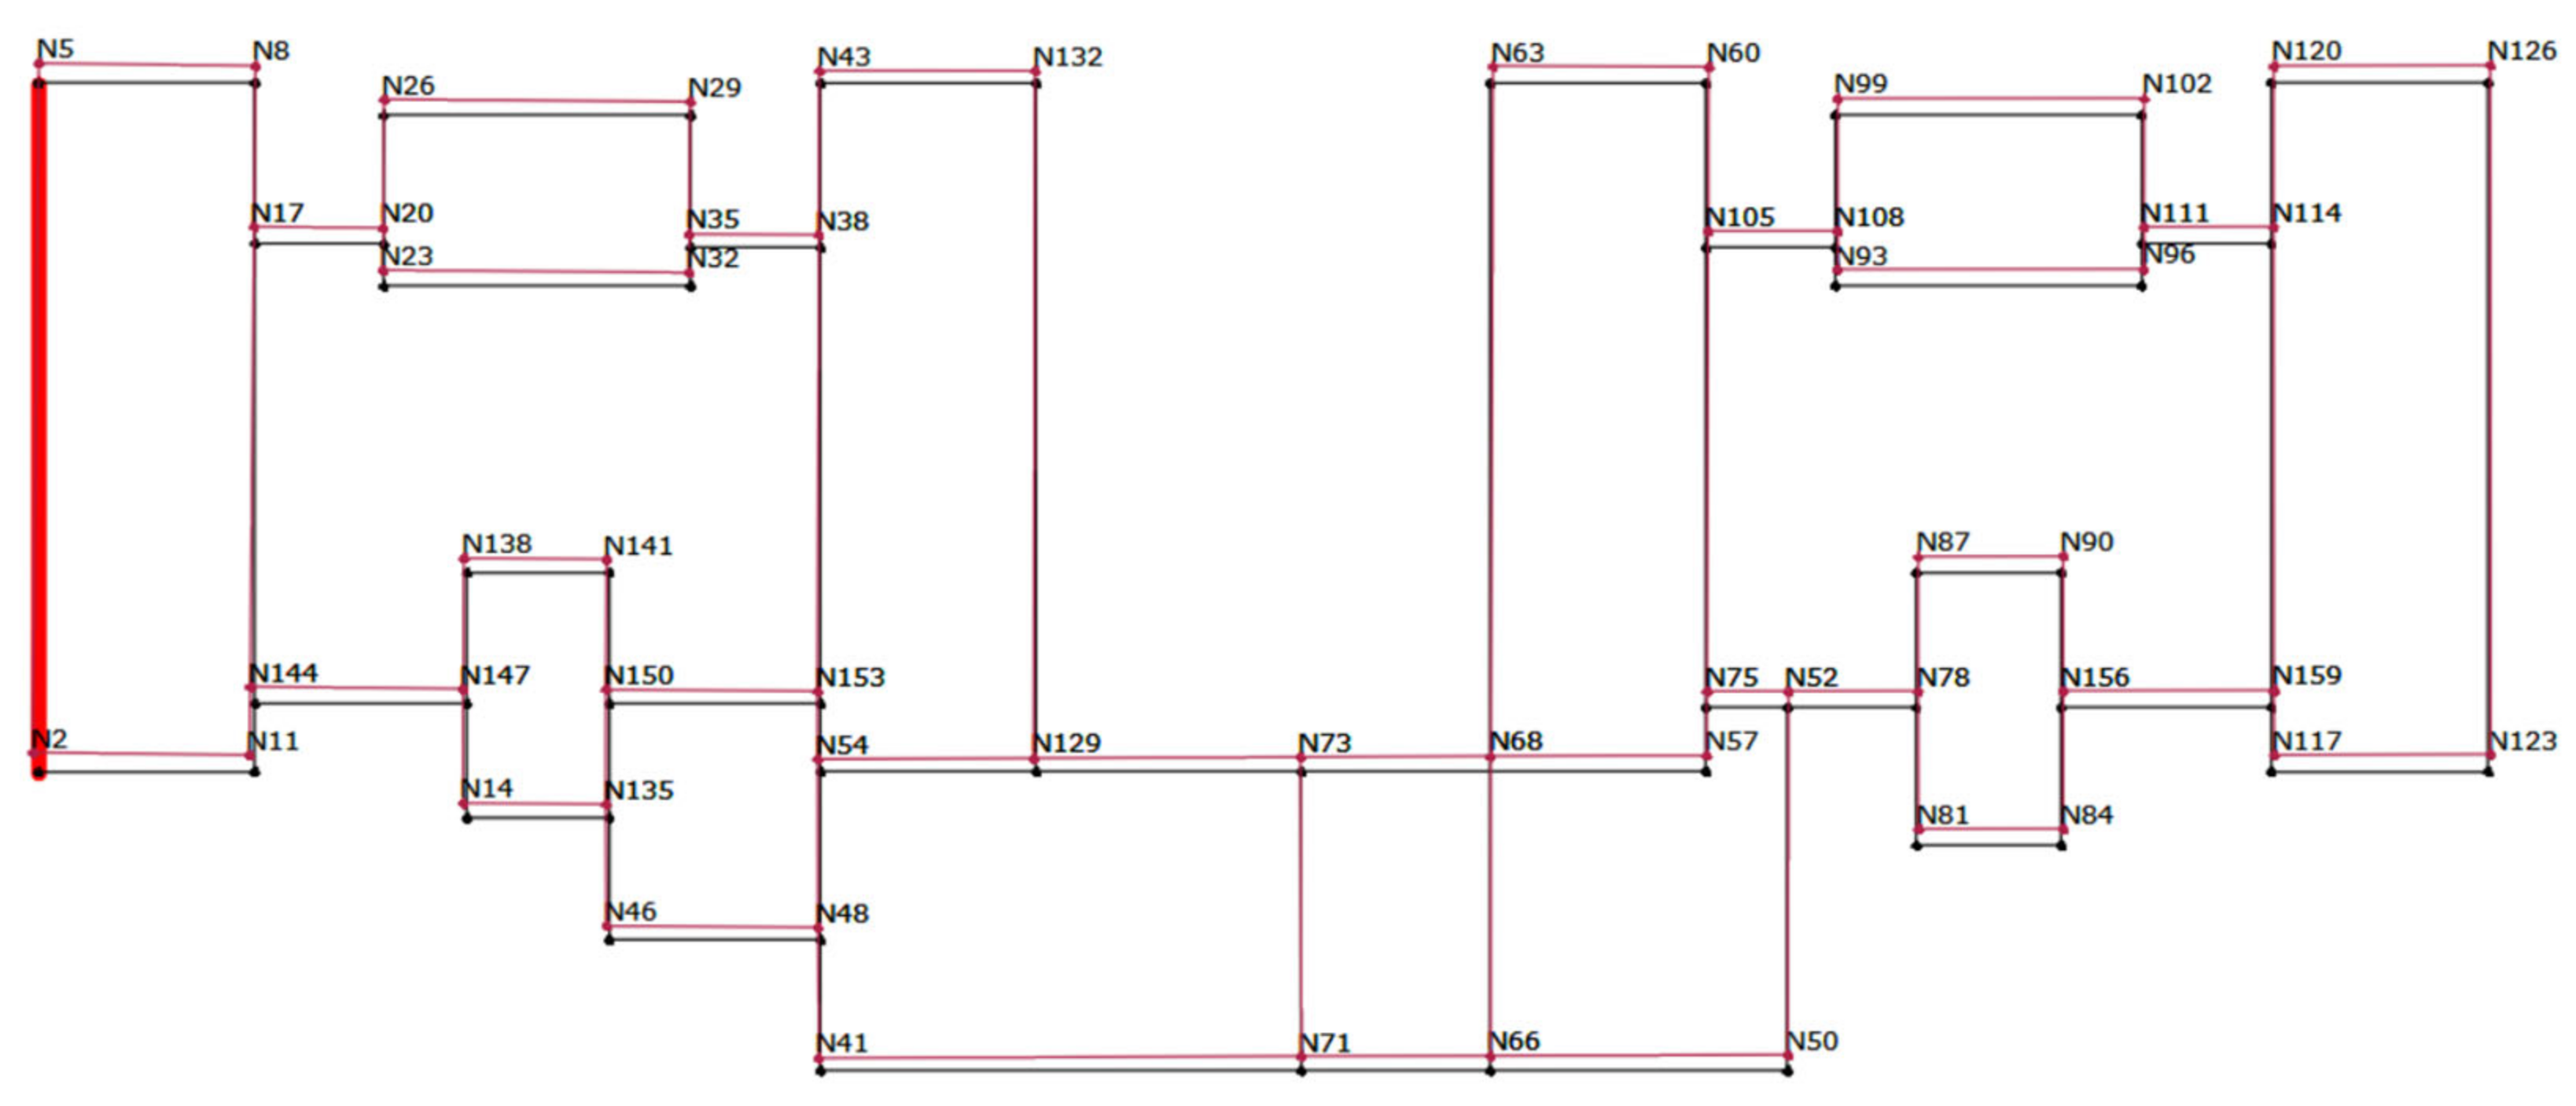
Figure 23.
The control nodes monitored in pushover analyses (Red circle show control nodes).
Figure 23.
The control nodes monitored in pushover analyses (Red circle show control nodes).
Figure 24.
A graphic representation of strengthened masonry walls.
Figure 24.
A graphic representation of strengthened masonry walls.
Figure 25.
A graphic representation of a school masonry wall retrofitted with an FRP system.
Figure 25.
A graphic representation of a school masonry wall retrofitted with an FRP system.
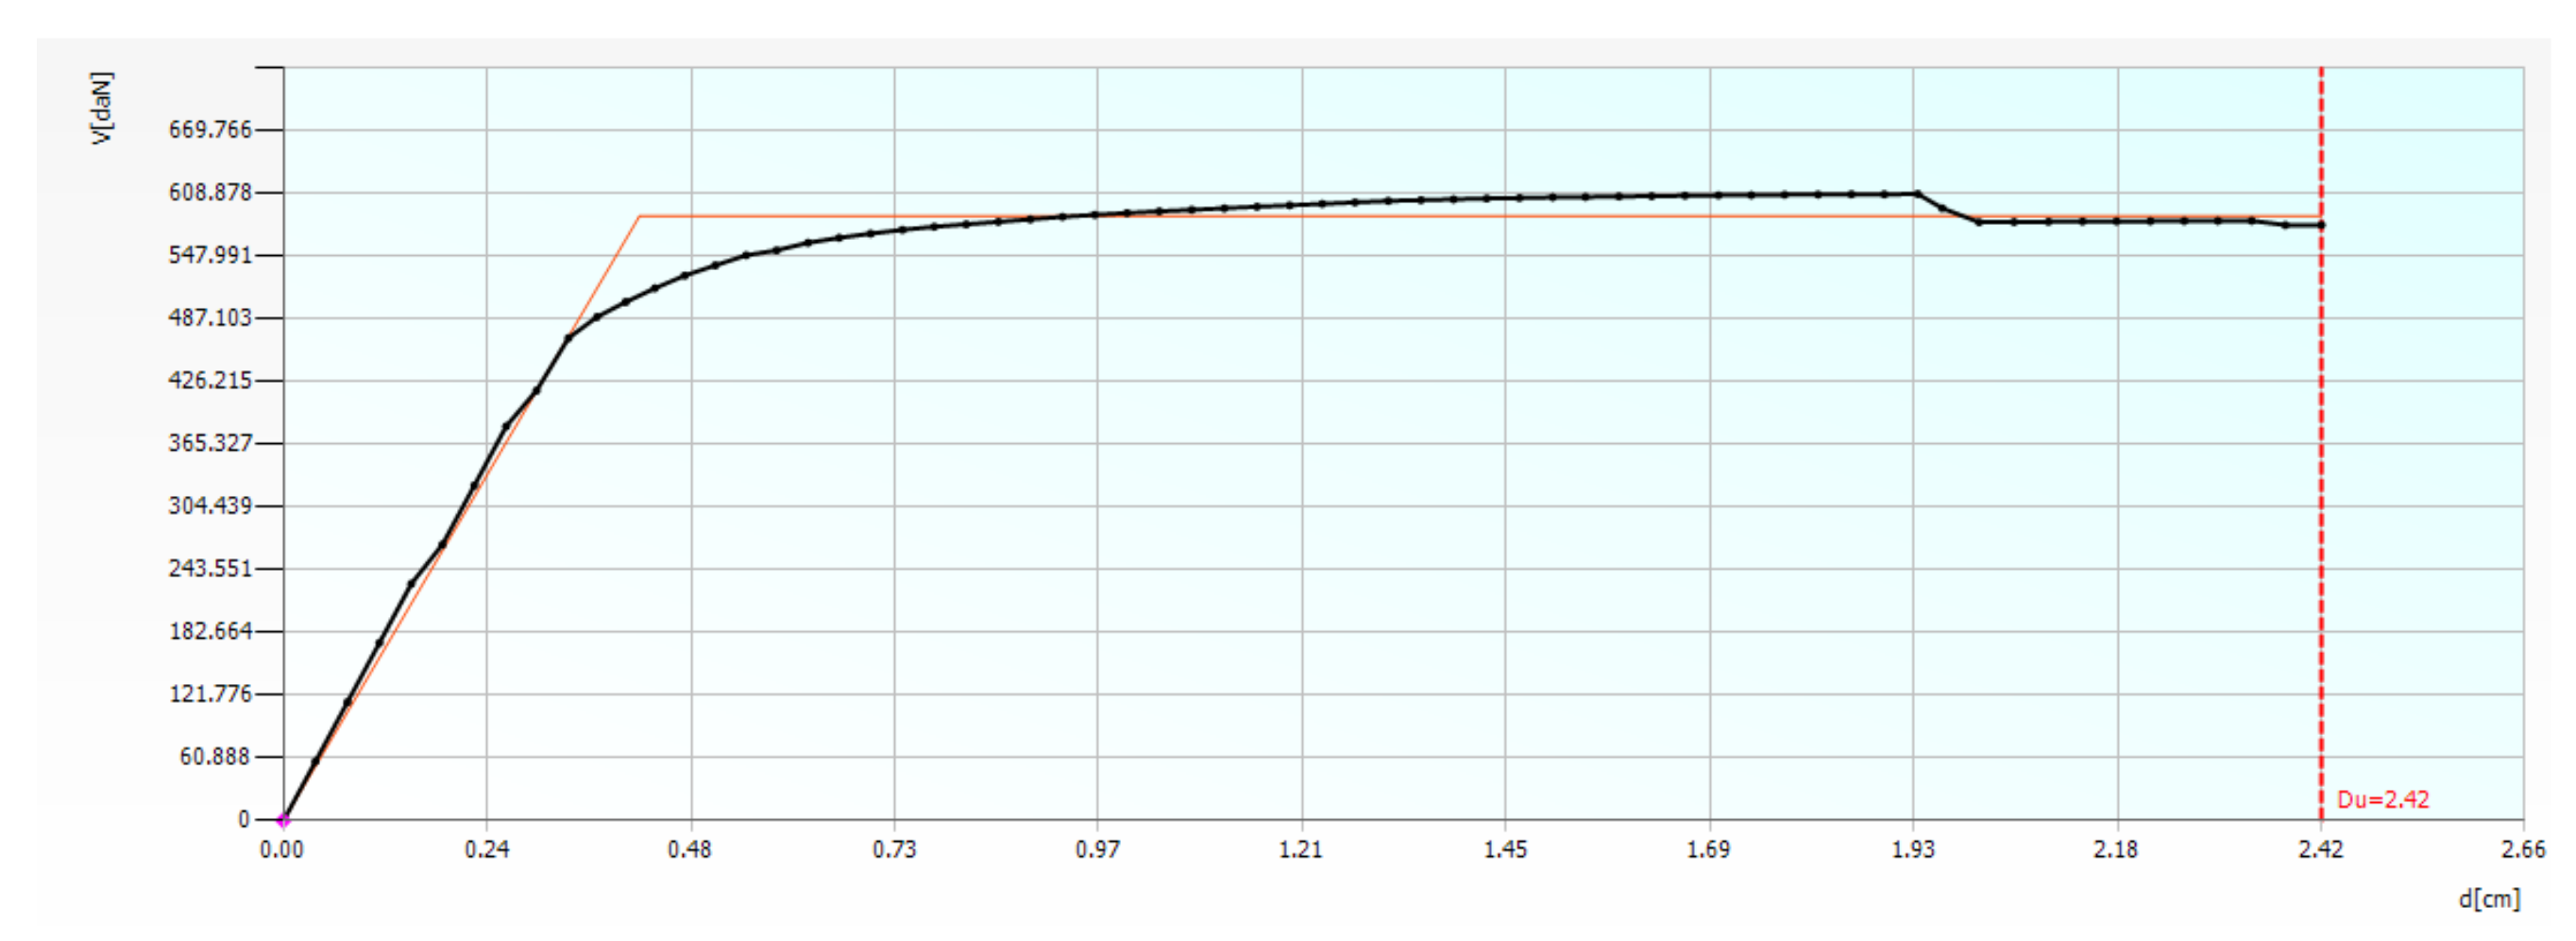
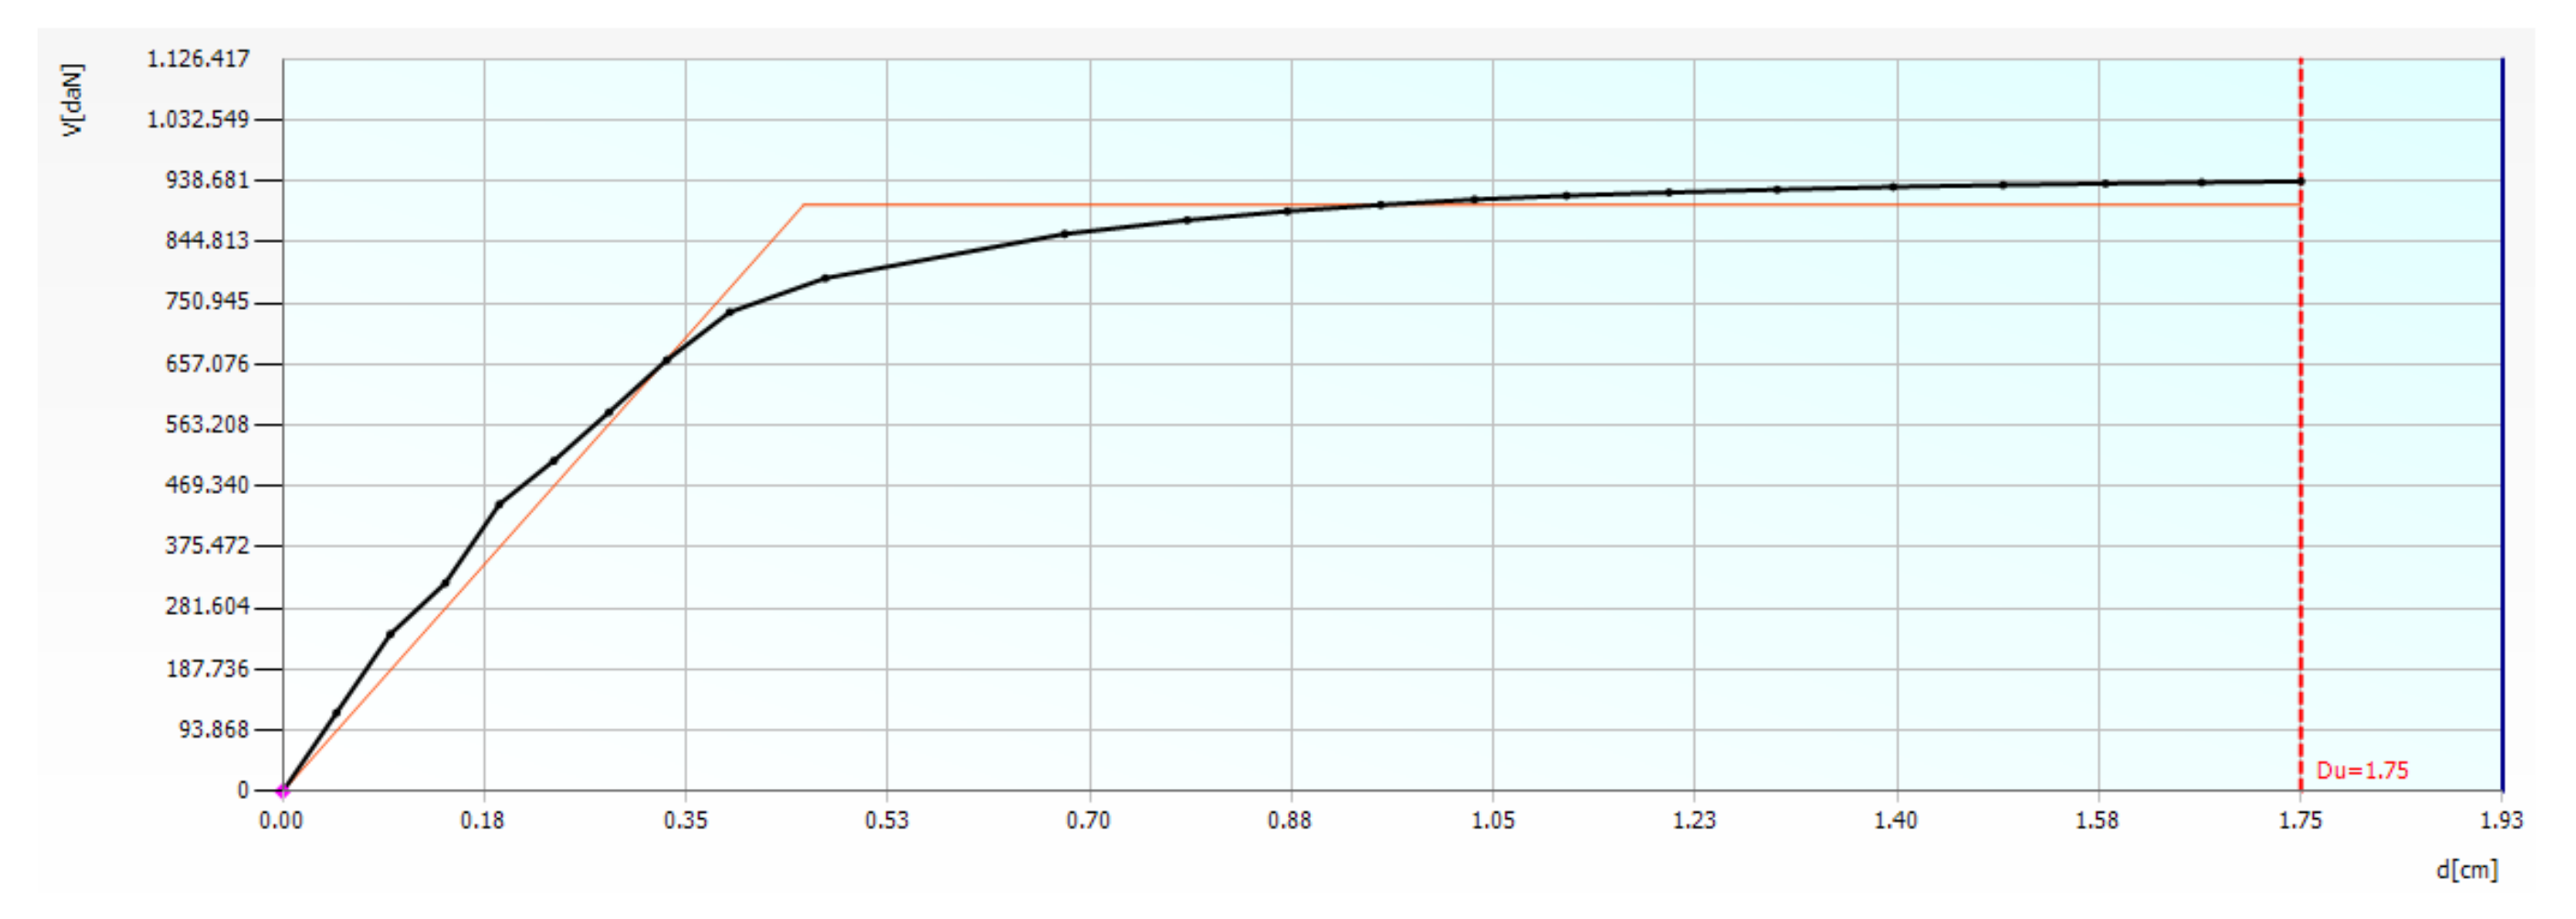
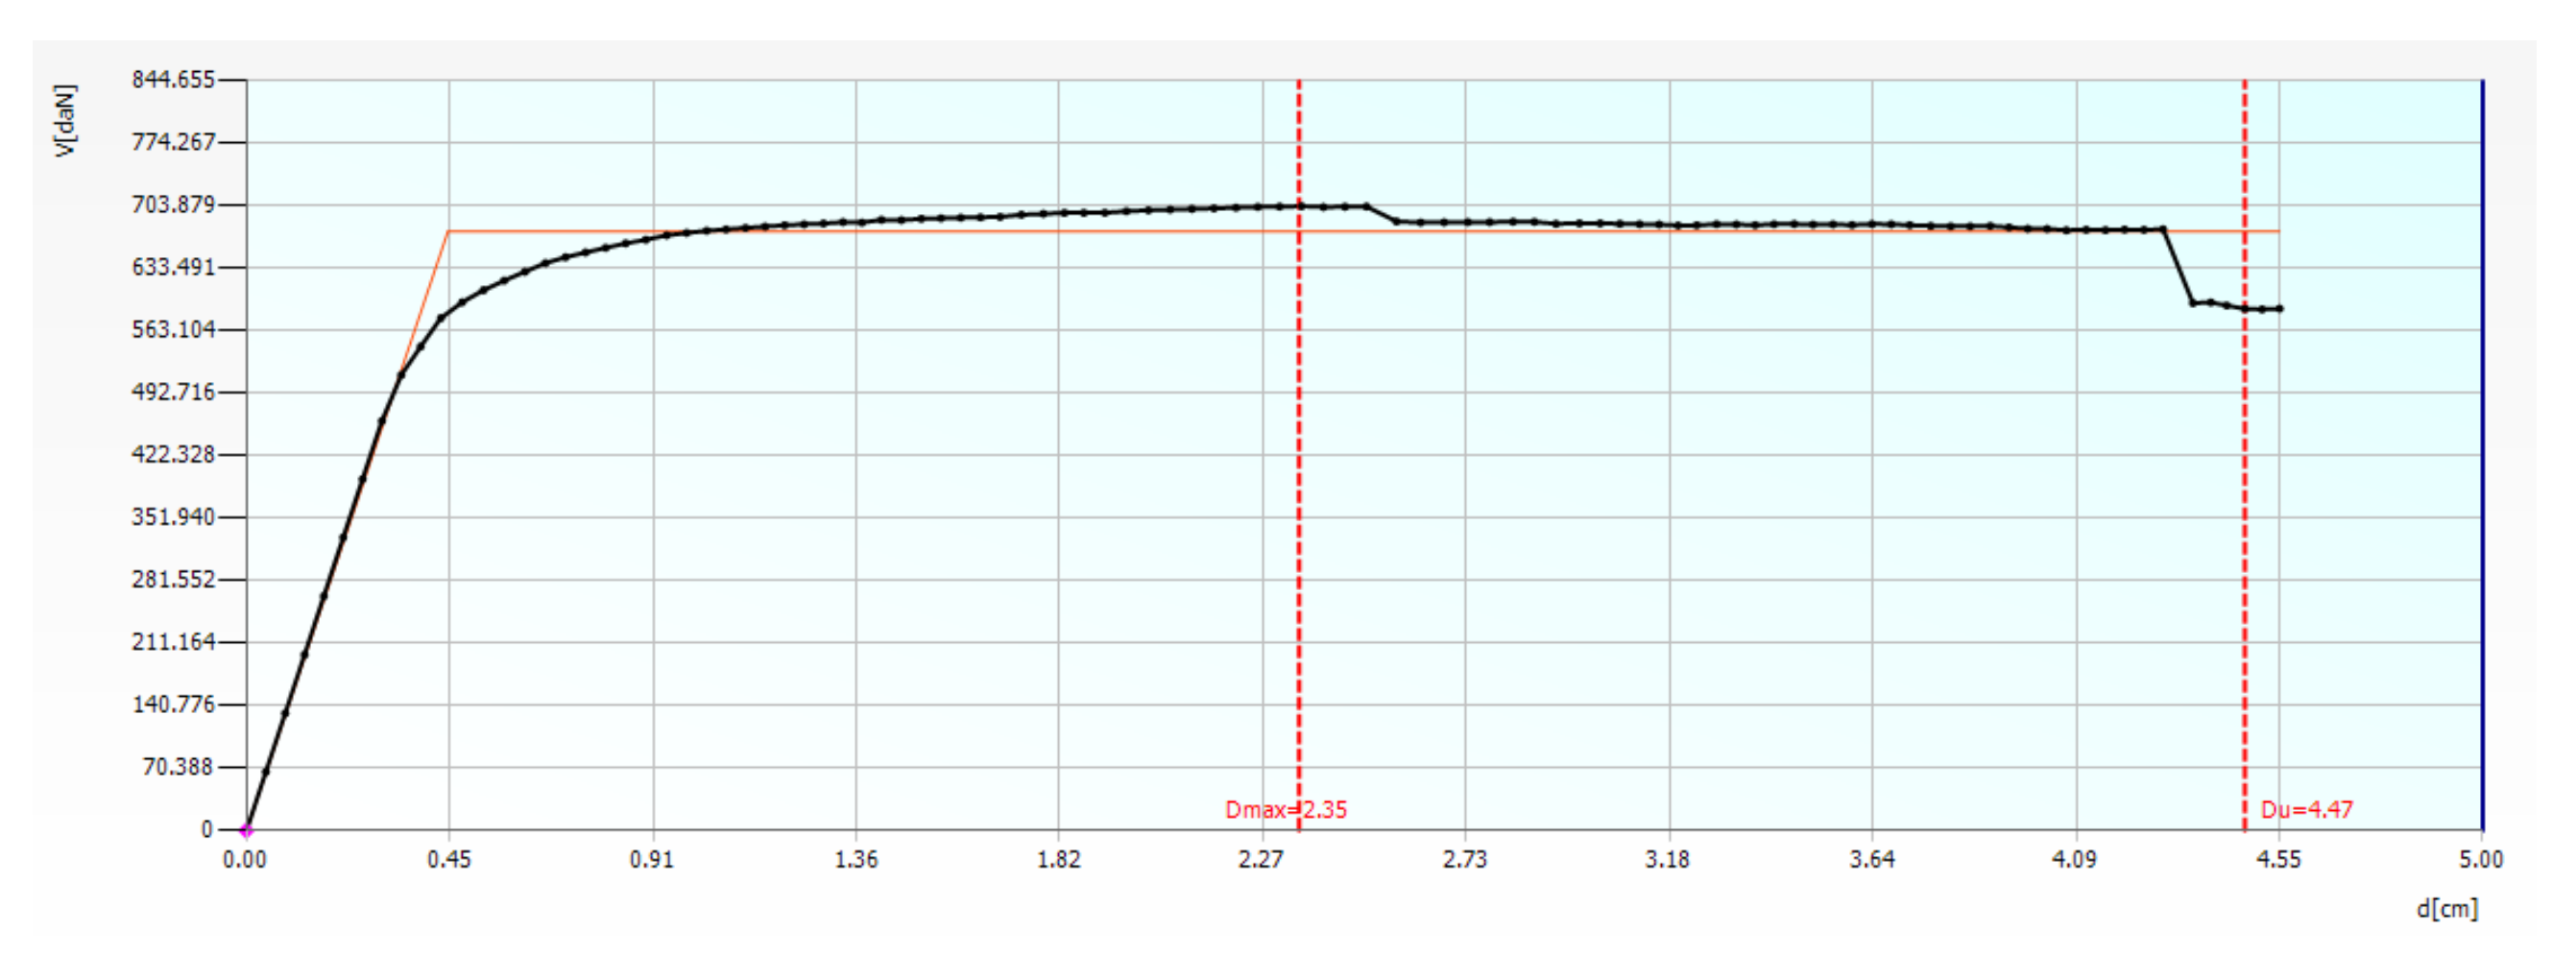
Figure 26.
Worst pushover curve in direction x on the building retrofitted with an FRP system (Black curve is the pushover, red one corresponds to bilinear equivalent).
Figure 26.
Worst pushover curve in direction x on the building retrofitted with an FRP system (Black curve is the pushover, red one corresponds to bilinear equivalent).
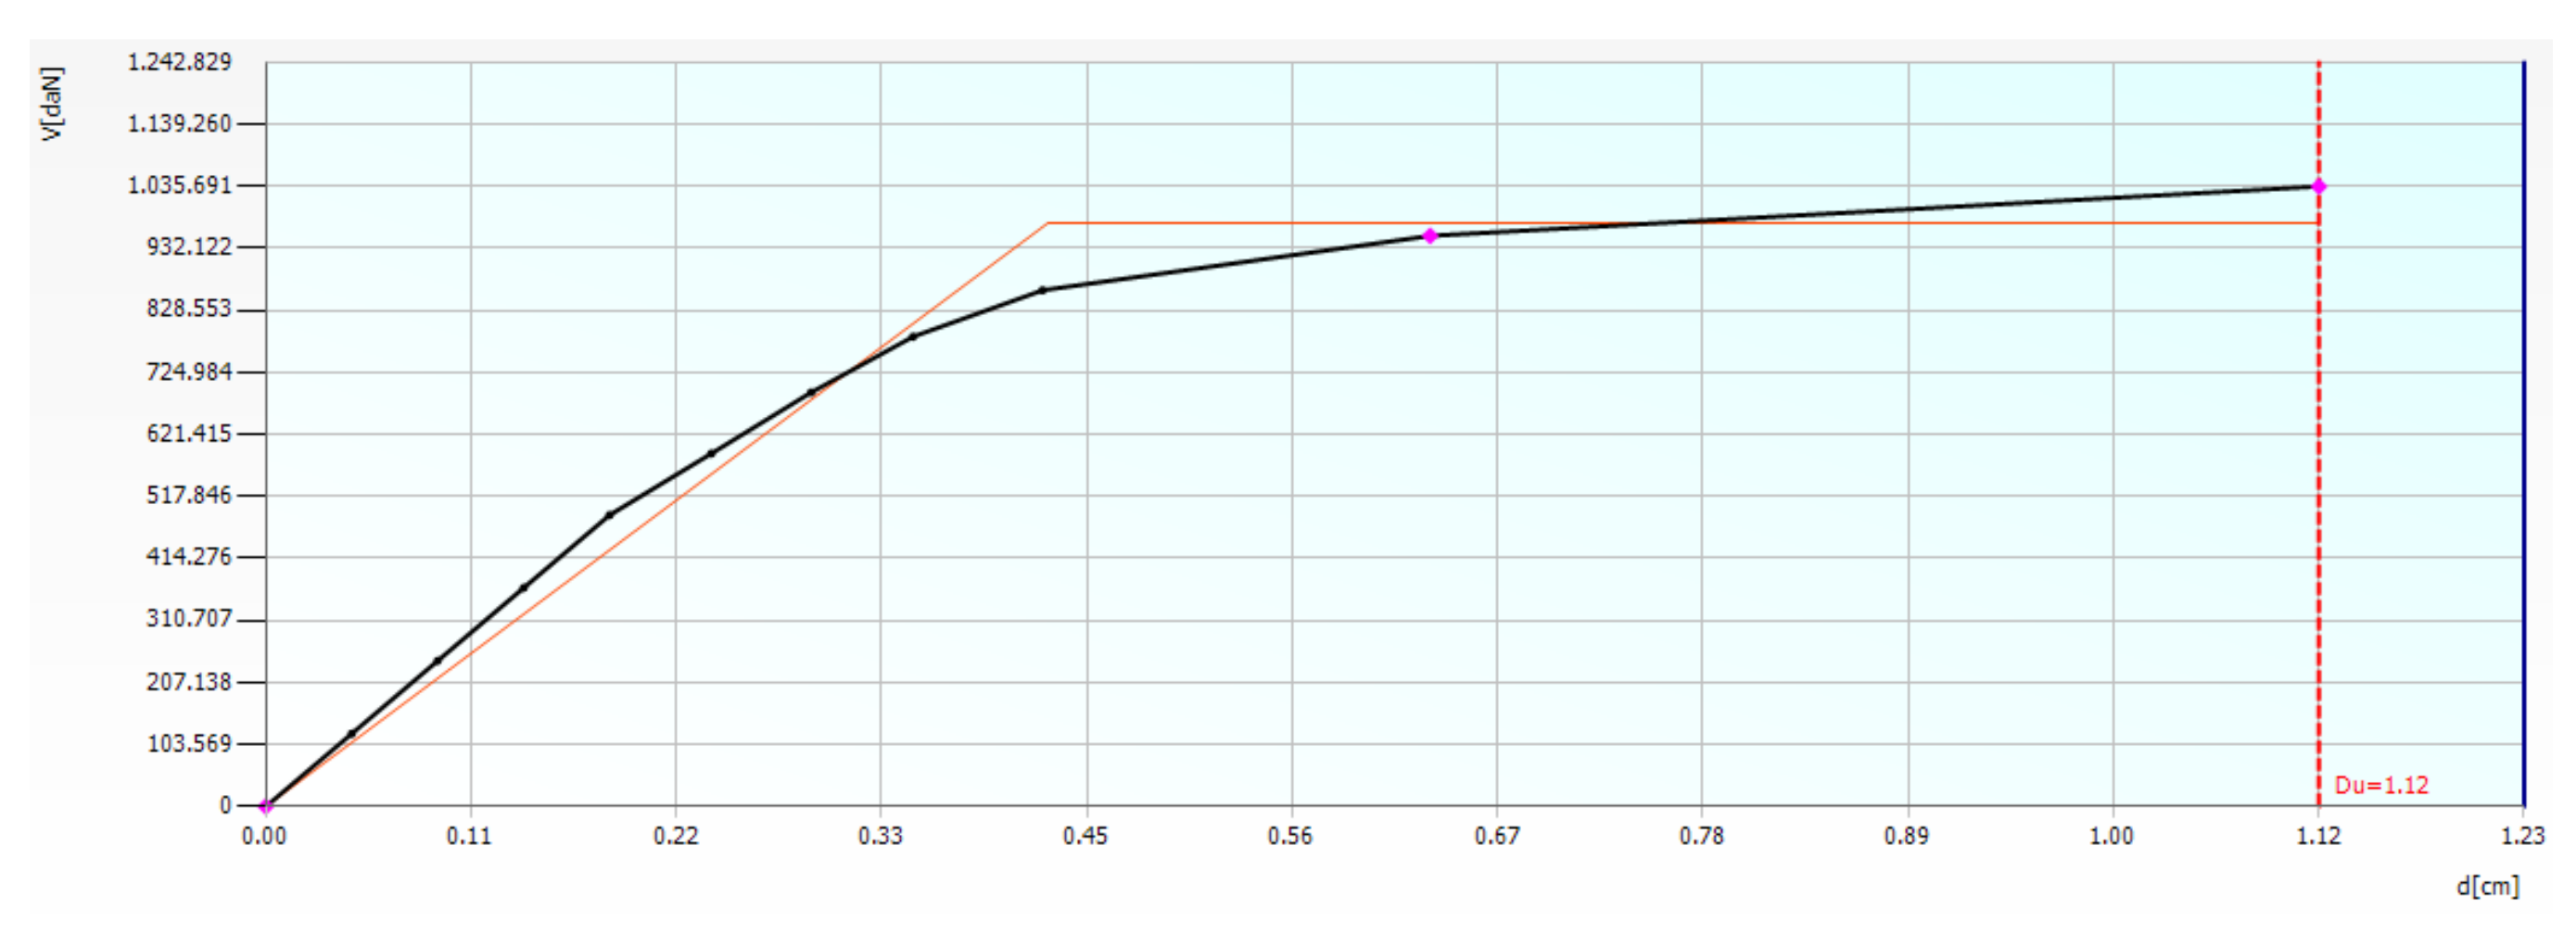
Figure 27.
Worst pushover curve in direction y on the building retrofitted with an FRP system.
Figure 27.
Worst pushover curve in direction y on the building retrofitted with an FRP system.
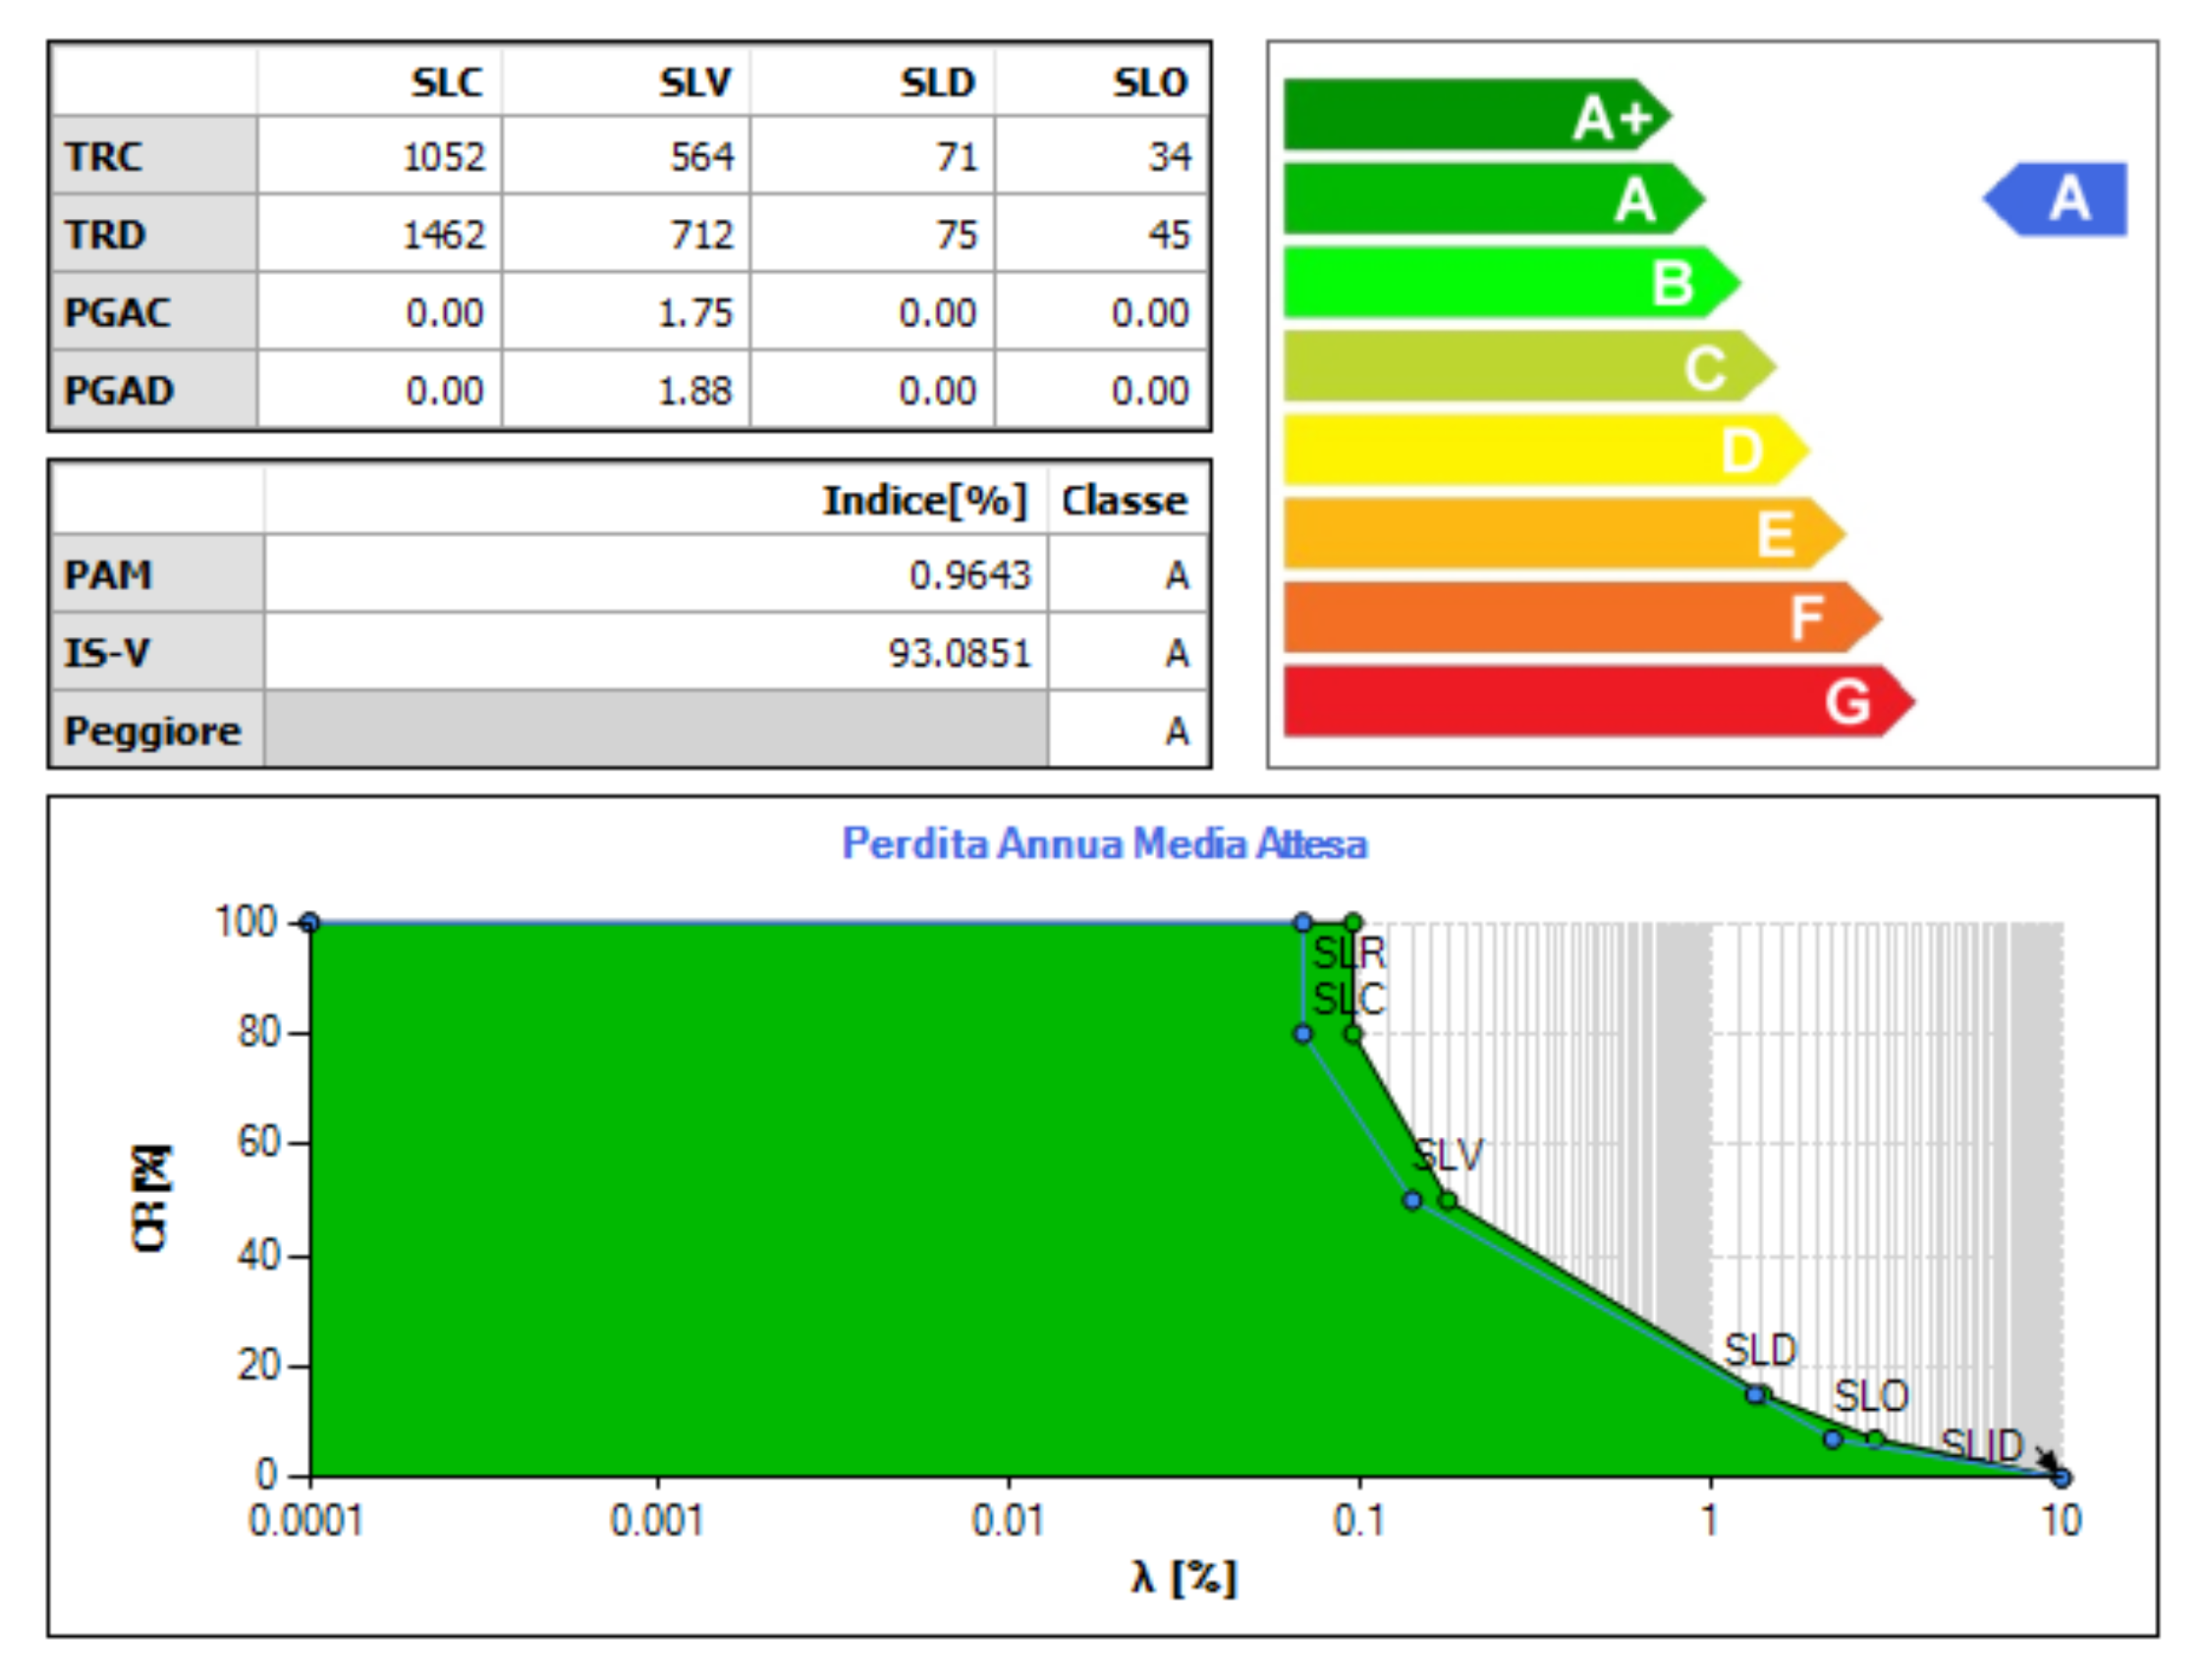
Figure 28.
Seismic risk classification of the building retrofitted with an FRP system.
Figure 28.
Seismic risk classification of the building retrofitted with an FRP system.
Figure 29.
Deformed shape of the original building in the x direction.
Figure 29.
Deformed shape of the original building in the x direction.
Figure 30.
Deformed shape of the original building in the y direction.
Figure 30.
Deformed shape of the original building in the y direction.
Figure 31.
A graphic representation of a school masonry wall retrofitted by an FRCM system.
Figure 31.
A graphic representation of a school masonry wall retrofitted by an FRCM system.
Figure 32.
Worst pushover curve in direction x on the building retrofitted with an FRCM system.
Figure 32.
Worst pushover curve in direction x on the building retrofitted with an FRCM system.
Figure 33.
Worst pushover curve in direction y on the building retrofitted with an FRCM system.
Figure 33.
Worst pushover curve in direction y on the building retrofitted with an FRCM system.
Figure 34.
Deformed shape of the original building in the x direction.
Figure 34.
Deformed shape of the original building in the x direction.
Figure 35.
Deformed shape of the original building in the y direction.
Figure 35.
Deformed shape of the original building in the y direction.
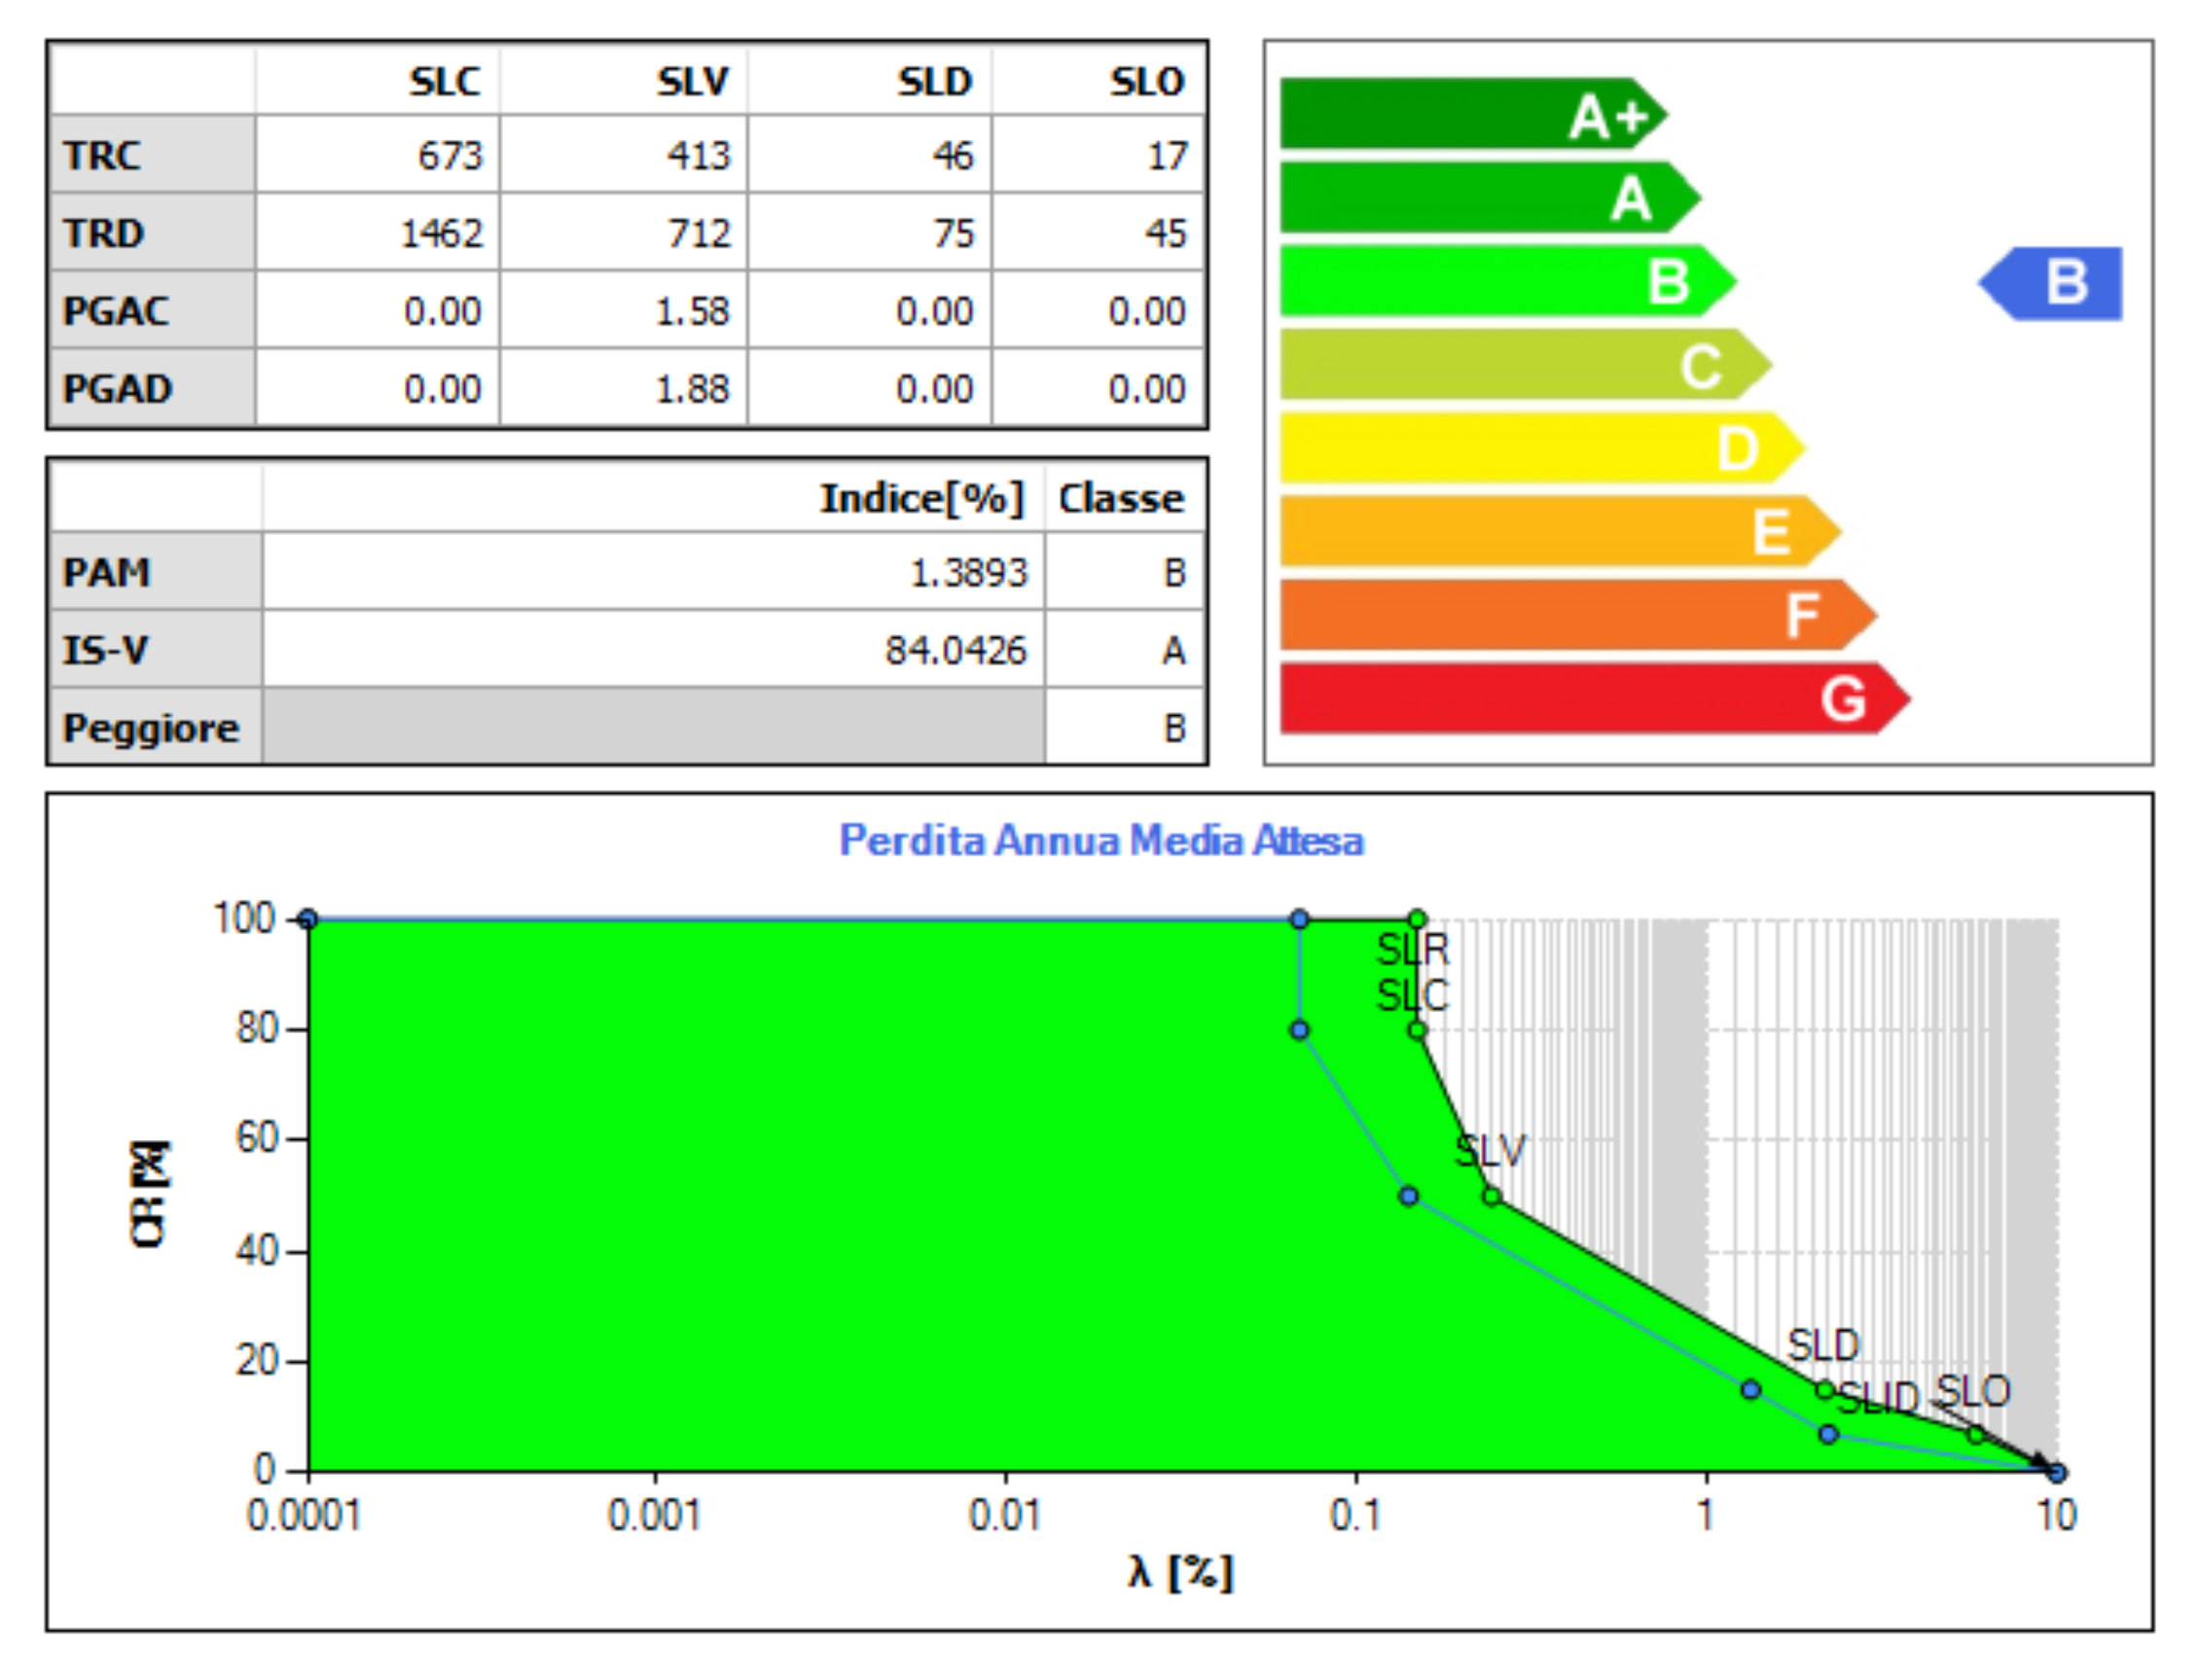
Figure 36.
Seismic risk classification of the building retrofitted with an FRCM system.
Figure 36.
Seismic risk classification of the building retrofitted with an FRCM system.
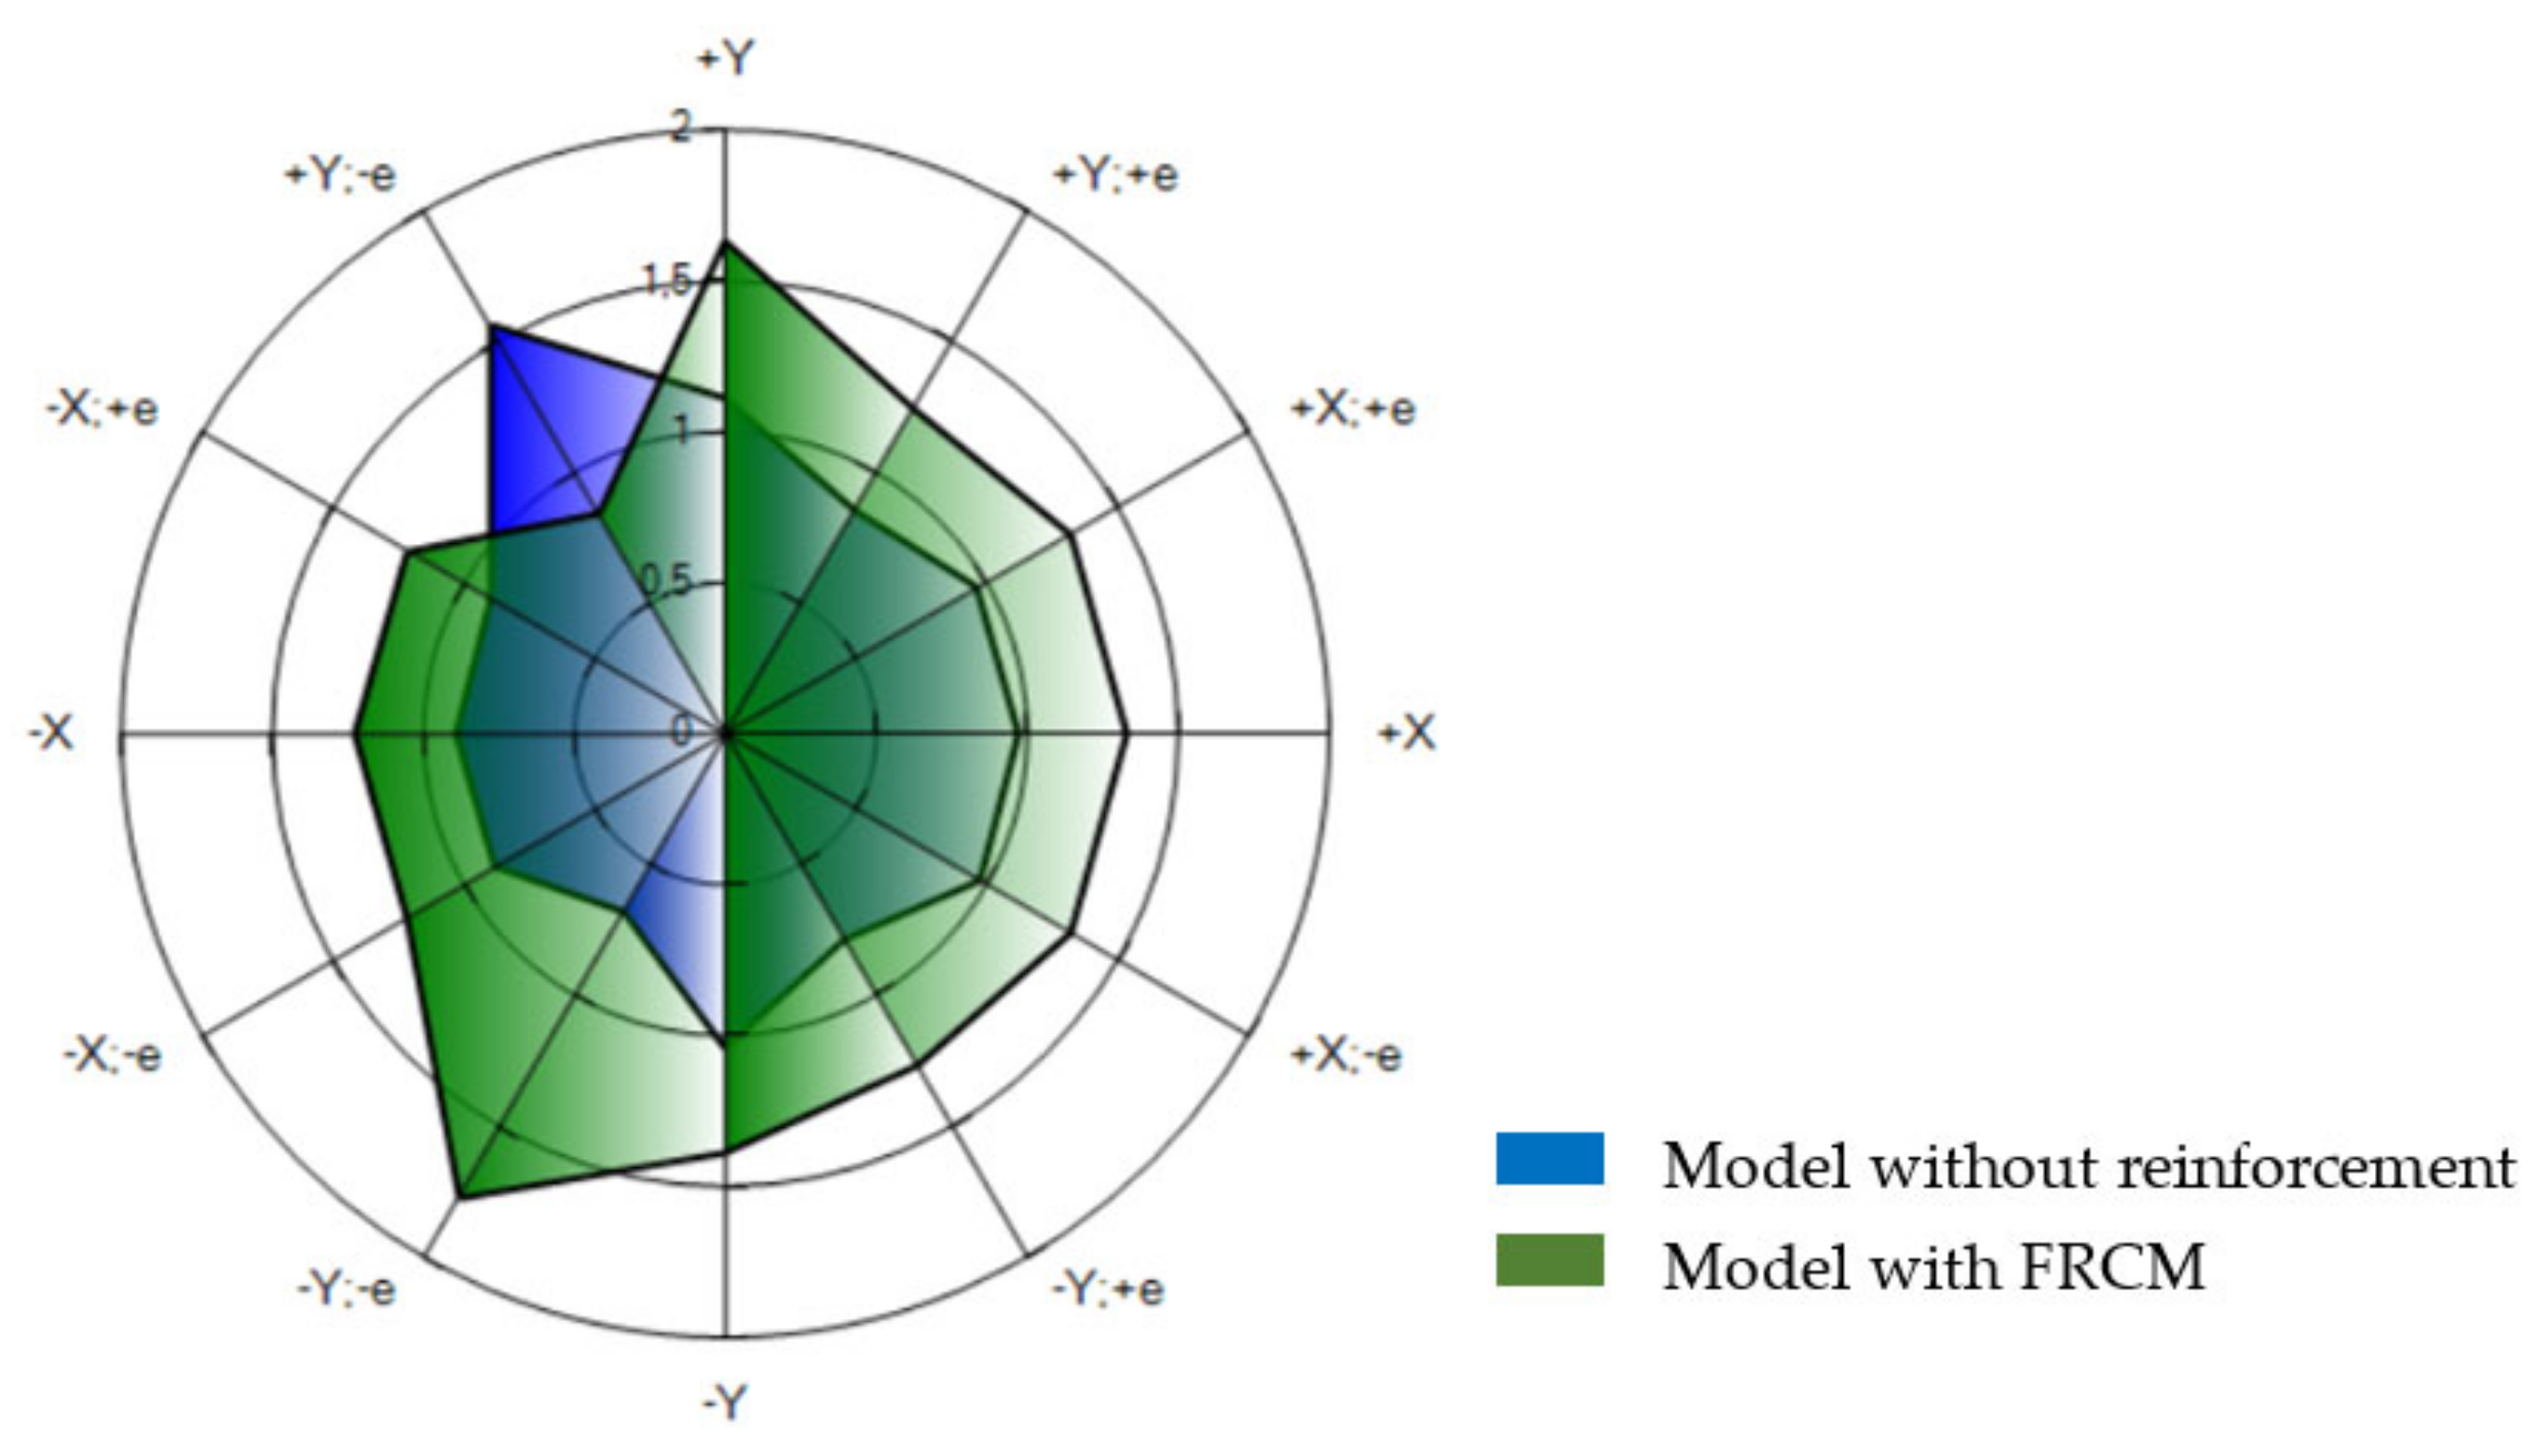
Figure 37.
Graphical comparison between model without/with FRCM reinforcement.
Figure 37.
Graphical comparison between model without/with FRCM reinforcement.
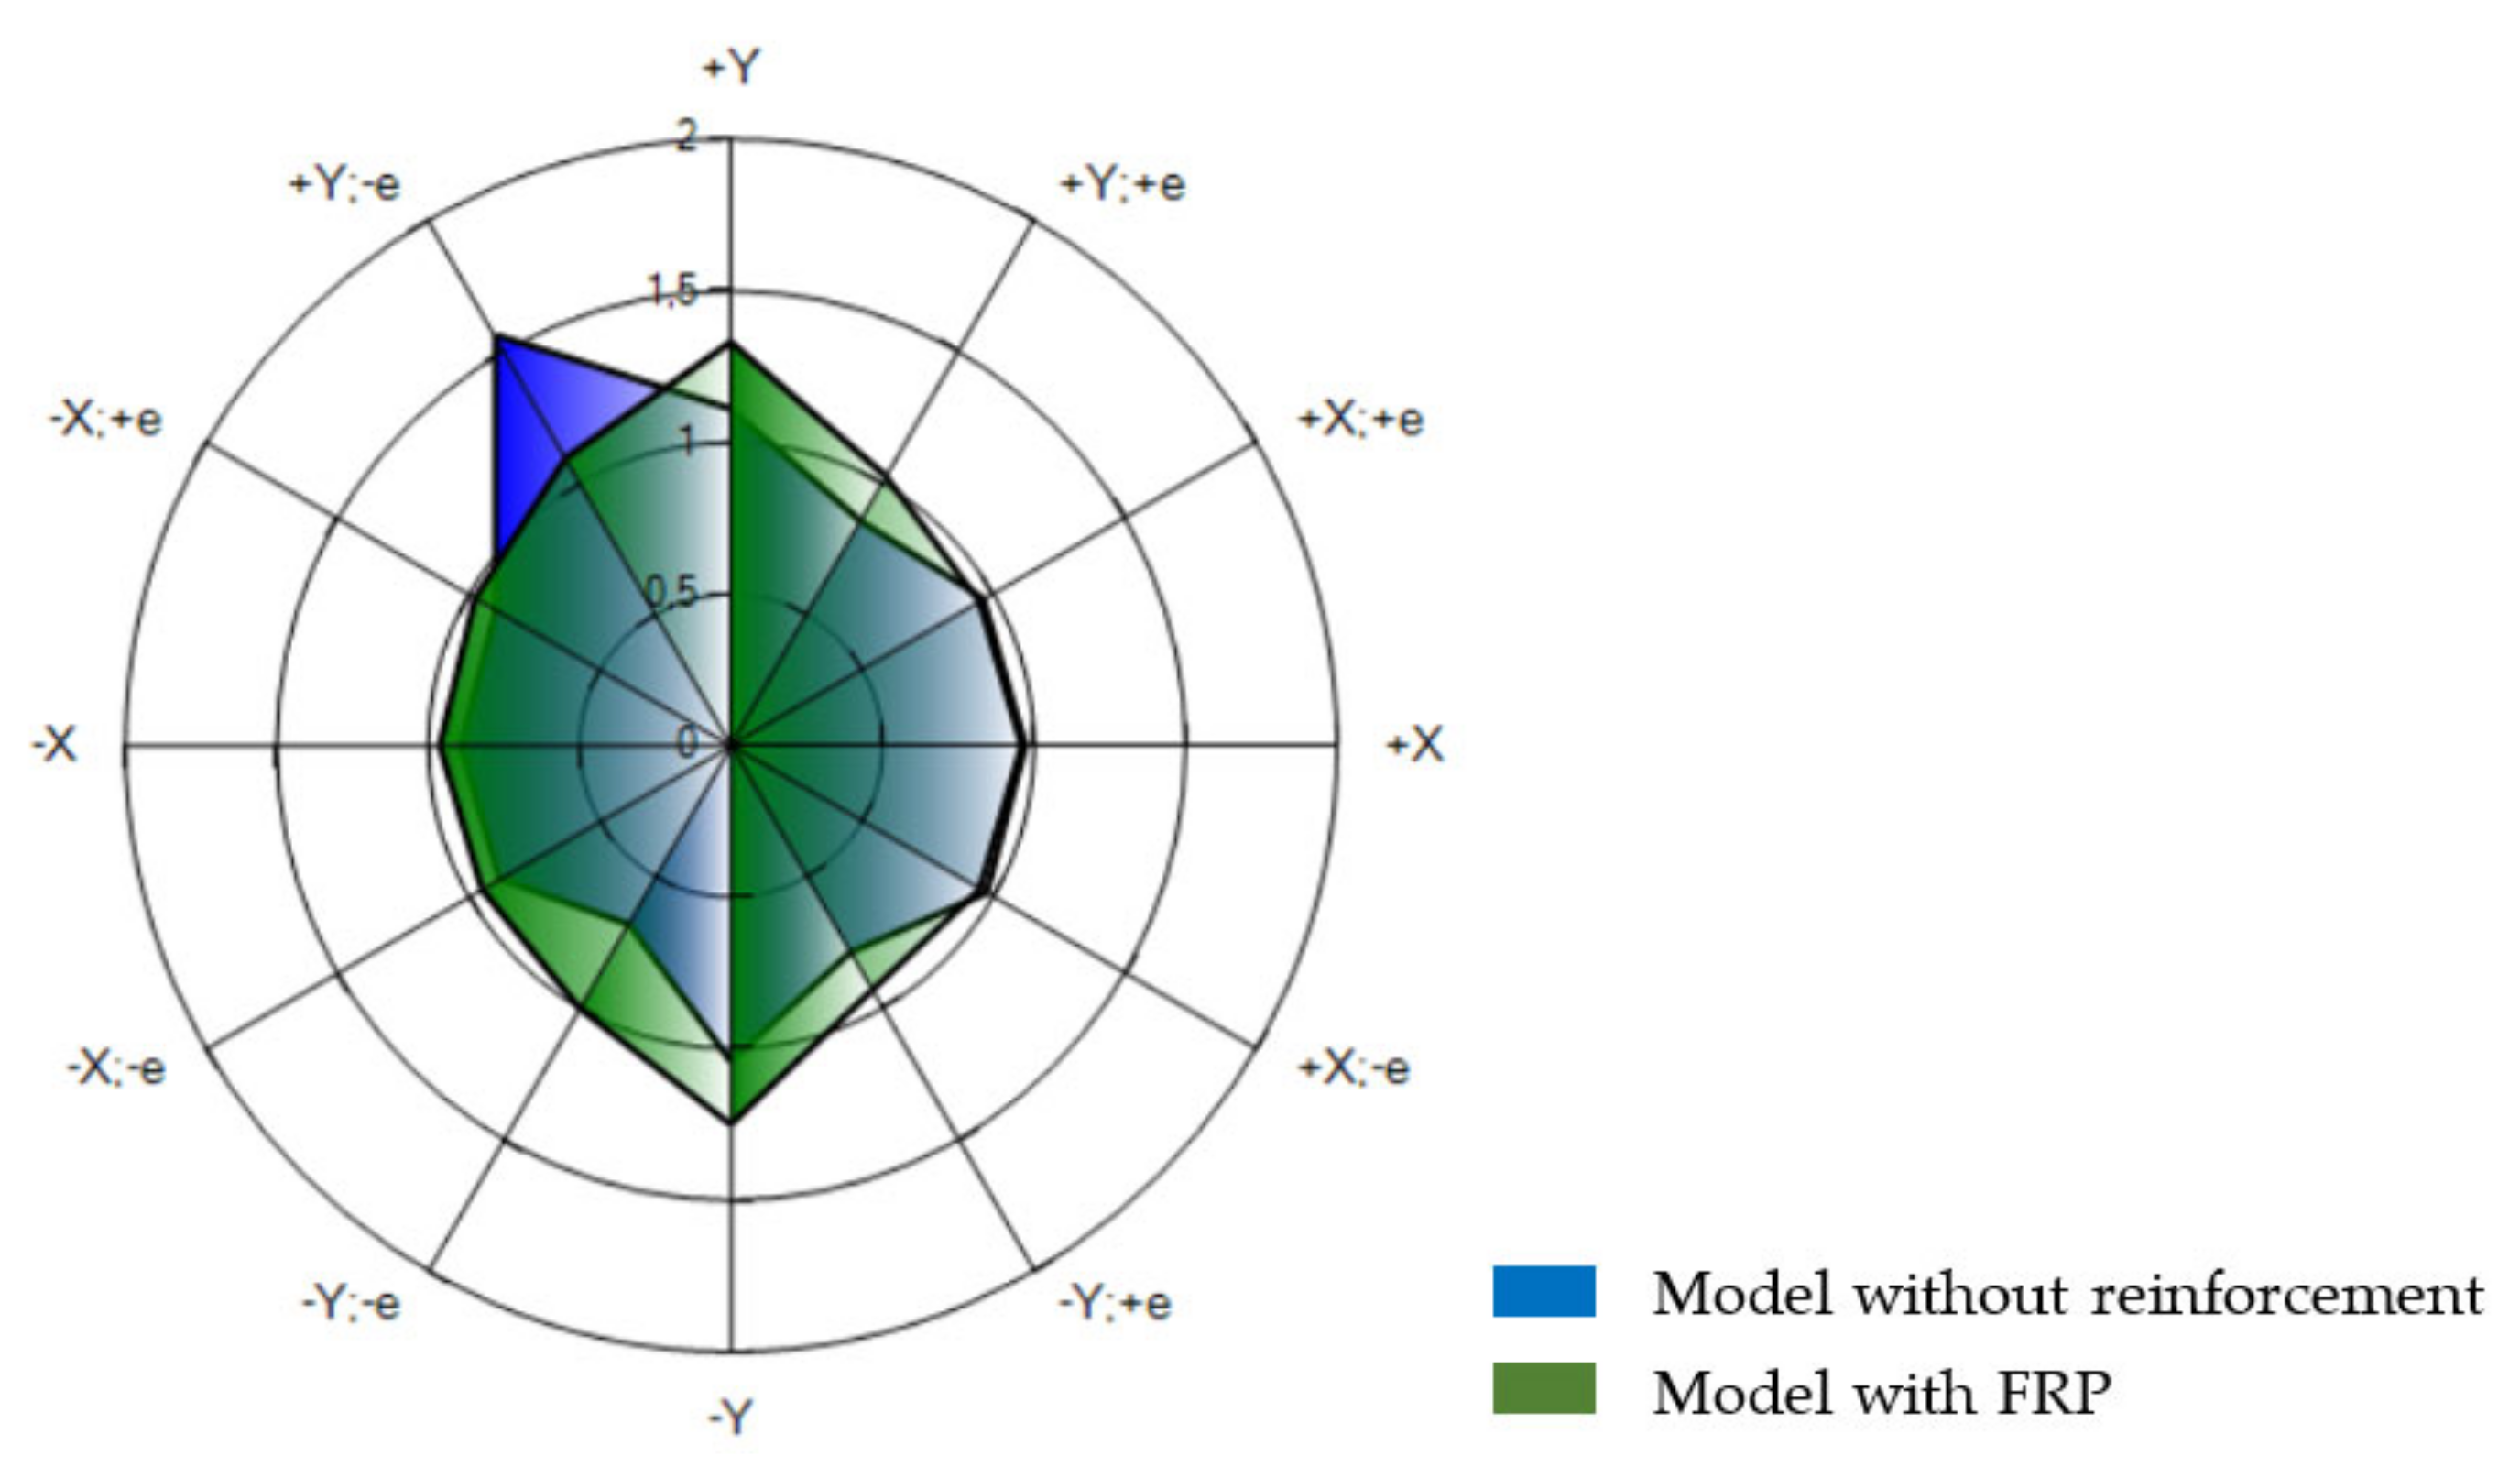
Figure 38.
Graphical comparison between model without or with FRP reinforcement.
Figure 38.
Graphical comparison between model without or with FRP reinforcement.
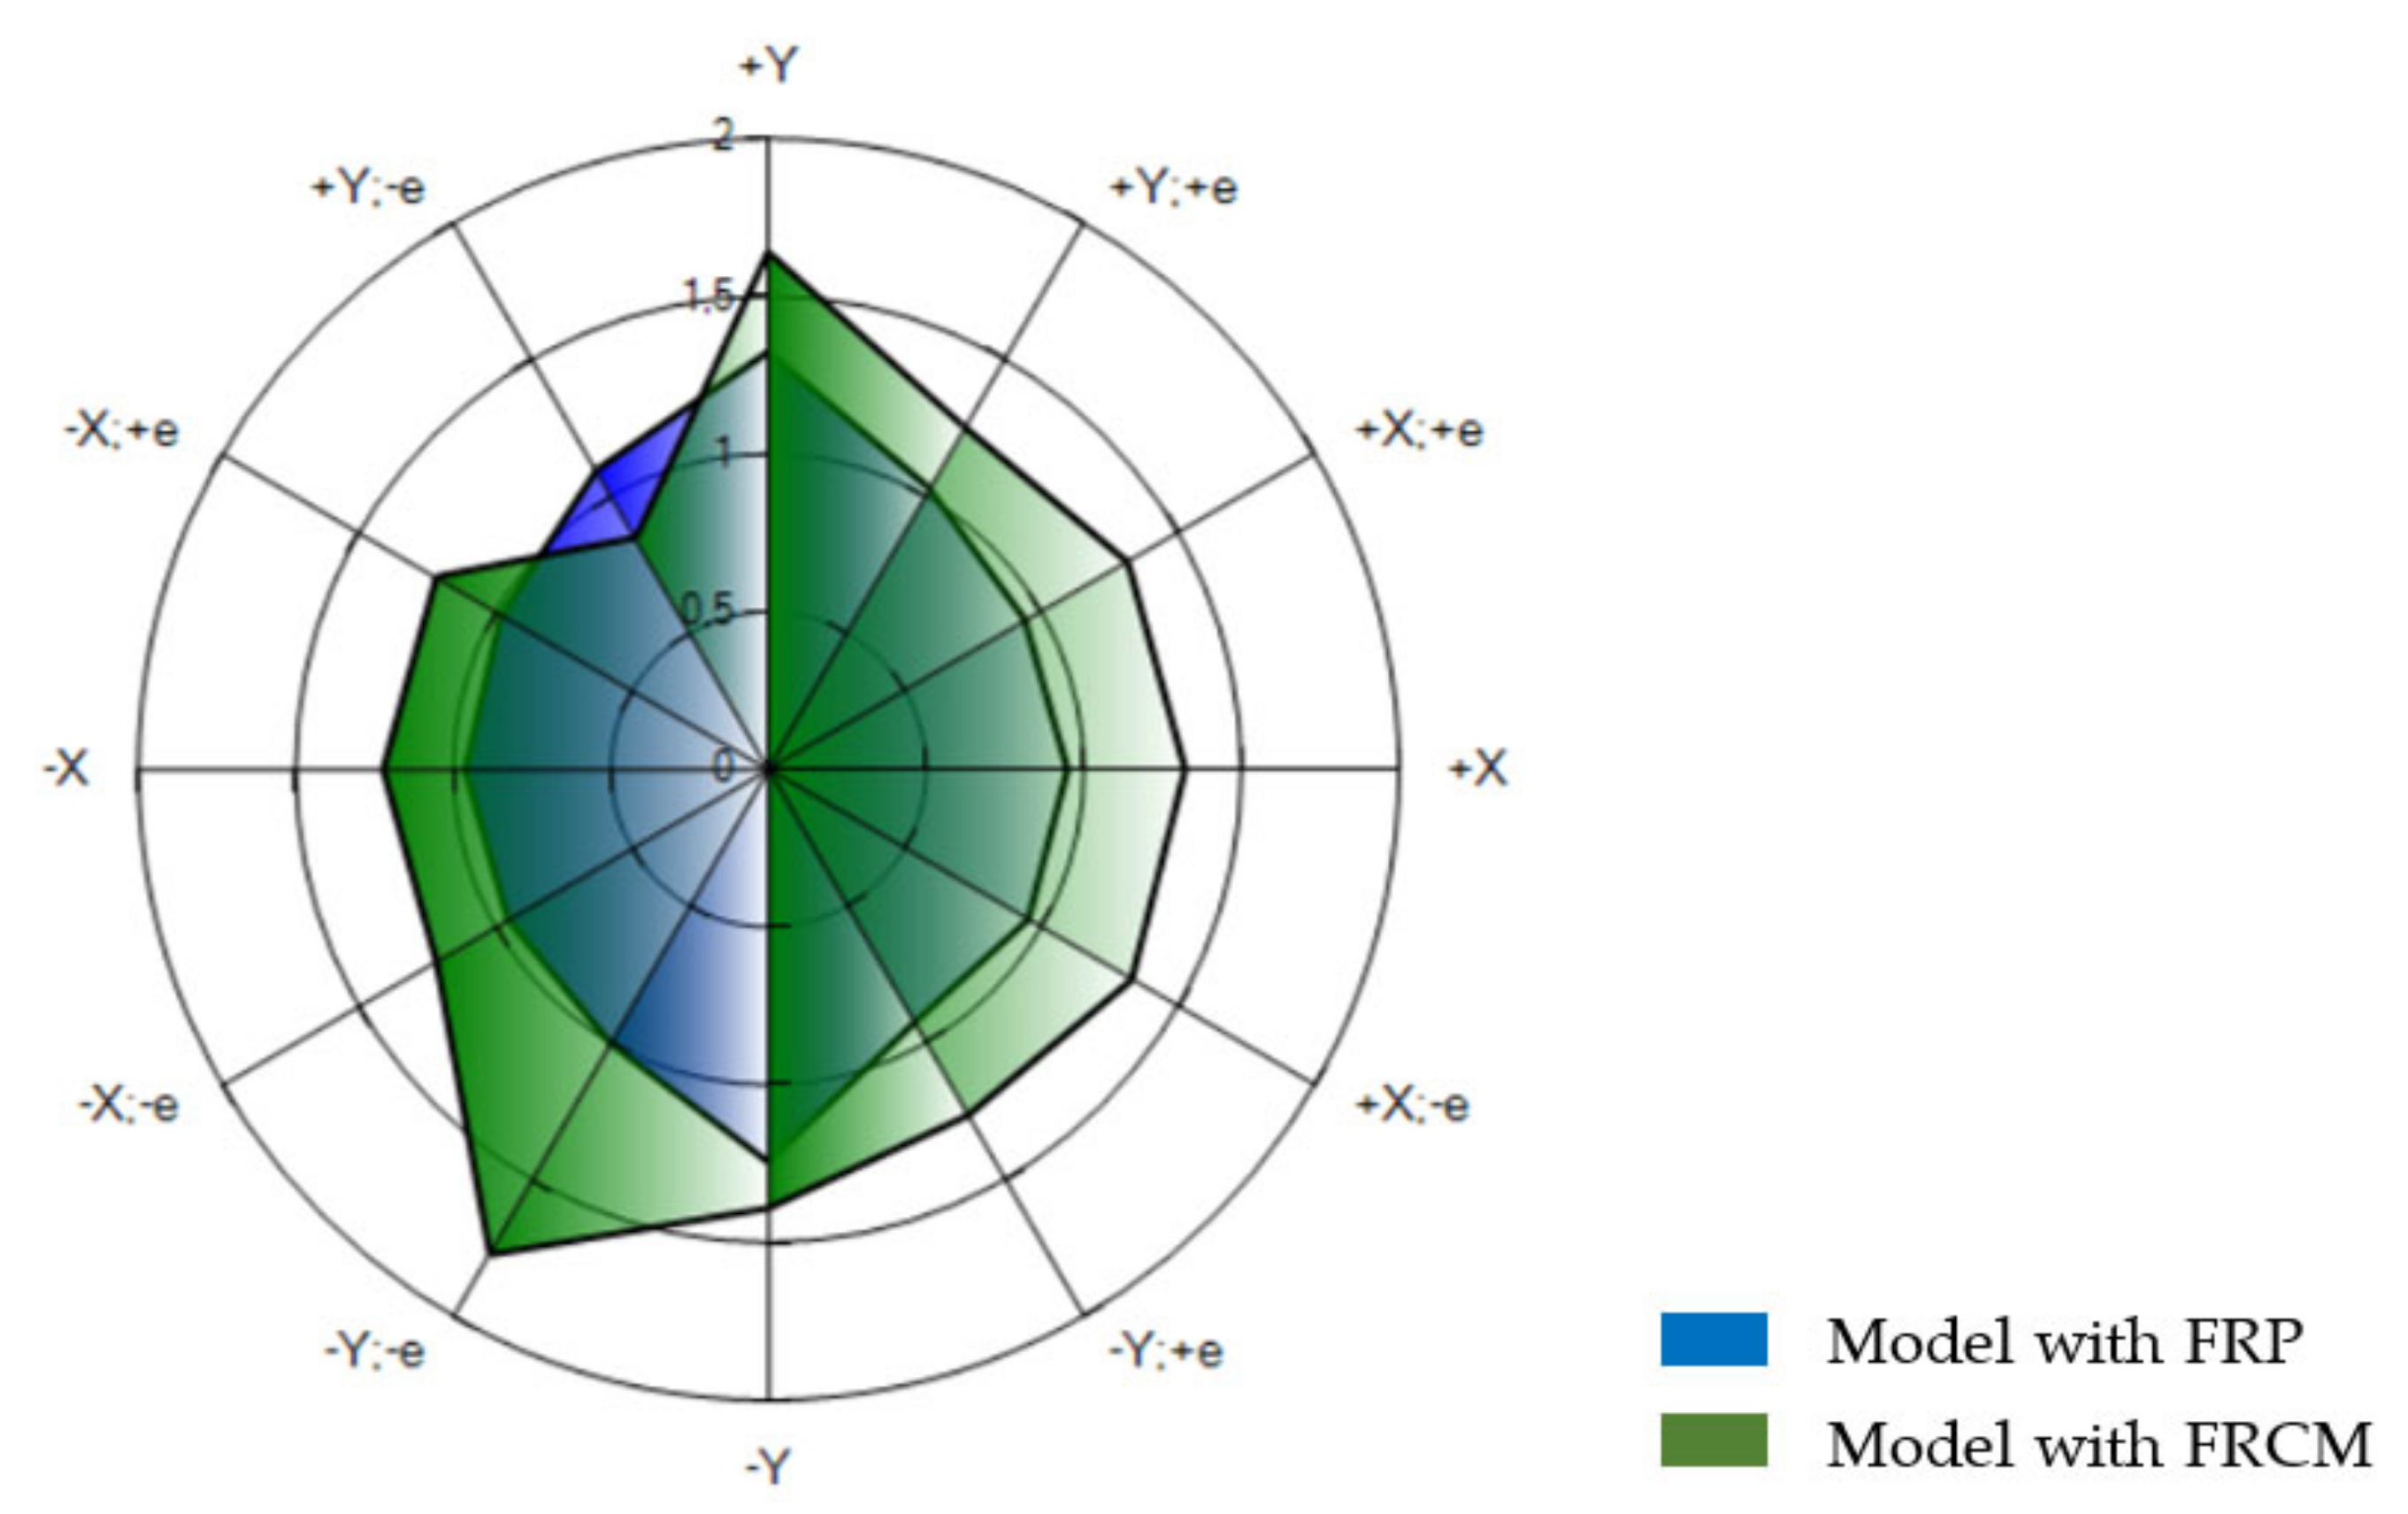
Figure 39.
Graphical comparison between two reinforced models.
Figure 39.
Graphical comparison between two reinforced models.
Table 1.
Results of the flat jack test.
Table 1.
Results of the flat jack test.
| Feature | Value |
|---|
| Compression Strenght–1st Cracking | fm = 1.10 N/mm2 |
| Compression Strenght–Failure | fm = 2.24 N/mm2 |
| Elastic Modulus | E = 20,500 kg/cm2 |
| Average Specific Weight | w = 1750 kg/m3 |
| Poisson Modulus | ν = 0.24 |
Table 2.
Masonry with regular ashlars of soft stone (tuff)-FC = 1.20.
Table 2.
Masonry with regular ashlars of soft stone (tuff)-FC = 1.20.
| Characteristics | Value |
|---|
| Medium compressive strength | fm = 224 N/cm2 |
| Medium shear strength | τ0 = 6.0 N/cm2 |
| Normal modulus of elasticity | E = 2090 MPa |
| Tangential modulus of elasticity | G = 667 MPa |
| Partial safety coefficient for compressive strength of masonry | γM = 3 |
Table 3.
Split stone masonry with good texture-FC = 1.35.
Table 3.
Split stone masonry with good texture-FC = 1.35.
| Characteristics | Value |
|---|
| Medium compressive strength | fm = 260 N/cm2 |
| Medium shear strength | τ0 = 5.6 N/cm2 |
| Normal modulus of elasticity | E = 1740 MPa |
| Tangential modulus of elasticity | G = 580 MPa |
| Partial safety coefficient for compressive strength of masonry | γM = 3 |
Table 4.
PVR and TR parameters for Ultimate and Serviceability limit states.
Table 4.
PVR and TR parameters for Ultimate and Serviceability limit states.
| LS | D | O |
|---|
| PVR | TR | PVR | TR | PVR | TR |
| 10% | 712 years | 63% | 75 years | 81% | 45 years |
Table 5.
Mode shapes and vibration periods of the school building.
Table 5.
Mode shapes and vibration periods of the school building.
| Modo | T [s] | mx [kg] | Mx [%] | my [kg] | My [%] | mz [kg] | Mz [%] |
|---|
| 1 | 0.23777 | 2.583.456 | 86.02 | 35 | 0.00 | 0 | 0.00 |
| 2 | 0.21297 | 11 | 0.00 | 48.636 | 1.62 | 0 | 0.00 |
| 3 | 0.19674 | 13.682 | 0.46 | 10.722 | 0.36 | 1 | 0.00 |
| 4 | 0.18234 | 26 | 0.00 | 2.368.538 | 78.86 | 30 | 0.00 |
| 5 | 0.17285 | 4.341 | 0.14 | 160.090 | 5.33 | 21 | 0.00 |
| 6 | 0.16274 | 3.423 | 0.11 | 54.892 | 1.83 | 65 | 0.00 |
| 7 | 0.11515 | 385.897 | 12.85 | 176 | 0.01 | 20 | 0.00 |
| 8 | 0.09681 | 199 | 0.01 | 3.727 | 0.12 | 1 | 0.00 |
| 9 | 0.08988 | 4.139 | 0.14 | 311 | 0.01 | 7 | 0.00 |
| 10 | 0.08473 | 10 | 0.00 | 341.891 | 11.38 | 199 | 0.01 |
| 11 | 0.08143 | 1.103 | 0.04 | 1.073 | 0.04 | 256 | 0.01 |
| 12 | 0.07834 | 429 | 0.01 | 5.102 | 0.17 | 111 | 0.00 |
| 13 | 0.06650 | 5 | 0.00 | 0 | 0.00 | 19.307 | 0.64 |
| 14 | 0.06645 | 2 | 0.00 | 1 | 0.00 | 441.342 | 14.69 |
| 15 | 0.06633 | 3 | 0.00 | 1 | 0.00 | 143.078 | 4.76 |
| 16 | 0.06617 | 5 | 0.00 | 119 | 0.00 | 259.135 | 8.63 |
| 17 | 0.06485 | 59 | 0.00 | 5 | 0.00 | 43.873 | 1.46 |
| 18 | 0.06412 | 1 | 0.00 | 0 | 0.00 | 20 | 0.00 |
| 19 | 0.06412 | 0 | 0.00 | 0 | 0.00 | 225.470 | 7.51 |
| 20 | 0.06398 | 0 | 0.00 | 1 | 0.00 | 110.970 | 3.69 |
Table 6.
Ranges for each seismic class.
Table 6.
Ranges for each seismic class.
| Safety Index | IS-V Class |
|---|
| 100% < IS-V | AIS-V+ |
| 80% ≤ IS-V < 100% | AIS-V |
| 60% ≤ IS-V < 80% | BIS-V |
| 45% ≤ IS-V < 60% | CIS-V |
| 30% ≤ IS-V < 45% | DIS-V |
| 15% ≤ IS-V < 30% | EIS-V |
| IS-V ≤ 15% | FIS-V |
| Expected Average Annual Loss | PAM Class |
| PAM ≤ 0.50% | APAM+ |
| 0.50% < PAM ≤ 1.0% | APAM |
| 1.0% < PAM ≤ 1.5% | BPAM |
| 1.5% < PAM ≤ 2.5% | CPAM |
| 2.5% < PAM ≤ 3.5% | DPAM |
| 3.5% < PAM ≤ 4.5% | EPAM |
| 4.5% < PAM ≤ 7.5% | FPAM |
| 7.5% ≤ PAM | GPAM |
Table 7.
Results of seismic risk class analysis considering different control nodes.
Table 7.
Results of seismic risk class analysis considering different control nodes.
| Reference Node | αSLV | PAM | IS-V | Class |
|---|
| Node 127 | X: 0.59 Y: 0.62 | 2.39 | 59.04 | C |
| Node 142 | X: 0.56 Y: 0.70 | 2.13 | 56.38 | C |
| Node 130 | X: 0.58 Y: 0.70 | 2.39 | 57.98 | C |
Table 8.
Mode shapes and vibration periods of the school building with the FRP system.
Table 8.
Mode shapes and vibration periods of the school building with the FRP system.
| Modo | T [s] | mx [kg] | Mx [%] | my [kg] | My [%] | mz [kg] | Mz [%] |
|---|
| 1 | 0.23339 | 2.313.009 | 86.02 | 23 | 0.00 | 0 | 0.00 |
| 2 | 0.21123 | 63 | 0.00 | 42.718 | 1.59 | 0 | 0.00 |
| 3 | 0.19776 | 3.904 | 0.15 | 7.884 | 0.29 | 0 | 0.00 |
| 4 | 0.18112 | 18 | 0.00 | 1.948.996 | 72.49 | 33 | 0.00 |
| 5 | 0.17515 | 4.760 | 0.18 | 210.666 | 7.83 | 30 | 0.00 |
| 6 | 0.16552 | 2.679 | 0.10 | 108.928 | 4.05 | 43 | 0.00 |
| 7 | 0.11311 | 346.026 | 12.87 | 148 | 0.01 | 32 | 0.00 |
| 8 | 0.09591 | 380 | 0.01 | 6.998 | 0.26 | 0 | 0.00 |
| 9 | 0.09344 | 114 | 0.00 | 16.351 | 0.61 | 4 | 0.00 |
| 10 | 0.09304 | 14 | 0.00 | 28.048 | 1.04 | 33 | 0.00 |
| 11 | 0.08965 | 649 | 0.02 | 22 | 0.00 | 14 | 0.00 |
| 12 | 0.08814 | 42 | 0.00 | 583 | 0.02 | 3 | 0.00 |
| 13 | 0.08692 | 2.695 | 0.10 | 86 | 0.00 | 30 | 0.00 |
| 14 | 0.08180 | 0 | 0.00 | 288.298 | 10.72 | 268 | 0.01 |
| 15 | 0.07945 | 809 | 0.03 | 2.291 | 0.09 | 112 | 0.00 |
| 16 | 0.07678 | 479 | 0.02 | 11.533 | 0.43 | 207 | 0.01 |
| 17 | 0.07015 | 3.472 | 0.13 | 64 | 0.00 | 27 | 0.00 |
| 18 | 0.06659 | 253 | 0.01 | 0 | 0.00 | 264 | 0.01 |
| 19 | 0.06638 | 4 | 0.00 | 3.525 | 0.13 | 46.180 | 1.72 |
| 20 | 0.06609 | 154 | 0.01 | 13 | 0.00 | 269 | 0.01 |
Table 9.
Mode shapes and vibration periods of the school building with an FRCM system.
Table 9.
Mode shapes and vibration periods of the school building with an FRCM system.
| Modo | T [s] | mx [kg] | Mx [%] | my [kg] | My [%] | mz [kg] | Mz [%] |
|---|
| 1 | 0.23392 | 2.336.254 | 86.10 | 50 | 0.00 | 0 | 0.00 |
| 2 | 0.21139 | 450 | 0.02 | 40.820 | 1.50 | 1 | 0.00 |
| 3 | 0.19769 | 3.639 | 0.13 | 7.468 | 0.28 | 0 | 0.00 |
| 4 | 0.18131 | 3 | 0.00 | 2.009.003 | 74.04 | 47 | 0.00 |
| 5 | 0.17545 | 5.007 | 0.18 | 173.836 | 6.41 | 30 | 0.00 |
| 6 | 0.16564 | 2.619 | 0.10 | 112.021 | 4.13 | 45 | 0.00 |
| 7 | 0.11356 | 346.688 | 12.78 | 128 | 0.00 | 24 | 0.00 |
| 8 | 0.09621 | 765 | 0.03 | 6.225 | 0.23 | 0 | 0.00 |
| 9 | 0.09348 | 71 | 0.00 | 19.596 | 0.72 | 8 | 0.00 |
| 10 | 0.09307 | 7 | 0.00 | 28.558 | 1.05 | 30 | 0.00 |
| 11 | 0.08980 | 840 | 0.03 | 151 | 0.01 | 16 | 0.00 |
| 12 | 0.08813 | 7 | 0.00 | 186 | 0.01 | 7 | 0.00 |
| 13 | 0.08701 | 2.612 | 0.10 | 208 | 0.01 | 11 | 0.00 |
| 14 | 0.08192 | 3 | 0.00 | 285.154 | 10.51 | 477 | 0.02 |
| 15 | 0.07961 | 952 | 0.04 | 3.694 | 0.14 | 49 | 0.00 |
| 16 | 0.07686 | 365 | 0.01 | 12.419 | 0.46 | 157 | 0.01 |
| 17 | 0.07012 | 3.488 | 0.13 | 57 | 0.00 | 25 | 0.00 |
| 18 | 0.06667 | 249 | 0.01 | 0 | 0.00 | 12.010 | 0.44 |
| 19 | 0.06642 | 0 | 0.00 | 3.003 | 0.11 | 60.932 | 2.25 |
| 20 | 0.06616 | 117 | 0.00 | 61 | 0.00 | 3.808 | 0.14 |
Table 10.
Analysis results between retrofit systems: FRP vs. FRCM.
Table 10.
Analysis results between retrofit systems: FRP vs. FRCM.
| Type of Reinforcement | αSLV | PAM | IS-V | Class |
|---|
| FRP | X: 0.94 Y: 0.92 | 0.96 | 93.8 | A |
| FRCM | X: 0.97 Y: 0.84 | 1.38 | 84.04 | B |
Table 11.
Comparison in terms of α between model without or with FRCM reinforcement.
Table 11.
Comparison in terms of α between model without or with FRCM reinforcement.
| Model without Reinforcement | Model with FRCM |
|---|
| αSLV,min = 0.68 | αSLV,min = 0.843 |
|---|
| Nr | Direction | αSLV | Nr | Direction | αSLV |
|---|
| 1 | +X | 0.967 | 1 | +X | 1.324 |
| 9 | +X; +e | 0.967 | 9 | +X; +e | 1.316 |
| 17 | +Y; +e | 0.86 | 17 | +Y; +e | 1.249 |
| 5 | +Y | 1.108 | 5 | +Y | 1.637 |
| 18 | +Y, +e | 1.564 | 18 | +Y, +e | 0.843 |
| 13 | −X; +e | 0.893 | 13 | −X; +e | 1.215 |
| 3 | −X | 0.888 | 3 | −X | 1.226 |
| 14 | −X; −e | 0.878 | 14 | −X; −e | 1.217 |
| 22 | −Y; −e | 0.68 | 22 | −Y; −e | 1.772 |
| 7 | −Y | 1.038 | 7 | −Y | 1.387 |
| 21 | −Y; +e | 0.787 | 21 | −Y; +e | 1.264 |
| 10 | +X; −e | 0.969 | 10 | +X; −e | 1.325 |
Table 12.
Comparison in terms of α between model without/with FRP reinforcement.
Table 12.
Comparison in terms of α between model without/with FRP reinforcement.
| Model without Reinforcement | Model with FRP |
|---|
| αSLV,min = 0.68 | αSLV,min = 0.843 |
|---|
| Nr | Direction | αSLV | Nr | Direction | αSLV |
|---|
| 1 | +X | 0.967 | 1 | +X | 0.954 |
| 9 | +X; +e | 0.967 | 9 | +X; +e | 0.941 |
| 17 | +Y; +e | 0.86 | 17 | +Y; +e | 1.026 |
| 5 | +Y | 1.108 | 5 | +Y | 1.328 |
| 18 | +Y, +e | 1.564 | 18 | +Y, +e | 1.095 |
| 13 | −X; +e | 0.893 | 13 | −X; +e | 0.976 |
| 3 | −X | 0.888 | 3 | −X | 0.965 |
| 14 | −X; −e | 0.878 | 14 | −X; −e | 0.953 |
| 22 | −Y; −e | 0.68 | 22 | −Y; −e | 1.004 |
| 7 | −Y | 1.038 | 7 | −Y | 1.245 |
| 21 | −Y; +e | 0.787 | 21 | −Y; +e | 0.932 |
| 10 | +X; −e | 0.969 | 10 | +X; −e | 0.949 |
Table 13.
Comparison in terms of α between two reinforced models.
Table 13.
Comparison in terms of α between two reinforced models.
| Model with FRCM | Model with FRP |
|---|
| αSLV,min = 0.843 | αSLV,min = 0.932 |
|---|
| Nr | Direction | αSLV | Nr | Direction | αSLV |
|---|
| 1 | +X | 1.324 | 1 | +X | 0.954 |
| 9 | +X; +e | 1.316 | 9 | +X; +e | 0.941 |
| 17 | +Y; +e | 1.249 | 17 | +Y; +e | 1.026 |
| 5 | +Y | 1.637 | 5 | +Y | 1.328 |
| 18 | +Y, +e | 0.843 | 18 | +Y, +e | 1.095 |
| 13 | −X; +e | 1.215 | 13 | −X; +e | 0.976 |
| 3 | −X | 1.226 | 3 | −X | 0.965 |
| 14 | −X; −e | 1.217 | 14 | −X; −e | 0.953 |
| 22 | −Y; −e | 1.772 | 22 | −Y; −e | 1.004 |
| 7 | −Y | 1.387 | 7 | −Y | 1.245 |
| 21 | −Y; +e | 1.264 | 21 | −Y; +e | 0.932 |
| 10 | +X; −e | 1.324 | 10 | +X; −e | 0.949 |


