Article

Experimental Study on Seismic Behavior of Coupled Steel Plate and Reinforced Concrete Composite Wall

1
School of Civil Engineering, Chongqing University, Chongqing 400045, China
2
Key Laboratory of New Technology for Construction of Cities in Mountain Area and School of Civil Engineering, Chongqing University, Chongqing 400045, China
3
China Construction Second Engineering Bureau Ltd., Beijing 100160, China
*
Author to whom correspondence should be addressed.
Buildings 2022, 12(11), 2036; https://doi.org/10.3390/buildings12112036
Submission received: 30 October 2022 / Revised: 15 November 2022 / Accepted: 18 November 2022 / Published: 21 November 2022
(This article belongs to the Topic Advances on Structural Engineering, 2nd Volume)

Abstract

:
The coupled steel plate and reinforced concrete (C-SPRC) composite wall is a new type of coupled-wall system consisting of steel coupling beams (SCBs) that join two SPRC walls where the steel plate shear wall (SPSW) is embedded in the RC wall. Although the C-SPRC wall has been extensively constructed in high-rise buildings in seismic regions, research on its behavior has rarely been reported. No code provisions are available for directly guiding the preliminary design of such coupled-wall systems. In the research, three 1/3-scaled C-SPRC wall subassemblies including one-and-a-half stories of SPRC walls and a half-span of SCB were tested under simulated earthquake action, considering the fabrication method of the embedded SPSW and the shear-span ratio of the SPRC walls as two test variables. The prime concern of the research was to evaluate the influences of those popular design and construction parameters on the seismic behavior of the C-SPRC wall. Deviating from the beam tip loading method used in conventional subassembly tests, the lateral cyclic load in this research was applied at the top of the wall pier so that the behaviors of both walls and SCBs could be examined. The test results exhibited the great seismic performance of the subassemblies with the coupling mechanism fully developed. The energy dissipation capacity and inter-story deformation capacity of the subassembly with the assembled SPSW were roughly 9.4% and 13.2% greater than those with the conventional welded SPSW. Compared with the subassembly with the shear-span ratio of 2.2, the interstory-deformation capacity of the one with the shear-span ratio of 2.0 was increased by approximately 13.4%, while the energy dissipation capacity was decreased by 10.9%. The test results were further compared with the simulation results using the proven-reliable finite element analysis with respect to the hysteretic curves, skeleton curves, energy dissipation capacities and failure patterns.

1. Introduction

The steel plate and reinforced concrete (SPRC) composite wall has been widely adopted in super-high-rise buildings subjected to moderate-to-high seismic risks. A typical SPRC wall is constructed by embedding a steel plate shear wall (SPSW) into a cast-in-place reinforced concrete (RC) wall section, where the SPSW [1] is comprised of slender web plates welded to horizontal boundary elements (HBEs), interior vertical boundary elements (IVBEs) and exterior vertical boundary elements (EVBEs), respectively. Previous research has demonstrated that the SPRC wall can be designed to obtain great load-carrying capacity, ductility and energy-dissipation capacity [2,3,4,5,6]. For bottom stories and basements of super-tall buildings, the use of SPRC walls instead of conventional RC walls can achieve material efficient seismic design, maximum usable floor space and overall cost-effectiveness. The code-specified fire resistance and durability requirements of the SPSW can be inherently satisfied thanks to the protection provided by concrete [7]. However, SPRC walls in super-tall buildings rarely exist as single-wall piers. As part of the core tube, adjacent SPRC walls are joined by steel coupling beams (SCBs) at floor levels, resulting in the coupled SPRC (C-SPRC) wall system, as shown in Figure 1. The behavior of a C-SPRC wall is significantly different from the sum of its component wall piers and dominated by the so-called coupling mechanism.
Recent research on coupled-wall systems has mainly focused on the hybrid coupled wall (HCW) and coupled SPSW (C-SPSW). An HCW system consists of two or more RC walls joined by SCBs. El-Tawil et al. [8] systematically summarized previous research on the design, analysis and behavior of HCW systems. Recent research on HCW systems has focused on the development of the innovative coupling beam and its connection to RC or steel-reinforced concrete (SRC) composite wall piers. Das et al. [9] focused on the two different SCB-to-RC wall joint configurations in an innovative hybrid coupled-wall system. Either the “partly embedded” or “passing through” SCB can satisfy the target design objective. Li et al. [10] reported tests on the hybrid connection between the SCB and concrete wall pier with embedded steel shapes, which failed due to joint panel shear. Ji et al. [11] conducted experimental studies on three SCB-to-SRC wall subassemblies, where the SCB was fully welded to an embedded steel column at the wall boundary region. All three subassemblies failed at the joint panel shear. Wu et al. [12] conducted tests on the endplate connection between the SRC wall pier and SCB. All joints failed due to the failure of the endplate. It is worth mentioning that the subassemblies in the above-mentioned studies consisted of a half-span-length cantilever coupling beam connected to a wall pier and were tested by applying a reversed, cyclic load at the beam tip representing the midspan of the coupling beam. During the loading process, the wall pier was mainly subjected to constant axial load. This test setup has been recognized effective in investigating the behavior of the SCB and its connection to the wall pier. Motter [13] presented two subassembly tests on SRC coupling beams connected to RC walls with cyclic load applied at the top of the wall instead of the cantilever beam tip. With this loading method, more responses of wall piers can be mobilized and revealed in addition to the coupling beams and beam-to-wall connections. In C-SPSW systems, SCBs are used to connect two or more SPSW piers. Pavir et al. [14] studied four-story C-SPSWs with different details of SCBs. The shear resistance and energy dissipation of the C-SPSWs increase with the capacity and length of the SCBs. Oh et al. [15] and Usefvand et al. [16] reported that the C-SPSW can maintain the benefits of SPSWs while improving the efficiency of steel. Yu et al. [17] proposed a new type of coupled buckling-restrained SPSW, which showed great load-carrying capacity and bending performance with high material utilization. The degree of coupling action is suggested within 0.35–0.45. With the aim of further optimizing the coupling beams of the C-SPSW, a series of investigations have been conducted [18,19,20,21,22]. The C-SPRC wall system can be seen as a combination of HCW and SPSW, with the original design objective of enhancing the axial load capacity of walls at bottom stories of super-tall buildings. However, the impact of adding the SPSW to the HCW system in terms of the coupling mechanism and other seismic responses remained unclear with very limited study, largely due to the difficulty and cost of experimental studies. Studies are needed to reveal the coupling mechanism and influences of important design parameters on the seismic behavior of C-SPRC walls.
In this research program, three 1/3-scaled C-SPRC wall subassemblies with different SPSW details and wall shear-span ratios were tested to failure with lateral cyclic loading applied at the top of the wall pier. Two types of SPSWs were considered to reflect the current construction practice. The first type of SPSW is shop-welded as a whole and then shipped to the job site for direct erection. The second type consists of multiple SPSW segments that are shop-welded and shipped to the construction site to assemble story-by-story using a bolted faceplate joint at the web plate and a welded joint at the VBE. The shear-span ratios used for the test subassemblies also reflect the current design practice. The seismic performances of the test subassemblies were discussed in terms of the coupling mechanism, lateral force–drift relationships, interstory drift ratio, stiffness degradation, deformation capacity, shear rotation of the SCBs and the energy dissipation capacity. Finite element (FE) models were established using ABAQUS to simulate the subassemblies and provide a sound foundation for further investigations.

2. Experimental Program

The subassembly test was performed at Chongqing University structural laboratory. The emphasis of the test was placed on the examination of the overall performance of the test subassemblies and revealing the extent of influences the test variables had on the behavior of the test subassemblies.

2.1. Description of Test Subassemblies

The test subassemblies were designed to possess two seismic fortification lines. The SCBs will first significantly yield and consume a great deal of inelastic energy. Then, the composite wall piers provide the further deformation and energy dissipation capacities. Three 1/3-scaled subassemblies, identified by CS-1 to CS-3, were designed and constructed according to the Chinese Code for Design of Composite Structures (JGJ 138-2016) [23], Code for Seismic Design of Buildings (GB50011-2010) [24] and AISC 341-2016 [1]. As shown in Figure 2a, the test subassembly consisted of a wall pier of one-and-a-half story and an SCB of a half-span length. Figure 2b illustrates the boundary conditions of the actual subassembly corresponding to loading conditions depicted in Figure 2a.
The overall dimensions are provided in Figure 3. The clear length of the SCB was 400 mm, measured from the wall surface to beam end. Wall piers of all three subassemblies had identical overall dimensions, consisting of a 900 × 300 × 300 mm loading beam on top, a 2200 × 500 × 400 mm foundation at the bottom and a 1500 × 800 × 160 mm wall portion in-between.
In these three subassemblies, the SCB was welded to the VBE of the embedded SPSW. As shown in Figure 4a, the SCB of CS-1 and CS-2 had a section of 200 × 80 × 6 × 10 mm, while that of CS-3 had a section of 200 × 80 × 6 × 8 mm. As shown in Figure 4b, the VBE of the embedded SPSW of all subassemblies had the same total depth of 120mm. The flange thickness was 10mm for CS-1, CS-2 and 6mm for CS-3, respectively. The web thickness was 6mm for CS-1, CS-2 and 8mm for CS-3, respectively. The thickness of the steel plate of SPSW was 6mm for CS-1 and CS-2, while 8mm for CS-3. The overall dimensions and details of the embedded SPSW are shown in Figure 5. The SPSW of CS-1 and CS-3 was fabricated and erected as whole with continuous steel plate and VBE, as depicted in Figure 5a. The SPSW of CS-2, on the other hand, was fabricated by joining the upper and lower segments through a bolted faceplate joint at the web plate and a welded joint at the VBEs, as shown in Figure 5b. In the lower SPSW segment, the top edge of steel plate was 165 mm beyond the edge of the VBEs; in the upper SPSW segment, the bottom edge of the VBE was 165 mm beyond that of the steel plate. Two faceplates with 5 mm thickness were placed on both sides of the steel plate at the joint and two rows of bolts were used to fasten the joints. The upper and lower VBEs were welded together. As shown in Figure 6, six No.10 hot-rolled rebars were used as the longitudinal reinforcement at wall boundaries. No.8 hoops with a spacing of 100 mm were used as the transverse reinforcement, and No.6 rebars spaced by 100 mm were used as the horizontal and vertical distributed wall reinforcement. Shear studs with a diameter of 10 mm were welded to the steel plates with 100/120 mm spacing to strengthen bonding between steel and concrete.
In this experimental study, the shear-span ratio of the SPRC wall section, Mw/h0Vw, was chosen as a test variable, where Mw is the most probable flexural capacity of the wall cross-section; Vw is the shear force demand; h0 is the effective depth, measured from the edge of the compressive zone to the center of the elements in tension of the wall cross-section. According to section 10.1.4 of JGJ 138-2016 [23], the shear-span ratio should be between 1.5 and 2.2. Thus, 2.2 is selected for CS-1 and CS-2. Previous research also suggested that it should be greater than 2.0 to ensure ductile behavior and avoid brittle failure in shear [25,26]. Thus, 2.0 was chosen for CS-3.
The computation of the flexural and shear capacities of SPRC wall was based on JGJ 138-2016 [23]. 
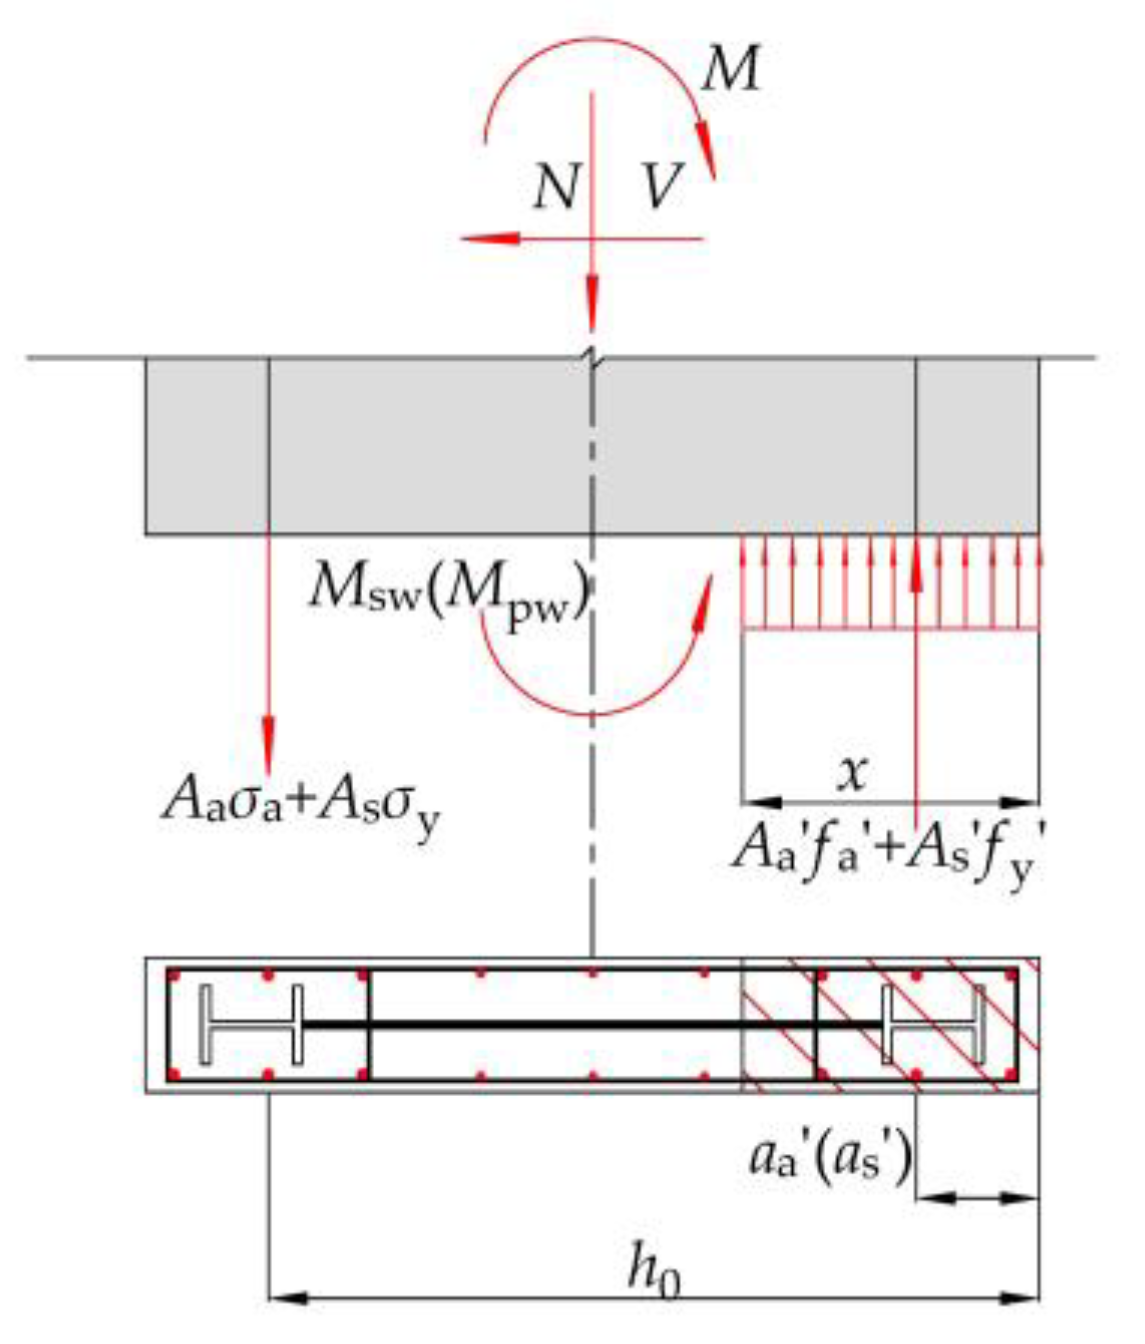
Figure 7 shows the calculating diagram for the flexural capacity of the SPRC wall section, which can be obtained by Equation (1):
M α 1 f c b w x ( h 0 0.5 x ) + f y A s ( h 0 a s ) + f a A a ( h 0 a a ) + M sw + M pw
where α1 is the influence coefficient of the concrete compressive zone; fc is the compressive strength of the concrete; bw is the wall thickness; x is the depth of the concrete compressive zone; f y is the compressive strength of the longitudinal reinforcement; A s is the section area of the reinforcement in the compressive zone; a s is the distance from the center of the compressed reinforcement to the edge of the element in tension; f a is the compressive strength of the steel used in the VBE; A a is the section area of the VBE in the compressive zone; a a is the distance from the center of the compressed VBE to the edge of the element in tension; Msw, Mpw are the moments applied on the vertical distributed bars and the steel plate. The shear capacity of the SPRC composite wall can be estimated by Equation (2):
V ( 0.4 f ct b w h 0 + 0.1 N A w / A ) / ( l 0.5 ) + 0.8 f yh A sh h 0 / s + 0.25 f a A a / l + 0.5 f p A p / ( l 0.5 )
where λ is the shear-span ratio; fct is the tensile strength of the concrete; N is the axial load applied on the wall pier; A is the shear wall section area, taking Aw to equal to A; fyh is the tensile strength of the horizontal distributed bars; Ash is the section area of the horizontal distributed bars; s is the spacing of the horizontal distributed bars; fa is the tensile strength of the steel used in the VBE; Aa is the section area of the VBE in the element in tension; fp is the tensile strength of the steel used in the steel plate; Ap is the section area of the steel plate. The shear capacity of SCB, Vp, was calculated as per AISC 341-2016 [1]. Using the global limit state analyses on each test subassembly, the calculated lateral load capacities of the test subassemblies, Vn, are obtained and listed in Table 1.
To summarize, the three test subassemblies were designed to form two groups for comparison. The first group included test subassemblies CS-1 and CS-3, where the embedded SPSW was welded as a whole for erection while their shear-span ratios were 2.2 and 2.0, respectively. The second group consisted of CS-1 and CS-2, with the same shear-span ratios of 2.2, with different SPSW details. In CS-2, the SPSW was assembled using bolted faceplates to join the web plates of the upper and lower segments of the SPSW. The CS-1 versus CS-3 and CS-1 versus CS-2 comparison aimed to reveal the influences of the wall shear-span ratio and SPSW details on the behaviors of the test subassemblies, respectively. Whether the coupled mechanism can be realized was also an emphasis to examine out of the test results.

2.2. Loading Regime and Test Setup

Test subassemblies were subjected to constant axial load and lateral cyclic load at the top of the wall pier. A hydraulic jack with 1500 kN loading capacity was used to apply the constant axial load, representing an axial load ratio of 0.15 [27]. To distribute the vertical load, a spreader beam was mounted between the vertical hydraulic jack and loading beam. A roller was placed between the reaction girder and jack so that the vertical jack could slide horizontally and remain vertical. The lateral cyclic load was applied at the top of the wall pier via a horizontal actuator of 2000 kN loading capacity with one end fixed on the reaction wall and the other on the loading beam, and the pushing of the actuator was designated as the positive direction and pulling the negative direction. The cantilevered SCB end was supported through a vertical hydraulic jack with a loading capacity of 500kN, which was connected using the hinge connection to allow the rotation of the joint. Rigid beams were used to compress the foundation to prevent overturning through post-tensioning to the strong floor. To prevent horizontal sliding, two jacks were placed against the front and rear surfaces of the foundation. Lateral supports were also provided at two-thirds of the subassembly height to prevent out-of-plane deformation. The depiction of the test setup is shown in Figure 8. Figure 9 depicts the boundary conditions corresponding to the test setup. It is noted that no bending moment is applied to the top of the wall pier, which is largely due to the difficulty in providing such external moment in the laboratory. However, according to the structural analysis on the coupled-wall system, it is reasonable to assume a very small bending moment at the midheight cross-section of the wall piers, which will not have noticeable influence on the structural responses of the test subassemblies.
After applying axial load, the lateral cyclic load was applied in two stages. The first stage was a preloading process, when two cycles of 50 kN load level were carried out to ensure the loading system was fully engaged with the test subassembly. The subsequent loading stage was displacement-controlled [28]. The top lateral drift ratio θ was chosen as the deformation index, defined as the ratio of the top lateral drift, Δ, to the total structural height measured from the centerline of the horizontal actuator to the top surface of the foundation. The wall pier was displaced two cycles to θ equal to 0.25%, 0.5%, 0.75%, 1.0%, 1.5%, 2.0%, 3.0% and 4.0%. When the measured lateral capacity decreased to less than 85% of the peak lateral load, the test was terminated.

2.3. Instrumentations

Figure 10 and Figure 11 indicate the distribution of measuring instruments, where two linear variable differential transducers (LVDTs) were horizontally placed at all floor levels to measure the lateral drift and the shear rotation of the SCBs was measured with the linear potentiometers (LPs) mounted on the web of the SCBs. Strain gauges were attached to critical locations on the SCBs, longitudinal rebars and SPSW.

2.4. Material Properties

Table 2 and Table 3 show the mechanical properties of 150 mm concrete cubic samples and steel shapes, respectively. The bolts used in CS-2 were grade M10.9 high-strength friction bolts. In Table 2 and Table 3, fcu,m is the average compressive strength of the concrete cubic samples; Ec and Es are the Young’s modulus of the concrete and steel, respectively; ft, fy, εy and εu are the tensile strength, yield strength, yield strain and ultimate strain of the steel, respectively. The material tests provided the relevant parameter values for the FE analysis.

3. Experimental Results and Discussion

3.1. Failure Process and Modes

The general failure process of the three test subassemblies followed a similar pattern (Figure 12). When θ was 0.25%, horizontal cracks occurred at the bottom of the wall boundaries. Along with the increase of θ up to 1.5%, these early cracks gradually extended toward the web regions. New cracks also developed at upper portion of the wall boundaries. Then, the cracks uniformly distributed along the wall height and almost remained unchanged without noticeable further development until the failure of the subassemblies, indicating that the damage development had shifted from the wall piers to the other components of the subassemblies. It was also noticed that cracks due to shear were much less than those due to flexure.
The initiation of concrete crushing was observed at the bottom of the wall boundaries, corresponding to θ of 2.0%. Along with the further increase of θ, the concrete crushing became more severe and started to spall off. When θ arrived at 4.0%, the ultimate conditions were reached (Figure 13 and Figure 14). The longitudinal rebars at the bottom of the wall boundaries yielded in all three subassemblies. Considerable shear rotation of the SCB was fully developed with no fracture in CS-2, while the web and flange of the SCBs was fractured in the CS-1 and CS-3 subassemblies.

3.2. Lateral Force–Drift Relationships

Figure 15 shows the measured hysteretic loops of all three test subassemblies, indicating the great energy dissipation characteristic without a significant pinching effect. The similarity in the hysteretic loops of the three subassemblies indicated that these two test variables have indistinctive influence on the overall seismic behavior. The assembled SPSW in CS-2 can be an effective alternative to the conventional SPSW. After the peak lateral load, the postyield strength of CS-2 and CS-3 did not decrease significantly, implying the great strength retention capacity of the subassemblies.

3.3. Interstory Drift Ratio

Figure 16 and Table 4 summarize the values of the interstory drifts (δ0, δy, δm, δu) and interstory drift ratios (θ0, θy, θm, θu) at all floor levels corresponding to the initial concrete cracking (F0), yield (Fy), peak load (Fm) and ultimate load conditions (Fu), respectively. The average interstory drift ratios of three subassemblies were 3.34%, 3.76% and 3.78%, respectively. Compared with CS-1, the drift ratios of CS-2 and CS-3 increased by 13.2% and 13.4%, respectively. It is indicated that adopting the assembled SPSW or shear-span ratio of 2.0 can effectively enhance the interstory-deformation capacity of the subassemblies.

3.4. Stiffness Degradation

To assess the stiffness degradation, the secant stiffness of the subassemblies corresponding to the peak lateral load of the first load cycle at each magnitude of displacement was used (Figure 17). Secant stiffness degraded with the increase of θ. Before θ reached 0.6%, the secant stiffness reduced abruptly due to the cracking development of the wall piers. After that, the secant stiffness decreased more gradually with θ, indicating that the cracking conditions of the wall piers remained stable. During this stage, the plasticity development of the SCBs contributed to the majority of stiffness degradation. In general, the similarity of the curves shows that both of the two test variables have limit influence on the stiffness characteristics of the subassemblies.

3.5. Deformation Capacity

The yield top lateral drifts Δy of three subassemblies were determined by the equivalent energy method [29] based on the skeleton curves in Figure 18. As shown in Figure 19, Vm and Δm are the peak lateral load and the corresponding top lateral drift on the skeleton curve. As mentioned in Section 2.2, The ultimate lateral load Vu equals to 0.85 Vm, and the corresponding lateral drift Δu is the ultimate top lateral drift. An idealized bilinear curve consisting of an ascending segment and a flat segment corresponding to Vm is developed in the way illustrated in Figure 19. If the regions in blue and green colors, enclosed by the measured curve and the ascending segment of the idealized bilinear curve, have the same area, the lateral drift corresponding to the intersecting point between the ascending and flat segments of the idealized bilinear curve is considered as Δy and the corresponding lateral load is Vy.
As listed in Table 5, the ductility characteristic was evaluated by the displacement ductility coefficient μ [30], calculated by μ = Δuy. The average μ of the three subassemblies were 3.6, 3.4 and 3.5, respectively, indicating great postyield-deformation capacity. Judging from the little difference in μ of the three subassemblies, both the two test variables had an insignificant effect on the ductility behavior.

3.6. Shear Rotation of SCBs

As shown in Figure 20, the shear rotation angle γ of the SCBs can be estimated as follows:
γ = γ 1 + γ 2 = 0.5 ( a 1 + a 2 + a 3 + a 4 ) a 2 + b 2 / a b
where a1, a2, a3 and a4 are the elongation and shortening of the diagonal lines of the shear deformation region; a1 and a2 take positive values in terms of elongation, while a3 and a4 are positive in the case of shortening; a and b are the side lengths of the measured region.
The calculated γ of the SCBs of the three subassemblies are shown in Figure 21 and Table 6, where γ0, γm and γu are the calculated γ of the SCBs corresponding to F0, Fm and Fu, respectively. Before the failure of the subassemblies, the SCBs undertook the majority of plasticity development in the subassemblies and dissipated a considerable amount of energy through the inelastic shear rotation. At Fu, the average γu of the SCBs in CS-1, CS-2 and CS-3 was 0.082 rad, 0.080 rad and 0.086 rad, respectively. The shear rotation capacities of the SCBs can be fully developed up to the limiting value of 0.08 rad, specified in AISC 341 2016 [1].

3.7. Energy-Dissipation Capacity

The zone enclosed by the measured hysteretic curves can be used to estimate the energy-dissipation capacities of the three subassemblies. As shown in Figure 22, it was apparent that CS-2 exhibited the best energy-dissipation capacity among all three test subassemblies, which is 9.4% higher than CS-1 in accumulative value of energy dissipation, but that of CS-3 was 10.9% lower than that of CS-1. The use of assembled SPSW largely increased the energy-dissipation capacity of the subassembly, while using the shear-span ratio of 2.0 had a negative effect on this capacity of the subassembly.

4. FE Analysis

To further investigate the seismic behavior of the C-SPRC walls based on the test results, three subassemblies were numerically simulated through the proved-reliable FE software, ABAQUS. Simulated hysteretic curves, skeleton curves, energy dissipation values and failure patterns were then compared to the experimental ones.

4.1. Concrete Modeling

Concrete behavior in ABAQUS was simulated using the concrete-damaged plasticity (CDP) model combining uncorrelated multihardening plasticity and isotropic damage elasticity. Figure 23 shows the stages of the two failure mechanisms of tensile cracking and compressive crushing. The stress–strain relationship can be determined according to the Chinese code and the tensile and compressive equivalent plastic strains control the yield surface evolution. The initial elasticity modulus E0 can be calculated using the strain εc,e0 and stress σc,e0 corresponding to the elastic limit by Equation (4). Generally, σc,e0 is 1/3 of fc, where fc is the concrete compressive strength.
E 0 = σ c , e 0 / ε c , e 0
The inelastic strain and yield stress are chosen to replace the strain and stress in the compression or tensile plasticity stage in the CDP model. Equations (5) and (6) are used to calculate the cracking strain in the tensile stage (εt,in) and the inelastic strain in the compression stage (εc,in).
ε t , in = ε t ε c , in σ t / E 0
ε c , in = ε c σ c / E 0
where σt is the stress at any point during the hardening stage of tension; εt is the corresponding strain; εc and σc are the strain and stress during the hardening stage of compression.
The concrete damage strongly weakens its stiffness. Equations (7) and (8) are the expressions of the uniaxial stress–strain relationship of the concrete. Inserting Equations (5) and (6) into Equations (7) and (8), the Dc (Dt)-εt,in (εc,in) relationship could be obtained. The tension plastic strain, εt,p, and the compression one, εc,p, can be calculated via Equations (9) and (10).
σ t = ( 1 D t ) E 0 ( ε t ε t , p ) σ c
σ c = ( 1 D c ) E 0 ( ε c ε c , p )
ε t , p = ε t , in D t σ t / E 0 ( 1 D t )
ε c , p = ε c , in D c σ c / E 0 ( 1 D c )
where Dt and Dc are the uniaxial tensile and compressive damage variables, respectively.
The parameters of the CDP model in ABAQUS can be viewed in Table 7.

4.2. Steel Members Modeling

As indicated in Equation (11) and Figure 24, the stress–strain relationship presented in Design of Steel Structures (Eurocode 3 2005) [31] was adopted to simulate the structural steel members in this simulation, which consists of elastic, yield platform, hardening and failure stages. The Poisson’s ratio of the steel was 0.3.
σ = { ε E s ε ε p f y ε p ε ε y f y + ( f u f y ) ( ε ε y ) / ( ε s ε y ) ε y ε ε s f u ε s ε ε t f u ( 1 ( ε ε t ) / ( ε u ε t ) ) ε t ε ε u 0 ε > ε u
where σ is the stress of the steel; fu is the ultimate tensile stress of the steel; εp is the proportional limit stain of the steel; εs is the strength ultimate strain of the steel; εt is the strength degradation strain of the steel.

4.3. Reinforcements Modeling

The Usteel02 model used to simulate the reinforcements is shown in Figure 25, in which the loading, yield platform, unloading and failure of reinforcement were considered.

4.4. FE Types and Mesh Sizes

The 3D eight-node solid element with reduced integration (C3D8R) was chosen as the FE type of concrete. The faceplates and steel plates in CS-2 were also modeled by C3D8R to simulate the complicated interactions. The four-node doubly curved shell elements with reduced integration (S4R) were used to simulate the steel plates in CS-1 and CS-3. The rebars were simulated by the two-node linear displacement truss elements (T3D2). In order to provide both accurate and computationally cost-effective results, mesh sizes of 6 mm, 6 mm and 20 mm were applied to the faceplates, bolts and web plates in CS-2, respectively (Figure 26a–c), and the mesh sizes of the other steel members, reinforcements and concrete of numerical models were 60 mm (Figure 26d–f).

4.5. Bond–Slip and Boundary Conditions

As the test results indicated, a sufficient amount of shear studs welded on the SPSW can ensure reliable interaction between the concrete and the embedded SPSW, effectively bonding the concrete and steel plate together. Thus, the steel plates, VBEs, HBEs and reinforcements are embedded into the concrete using the embedded constraint option, assuming a perfect bond–slip behavior. The bottom surface of foundation was restrained against all degrees of freedom. Uniform compressive force was applied on the top surface of loading beam, and the displacement-controlled lateral loading history of the test was replicated and applied to a reference point on the side-surface of the loading beam. The out-of-plane deformation of the SCB and SPRC wall pier was restrained.

4.6. Comparison of Hysteretic Curves, Skeletion Curves and Energy-Dissipation Capacities

Figure 27 plots the simulated and experimental skeleton curves of all three subassemblies, where the red dashed lines represent the simulated results while the dark solid lines represent the experimental ones. The calculated lateral load capacity Vn shown by the dark straight dashed lines is close to the simulated peak lateral load of the models. The postyield strength degradation and deformation capacity were also well-simulated.
As shown in Figure 28, the simulated hysteretic curves of all three numerical models were similar to their corresponding experimental results generally. At the ultimate load stages, the pinching of the experimental curves was more obvious than the simulated ones due to the significant concrete crushing and spalling off at the wall-bottom-boundary regions, which was ignored in the simulation. Figure 29 demonstrates the comparison of energy-dissipation values between the simulated and experimental results. The test subassembly CS-2 with assembled SPSW dissipated the largest amount of energy among the three models. Due to the same reason for the deviations in the hysteretic curves, the simulated energy dissipations of all three models did not agree well with the experimental ones at the ultimate loading cycles.

4.7. Comparison of Failure Patterns

As shown in Figure 30, Figure 31 and Figure 32, the failure of these three numerical models followed similar patterns with the test observations. Along with the increase of θ, the concrete damage gradually distributed through the wall height. During the loading process, the plasticity of the SCBs were fully developed in the three models. Before the termination of the simulation, the longitudinal rebars at the bottom, the VBEs and the bottom steel plates yielded. In addition, in CS-2, the yield occurred in the corner area of the faceplate, and the forces of the connecting bolts on both sides were greater than those in the central area but did not exceed the ultimate strength. Thus, the assembled SPSW in CS-2 kept working in the loading process, demonstrating the effectiveness of this type of SPSW in the current construction practice. In general, the adopted numerical modeling technique can simulate the failure of the three test models with satisfactory accuracy.

5. Conclusions

Through the structural test and the FE analysis, three 1/3-scaled C-SPRC wall subassemblies with different embedded SPSW details and wall shear-span ratios were examined to explore the seismic behavior. The following conclusions are summarized based on the experimental and simulated results:
  • The coupling mechanism of the C-SPRC composite wall was realized according to the damage development and the failure pattern observed in the tests. At the early loading stage, the concrete cracking was initiated at the bottom of the wall boundaries. Then, the cracks uniformly distributed along the wall height and almost remained unchanged without noticeable further development until the failure of the subassemblies. The subassembly plasticity development concentrated at the SCBs with significant shear rotations. After the failure of the SCBs, due to excessive shear deformation, both sides at the bottom of the wall piers developed concrete crushing and spalling off.
  • The experimental results showed the C-SPRC wall subassembly with a proper design can satisfy the requirements on the interstory-deformation capacity, ductility and energy-dissipation capacity. The plastic shear rotation angles of the SCB of all subassemblies can reach the code limit of 0.08 rad, indicating the full development of the plasticity of the SCB. The average displacement ductility coefficients of the three subassemblies were 3.6, 3.45 and 3.5, respectively.
  • The test subassembly with the embedded SPSW assembled by bolted faceplate joint at the web plate and welded joint at the VBE exhibited similar seismic performance to those with the conventional SPSW. The energy-dissipation capacity and interstory-deformation capacity of the subassembly with the assembled SPSW were roughly 9.4% and 13.2% greater than those of the subassembly with the conventional SPSW. In comparison to the test subassembly with the shear-span ratio of 2.2, the interstory-deformation capacity and SCB shear rotation of the subassembly with the shear-span ratio of 2.0 was increased by approximately 13.4% and 7.2%, while the energy-dissipation capacity was decreased by 10.9%, and both of these two test variables have insignificant influence on the stiffness degradation of the C-SPRC walls.
  • When designing the coupled SPRC composite wall system, it is recommended that using shear-span ratios between 2.0 and 2.2 can ensure great postyield-deformation capacity, interstory-deformation capacity and ductility, and the assembled SPSW can be an effective alternative to the conventional integral SPSW according to the experimental results.
  • The seismic behaviors of the three numerical models were in good agreement with those obtained in the experiments, showing the reliability and accuracy of the modeling method. The numerical modeling techniques of ABAQUS can provide a sound foundation for further investigations about the C-SPRC composite walls.

Author Contributions

Conceptualization, Z.M., Y.W. and M.Z.; methodology, Z.M., Y.W. and J.Z.; software, Z.M. and J.Z.; validation, Z.M., J.Z. and Y.W.; formal analysis, Z.M. and J.Z.; investigation, Z.M., J.Z. and Y.W.; resources Y.W. and M.Z.; data curation, Z.M. and J.Z.; writing—original draft preparation, Z.M. and Y.W.; writing—review and editing, Y.W.; visualization, Z.M.; supervision, M.Z.; project administration, J.Z.; funding acquisition, Y.W. All authors have read and agreed to the published version of the manuscript.

Funding

This research described in this paper was financially funded by the National Natural Science Foundation of China (grant no. of 51978101).

Institutional Review Board Statement

Not applicable.

Informed Consent Statement

Not applicable.

Data Availability Statement

Not applicable.

Conflicts of Interest

The authors declare no conflict of interest.

Nomenclature

N2Axial force of wall pier on second floor in structure;
M2Bending moment of wall pier on second floor in structure;
V2Shear force of wall pier on second floor in structure;
MwMost-probable flexural capacity of wall cross-section;
VwShear force demand of wall cross-section;
VbMost-probable shear capacity of SCB;
NAxial load applied on wall pier;
h0Effective depth;
MFlexural capacity;
VShear capacity of wall cross-section;
VnCalculated lateral load capacities of test subassemblies;
α1Influence coefficient of concrete compressive zone;
fcCompressive strength of concrete;
bwWall thickness;
xDepth of concrete compressive zone;
f y Compressive strength of longitudinal reinforcement;
A s Section area of reinforcement in compressive zone;
a a Distance from the center of compressed VBE to the edge of element in tension;
a s Distance from the center of compressed reinforcement to the edge of element in tension;
fa, f a Tensile and compressive strength of steel used in VBE;
AaSection area of VBE in the element in tension;
A a Section area of VBE in compressive zone;
Msw, MpwMoment applied on vertical distributed bars and steel plate;
λShear-span ratio;
fctTensile strength of concrete;
AShear wall section area;
fyhTensile strength of horizontal distributed bars;
AshSection area of horizontal distributed bars;
sSpacing of horizontal distributed bars;
fpTensile strength of steel used in steel plate;
ApSection area of steel plate;
VpPlastic shear capacity of SCB;
MbFlexural force demand of SCB;
σaTensile stress of VBE;
σyTensile stress of longitudinal reinforcement;
ΔTop lateral drift;
θTop lateral drift ratio;
fcu,mAverage compressive strength of the concrete cubic samples;
Ec, EsYoung’s modulus of concrete and steel;
fy, ftYield strength and tensile strength of steel;
εy, εuYield strain and ultimate strain of steel;
F0Initial concrete cracking condition;
FyYield condition of subassembly;
FmPeak load condition of subassembly;
FuUltimate load condition of subassembly;
δ0, δy, δm, δuInterstory drifts at F0, Fy, Fm, Fu;
θ0, θy, θm, θuInterstory drift ratios at F0, Fy, Fm, Fu;
VmPeak lateral load;
ΔmTop lateral drift corresponding to Vm;
VyLateral load corresponding to Δy;
ΔyYield top lateral drift;
VuUltimate lateral load;
ΔuUltimate top lateral drift;
μDisplacement ductility coefficient;
a1, a2Elongation of diagonal lines of shear deformation region;
a3, a4Shortening of diagonal lines of shear deformation region;
a, bSide lengths of the measured region;
γShear rotation angle of SCBs
γ0, γm, γuCalculated γ corresponding to F0, Fm, Fu;
E0Initial elasticity modulus;
σc,e0, εc,e0Strain and stress corresponding to the elastic limit;
εt,inCracking strain in the tensile stage;
εc,inInelastic strain in the compression stage;
σtStress at any point during the hardening stage of tension;
εtStrain corresponding to σt;
εc, σcStrain and stress during the hardening stage of compression;
εt,p, εc,pTension and compression plastic strain;
Dt, DcUniaxial e compressive and tensile damage variable;
σStress of steel;
fuUltimate tensile stress of steel;
εpProportional limit stain of steel;
εsStrength ultimate strain of steel;
εtStrength degradation strain of steel

References

  1. ANSI/AISC 341-16; Seismic Provisions for Structural Steel Buildings. American Institute of Steel Construction: Chicago, IL, USA, 2016.
  2. Wang, J.J.; Tao, M.X.; Fan, J.S.; Nie, X. Seismic Behavior of Steel Plate Reinforced Concrete Composite Shear Walls under Tension-Bending-Shear Combined Cyclic Load. J. Struct. Eng. 2018, 144, 04018075. [Google Scholar] [CrossRef]
  3. Ren, X.D.; Bai, Q.; Yang, C.D.; Li, J. Seismic behavior of tall buildings using steel-concrete composite columns and shear walls. Struct. Des. Tall Spec. Build. 2018, 27, e1441. [Google Scholar] [CrossRef]
  4. Najm, H.M.; Ibrahim, A.M.; Sabri, M.M.; Hassan, A.; Morkhade, S.; Mashaan, N.S.; Eldirderi, M.M.A.; Khedher, K.M. Modelling of Cyclic Load Behaviour of Smart Composite Steel-Concrete Shear Wall Using Finite Element Analysis. Buildings 2022, 12, 850. [Google Scholar] [CrossRef]
  5. Xiao, C.Z.; Zhu, A.P.; Li, J.H.; Li, Y.B. Experimental study on seismic performance of embedded steel plate-HSC composite shear walls. J. Build. Eng. 2020, 34, 101909. [Google Scholar] [CrossRef]
  6. Wang, W.; Wang, Y.; Lu, Z. Experimental study on seismic behavior of steel plate reinforced concrete composite shear wall. Eng. Struct. 2018, 160, 281–292. [Google Scholar] [CrossRef]
  7. Yun, S.; Su, Z.; Jiang, L.; Zhou, Q.L. Seismic Response Analysis and Connection Performance Evaluation of a Hybrid Coupled PEC Wall System. Adv. Civ. Eng. 2020, 2020, 8139697. [Google Scholar] [CrossRef]
  8. El-Tawil, S.; Harries, K.A.; Fortney, P.J.; Shahrooz, B.M.; Kurama, Y. Seismic design of hybrid coupled wall systems: State of the art. J. Struct. Eng. 2010, 136, 755–769. [Google Scholar] [CrossRef]
  9. Das, R.; Steensels, R.; Dragan, D.; Vandoren, B.; Degée, H. Characterization and optimization of a steel beam to RC wall connection for use in innovative hybrid coupled wall systems. Structures 2020, 23, 111–125. [Google Scholar] [CrossRef]
  10. Li, G.Q.; Gu, F.L.; Jiang, J.; Sun, F.F. Cyclic behavior of steel beam-concrete wall connections with embedded steel columns (I): Experimental study. Steel Compos. Struct. 2017, 23, 399–408. [Google Scholar] [CrossRef]
  11. Ji, X.D.; Cheng, Y.H.; Leong, T.S.; Cui, Y. Seismic behavior and strength capacity of steel coupling beam-to-SRC wall joints. Eng. Struct. 2019, 201, 109820. [Google Scholar] [CrossRef]
  12. Wu, Y.T.; Fu, J.J.; Zhou, Q.; Lan, T.Q.; Yang, Y.B. Seismic Performance of Endplate Connections between Steel Reinforced Concrete Walls and Steel Beams. Struct. Eng. Int. 2018, 28, 208–217. [Google Scholar] [CrossRef]
  13. Motter, C.J. Large-Scale Testing of Steel-Reinforced Concrete (SRC) Coupling Beams Embedded into Reinforced Concrete Structural Walls. Ph.D. Thesis, UCLA, Los Angeles, CA, USA, 2014. [Google Scholar]
  14. Pavir, A.; Shekastehband, B. Hysteretic behavior of coupled steel plate shear walls. J. Constr. Steel Res. 2017, 133, 19–35. [Google Scholar] [CrossRef]
  15. Oh, K.; Ha, H.; Jo, B.; Lee, K. An Analytical Study on Structural Performance Evaluation of Coupled Steel Plate Shear Wall Systems. Int. J. Steel Struct. 2019, 19, 1–13. [Google Scholar] [CrossRef]
  16. Usefvand, M.; Maleki, A.; Alinejad, B. Investigate of damage index of coupled steel plate shear walls (C-SPSW) system under seismic loading. Structures 2020, 28, 614–625. [Google Scholar] [CrossRef]
  17. Yu, J.G.; Feng, X.T.; Hao, J.P.; Hua, J. Mechanical performance of coupled buckling-restrained steel plate shear walls. J. Build. Eng. 2021, 43, 103093. [Google Scholar] [CrossRef]
  18. Gholhaki, M.; Ghadaksaz, M.B. Investigation of the link beam length of a coupled steel plate shear wall. Steel Compos. Struct. 2016, 20, 107–125. [Google Scholar] [CrossRef]
  19. Ma, Y.; Sun, B.; Berman, J.W.; Taoum, A.; Yang, Y. Cyclic behavior of coupled steel plate shear walls with different beam-to-column connections. J. Constr. Steel Res. 2022, 189, 107084. [Google Scholar] [CrossRef]
  20. Ma, Y.; Yan, Z.Z.; Berman, J.W.; Taoum, A.; Tian, W. Seismic Performance of Coupled Steel Plate Shear Walls with Different Degrees of Coupling. J. Struct. Eng. 2022, 148, 04022111. [Google Scholar] [CrossRef]
  21. Zuo, J.Q.; Zhu, B.L.; Guo, Y.L.; Wen, C.B.; Tong, J.Z. Experimental and numerical study of Steel Corrugated-Plate Coupling Beam connecting shear walls. J. Build. Eng. 2022, 54, 104662. [Google Scholar] [CrossRef]
  22. Usefvand, M.; Maleki, A.; Alinejad, B. Cyclic Behavior and Performance of a Coupled-Steel Plate Shear Wall with Fuse Pin. Adv. Mat. Res. 2020, 10, 245–265. [Google Scholar] [CrossRef]
  23. JGJ138; Code for Design of Composite Structures, China Build. Industry Press: Beijing, China, 2016. (In Chinese)
  24. GB50011; Code for Seismic Design of Buildings, China Build. Industry Press: Beijing, China, 2010. (In Chinese)
  25. Li, H.N.; Li, B. Experimental study on seismic restoring performance of reinforced concrete shear walls. J. Build. Struct. 2004, 25, 35–42. (In Chinese) [Google Scholar]
  26. Tong, X.; Fang, Z.; Luo, X.; Gong, L. Study on shear capacity of ultra-high performance concrete squat shear walls. Case Stud. Constr. Mater. 2020, 12, e00314. [Google Scholar] [CrossRef]
  27. Zhang, L.; Han, X.; Chen, X.; Ji, J. Experimental Study on the Seismic Behavior of Squat SRC Shear Walls with High Axial Load Ratio. Buildings 2022, 12, 1238. [Google Scholar] [CrossRef]
  28. FEMA. Interim Testing Protocols for Determining the Seismic Performance Characteristics of Structural and Nonstructural Components; Applied Technology Council: Washington, DC, USA, 2007.
  29. Park, R. Ductility evaluation from laboratory and analytical testing. In Proceedings of the 9th World Conference on Earthquake Engineering, Tokyo-Kyoto, Japan, 2–9 August 1988. [Google Scholar]
  30. Pachideh, G.; Gholhaki, M.; Daryan, A.S. Analyzing the damage index of steel plate shear walls using pushover analysis. Structures 2019, 20, 437–451. [Google Scholar] [CrossRef]
  31. Eurocode. Design of Steel Structures. Part 1.2: General Rules-Structural Fire Design; European Committee for Standardization: Brussels, Belgium, 2005. [Google Scholar]
Figure 1. Concept of C-SPRC composite wall.
Buildings 12 02036 g001
Figure 2. C-SPRC wall subassembly. (a) Scope of subassembly; (b) Boundary conditions of actual subassembly.
Buildings 12 02036 g002
Figure 3. Overall dimensions of subassemblies (unit: mm).
Buildings 12 02036 g003
Figure 4. Details of SCBs and VBEs (unit: mm). (a) SCB; (b) VBE.
Buildings 12 02036 g004
Figure 5. Details of steel plate connection (unit: mm). (a) CS-1, CS-3; (b) CS-2.
Buildings 12 02036 g005
Figure 6. Reinforcement arrangement.
Buildings 12 02036 g006
Figure 7. Flexural capacity calculating diagram.
Buildings 12 02036 g007
Figure 8. Test setup.
Buildings 12 02036 g008
Figure 9. Boundary conditions of test subassembly.
Buildings 12 02036 g009
Figure 10. Layout of LVDTs and LPs.
Buildings 12 02036 g010
Figure 11. Layout of strain gauges in different components. (a) Strain gauges in steel bars; (b) Strain gauges in SCBs, steel plates and VBEs.
Buildings 12 02036 g011
Figure 12. Cracking development of wall piers. (a) θ = 0.25%; (b) θ = 0.75%; (c) θ = 1.5%.
Buildings 12 02036 g012
Figure 13. Ultimate conditions of wall piers (θ = 4.0%). (a) Wall pier in CS-1; (b) Wall pier in CS-2; (c) Wall pier in CS-3.
Buildings 12 02036 g013
Figure 14. Significant shear deformation of SCBs. (a) CS-1; (b) CS-2.
Buildings 12 02036 g014
Figure 15. Hysteretic loops of subassemblies. (a) CS-1; (b) CS-2; (c) CS-3.
Buildings 12 02036 g015
Figure 16. Distribution of interstory drifts and interstory drift ratios. (a) CS-1; (b) CS-2; (c) CS-3.
Buildings 12 02036 g016
Figure 17. Stiffness degradation curves of subassemblies (unit: kN/mm).
Buildings 12 02036 g017
Figure 18. Skeleton curves of subassemblies. (a) CS-1; (b) CS-2; (c) CS-3.
Buildings 12 02036 g018
Figure 19. Method of determining yield point.
Buildings 12 02036 g019
Figure 20. Calculation diagram of shear deformation.
Buildings 12 02036 g020
Figure 21. Shear rotation of SCBs.
Buildings 12 02036 g021
Figure 22. Comparison of accumulative values of energy dissipation (unit: kN·m).
Buildings 12 02036 g022
Figure 23. Stress–strain curves of CDP.
Buildings 12 02036 g023
Figure 24. Stress–strain curves of steel members.
Buildings 12 02036 g024
Figure 25. Stress–strain curves of USteel02 of PQ-fiber.
Buildings 12 02036 g025
Figure 26. Meshing of FE model. (a) Faceplate in CS-2; (b) Bolt in CS-2; (c) SPSW in CS-2; (d) SPSW in CS-1, CS-3; (e) Reinforcement; (f) Concrete.
Buildings 12 02036 g026
Figure 27. Comparison of skeleton curves of three numerical models. (a) CS-1; (b) CS-2; (c) CS-3.
Buildings 12 02036 g027
Figure 28. Comparison of hysteric curves of three numerical models. (a) CS-1; (b) CS-2; (c) CS-3.
Buildings 12 02036 g028
Figure 29. Comparison of energy dissipation values of three numerical models. (a) CS-1; (b) CS-2; (c) CS-3.
Buildings 12 02036 g029
Figure 30. Failure patterns of concrete in three numerical models. (a) CS-1; (b) CS-2; (c) CS-3.
Buildings 12 02036 g030
Figure 31. Failure patterns of steel members of three numerical models. (a)Embedded SPSW of CS-1; (b) Embedded SPSW of CS-2; (c) Embedded SPSW of CS-3; (d) Faceplate of CS-2; (e) Bolts of CS-2.
Buildings 12 02036 g031
Figure 32. Failure patterns of steel bars of three numerical models. (a) CS-1; (b) CS-2; (c) CS-3.
Buildings 12 02036 g032
Table 1. Calculated capacities and shear-span ratios.
SubassemblyVp/kNM/(kN·m)Vn/kNN/kNλ
CS-119411137209902.2
CS-2
CS-319910016999982.0
Table 2. Mechanical properties of concrete (unit: MPa).
SubassemblyPositionfcu,mEc
CS-1Loading beam48.23.4554 × 104
Wall pier49.9
Foundation47.23.3657 × 104
CS-2Loading beam47.43.4554 × 104
Wall pier49.2
Foundation47.33.3657 × 104
CS-3Loading beam49.33.4554 × 104
Wall pier49.6
Foundation473.3657 × 104
Table 3. Mechanical properties of steel.
TypeThickness(Diameter)/mmfy/MPaεy/10−3εu/10−3ft/MPaEs/MPa
Steel Plate53421.78619.715517191,533
63411.8320.054501186,080
83581.94421.633510184,184
103771.88321.059515200,065
Steel Bar64492.00119.591515224,355
84202.00222.108590209,791
104261.89720.784589224,512
Table 4. Values of interstory drifts and interstory drift ratios.
SubassemblyFloor LevelLoading Directionδ0/mmθ0 (%)δy/mmθy (%)δm/mmθm(%)δu/mmθu (%)
CS-12nd+2.20.244 8.70.971 171.887 303.333
1.30.145 6.50.725 17.21.923 31.23.448
Top+4.10.249 16.30.990 31.91.923 53.73.226
4.10.249 14.20.862 31.91.923 55.23.333
CS-22nd+2.10.233 9.41.042 26.22.941 34.23.846
20.222 91.000 17.61.961 34.73.846
Top+4.10.249 18.71.136 49.22.941 62.53.846
4.10.249 16.30.990 31.51.923 58.73.571
CS-32nd+2.40.267 10.81.176 25.42.857 36.54.000
2.20.244 7.60.847 17.61.961 34.83.846
Top+4.10.249 19.91.176 44.42.703 61.83.704
4.10.249 14.60.885 321.923 58.83.571
Table 5. Measured top lateral drift of subassemblies (unit: mm).
SubassemblyLoading
Direction
ΔyΔmΔuμ
CS-1+16.331.953.73.3
14.231.955.23.9
CS-2+18.749.262.53.3
16.331.558.73.6
CS-3+19.944.461.83.1
14.63258.83.9
Table 6. Calculated shear rotation of SCBs (unit: rad).
SubassemblyLoading
Direction
γ0γmγu
CS-1+0.0100.0440.096
−0.007−0.022−0.068
CS-2+0.0110.0540.096
−0.009−0.034−0.065
CS-3+0.0130.0620.101
−0.011−0.035−0.071
Table 7. Parameters of CDP model.
ParametersValues
Dilation angle38°
Poisson’s ratio0.2
Flow potential eccentricity0.1
Ratio of the second stress invariant on tensile meridian-to-that on compressive meridian2/3
Ratio of the biaxial compressive strength-to-the uniaxial compressive strength1.16
Publisher’s Note: MDPI stays neutral with regard to jurisdictional claims in published maps and institutional affiliations.

