
Evacuation of Shelter in Place at Subway Transfer Stations Based on BIM and Proposal of a Strengthening Method


Abstract
:
1. Introduction
2. SIP Simulation Based on the BIM Model
2.1. Variables for Evacuation Simulation
2.1.1. Movement of Occupants
2.1.2. Occupants Counting for Evacuation Simulation
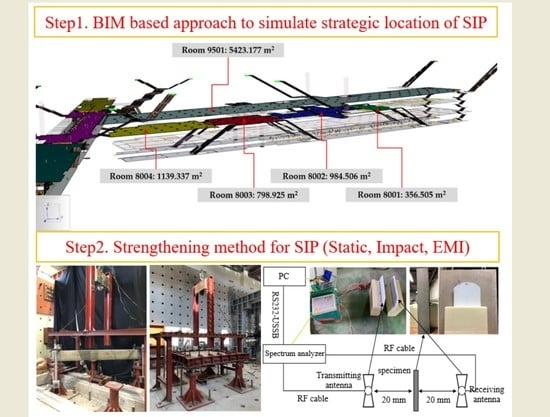
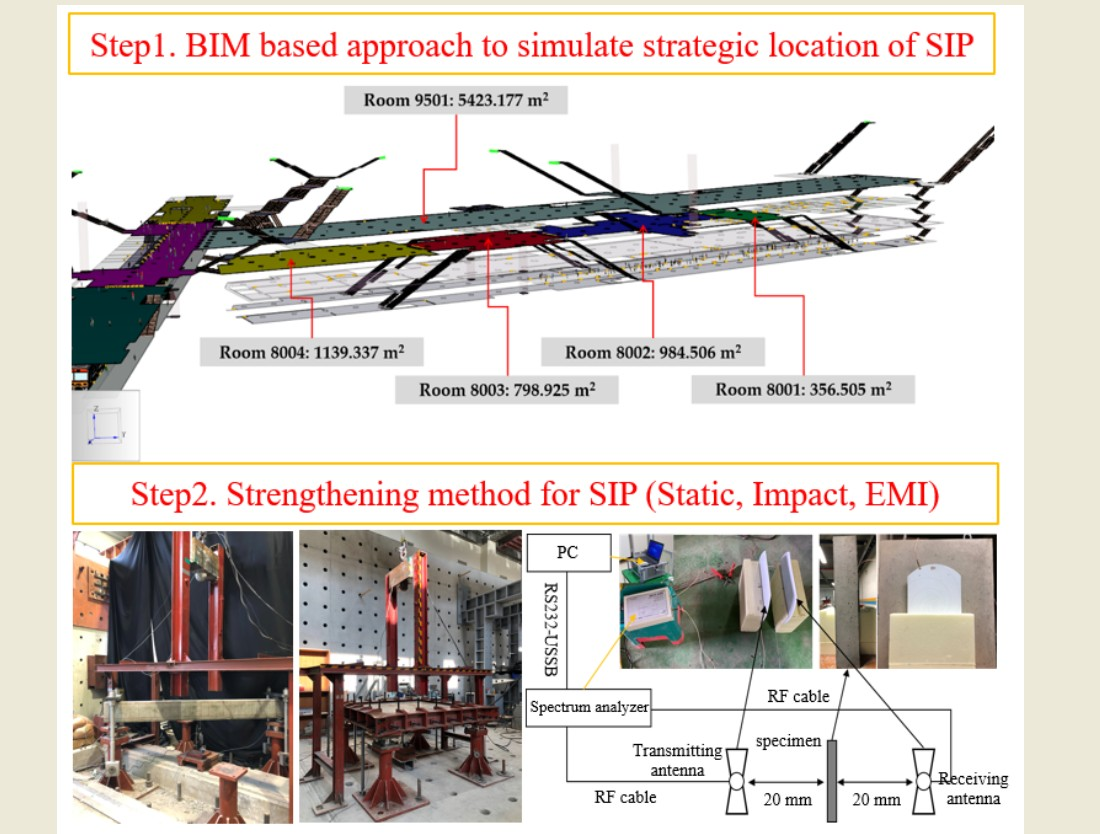
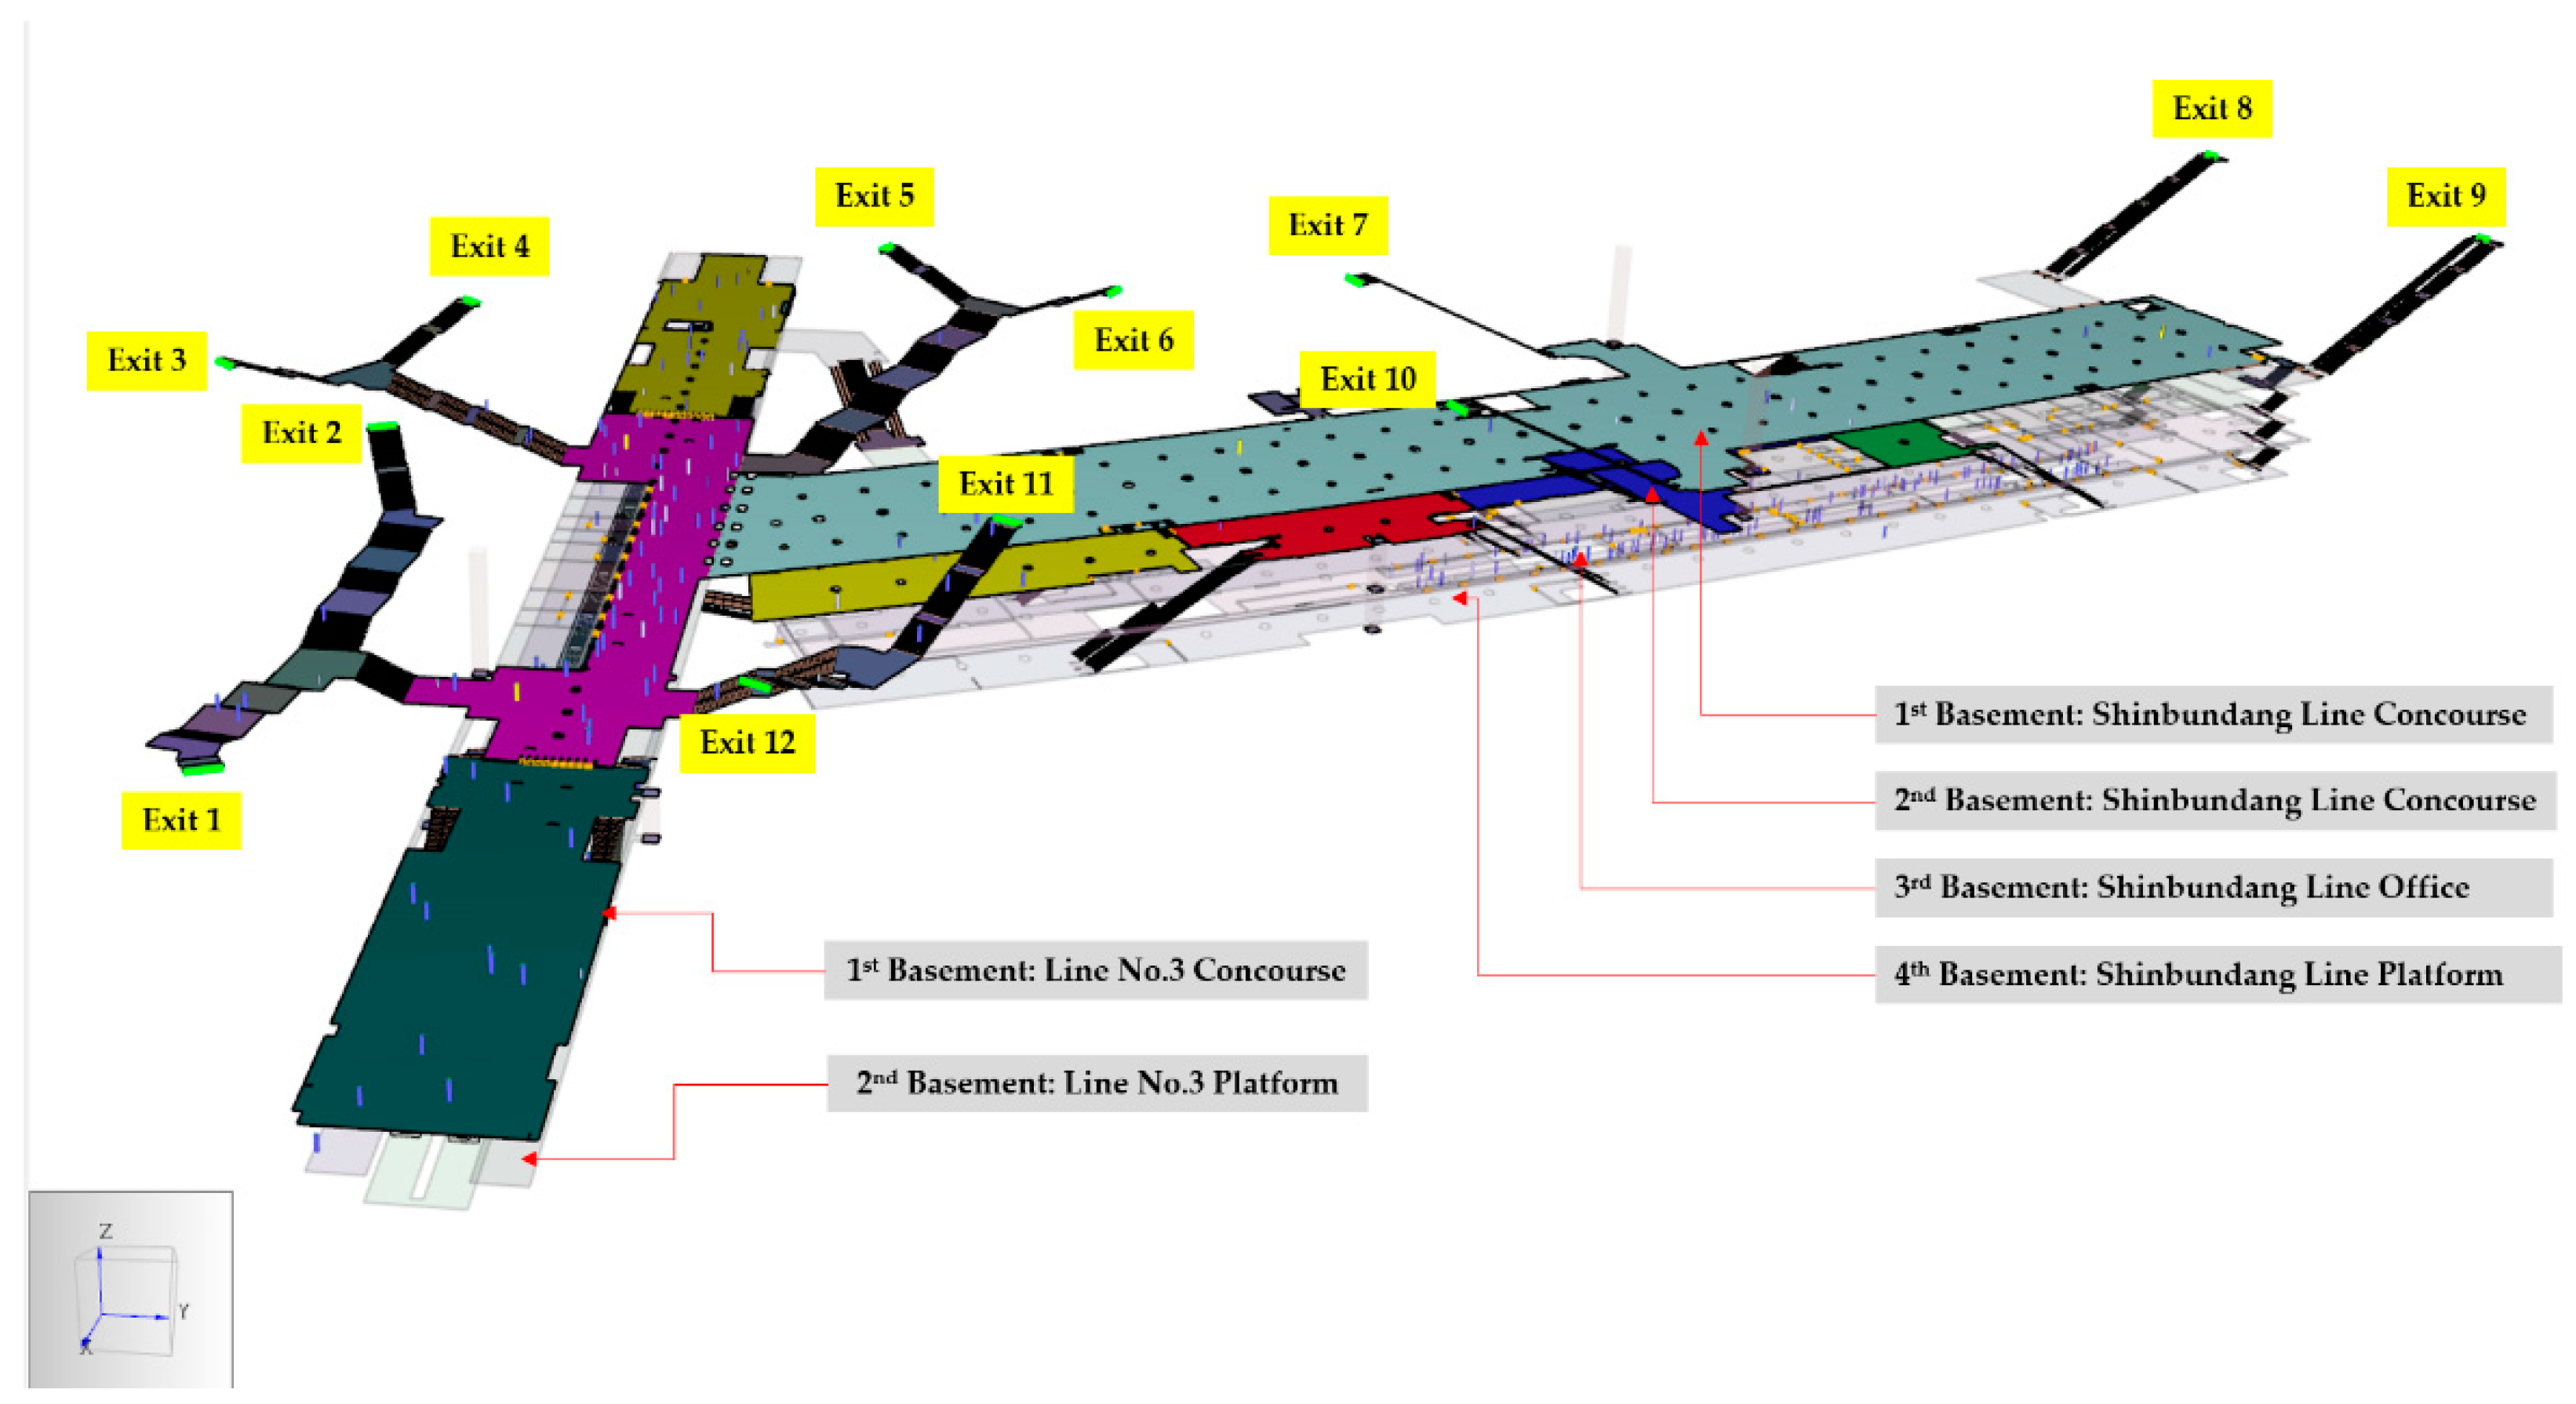
2.1.3. Location of SIP
- Less Than 24 h. An occupancy duration of less than 24 h does not require sleeping areas. The occupant load will generally be a net 1.86 m2/person, depending upon the classification of occupancy.
- More Than 24 h. An occupancy duration greater than 24 h requires sleeping areas. The minimum floor area, with the use of single-size beds, is approximately 5.6 m2/person. With the use of bunked beds, the minimum floor area is approximately 2.8 m2/person.
2.2. Modeling
2.2.1. Creation of a Mesh
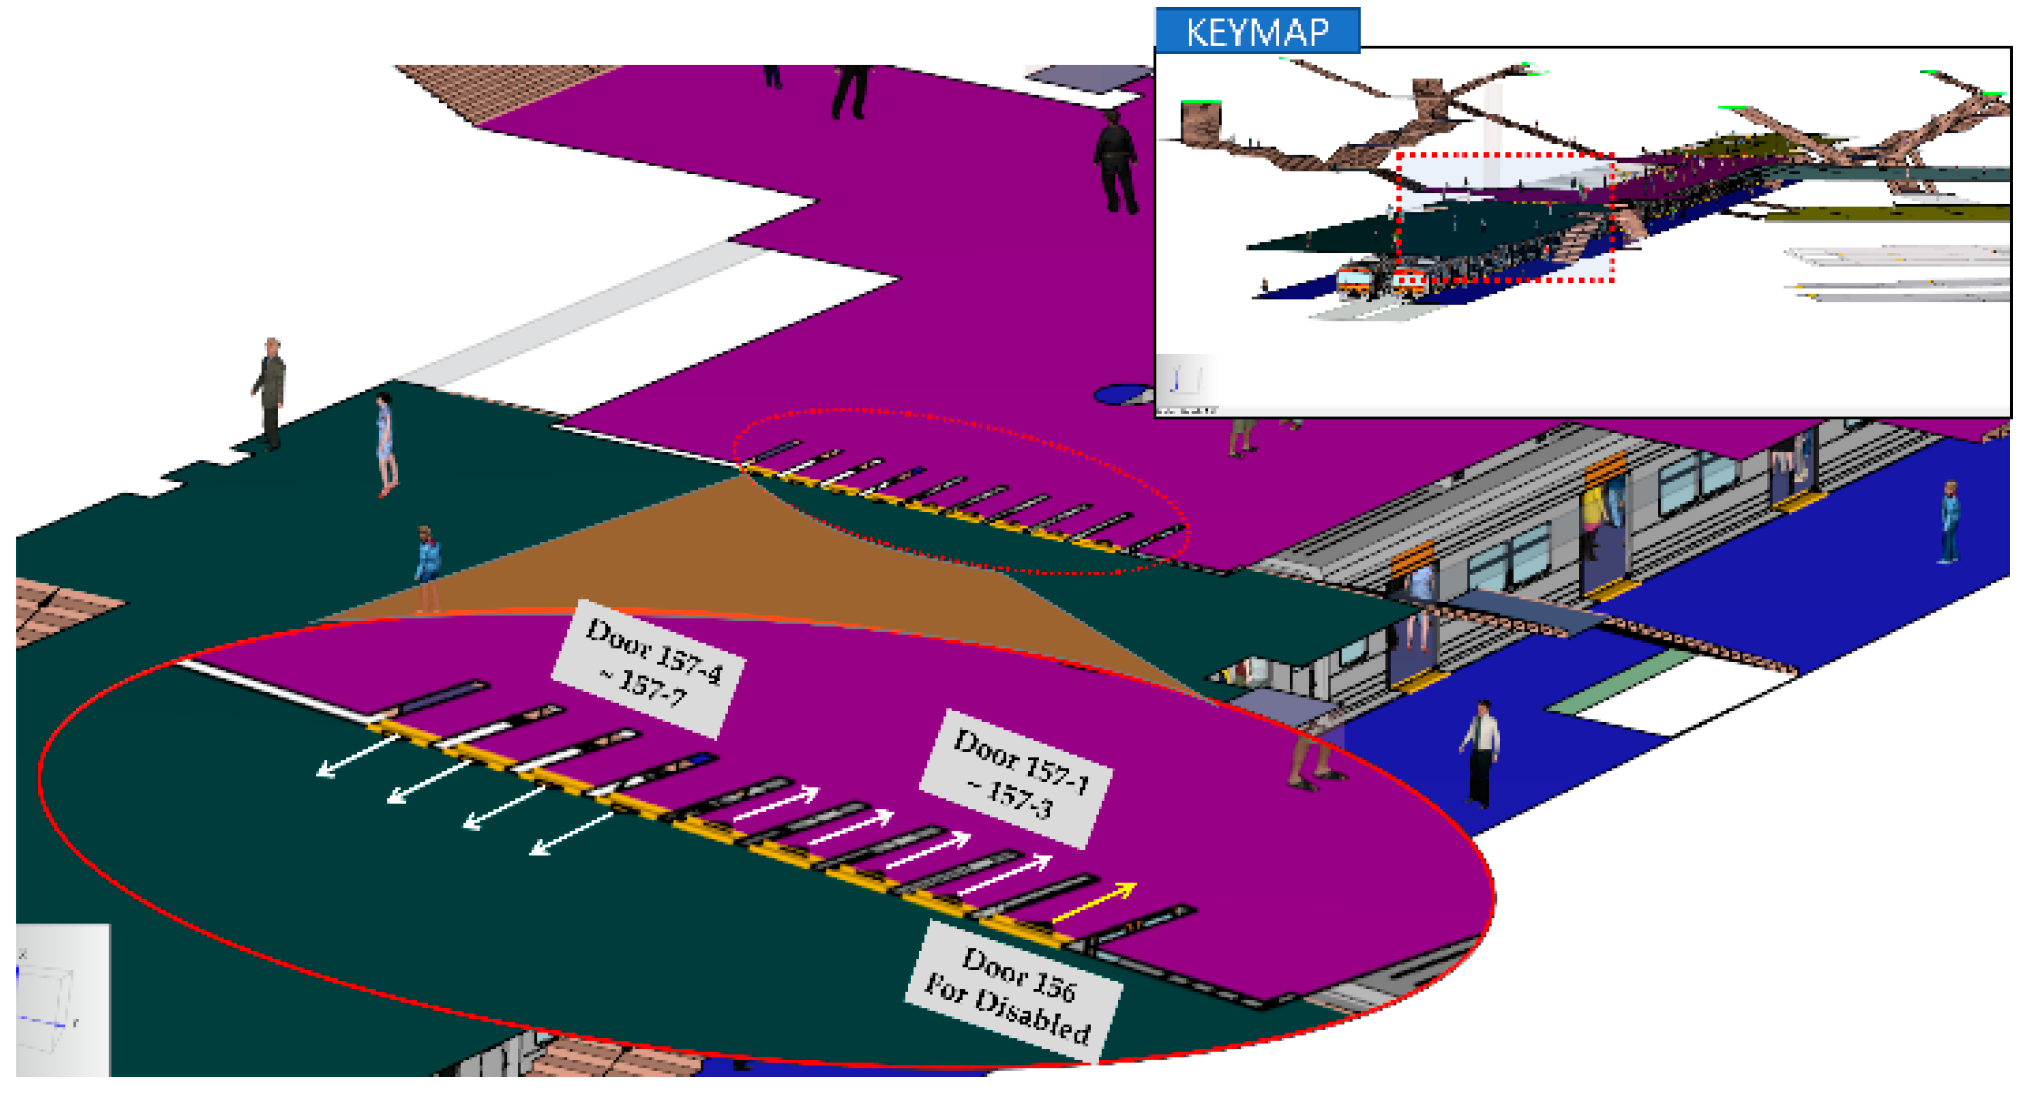
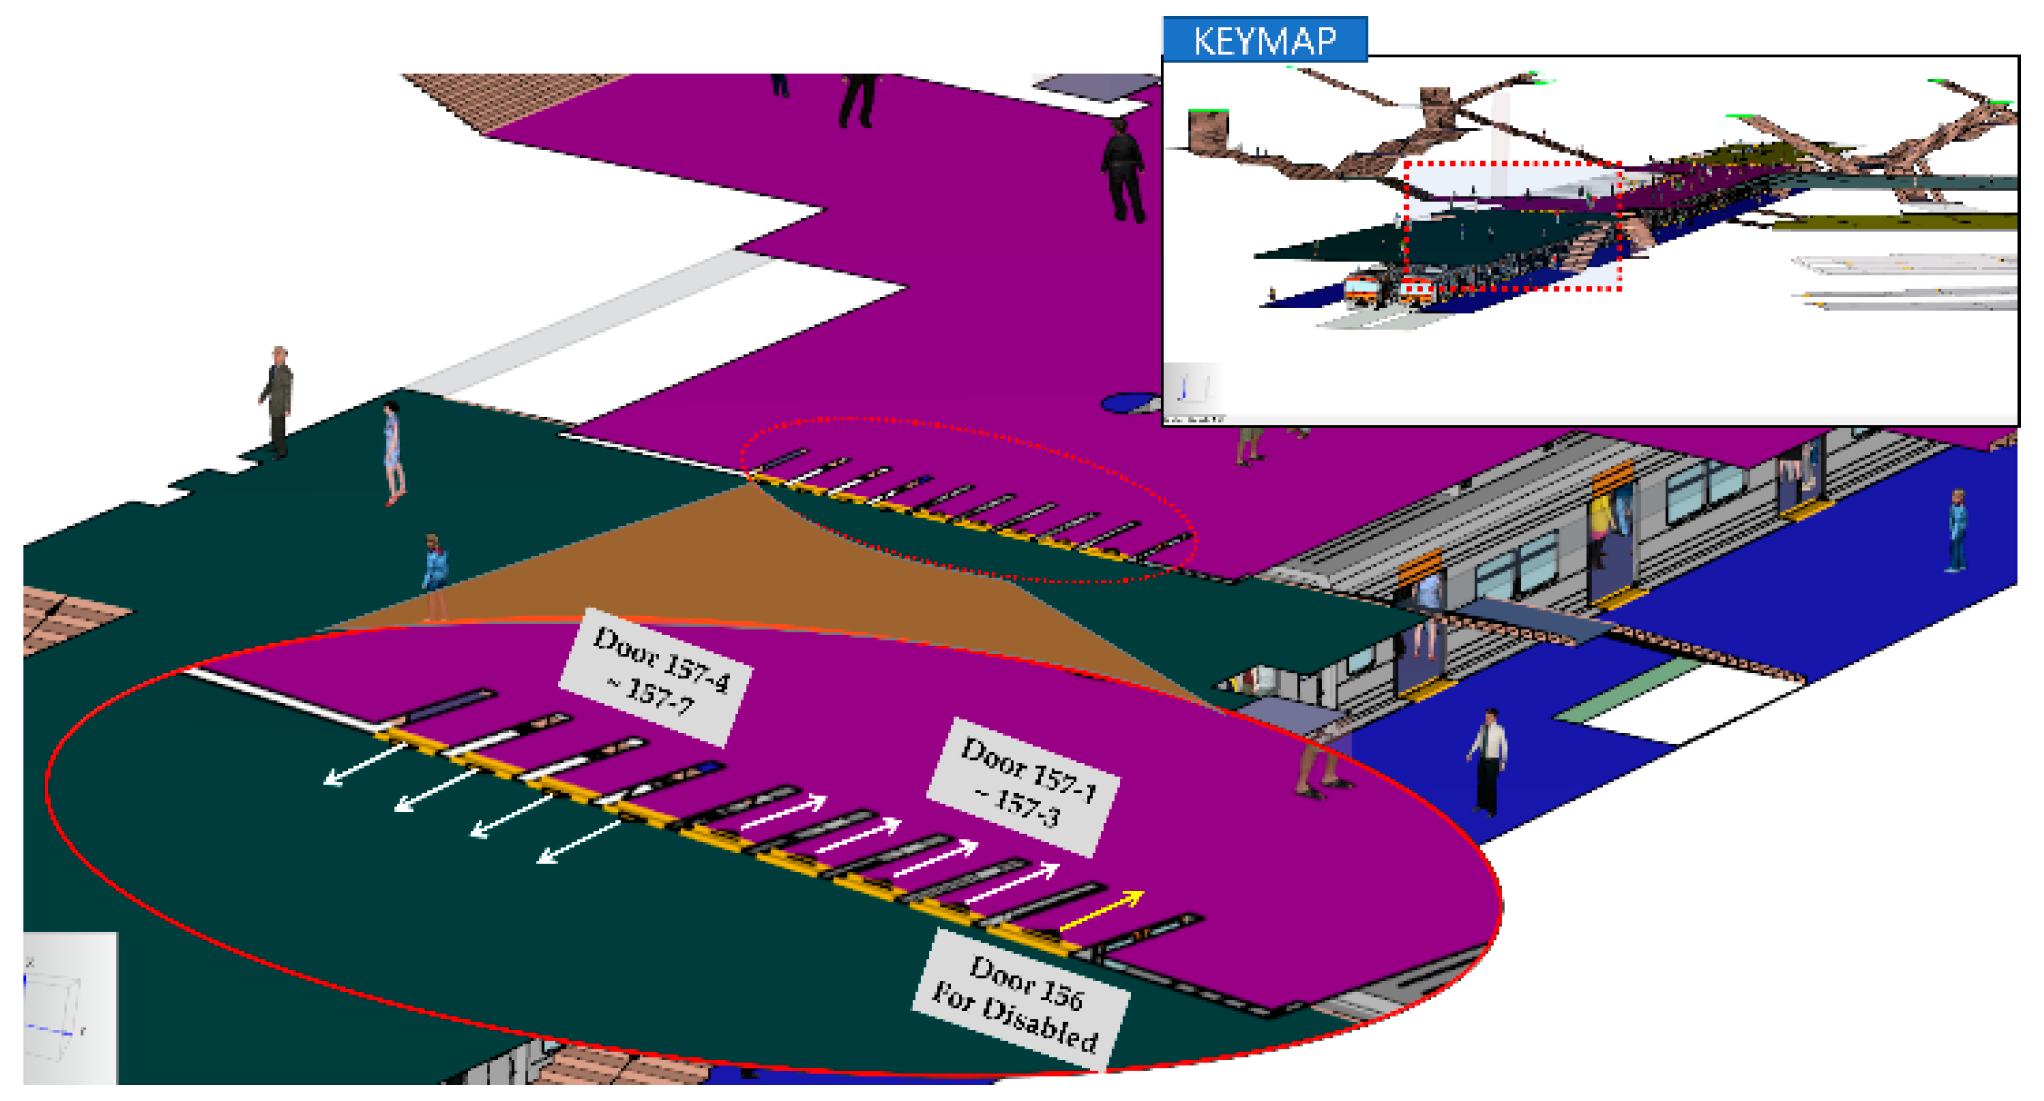
2.2.2. Door
2.2.3. Gate
2.2.4. Elevator and Stairs
2.2.5. Occupant
2.3. Scenario
3. Strengthened Method for SIP
3.1. Details of Test Specimens
3.1.1. Materials
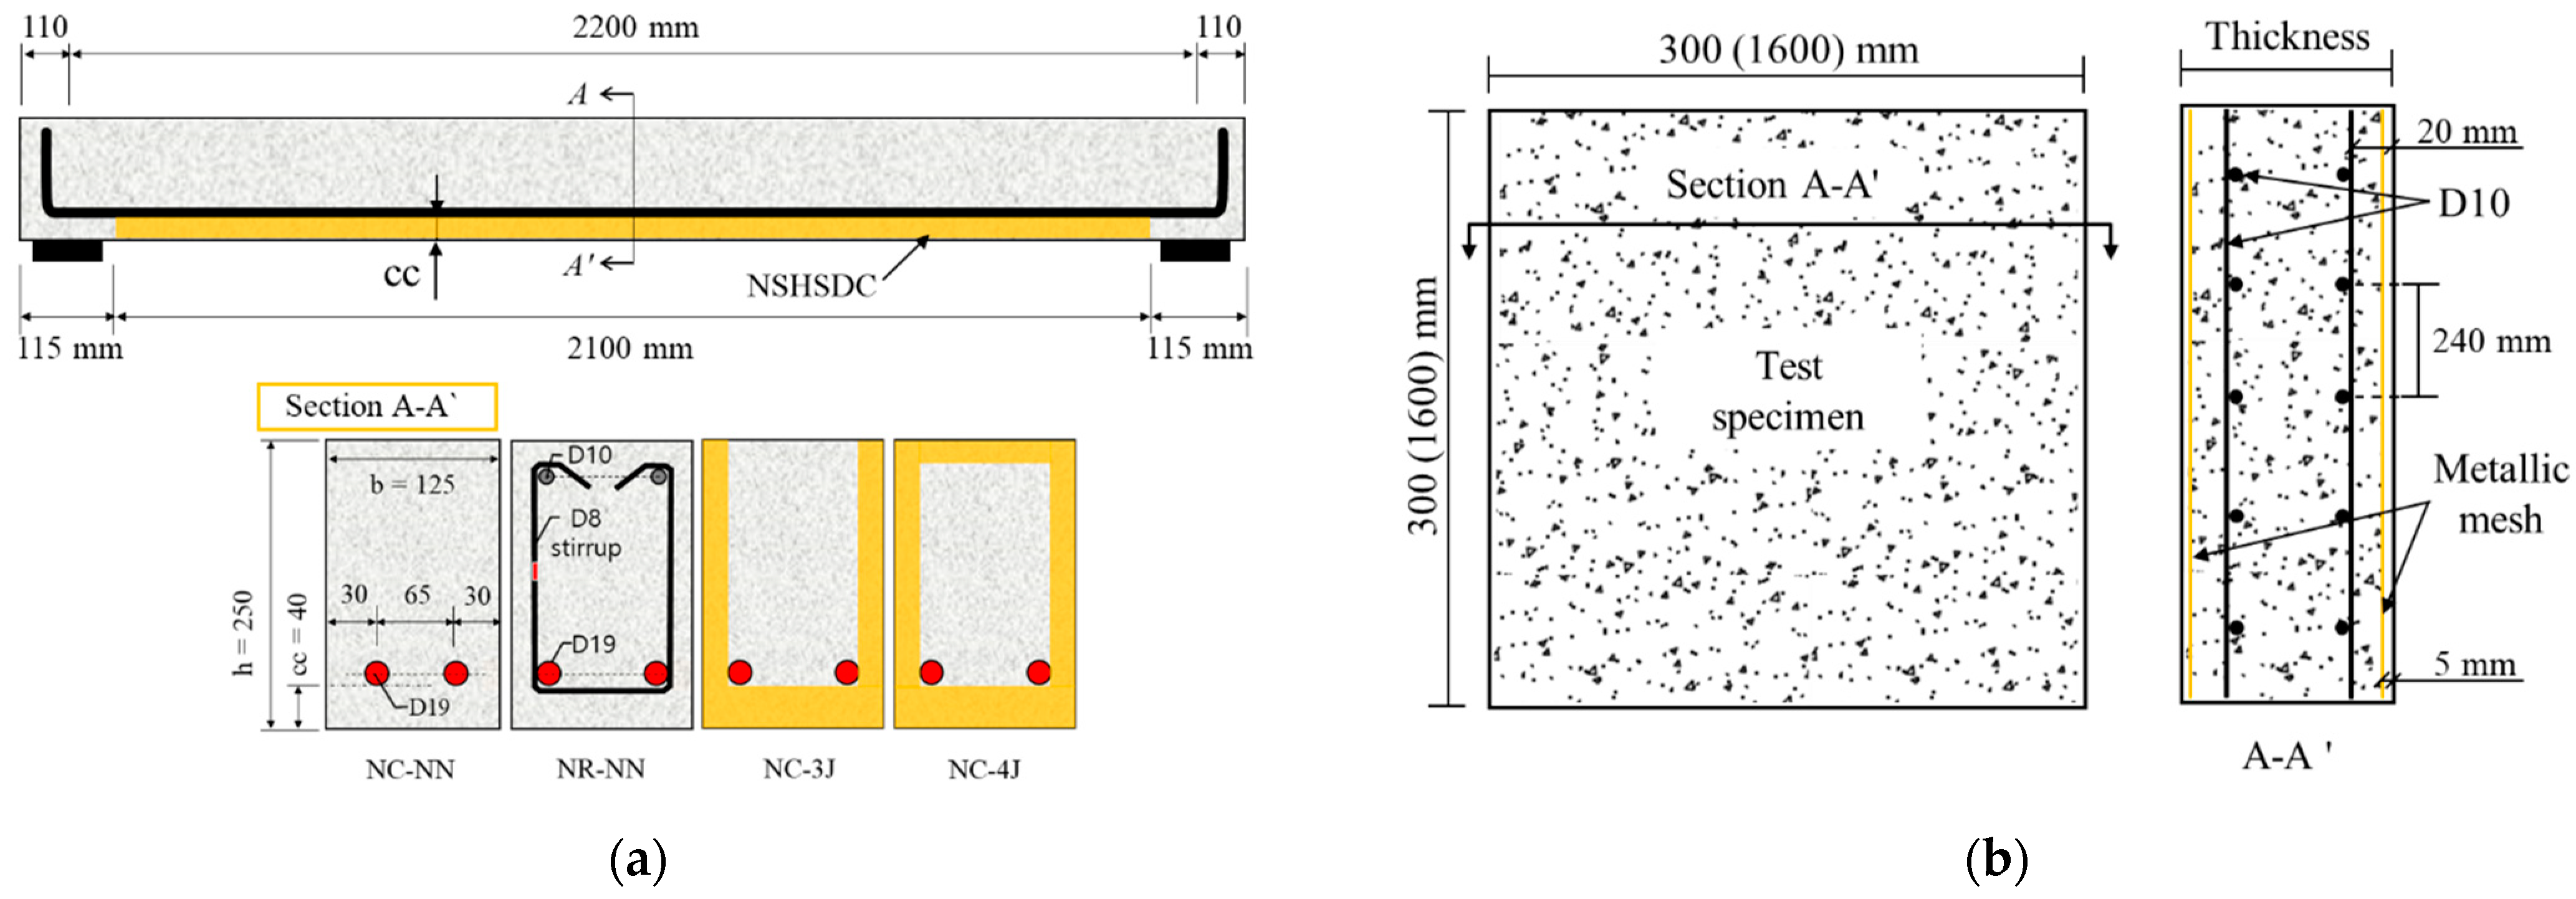
3.1.2. Specimen Details
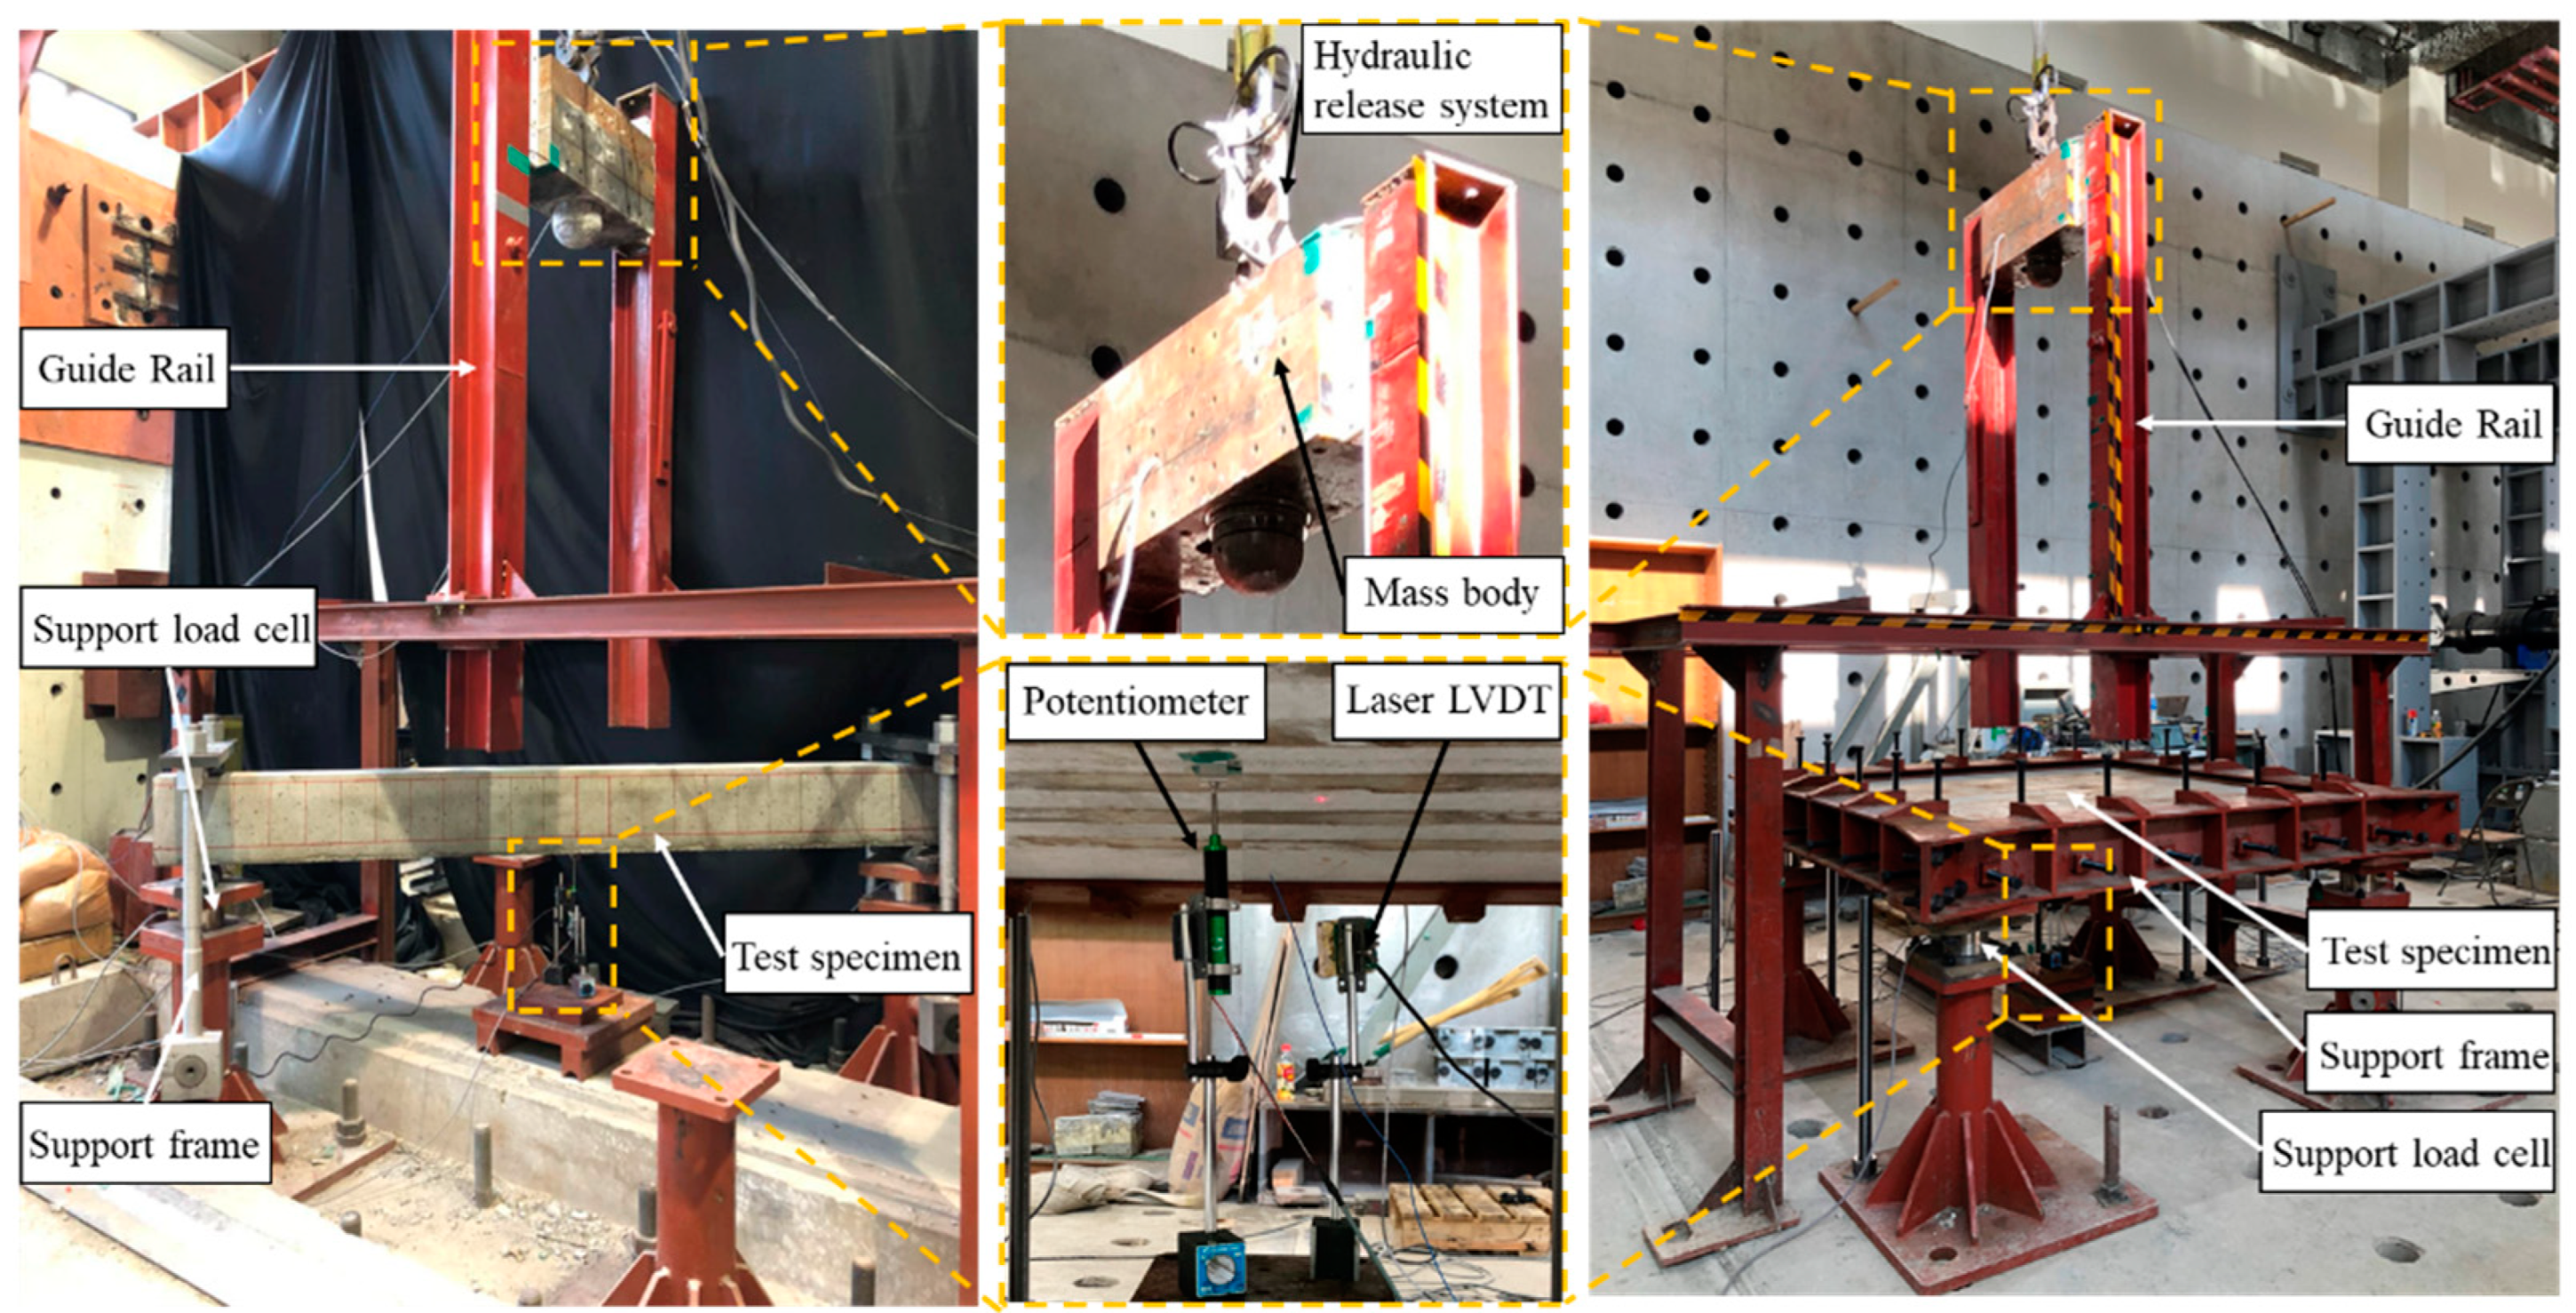
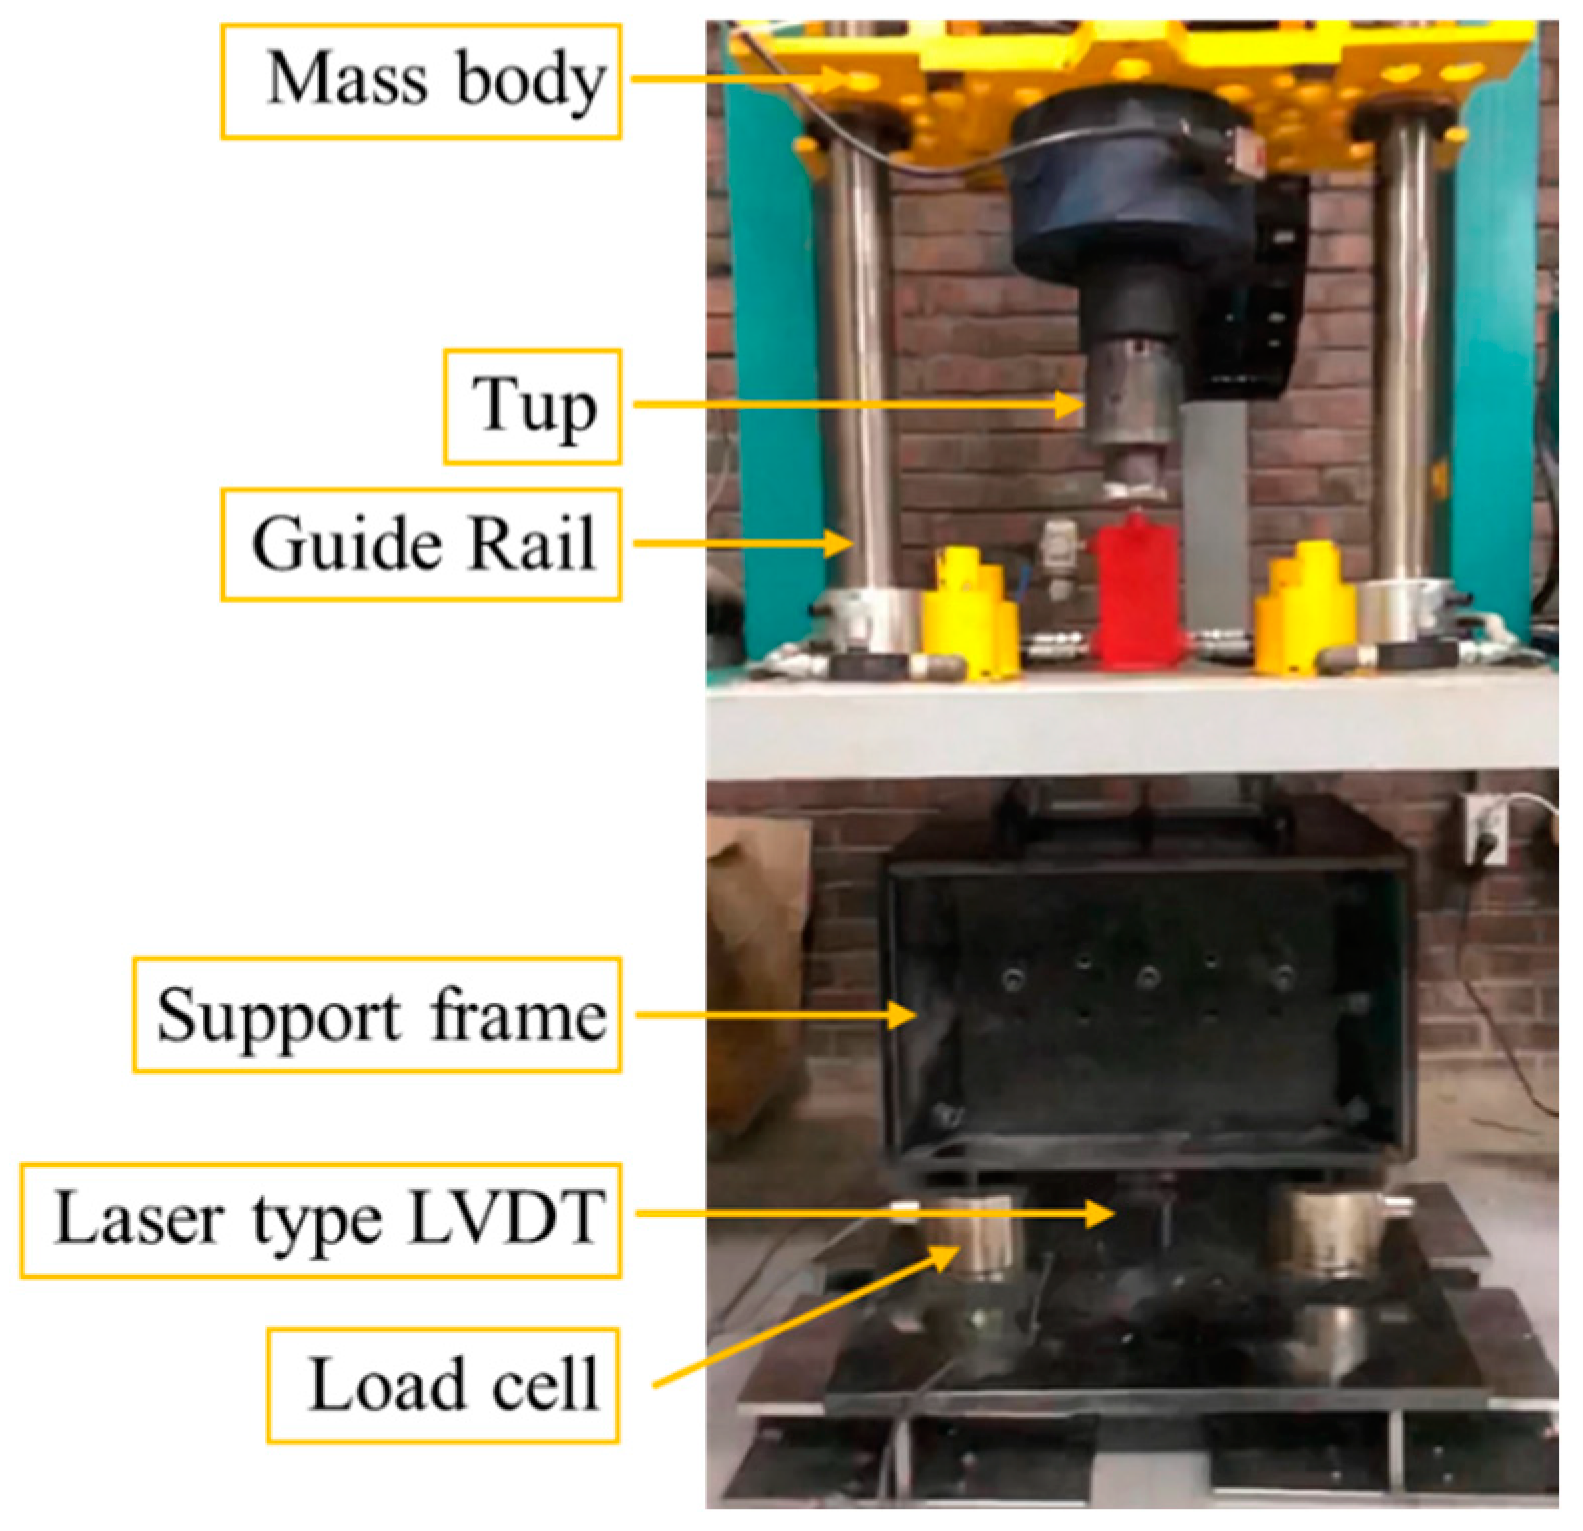
3.2. Test Setup
3.2.1. Impact Test
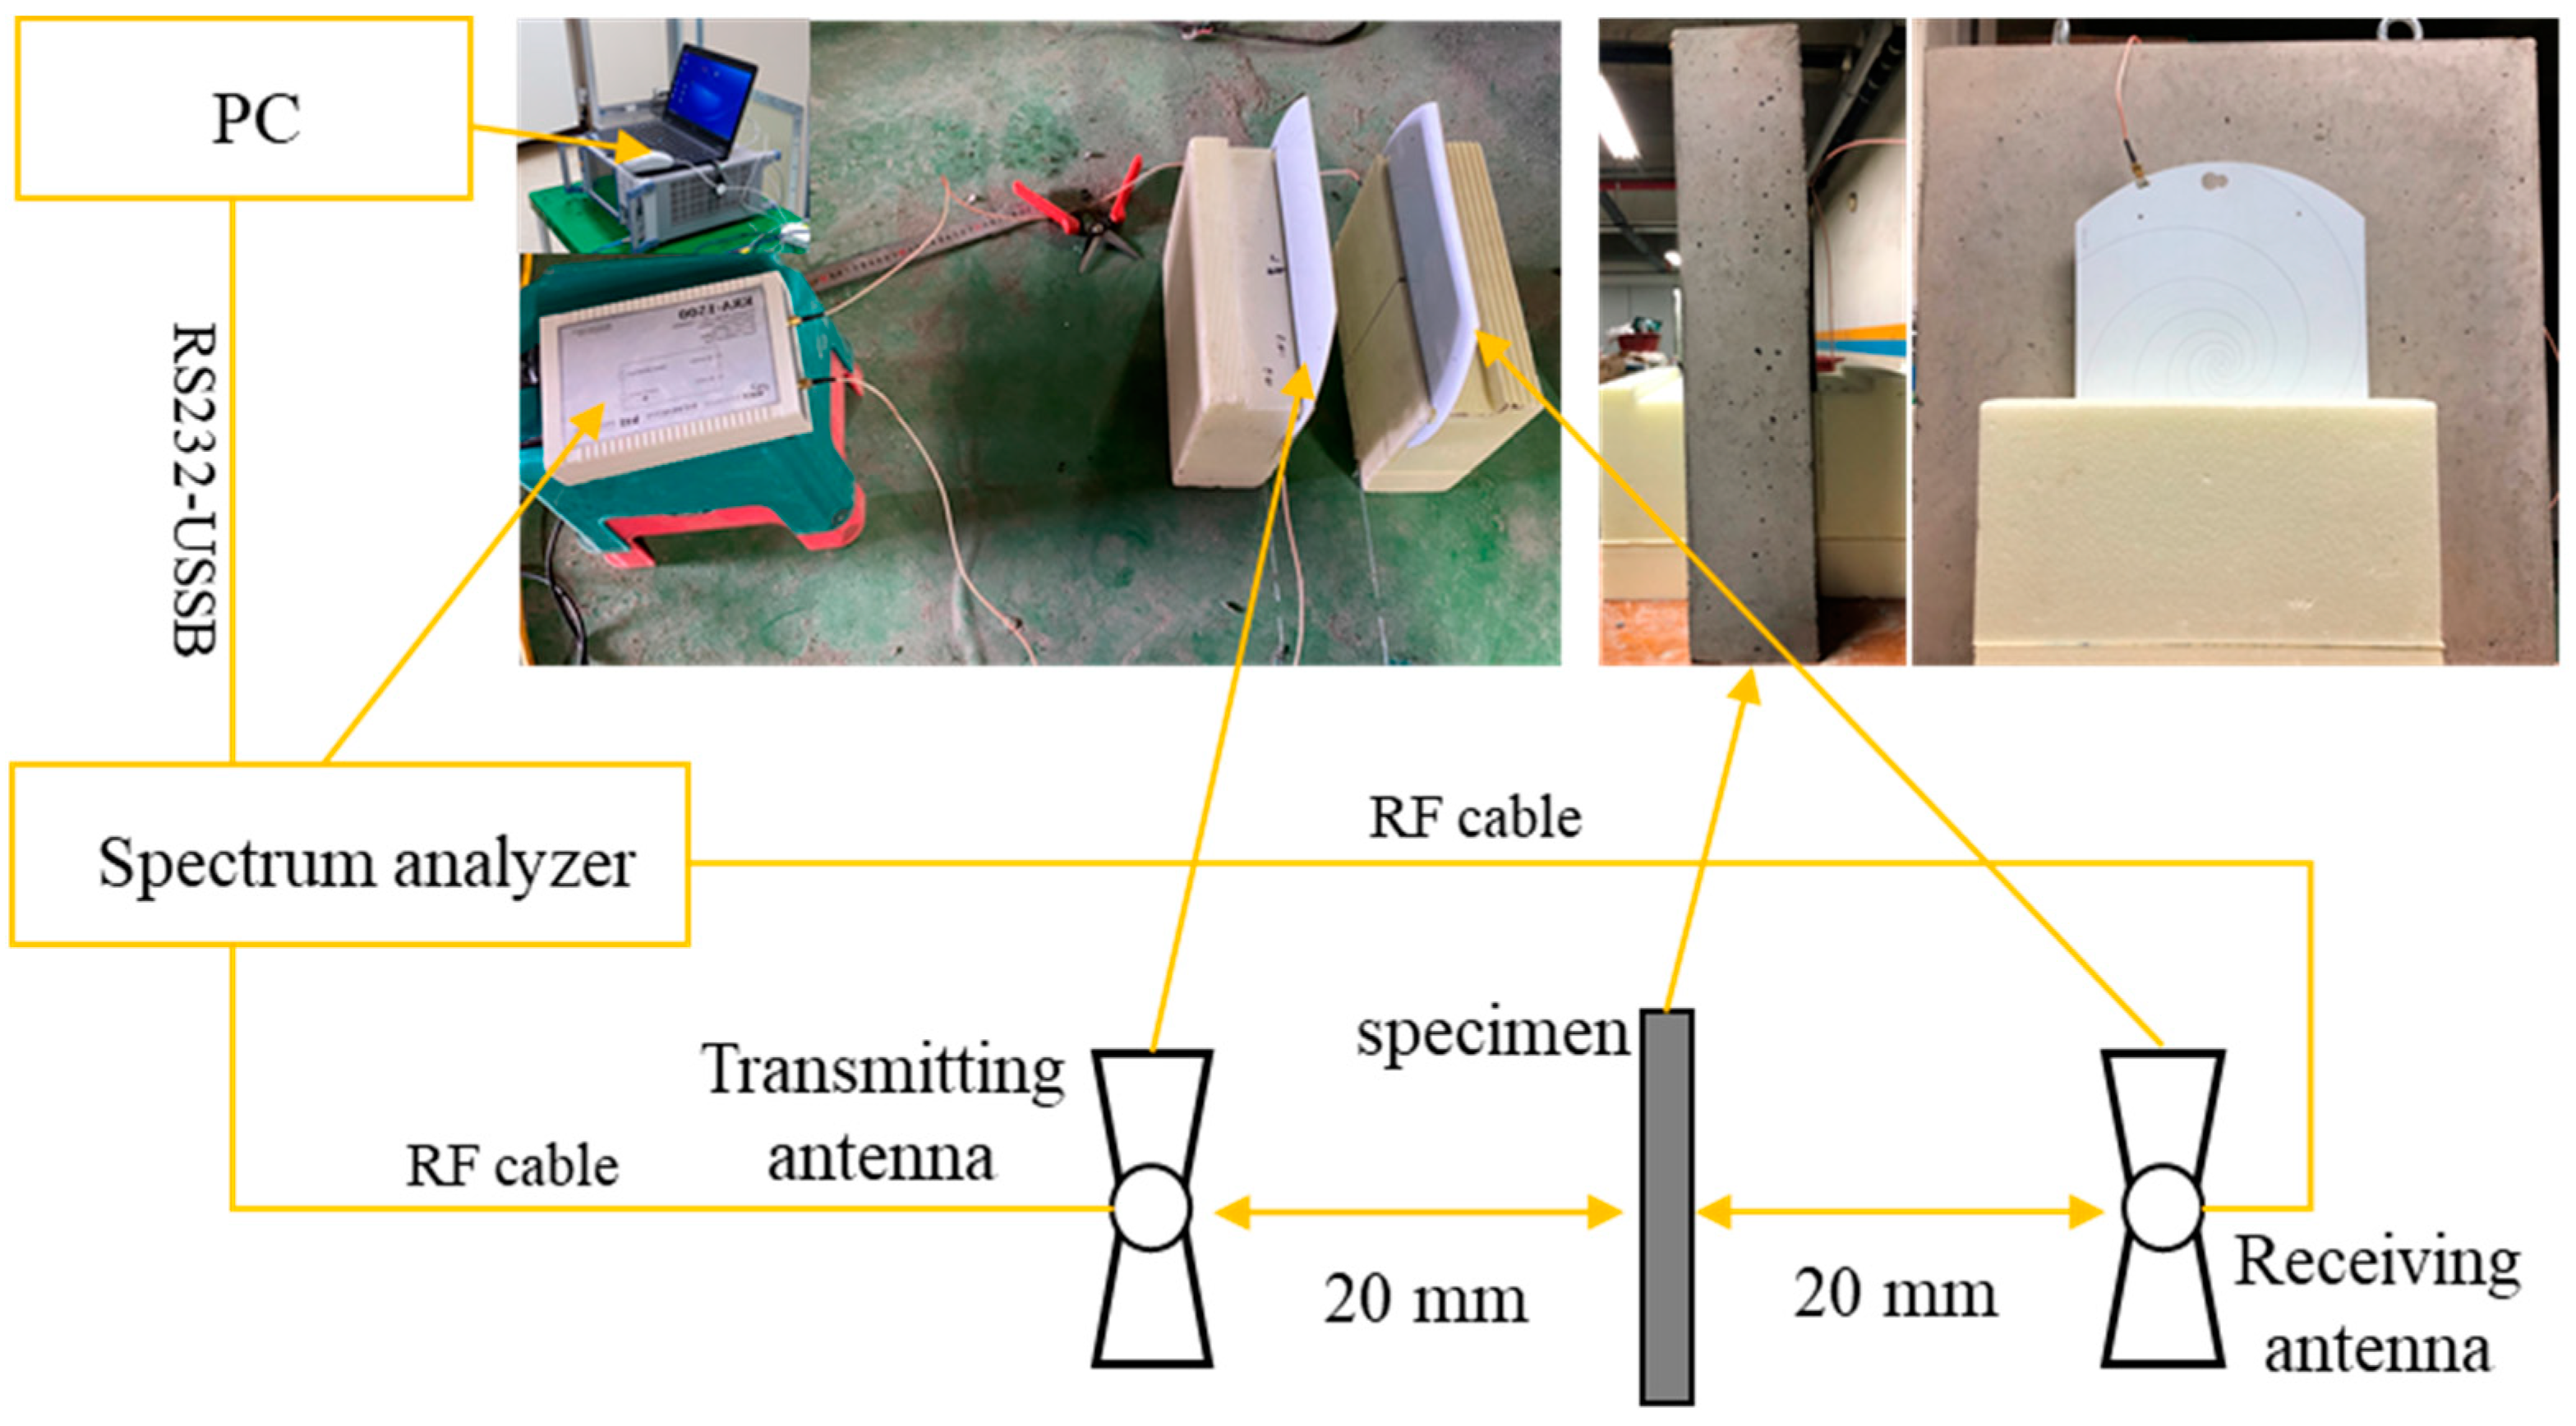
3.2.2. EMI Shielding Test
4. Results and Discussion
4.1. Scenario Based on the Location of the SIP
4.1.1. Scenario A
4.1.2. Scenario B
4.1.3. Scenario C
4.1.4. Scenario D
4.1.5. Scenario E
4.1.6. Scenario F
4.2. Improvement Method for Evacuation
4.3. Performance of Test Beams with Different Strengthening Methods
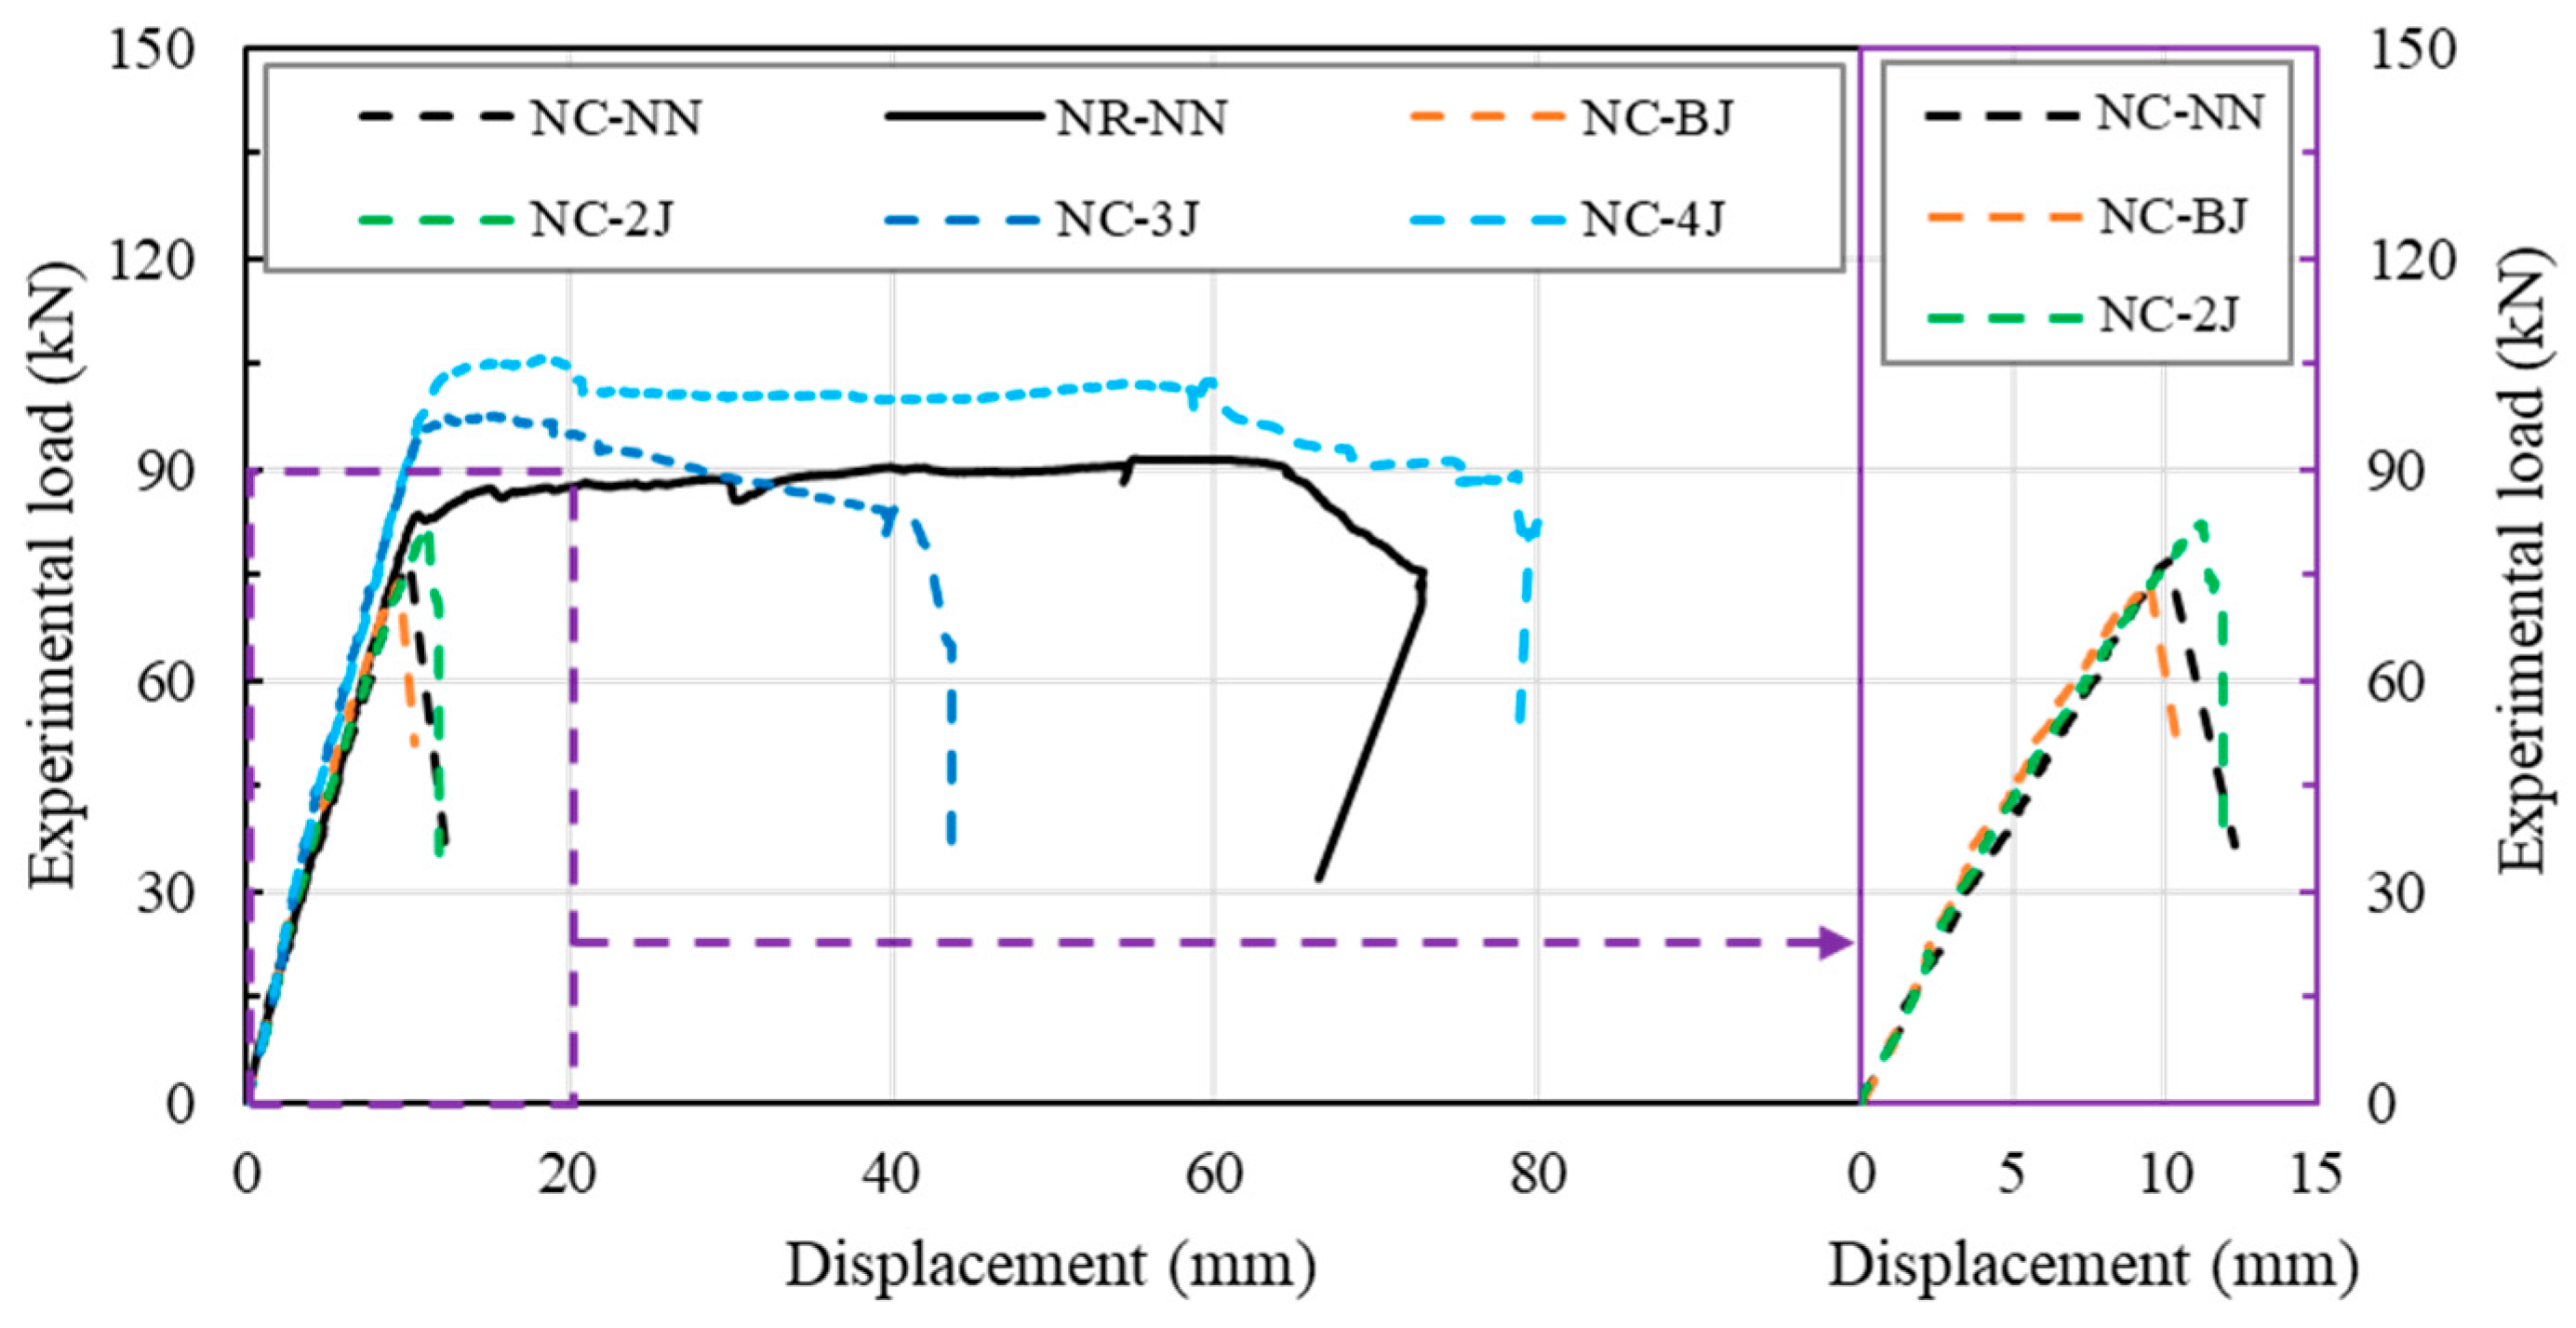
4.3.1. Static Loading Resistance Capacity of Beams
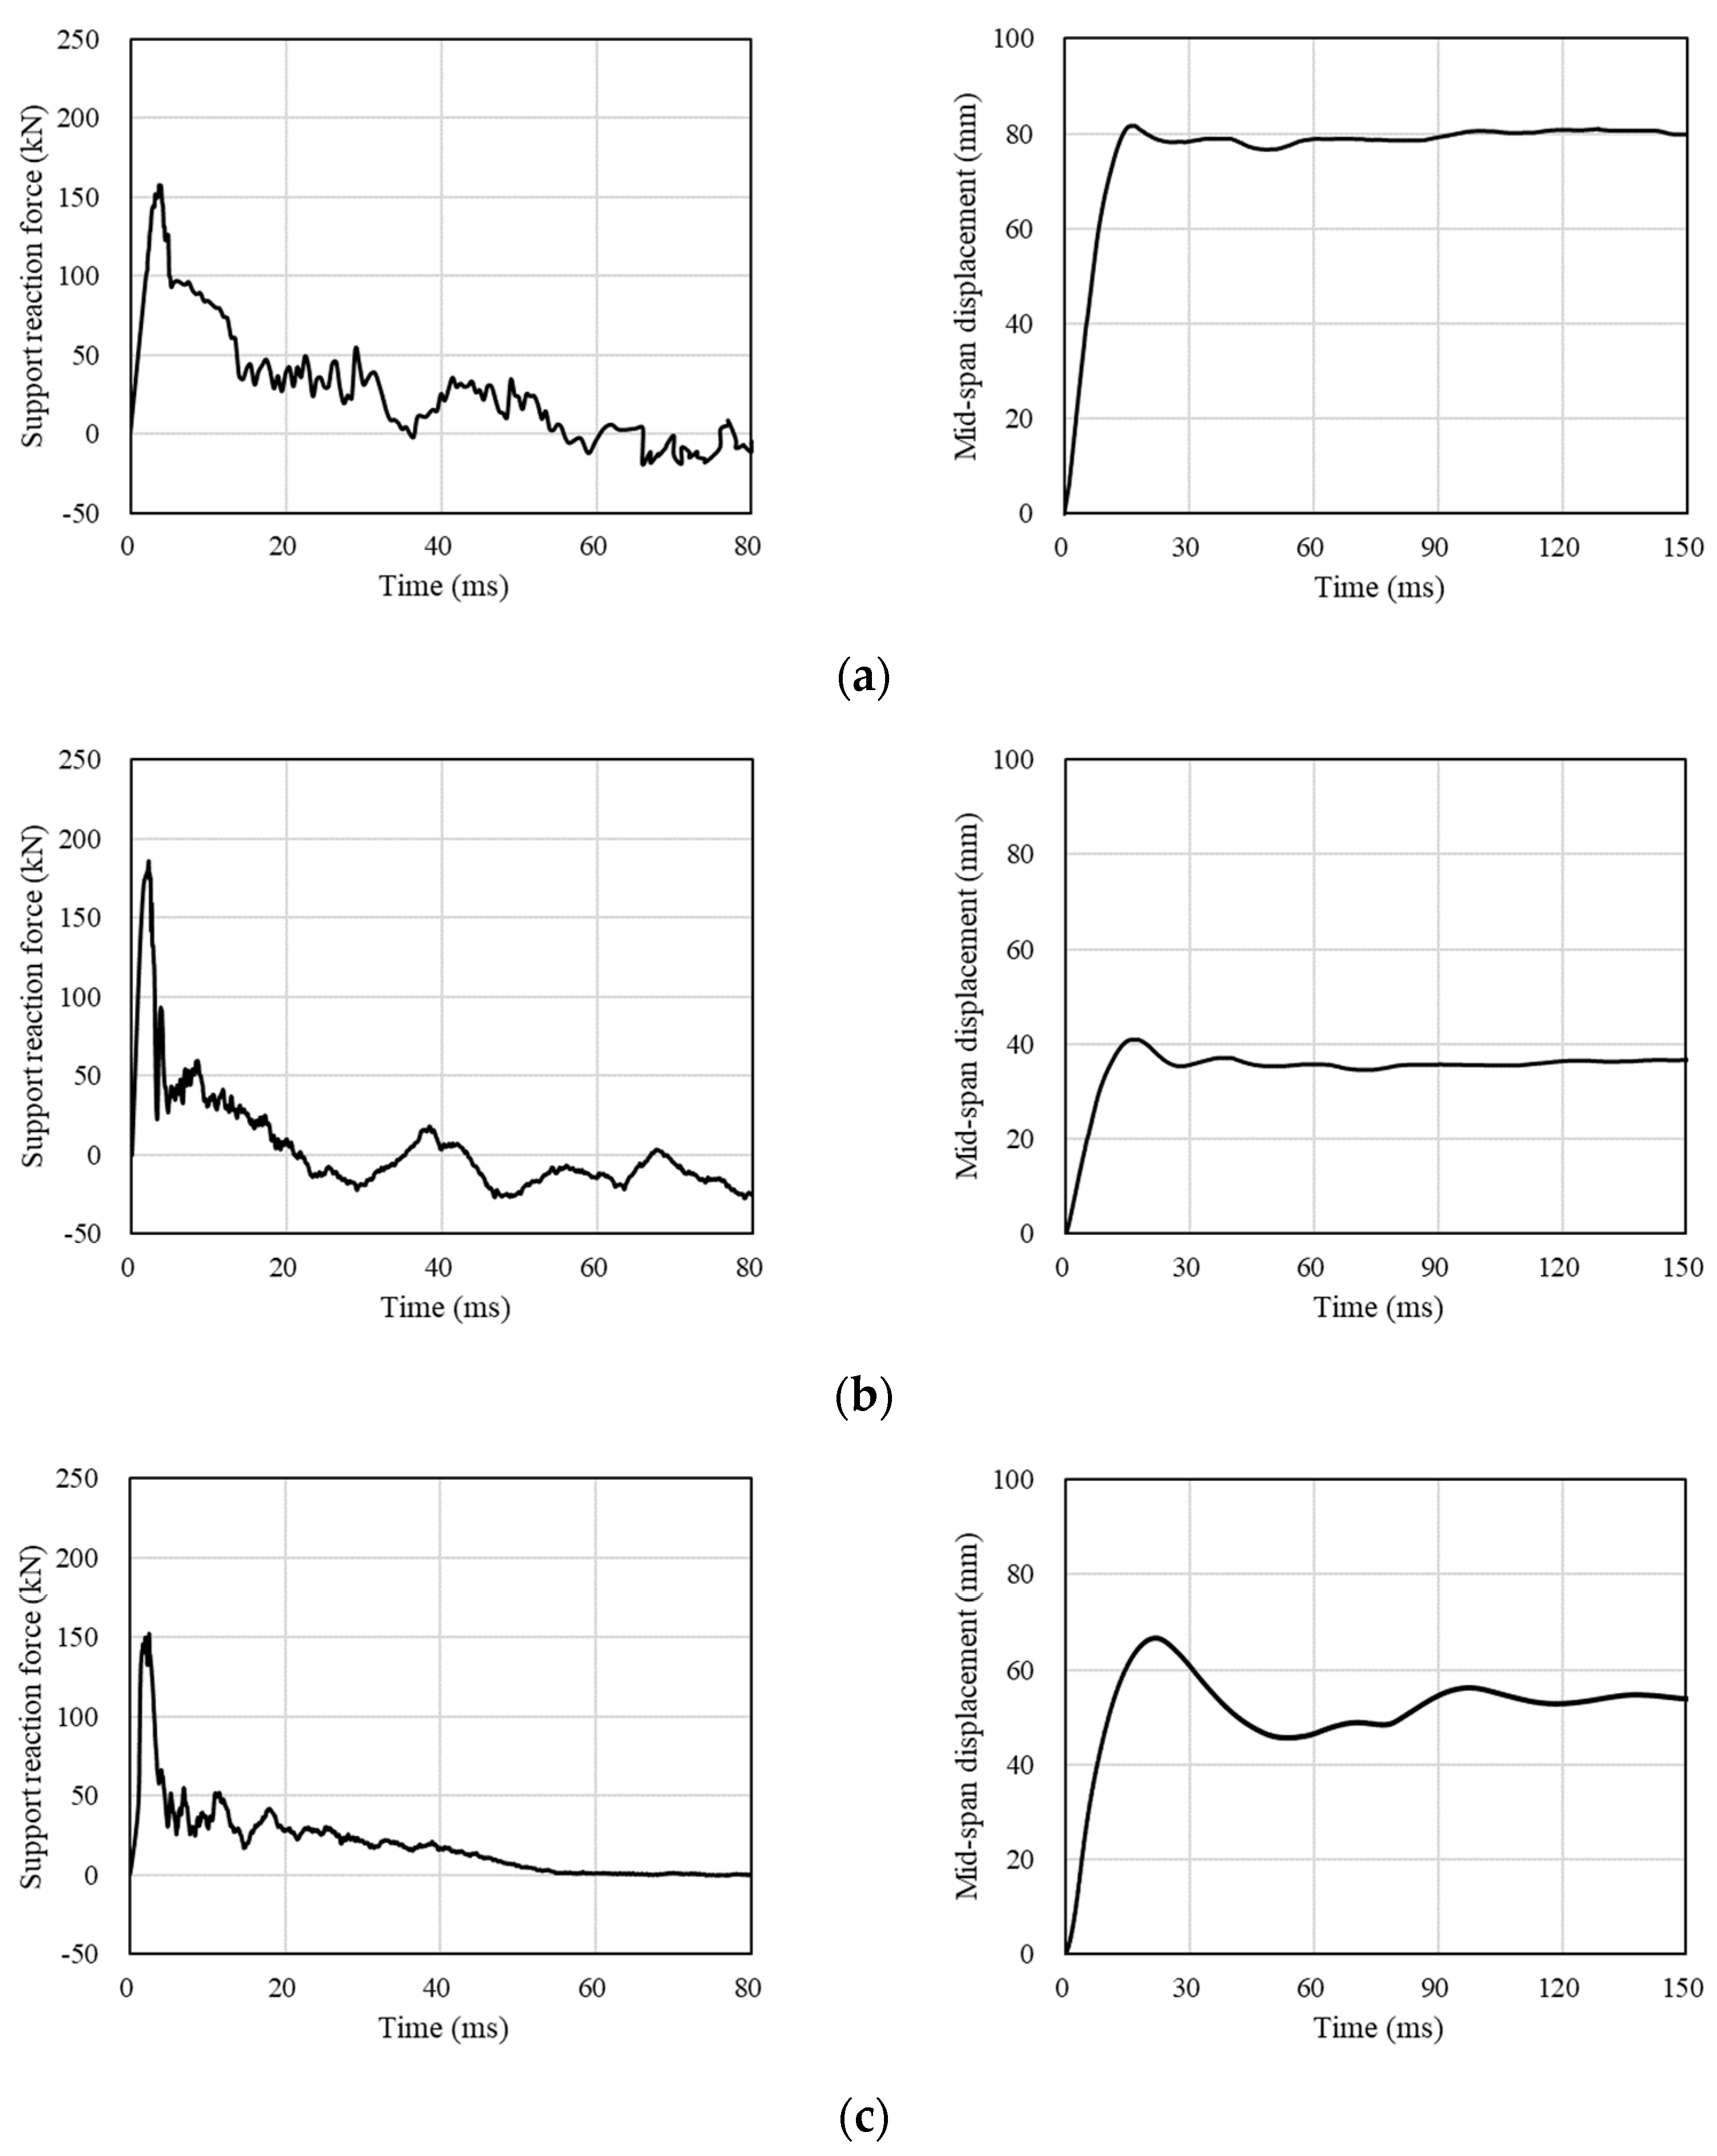
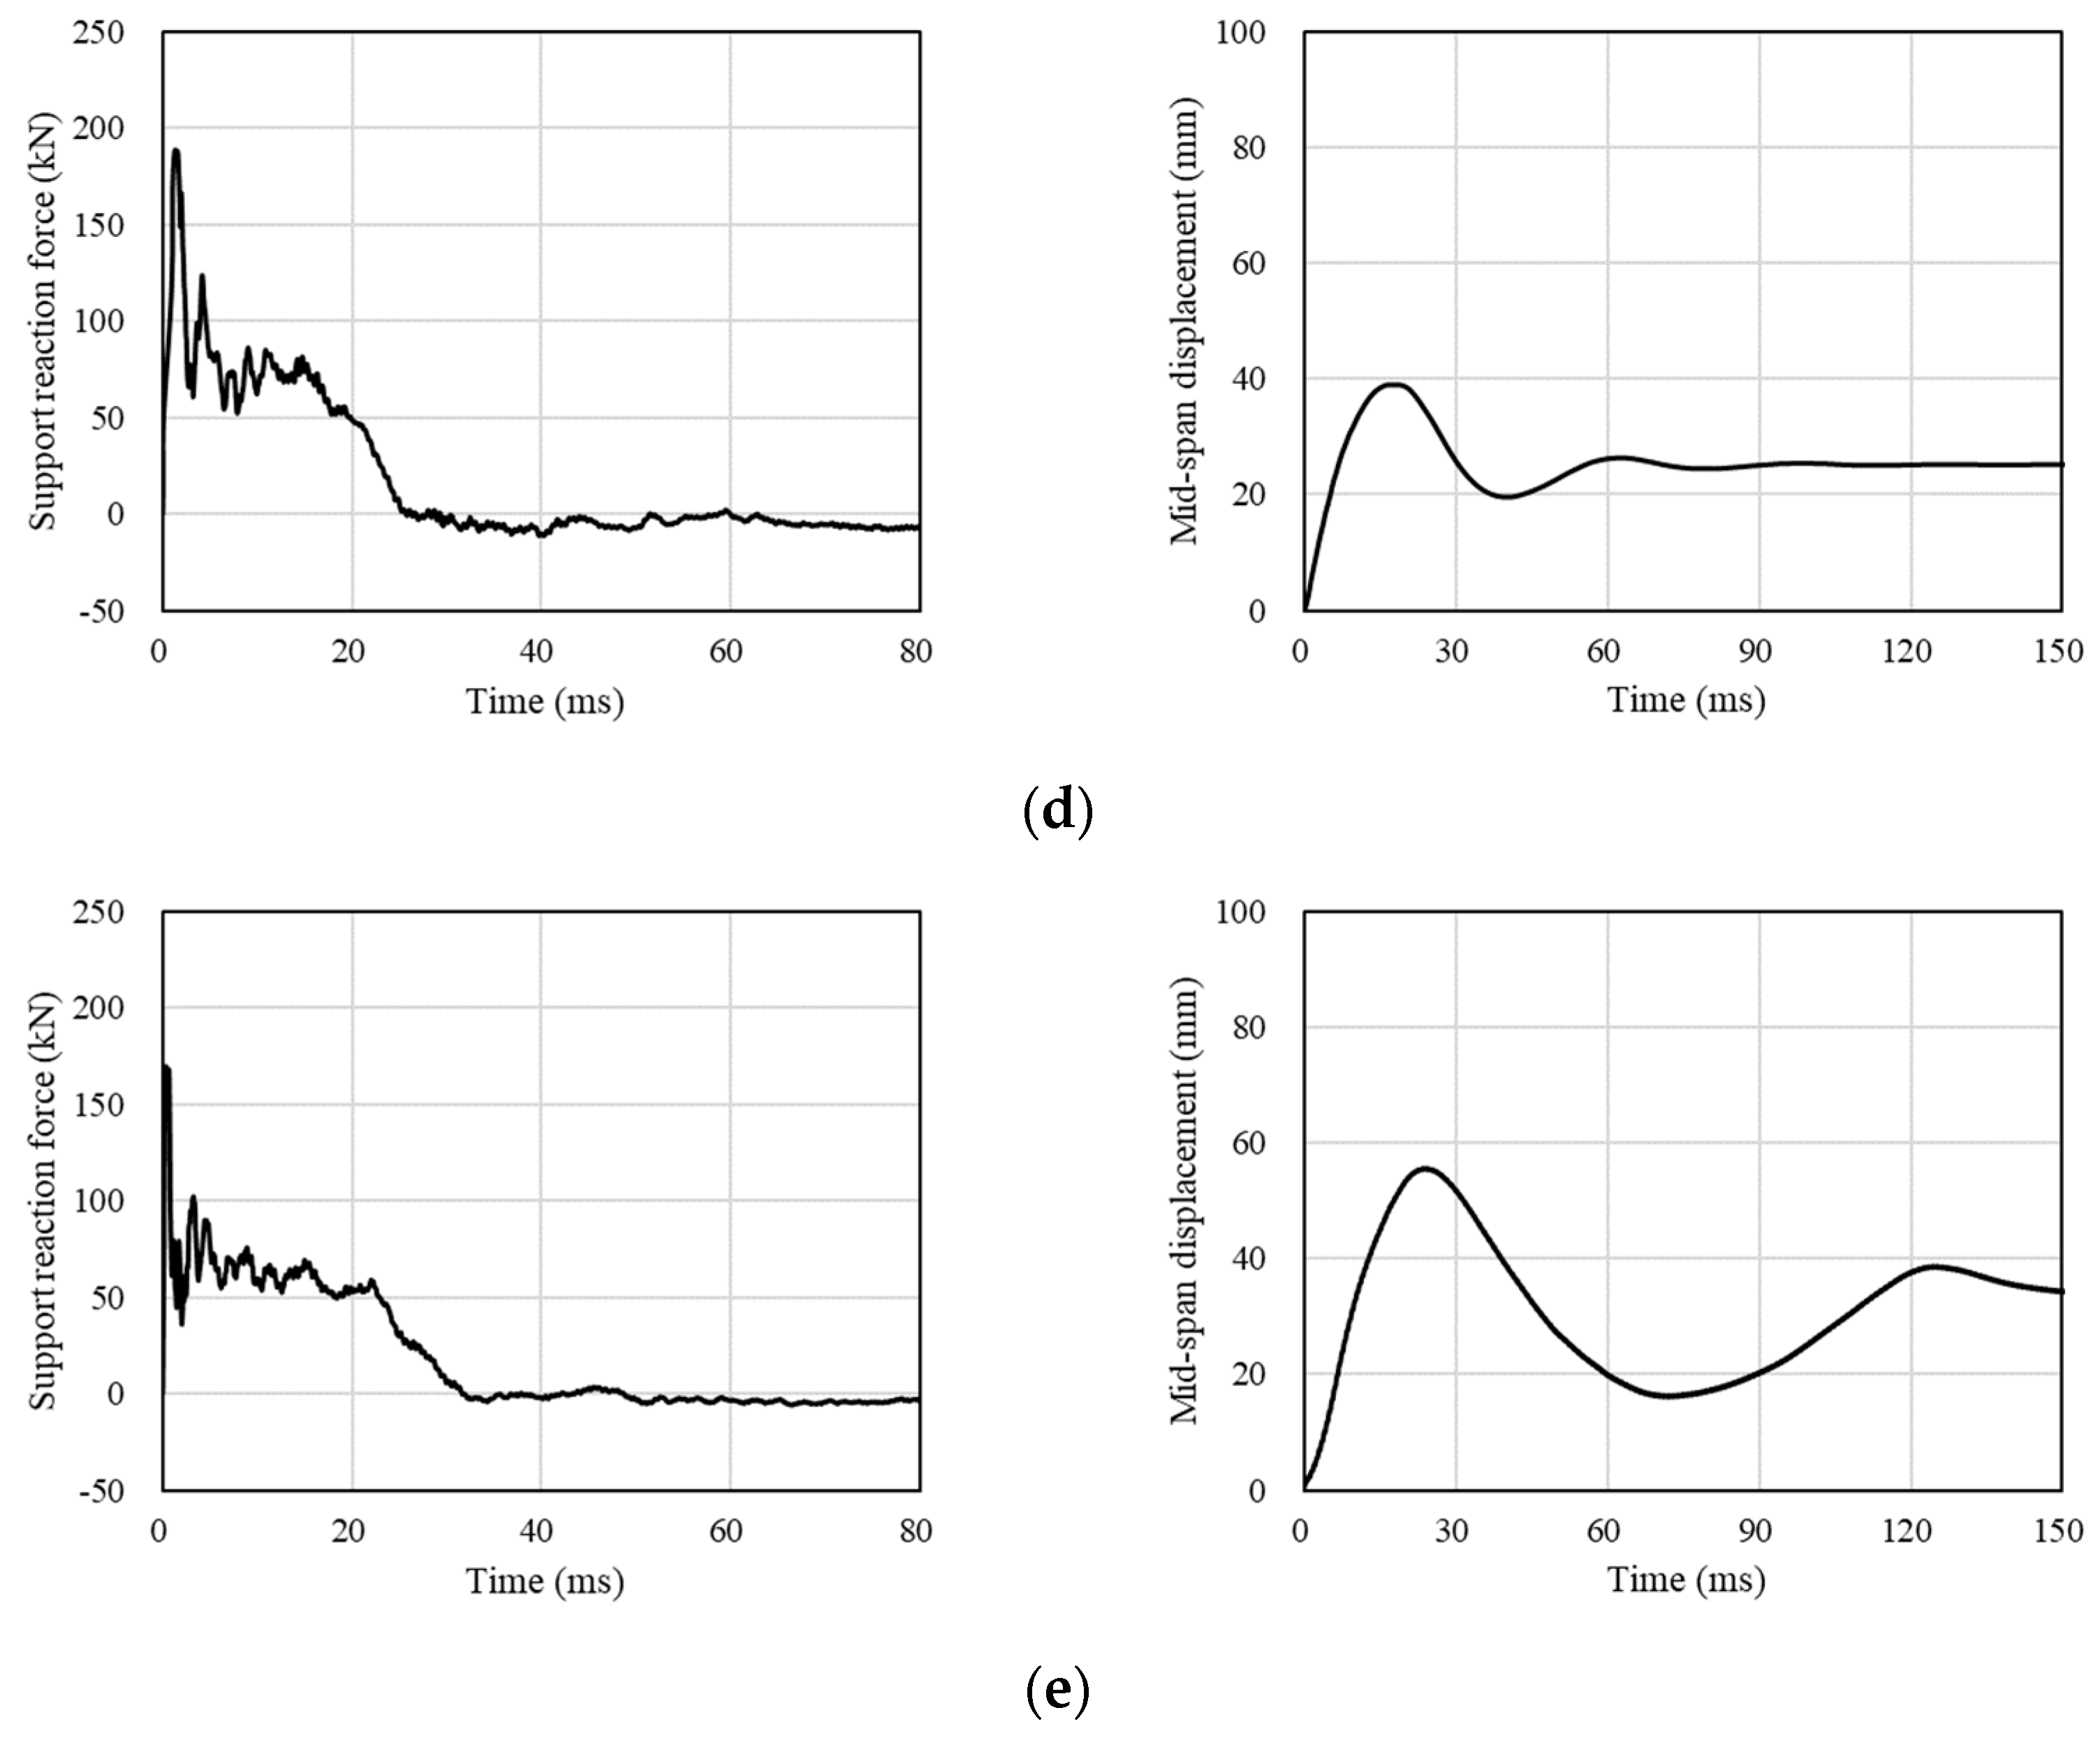
4.3.2. Drop-Weight Impact Resistance Capacity of Beams
4.4. Performance of Test Wall with Different Strengthening Method
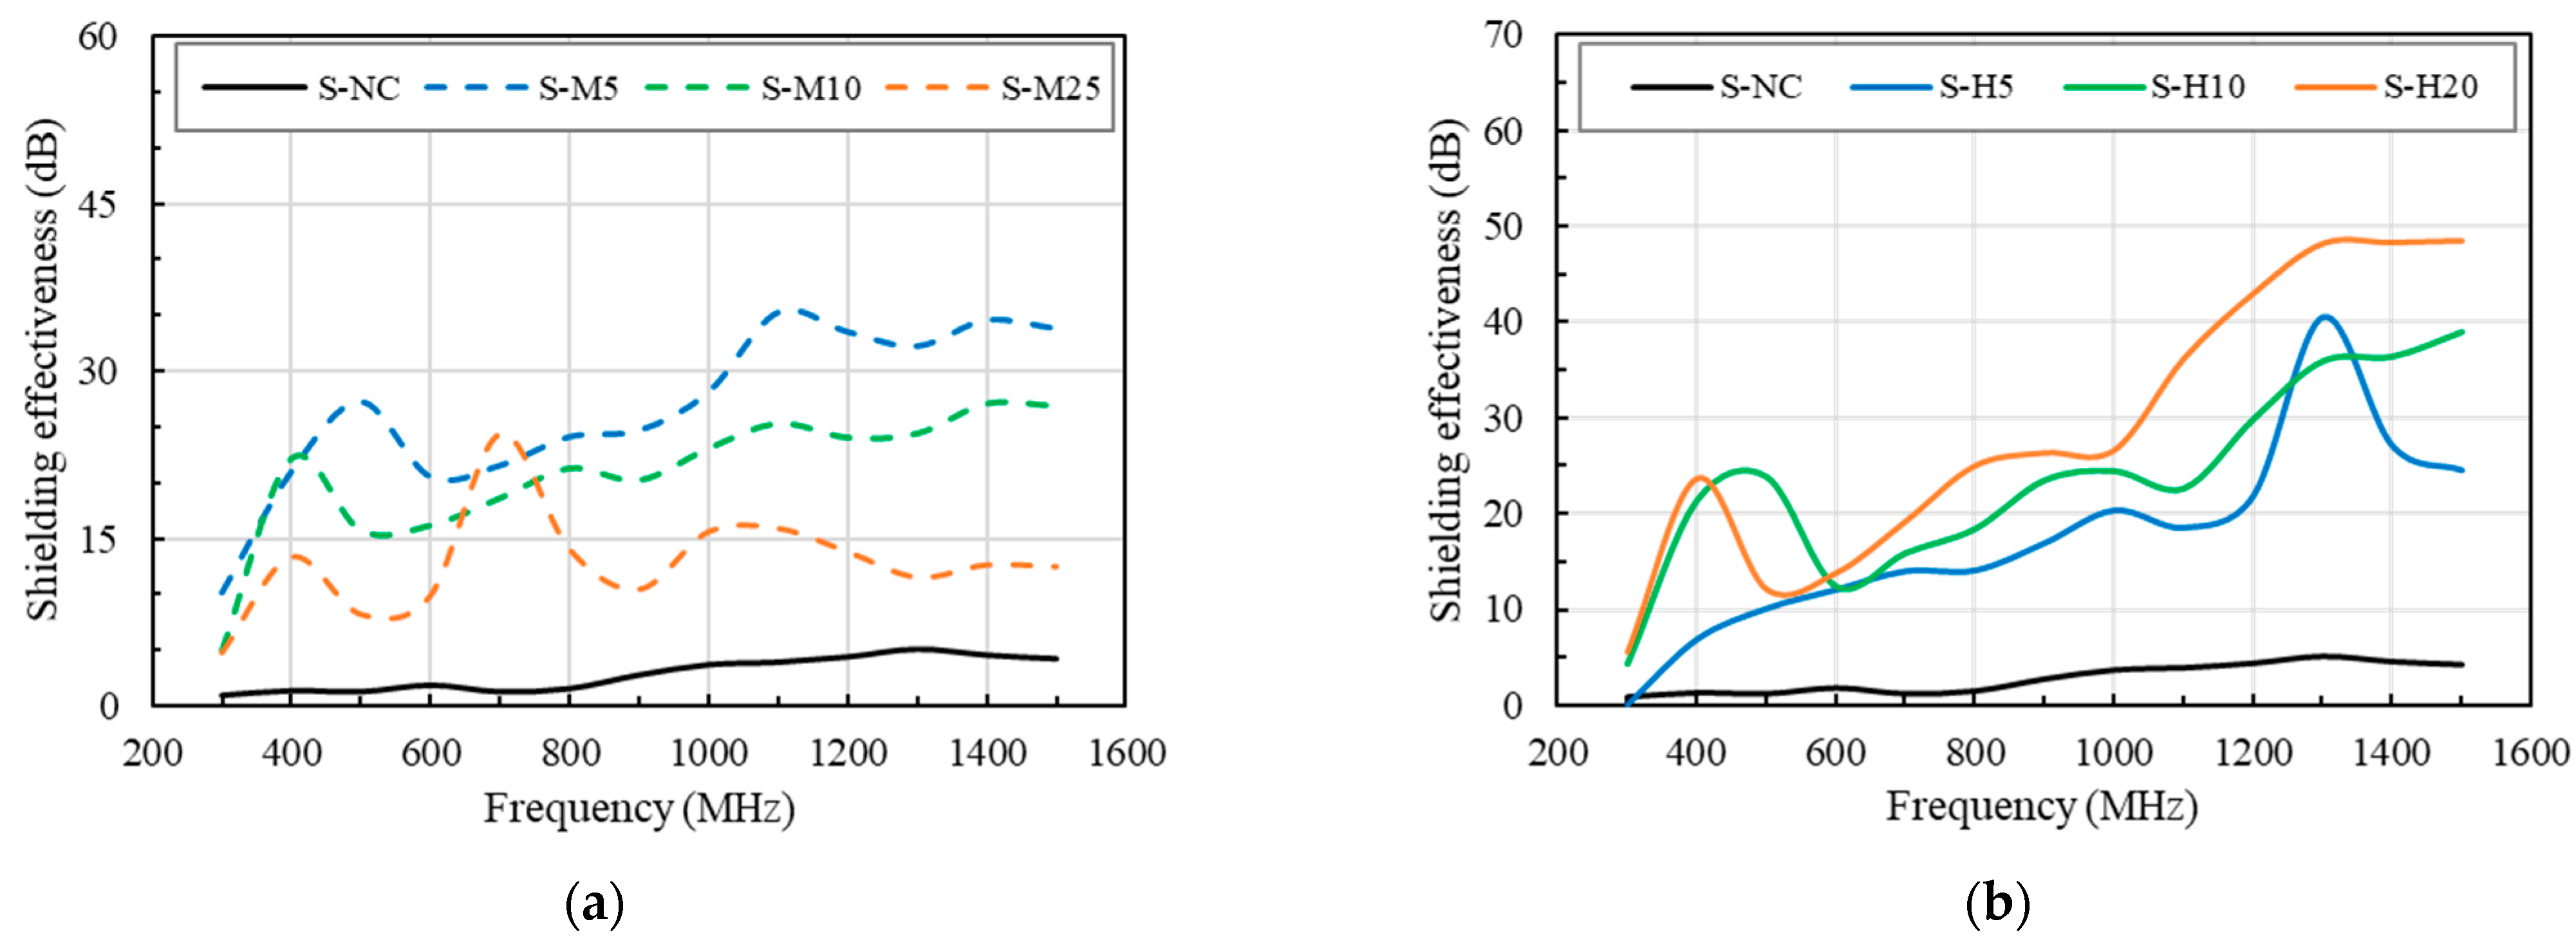
4.4.1. Shielding Effectiveness of Specimens before Damage
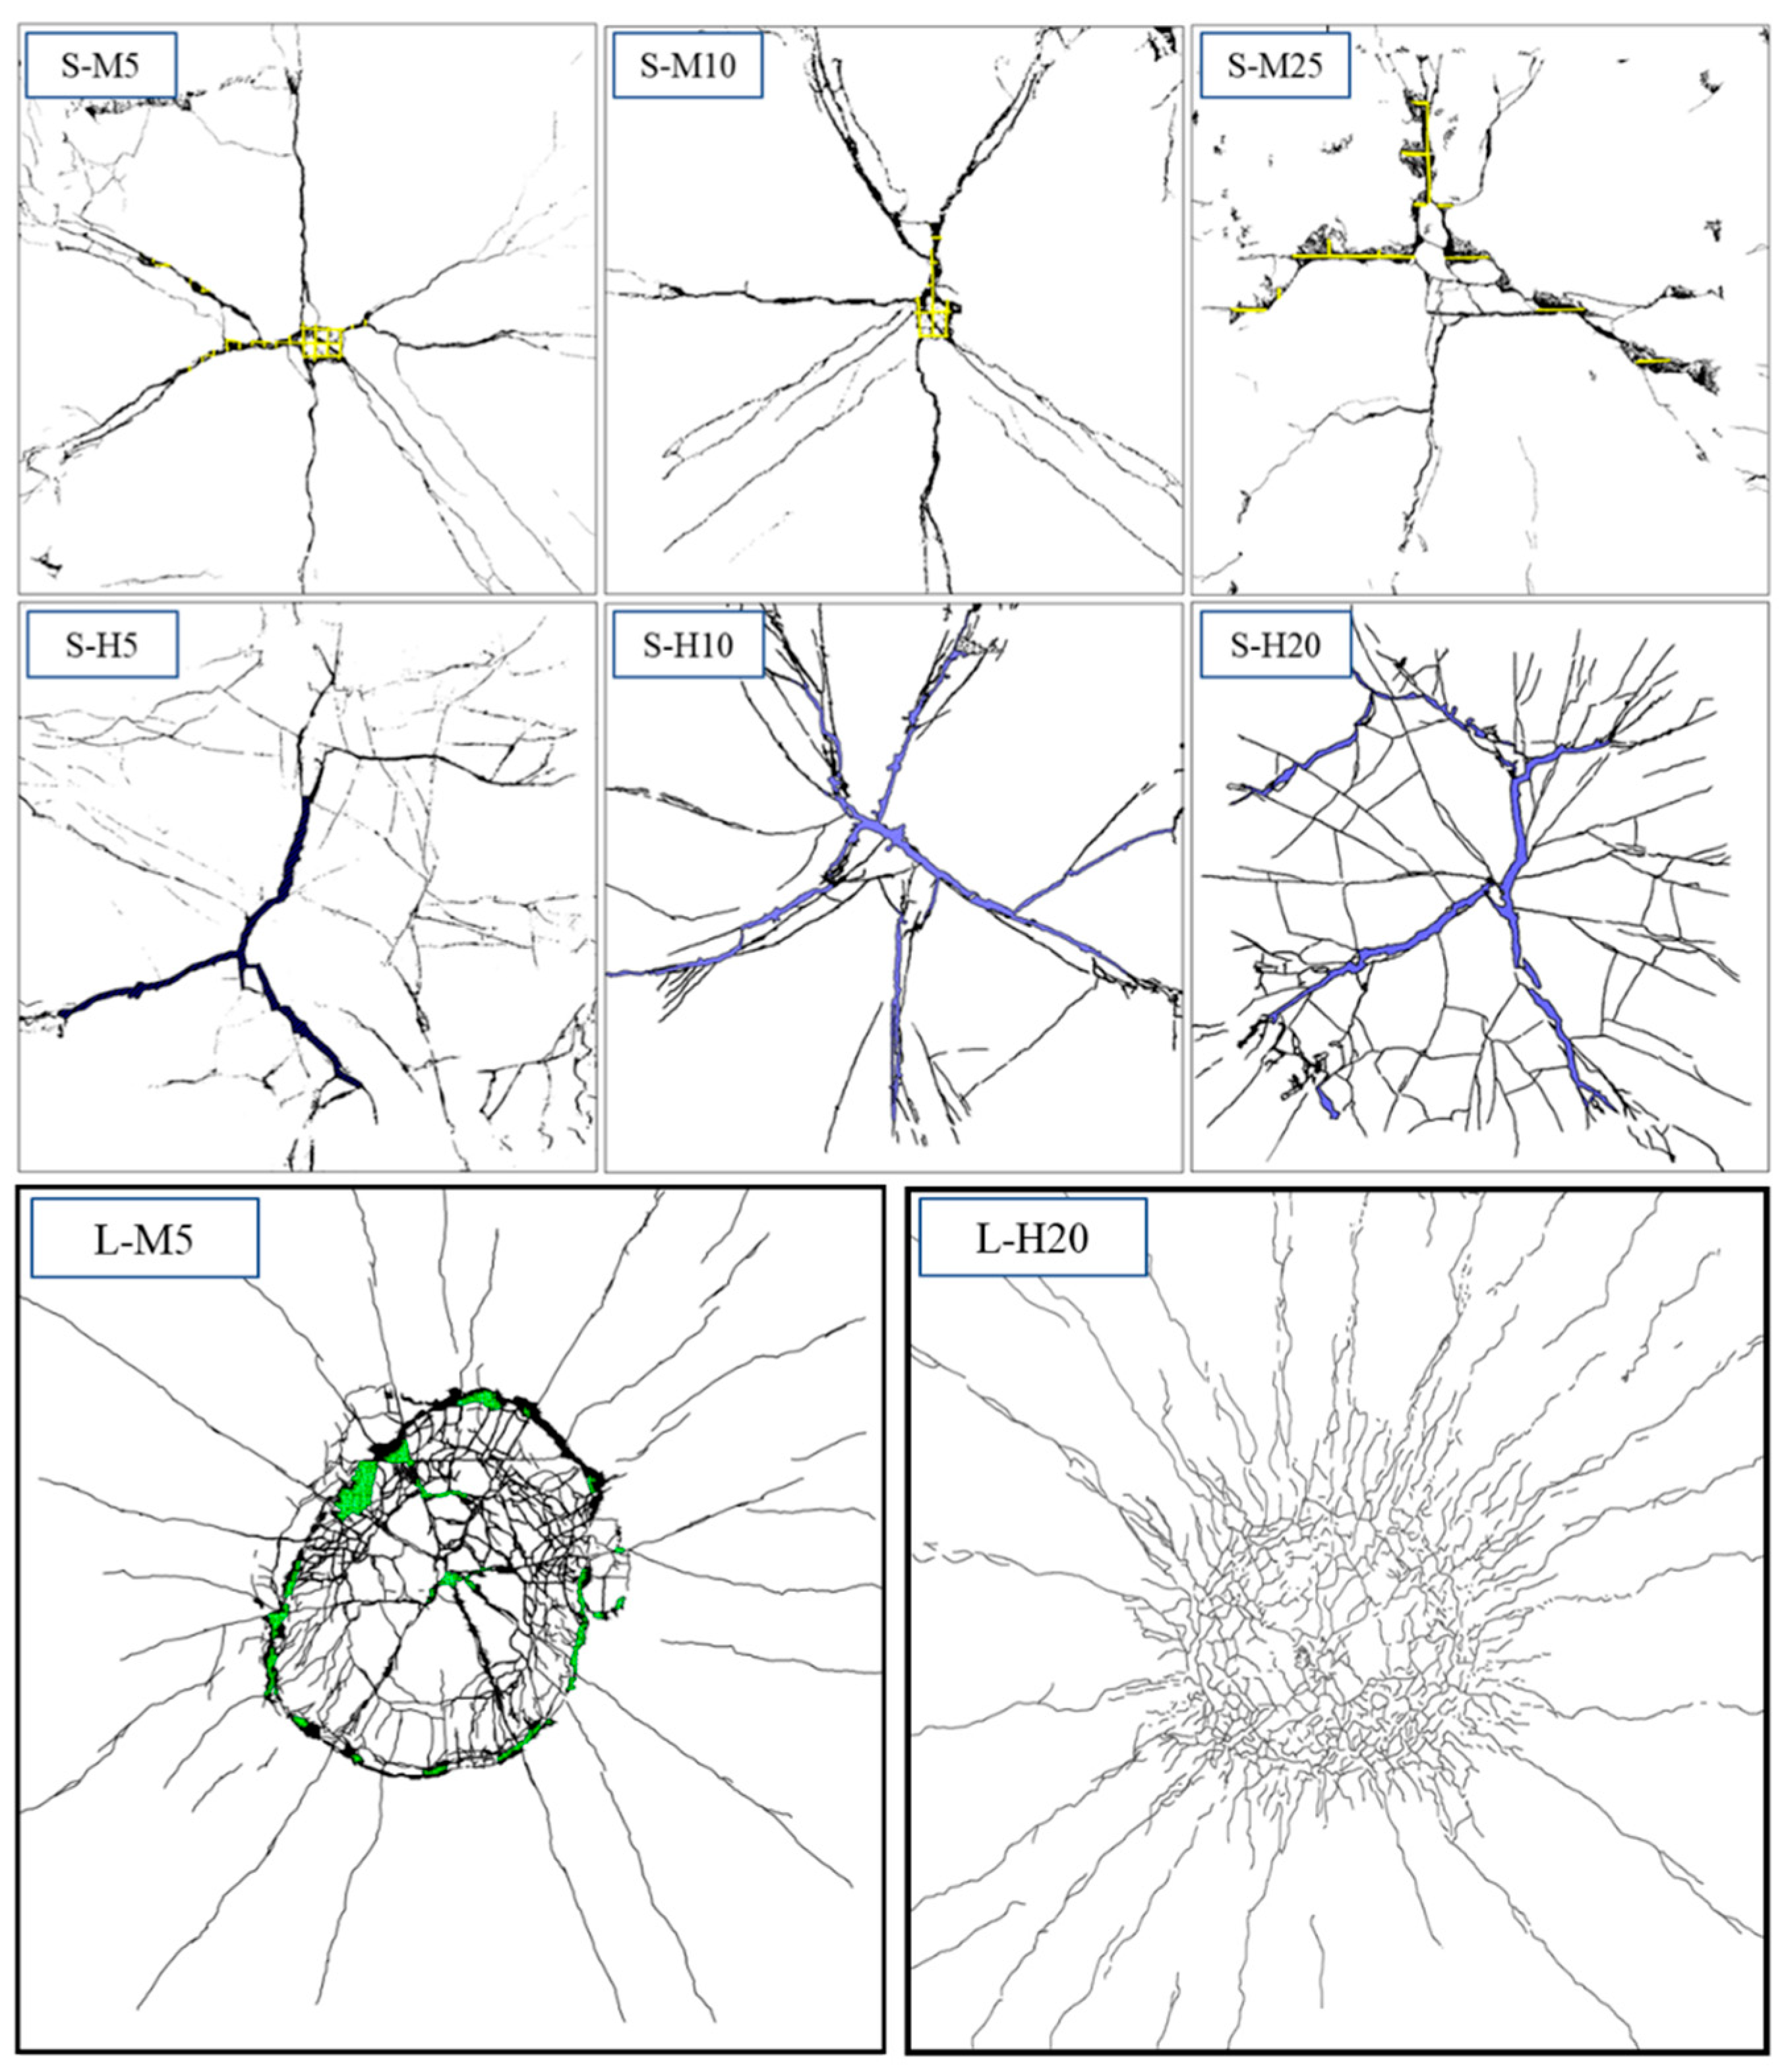
4.4.2. Drop-Weight Impact Resistance Capacity of Walls
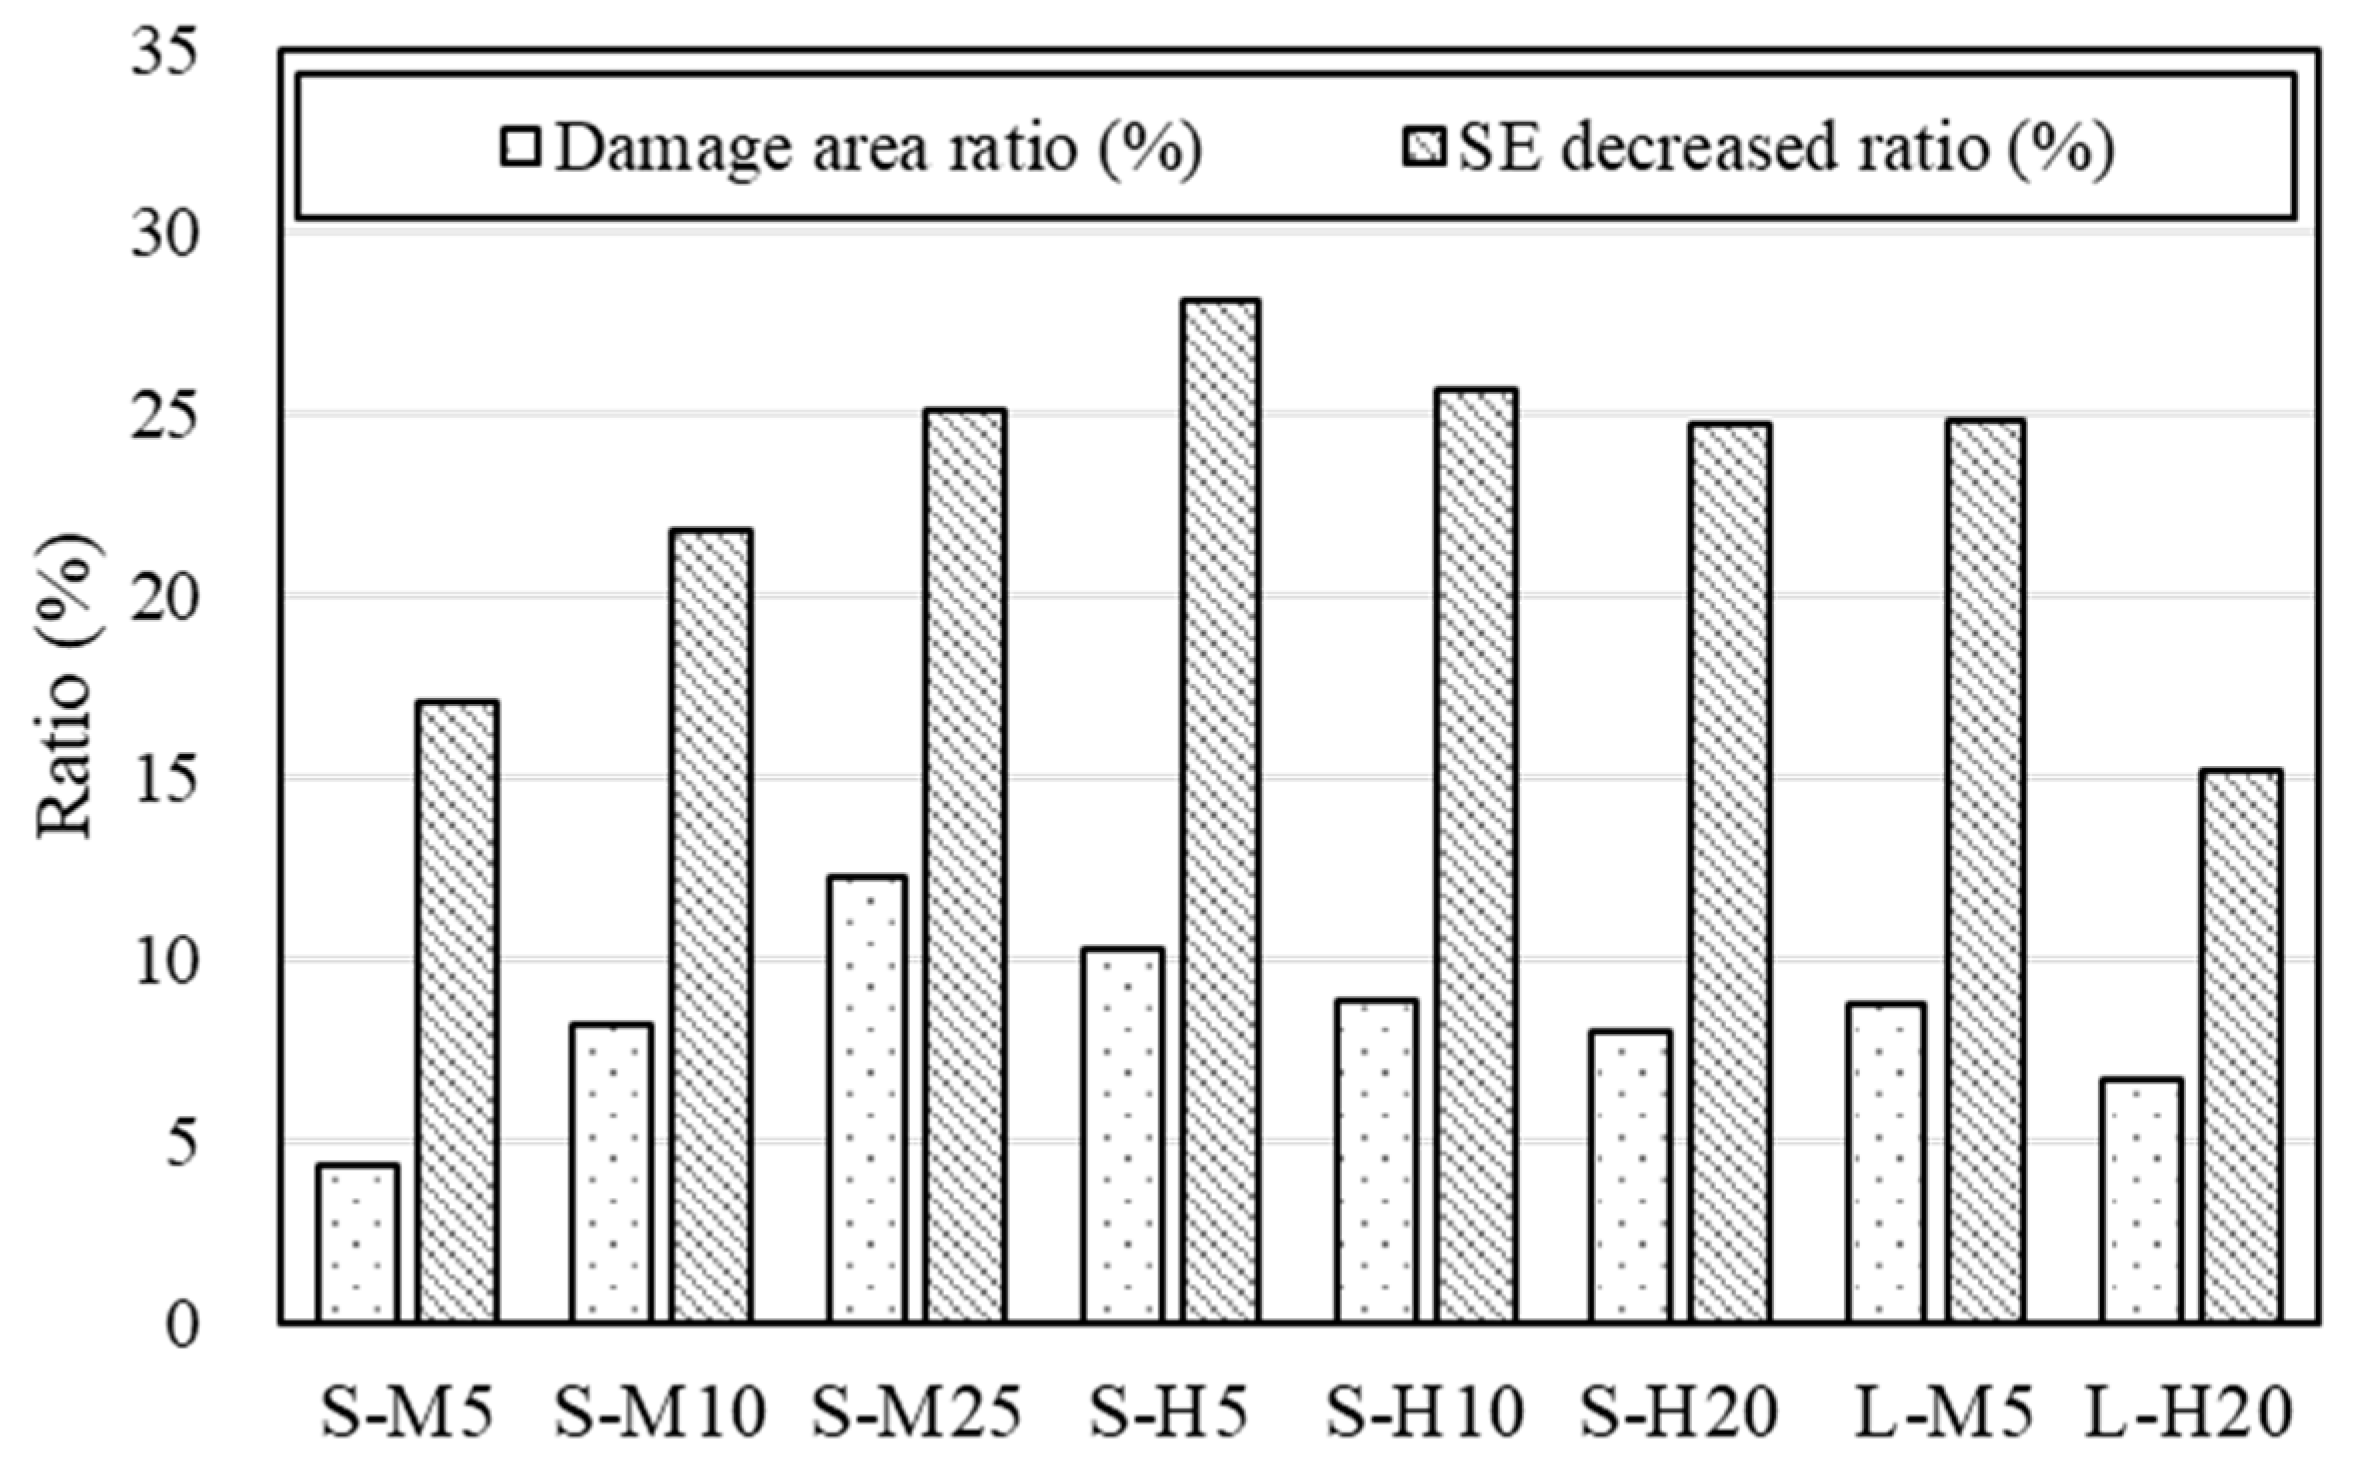
4.4.3. Shielding Effectiveness of Specimens after Damage
5. Concluding Remarks
- (1).
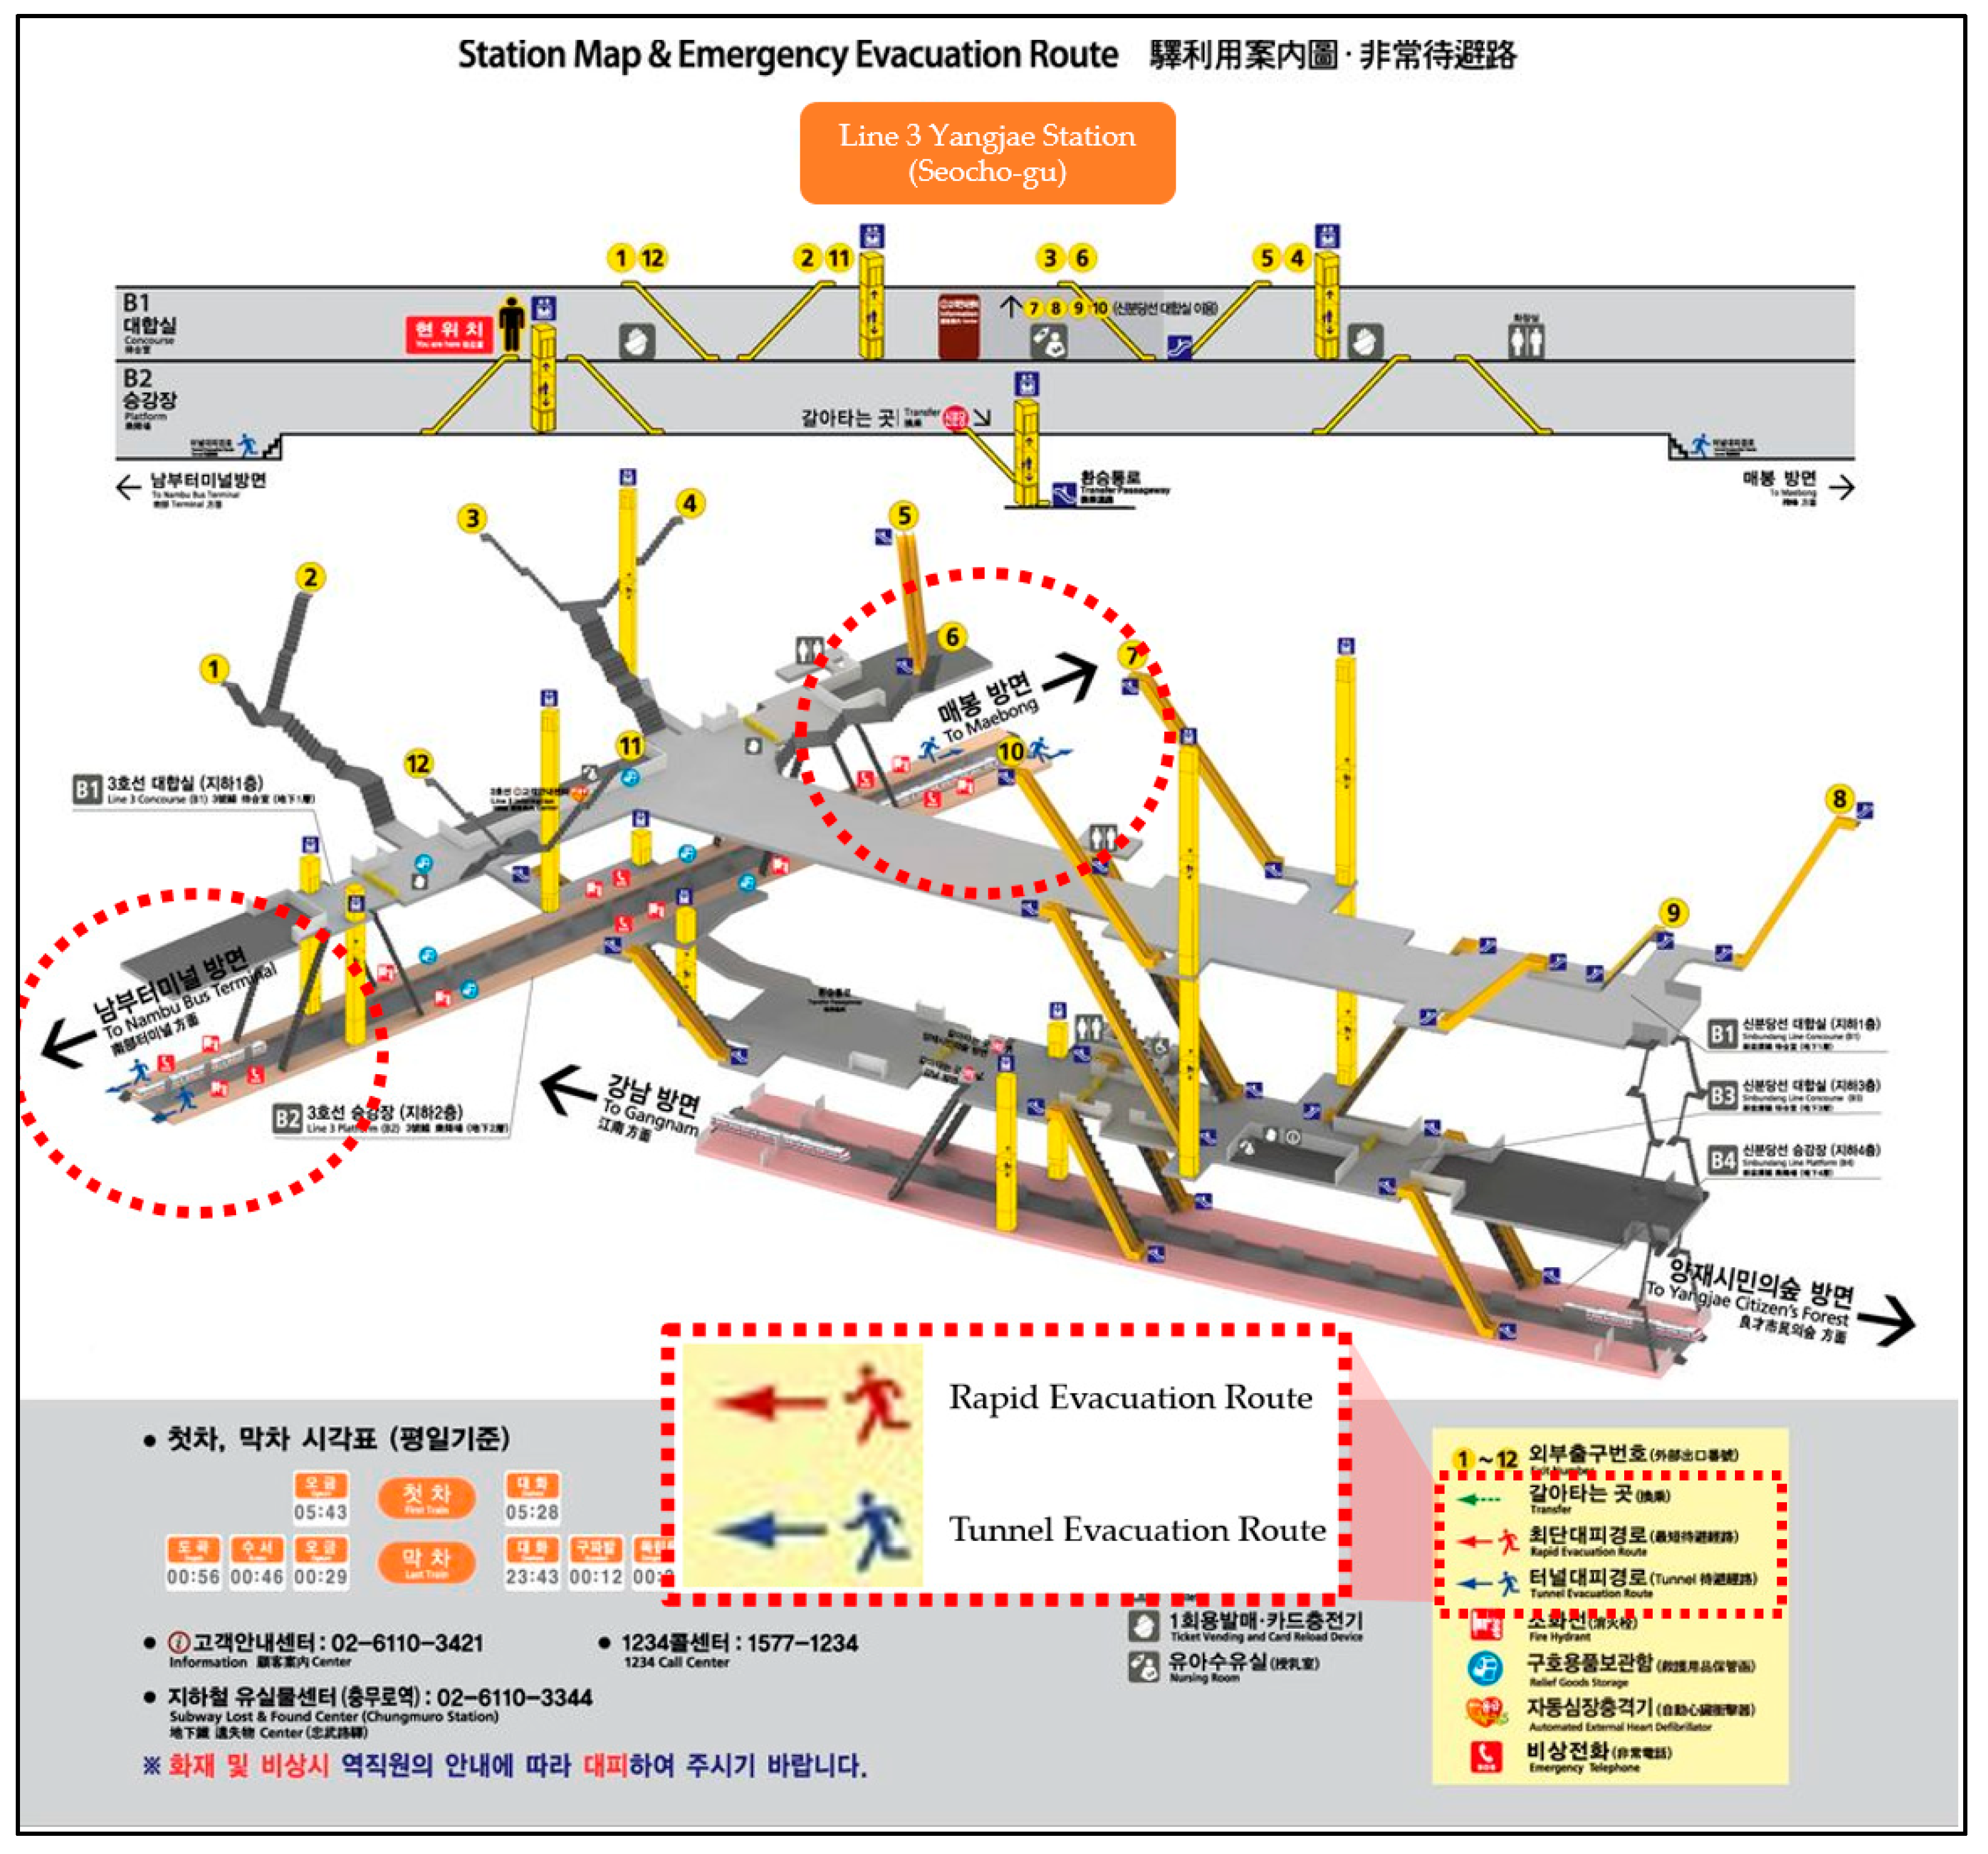
- Subway stations are Designated Facilities for Public Use facilities in a CBRE situation, and spaces for SIP must be designated inside the stations. However, if you look at the provided Station Evacuation Route Map (Figure 1), most of the stations’ evacuation routes are from the platform to the tunnel or to the outside, and, in most places, a separate evacuation space is not specified. The domestic evacuation time standards limit the evacuation time from outside to the SIP facility in a CBRE situation [43] and suggest evacuating to a safe space or outside within 6 min in the case of an emergency situation in the subway [4]. Therefore, in this study, the method that was the most efficient between moving outside in the case of an emergency situation or moving to SIP when an evacuation space for SIP is designated was studied.
- As a result, the time taken to evacuate to the outside exit (Scenario A) was 529.6 s, which was 293.5 s longer than the 236.1 s (Scenario D) of moving to the SIP. This is because, when moving outside, a large number of people evacuated through a narrow exit, creating bottlenecks, such as stairs and subway gates. Therefore, through this study, we found that moving inside to a determined SIP was much more efficient than moving outside in the case of an emergency inside the subway as well as in CBRE situations. However, since the location of the SIP in the Evacuation Map provided to existing subway stations is not specified, an appropriate location of the SIP is suggested in this study, and appropriate ventilation and blocking facilities are needed.
- (2).
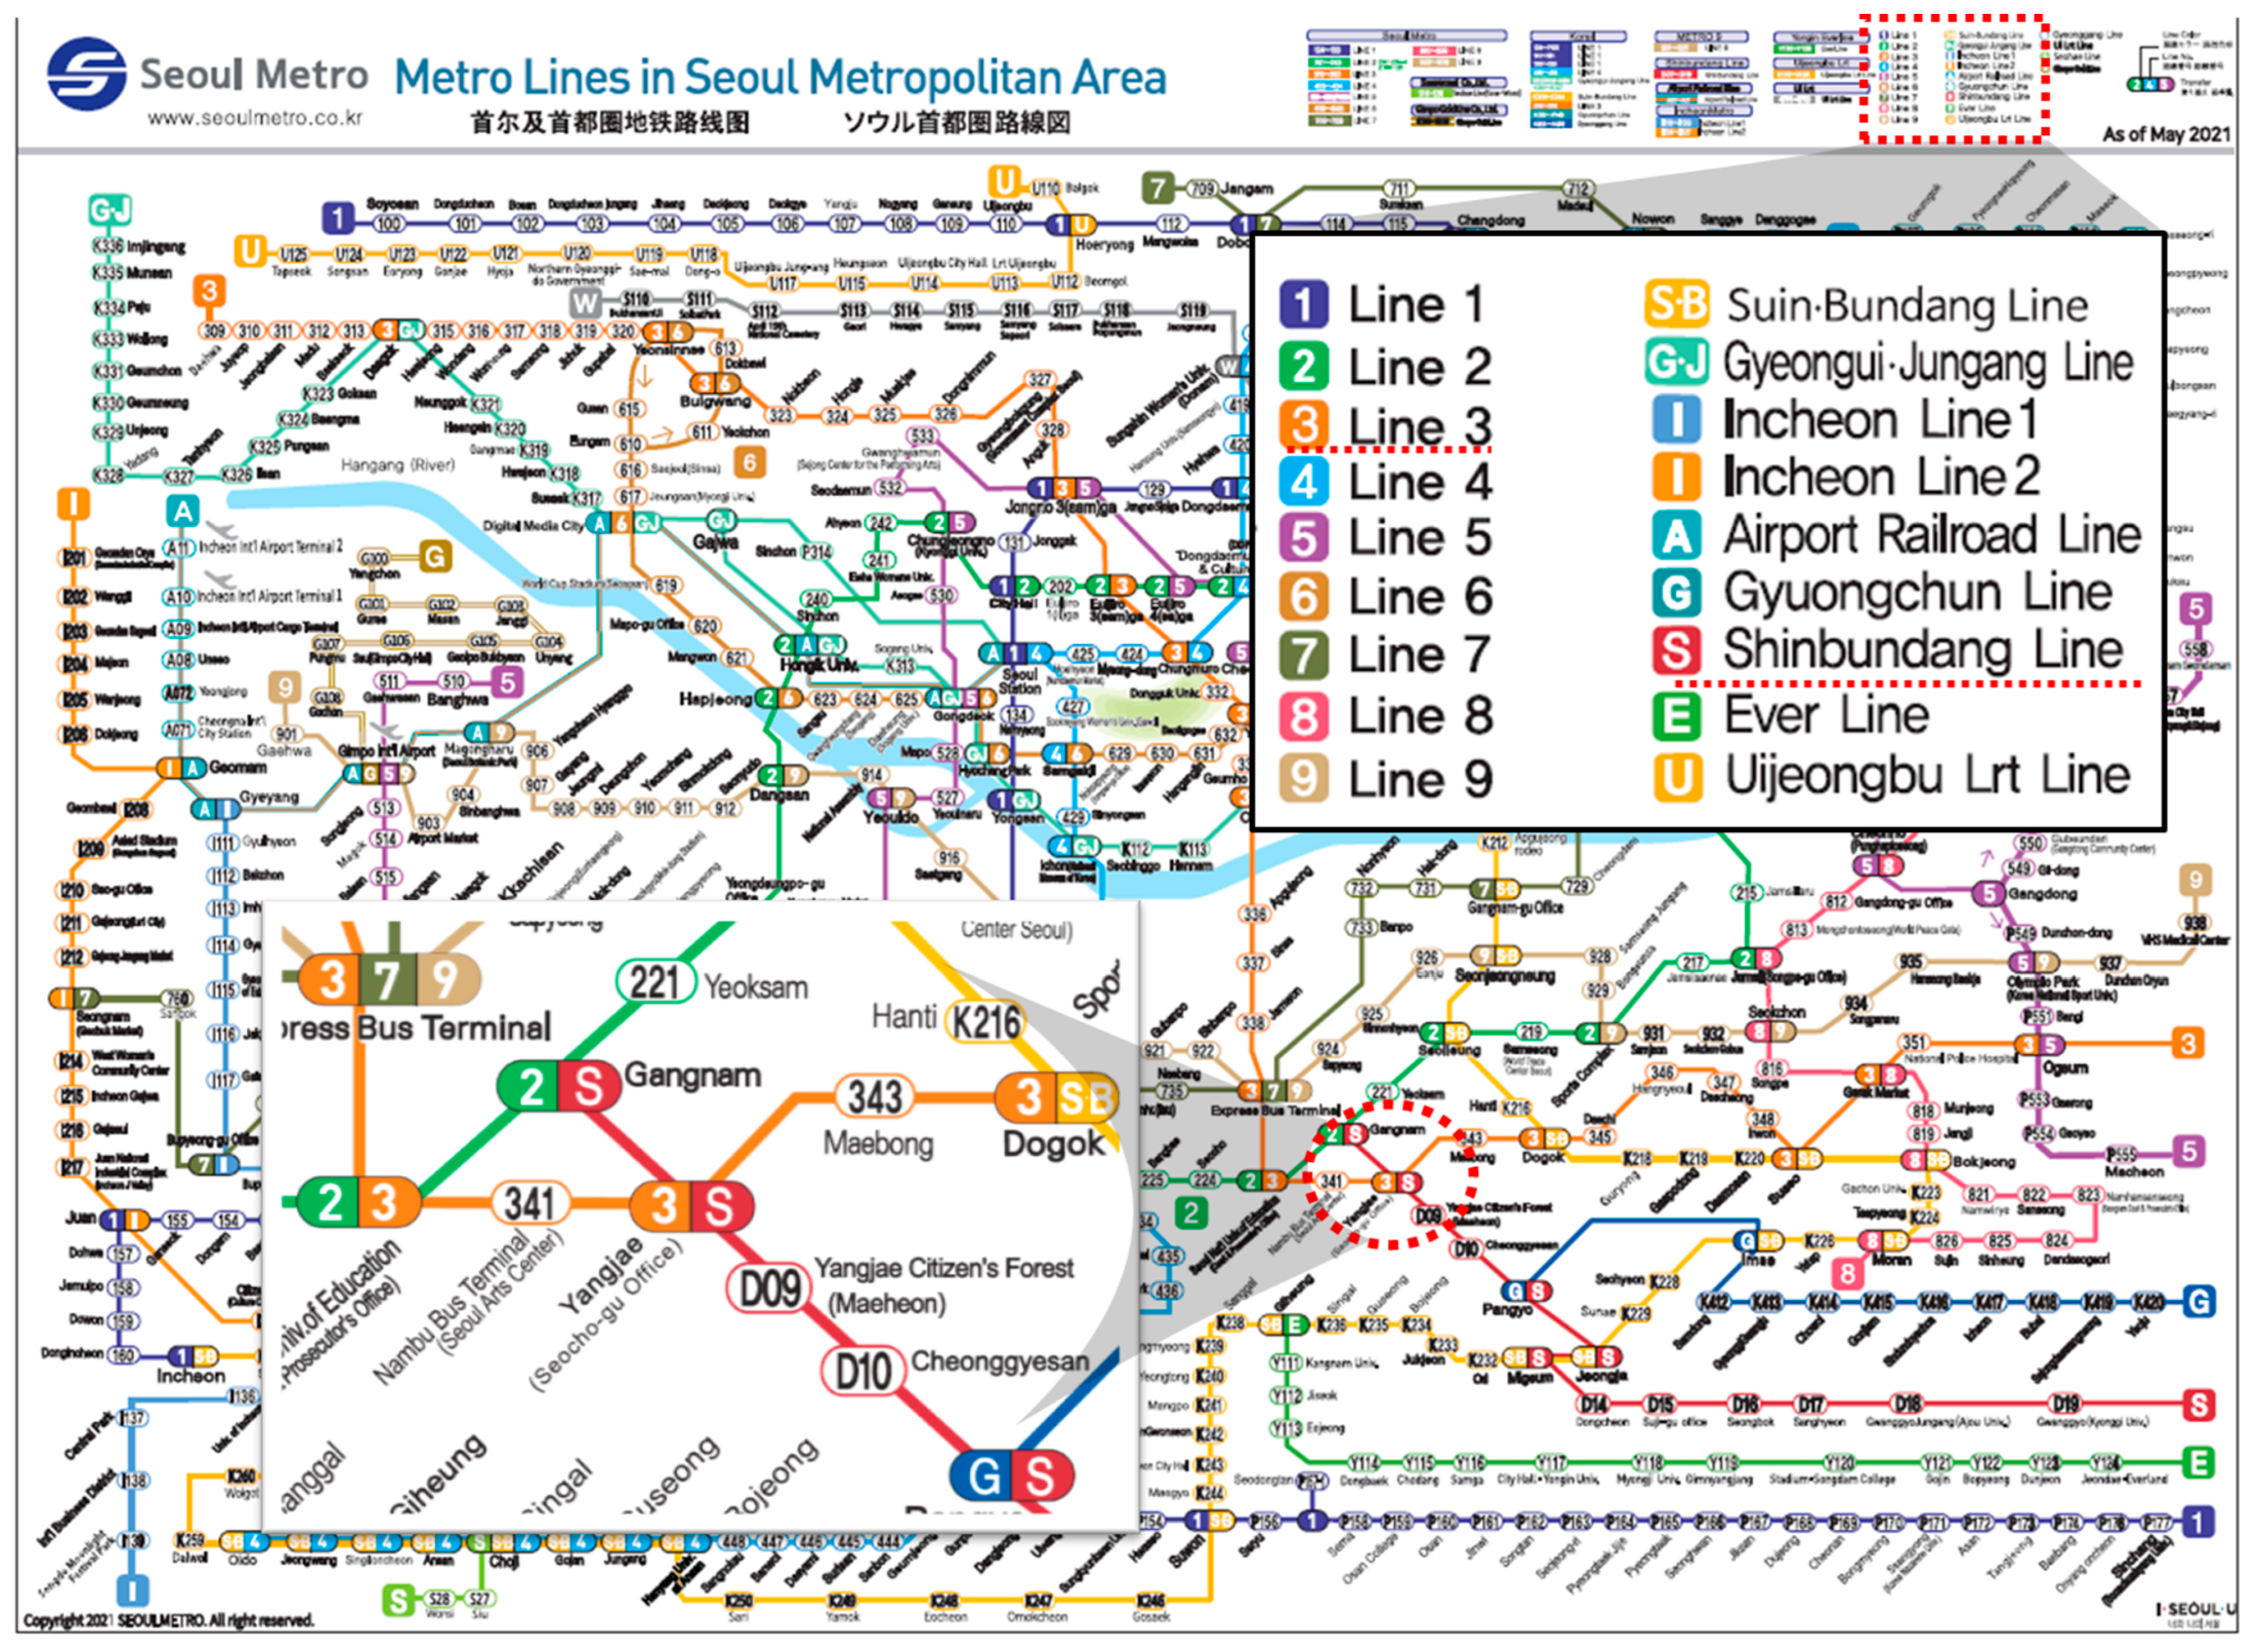
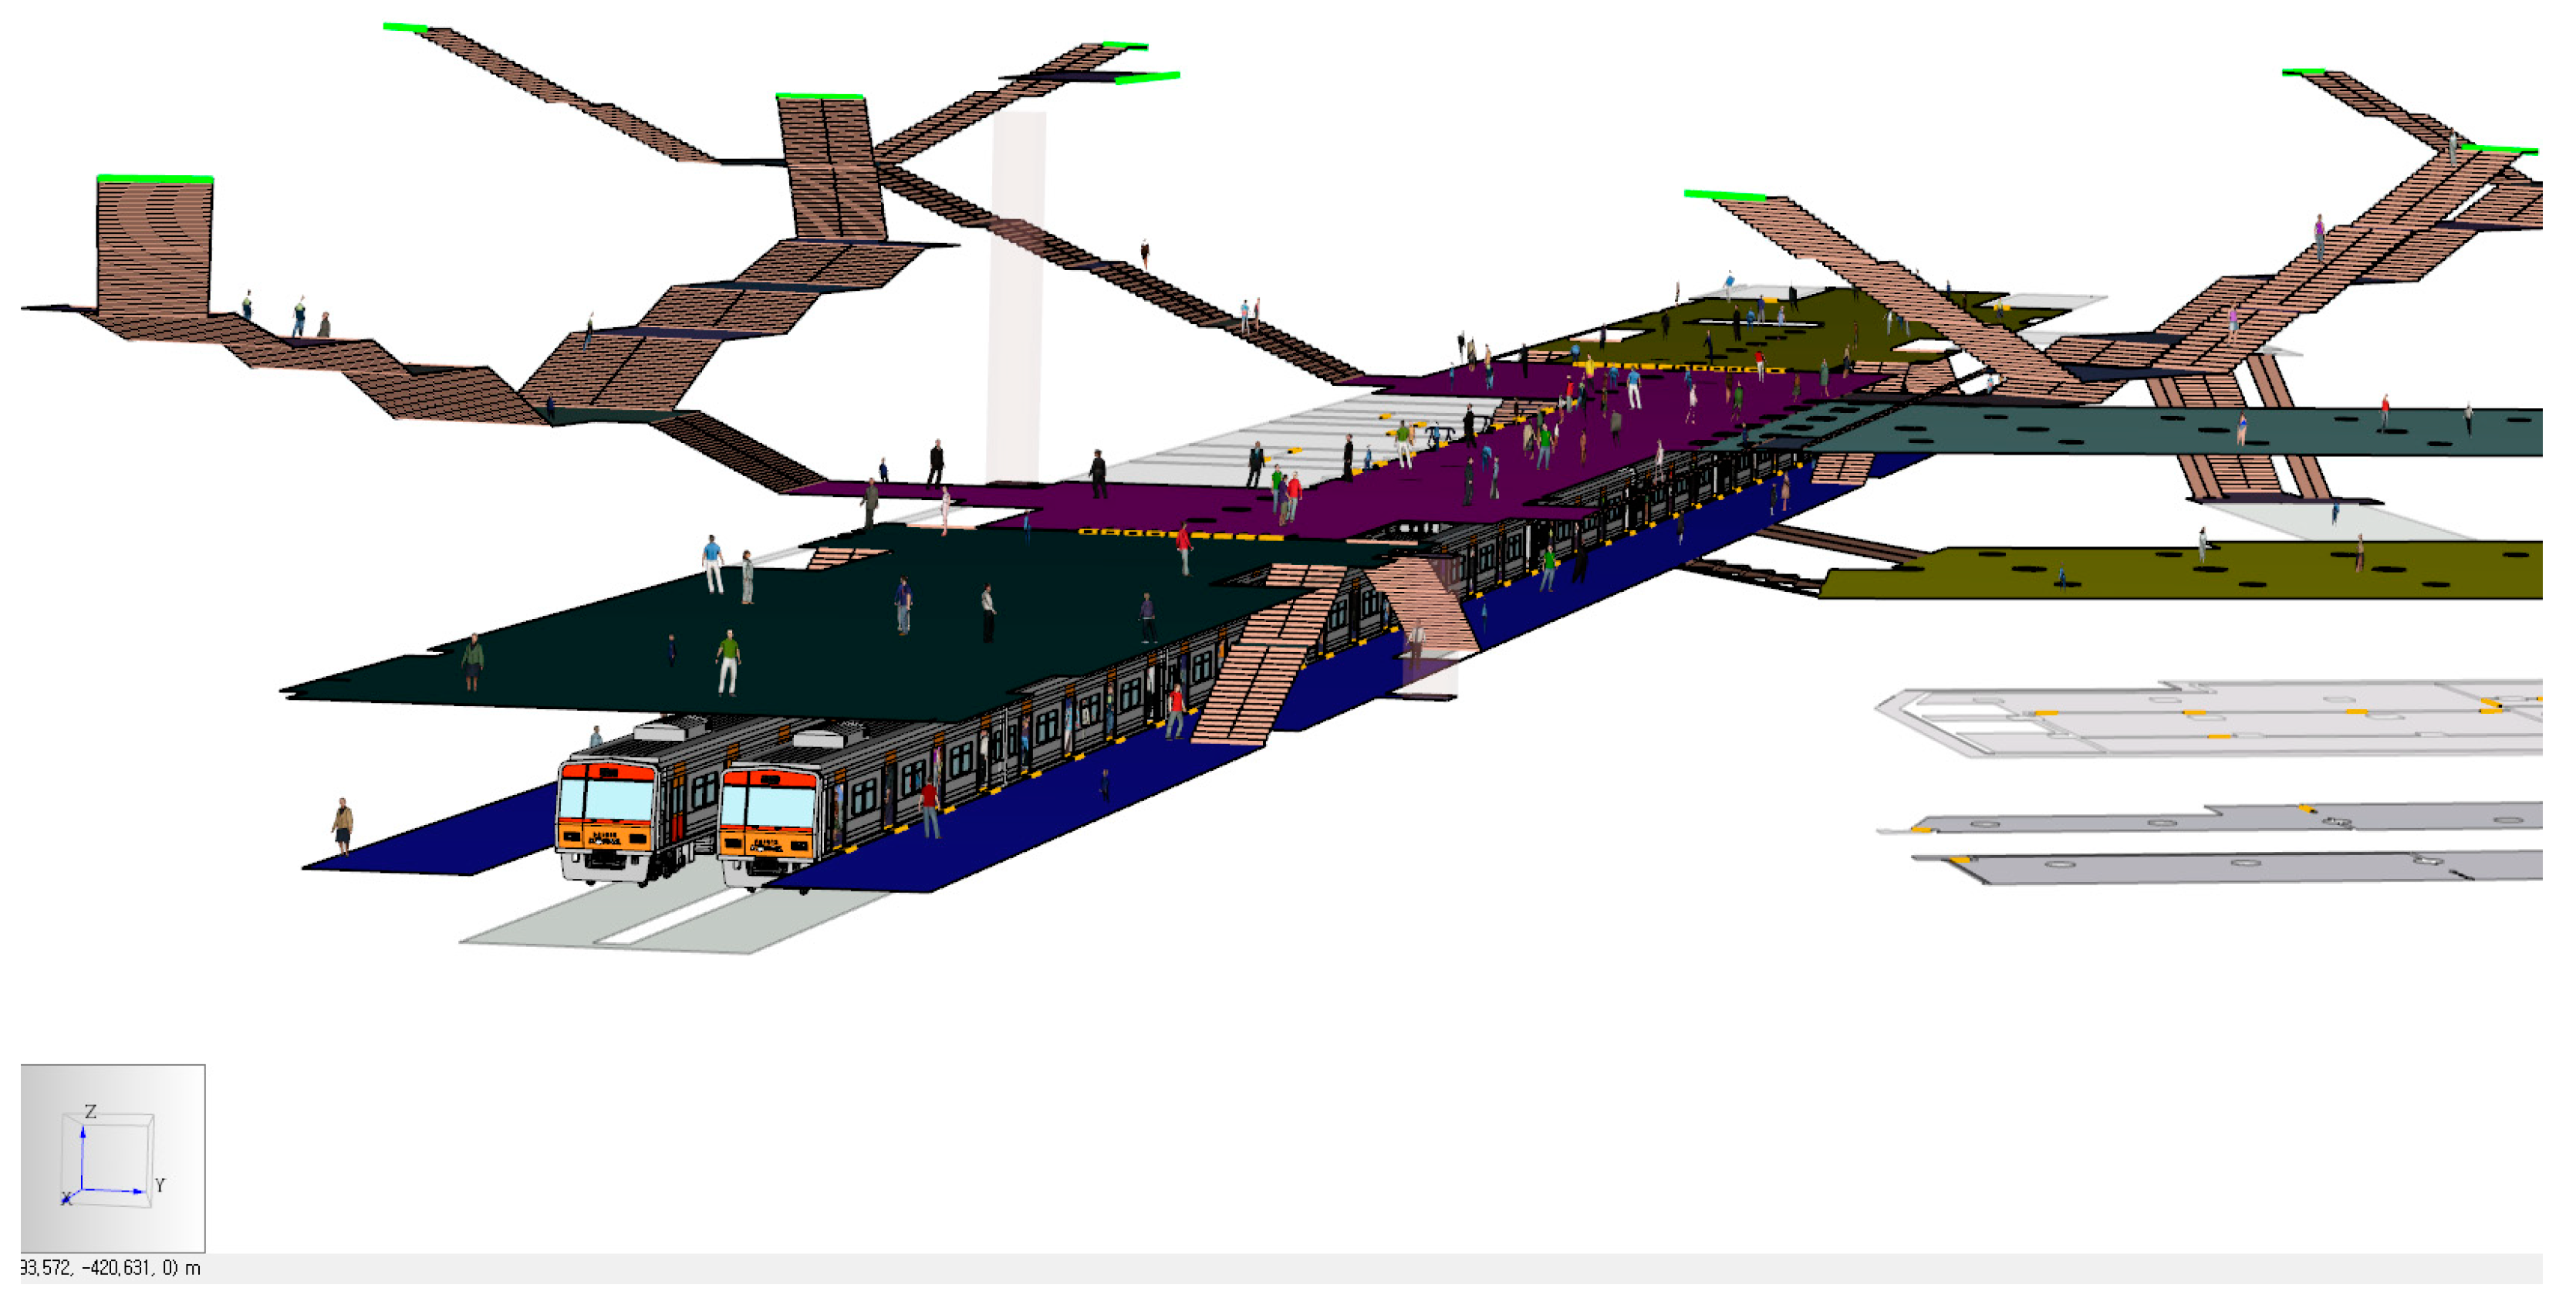
- Although the subway station evacuation time is affected by shape information, such as stairs and doors [5,6], Yangjae Station, which was used in this study, is a transfer station where Line 3 and Shinbundang Line meet, and evacuation takes place in a wide space. Therefore, the most time loss occurs as a bottleneck when passing through a gate rather than a door or stairs. In the case of the gate, it is possible to move in only one direction; additionally, there is a waiting time for approval after touching the transportation card when moving. In other words, when evacuees move in the case of an emergency situation, they could be allowed to pass in both directions and move without a traffic card. Of course, in the case of Scenario E, which does not require many gates, the evacuation time was hardly affected; however, we analyzed that it was affected by a minimum of 8.8 s and a maximum of 271.7 s. This is the easiest way to shorten the evacuation time in the case of an emergency, and it is necessary to review the improvement of the gate through this study as it is a situation that could cause casualties over time.
- (3).
- For test beams, increasing the number of HSDC strengthening sides decreases the maximum displacement, effectively increasing the ductility and stiffness of RC beams against impact loads. The walls strengthened with metallic mesh recorded an increase in shielding effectiveness with a decrease in mesh size and increased HSDC thickness strengthening. Furthermore, a similar phenomenon occurred for impact load testing, and the shielding effectiveness ratio decreased after damage. Thus, concrete elements of shelter in place strengthened by 5 mm metallic mesh and/or HSDC can be chosen due to the application aim of static, impact, and shielding effectiveness.
Author Contributions
Funding
Data Availability Statement
Acknowledgments
Conflicts of Interest
References
- American Red Cross. Fact Sheet on Shelter-In-Place; American Red Cross: Washington, DC, USA, 2003. [Google Scholar]
- Anti-Corruption & Civil Rights Commission. Improving the Effectiveness of Evacuation Facility Guidance to Ensure the Safety of Residents. January 2015. Available online: https://www.acrc.go.kr/board.es?mid=a10504030000&bid=1013&act=view&list_no=30352 (accessed on 5 January 2015).
- Ministry of Land, Infrastructure and Transport. Notice No. 2018-199, 2018.3.28. Full revision, Design Guidelines for Convenience Facilities at Transit Stations for Urban Railroad Stations. Available online: https://www.law.go.kr/LSW/admRulInfoP.do?admRulSeq=2100000118529 (accessed on 28 March 2018).
- Kim, Y.-H.; Choi, J.-S.; Yuan, T.-F.; Yoon, Y.-S. Building-Information-Modeling Based Approach to Simulate Strategic Location of Shelter in Place and Its Strengthening Method. Materials 2021, 14, 3456. [Google Scholar] [CrossRef] [PubMed]
- Kim, Y.-H.; Yoo, S.-J.; Yuan, T.-F.; Yoon, Y.-S. Effect of design code and evacuation information on strategic location of Shelter in Place (SIP) in light rail station. J. Asian Arch. Build. Eng. 2021, 21, 1332–1347. [Google Scholar] [CrossRef]
- Zou, Q.; Chen, S. Simulation of Crowd Evacuation under Toxic Gas Incident Considering Emotion Contagion and Information Transmission. J. Comput. Civ. Eng. 2020, 34, 04020007. [Google Scholar] [CrossRef]
- Gupta, A.; Yadav, P. SAFE-R: A new model to study the evacuation profile of a building. Fire Saf. J. 2004, 39, 539–556. [Google Scholar] [CrossRef]
- Society of Fire Protection Engineers. SFPE Handbook of Fire Protection Engineering, 3rd ed.; National Fire Protection Association: Quincy, MA, USA; Society of Fire Protection Engineers: Bethesda, MD, USA, 2002. [Google Scholar]
- Richard, W.B.; Addison, W.A. Normal walking speed: A descriptive meta-analysis. Physiotherapy 2011, 97, 182–189. [Google Scholar]
- Ando, K.; Ota, H.; Oki, T. Forecasting the flow of people. Railw. Res. Rev. 1988, 45, 8–14. [Google Scholar]
- Statics Korea. Population Census Results in 2020, Release 29 July 2021. Available online: http://kostat.go.kr/portal/korea/kor_nw/1/1/index.board?bmode=read&aSeq=391020 (accessed on 29 July 2021).
- Seoul Metro, December 2021 Number of People Using Each Station by Time Zone (Lines 1 to 8), Release 17 January 2022. Available online: http://www.seoulmetro.co.kr/kr/board.do?menuIdx=548&bbsIdx=2213467 (accessed on 17 January 2022).
- Namuwiki Shinbundangsun 14 Statistic of Boarding and Alighting by Station. Available online: https://namu.wiki/w/%EC%8B%A0%EB%B6%84%EB%8B%B9%EC%84%A0 (accessed on 13 October 2022).
- FEMA453. Risk Management Series, Design Guidance for Shelters and Safe Rooms; FEMA: Washington, DC, USA, 2006.
- IMO. IMO Guidelines for Evacuation Analysis for New and Existing Passenger Ships; International Maritime Organization: London, UK, 2016.
- Thunderhead Engineering. Verification and Validation; Thunderhead Engineering: New York, NY, USA, 2015; pp. 85–110. [Google Scholar]
- Wikipedia. Seoul Subway Line 3, Rolling Stock. Available online: https://en.wikipedia.org/wiki/Seoul_Subway_Line_3 (accessed on 21 October 2022).
- Roh, J.S.; Ryou, H.S.; Yoon, S.W. The effect of PSD on life safety in subway station fire. J. Mech. Sci. Technol. 2010, 24, 937–942. [Google Scholar] [CrossRef]
- Korea National Railway. Convenience Facility Design for the Handicapped. Available online: https://www.kr.or.kr/boardCnts/fileDown.do?fileSeq=7cb186ca4d90c62df06f67aa4177beb6 (accessed on 27 June 2019).
- Templer, J.A. The Staircase: Studies of Hazards, Falls and Safer Design; MIT Press: Cambridge, MA, USA, 1992. [Google Scholar]
- Main Design Criteria for Subway (Facility Field), in the Design Standard for Subway. 2018. Available online: http://news.seoul.go.kr/citybuild/archives/200564 (accessed on 29 June 2022).
- Yuan, T.-F.; Lee, J.-Y.; Min, K.-H.; Yoon, Y.-S. Experimental Investigation on Mechanical Properties of Hybrid Steel and Polyethylene Fiber-Reinforced No-Slump High-Strength Concrete. Int. J. Polym. Sci. 2019, 2019, 4737384. [Google Scholar] [CrossRef] [Green Version]
- Yuan, T.-F.; Lee, J.-Y.; Yoon, Y.-S. Enhancing the tensile capacity of no-slump high-strength high-ductility concrete. Cem. Concr. Compos. 2020, 106, 103458. [Google Scholar] [CrossRef]
- Yuan, T.-F.; Hong, S.-H.; Shin, H.-O.; Yoon, Y.-S. Bond Strength and Flexural Capacity of Normal Concrete Beams Strengthened with No-Slump High-Strength, High-Ductility Concrete. Materials 2020, 13, 4218. [Google Scholar] [CrossRef]
- ASTM C150; Standard Specifcation for Portland Cement. ASTM International: West Conshohocken, PA, USA, 2007.
- Lee, J.Y.; Kim, D.B.; Kwon, K.Y.; Yoon, Y.S. Recommendation of Adequate Sampling Rate for Drop Weight Impact Test with Application of Nyquist’s Sampling Theorem. J. Korean Soc. Hazard Mitig. 2015, 15, 61–67. [Google Scholar] [CrossRef] [Green Version]
- Lee, J.-Y.; Yuan, T.; Shin, H.-O.; Yoon, Y.-S. Strategic use of steel fibers and stirrups on enhancing impact resistance of ultra-high-performance fiber-reinforced concrete beams. Cem. Concr. Compos. 2020, 107, 103499. [Google Scholar] [CrossRef]
- Micheli, D.; Marchetti, M.; Pastore, R.; Vricella, A.; Gradoni, G.; Moglie, F.; Primiani, V.M. Shielding effectiveness of carbon nanotube reinforced concrete composites by reverberation chamber measurements. In Proceedings of the 2015 International Conference on Electromagnetics in Advanced Applications (ICEAA), Turin, Italy, 7–11 September 2015; pp. 145–148. [Google Scholar] [CrossRef]
- Micheli, D.; Pastore, R.; Vricelaa, A.; Delfni, A.; Marchetti, M.; Santoni, F. Electromagnetic Characterization of Masterials by Vector Network Analyzer Experimental Setup, Spectroscopic Methods for Nanomaterials Characterization (Micro and Nano Technologies); Elsevier: Amsterdam, The Netherlands, 2017; pp. 195–236. [Google Scholar]
- Yuan, T.-F.; Choi, J.-S.; Hong, S.-H.; Yoon, Y.-S. Enhancing the electromagnetic shielding and impact resistance of a reinforced concrete wall for protective structures. Cem. Concr. Compos. 2021, 122, 104148. [Google Scholar] [CrossRef]
- Lampropoulos, A.P.; Paschalis, S.A.; Tsioulou, O.T.; Dritsos, S.E. Strengthening of reinforced concrete beams using ultra high performance fibre reinforced concrete (UHPFRC). Eng. Struct. 2016, 106, 370–384. [Google Scholar] [CrossRef] [Green Version]
- Tanarslan, H. Flexural strengthening of RC beams with prefabricated ultra high performance fibre reinforced concrete laminates. Eng. Struct. 2017, 151, 337–348. [Google Scholar] [CrossRef]
- Al-Osta, M.; Isa, M.; Baluch, M.; Rahman, M. Flexural behavior of reinforced concrete beams strengthened with ultra-high performance fiber reinforced concrete. Constr. Build. Mater. 2017, 134, 279–296. [Google Scholar] [CrossRef]
- Hrynyk, T.D.; Vecchio, F.J. Behavior of Steel Fiber-Reinforced Concrete Slabs under Impact Load. ACI Struct. J. 2014, 111, 1213–1223. [Google Scholar]
- Lee, J.-Y.; Shin, H.; Yoo, D.-Y.; Yoon, Y.-S. Structural response of steel-fiber-reinforced concrete beams under various loading rates. Eng. Struct. 2018, 156, 271–283. [Google Scholar] [CrossRef]
- Defence USDo. Unified Facilities Criteria (UFC) 3-340-02: Structures to Resist the Effects of Accidental Explosions; Department of Defense: Washington, DC, USA, 2008.
- Yuan, T.-F.; Choi, J.-S.; Kim, S.-K.; Yoon, Y.-S. Assessment of Steel Slag and Steel Fiber to Control Electromagnetic Shielding in High-Strength Concrete. KSCE J. Civ. Eng. 2021, 25, 920–930. [Google Scholar] [CrossRef]
- Hyun, S.Y.; Kyoung, J.K.; Lee, H.J.; Lee, K.W.; Yook, J.G. Analysis of shielding effectiveness of reinforced concrete against high altitude electromagnetic pulse. IEEE Trans. Electromagn. Compat. 2014, 56, 1488–1496. [Google Scholar] [CrossRef]
- Liu, F.; Lü, X.; Li, Y.B.; Yang, J.; Pan, Z. Attenuation characteristics on high power microwave penetrating through reinforcement nets. High Power Laser Part. Beams 2012, 24, 2713–2717. [Google Scholar] [CrossRef]
- Lu, H.D.; Zhu, F.; Li, X.; Tang, Y.T. Shielding effectiveness of reinforced concrete toward electric arcs in pantograph catenary systems of metro. Chin. J. Radio Sci. 2016, 31, 1209–1215. [Google Scholar] [CrossRef]
- Shukla, V. Review of electromagnetic interference shielding materials fabricated by iron ingredients. Nanoscale Adv. 2019, 1, 1640–1671. [Google Scholar] [CrossRef] [PubMed] [Green Version]
- Sadraie, H.; Khaloo, A.; Soltani, H. Dynamic performance of concrete slabs reinforced with steel and GFRP bars under impact loading. Eng. Struct. 2019, 191, 62–81. [Google Scholar] [CrossRef]
- National Fire Agency 2009 Policy Research Report. In Study on CBR Evacuation Facility Standards and Utilization Plans; Hanseo University: Seosan, Republic of Korea, 2009; p. 49.


| Categories | Target Facilities |
|---|---|
| Command and Control Center | Underground Facility Equipped with CBR (Chemical, Biological, and Radiological) Protection Facilities. |
| Multi-Group (I) | High-Rise Building (under the second basement floor), Subway, Tunnel, etc. |
| Multi-Group (II) | Underground Mall, Underpass, Underground Passage, Multi-Story Building (Basement), Civil Defense Training Center, and Underground Parking Lot. |
| Gender | Age (Years) | Speed (m/s) |
|---|---|---|
| Female | 2~8.3 | 0.06 × Age + 0.5 |
| 8.3~13.3 | 0.04 × Age + 0.67 | |
| 13.3~22.25 | 0.02 × Age + 0.94 | |
| 22.25~37.5 | −0.018 × Age + 1.78 | |
| 37.5~70 | −0.01 × Age + 1.45 | |
| Male | 2~5 | 0.16 × Age + 0.3 |
| 5~12.5 | 0.06 × Age + 0.8 | |
| 12.5~18.8 | 0.06 × Age + 1.45 | |
| 18.8~39.2 | −0.01 × Age + 1.78 | |
| 39.2~70 | −0.009 × Age + 1.75 |
| Strata Gender (Age in Years) | Gait Speed (m/s) | Applied Speed | |
|---|---|---|---|
| Richard et al. [10] | Ando et al. [11] | ||
| Men (0 to 9) | - | 0.670 (0 to 1.340) | 0.670 |
| Men (10 to 19) | - | 1.501 (1.400 to 1.602) | 1.501 |
| Men (20 to 29) | 1.358 (1.270 to 1.447) | 1.550 (1.490 to 1.610) | 1.358 |
| Men (30 to 39) | 1.433 (1.316 to 1.550) | 1.440 (1.480 to 1.399) | 1.433 |
| Men (40 to 49) | 1.434 (1.353 to 1.514) | 1.350 (1.309 to 1.390) | 1.434 |
| Men (50 to 59) | 1.433 (1.379 to 1.488) | 1.260 (1.219 to 1.300) | 1.433 |
| Men (60 to 69) | 1.339 (1.266 to 1.412) | 1.170 (1.129 to 1.210) | 1.339 |
| Men (70 to 79) | 1.262 (1.210 to 1.322) | - | 1.262 |
| Men (80 to 99) | 0.968 (0.834 to 1.101) | - | 0.968 |
| Women (0 to 9) | - | 0.515 | 0.515 |
| Women (10 to 19) | - | 1.195 | 1.195 |
| Women (20 to 29) | 1.341 (1.239 to 1.443) | 1.299 | 1.341 |
| Women (30 to 39) | 1.337 (1.193 to 1.482) | 1.150 | 1.337 |
| Women (40 to 49) | 1.390 (1.339 to 1.411) | 1.005 | 1.390 |
| Women (50 to 59) | 1.313 (1.222 to 1.405) | 0.905 | 1.313 |
| Women (60 to 69) | 1.241 (1.183 to 1.300) | 0.805 | 1.241 |
| Women (70 to 79) | 1.132 (1.072 to 1.192) | - | 1.132 |
| Women (80 to 99) | 0.943 (0.852 to 1.034) | - | 0.943 |
| Ages (Years Old) | Population | Rate | Male Rate | Female Rate |
|---|---|---|---|---|
| 0~9 | 3924 | 7.90% | 4.20% | 3.70% |
| 10~19 | 4674 | 9.30% | 5.00% | 4.30% |
| 20~29 | 6616 | 13.20% | 7.30% | 5.90% |
| 30~39 | 6627 | 13.20% | 7.00% | 6.20% |
| 40~49 | 7953 | 15.90% | 8.20% | 7.70% |
| 50~59 | 8338 | 16.70% | 8.40% | 8.30% |
| 60~69 | 6481 | 13.00% | 6.20% | 6.80% |
| 70~79 | 3603 | 7.20% | 2.50% | 4.70% |
| Over 80 | 1917 | 3.80% | 1.20% | 2.40% |
| Total | 50,133 | 100% | 50.0% | 50.0% |
| Station | Room | Area (m2) | Capacities (Persons) |
|---|---|---|---|
| Line 3 | Room 7001 | 1077.908 | 580 |
| Room 7002 | 965.958 | 519 | |
| Room 7003 | 1245.331 | 670 | |
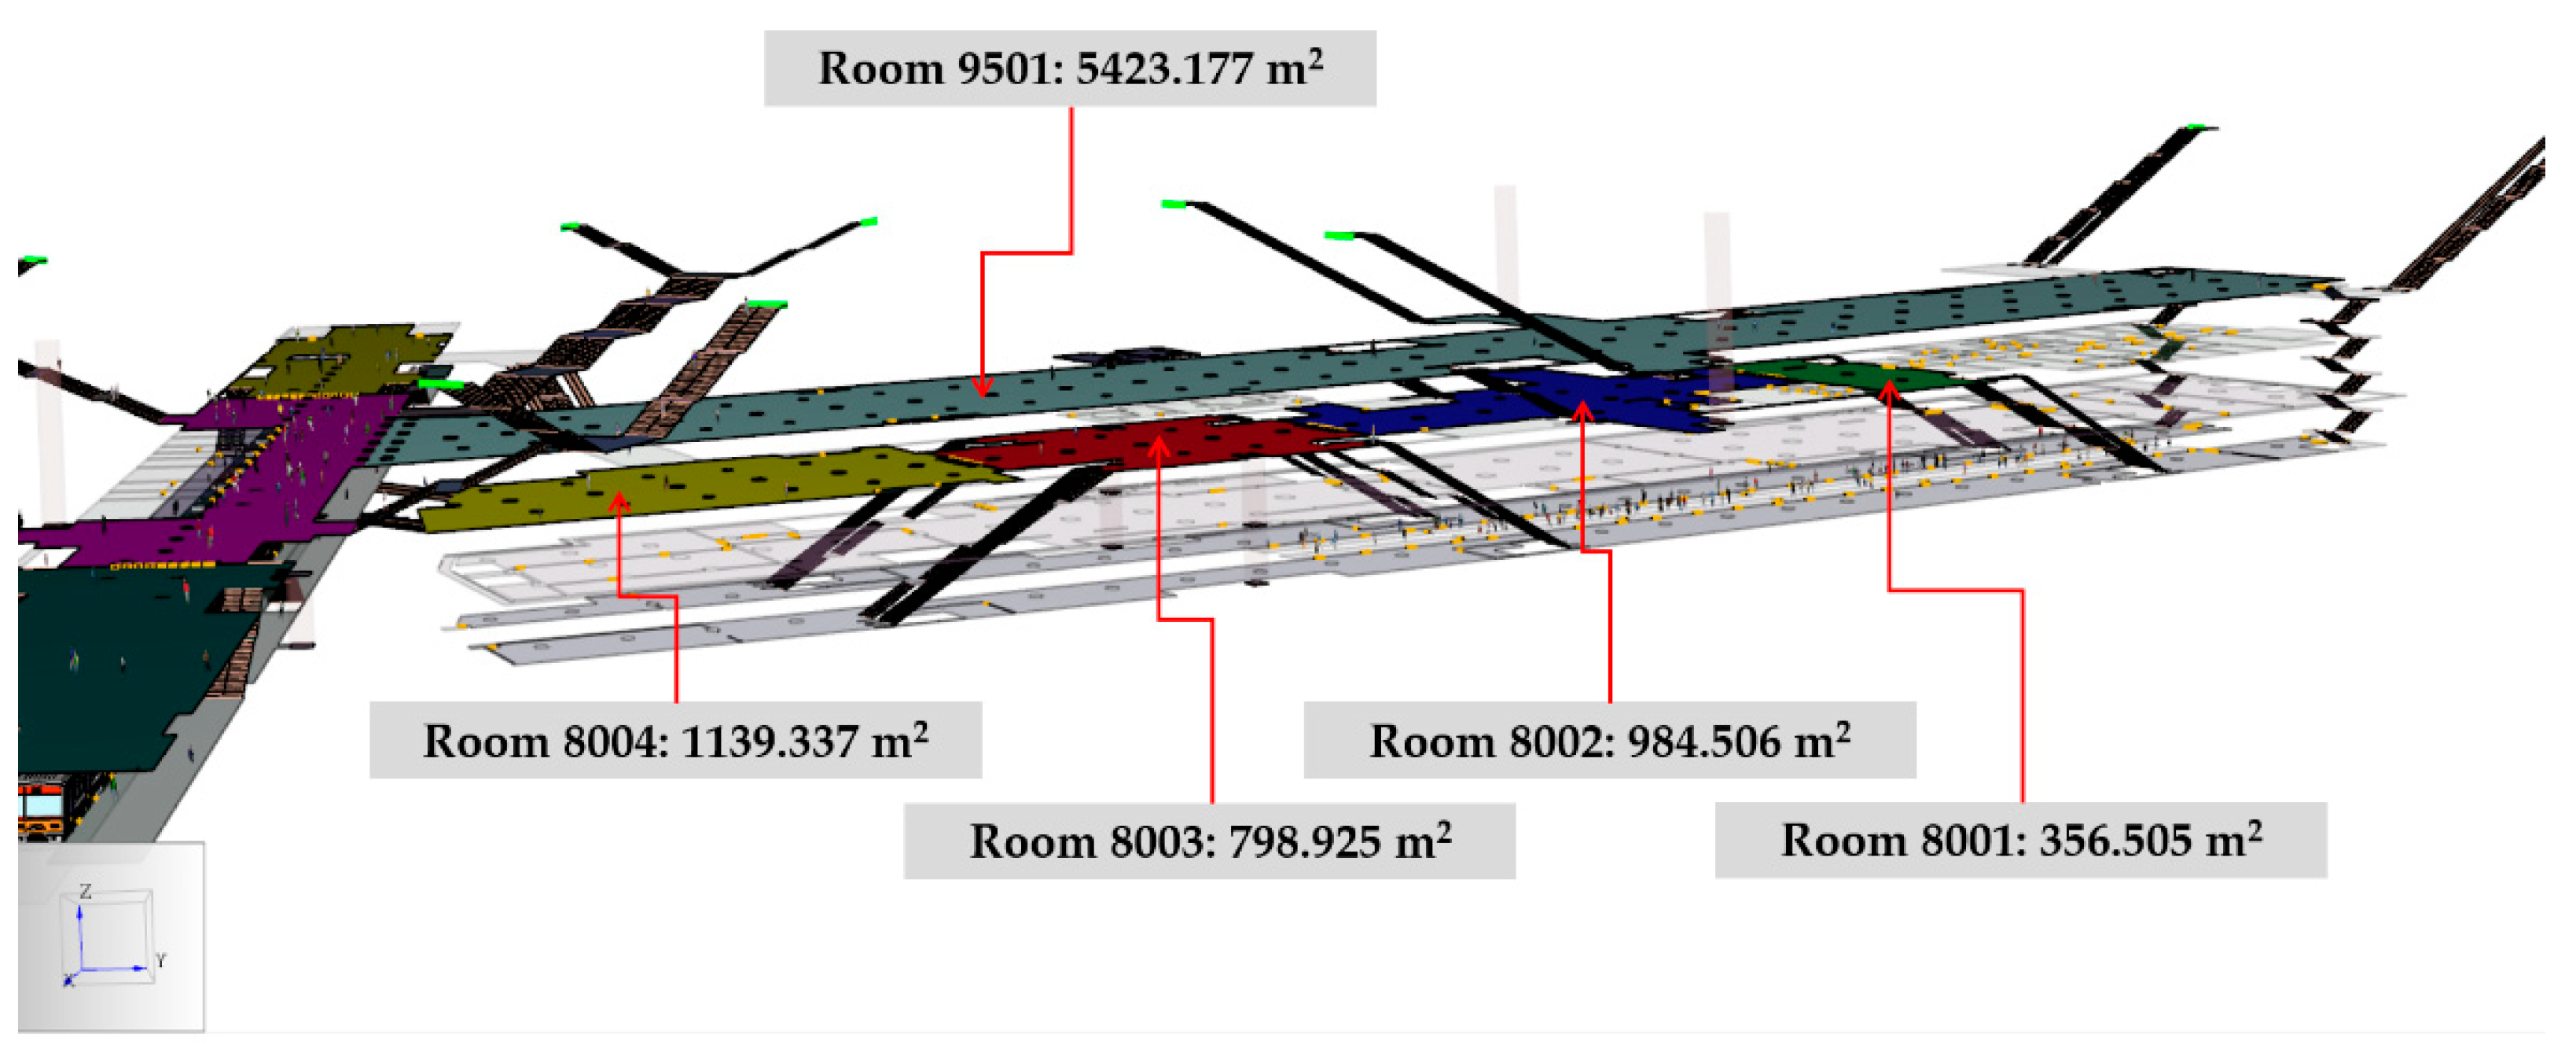
| Shinbundang Line | Room 8001 | 356.505 | 192 |
| Room 8002 | 984.506 | 529 | |
| Room 8003 | 798.925 | 430 | |
| Room 8004 | 1139.337 | 613 | |
| Room 9501 | 5423.177 | 2916 |
| Scenario | Description | SIP Location |
|---|---|---|
| Scenario A | Evacuate at the exit of Line 3 and Shinbundang Line | Exits: 1~12 |
| Scenario B | Evacuate to the second basement floor of the Shinbundang Line | Rooms: 8001~8004 |
| Scenario C | Evacuate to the first basement floor of the Shinbundang Line | Rooms: 9501 |
| Scenario D | Evacuate to both sides of the first basement floor of Line 3 and the second basement floor of the Shinbundang Line | Rooms: 7001, 7002, 8001, 8002, 8003, and 8004 |
| Scenario E | Evacuate from the center of the first basement floor of Line 3 and the second basement floor of the Shinbundang Line | Rooms: 7003, 8001, 8002, 8003, and 8004 |
| Types | M5 | M10 | M25 |
|---|---|---|---|
 |  |  | |
| Diameter (mm) | 0.73 | 1.18 | 1.90 |
| Tensile strength (MPa) | 987/1013 | 836/821 | 842/866 |
| Types | w/b | Water | Cement | Silica Fume | Silica Filler | Sand | Coarse Aggregate | Steel Fiber | Polyethylene Fiber | SP |
|---|---|---|---|---|---|---|---|---|---|---|
| NSC | 0.43 | 0.43 | 1.00 | - | - | 2.15 | 2.42 | - | - | 0.8% |
| HSDC | 0.172 | 0.215 | 1.00 | 0.25 | 0.30 | 1.10 | - | 1.0% | 0.5% | 3.0% |
| Specimens Thickness (mm) | Strengthening Materials | ||||||||
|---|---|---|---|---|---|---|---|---|---|
| Metallic Mesh | HSDC | ||||||||
| 5 mm | 10 mm | 25 mm | 5 mm | 10 mm | 20 mm | ||||
| 1 | Type I | S-NC | 100 | - | - | - | - | - | - |
| 2 | S-M5 | double | - | - | - | - | - | ||
| 3 | S-M10 | - | double | - | - | - | - | ||
| 4 | S-M25 | - | - | double | - | - | - | ||
| 5 | Type II | S-H5 | - | - | - | double | - | - | |
| 6 | S-H10 | - | - | - | - | double | - | ||
| 7 | S-H20 D | - | - | - | - | - | double | ||
| 8 | Type Ⅲ | L-NC | 140 | - | - | - | - | - | - |
| 9 | L-M5 | double | - | - | - | - | - | ||
| 10 | L-H20 | - | - | - | - | - | double | ||
| Blow No. | Impact Properties | Dmax. (mm) | Dres (mm) | θmax (⁰) | Fr (kN) | Remarks | ||
|---|---|---|---|---|---|---|---|---|
| H (mm) | Ei (kJ) | |||||||
| NC-NN | 1 | 2000 | 5.9 | 83.1 | - | 4.3 | 157.7 | shear failure |
| NC-3J | 1 | 66.8 | 53.6 | 3.5 | 152.3 | spalling | ||
| NC-4J | 1 | 39.0 | 25.2 | 2.0 | 188.3 | flexural failure | ||
| 2 | 55.6 | 34.2 | 4.2 | 169.8 | ||||
| 3 | - | - | - | 105.2 | ||||
| NR-NN | 1 | 40.9 | 36.6 | 2.1 | 185.9 | spalling | ||
| Blow No. | Impact Properties | Fr (kN) | Dmax. (mm) | Crack Numbers | Wmax (mm) | Edis (kJ) | ||
|---|---|---|---|---|---|---|---|---|
| H (mm) | Ei (kJ) | |||||||
| S-NC | #1 | 200 | 0.20 | 16.2 | - | - | - | - |
| S-M5 | #1 | 200 | 0.20 | 19.8 | 0.90 | 6 | 0.05 | 1.89 |
| #2 | 300 | 0.49 | 23.1 | 1.03 | 6 | 0.08 | ||
| #3 | 400 | 0.88 | 30.7 | 1.74 | 11 | 0.15 | ||
| #4 | 500 | 1.37 | 29.9 | 1.75 | 15 | 0.75 | ||
| #5 | 600 | 1.96 | 25.0 | 3.82 | 15 | 3.08 | ||
| S-M10 | #1 | 200 | 0.20 | 22.6 | 0.74 | 4 | 0.05 | 1.31 |
| #2 | 300 | 0.49 | 24.6 | 0.98 | 8 | 0.15 | ||
| #3 | 400 | 0.88 | 26.4 | 1.34 | 8 | 0.90 | ||
| #4 | 500 | 1.37 | 26.4 | 1.34 | 11 | 1.20 | ||
| #5 | 600 | 1.96 | 24.0 | 3.77 | 12 | 1.70 | ||
| S-M25 | #1 | 200 | 0.20 | 20.6 | 1.33 | 4 | 0.08 | 0.83 |
| #2 | 300 | 0.49 | 21.8 | 1.00 | 6 | 0.45 | ||
| #3 | 400 | 0.88 | 27.2 | 1.89 | 9 | 0.80 | ||
| #4 | 500 | 1.37 | 24.5 | 2.06 | 10 | 1.40 | ||
| S-H5 | #1 | 200 | 0.20 | 19.7 | 1.05 | 4 | 0.45 | 1.28 |
| #2 | 300 | 0.49 | 22.8 | 1.54 | 6 | 1.10 | ||
| #3 | 400 | 0.88 | 23.7 | 2.22 | 9 | 1.95 | ||
| #4 | 500 | 1.37 | 26.2 | 2.48 | 9 | 5.00 | ||
| #5 | 600 | 1.96 | 15.0 | 4.63 | 9 | 6.00 | ||
| S-H10 | #1 | 200 | 0.20 | 22.2 | 0.73 | 5 | 0.25 | 1.87 |
| #2 | 300 | 0.49 | 24.4 | 1.07 | 11 | 1.30 | ||
| #3 | 400 | 0.88 | 24.4 | 1.91 | 14 | 2.00 | ||
| #4 | 500 | 1.37 | 25.8 | 1.64 | 16 | 4.50 | ||
| #5 | 600 | 1.96 | 28.1 | 1.75 | 26 | 5.50 | ||
| #6 | 700 | 2.65 | 20.0 | 3.69 | 26 | 3.00 | ||
| S-H20D | #1 | 200 | 0.20 | 23.6 | 0.49 | 5 | 0.05 | 2.54 |
| #2 | 300 | 0.49 | 28.9 | 0.72 | 8 | 0.20 | ||
| #3 | 400 | 0.88 | 32.1 | 0.97 | 13 | 0.40 | ||
| #4 | 500 | 1.37 | 26.4 | 1.13 | 21 | 0.70 | ||
| #5 | 600 | 1.96 | 38.7 | 1.47 | 29 | 1.10 | ||
| #6 | 700 | 2.65 | 38.5 | 1.77 | 29 | 2.00 | ||
| #7 | 800 | 3.43 | 21.0 | 3.04 | 29 | 4.00 | ||
| L-M5 | #1 | 2000 | 5.88 | 923.6 | 17.85 | 24 | 2.15 | 3.52 |
| #2 | 2000 | 11.76 | 529.9 | 27.60 | 26 | scabbing | ||
| L-H20 | #1 | 2000 | 5.88 | 1025.2 | 18.72 | 35 | 1.45 | 3.70 |
| #2 | 2000 | 11.76 | 823.9 | 27.61 | 67 | 2.15 | ||
| #3 | 2000 | 17.56 | 559.1 | 20.14 | 67 | scabbing | ||
Publisher’s Note: MDPI stays neutral with regard to jurisdictional claims in published maps and institutional affiliations. |
© 2022 by the authors. Licensee MDPI, Basel, Switzerland. This article is an open access article distributed under the terms and conditions of the Creative Commons Attribution (CC BY) license (https://creativecommons.org/licenses/by/4.0/).
Share and Cite
Kim, Y.-H.; Choi, J.-S.; Yuan, T.-F.; Yoon, Y.-S. Evacuation of Shelter in Place at Subway Transfer Stations Based on BIM and Proposal of a Strengthening Method. Buildings 2022, 12, 1981. https://doi.org/10.3390/buildings12111981
Kim Y-H, Choi J-S, Yuan T-F, Yoon Y-S. Evacuation of Shelter in Place at Subway Transfer Stations Based on BIM and Proposal of a Strengthening Method. Buildings. 2022; 12(11):1981. https://doi.org/10.3390/buildings12111981
Chicago/Turabian StyleKim, Young-Hwi, Jin-Seok Choi, Tian-Feng Yuan, and Young-Soo Yoon. 2022. "Evacuation of Shelter in Place at Subway Transfer Stations Based on BIM and Proposal of a Strengthening Method" Buildings 12, no. 11: 1981. https://doi.org/10.3390/buildings12111981