Article

Improve Urban Form to Achieve High Social Sustainability in a Residential Neighborhood Salam New City as a Case Study

by
Amr N. Mohamed
1,2,*,
Ashraf Abd Elfattah Elmokadem
2,*,
Shimaa M. Ali
3,* and
Nancy Badawey
2,*
1
Department of Architectural Engineering and Environmental Design, College of Engineering, Arab Academy for Science and Technology and Maritime, Port Said 3650111, Egypt
2
Department of Architecture and Urban Planning, Faculty of Engineering, Port Said University, Port Said 8583102, Egypt
3
Department of Architecture & Urban Planning, Suez Canal University, Ismailia 8366004, Egypt
*
Authors to whom correspondence should be addressed.
Buildings 2022, 12(11), 1935; https://doi.org/10.3390/buildings12111935
Submission received: 22 October 2022 / Revised: 1 November 2022 / Accepted: 4 November 2022 / Published: 10 November 2022

Abstract

:
The urban built environment has a significant role in leading individuals to outdoor spaces, socializing, and being together. Despite the Egyptian Government’s efforts to provide more housing for people in different forms, they ignore the social life in the new residential neighborhood when designing the neighborhood’s urban form. This paper examines the quantitative connection between the Urban Form Aspects and Social Sustainability in residential communities. The research selects Salam New City in Port Said Governorate as a case study and applies different scenarios for the most important urban aspects. The research uses the simulation method to investigate the effects of the different urban form scenarios on the social aspects by using Urban Modeling Interference (Umi) and DepthmapX simulation software. Finally, the paper concludes that social interaction and activities improve by 48% and social integration will improve by 74% from the base case for Salam New City case study when using the Urban Form Aspects (Green percentage 35%, Mixed land use 40%, Street network 7% with D/H Ratio 4/1), which leads to improving the social life in the selected area.

1. Introduction

Contemporary neighborhoods are exclusively residential and car-centric. Not having access to the essentials close by forces locals to rely on personal vehicles. The new cities in Egypt are an example of these contemporary neighborhoods. One of these new cities is the 10th of Ramadan City in Egypt. During the 30 years from 1977 to 2006, the residents are 500,000 people despite the city being home to about 1,258,200 people, which is 25.2% of the total number of people who were supposed to live there because they do not have enough services with a bad design like schools, places to have fun, public transportation, sidewalks, etc. One interpretation is that it reflects the robustness or frailty of the social fabric at large, as measured by the strength of ties within various networks [1,2]. This makes cities not fulfill the resident’s needs, raises the cost of the infrastructure needed to support outdoor spaces, and raises land values without making better social life in the residential neighborhoods. Egypt is now getting ready to build up to 18 new cities in 2017. To achieve the government’s goal of creating sustainable new communities by the year 2030, this research provides the numerical relationship between urban form and social sustainability, allowing urban planners to consider residents’ needs when creating new residential neighborhoods.
Improving the local environment, reducing traffic, and making walking more pleasant all enhance health and aesthetic enjoyment, reduce emissions, and encourage the residents to participate in physical activities [3,4]. Urban form refers to the size, shape, and configuration of an area or its parts and describes a city’s physical characteristics. Urban form aspects can be concluded as Density, Land-use mix, Urban Pattern and Connectivity, Building Typology, Quality of Centre, and Transport infrastructure [5,6,7,8,9]. Social sustainability is essential to building social capital, which is defined as the trust, mutual understanding, and shared values and behaviors that bind the members of communities together [1,10]. Social sustainability can be concluded as social participation, safety, security, social equity, neighborhood satisfaction, social interaction and activities, and sense of place [5,11,12,13]. Previous studies investigated the relationship between urban form aspects and social sustainability aspects [11,14,15,16,17,18,19]. Most of them demonstrate a qualitative relationship. Rarely do researchers explain the numerical relationship between urban form aspects and social sustainability aspects. Additionally, the Egyptian planning laws neglect the social aspect when designing residential neighborhoods in new cities because of the lack of clarity numerical relationship between urban form aspects and social sustainability aspects. This research aims to create a numerical relationship between the most important urban form aspects and the most important social sustainability aspects at a residential neighborhood level to be a guideline for urban planners when designing a new residential neighborhood. The limitation of this study is within residential neighborhoods in Port said city and can apply to the neighborhoods with areas from 35 acres to 95 acres.
The research uses quantitative and qualitative methodology by using literature review, simulation, and comparative analytical methods. The research starts with a description of the Urban form aspects and social sustainability aspects. Then, the research contains a literature review for the qualitative relationship between the most important urban form aspects and the most important social aspects through their indicators. The research selects a residential neighborhood in Salam New City in Port Said Governorate in Egypt as a case study. After that, the research investigates the effect of changing urban form on the social sustainability aspects at the residential neighborhood scale by having different scenarios for the most important urban form aspects and measuring their effect on the most important social aspects to find the numerical relationship between the different aspects. The research uses Urban Modeling Interface (UMI) simulation software to measure the walkability indicator and DepthmapX simulation software to measure the spatial indicator to evaluate the changing in social aspects The research implies a new design for the selected neighborhood to achieve high social sustainability. The research finds when the residential neighborhood includes a green percentage of 35%, Mixed land use of 40%, and a Street network of 7% with a D/H Ratio of 4/1, The Social Interaction and Activities will improve by 48% and The Social Integration will improve by 74% from the base case. Urban planners can use these findings to improve the social life in the new residential neighborhood in Egypt, and these findings can be a guideline to change the Egyptian urban laws for designing new communities.

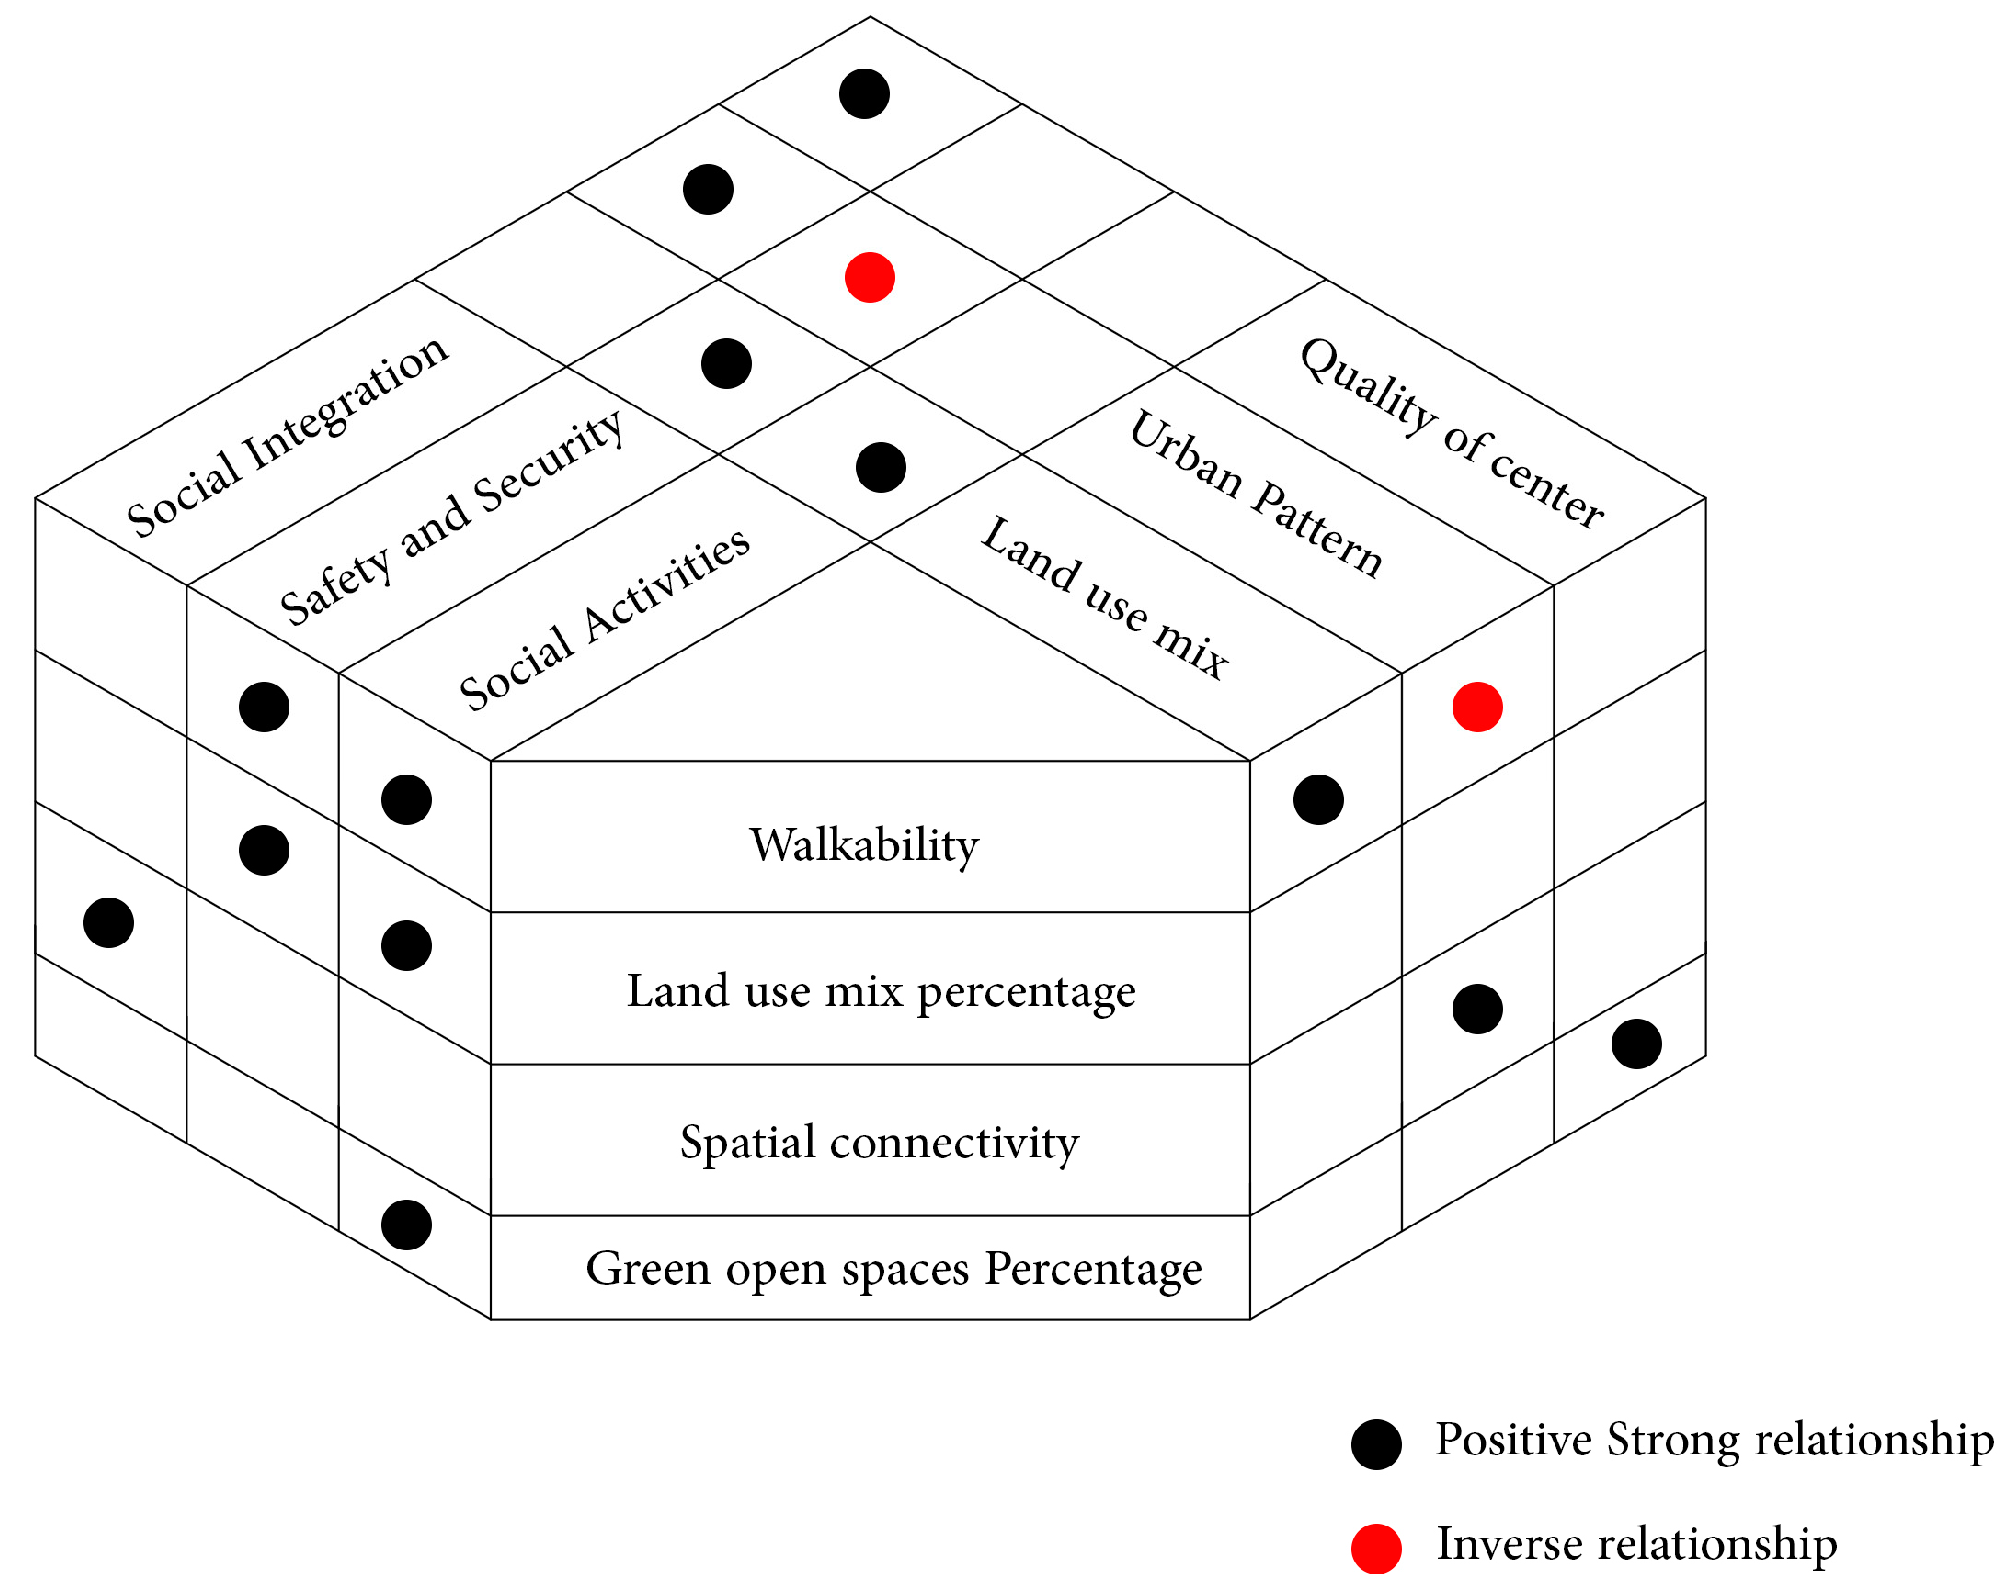
2. Explaining the Relation between Social and Urban Form Aspects

Social aspects are generally overlapping together so that an increase or decrease in one indicator can affect the other. According to previous researchers [20,21,22,23,24], the most important social sustainability aspects are social interactions and networks, social integration and security, and Safety. According to previous researchers [25,26,27,28,29,30], the most important urban form aspects are Mixed-use, Urban Pattern, and Quality of Centre.
There is a positive relationship between mixed land use and walkability, and social interaction, safety, and security. In other words, by increasing walkability, safety and social activities increase, and with high mixed-use, social interaction, and activities increase too [5,22,31,32,33,34,35,36]. Additionally, there is a positive relationship between social integration and Connectivity [15,16,31,37,38]. There is an indicator for each social sustainability and urban form aspect, allowing for an evaluation of the degree to which each aspect was met. These indicators are measurable through different simulation software. Figure 1 concludes the previous relations between social aspects, urban form aspects, and their indicators. One of the most important indicators is walkability, as it links to the quality of life in many ways. Walkability refers to the level at which an urban setting encourages its residents to walk [39]. Connectivity is one of the few proxies related to resilience that is also commonly associated with urban morphology, design, and regeneration. connectivity is a crucial parameter, so areas with low levels of connectivity can have several points of failure, thus leaving the system vulnerable [37]. Table 1 contains the most important urban form and social sustainability aspects, along with their most important indicators and the relationship between them.

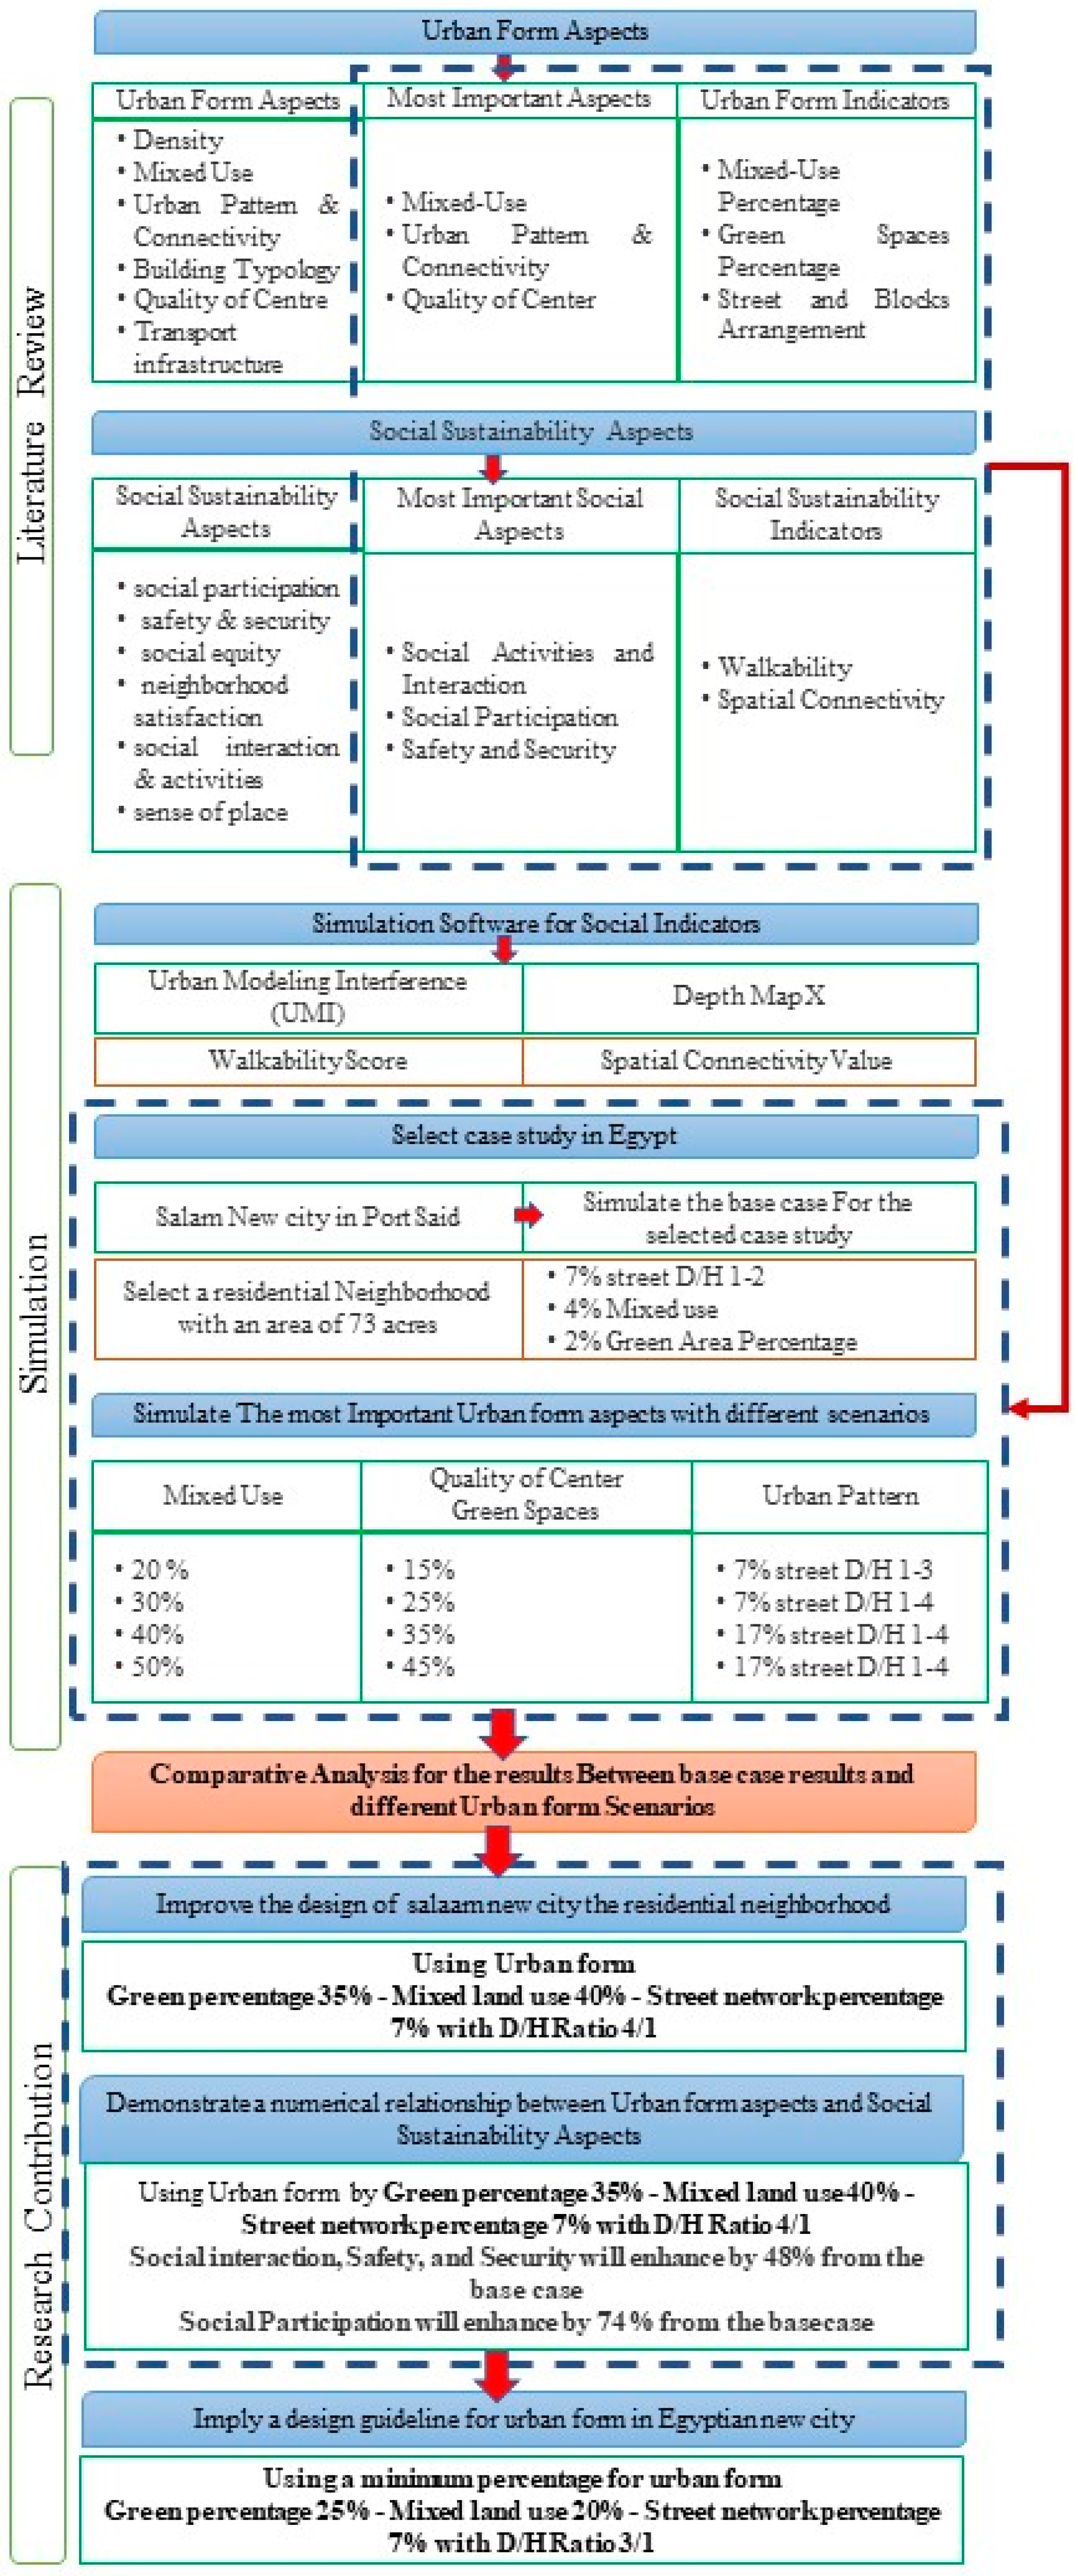
3. The Research Methodology

The research uses quantitative and qualitative methodology by using literature review, simulation, and comparative analytical methods. The research defines the main aspects of social sustainability and urban form. Then, the research describes the most important urban form and social sustainability aspects and extracts their quantitative indicators. The research selects a case study in Egypt in Salam New city in Port said Governorate. The research simulates the base case for the selected case study and the different scenarios for the Urban form indicators by using Urban Modeling Interference (UMI) plugin in Rhino simulation software and depthmapX software. The research compares and analyzes the results of different urban form scenarios with base case to evaluate social improvements in the selected neighborhood. Finally, the research demonstrates a quantitative percentage for the urban form to improve the social aspects in the residential neighborhood in Port Said City. Figure 2 explains the research methodology and process.

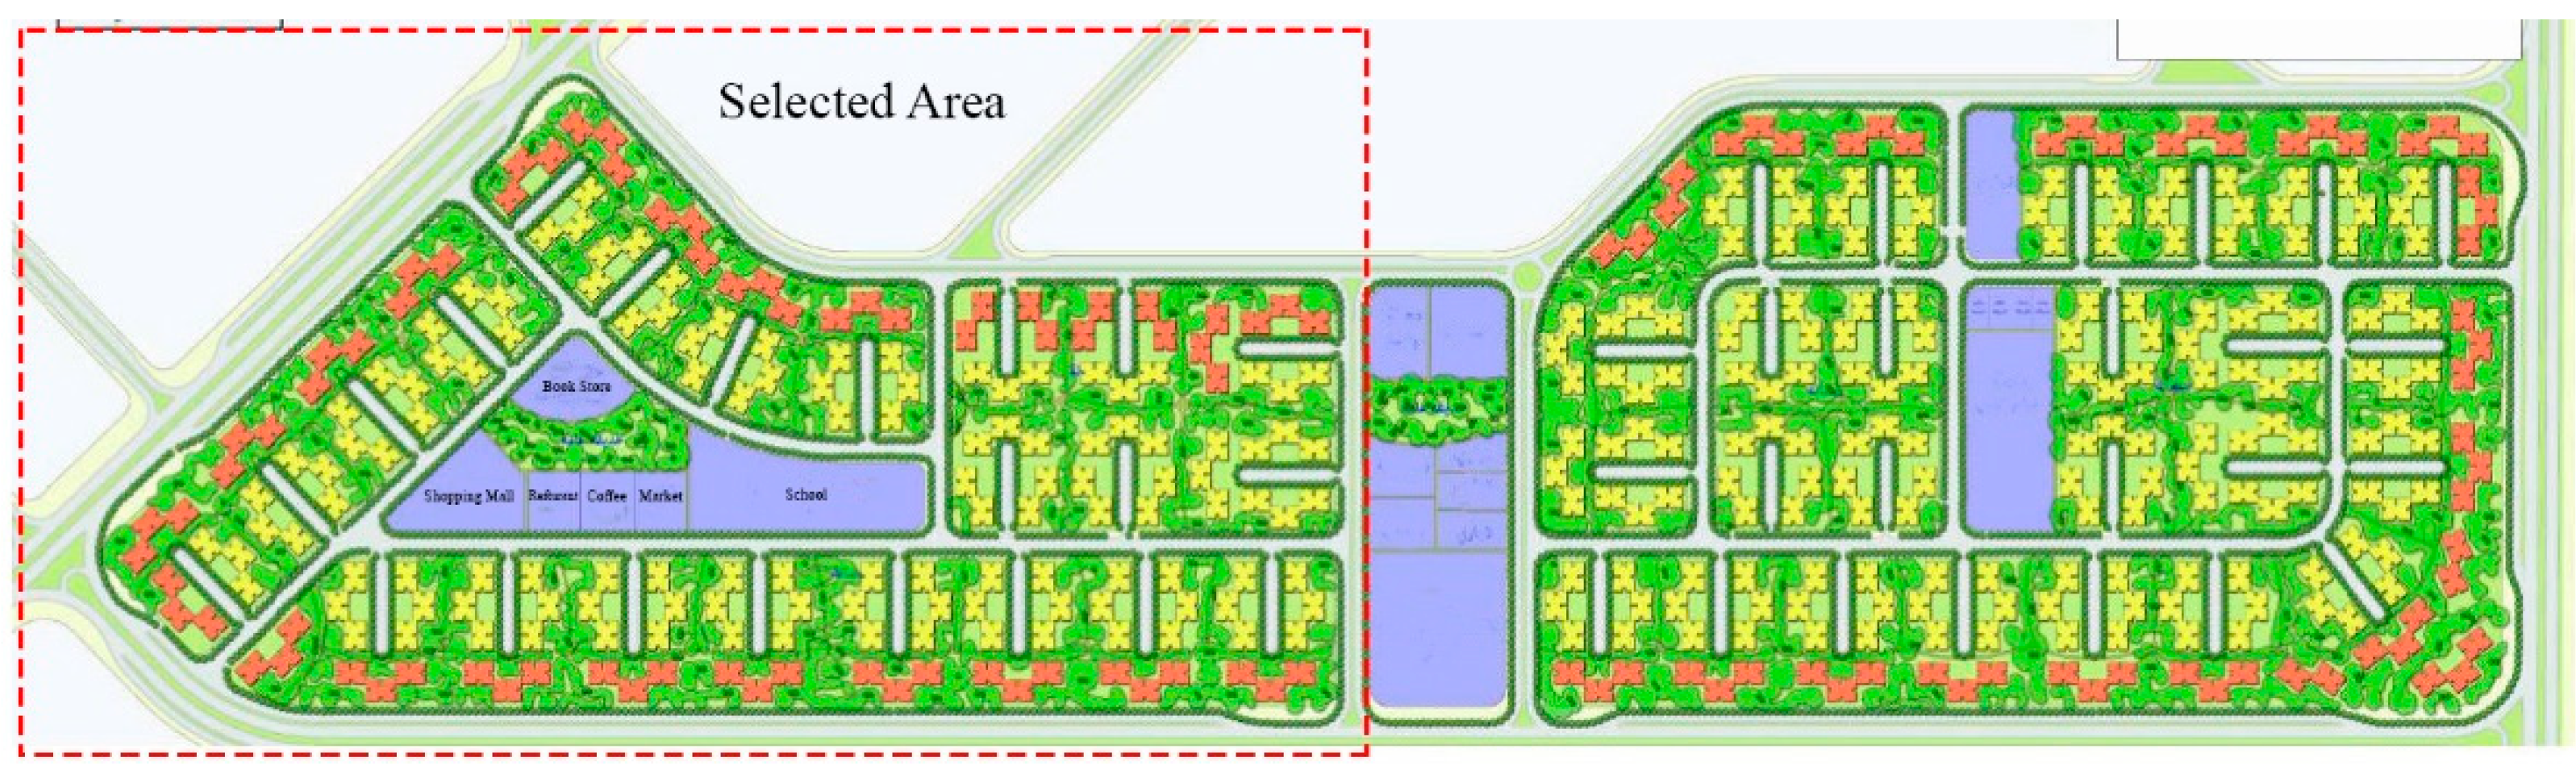
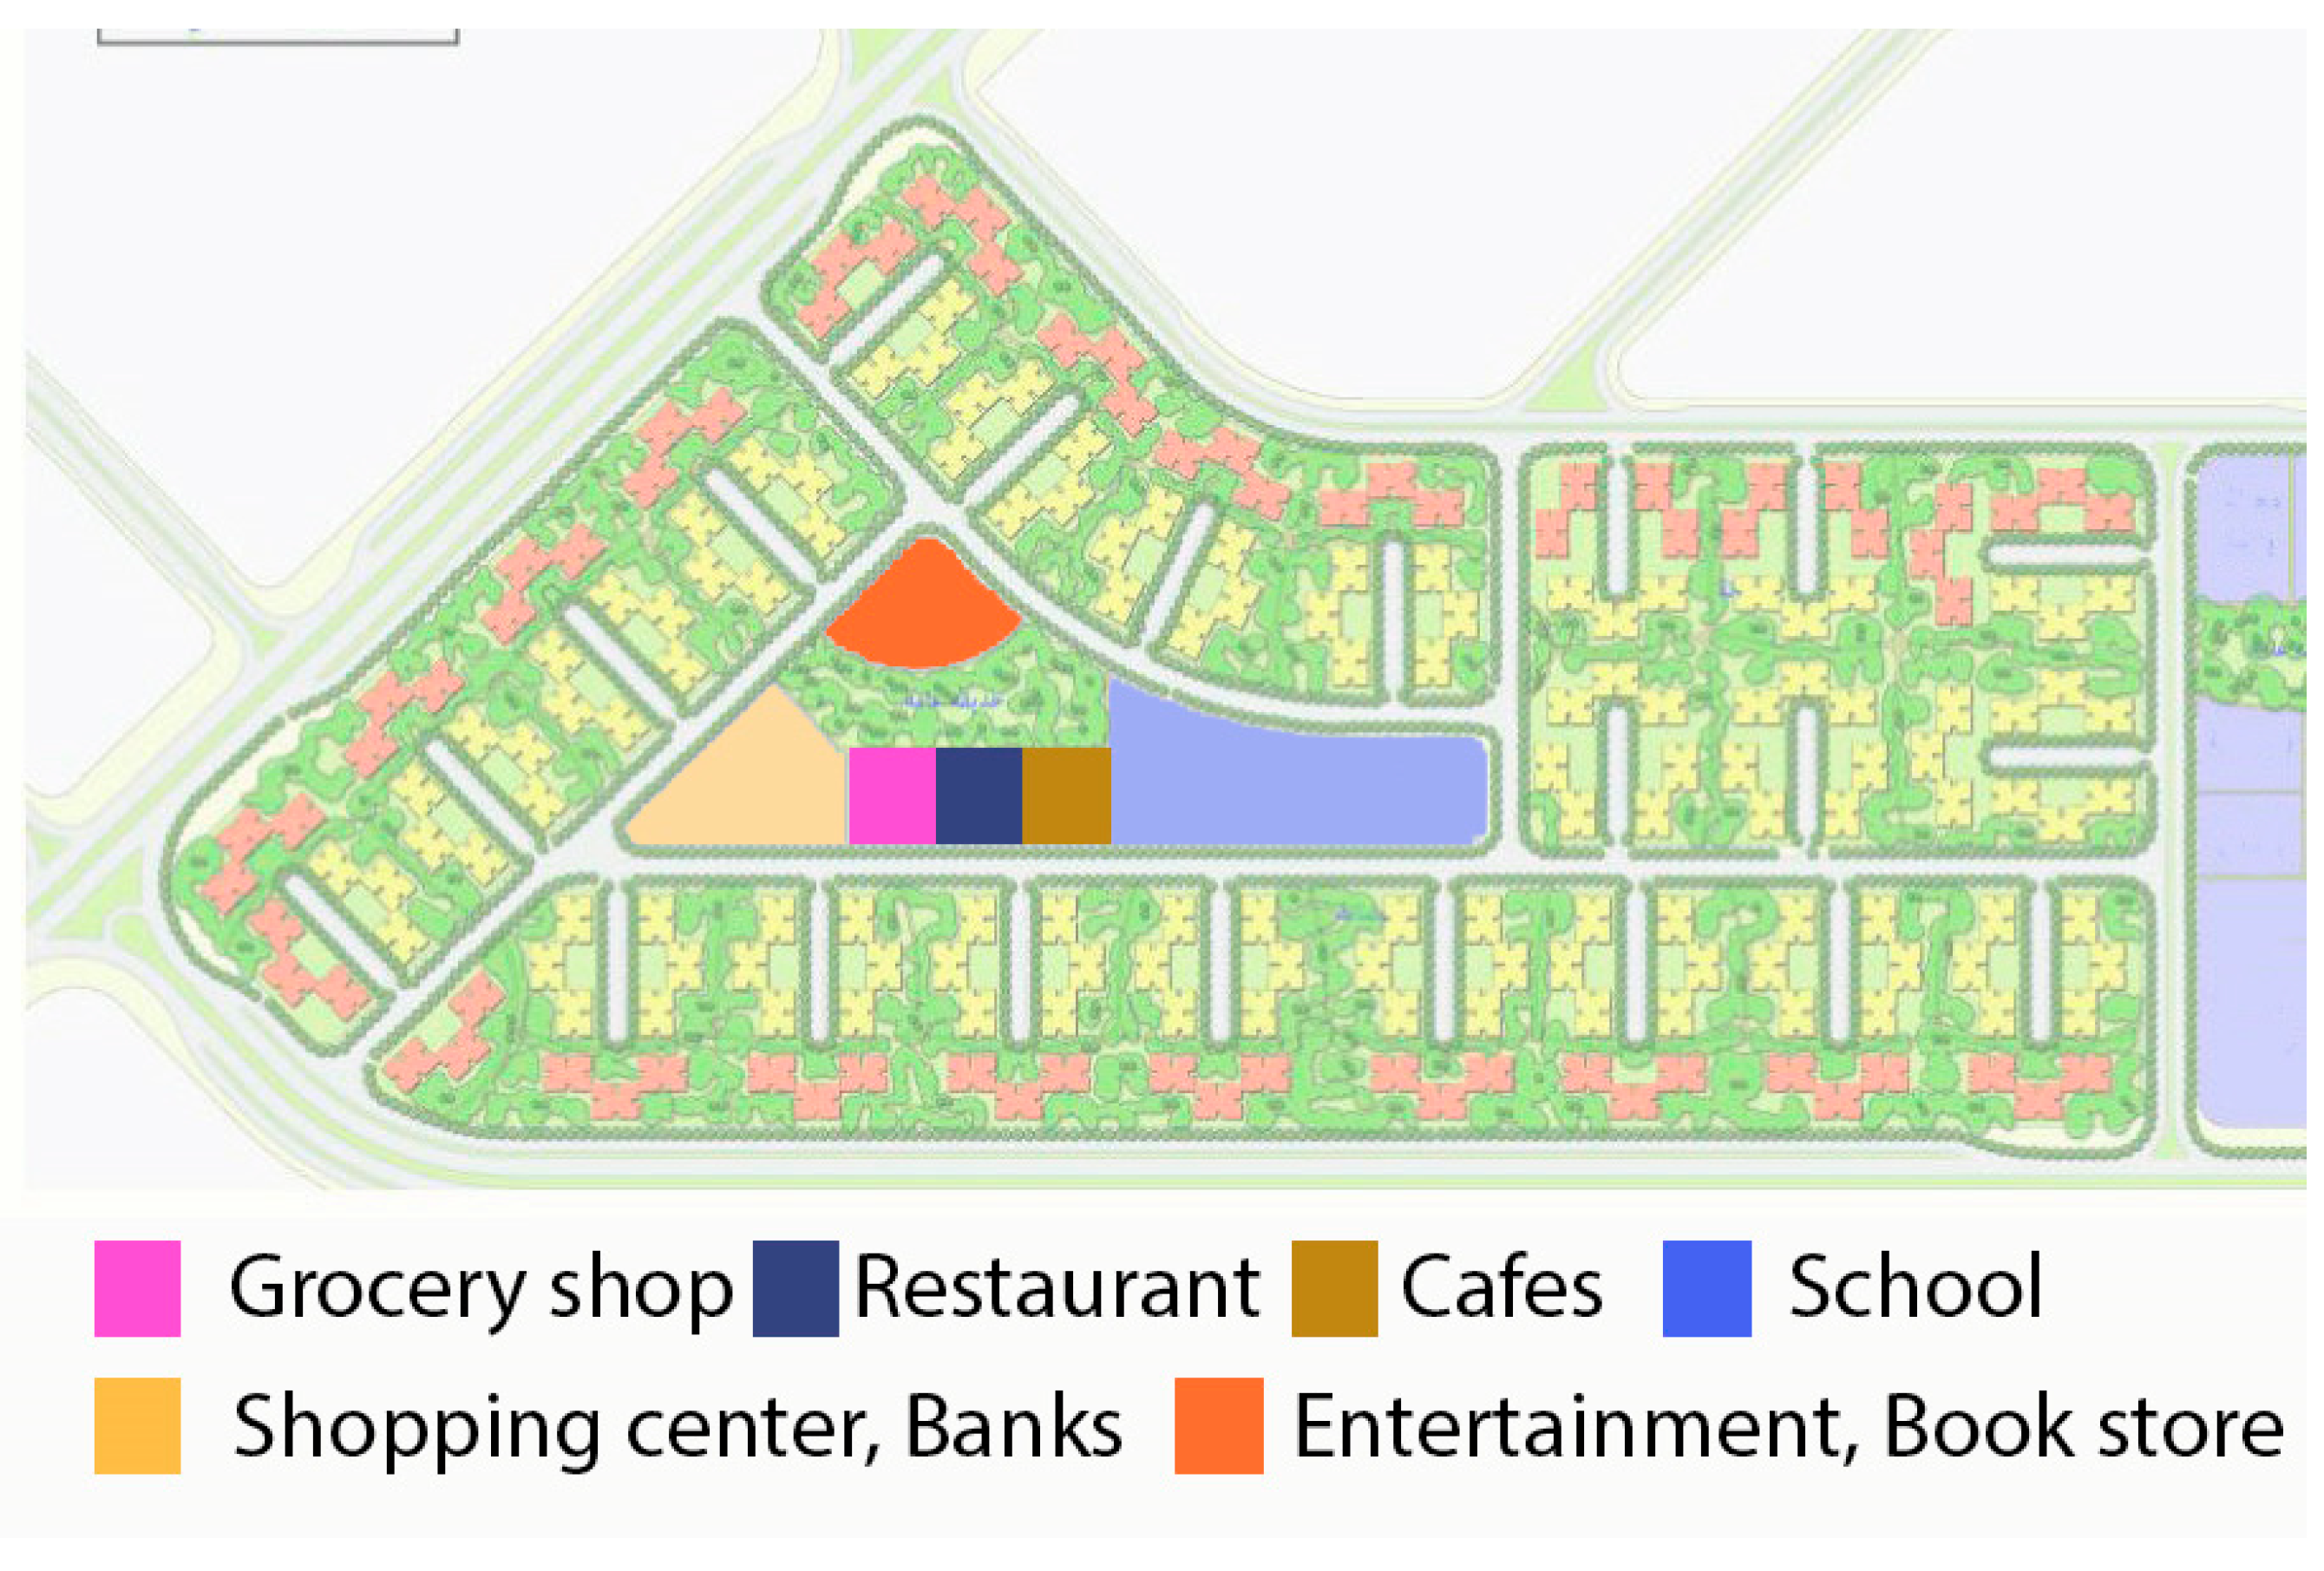
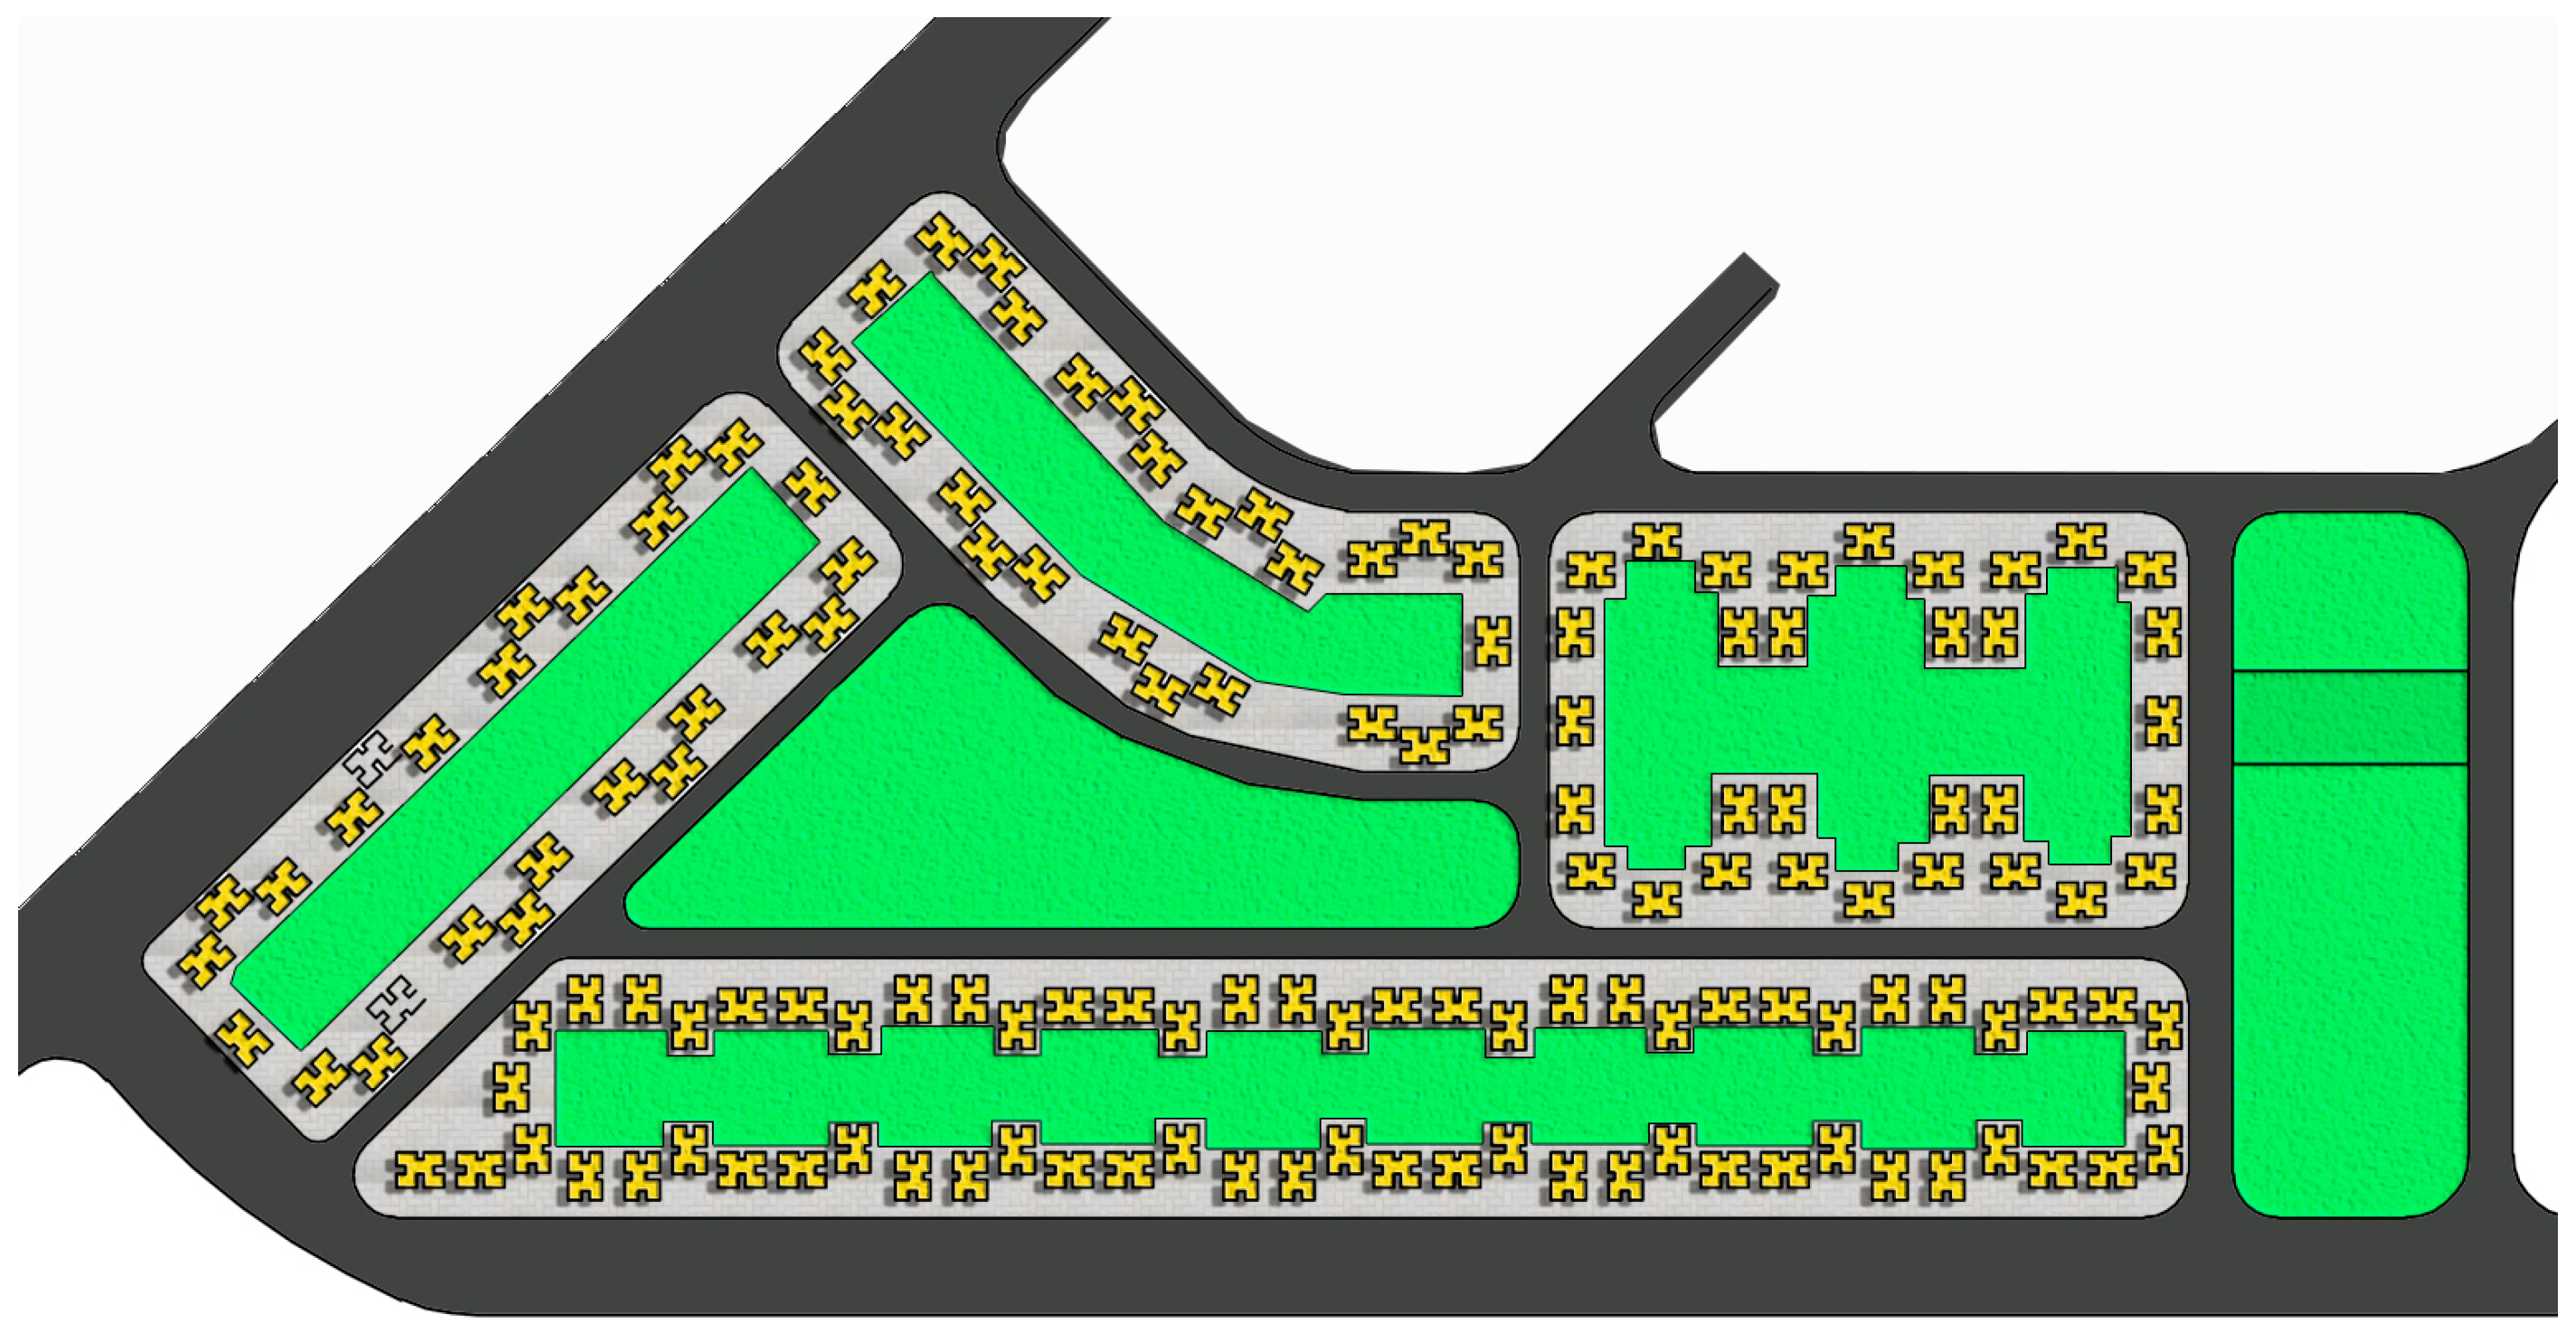
4. The Selected Case Study

The study selects a medium-sized area for a residential complex for a social housing project, which is the prevailing model for the implementation of social housing projects at the national level in the Egyptian Republic. All study areas are barely completed but have not yet been inhabited and have not been handed over to their beneficiaries. The case study is in Port Said City, Salam New City, one of the cities of the Suez Canal region, which is considered one of the most important areas at this moment and contains many development projects. This plan includes a new neighborhood dedicated to social housing. This neighborhood contains a group of residential buildings and a service center. Part of that residential complex comprises an area of about 306,659 m2 with a total number of buildings of about 190 residential buildings with an average area of 289 m2. This part includes a service center and a small park. Figure 3 presents the layout of the residential neighborhood in Salam New City.

5. Data and Simulation Method

This part contains the analysis and measurements of the effect of the urban form aspects on the social aspects.
The research use UMI and depth map X as simulation software. UMI is a Rhinoceros 6 plugin developed by the MIT Sustainable Design Lab to assess the environmental performance of neighborhoods, including walkability. DepthmapX is a spatial analysis platform designed for studying social processes within different scales of the built forms; aiming at deriving variables that may have social significance.
The current urban form aspects for the base case are mixed land use of 4%, a U-shaped urban pattern with a D/H ratio of 2/1, and street percentages of 17% and 2% green open spaces. Researchers proposed urban form scenarios to evaluate the changes in the social aspects. The researchers select these scenarios based on the case study’s residential use, keeping urban density constant to not affect the number of units, so the researchers propose a maximum 50% mixed-use percentage as a scenario according to the total number of the residential blocks. Additionally, to get the maximum usage from the selected area and not waste space in the surrounding area, the researchers do not propose more than a 45% green area percentage as a scenario. The current amenities for the selected area are in Figure 4.
The previous walk score system was built according to the main important amenities grocery, restaurants, shopping, cafes, schools, banks, bookstores, parks, and entertainment. The researchers use the same evaluated methodology, as it has great similarities between its design amenities and Egypt amenities that use in the residential neighborhood design in Egypt, so the researcher uses this method as it is fulfilling the residents’ needs.

5.1. The Urban Configurations That Used in the Simulation Setting

Table 2 contains the walkability score description that using in the following results and analysis.
Table 3 below contains the most effective urban configuration that has a great effect on the social sustainability aspects. These urban configurations are extracted from the literature review and the relation between the urban form aspects and social sustainability aspects.

5.2. Simulate Different Scenarios for the Most Important Urban Form Aspects

The following simulation contains the base case simulation results with its current urban configuration: Green Open Spaces percentage from 15% to 45%, Mixed-use percentage from 20% to 50%, and Urban Pattern with a U-shape arrangement with different D/H ratios. The simulation will be for each aspect with different scenarios with the constant of the other urban form aspects and then to simulate all aspects with the best scenario of each aspect in one case.

5.2.1. Base Case Simulation Results

Urban form aspects of the base case are Green open space 2% (6439.75 m2), mixed Land Use 4%, a U-Shape urban pattern with a D/H ratio of 2/1, and with a street percentage of 17%. The results of this case are as follows:
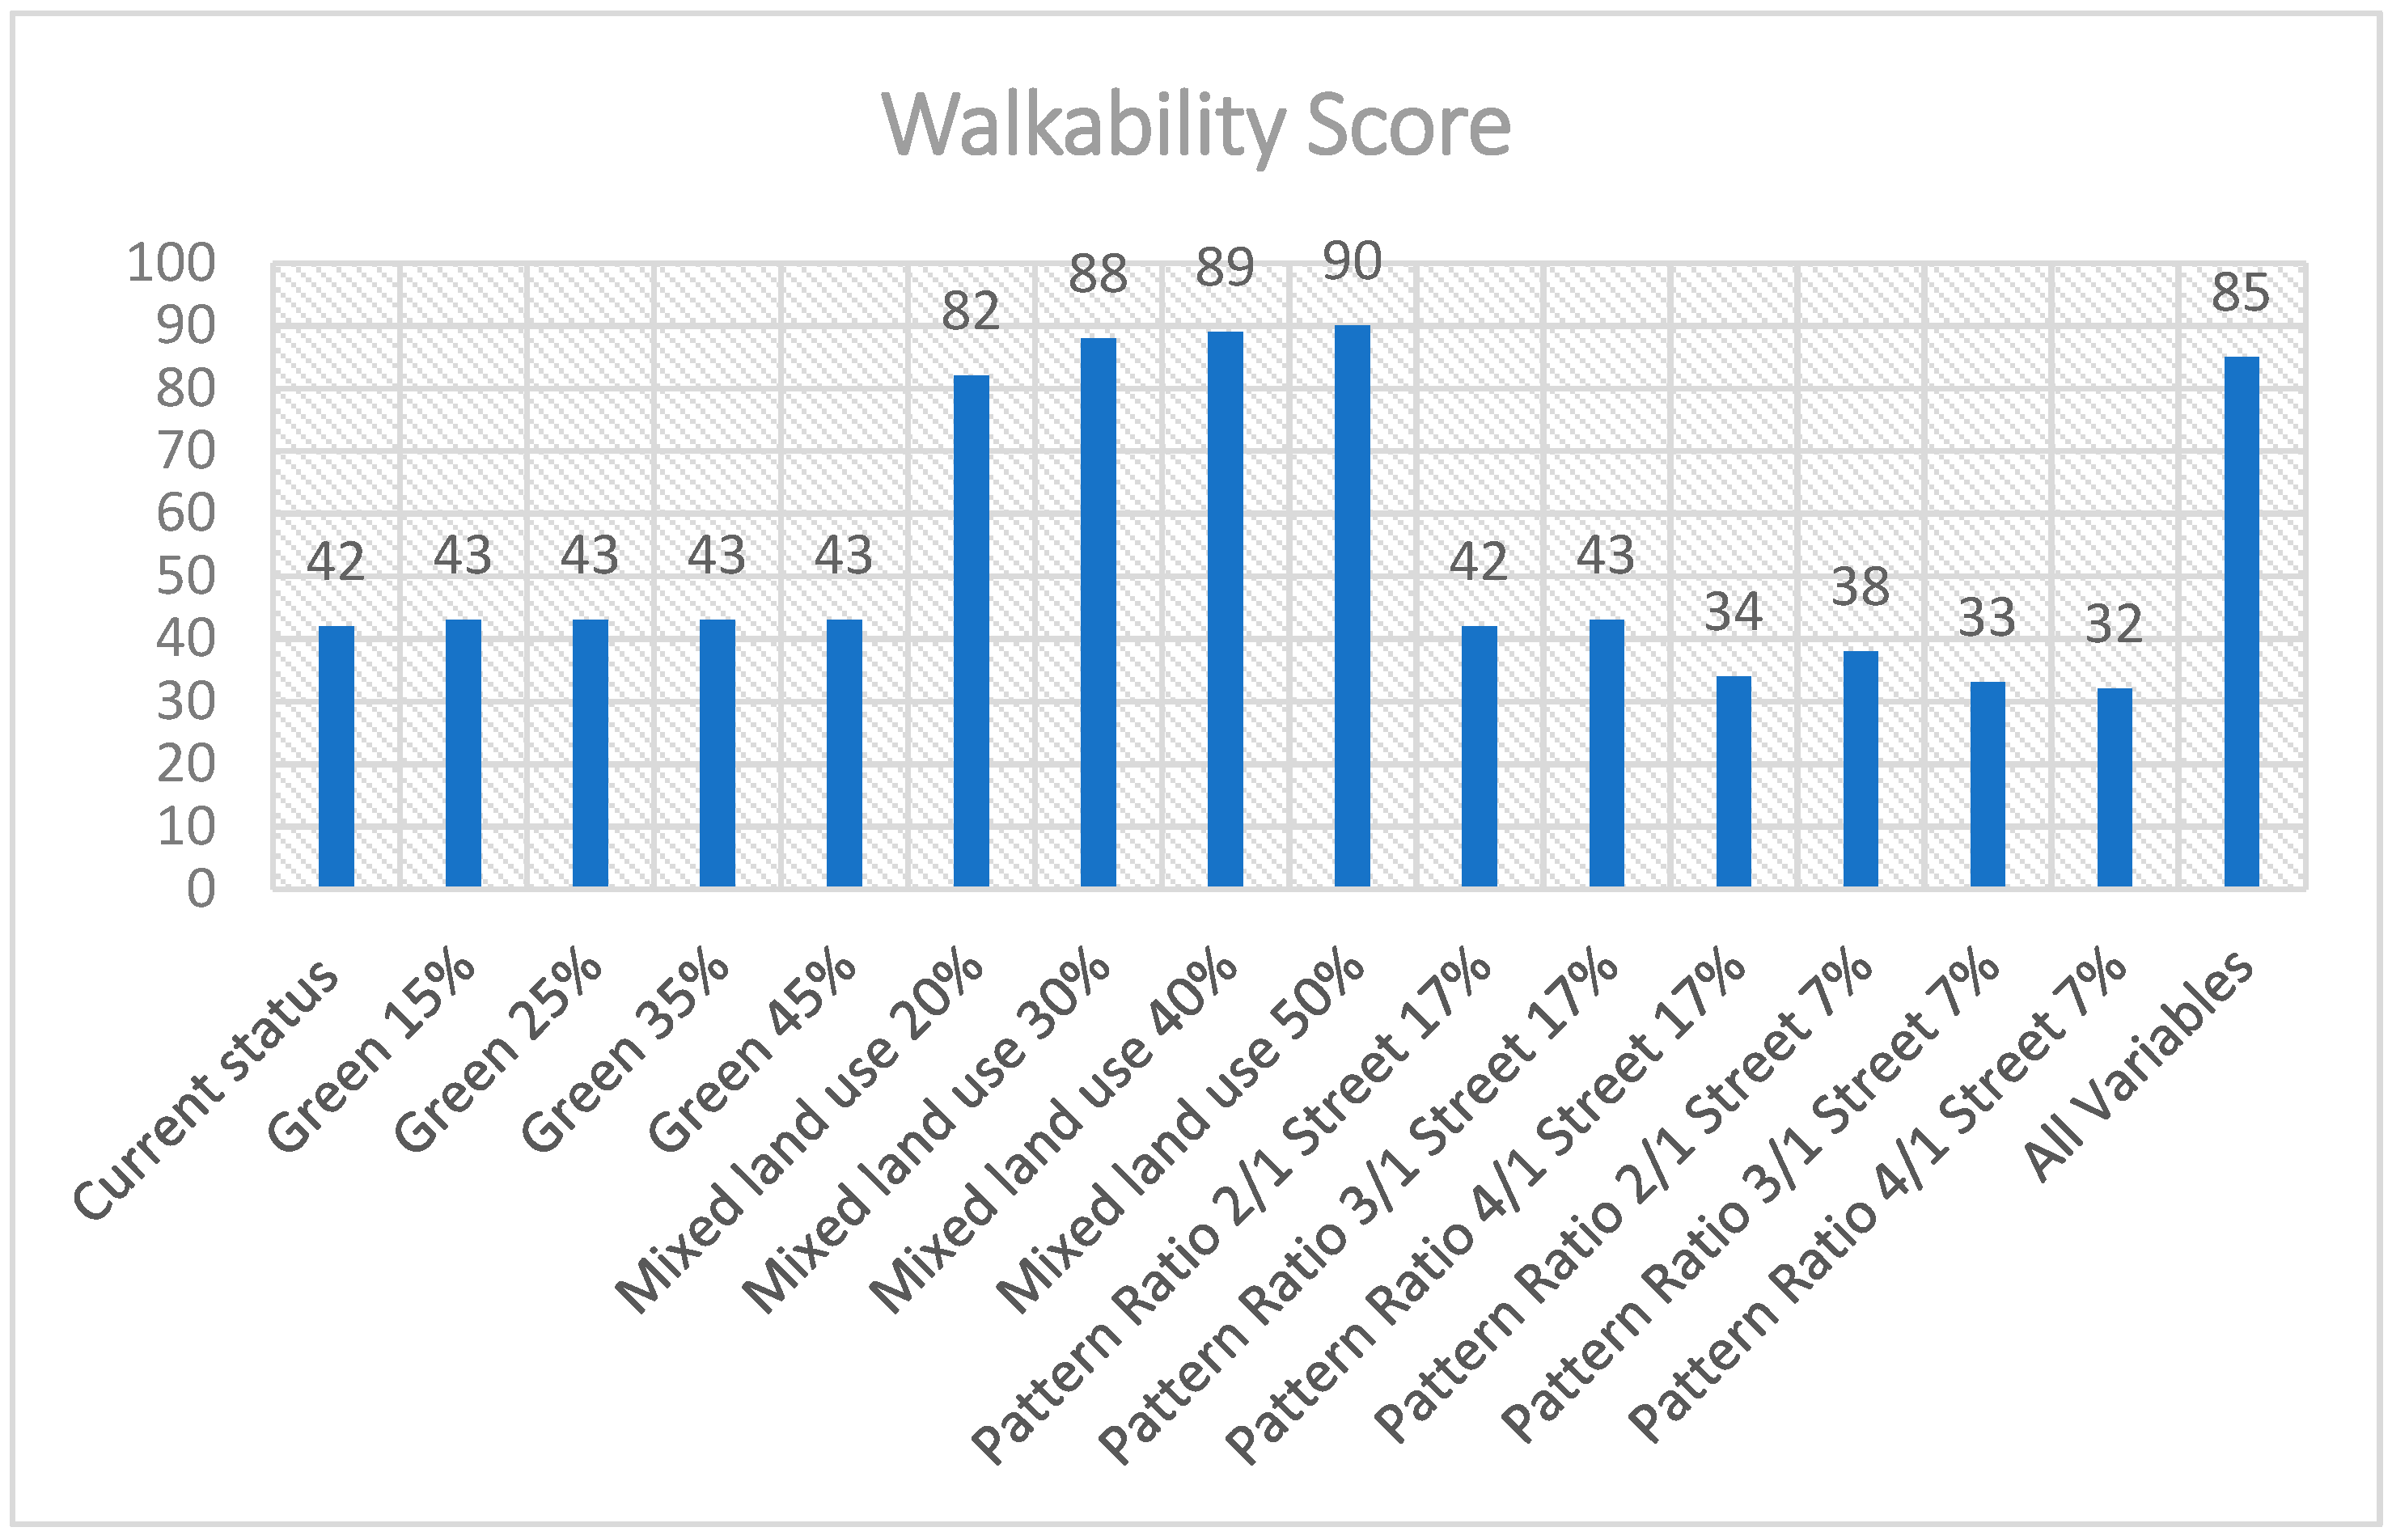
  • Walkability Score: The Walkability score is 42, which is car-dependent (most errands require a car), according to The Walk Score methodology. That means the area is unsafe.
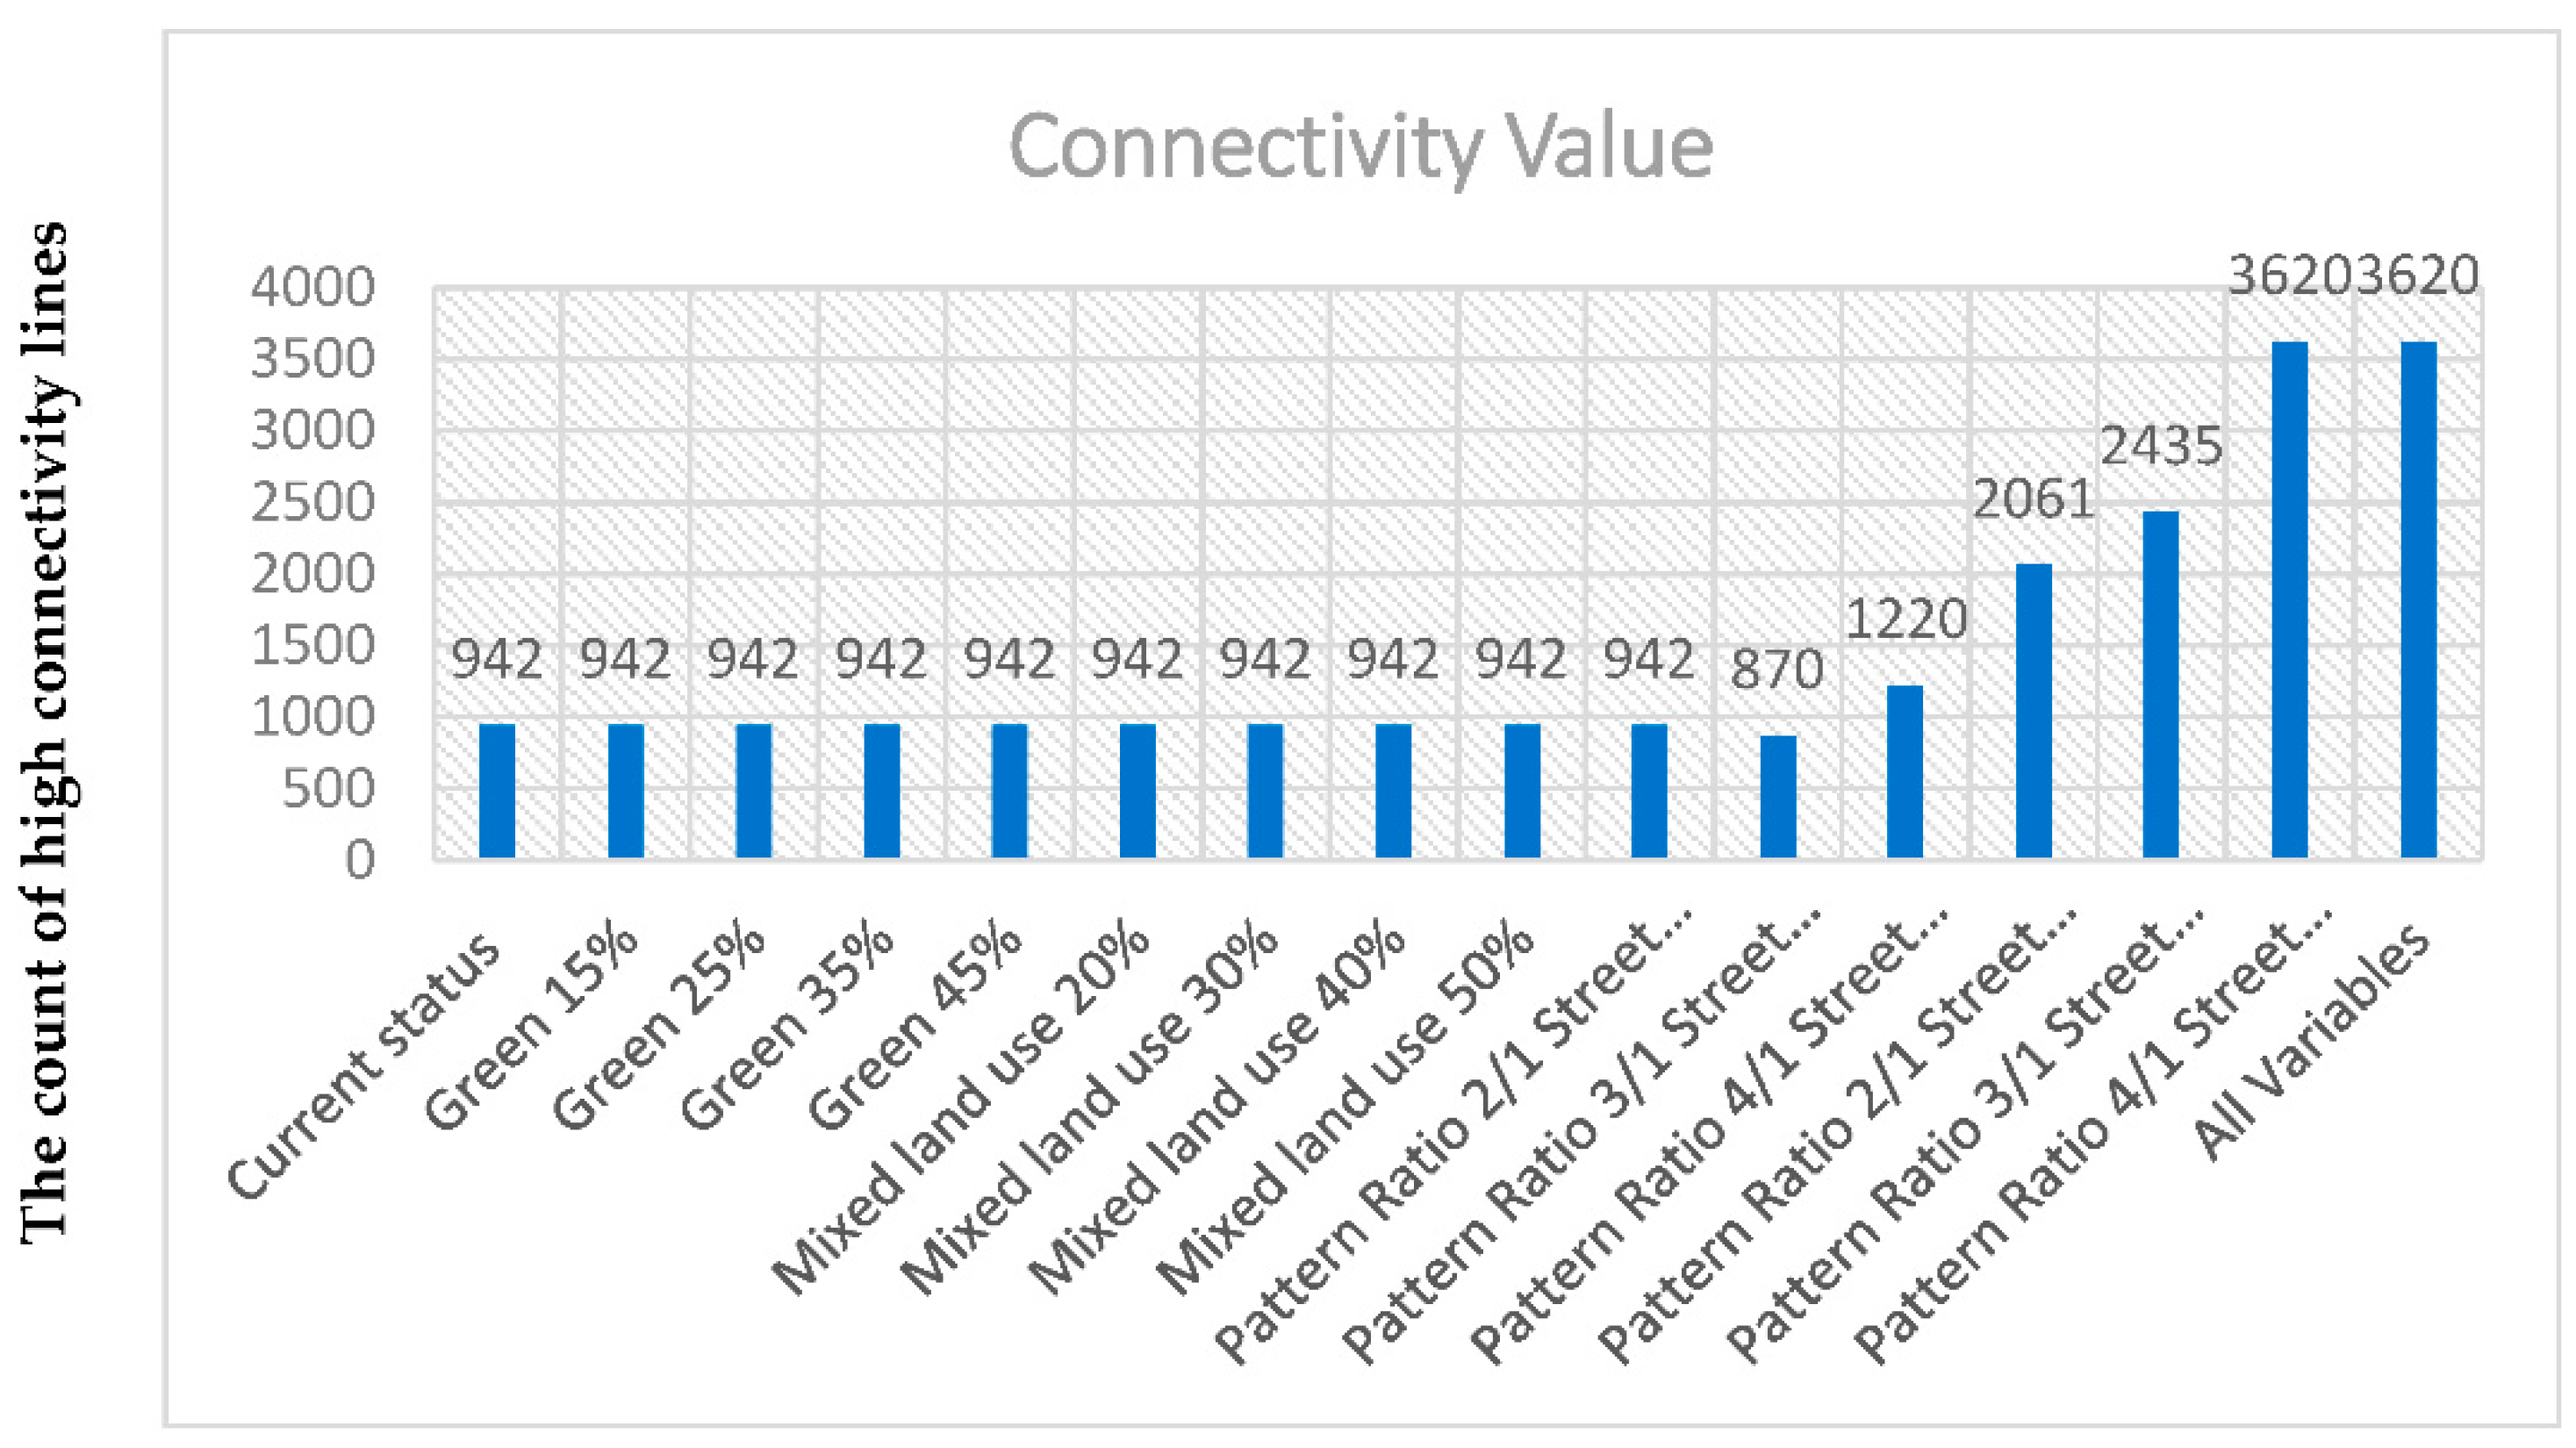
  • Connectivity Value: The area has a low connectivity value between different spaces. The average of the connectivity line is 942 from the total connectivity line.
The area has 4% mixed-use, which indicates the lack of different uses in the area, and the most used is residential use. The urban pattern is in a U shape with a D/H ratio of 2/1. The green percentage is 2% of the total area. Low walkability and connectivity indicate low social interaction, safety, and integration.

5.2.2. Green Open Spaces Percentage with Constant of Mixed Land Use Percentage and Urban Pattern

The researchers analyze the effect of the different green area percentages on the social aspects through the social indicator’s value.
The total area is 306,659 m2. The contestant factors are mixed land use 4% and U shape urban patterns with a D/H ratio 2/1 and with a street percentage of 17%. The analysis contains various scenarios of the green area percentage from the total area.

Scenario 15% with an Area (47,650 m2)

  • Walkability Score: The walkability score is 43, indicating Car-Dependent (Most errands require a car) according to The Walk Score methodology, which means the area is unsafe.
  • Connectivity Value: the area still has a low connectivity value between different spaces—the average of the connectivity line is 942 from the total connectivity line which means the area has low social integration with no progress.
With the constant of a mixed-use percentage of 4% and the urban pattern in a U-shape Urban Pattern with a D/H ratio 2/1 and modifying The Green area Percentage by 15% From the total Area There is little Effect on the Walkability score, they are still unsafe, and the connectivity value has no effect with means the social integration still weak.

Scenario 25% with an Area (76,664 m2)

  • Walkability Score: The Walkability score is 43, indicating Car-Dependent (Most errands require a car) according to The Walk Score methodology, which means the area is unsafe.
  • Connectivity Value: the area still has a low connectivity value between different spaces—the average of the connectivity line is 942 from the total connectivity line which means the area has low social integration with no progress.
With the constant of a mixed-use percentage of 4% and the urban pattern in a U-shape Urban pattern with a D/H ratio 2/1 and modifying the green area percentage by 25% from the total area, there is little effect on the Walkability score, but they are still unsafe, and the connectivity value has no effect with means the social integration still weak.

Scenario 35% with an area (107,330 m2)

  • Walkability Score: The Walkability score is 43, indicating Car-Dependent (Most errands require a car) according to The Walk Score methodology, which means the area is unsafe.
  • Connectivity Value: Connectivity Value, the area still has a low connectivity value between different spaces—the average of the connectivity line is 942 from the total connectivity line, which means the area has low social integration with no progress.
With the constant of a mixed-use percentage of 4% and the urban pattern in a U-shape Urban Pattern with a D/H ratio 2/1 and modifying the green area percentage by 35% From the total Area, there is little effect on the Walkability score, but they are still unsafe, and the connectivity value has no effect with means the social integration still weak.

Scenario 45% with an Area (137,996 m2)

  • Walkability Score: The Walkability score is 43, indicating Car-Dependent (Most errands require a car) according to The Walk Score methodology, which means the area is unsafe.
  • Connectivity Value: Connectivity Value, the area still has a low connectivity value between different spaces—the average of the connectivity line is 942 from the total connectivity line which means the area has low social integration with no progress.
With the constant of a mixed-use percentage of 4%, The urban pattern in a U-shape urban pattern with a D/H ratio 2/1 and modifying The Green area Percentage by 45% From the total Area and There is little effect on the Walkability score, but they are still unsafe, and the connectivity value has no effect with means the social integration still weak.

Summary

From the previous results, the research can conclude that:
  • Walkability Score: The Walkability score is increased a little bit which indicates Car-Dependent (Most errands require a car) according to The Walk Score methodology, which means the area is unsafe.
  • Connectivity Value: Connectivity Value, the area has a low connectivity value between different spaces—the maximum achieved connectivity value is 0.05%—which means the area has low social integration.
The following Table 4 contains a comparative analysis of walkability and connectivity value results for the different green space scenarios.
The results of the connectivity values are constant with no change in the various green percentage which means the social integration is not improved. The walkability score has a little change compared with the base case with a percentage of 3% but there is no effect with various green percentages, so the social activities and interaction and the safety and security have no great improvement.

5.2.3. Mixed Land Use Percentage with Constant of Urban Pattern and Green Area Percentage

The base case has a total building unit count of 190 residential buildings with 9 mixed-use buildings (4%) with a contestant factor of the green percentage of 2% and a U-Shaped urban pattern with a D/H ratio of 2/1. The number of buildings is constant in all scenarios (190 buildings), but the difference in each scenario is the use of the ground floor Some of the building is residential and the other is another use (a mixed-use building). The selection of which building is mixed land use is random, as the location does not matter.
Note that the urban density is constant. When changing the ground floor from being a mixed-use instate to residential use, an extra floor is added to be a residential use instead of the ground, so the total block height is 19 m instead of 15 m on the neighborhood borders.

Scenario 20% Mixed-Use Buildings

  • Walkability Score: The Walkability score is 82 which is Very Walkable according to The Walk Score methodology, which means the area becomes safe
  • Connectivity Value: the area still has a low connectivity value between different spaces—the average of the connectivity line is 942 from the total connectivity line, which means the area has low social integration with no progress.
A high effect on the walkability score indicates that the neighborhood has become safe, while the connectivity value has no effect, indicating that social integration is still weak. This is true even though the percentage of the green area has been held constant at 2% and the urban pattern has been kept in a U shape with a D/H ratio of 2/1.

Scenario 30% Mixed-Use Buildings

  • Walkability Score: The Walkability score is 88 which is very Walkable according to The Walk Score methodology, which means the area becomes safe.
  • Connectivity Value: the area still has a low connectivity value between different spaces—the average of the connectivity line is 942 from the total connectivity line which means the area has low social integration with no progress.
A higher Walkability score indicates that the neighborhood is still secure, while a lack of change in the connectivity value indicates that social integration is still weak. These assumptions are made while holding the green area percentage constant at 2% and the urban pattern in a U shape with a D/H ratio of 2/1.

Scenario 40% Mixed-Use Buildings

  • Walkability Score: The Walkability score is 89 which is Very Walkable according to The Walk Score methodology which means the area becomes safe
  • Connectivity Value: the area still has a low connectivity value between different spaces—the average of the connectivity line is 942 from the total connectivity line which means the area has low social integration with no progress.
Keeping the percentage of green space and the urban pattern (a U with a D to H ratio of 2 to 1) unchanged, while increasing the percentage of mixed land use to 20% of the total land use, has a negligible impact on the walkability score while leaving the neighborhood feeling secure. There is no change in social integration despite increasing the Connectivity value.

Scenario 50% Mixed-Use Buildings

  • Walkability Score: The Walkability score is 90, which is High Walkable according to The Walk Score methodology, which means the area becomes safe.
  • Connectivity Value: the area still has a low connectivity value between different spaces—the average of the connectivity line is 942 from the total connectivity line which means the area has low social integration with no progress.
Keeping the percentage of green space and the urban pattern (a U with a D to H ratio of 2 to 1) unchanged, while increasing the percentage of mixed land use to 20% of the total land use, has a negligible impact on the walkability score while leaving the neighborhood feeling secure. There is no change in social integration despite increasing the connectivity value.

Summary

From the previous results, the research can conclude that:
  • Walkability Score: Mixed land use percentages between 40% and 50% are acceptable and can be achieved to achieve a safe and secure neighborhood, which improves their walkability score relative to the base case.
  • Connectivity Value: With a mean connectivity line of 277 (constant) out of a possible 1000, the local community is not making any strides toward greater social integration.
The following Table 5 contains a comparative analysis of walkability and connectivity value results for the different mixed-use scenarios.
According to the previous results, the value of the walkability score increased by 53% from the base case, suggesting an improvement in the social activities and safety and security aspects because of the shift to a more mixed-use percentage. However, increasing the percentage of mixed land use does not affect social integration.

5.2.4. Urban Pattern Indicator with Constant of Mixed Land Use Percentage and Green Area Percentage (Street Percentage 17% from Total Area)

The prosperities of the urban open space, the width (or distance) of open space (D), such as public squares and streets, to the height of the surrounding buildings (H), is known as the D/H ratio (H) [7]. To assess the effect of changing the urban pattern on the social aspects, the D/H ratio should be a factor in the proposed different scenarios.
The analysis includes different D/H ratios with U-shaped urban patterns to assess the most applicable urban patterns that achieve the best results for the social aspects.

Scenario 3/1 D/H Ratio

  • Walkability Score: The walkability score is 43, which indicates to Car-Dependent (Most errands require a car) according to The Walk Score methodology, which means the area is unsafe.
  • Connectivity Value: The connectivity value has increased. the average of the connectivity lines is 870 of the total connectivity lines, which means social integration is increased.
As expected, the walkability score rises slightly when the urban pattern is altered, but the results show that the neighborhood is still not safe for pedestrians. Compared to where we are now, our connectivity value has decreased, indicating that the neighborhood is not very well-integrated.

Scenario 4/1 D/H Ratio

  • Walkability Score: The walkability score is 34, which indicates to Car-Dependent (Most errands require a car) according to The Walk Score methodology, which means the area is unsafe.
  • Connectivity Value: the area has a low connectivity value. the average of the connectivity lines is 1220 from the total connectivity lines which means the social integration is increased.
When comparing the base case and the pattern ratio of 3:1, the results show that a decrease in walkability occurs when the urban pattern is altered, indicating a decline in neighborhood safety. The value of connectivity is higher than in the baseline case, and the ratio of 3 to 1 indicates a higher degree of social integration.

Summary

From the previous results, the research can conclude that:
  • Walkability Score: The walkability value is up and down when changing the urban pattern which indicates in all cases non-improving in Safety and Security.
  • Connectivity Value: There is increasing in the connectivity value when changing the urban pattern, which indicates a little improved social integration.
The following Table 6 contains a comparative analysis of walkability and connectivity value results for the different mixed-use scenarios.
The results show fluctuating walkability scores, suggesting a connection between walkability and urban pattern as measured by the D/H Ratio. The percentage increase was around 3% relative to the base case, and the percentage decreased by around 20% in alternative cases. The Connectivity Score increased by 23% from the base case, while, in other cases, it decreased by 8%. This demonstrates a positive and negative relationship between the urban pattern ratio and the connectivity value. Since streets in open areas discourage people from mingling, the social aspects of a place do not improve when the street network accounts for about 17 percent of the total area.

5.2.5. Urban Pattern Indicator with Constant of Mixed Land Use Percentage and Green Area Percentage (Street Percentage 7% from Total Area)

The following analysis presents different D/H scenarios with a street percentage of 7% to assess their impact on the social aspects.

Scenario 2/1 D/H Ratio

  • Walkability Score: The Walkability score is 38, which indicates to Car-Dependent (Most errands require a car) according to The Walk Score methodology, which means the area is unsafe.
  • Connectivity Value: The area has a low connectivity value between different spaces—the average of the connectivity lines is 2061 from the total connectivity lines, which means the area has low social integration with little progress compared to the base case.
Only 4% of the land use is classified as mixed-use, so there are no other types of development in the area; the rest is all residential. The city’s layout resembles a U-Shaped Urban Pattern, with a D/H ratio of 2/1. The percentage of green space is 2% of the total area. As a result, walkability and connectivity are of low value, and thus, safety, social interaction, and social integration are also low.

Scenario 3/1 D/H Ratio

  • Walkability Score: The walkability score is 33, which indicates to Car-Dependent (Most errands require a car) according to The Walk Score methodology, which means the area is unsafe.
  • Connectivity Value: Connectivity Value has between different spaces—the average of the connectivity lines is 2435 from the total connectivity lines, which means social integration is increased.
When the urban pattern is changed, walkability drops compared to Pattern Ratio 2-1, indicating a decline in safety and security. Compared to the connectivity value, the Pattern Ratio of 2-1 increased, indicating better social integration.

Scenario 4/1 D/H Ratio

  • Walkability Score: The walkability score is 32 which indicates to Car-Dependent (Most errands require a car) according to The Walk Score methodology, which means the area is unsafe.
  • Connectivity Value: the area has a low connectivity value between different spaces—the average of the connectivity lines is 3620 from the total connectivity lines which means the social integration is increased.
When comparing the base case and the pattern ratio of 3/1, the results show that the walkability score decreases by 1 point when the urban pattern is changed, indicating a decline in neighborhood safety and security. Regarding connectivity, the ratio of 3/1, and the ratio of 2/1 in the Urban Pattern both increase the value of connectivity, which in turn increases social integration. The ratio of urban to rural areas is higher than the 2/1 found in the Urban Pattern.

Summary

From the previous results, the research can conclude that:
  • Walkability Score: There is decreasing in the walkability value when changing the urban pattern which indicates a non-improving in Safety and Security.
  • Connectivity Value: There is increasing in the connectivity value when changing the urban pattern which indicates social integration.
The following Table 7 contains a comparative analysis of walkability and connectivity value results for the different mixed-use scenarios.
Based on these findings, walkability has a negative correlation with changing the urban pattern, as it has been shown to decrease by 24%. In addition, the urban pattern ratio is positively correlated with the connectivity score, and the score itself is rising by a percentage of 74%.

5.2.6. Urban Pattern Indicator with Constant of Mixed Land Use Percentage and Green Area Percentage (Street Percentage 7% from Total Area)

The researchers propose the following model with a specific urban form scenario:
Urban Pattern is a U-shaped Urban Pattern with a ratio of D/H 4/1.
The Street Percentage is 7% of the Total Area.
Green Area Percentage is 35% (about ~122,663 m2).
Mixed land use percentage 40% (Most applicable ratio) with a block height of 19 m (Constant Urban Density).
  • Walkability Score: The walkability score is 82 which is Very Walkable according to The Walk Score methodology, which means the area becomes safe.
  • Connectivity Value: the area has a low connectivity value between different spaces—the average of the connectivity lines is 3620 from the total connectivity lines which means the social integration is increased.
Compared to the base case, the walkability score increases by 40%, which is good news for the community’s sense of safety and the number of opportunities for socialization and interaction among its residents.
A high percentage of mixed land use, with 40% having a significant effect on the walkability score (up 48% from the base case).
Compared to the base case, connectivity has increased by 74%, suggesting an increase in social integration as well.

6. Results and Analysis

The previous simulation results show variation in the social aspects in the selected neighborhood analysis as follows in Figure 5 and Figure 6:
After the previous comparative analysis for the walkability score and connectivity value results, the research concludes the results in the following points:
The change in green percentage does not affect the connectivity value but reduces the walkability score by 3% compared to the base case. Based on the results of this research, any percentage higher than 25% is optimal for social contributions.
Compared to the base case, the walkability score improves by as much as 53% under mixed-use scenarios, which have an impact on safety and security, and social interaction but no effect on connectivity value. The results show that 40% mixed-use is the most applicable percentage for the social aspects of improvement.
The connectivity value is strongly affected by the urban pattern, with the best value being 4/1 with a street percentage of 7% to achieve an improvement in connectivity value with a percentage of 74%. When the street percentage is reduced, connectivity improves.
When the optimal values for each indicator (Green percentage 35%; Mixed land use 40%; Street network percentage 7% with D/H Ratio 4/1) are applied to the chosen neighborhood, the results have great value for enhancing the social aspects, with percentages of 48% for social interaction and safety and 74% for social integration.
Figure 7 and Figure 8 presents a new design for the residential neighborhood in Salam New City that is recommended to achieve high social sustainability.
The research implies that the residential neighborhood in Egypt should have a minimum mixed-use with percentage 20%, green open spaces with a minimum 15%, and a U-shape with 3/1 D/H to enhance social interaction and activities, social participation and safety, and security as a step to achieve social sustainability in new communities.

7. Discussion

Previous researchers investigate the relationship between the urban form aspects and the social sustainability aspects through the walkability and connectivity value indicators. These researchers investigate the relation from a theoretical perspective. For example, increasing mixed-use in residential neighborhoods, such as commercial and service, enables residents and workers to engage in a variety of daily activities while sharing the same public space. In other words, the presence of mixed-use in a residential area increases social activities and interactions [22,31,32,45,46]. The patterns, locations, designs, and ensuing gaps between buildings at different levels of a neighborhood all present distinct opportunities for the fulfillment and expansion of social interactions linked with the social participation of adjacent leads. In other words, changing urban patterns to achieve high spatial connectivity value leads to increase social participation in the residential neighborhood [3,15,27,47,48]. Feeling safe and secure is one of the principal signs of the impressions of neighboring people on foot. Improving walking abilities tend to attract more pedestrians to the road and make them more secure [20,24,33,46]. According to the previous studies, none of them explain or present a numerical relationship or design consideration to achieve social sustainability in a residential neighborhood. Few studies describe a design configuration to increase social sustainability in neighborhoods. For example, previous studies suggest that the U-shape for urban pattern and row houses promote engagement since it provides a common entry point for all participants. These urban configurations enhance interaction because of the enormous dimensions of space between the blocks and the limitless number of people around each block. Other researchers imply that increasing connectivity means more intersections, smaller blocks of roads, fewer impasse streets and cul-de-sacs, and the creation of central squares with multiple activities and facilities to promote a livable and sustainable neighborhood [3,49]. These studies neglect numerical specifications for urban configuration. The unhabitable organization describes a numerical percentage for the urban to achieve social sustainability in a residential neighborhood such as mixed-use should be at least 40 percent, and the street network should occupy at least 30 percent of the land and at least 18 km of street length per km2, but it does not describe the improvement percentage on the social sustainability aspects [50,51]. The research implies that the residential neighborhood in Egypt should have a minimum mixed-use with a percentage 20%, green open spaces with a minimum 15%, and a U-Shape with 3/1 D/H to enhance social interaction and activities, social participation and safety, and security. These percentages improve the social sustainability aspects with a minimum percentage ranging from 20% to 30% for social interaction and activities and safety and security aspects and with a minimum percentage ranging from 40% to 50% for the social participation aspect. The research also implies a new design for a residential neighborhood in Port Said Salam New City to increase social sustainability compared to its base case. By using the urban form with a green percentage of 35%, mixed land use of 40%, and a street network percentage of 7% with a D/H Ratio of 4/1, the social sustainability aspects enhance by 48% from the base case for social interaction and activities, and the safety and security (The percentage of the walkability score improvements as an indicator), and by 74% from the base case for social integration (the percentage of the connectivity value as an indicator). These conducted numerical relations between urban form aspects and social sustainability aspects will help urban planners to design a new residential neighborhood by considering the social aspects in their design and will be a design guideline to change the urban planning laws in Egypt and insert the social sustainability factors in new cities.

8. Conclusions

Urban planners are becoming more aware of the financial benefits of incorporating social thinking that improves urban communities’ well-being and quality of life. Create spaces that encourage residents to interact and participate in fun activities together. There is a growing awareness that the physical environment can influence human behavior and neighborhood socio-demographic characteristics. People are more likely to form positive relationships in environments that feel safe. Walking in neighborhoods with mixed-use spaces encourages social interaction. In the design of social housing buildings, the absence of any consideration for social life in urban design, whether existing or new, was observed. According to the study’s authors, the neighborhood’s walkability, mixed land use, provision of social infrastructure and recreational facilities for all ages groups, accessibility to the public realm, ability to fulfill everyone’s needs regardless of age, and maximization of community participants are essential components of a socially sustainable urban community. Constant urban density in the same area should be achieved by increasing building height to meet the demand for more homes for the people and, at the same time, have a good urban form to achieve a good social life at the neighborhood level.
The research provides a new design model for a residential neighborhood in Salam New City in Port Said City to improve the social life in this neighborhood. After applying the most effective urban configuration aspects with different scenarios and analyzing their effect on the social aspects, the results found when using (Green percentage 35%—Mixed land use 40%—Street network percentage 7% with D/H Ratio 4/1) on the base case of the case study, the social Aspects improves as follows:
The social interaction and activities and the safety and security will improve by 48% from the base case (The percentage of the walkability score improvements as an indicator).
The social integration will improve by 74% from the base case (the percentage of the connectivity value as an indicator).
Social life has an important role to build sustainable communities. The research implies a design urban form considerations of the residential neighborhood as a U-Shape of the urban pattern with a minimum D/H ratio of 1/3, increasing the walkability by using different uses in the neighborhood not less than 20% from the main use count, pedestrian paths and decreasing the mobility as possible, and well design of the green open space to increase the interaction spaces for the residents not less than 25%. The research demonstrates a numerical relation between the urban form aspects and the social aspects to be a guide for the planners when designing the urban form of the housing complex to improve the social life to be a step to designing sustainable communities in new cities.
Future research should investigate the ability to achieve the recommendation of this research on the old residential neighborhoods to enhance the social life in these neighborhoods.
The stakeholders should change the current laws and regulations for designing new cities and their urban forms to increase the social life in the residential neighborhood to design a healthy and resilient city.

Author Contributions

The authors confirm their contribution to the paper as follows: Study conception and design: S.M.A., data collection: A.N.M.; software: A.N.M.; analysis and interpretation of results: A.N.M., draft manuscript preparation: N.B., supervision, A.A.E.E., writing—original draft preparation, A.N.M.; writing—review and editing, S.M.A., A.N.M. and N.B. All authors have read and agreed to the published version of the manuscript.

Funding

This research received no external funding.

Data Availability Statement

Not applicable.

Conflicts of Interest

The authors declare no conflict of interest.

References

  1. Ghonimi, I.; Awaad, A. Socially Sustainable Neighborhood in Egypt: Assessing Social Capital for Different Neigh-borhood Models in Greater Cairo Region. J. Eng. Sci. 2018, 46, 160–180. [Google Scholar] [CrossRef]
  2. New Urban Communities Authority. New Cities. Available online: http://www.newcities.gov.eg/Default.aspx (accessed on 20 September 2022).
  3. Karuppannan, S.; Sivam, A. Social sustainability and neighbourhood design: An investigation of residents’ satisfaction in Delhi. Local Environ. 2011, 16, 849–870. [Google Scholar] [CrossRef]
  4. Hajrasoulih, A.; del Rio, V.; Francis, J.; Edmondson, J. Urban form and mental wellbeing: Scoping a theoretical framework for action. J. Urban Des. Ment. Health 2018, 5, 10. [Google Scholar]
  5. Tonkiss, F. Cities by Design the Social Life of Urban Form, 1st ed.; Polity Press: Cambridge, UK, 2013. [Google Scholar]
  6. Larimian, T.; Freeman, C.; Palaiologou, F.; Sadeghi, N. Urban social sustainability at the neighbourhood scale: Measurement and the impact of physical and personal factors. Local Environ. 2020, 25, 747–764. [Google Scholar] [CrossRef]
  7. Shirazi, M.R.; Keivani, R.; Brownill, S.; Watson, G.B. Promoting Social Sustainability of Urban Neighbourhoods: The Case of Bethnal Green, London. Int. J. Urban Reg. Res. 2020, 46, 441–465. [Google Scholar] [CrossRef]
  8. Kim, J.; Kim, S. Finding the Optimal D/H Ratio for an Enclosed Urban Square: Testing an Urban Design Principle Using Immersive Virtual Reality Simulation Techniques. Int. J. Environ. Res. Public Health 2019, 16, 865. [Google Scholar] [CrossRef] [Green Version]
  9. Ng, E. Designing High-Density Cities for Social and Environmental Sustainability; Cromwell Press Group: Trowbridge, UK, 2010. [Google Scholar]
  10. Abass, Z.I.; Tucker, R. Socializing in the suburbs: Relationships between neighborhood design and social inter-action in low-density housing contexts. J. Urban Des. 2020, 25, 108–133. [Google Scholar] [CrossRef]
  11. Koramaz, E.K. The Spatial Context of Social Integration. Soc. Indic. Res. 2014, 119, 49–71. [Google Scholar] [CrossRef]
  12. Azzam, A.O. Socially Sustainable Neighborhoods: Special Reference to the Egyptian Context. Egypt. Master’s Thesis, The American University in Cairo, New Cairo, Egypt, 2018. [Google Scholar]
  13. Hagen, B.; Nassar, C.; Pijawka, D. The Social Dimension of Sustainable Neighborhood Design: Comparing Two Neighborhoods in Freiburg, Germany. Urban Plan. 2017, 2, 64–80. [Google Scholar] [CrossRef]
  14. Naceur, F. Social Interaction in Communal Outdoor Spaces of Residential Housing Estates in Biskara-ALGERIA. Int. J. Environ. Ecol. Fam. Urban Stud. 2013, 3, 45–58. [Google Scholar]
  15. Ridwana, R.; Prayitno, B.; Hatmoko, A.U. The Relationship Between Spatial Configuration and Social Interaction in High-Rise Flats: A Case Study On The Jatinegara Barat in Jakarta. SHS Web Conf. 2018, 41, 07003. [Google Scholar] [CrossRef] [Green Version]
  16. Alipour, S.M.H.; Ahmed, K.G. Assessing the effect of urban form on social sustainability: A proposed ‘Integrated Measuring Tools Method’ for urban neighborhoods in Dubai. City Territ. Arch. 2021, 8, 1–21. [Google Scholar] [CrossRef]
  17. Fathi, S.; Sajadzadeh, H.; Mohammadi Sheshkal, F.; Aram, F.; Pinter, G.; Felde, I.; Mosavi, A. The Role of Urban Morphology De-sign on Enhancing Physical Activity and Public Health. Int. J. Environ. Res. Public Health 2020, 17, 2359. [Google Scholar] [CrossRef] [PubMed] [Green Version]
  18. Kotharkar, S.B. Social Sustainability and Mixed Landuse. In Proceedings of the International Conference on Advances in Architecture and Civil Engineering, Delhi, India, 28–29 December 2012; pp. 725–731. [Google Scholar]
  19. Yin, L.; Patterson, K.; Silverman, R.; Wu, L.; Zhang, H. Neighborhood accessibility and walkability of subsidized housing in shrinking US cities. Urban Stud. 2020, 59, 323–340. [Google Scholar]
  20. Bramley, G.; Power, S. Urban form and social sustainability: The role of density and housing type. Environ. Plan. B Plan. Des. 2009, 36, 30–48. [Google Scholar] [CrossRef]
  21. Hamed, M. Developing Effective Social Sustainability Indicators in Architecture. Bull. Environ. Pharma-Cology Life Sci. 2015, 4, 40–56. [Google Scholar]
  22. Weijs-Perrée, M.; Berg, P.V.D.; Arentze, T.; Kemperman, A. Social networks, social satisfaction and place attachment in the neighborhood. Region 2017, 4, 133. [Google Scholar] [CrossRef]
  23. Carbone, J.T.; Clift, J. Neighborhood social integration as a predictor of neighborhood perceptions. J. Community Psychol. 2021, 49, 2179–2193. [Google Scholar] [CrossRef]
  24. Rada, V.B.; Ngaha, I.B. Public Spaces and Effective Factors on Social Interactions. Int. J. Curr. Eng. Technol. 2013, 3, 184–188. [Google Scholar]
  25. Taiwo, O.M.; Samsudin, S.; Daud, D.@.Z.; Ayodele, O.M. Integration of sustainability indicators in urban formation: A gap analysis. Plan. Malays. J. 2021, 19. [Google Scholar] [CrossRef]
  26. Teimouri, R. Social sustainability with Urban Green Space (UGS) planning. J. Adv. Hu-Manities Soc. Sci. 2019, 5, 236–246. [Google Scholar] [CrossRef]
  27. Ibrahim, R.; Mushatat, S.; Abdelmonem, M.G. The Role of Urban Pattern Indicators for Sus-tainable Urban Forms in the Developed Countries. In Proceedings of the 1st International Conference on Engineering And Innovative Technology (SU-ICEIT 2016), Engineering College at Salahaddin University, Erbil, Iraq, 12–14 April 2016; pp. 1–10. [Google Scholar]
  28. Lu, S.; Huang, Y.; Shi, C.; Yang, X. Exploring the Associations Between Urban Form and Neighborhood Vibrancy: A Case Study of Chengdu, China. ISPRS Int. J. Geo-Inform. 2019, 8, 165. [Google Scholar] [CrossRef] [Green Version]
  29. Ali, S. Maximizing the Social-Economic Impacts of Urban Green Space in Several Cities in Indonesia; IOP Conference Series: Earth and Environmental Science; IOP: Atlanta, GA, USA, 2021; Volume 198. [Google Scholar]
  30. Ali, H.H.; Al-Betawi, Y.N.; Al-Qudah, H.S. Effects of urban form on social sustainability—A case study of Irbid, Jordan. Int. J. Urban Sustain. Dev. 2019, 11, 203–222. [Google Scholar] [CrossRef]
  31. Zerouati, W.; Bellal, T. Evaluating the impact of mass housings’ in-between spaces’ spatial configuration on users’ social in-ter-action. Front. Archit. Res. 2020, 9, 34–53. [Google Scholar] [CrossRef]
  32. Bramiana, C.; Widiastuti, R. Implementing Mixed Land Use Rooting Jane Jacobs’ Concept of Diversity in Urban Sustainability. Modul 2017, 17, 27–35. [Google Scholar] [CrossRef]
  33. Mohammadi, M.G. A Critical View on New Urbanism Theory in Urban Planning: From Theory to Practice. Space Ontol. Int. J. 2017, 6, 9–97. [Google Scholar]
  34. Sattayakorn, S. Space as a Place for Social Interaction: A Case Study of Tai-Lao Communities. J. Arch. Res. Stud. (JARS) 2012, 9, 13–26. [Google Scholar] [CrossRef]
  35. Shojae, S.H.; Islami, S.G.; Rezaei, M. Role of local and urban textures in promoting social interactions of residents and emphasizing the living centers theory of Christopher Alexander. Front. Arch. Res. 2021, 10, 66–78. [Google Scholar] [CrossRef]
  36. Mamaghani, N.K.; Asadollahi, A.P.; Mortezaei, S.-R. Designing for Improving Social Relationship with Interaction Design Approach. Procedia Soc. Behav. Sci. 2015, 201, 377–385. [Google Scholar] [CrossRef] [Green Version]
  37. Nel, D.; Bruyns, G.; Higgins, C.D. Urban Design, Connectivity, and its Role in Building Spatial Resilience. In Proceedings of the XXV ISUF International Conference, Krasnoyarsk, Russia, 5–9 July 2018; pp. 921–930. [Google Scholar]
  38. Cassiers, T.; Kesteloot, C. Socio-spatial Inequalities and Social Cohesion in European Cities. Urban Stud. 2012, 49, 1909–1924. [Google Scholar] [CrossRef]
  39. Zayed, M.A. The effect of landscape elements on walkability in egyptian gated communities. Archnet-IJAR: Int. J. Arch. Res. 2016, 10, 113. [Google Scholar] [CrossRef]
  40. Aldrin, A.; Marzbali, M.H.; Tilaki, M.J.M.; Bahauddin, A. The Influence of Permeability on Social Cohesion: Is it good or bad? Procedia Soc. Behav. Sci. 2015, 168, 261–269. [Google Scholar]
  41. Larimian, T. Measuring urban social sustainability: Scale development and validation. Urban Anal. City Sci. 2021, 48, 621–637. [Google Scholar] [CrossRef] [Green Version]
  42. Mahmoud, I.H.; El Araby, M.; Al-Hagla, K.S.; El Sayary, S. Human Social Behavior in Public Urban Spaces: Towards Higher Quality Cities. Spaces Flows Int. J. Urban ExtraUrban Stud. 2013, 3, 23–35. [Google Scholar]
  43. Available online: http://www.newcities.gov.eg/ (accessed on 29 June 2021).
  44. Walk Score. Walk Score Methodology. Available online: https://www.walkscore.com/methodology.shtml (accessed on 15 September 2021).
  45. Jacobs-Crisioni, C.; Rietveld, P.; Koomen, E.; Tranos, E. Evaluating the Impact of Land-Use Density and Mix on Spatiotemporal Urban Activity Patterns: An Exploratory Study Using Mobile Phone Data. Environ. Plan. A Econ. Space 2014, 46, 2769–2785. [Google Scholar] [CrossRef]
  46. Lombard, S.C. Neighborhoods and Social Interaction. In Wellbeing and the Environment: Wellbeing: A Complete Reference Guide; John Wiley & Sons, Ltd.: Hoboken, NJ, USA, 2014; Volume 2, pp. 1–25. [Google Scholar] [CrossRef]
  47. Salat, S.; Bourdic, L. Power Laws for Energy Efficient and Resilient Cities. Procedia Eng. 2011, 21, 1193–1198. [Google Scholar] [CrossRef] [Green Version]
  48. Kirst, M.; Friesdorf, R.; Ta, M.; Amiri, A.; Hwang, S.W.; Stergiopoulos, V.; O’Campo, P. Patterns and effects of social integration on housing stability, mental health and substance use outcomes among participants in a randomized controlled Housing First trial. Soc. Sci. Med. 2020, 265, 113481. [Google Scholar] [CrossRef]
  49. Farida, N. Effects of outdoor shared spaces on social interaction in a housing estate in Algeria. Front. Arch. Res. 2013, 2, 457–467. [Google Scholar] [CrossRef]
  50. Ahmad, S. Sustainable Neighbourhood Development in Emerging Economies: A Review; Centre for Sustainable, Healthy and Learning Cities (SHLC): Dhaka, Bangladesh, 2020. [Google Scholar]
  51. UN Habitat. Safer Cities Programme Survey; UN Habitat: Nairobi, Kenya, 2007. [Google Scholar]
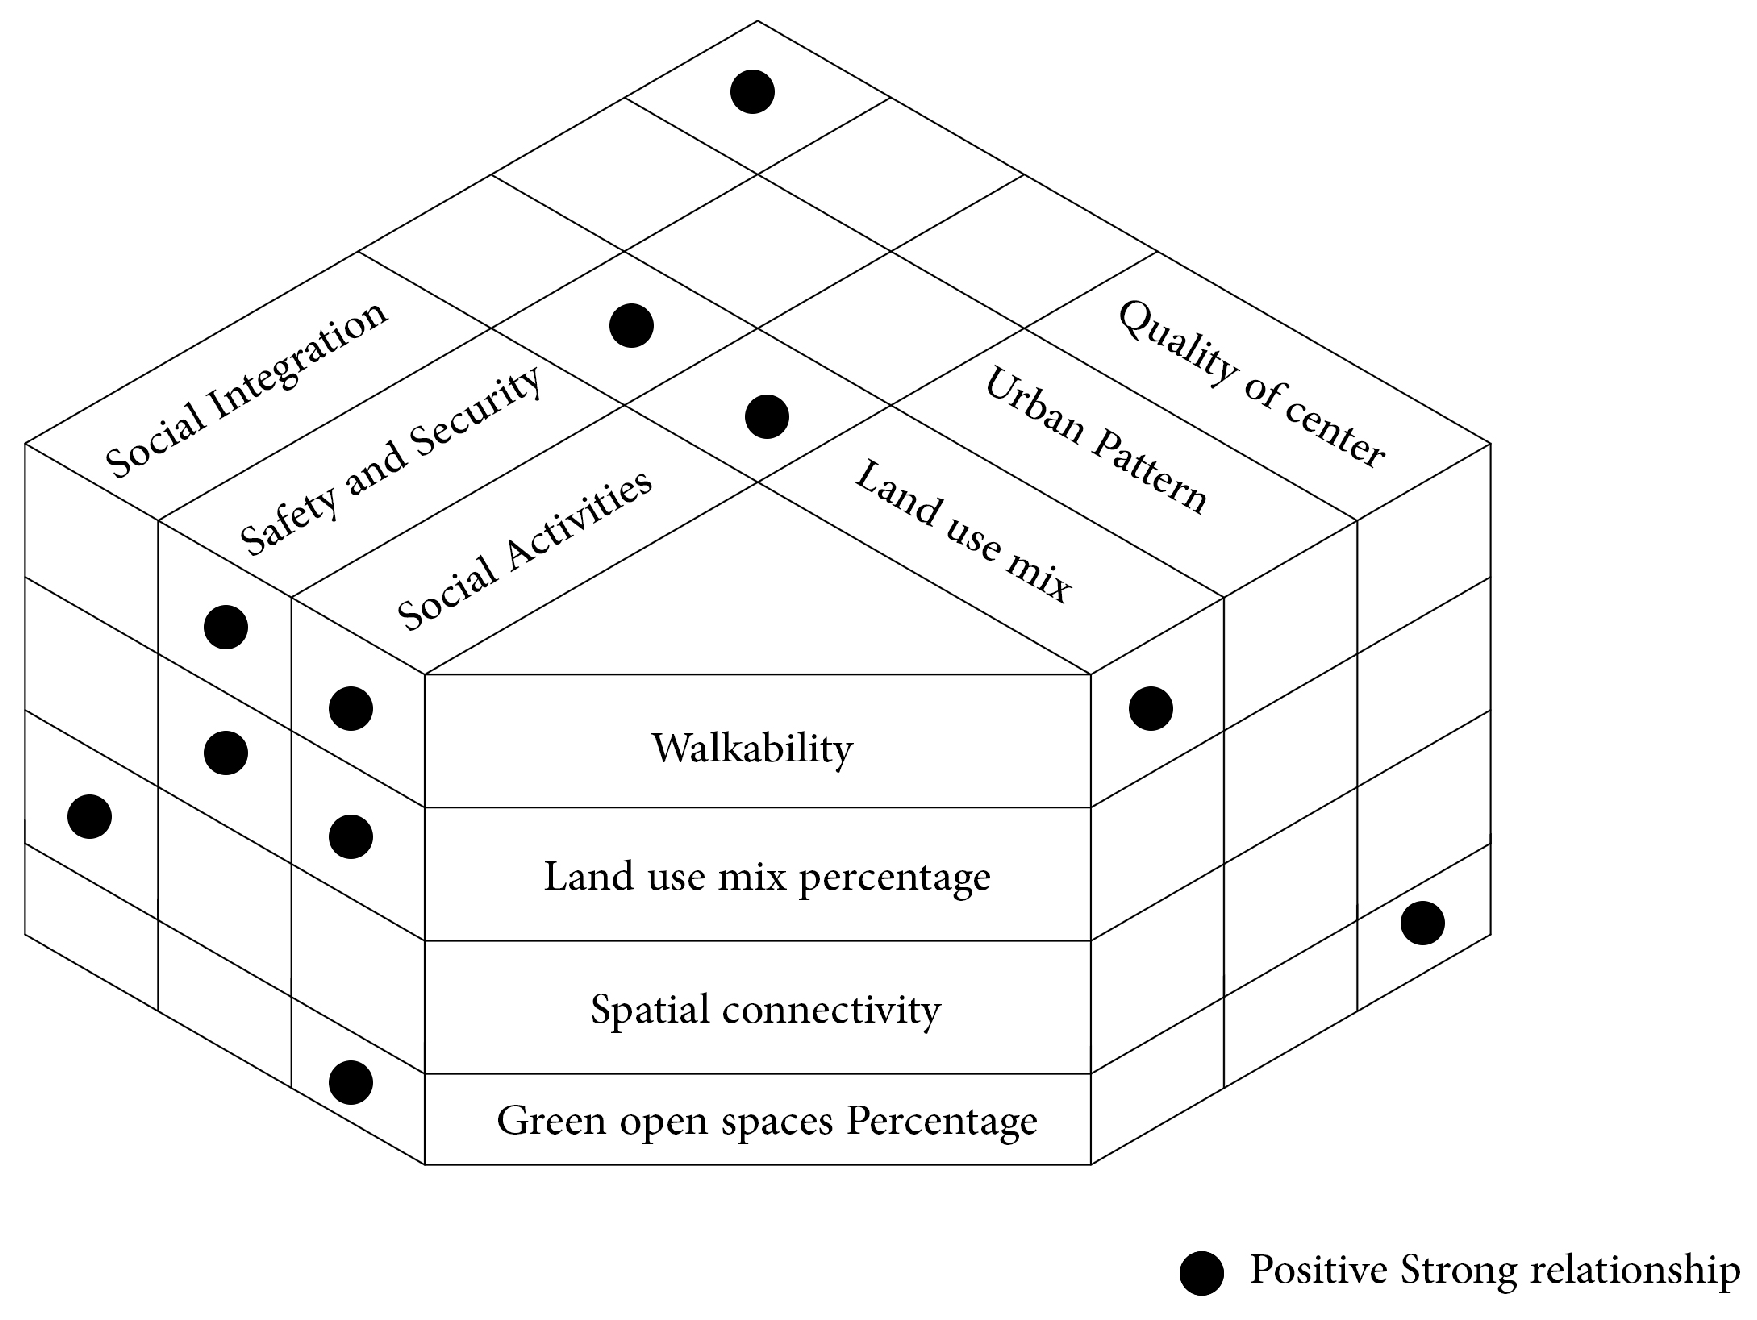
Figure 1. Matrix and expressing the relation between variables. Source: Adapted by the researchers. Retrieved from [5,16,26,31,40,41,42].
Buildings 12 01935 g001
Figure 2. The research methodology.
Buildings 12 01935 g002
Figure 3. Shows the layout of the neighborhood in Salam New City. Source: Adapted by the researchers retrieved from [43].
Buildings 12 01935 g003
Figure 4. The location of the amenities in the selected neighborhood. Source: Adapted by the researchers retrieved from [43].
Buildings 12 01935 g004
Figure 5. The walkability results for the various scenarios. Source: Designed by the researchers according to the previous simulation results.
Buildings 12 01935 g005
Figure 6. The connectivity results for the various scenarios. Source: Designed by the researchers according to the previous simulation results.
Buildings 12 01935 g006
Figure 7. The relationship between the urban form and social aspects after the study results.
Buildings 12 01935 g007
Figure 8. The proposed design for the selected neighborhood at Salam New City. Source: Proposed by the researchers according to the simulation results and analysis.
Buildings 12 01935 g008
Table 1. Social and Urban Form Aspects (Measurement and Evaluated Scale). Source: Adapted by Researchers Retrieved from [5,16,26,31,40,41,42].
SocialRelation between Aspects and Indicators Urban Form
AspectsIndicatorsAspectsIndicators
Social Activities and InteractionMix-use percentage and walkabilityMore mixed land use, Higher levels of Social Activities, and Interaction.Mixed Land UseMixed-use percentage
Safety and SecuritywalkabilityMore people walking around means more eyes on the streets, which improves safety.Urban PatternStreet Percentage and blocks clusters Arrangement
Social IntegrationSpatial connectivitywell-connected space will create well-integrated neighborsQuality of centerGreen open spaces percentage
Table 2. The walkability score using a patented system. Source: Adapted by the researchers retrieved from [44].
Walk ScoreDescription
90–100Walker’s Paradise
70–89Very Walkable
50–69Somewhat Walkable
25–49Car-Dependent
(Most errands require a car)
0–24Car-Dependent
(Almost all errands require a car)
Table 3. Urban Configurations that have effects on Social Sustainability.
Urban ConfigurationIllustrative Sketches
Mixed Land UseBuildings 12 01935 i001The mixed land use percentage is calculated depending on the total number of residential buildings located on the ground floor for the residential blocks arranged according to the previous sketch
Urban PatternBuildings 12 01935 i002The U-shape urban pattern is selected with the previous dimension and pattern with a D/H ratio of 4/1
Green Percentage (Green Open Spaces)Buildings 12 01935 i003- In Between Buildings, 80% of green open spaces from the total Area
- In the Center, 20% of the green open spaces from the total Area
Street NetworkBuildings 12 01935 i004The building pattern should be surrounded by a street on both sides as shown above. No street should be used between buildings, but pedestrian paths should be created.
Table 4. Comparative analysis for the walkability and connectivity value.
Walkability ScoreConnectivity Value
Buildings 12 01935 i005Buildings 12 01935 i006
Table 5. Comparative analysis for the walkability and connectivity value results for the different mixed-use scenarios.
Walkability ScoreConnectivity Value
Buildings 12 01935 i007Buildings 12 01935 i008
Table 6. Comparative analysis for the walkability and connectivity value.
Walkability ScoreConnectivity Value
Buildings 12 01935 i009Buildings 12 01935 i010
Table 7. Comparative analysis for the walkability and connectivity value.
Walkability ScoreConnectivity Value
Buildings 12 01935 i011Buildings 12 01935 i012
Publisher’s Note: MDPI stays neutral with regard to jurisdictional claims in published maps and institutional affiliations.

