
Mechanical Behavior of Special-Shaped Reinforced Concrete Composite Columns Encased with GFRP Core Columns
Abstract
:
1. Introduction
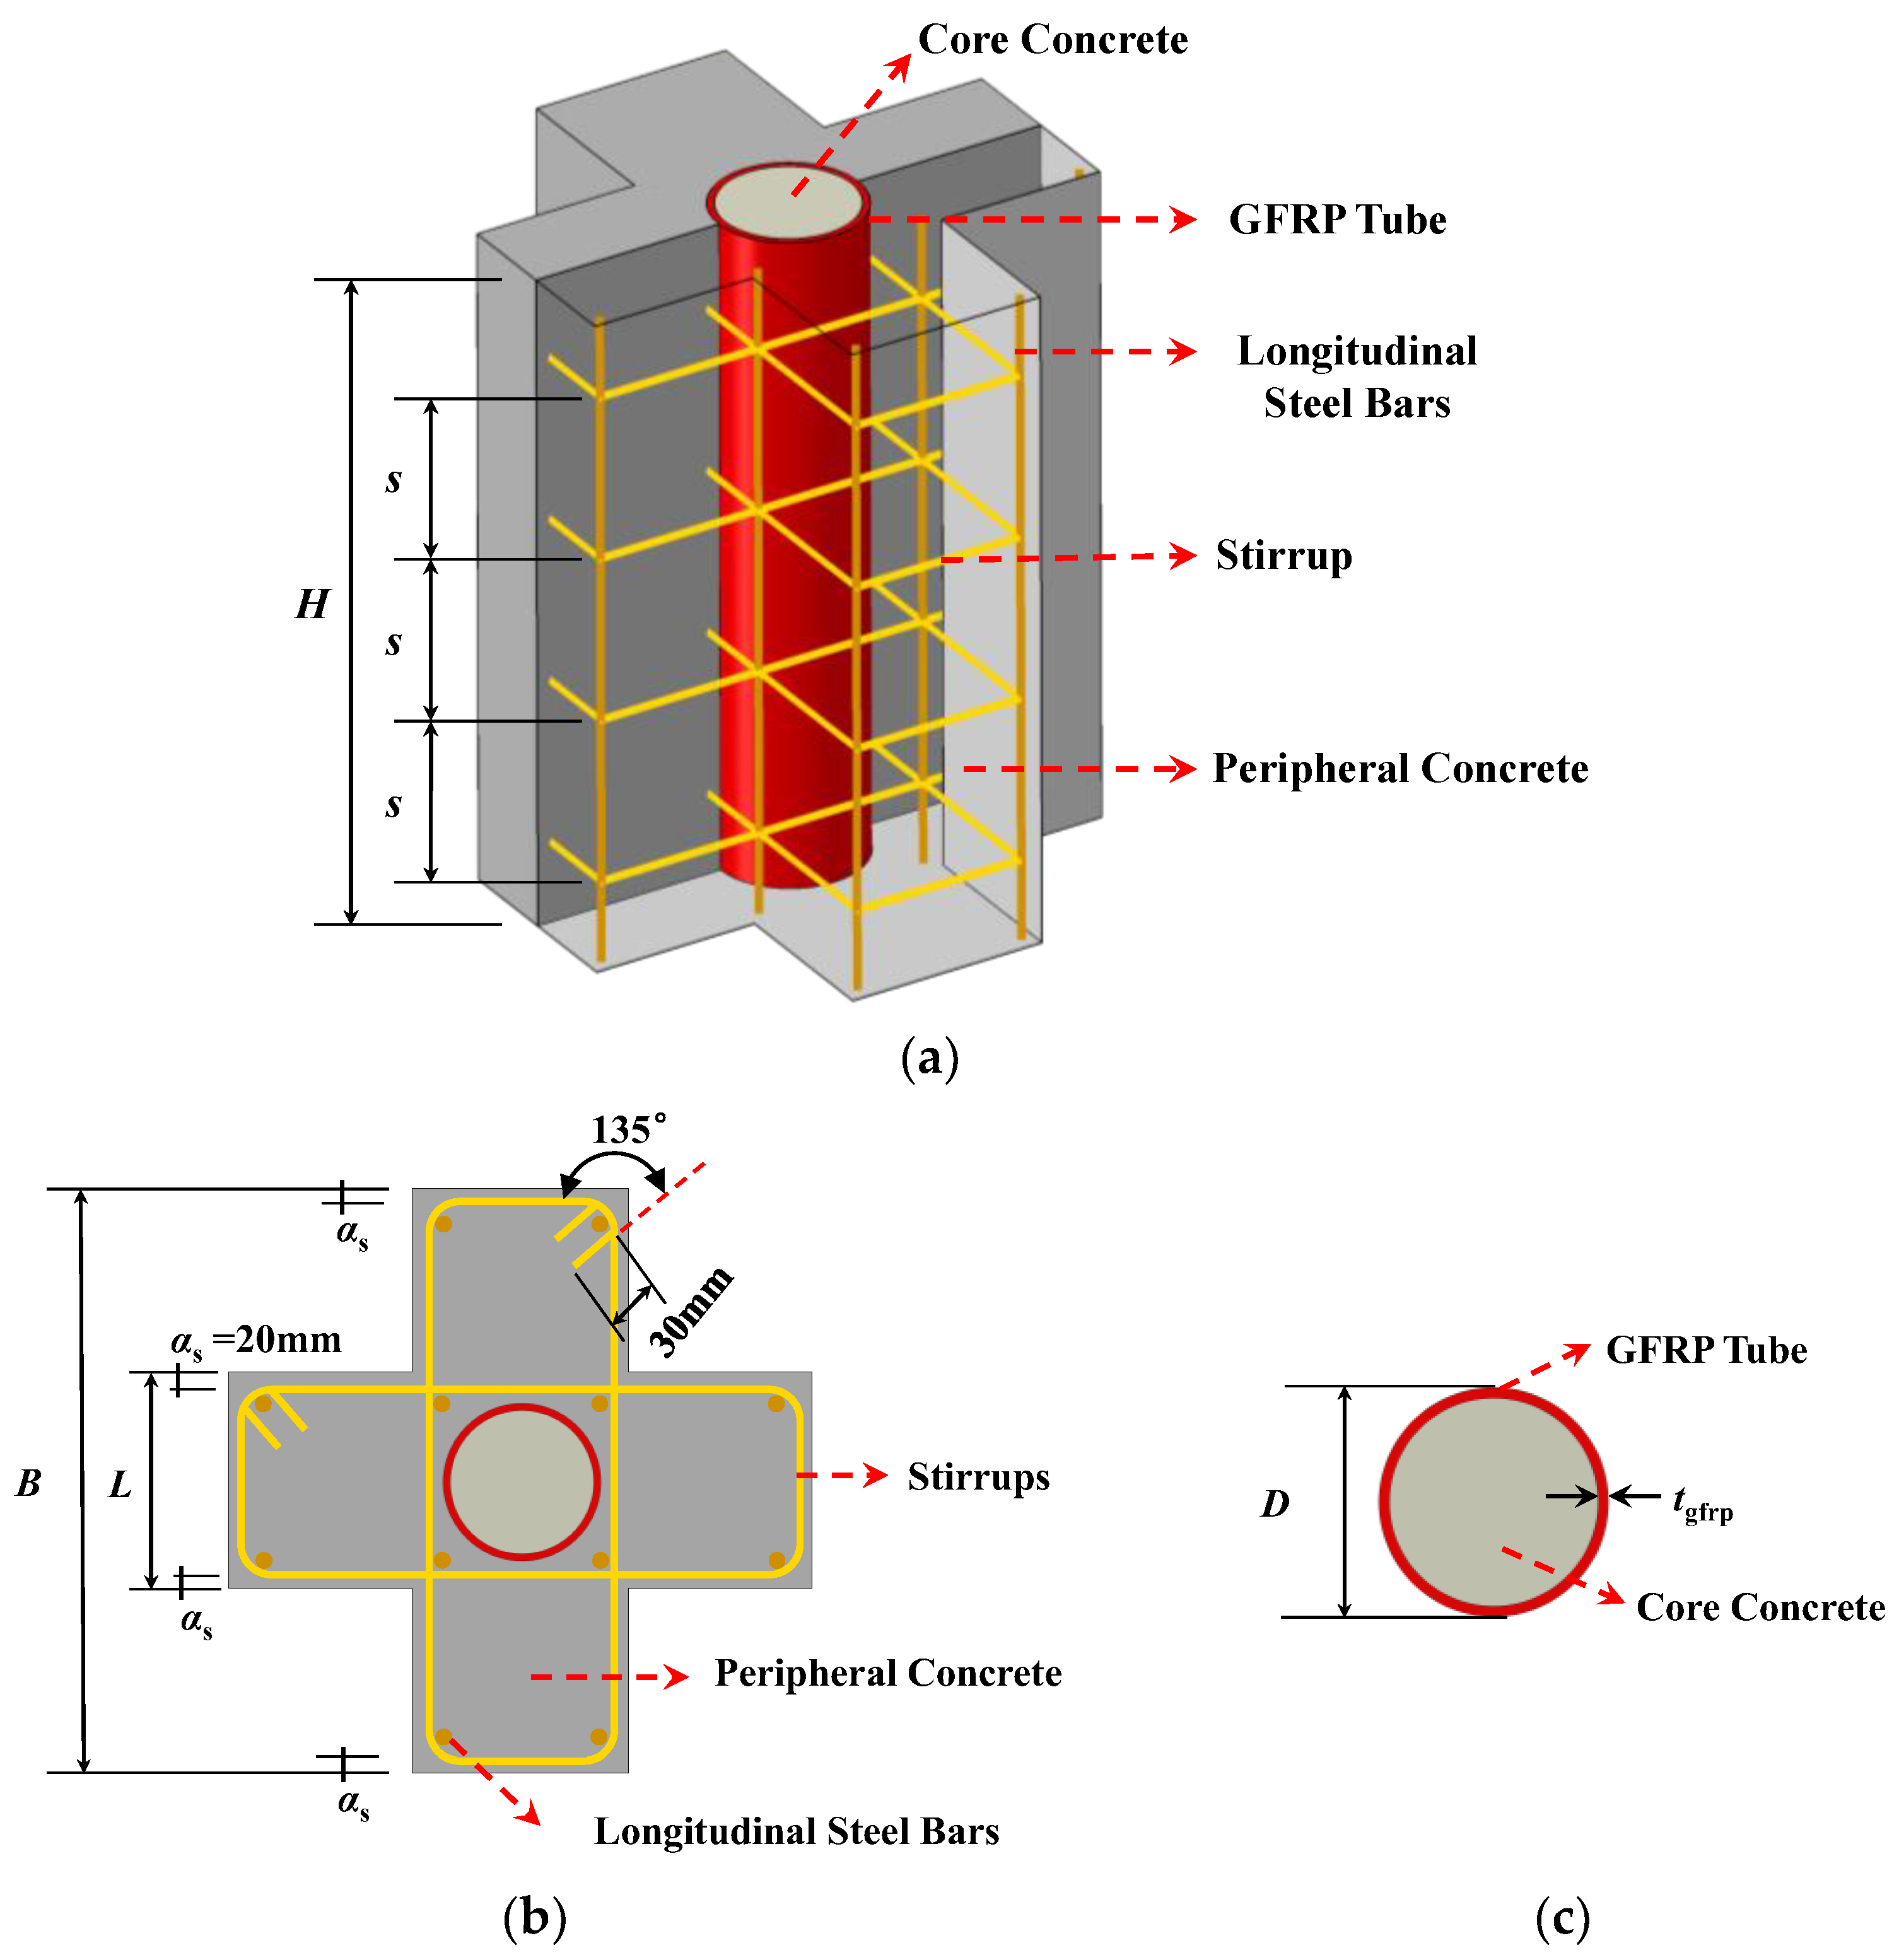
2. Specimen Design
3. Finite Element Model of EGCSSCs
3.1. Materials Constitutive Model
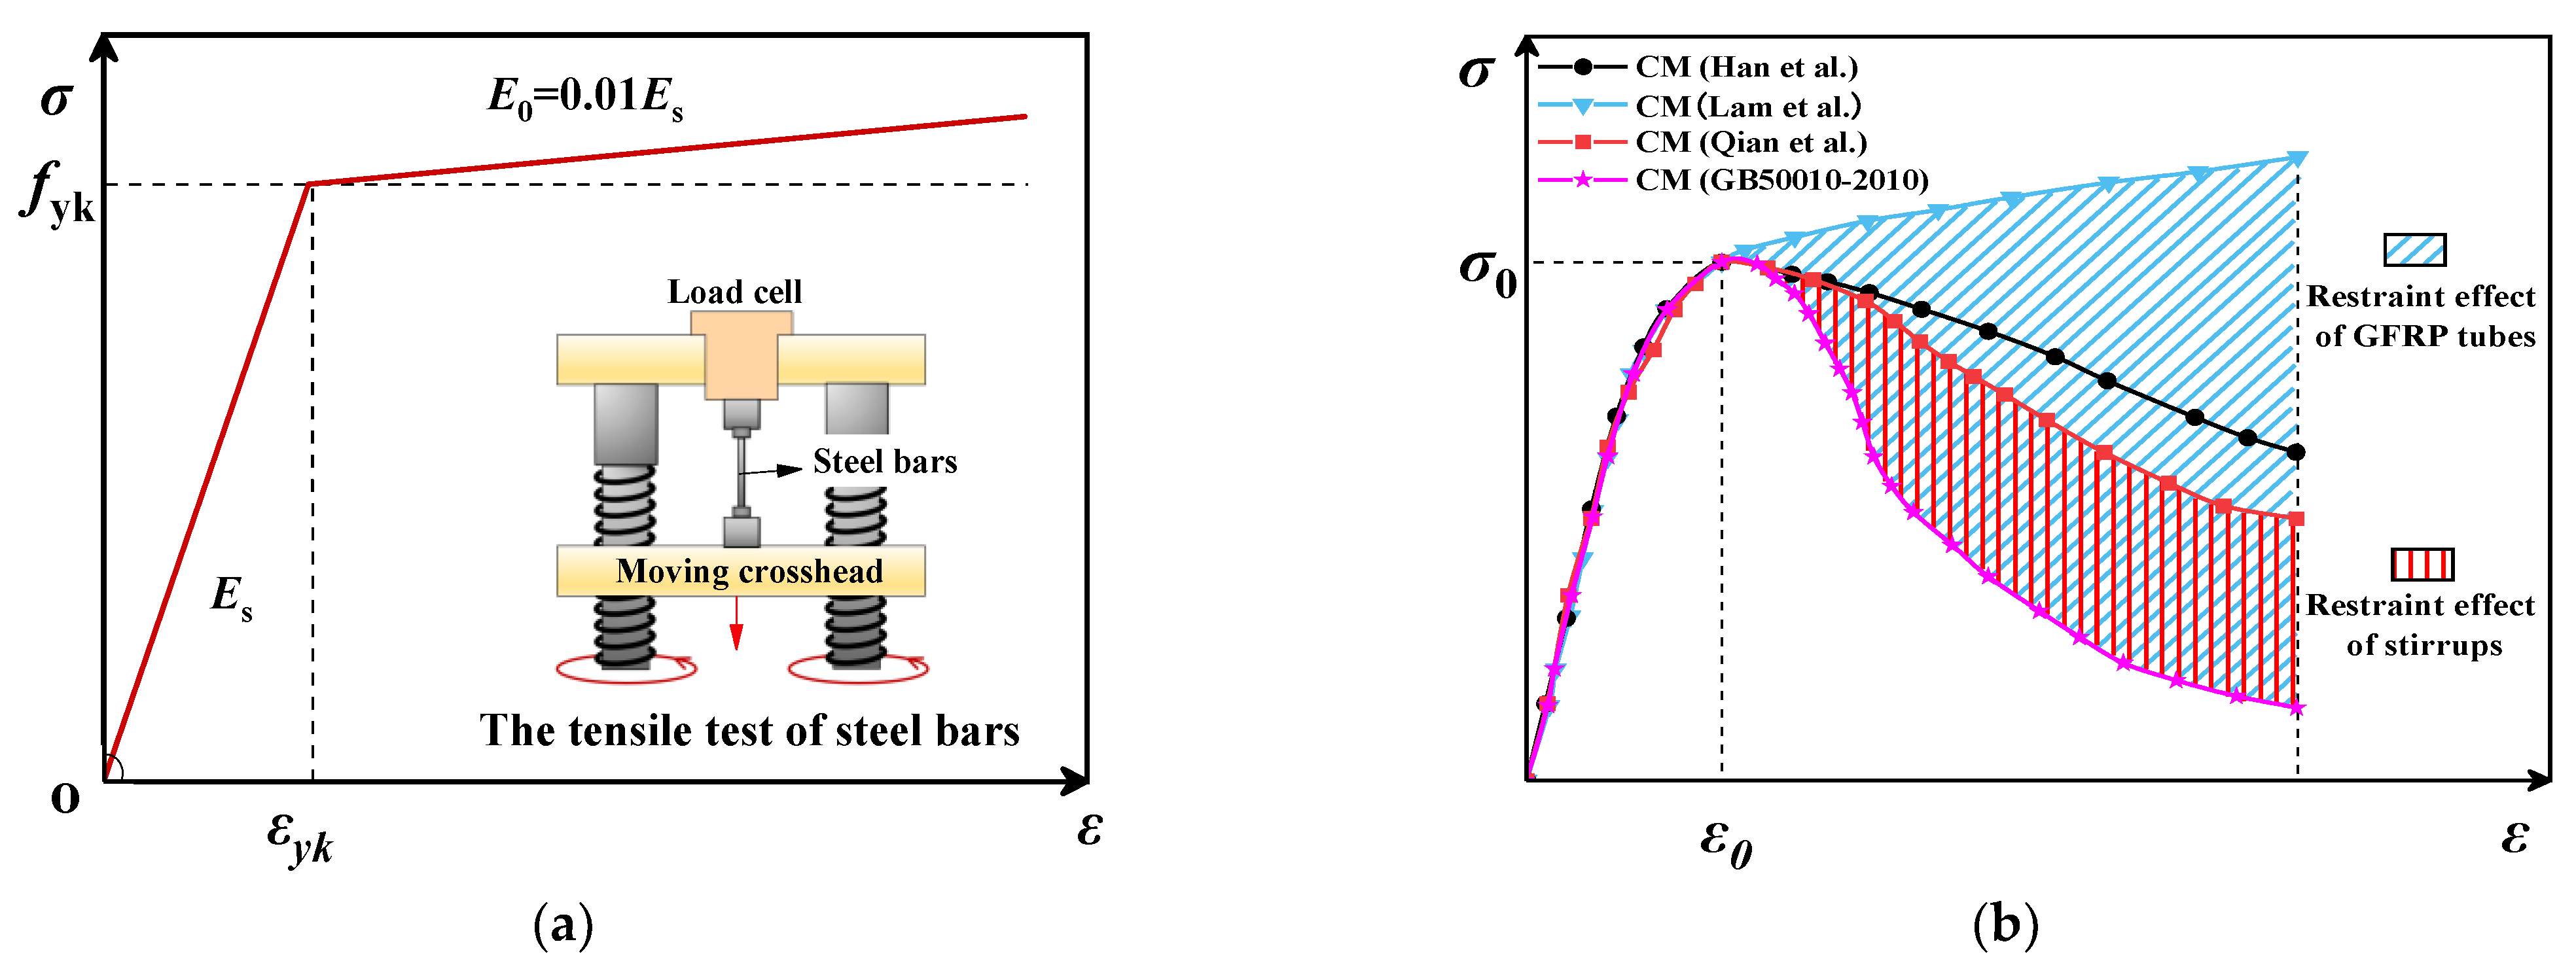
3.1.1. Steel Bars and Stirrups
3.1.2. Concrete
3.1.3. GFRP Tube
3.1.4. Concrete Plastic Damage Model
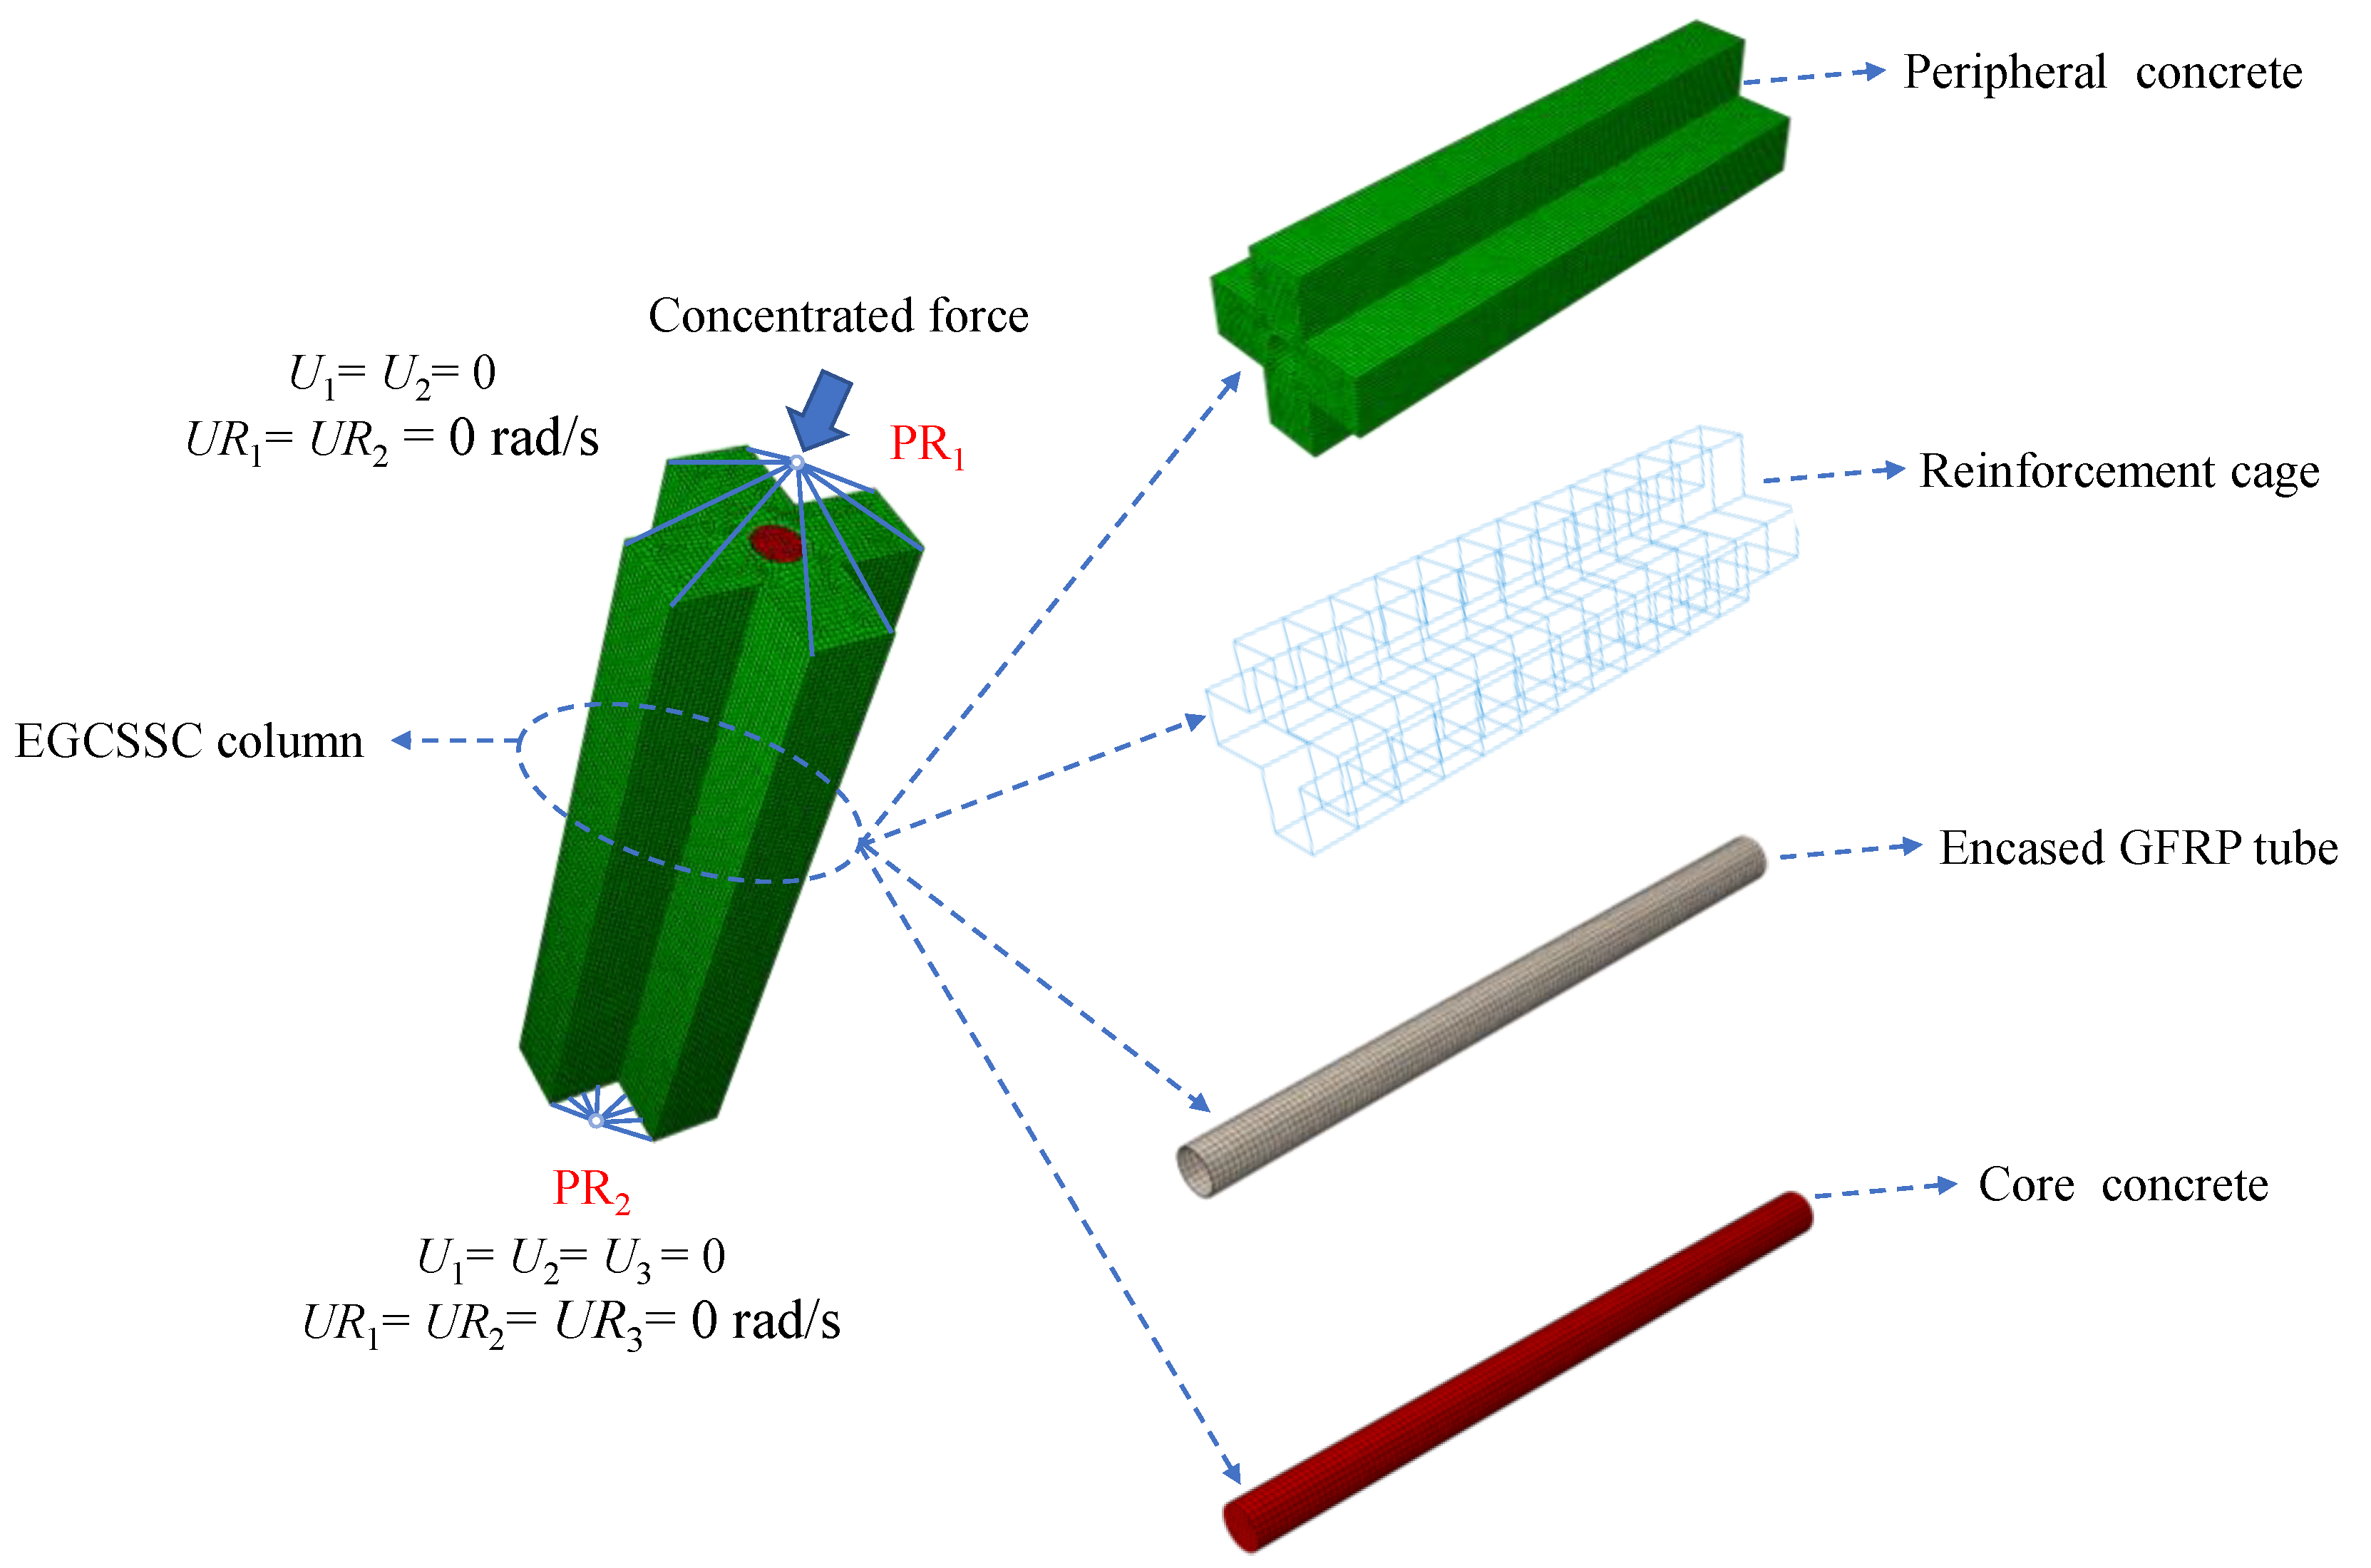
3.2. Establishment of Refined Finite Element Model
3.2.1. Element Type and Meshing
3.2.2. Interaction and Boundary Conditions
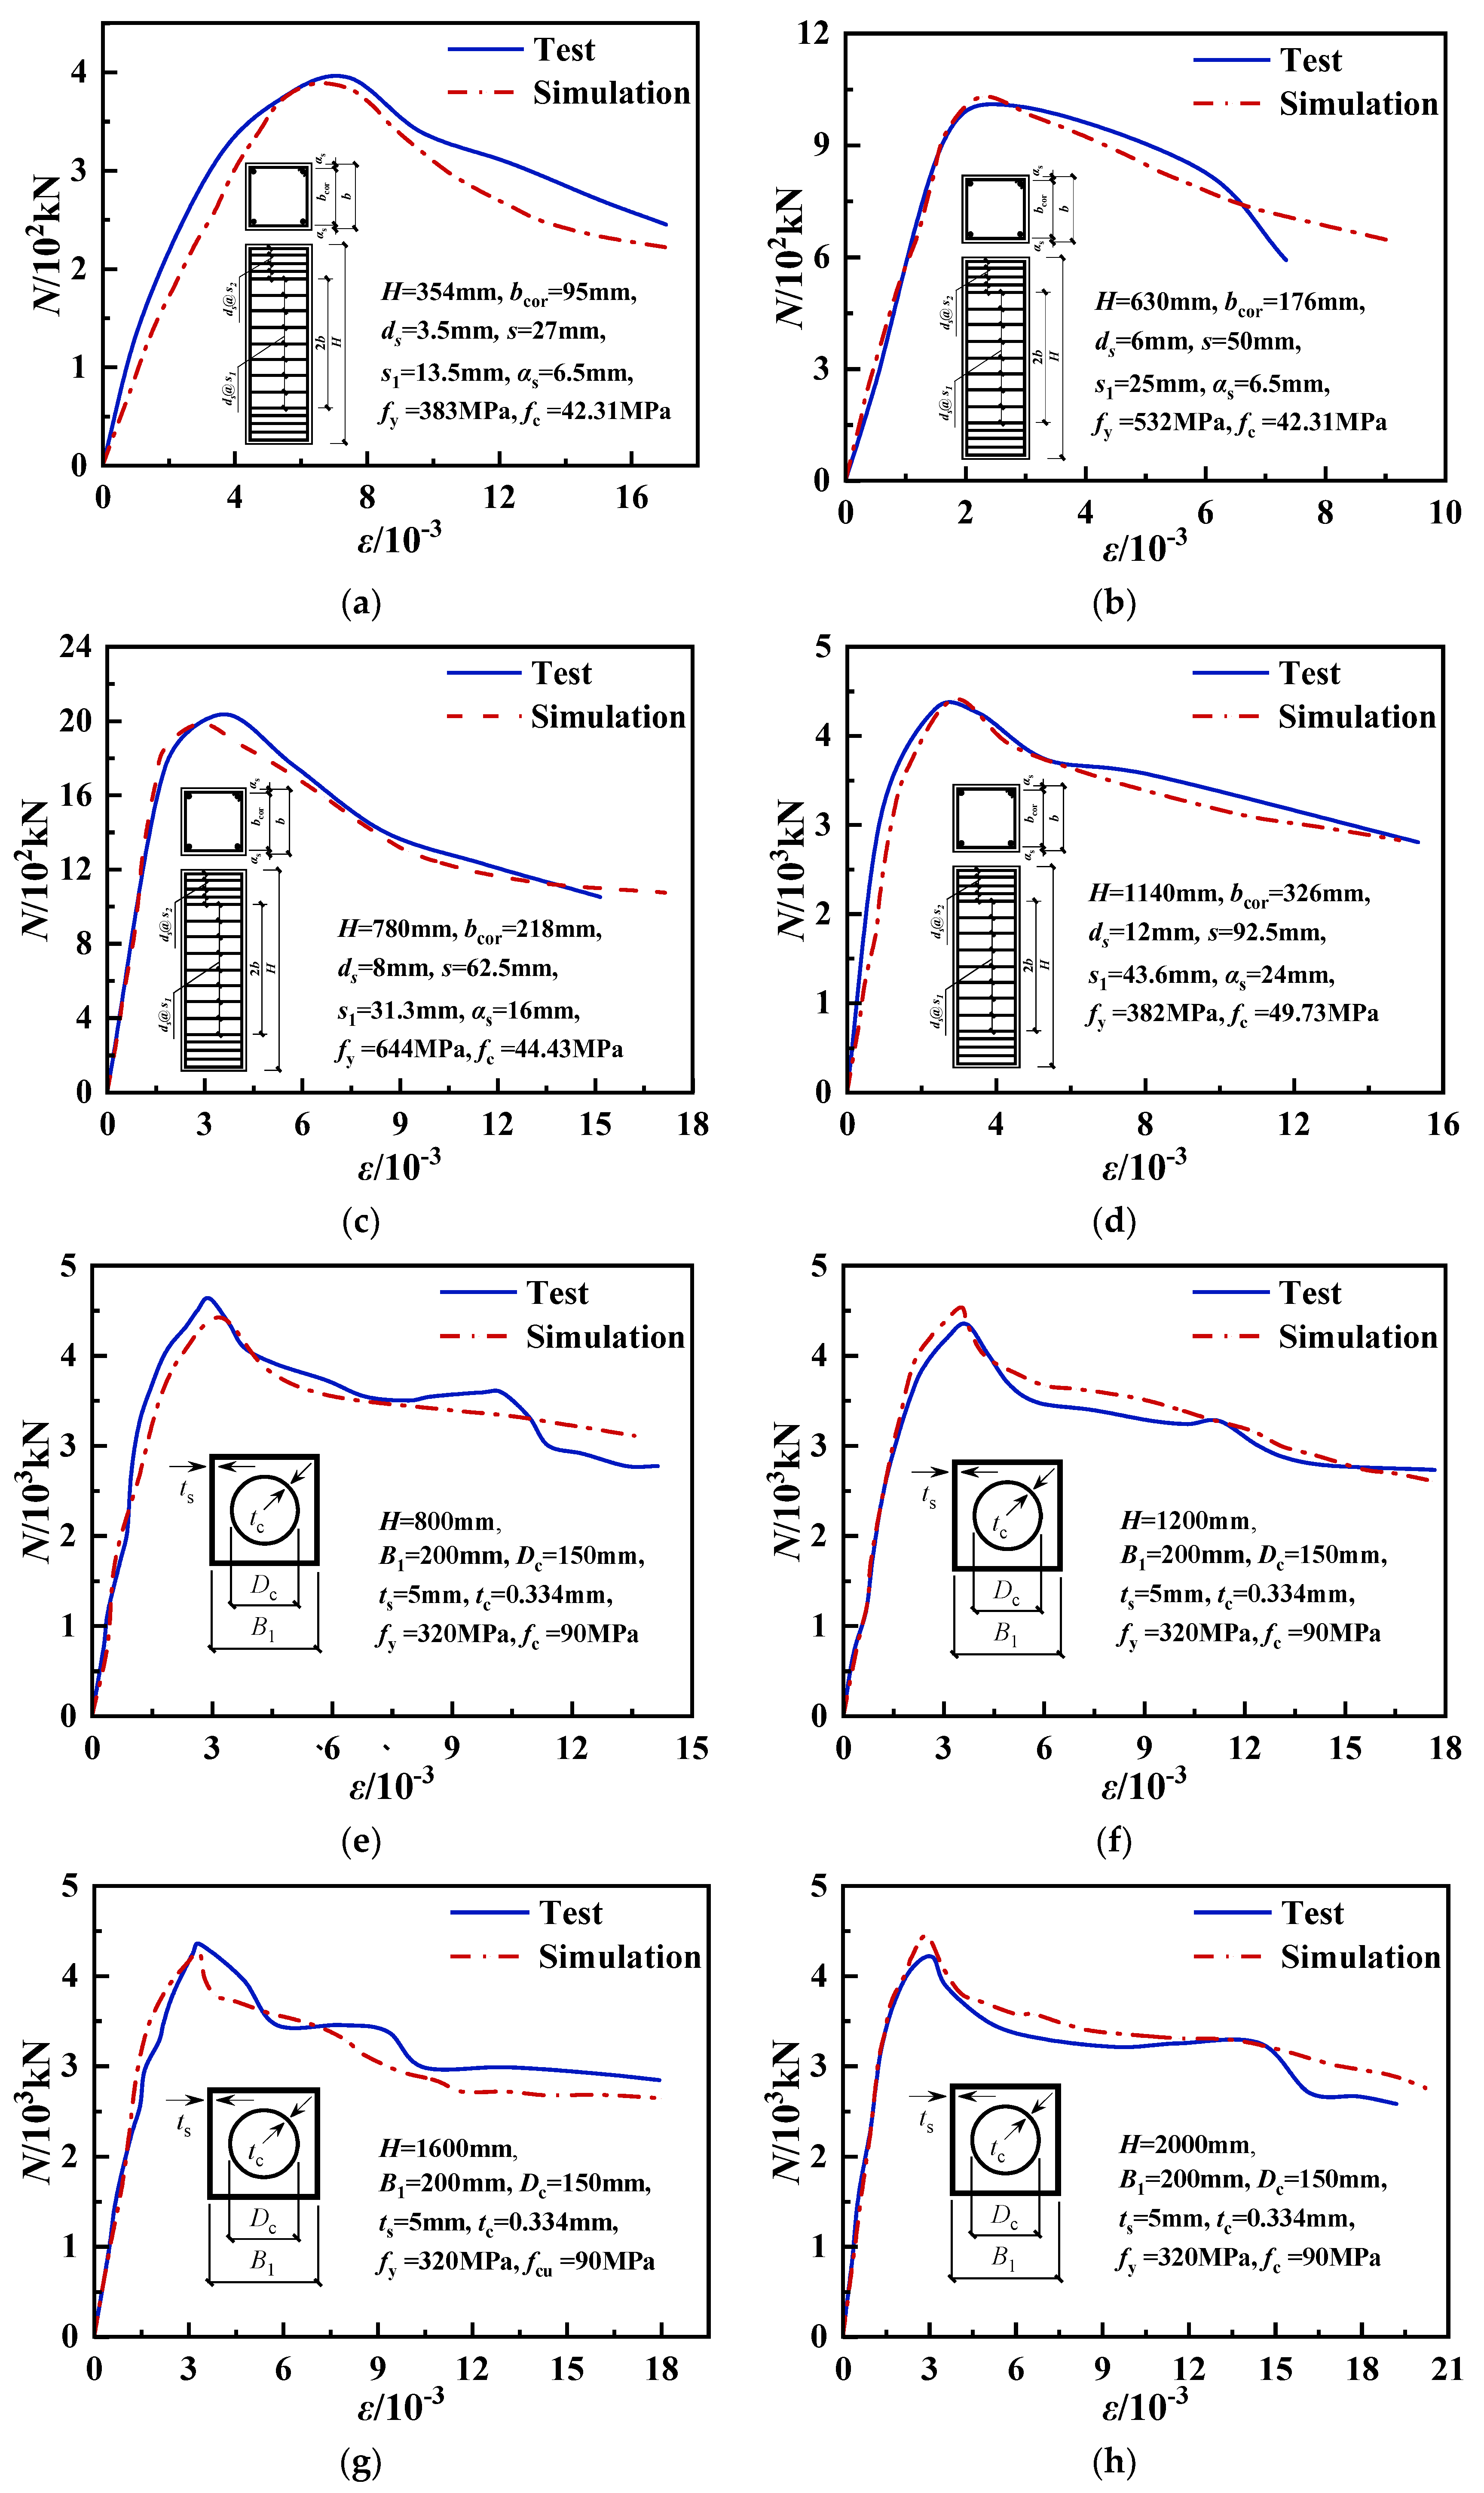
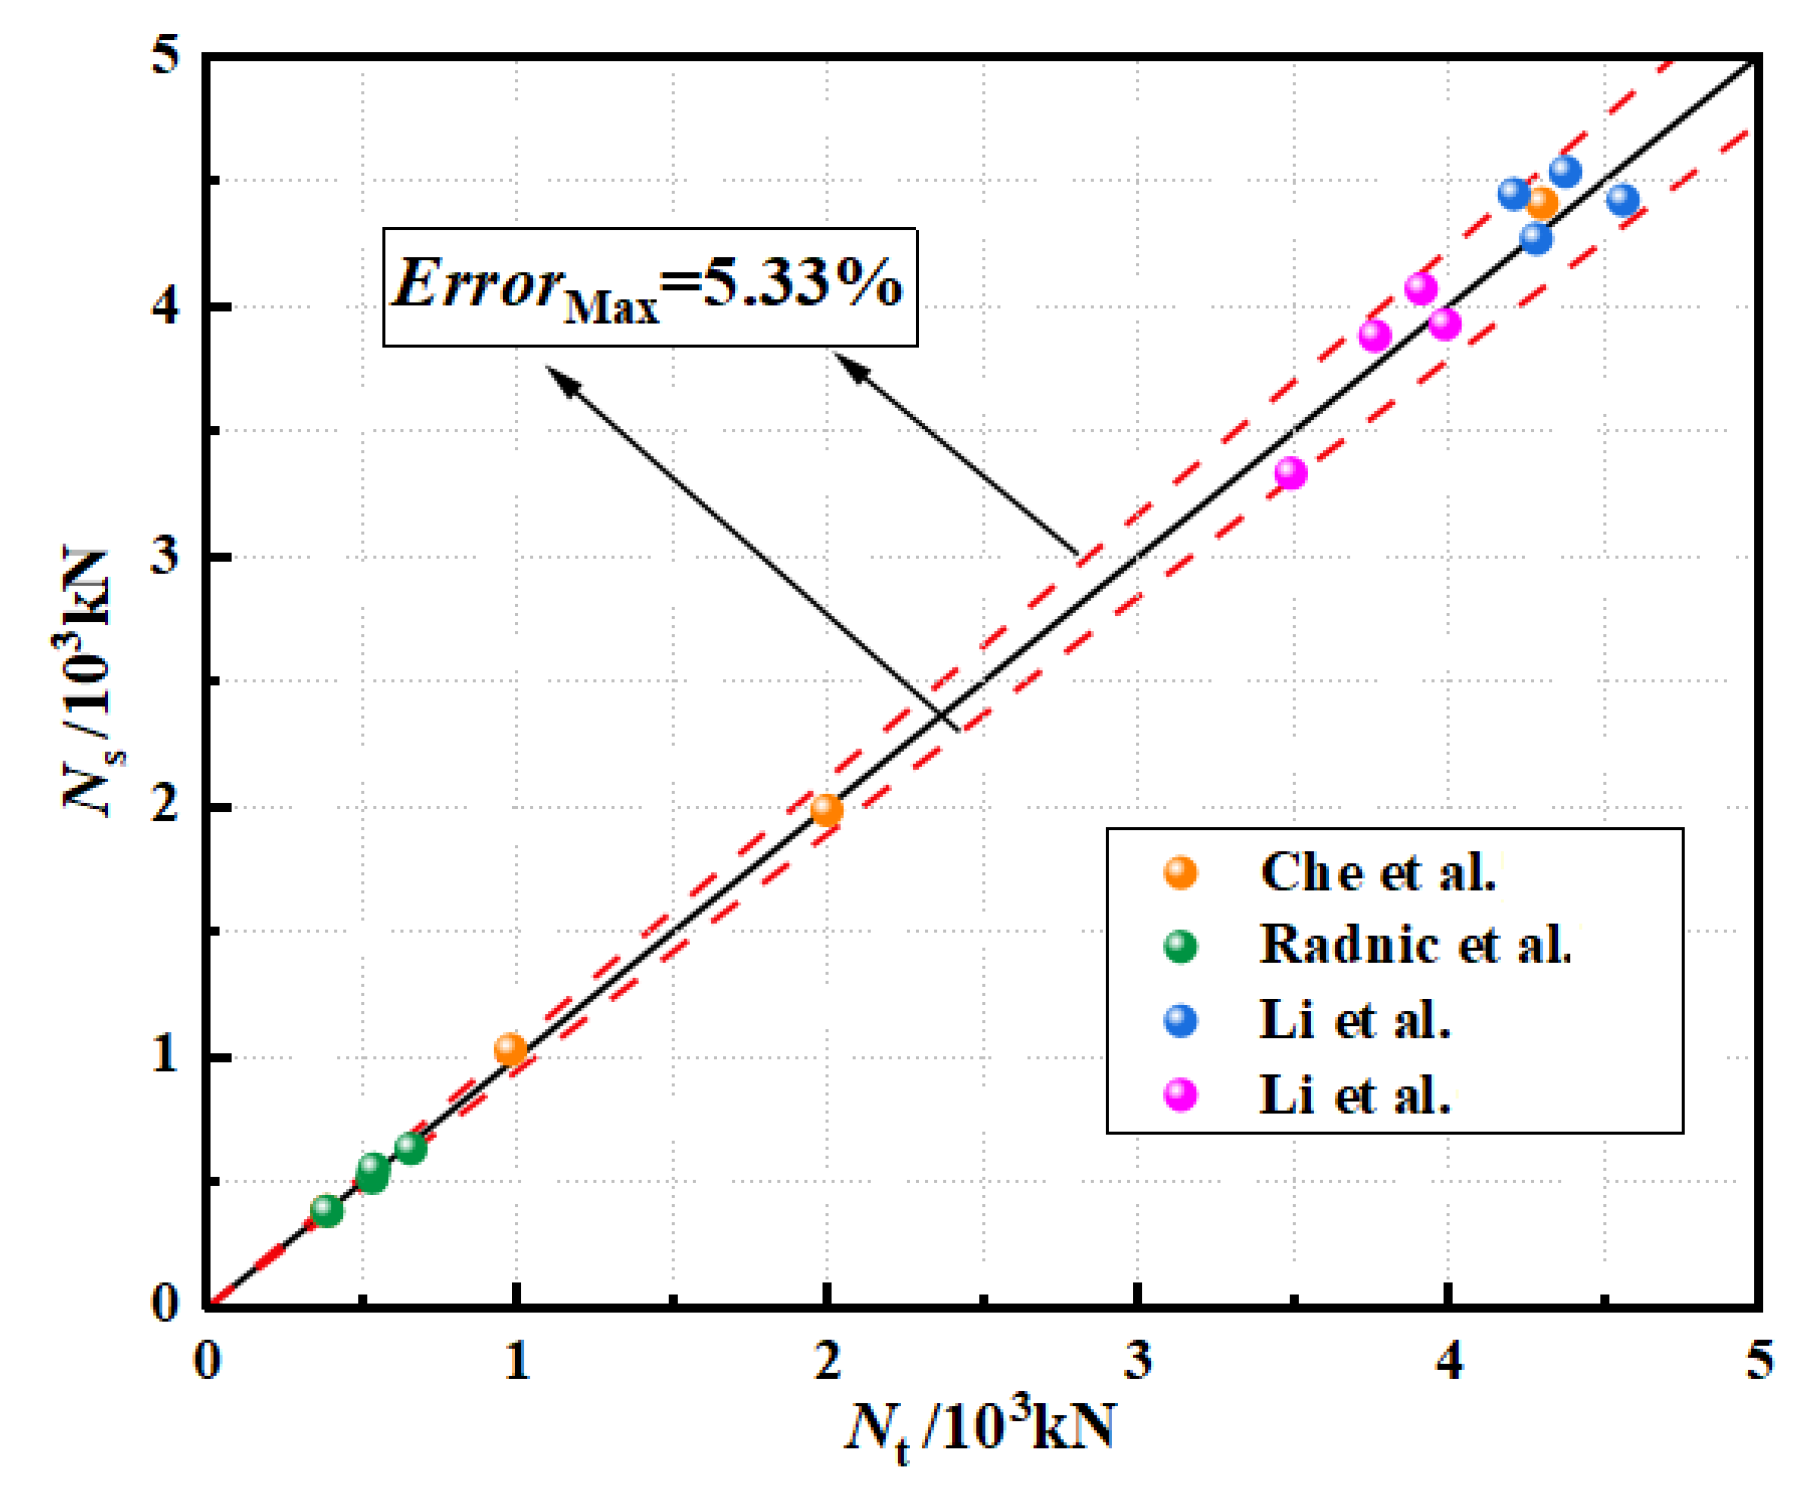
4. Experimental Validation of Finite Element Models
5. Parameter Analysis of EGCSSCs
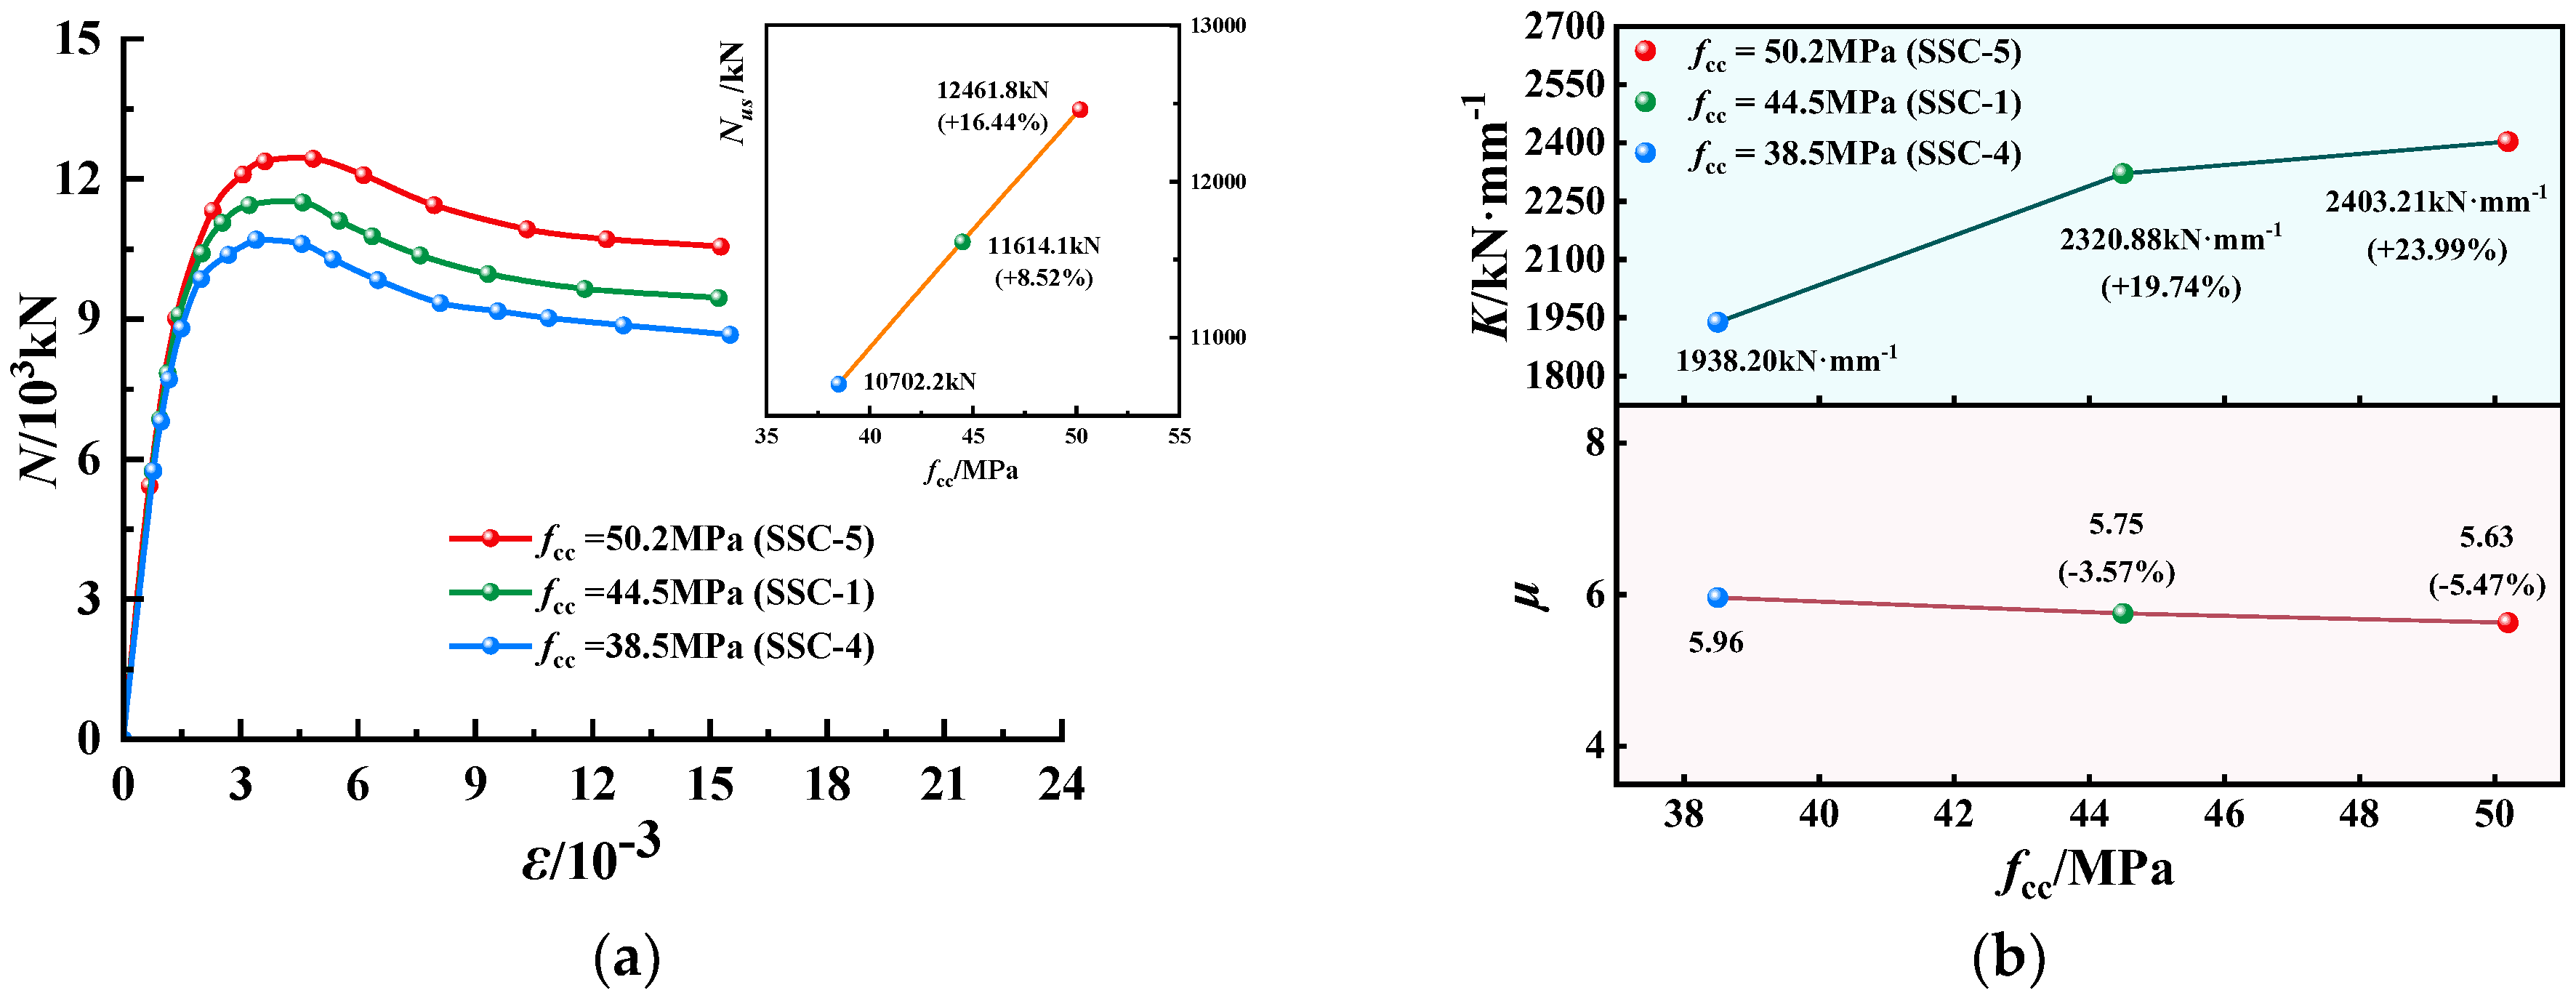
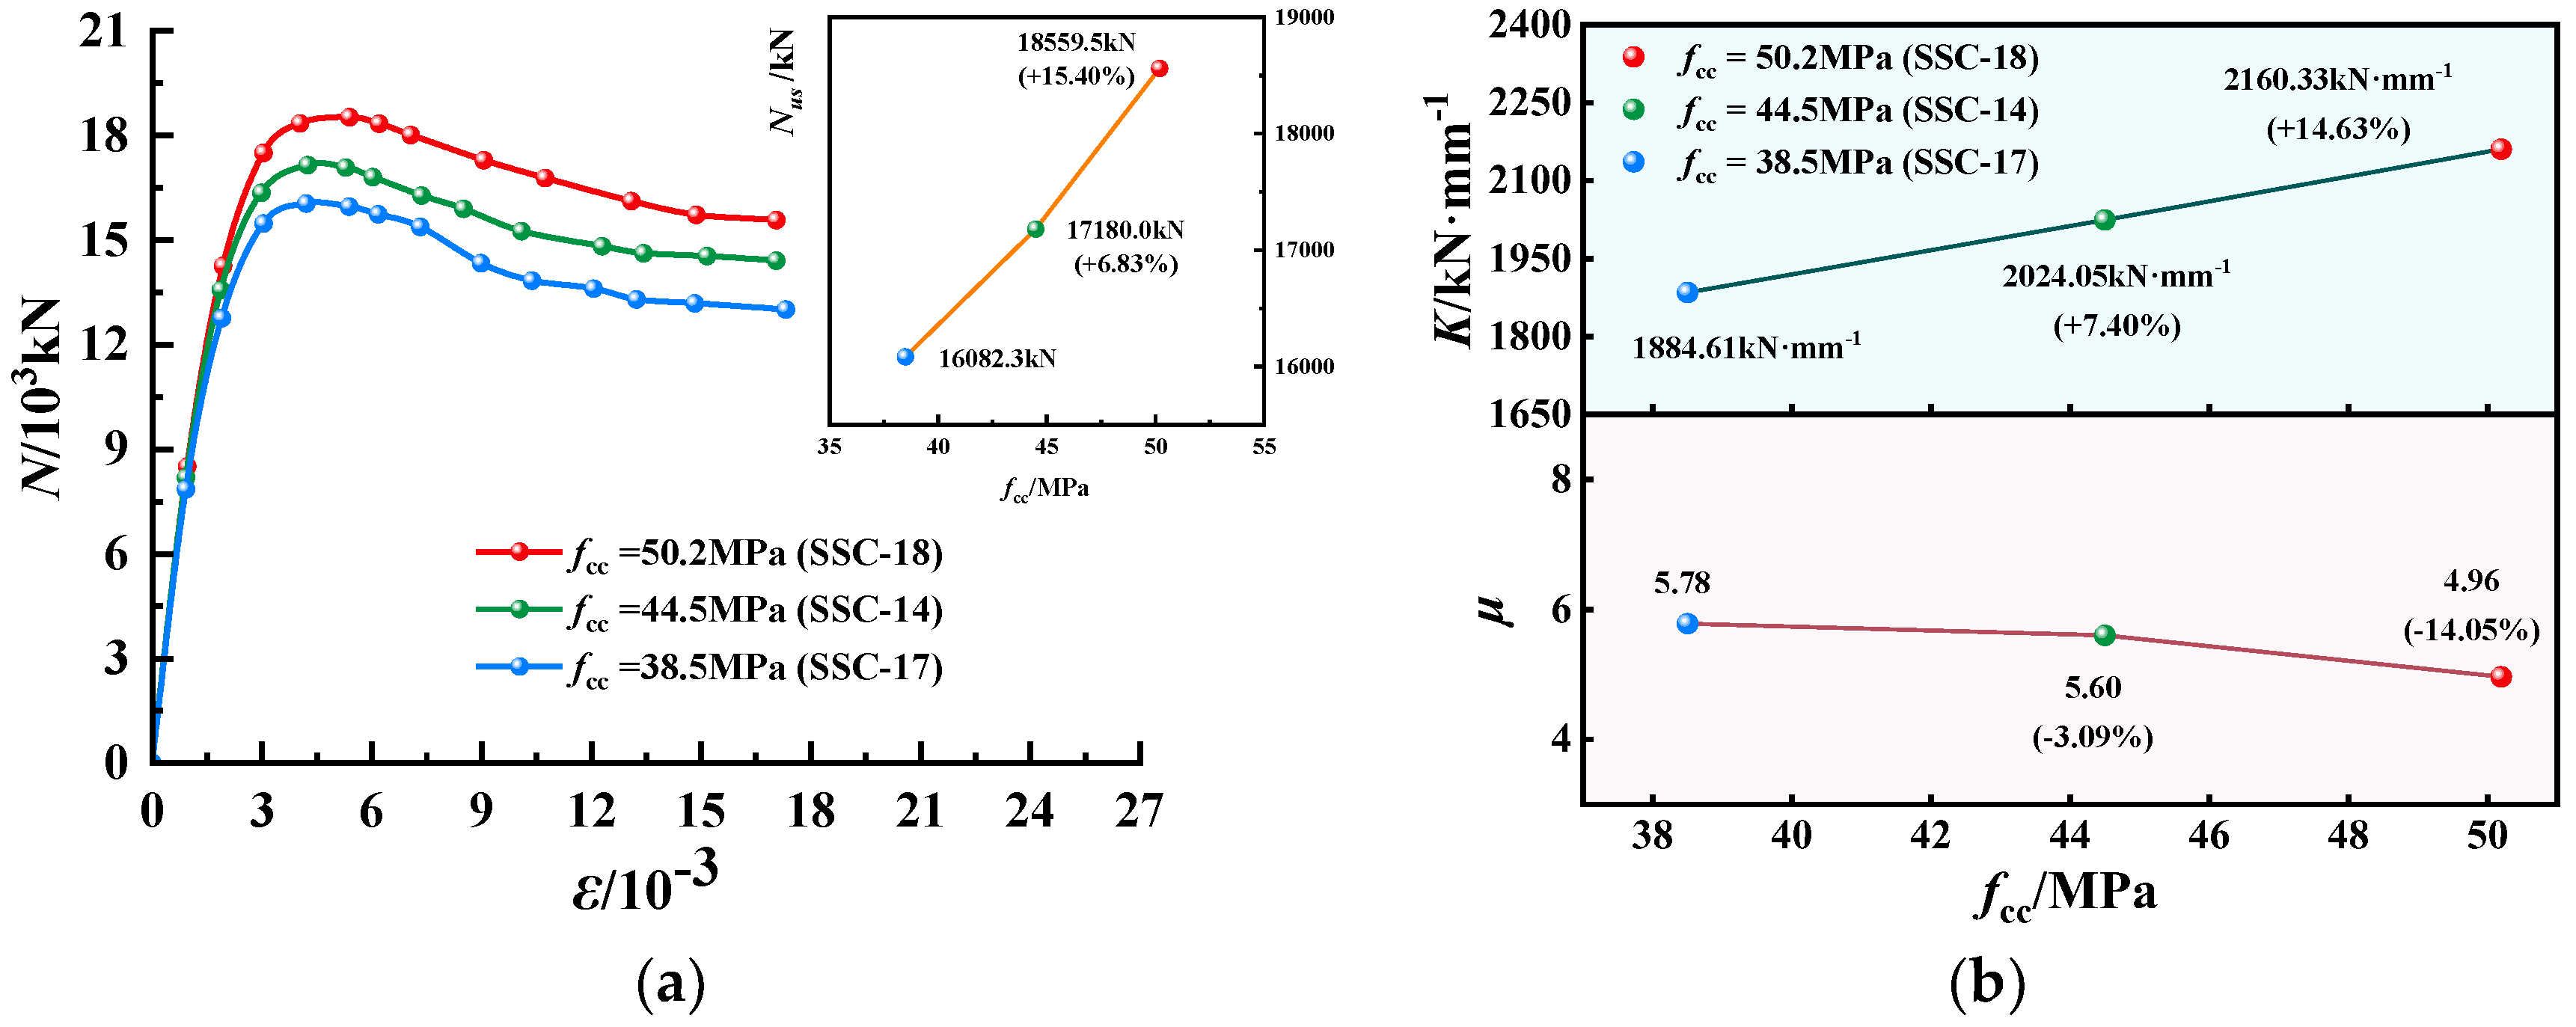
5.1. Axial Compressive Strength of Core Concrete (fcc)
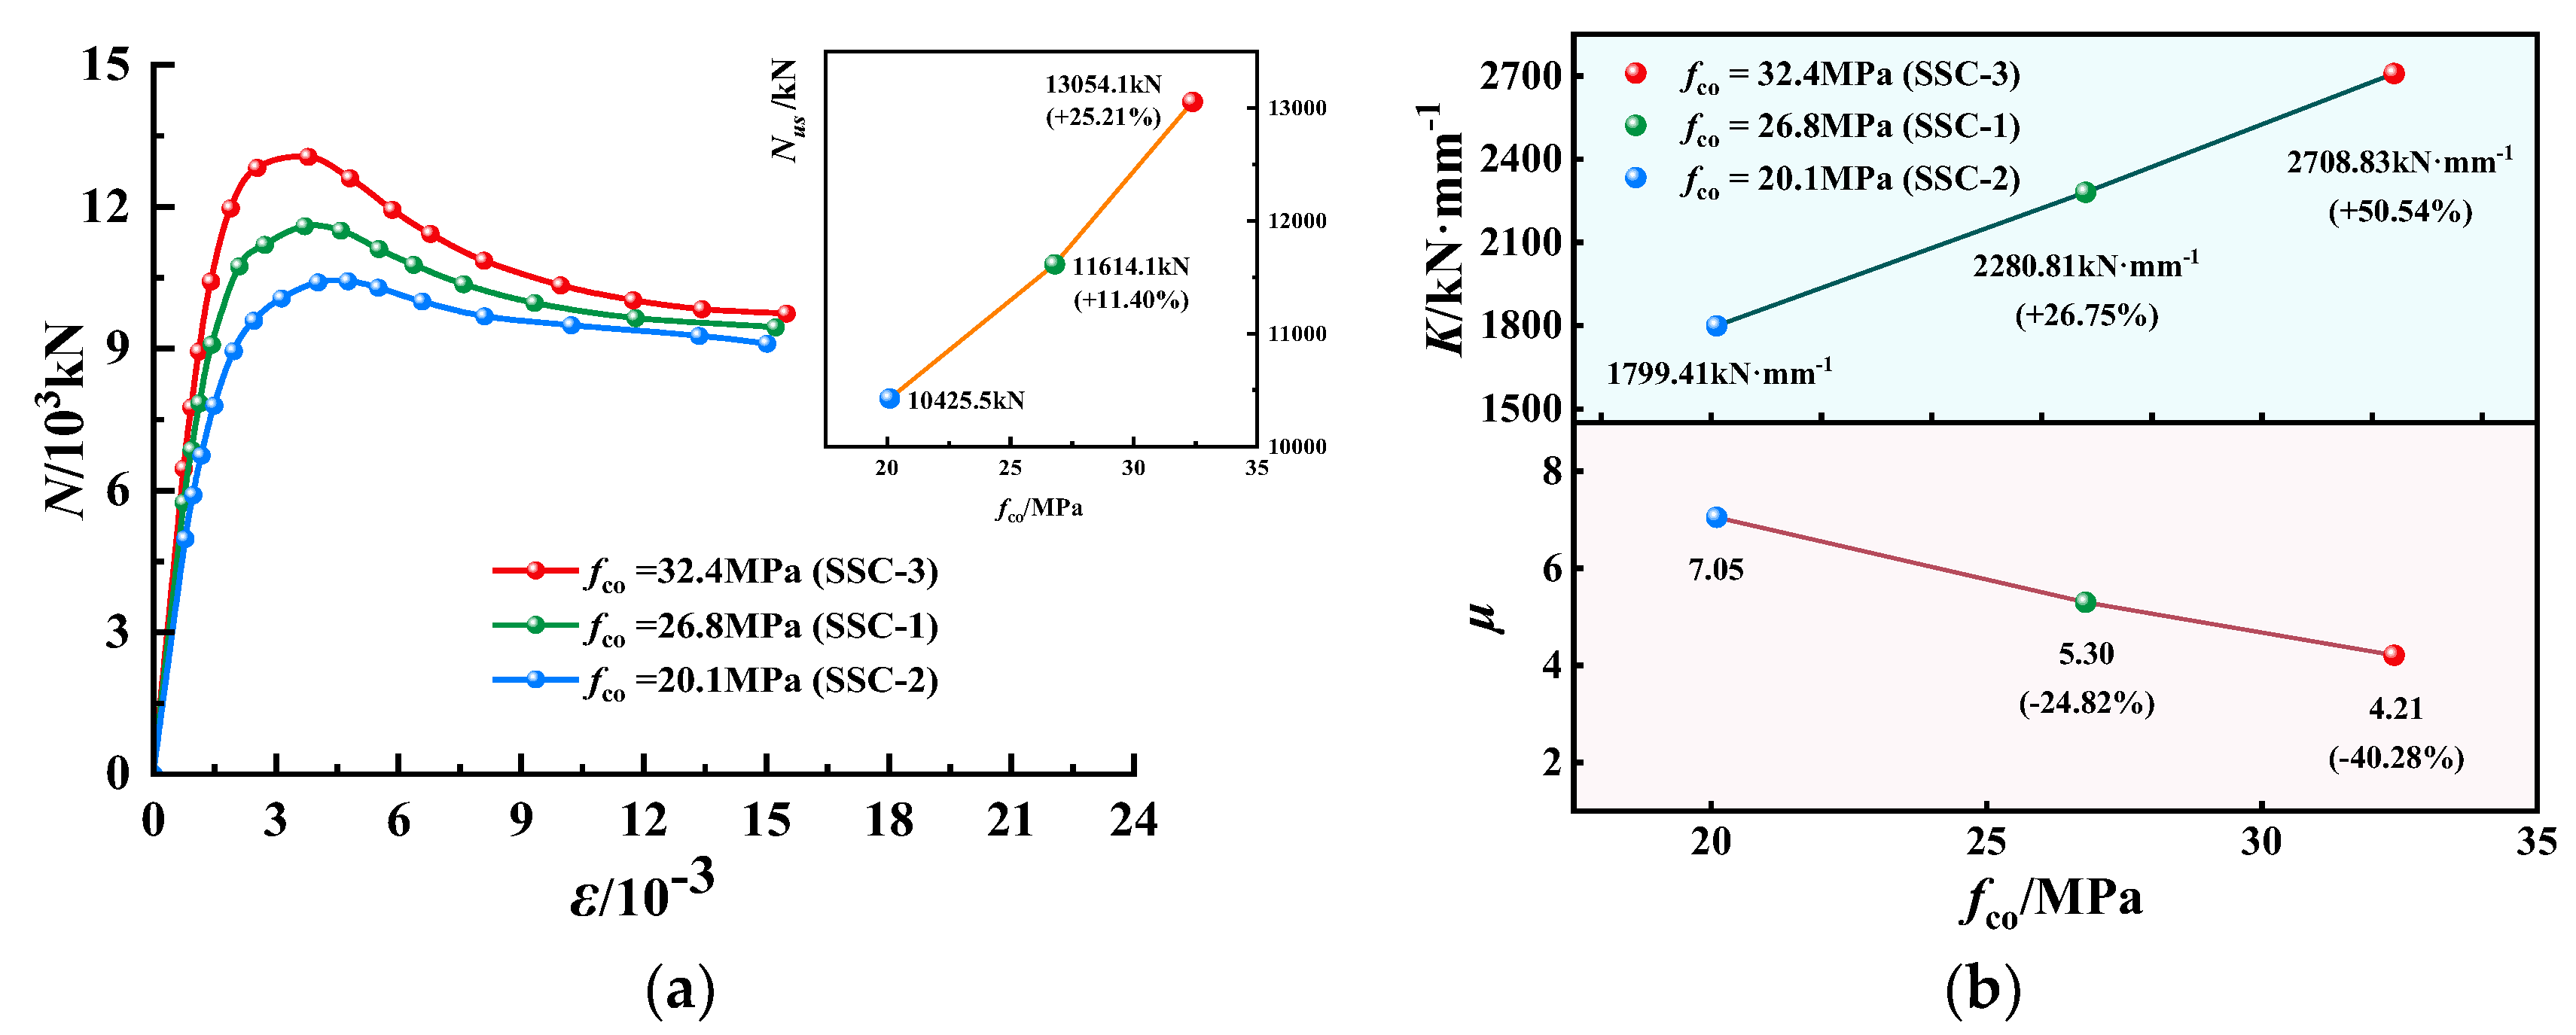
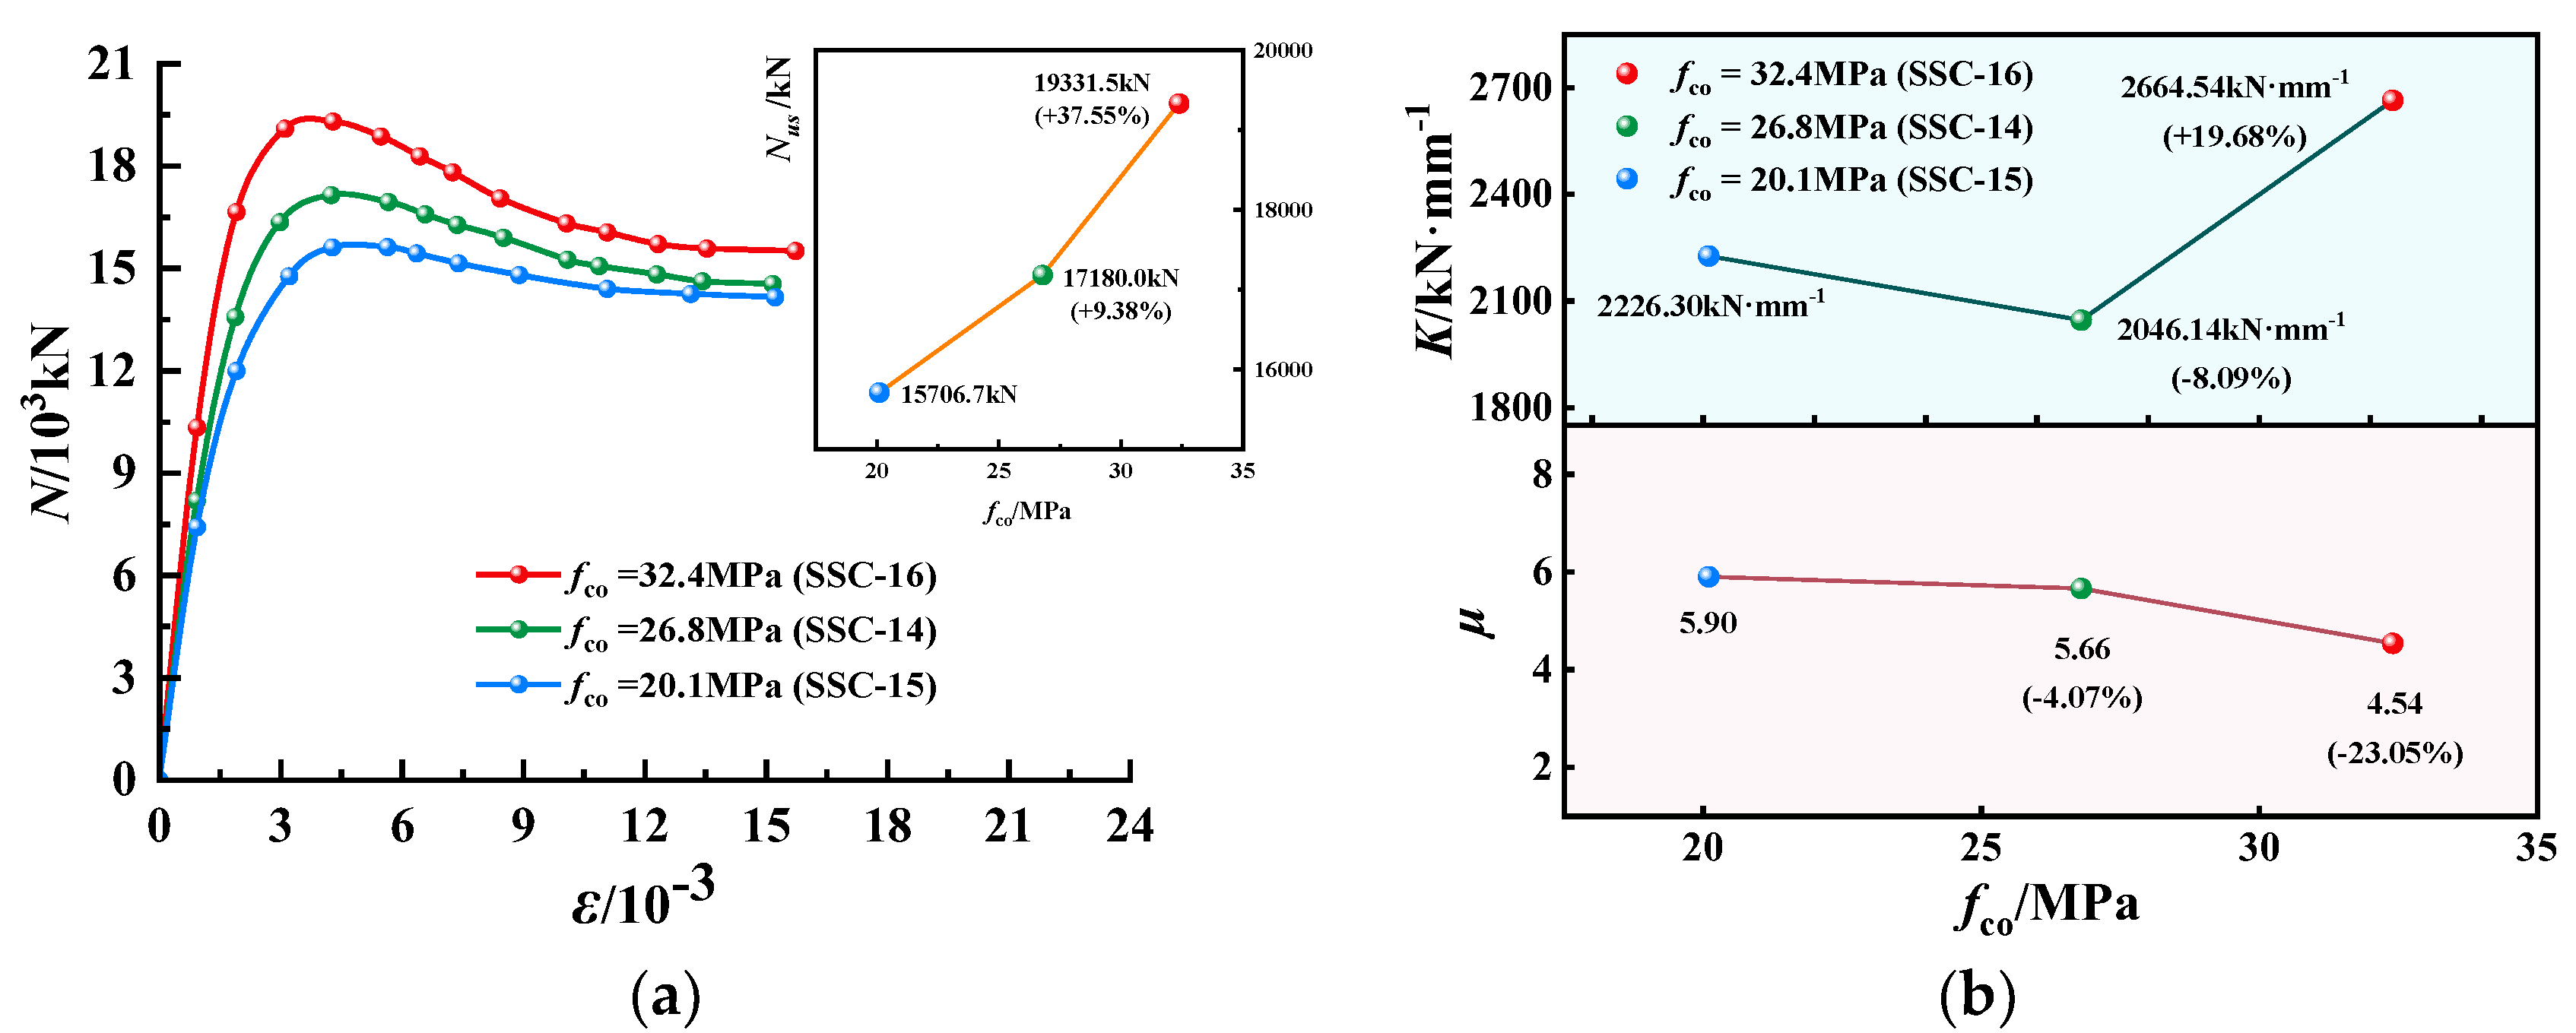
5.2. Axial Compressive Strength of Peripheral Concrete (fco)
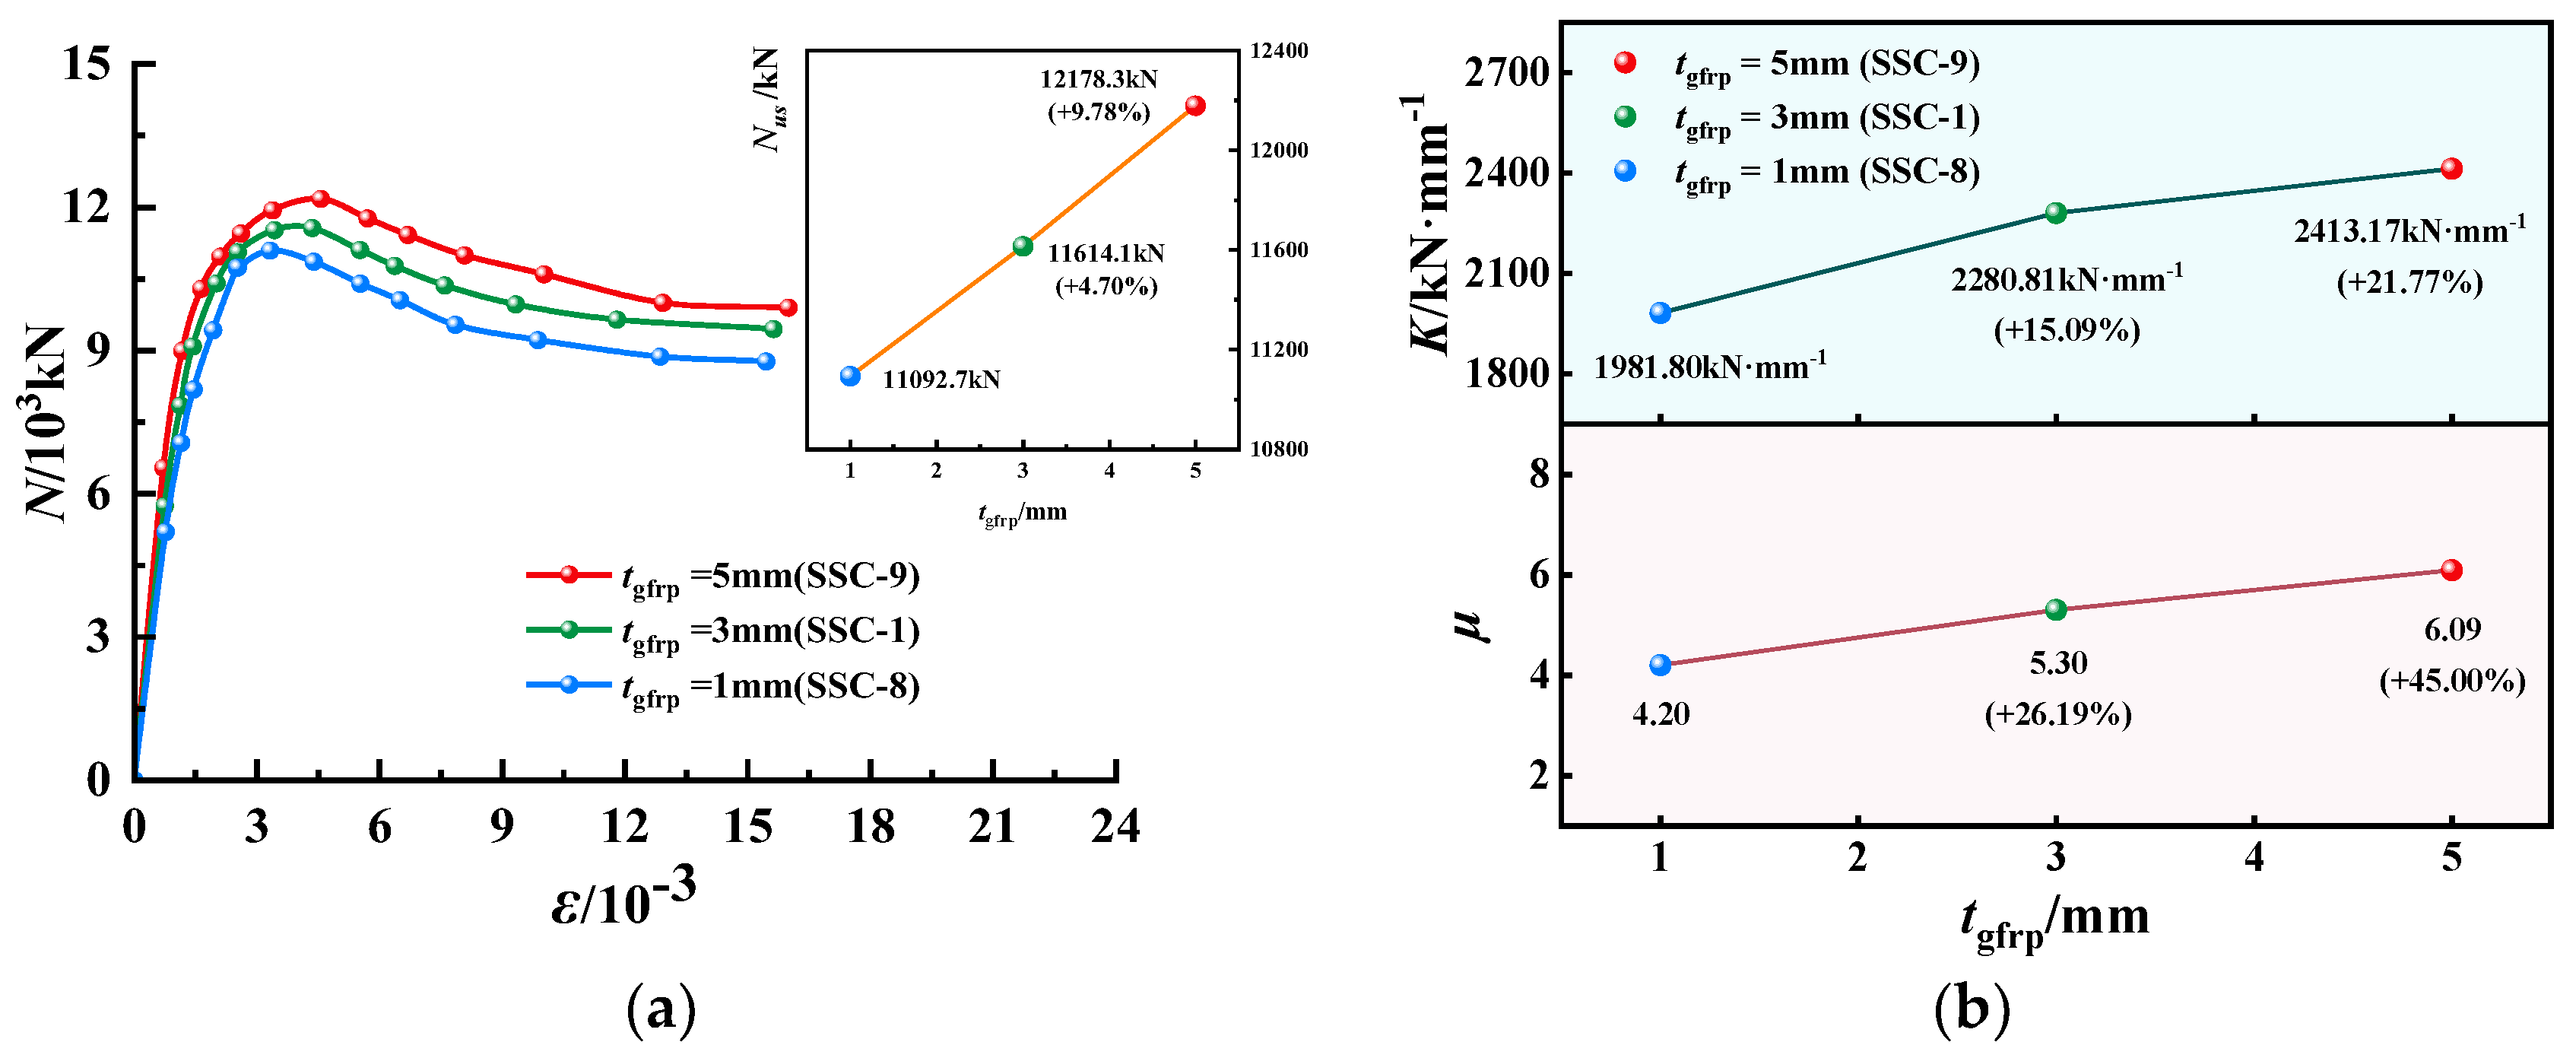
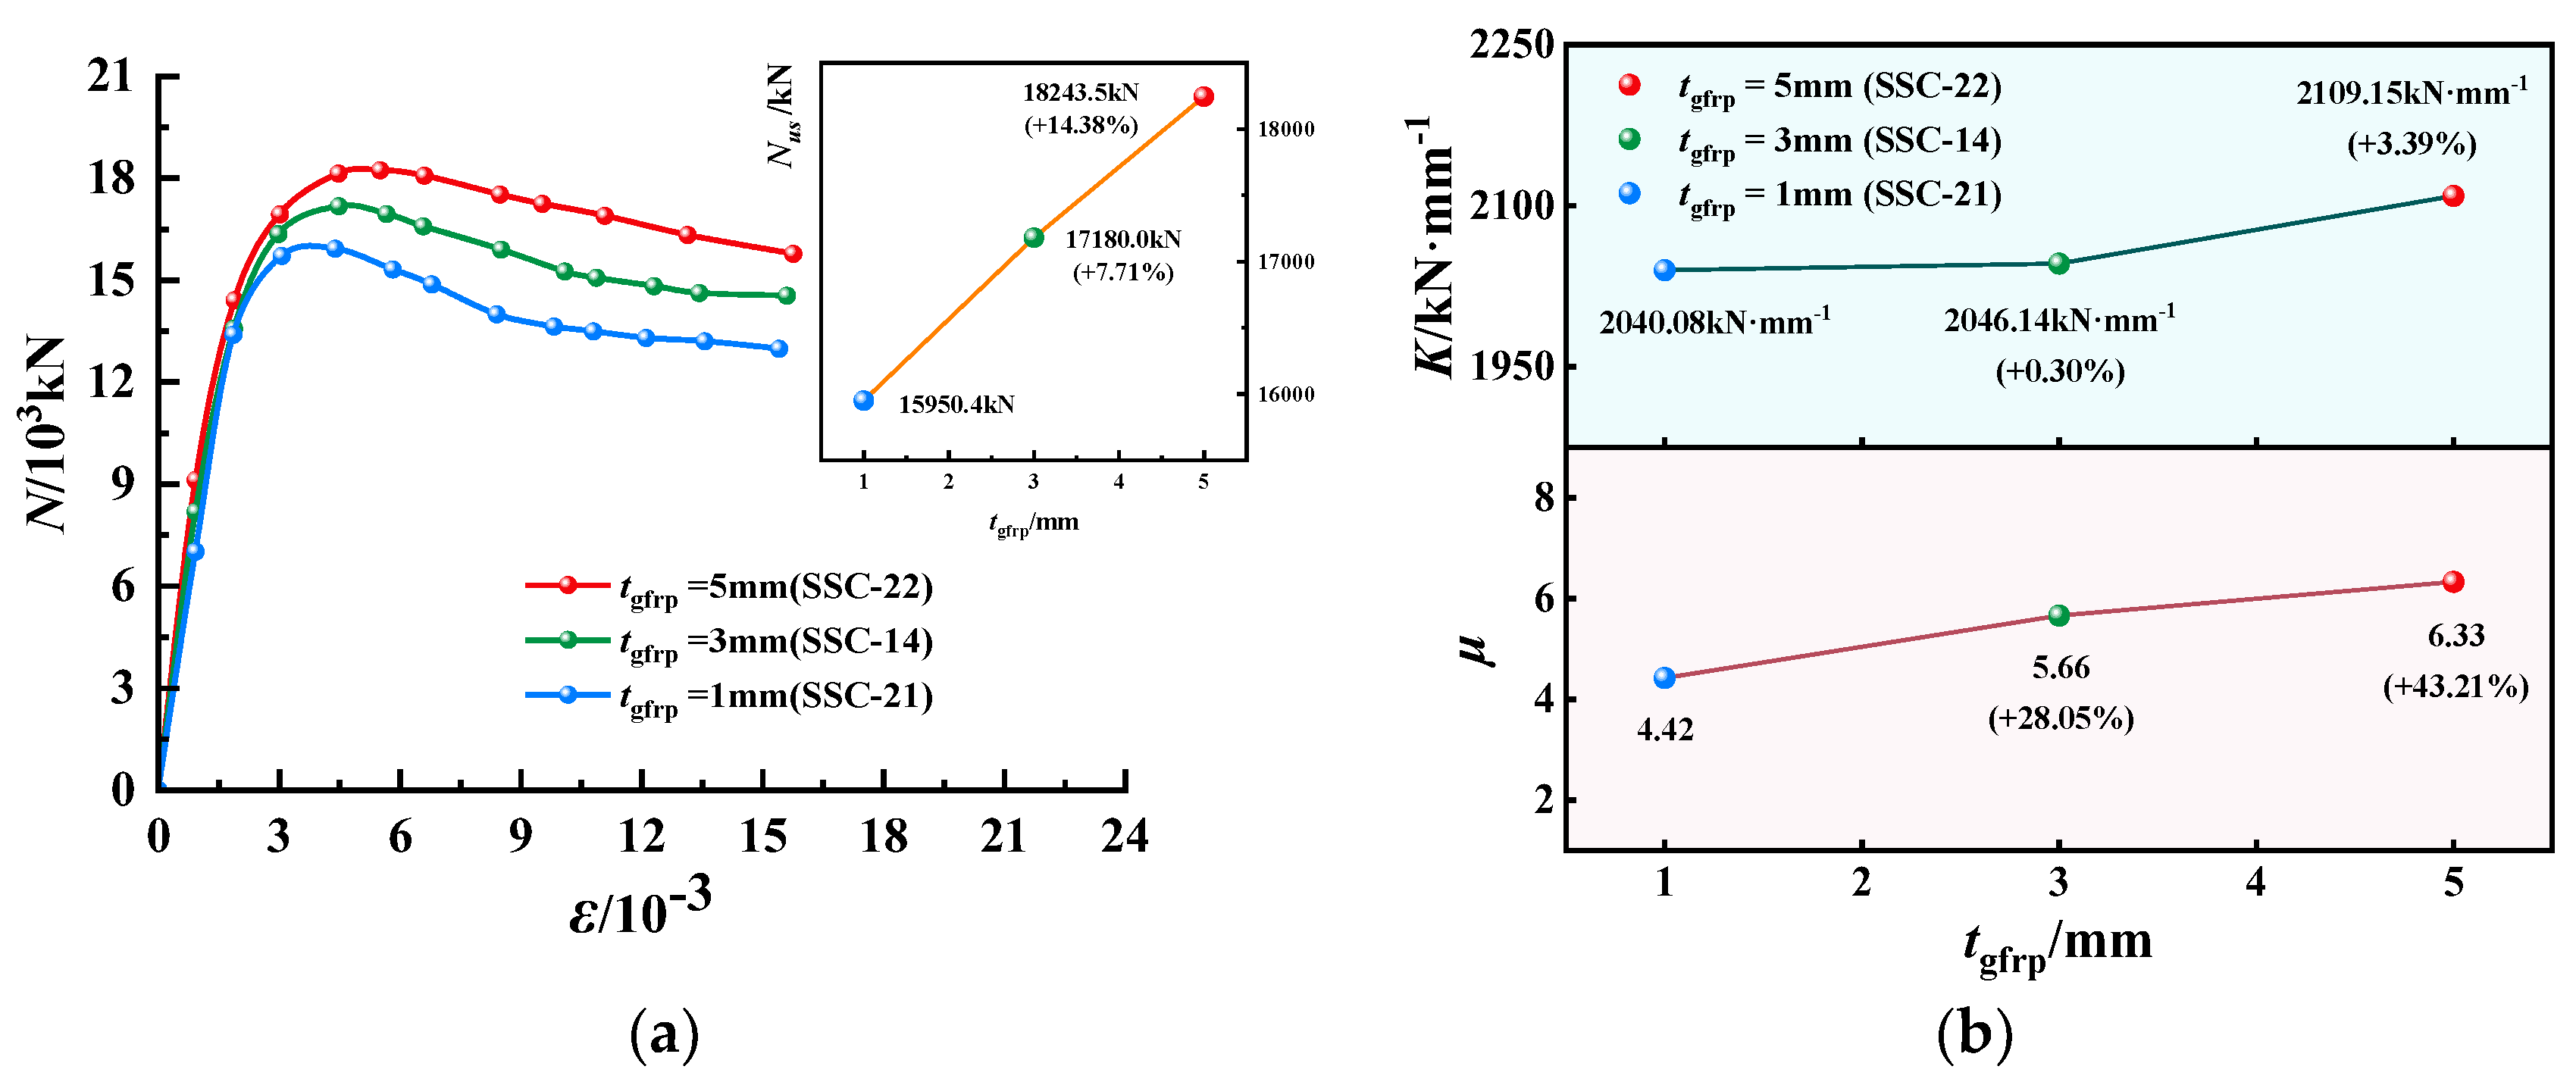
5.3. The Thickness of GFRP Tube (tgfrp)
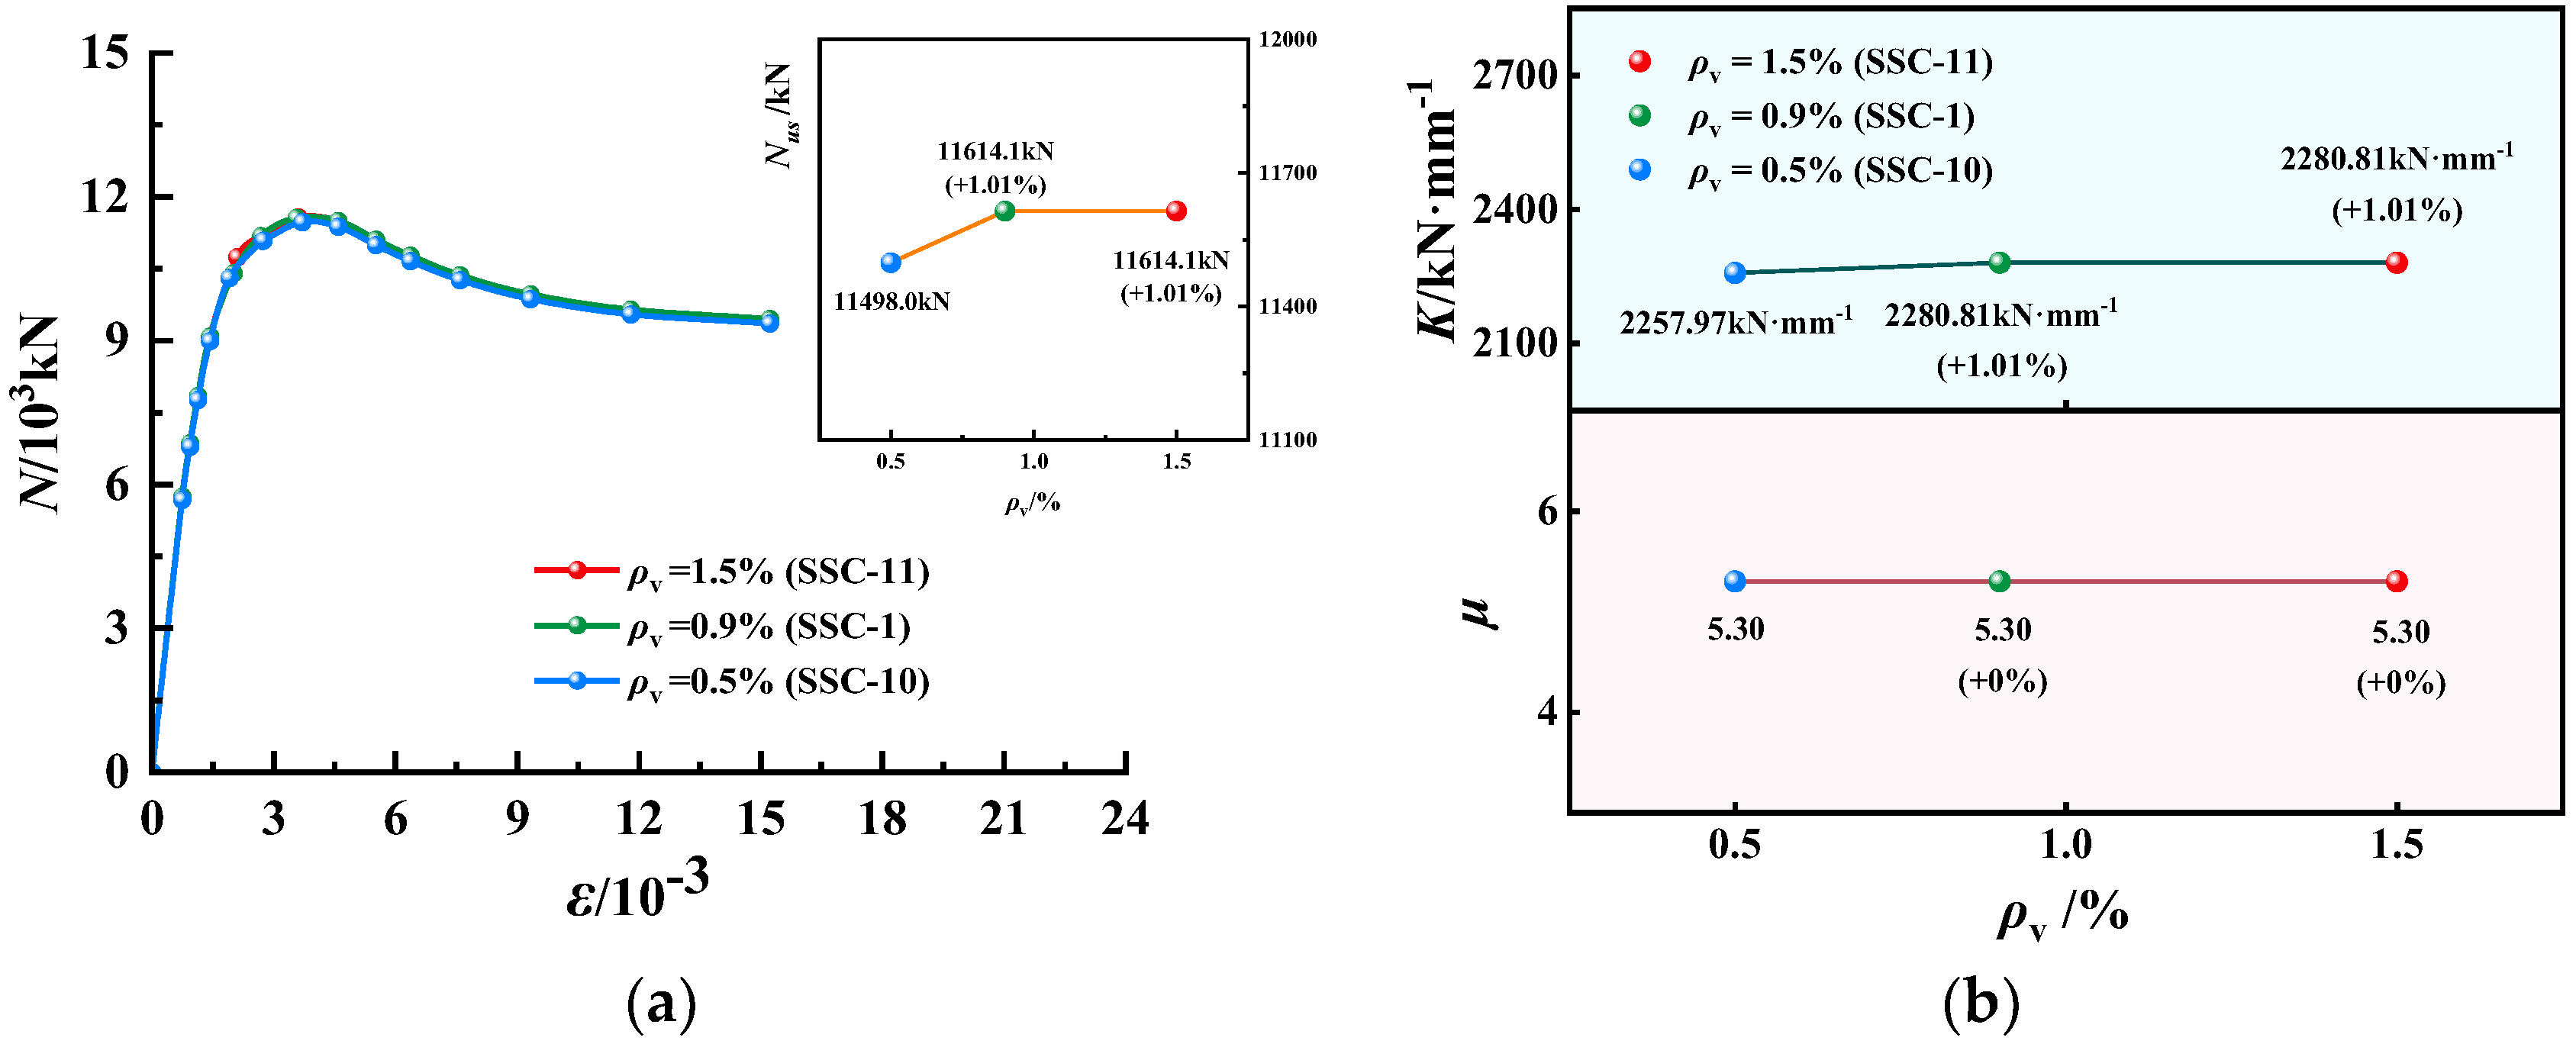
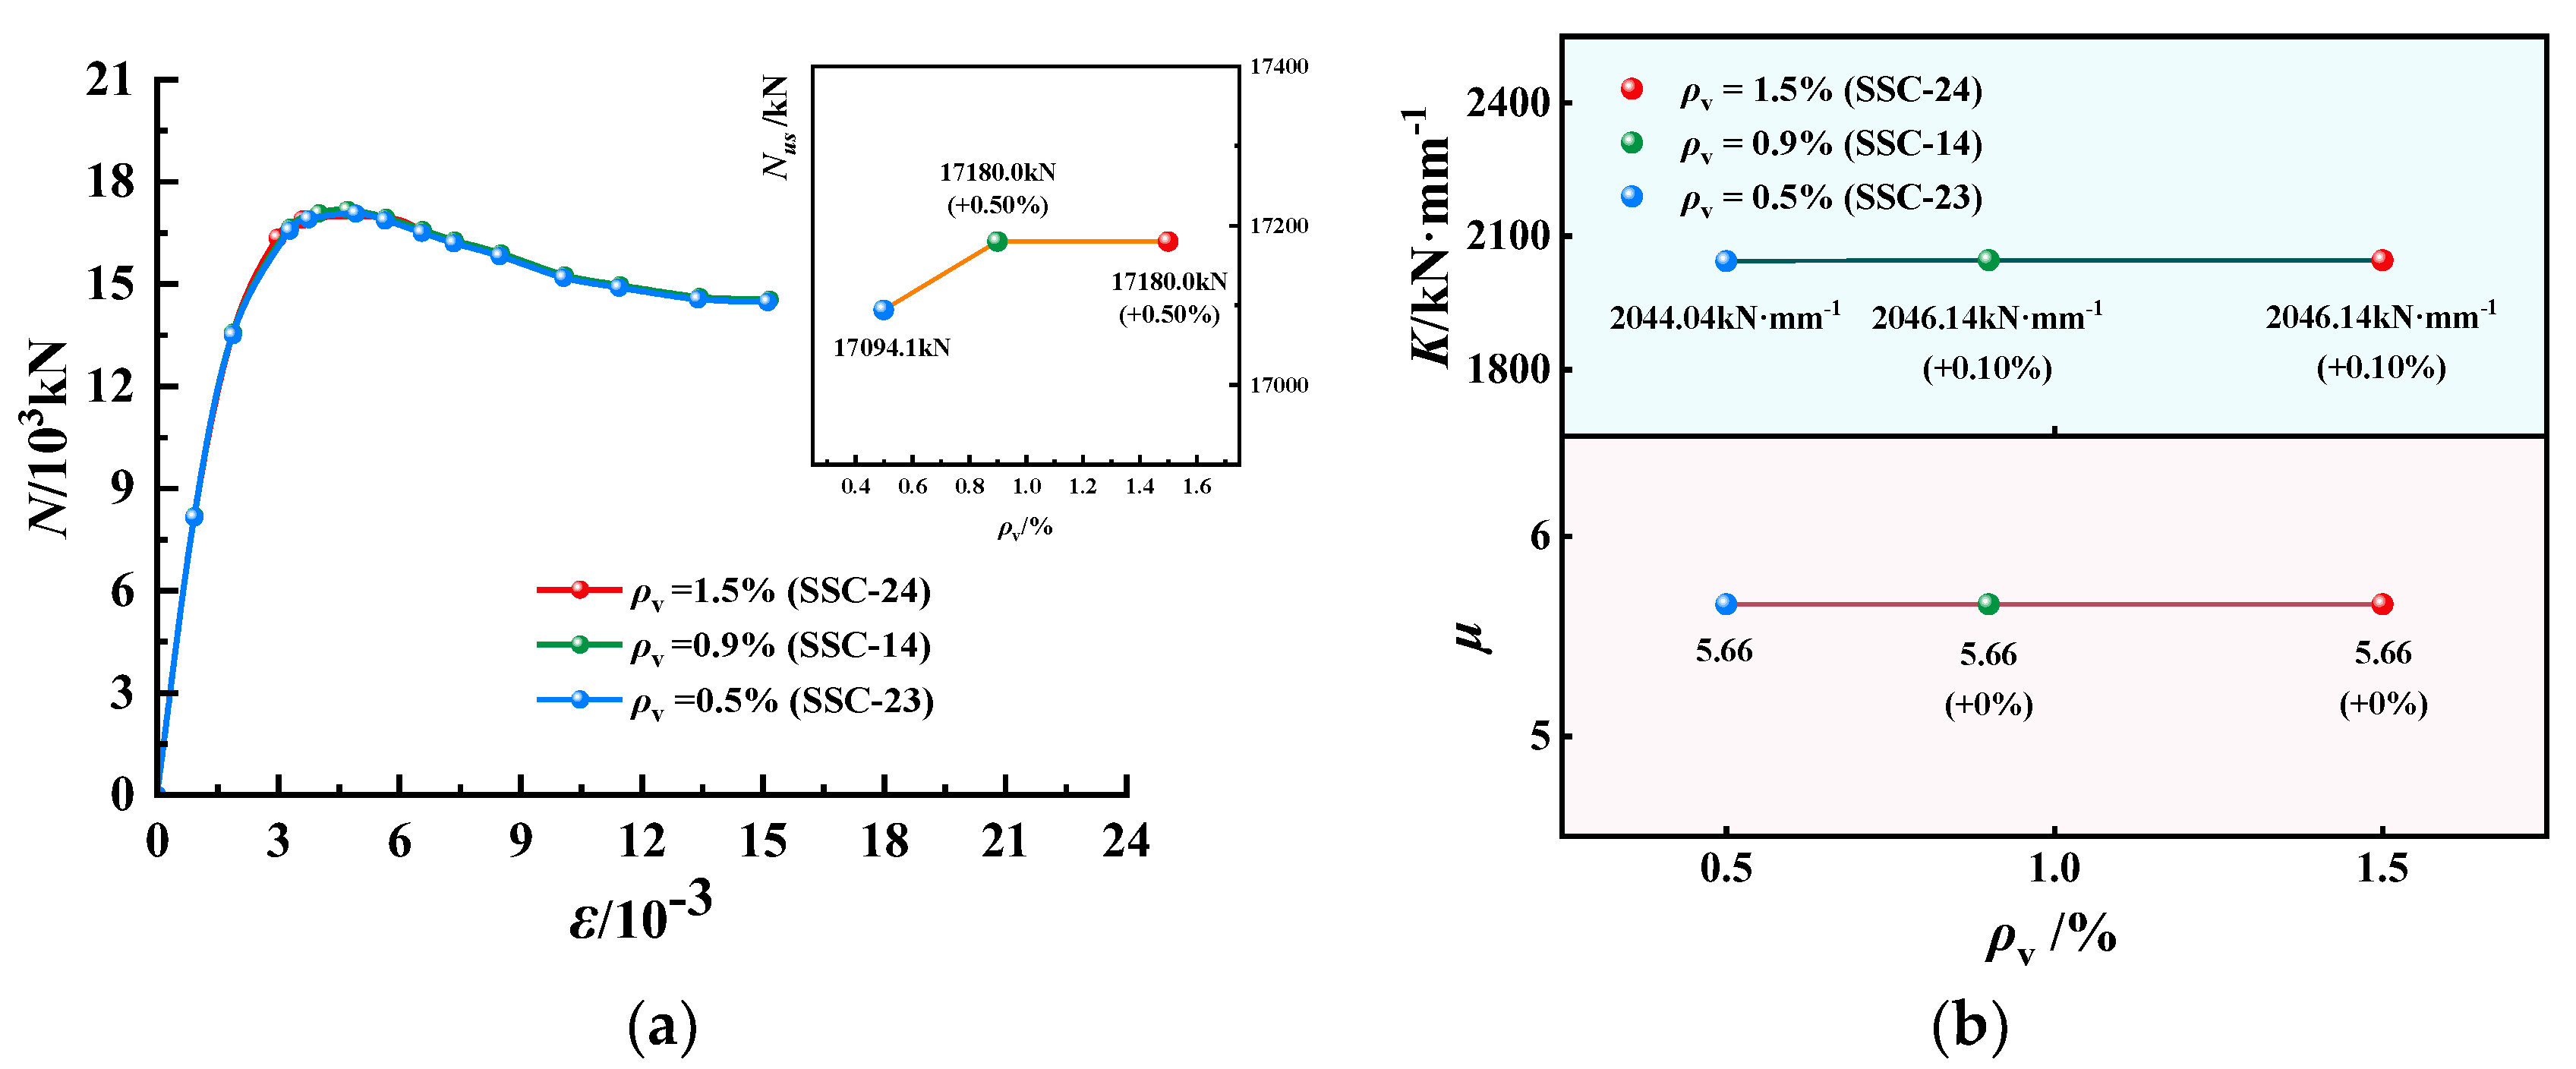
5.4. The Ratio of Longitudinal Reinforcement (ρv)
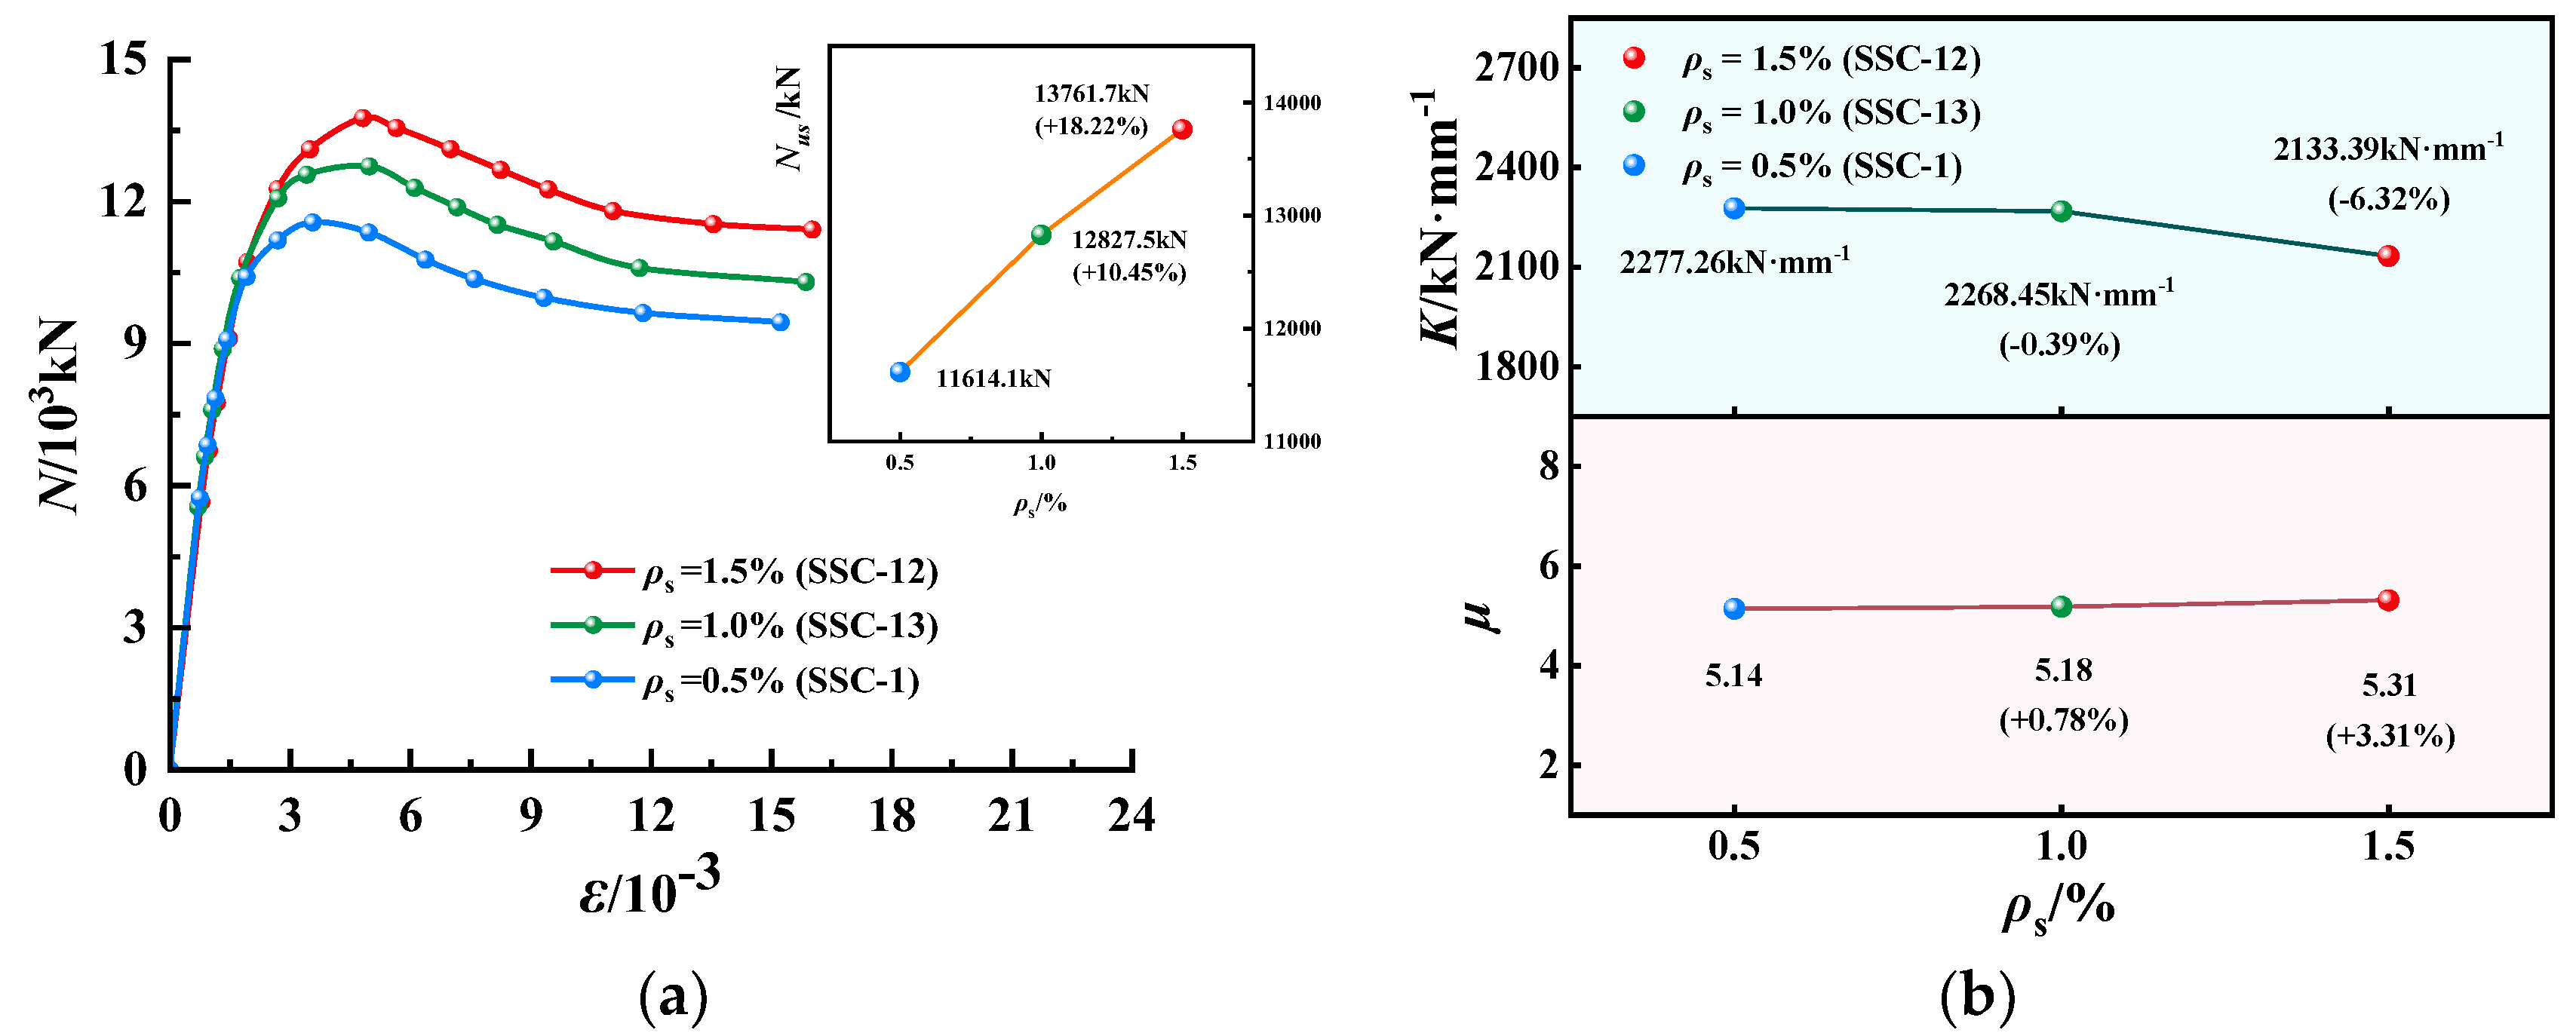
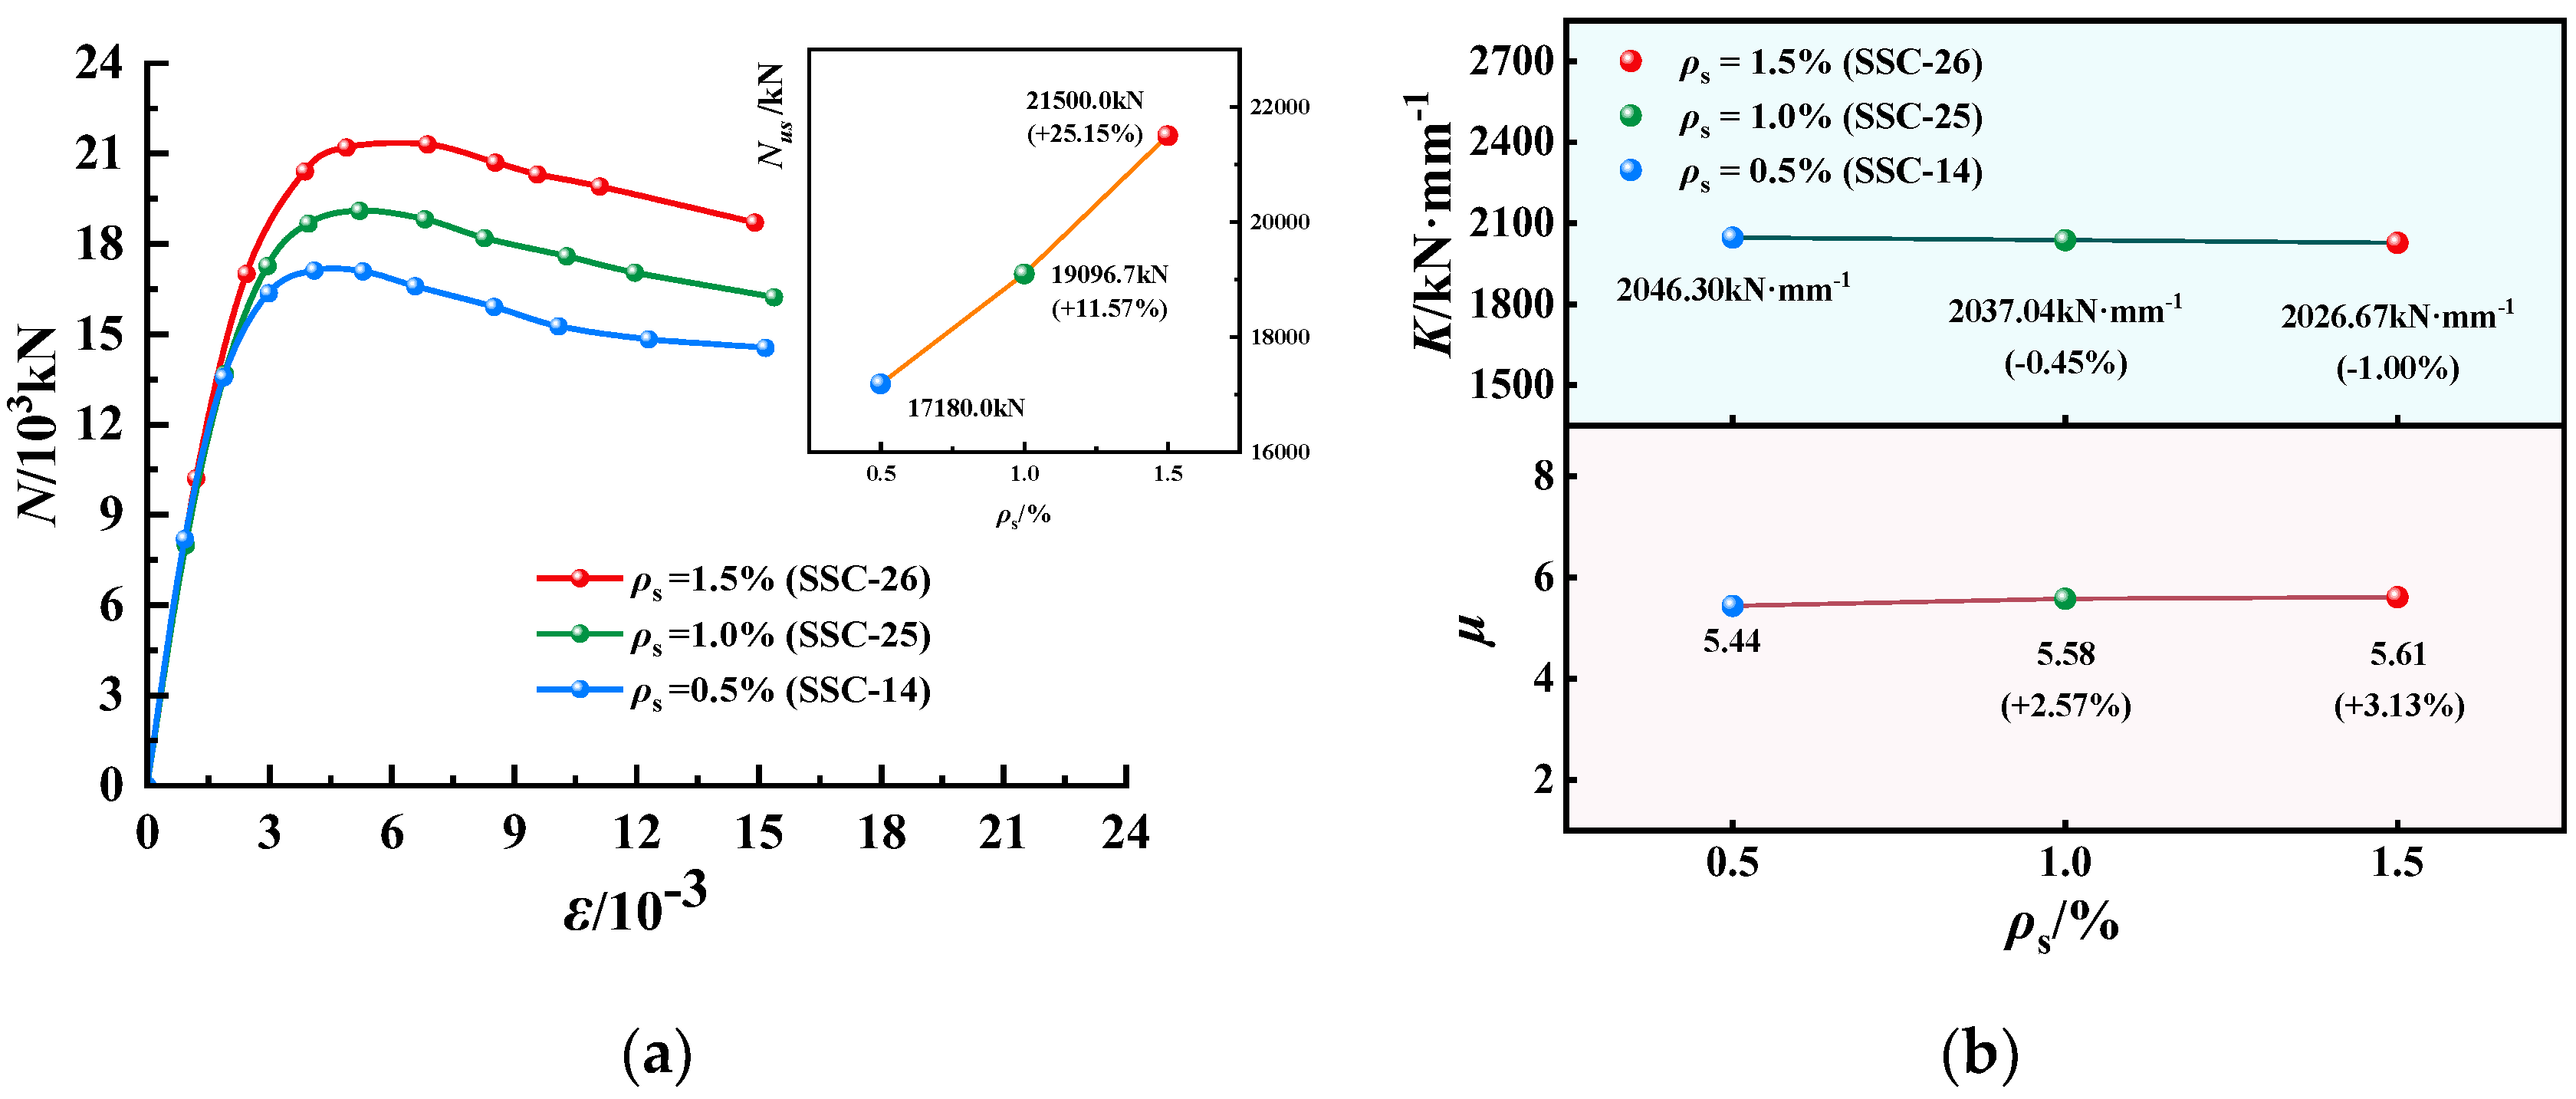
5.5. The Stirrup Ratio (ρs)
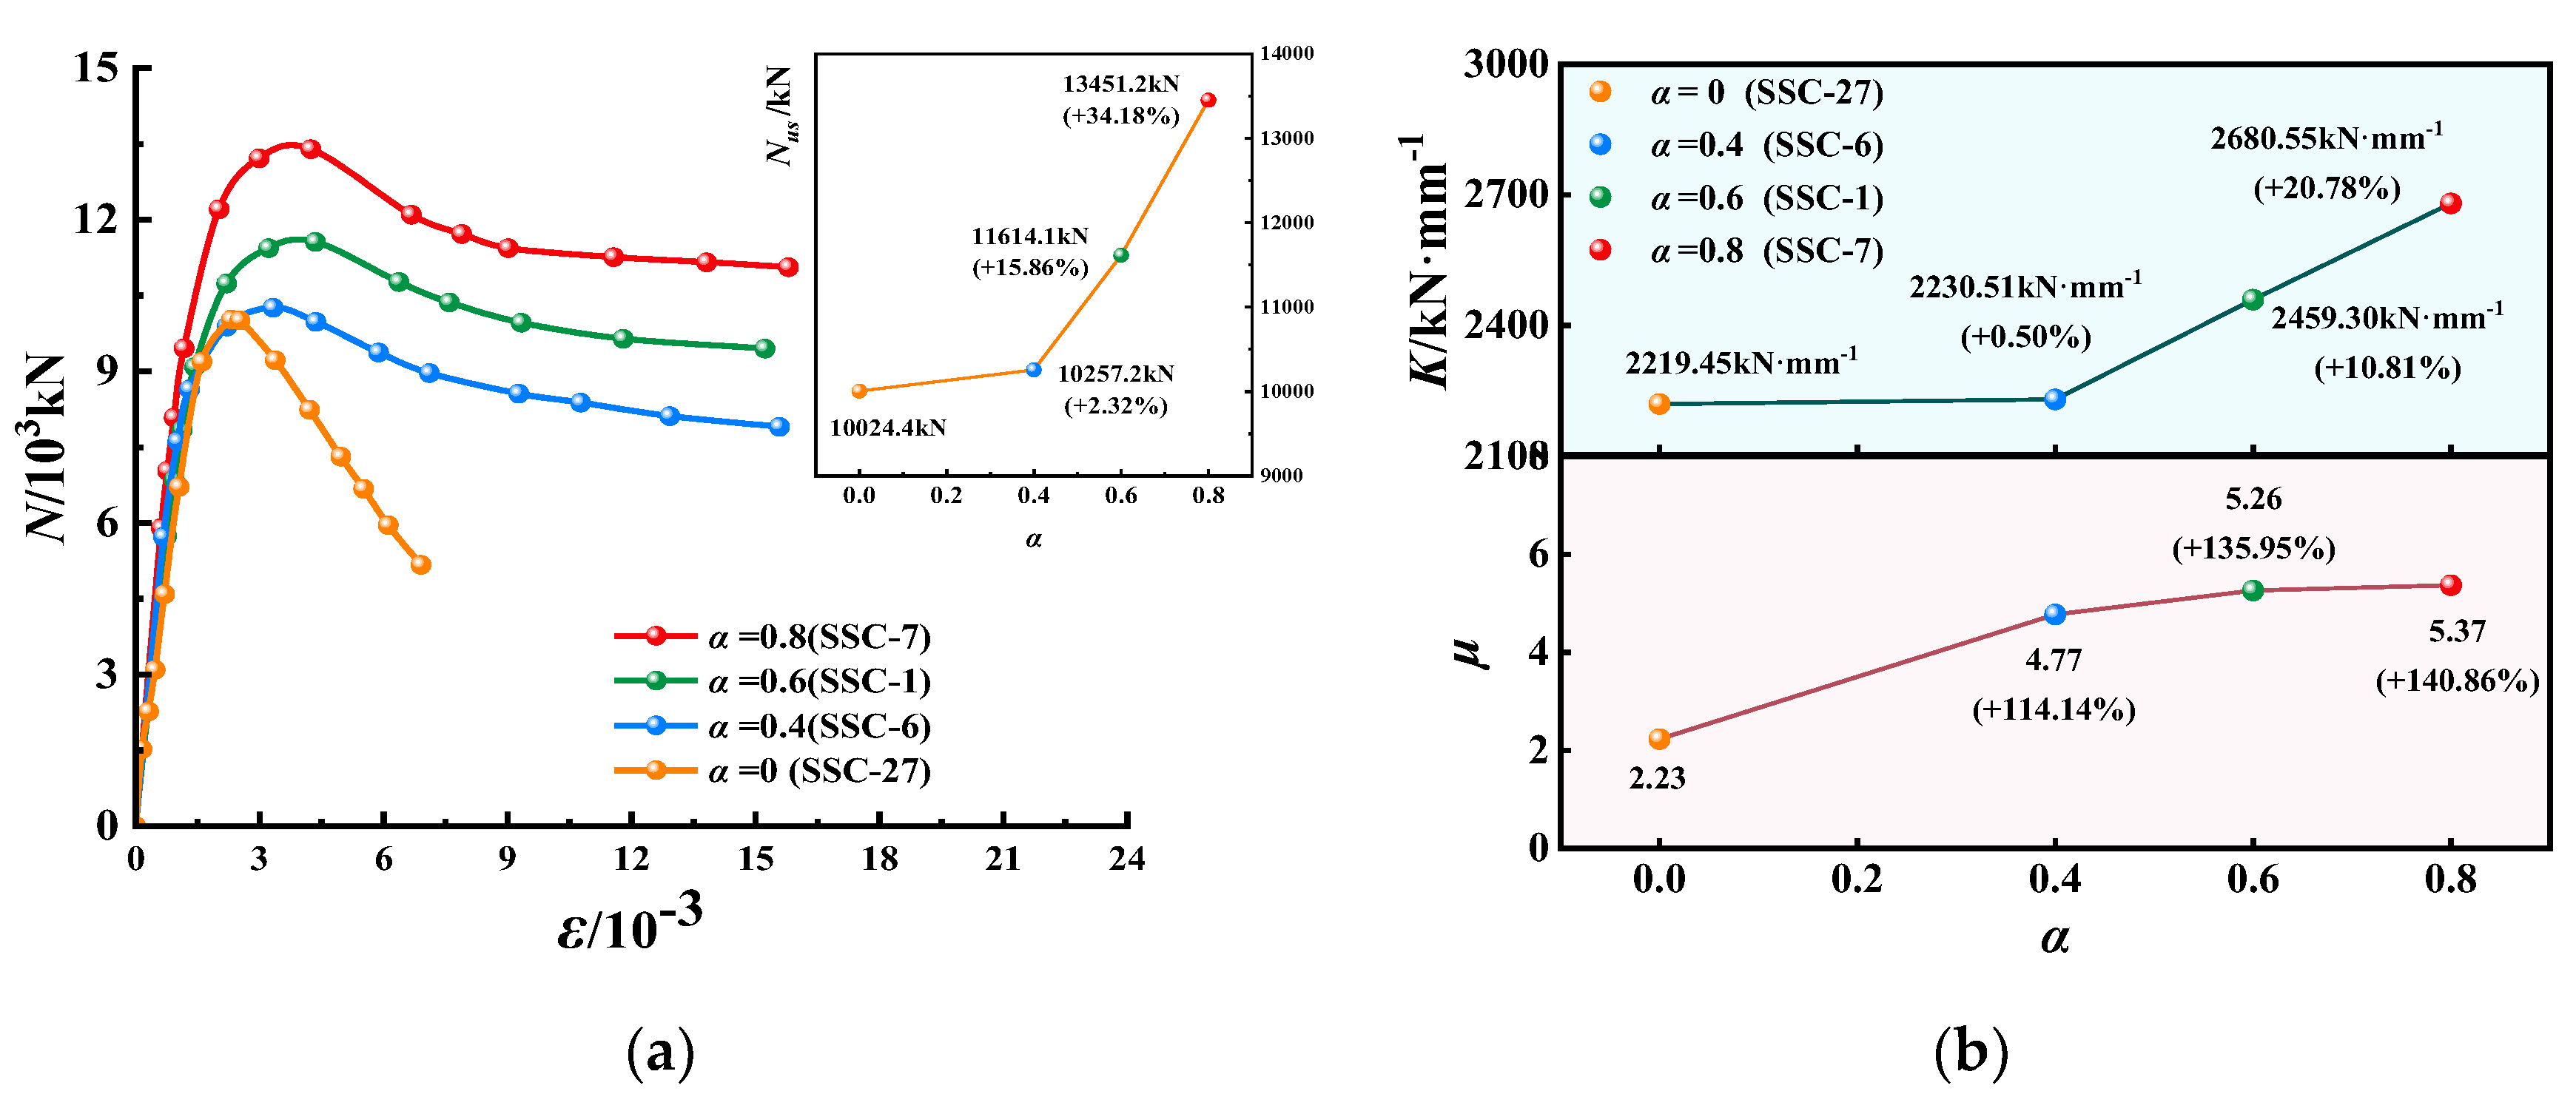
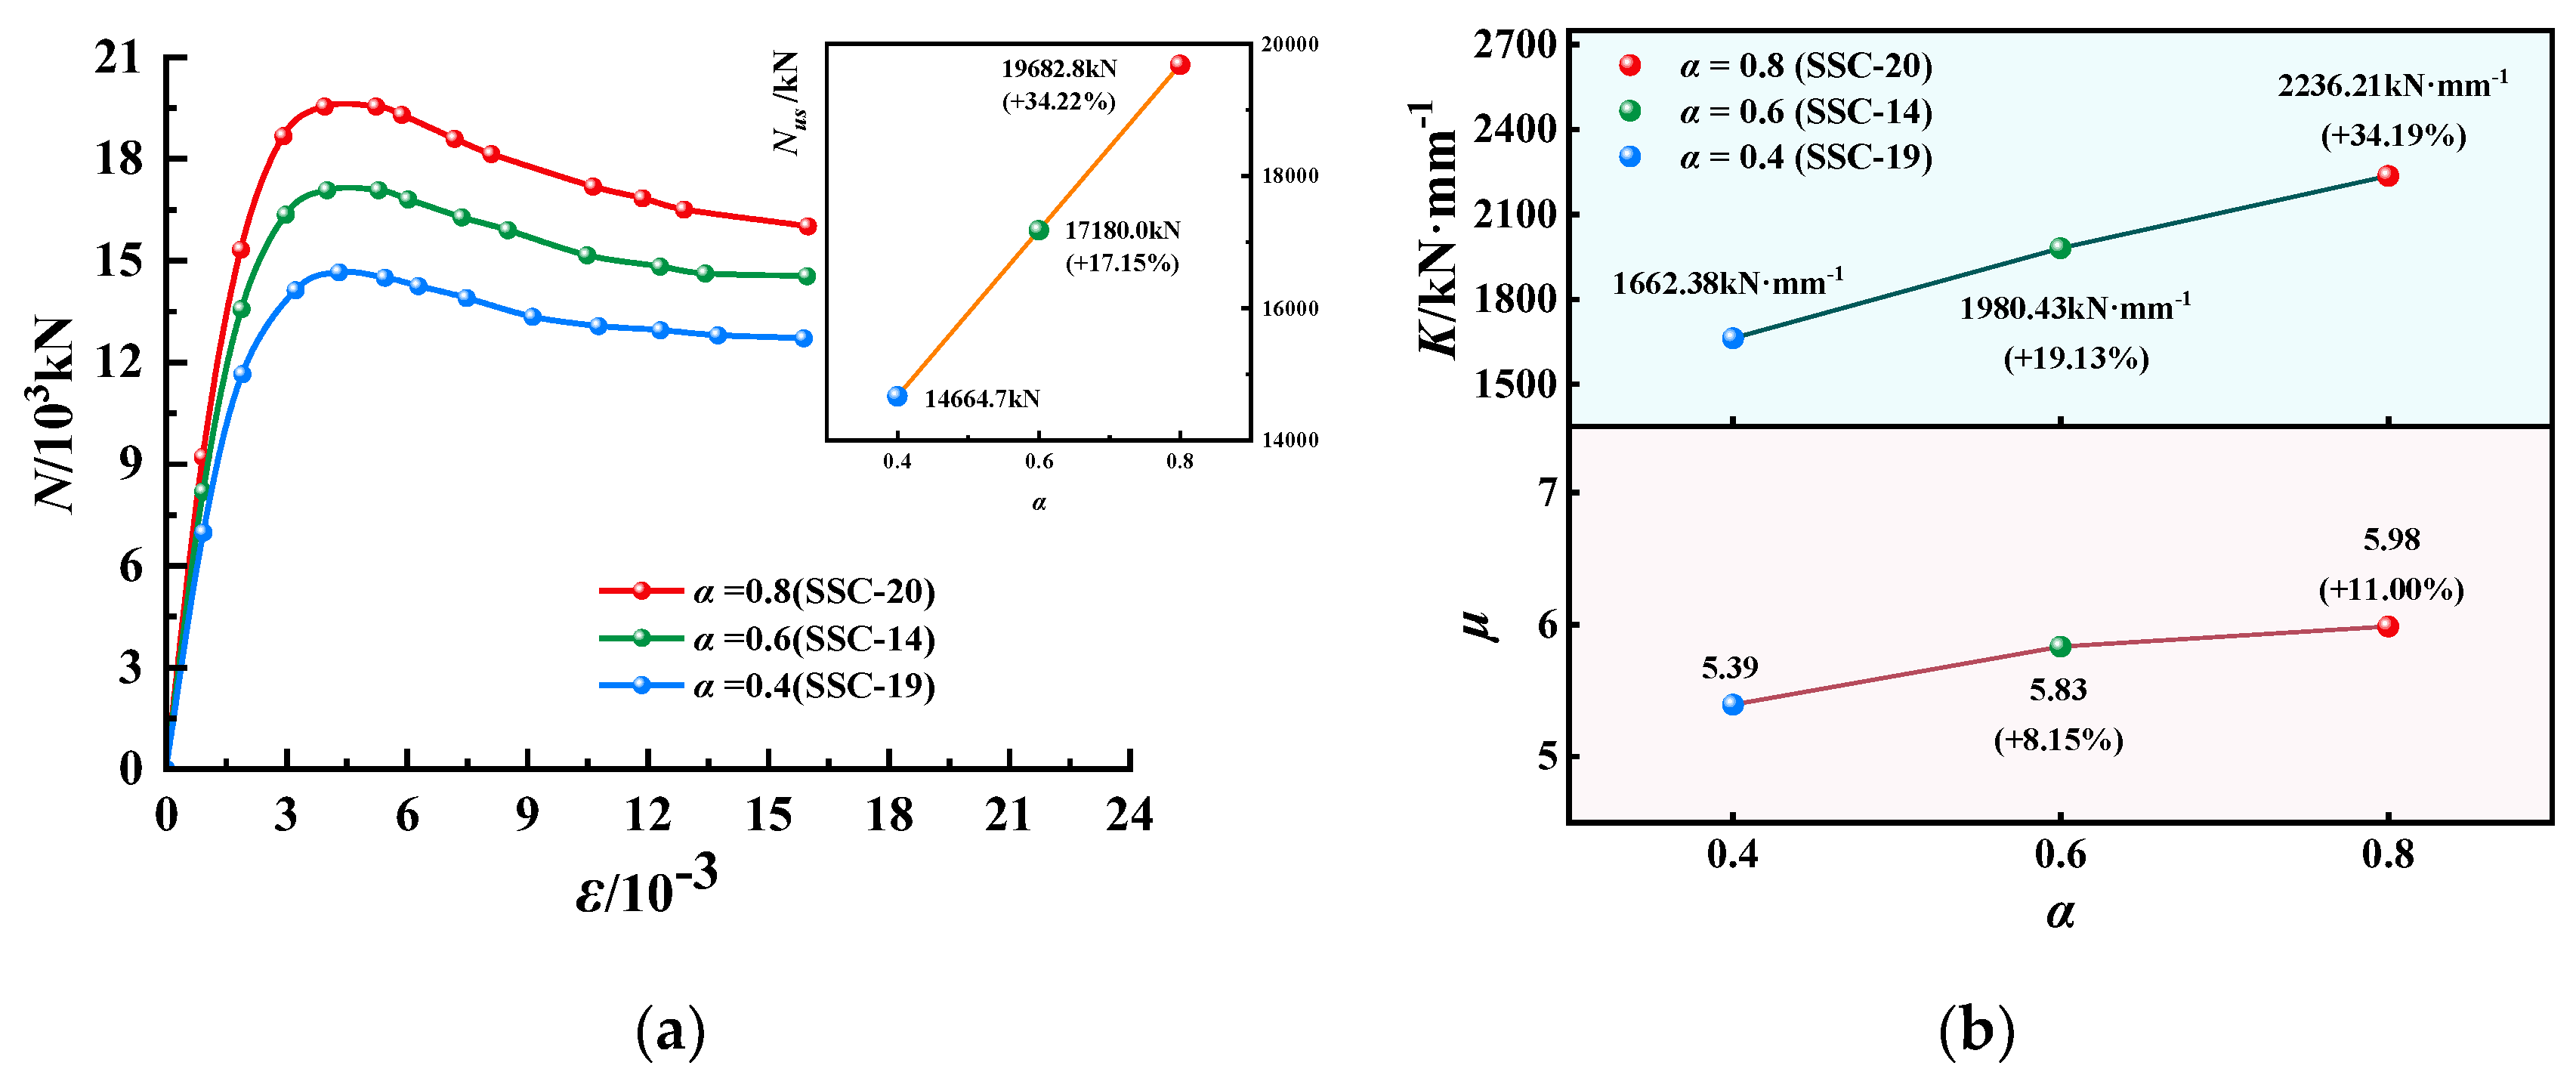
5.6. The GFRP Ratio in the Cross-Section (α)
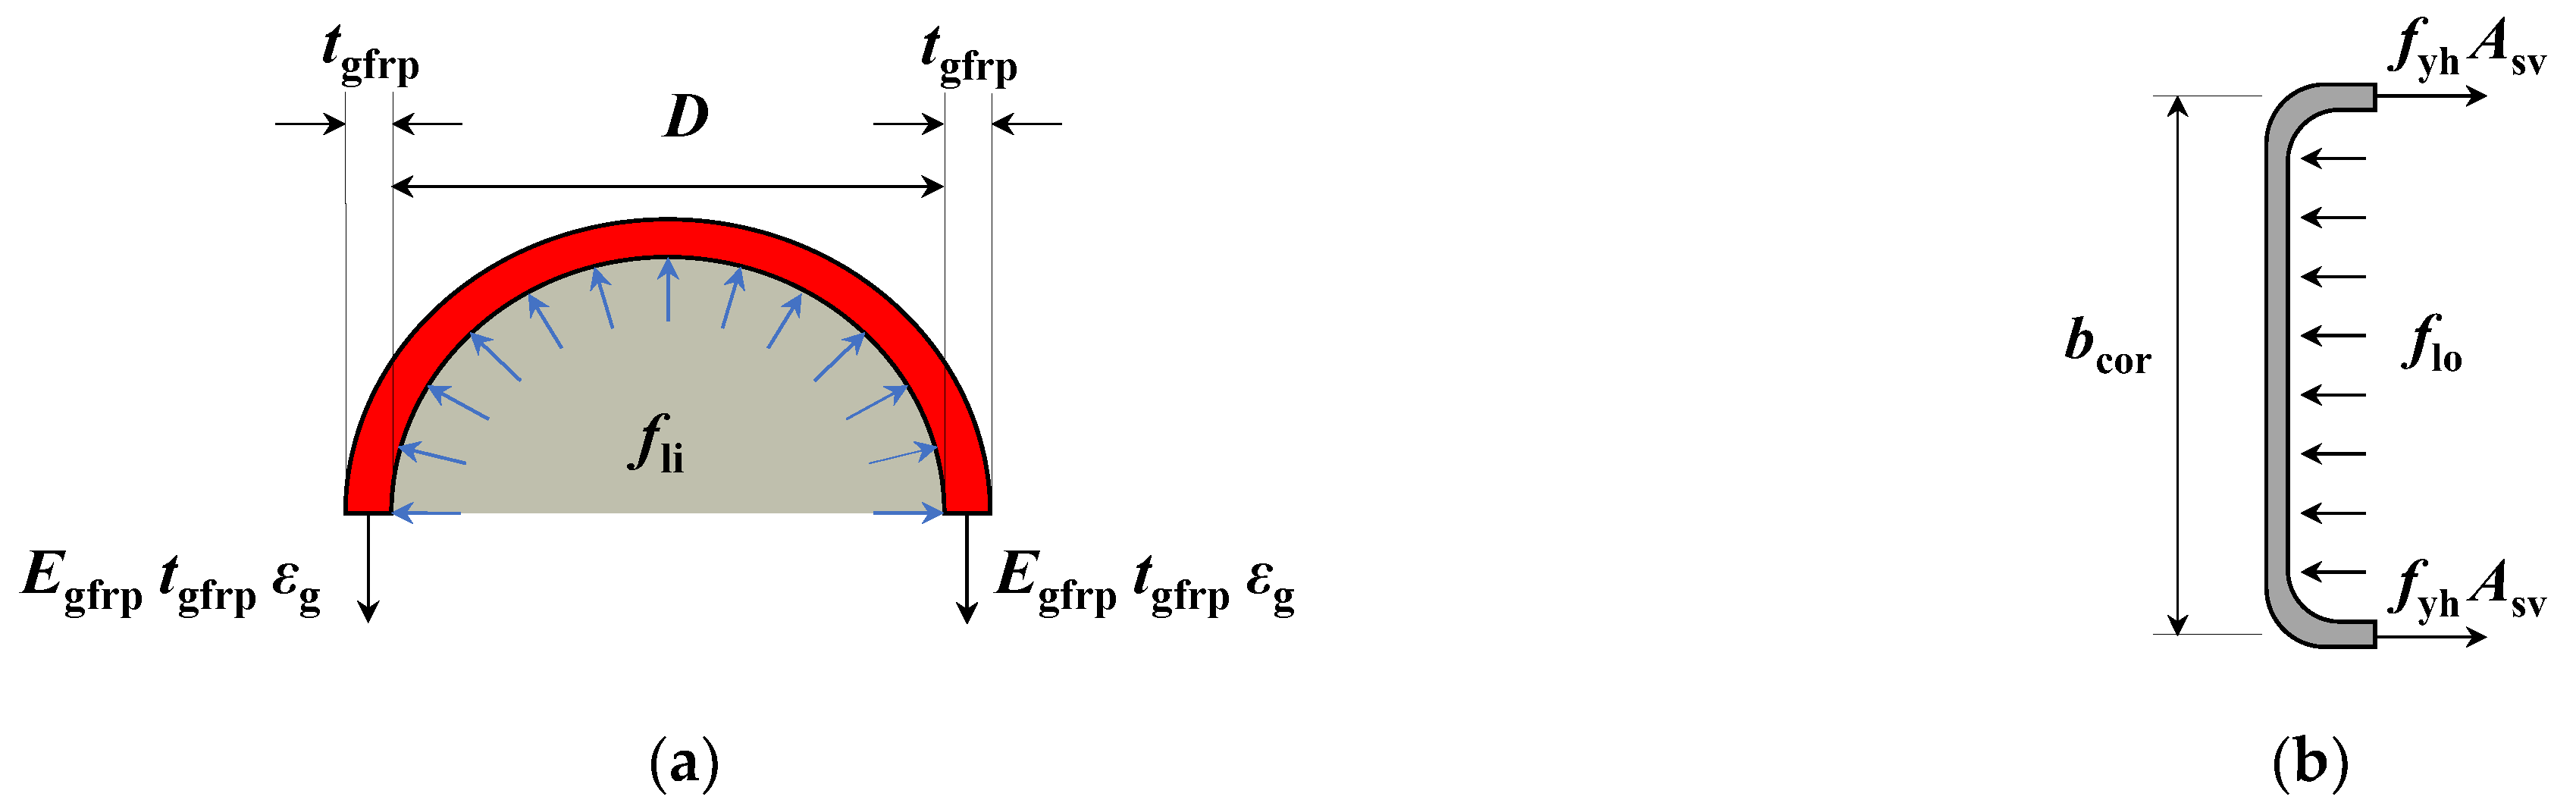
6. Force Mechanism of EGCSSCs
7. The Axial Compression-Bearing Capacity Formula of EGCSSCs
8. Conclusions
- (1)
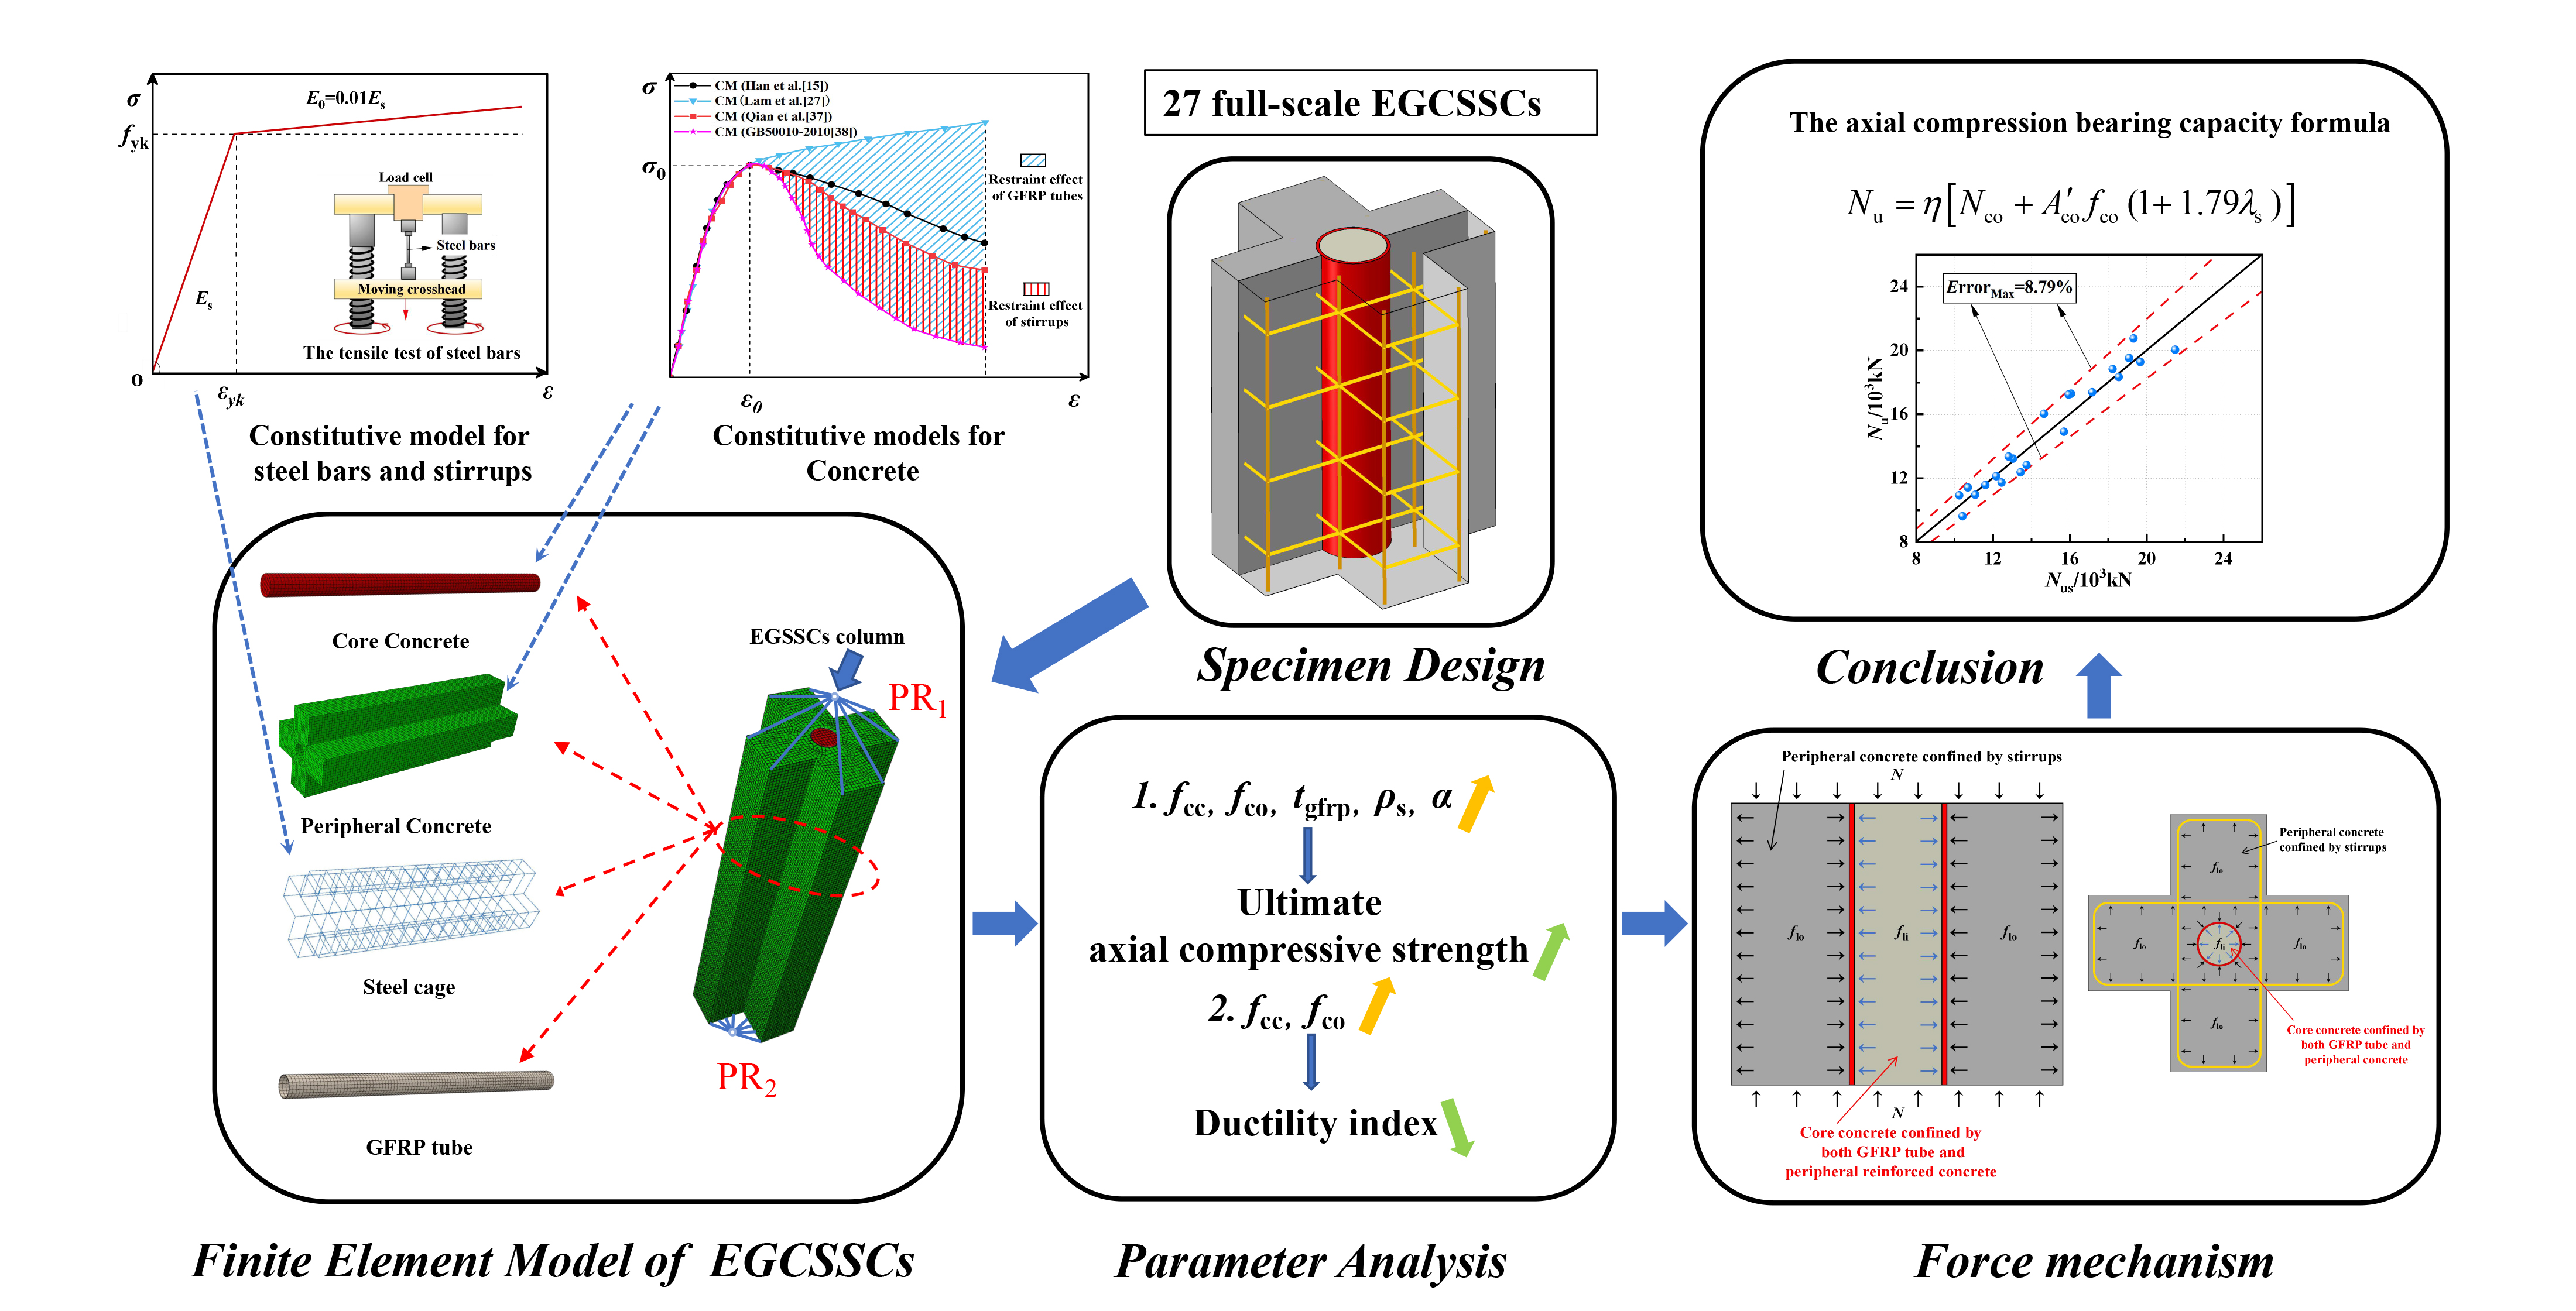
- Based on the simplified bilinear constitutive model of steel bars and stirrups, and the nonlinear constitutive models of core and peripheral concrete considering restraint, and the reasonable FEM method, 27 finite element models of composite columns were numerically simulated by ABAQUS finite element software.
- (2)
- All specimens showed excellent load-carrying capacity and good ductility. The axial compression behavior of EGCSSCs increased significantly with the increase in fcc, fco, tfrp, ρs and α. However, the change in ρv had little effect on its axial compression behavior. Moreover, with the existence of GFRP core columns, the Nus and µ of the columns were increased by 11.61% and 140.86%. In addition, K increased with the increase in fcc, fco, tfrp and α, and the largest increments were 23.99%, 50.54%, 21.77% and 34.19%, respectively. µ decreased with the increase in fcc and fco, which decreased by 14.05% and 40.82%, respectively.
- (3)
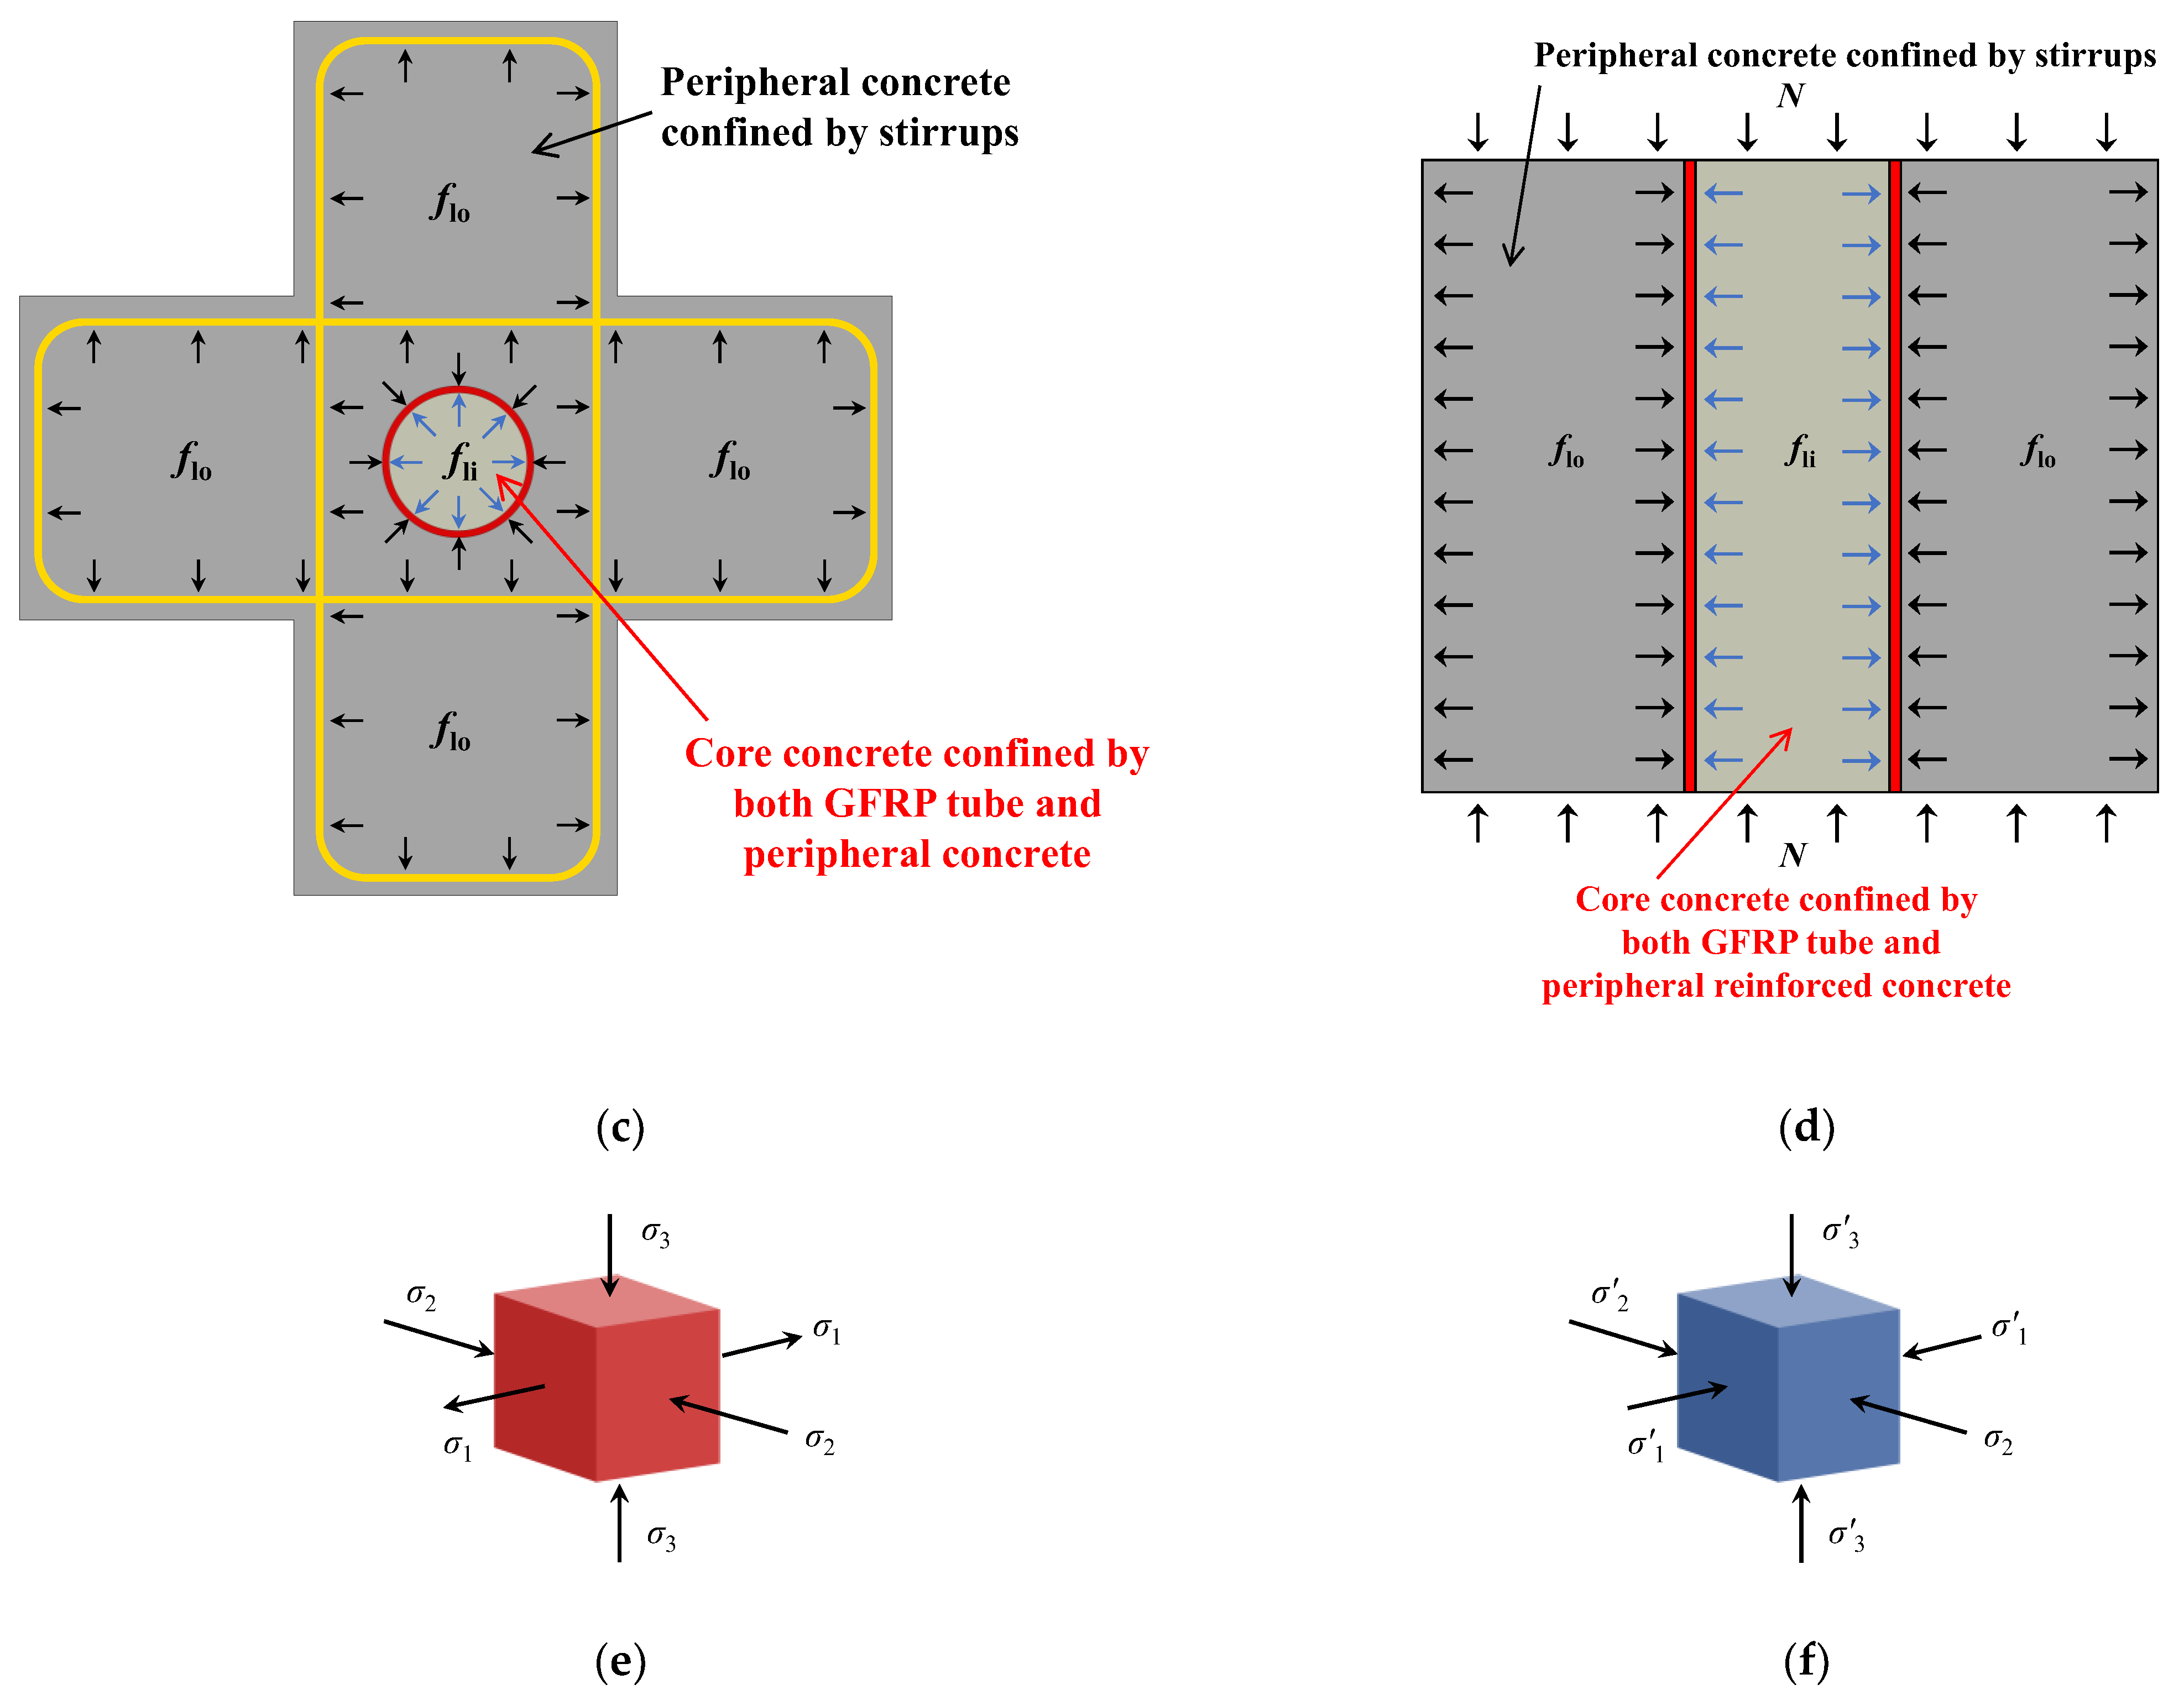
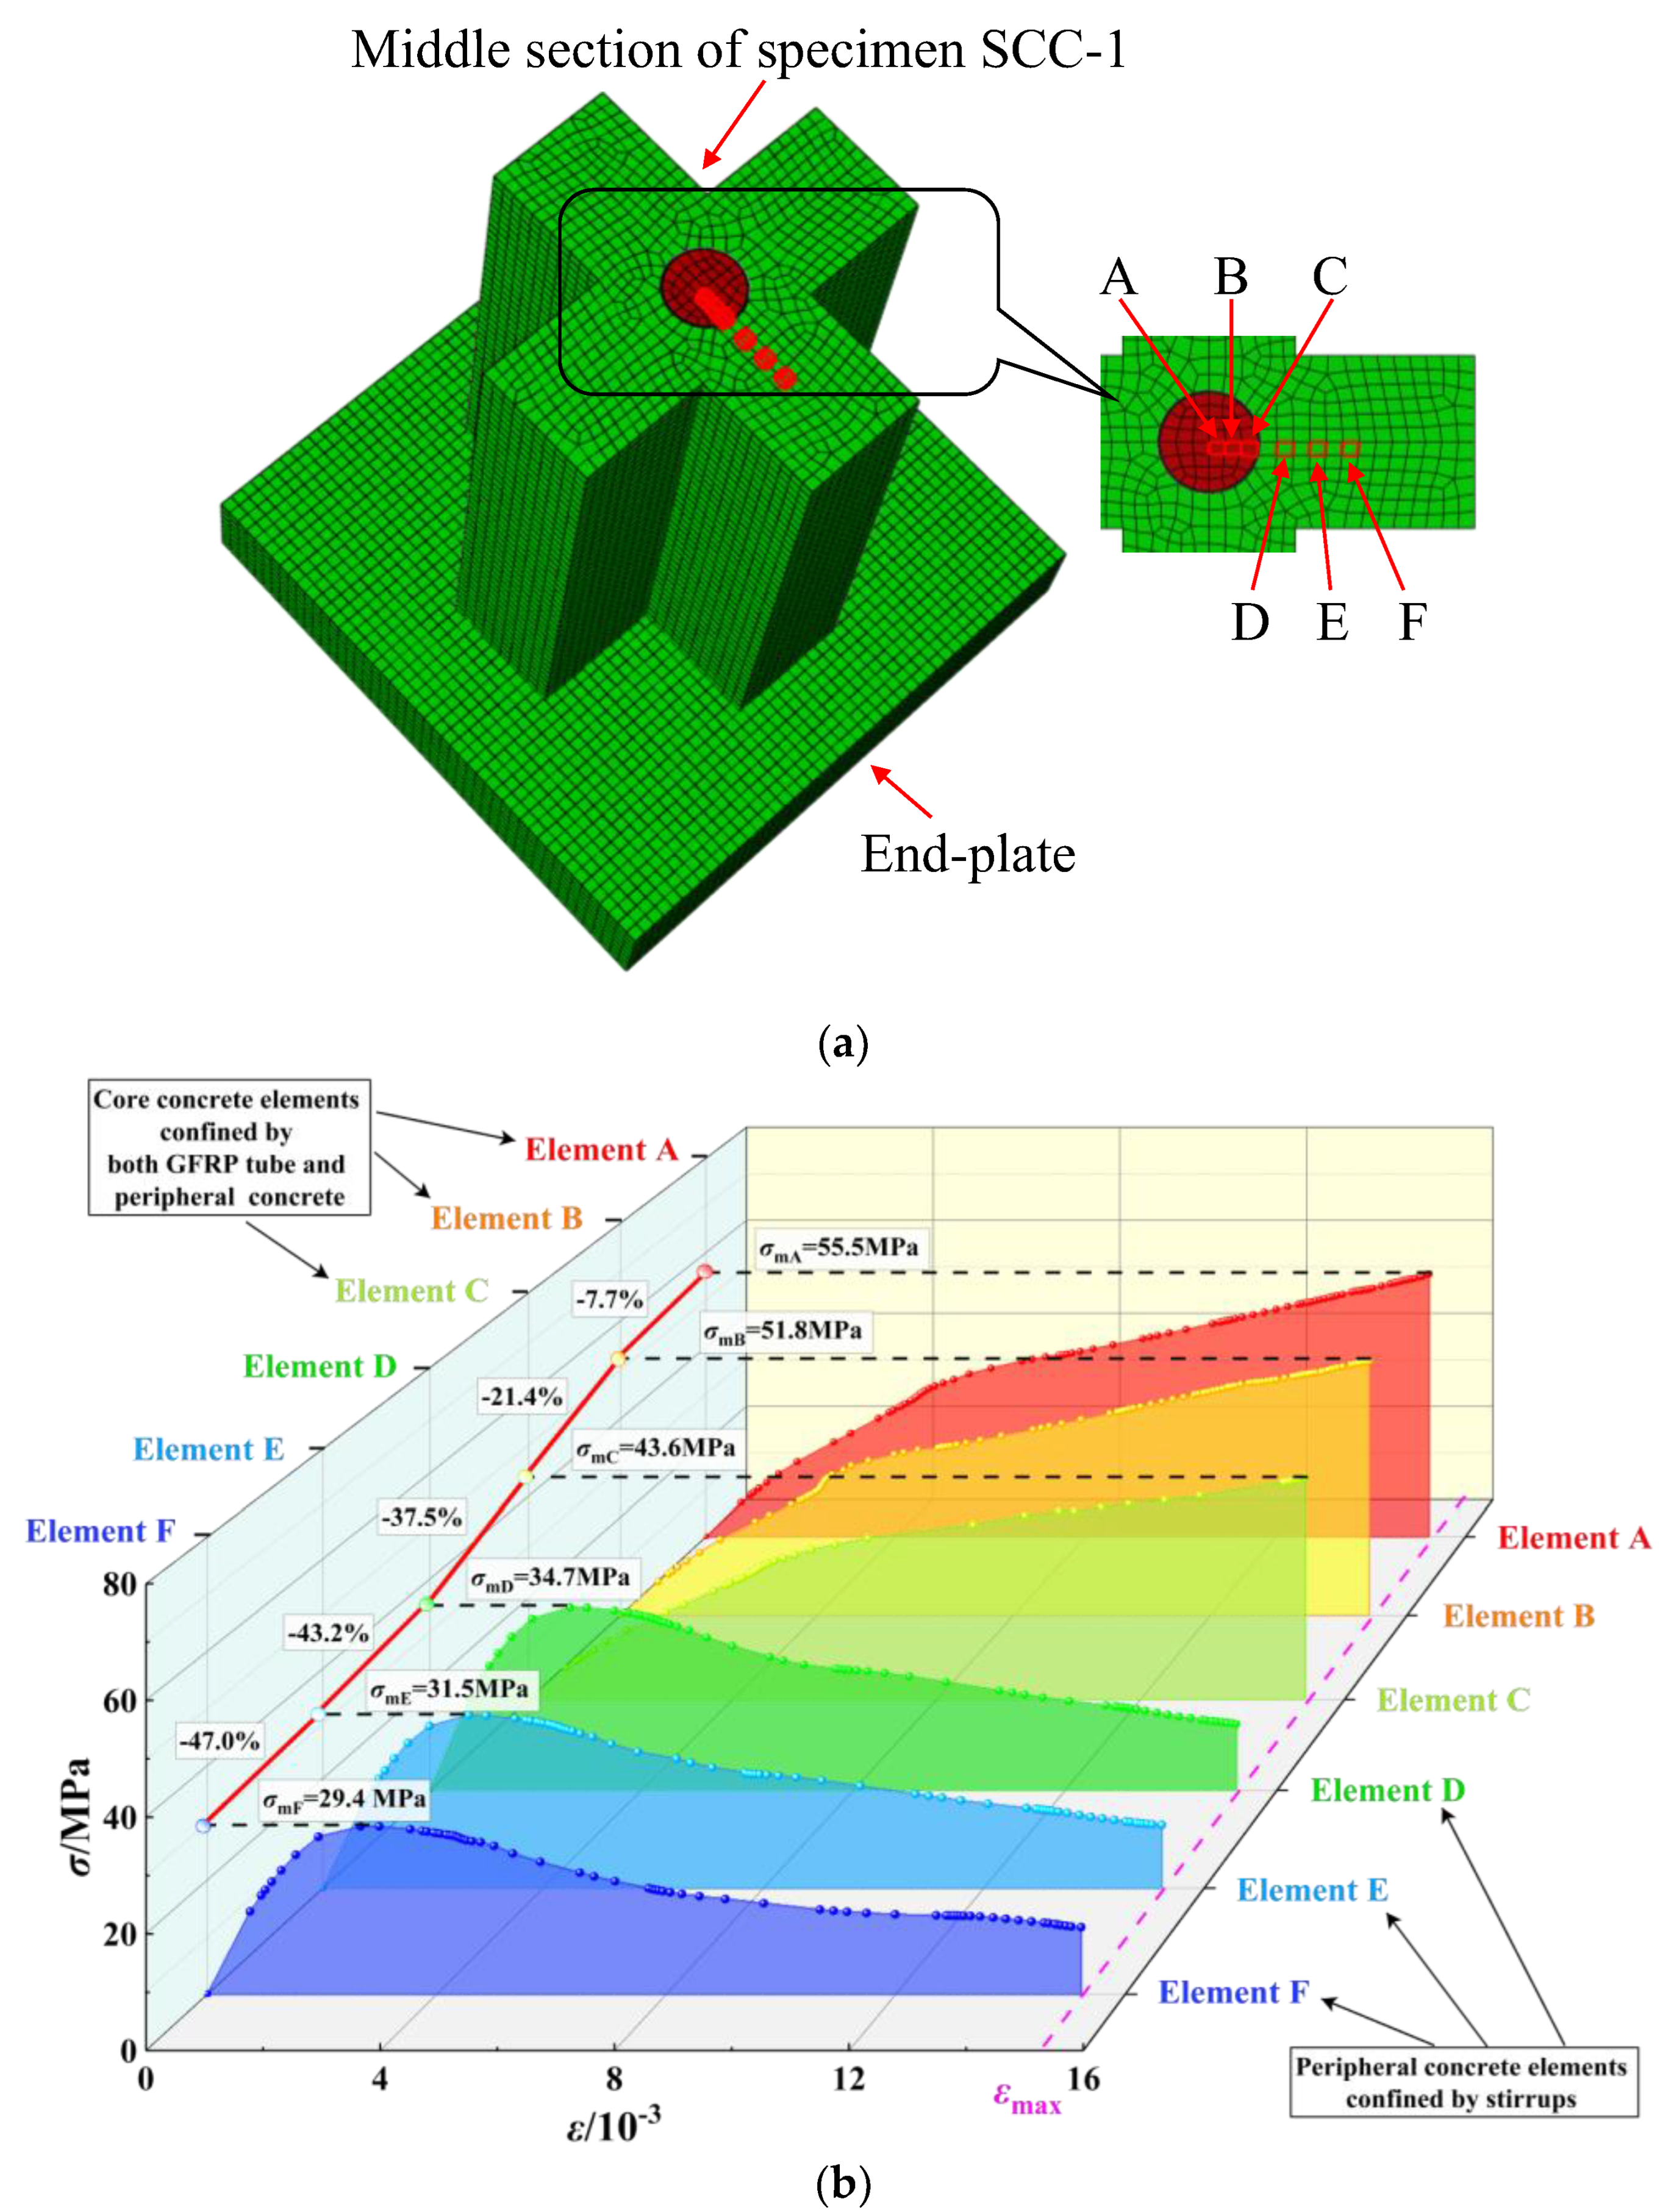
- The restraint effects on the element of EGCSSCs distributed along the circumferential direction were different, and the maximum stress of concrete elements gradually decreased from the center of EGCSSCs to the edges, indicating that the restraint effect on the core concrete was larger than that on the peripheral concrete. Moreover, the peripheral concrete reached peak stress earlier than the core concrete, and the peak stress of the peripheral concrete elements was close to that of ordinary concrete. In this paper, the confinement effects of core and peripheral concrete were simplified as the restraint effect coefficients of core concrete (λ) and peripheral concrete (λs), and λ > λs, which was consistent with the change law of the constraint effect. Because the core and peripheral concrete could not reach the peak stress at the same time, the bearing capacity of the column had a certain loss.
- (4)
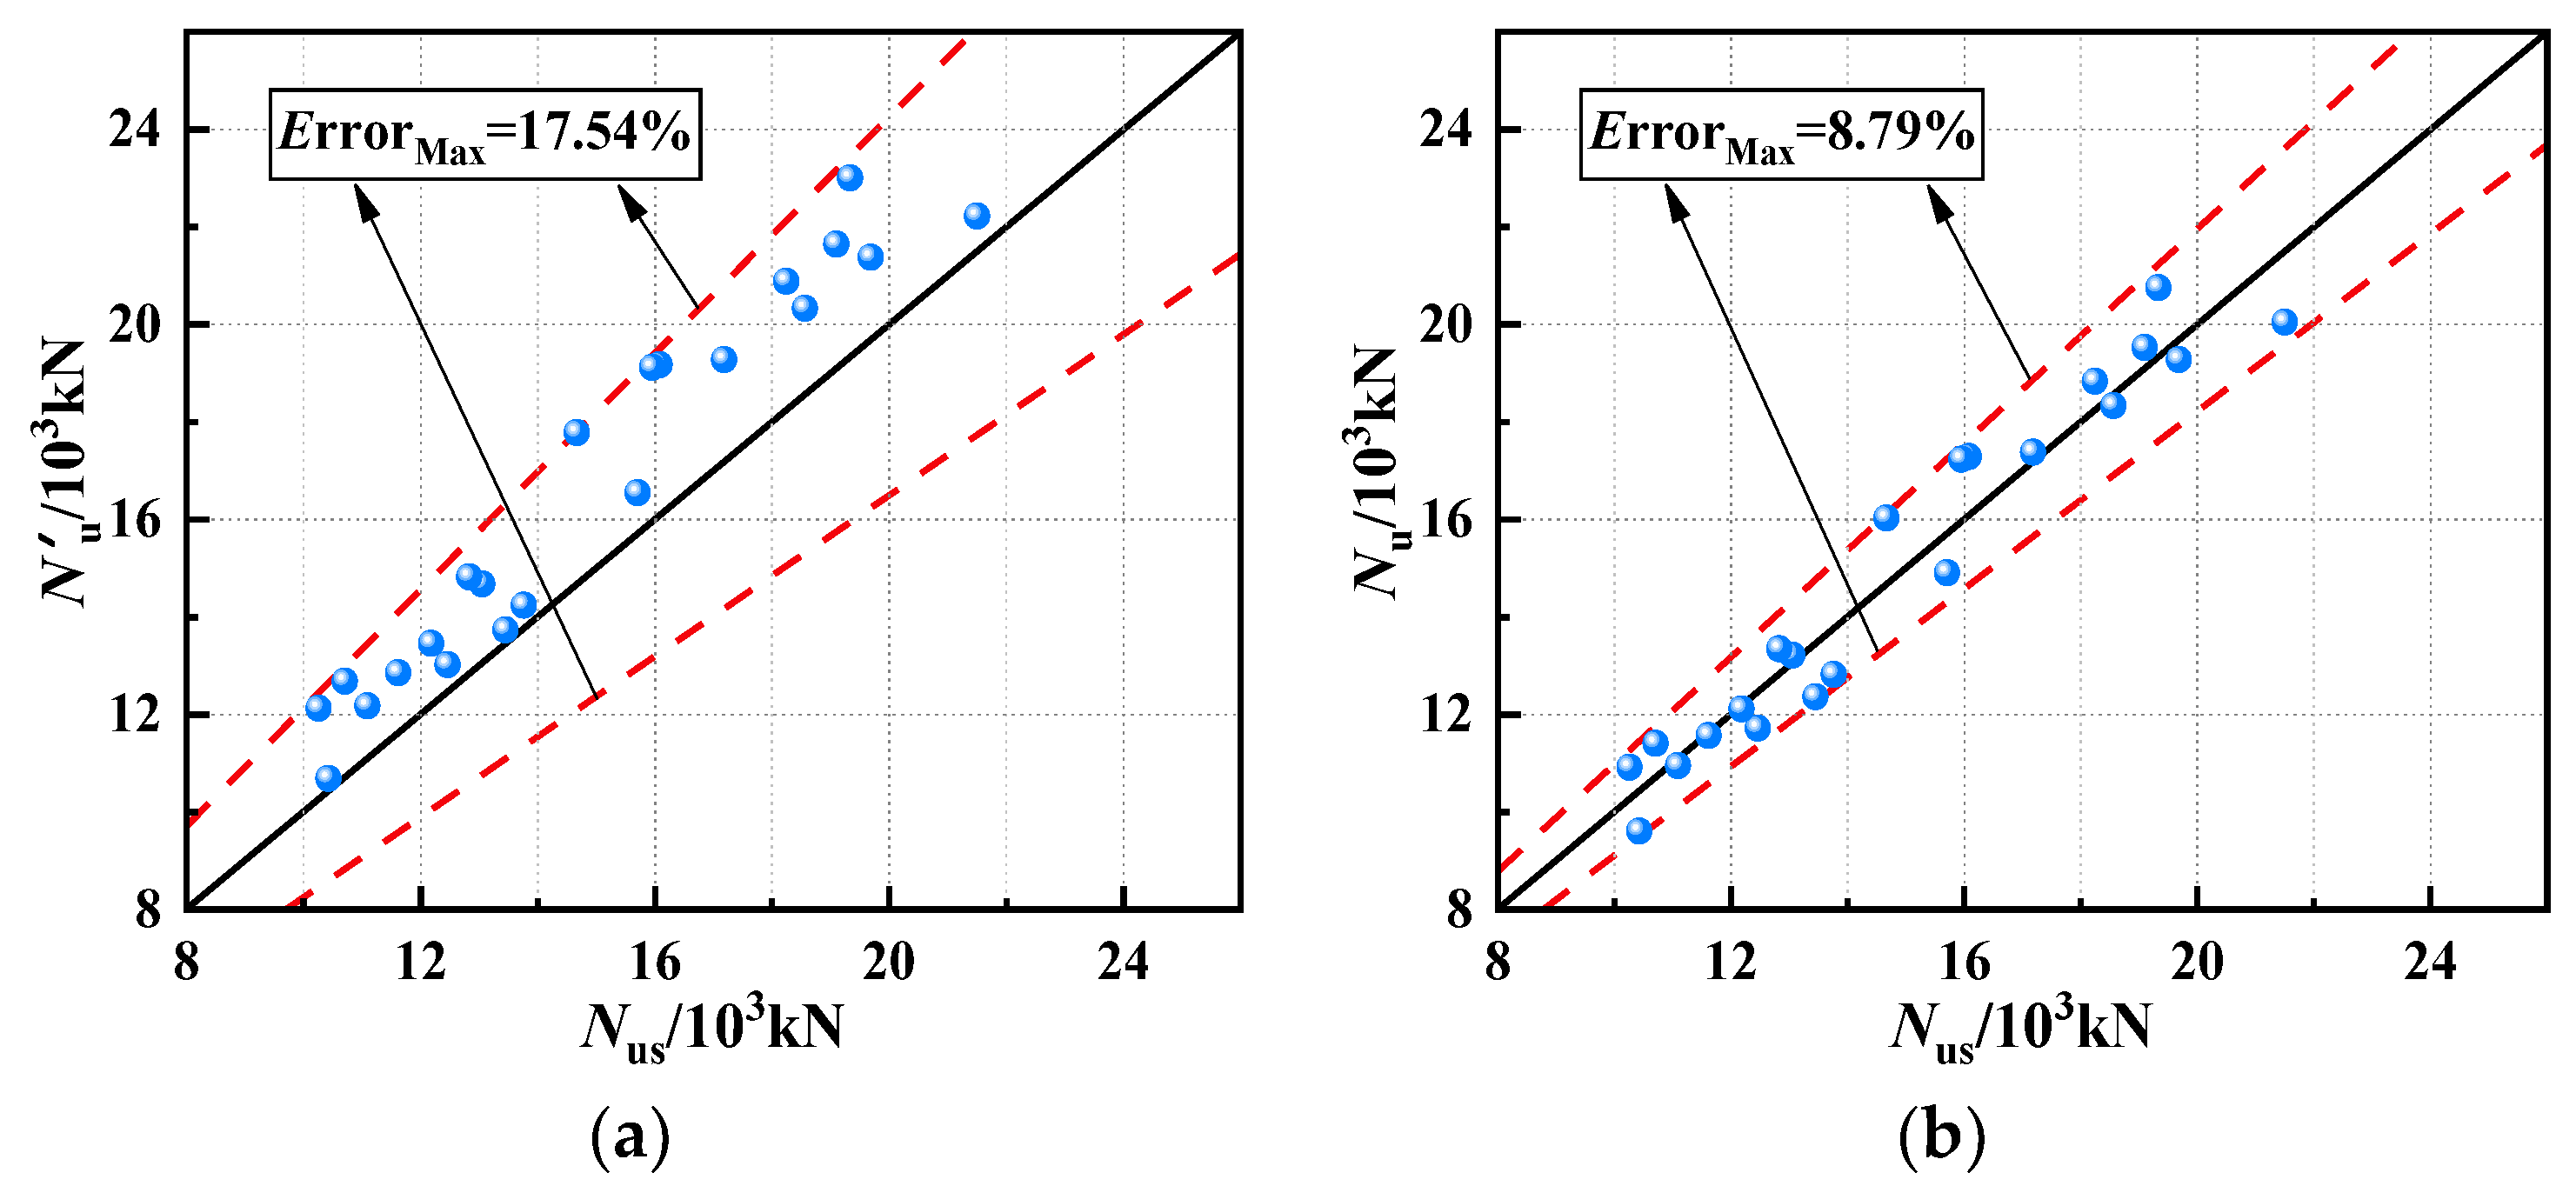
- The axial compression-bearing capacity formula of EGCSSCs was proposed by introducing the reduction coefficient (η). The global optimization algorithm (Leveberg–Marquardt) of 1st Opt software was used to determine the value of η. The ErrorMax between the calculation results and simulation results was 8.79%, which could meet the engineering accuracy requirements.
Author Contributions
Funding
Institutional Review Board Statement
Informed Consent Statement
Data Availability Statement
Conflicts of Interest
Glossary
| Aco/mm2 | section area of the EGCSSCs/ | G12/MPa | shear modulus of GFRP | ε0/- | peak strain corresponding to σ0 |
| A′co/mm2 | cross-sectional area between the stirrup and the GFRP tube | K/kN·mm−1 | initial stiffness of EGCSSCs | ε1/- | longitudinal compressive strain |
| Ass/mm2 | section area of longitudinal steel bars | L/mm | cross-section width of EGCSSCs | εc/- | strain corresponding to σc |
| Asv/mm2 | cross-sectional area of the stirrup | l/mm | length of stirrup | ε′c/- | circumferential strain of the core and peripheral concrete |
| B/mm | cross-section height of EGCSSCs | Ncc/kN | ultimate bearing capacity of EGCSSCs | ε′cc | ultimate strain of concrete |
| B1/mm | width of the specimens in Table 4 | Nco/kN | ultimate bearing capacity of EGCSSCs | εco1/- | peak strain corresponding to fco1 |
| bcor/mm | length of the core concrete in Table 4 | Ns/kN | ultimate bearing capacity obtained by simulations | εf/- | circumferential strain of GFRP |
| D/mm | diameter of the GFRP tube | Nt/kN | ultimate bearing capacity obtained by experiments | εg/- | circumferential stress of GFRP tube |
| Dc/mm | diameter of the CFRP tube | Nu/kN | ultimate bearing capacity of EGCSSCs calculated by Equation (13) | εp/- | peak tensile strain corresponding to σp |
| ds/mm | diameter of the stirrup | N′u/kN | ultimate bearing capacity of EGCSSCs calculated by Equation (11) | εrup/- | fracture strain of the GFRP tube in the circumferential direction |
| E1/MPa | elastic modulus of GFRP in the tangential direction | Nus/kN | ultimate bearing capacity of simulated EGCSSCs | εs/- | circumferential strain of the stirrups |
| E2/MPa | elastic modulus of GFRP in the normal direction | R/- | correlation coefficient | εsy/- | yield strain of steel |
| E′2/MPa | initial elastic modulus of concrete | R2/- | R-square | σ1/MPa | circumferential compressive stress of GFRP tube |
| Ec/MPa | elastic modulus of concrete | s/mm | spacing of the stirrups | σ2/MPa | circumferential tensile stress |
| Egfrp/MPa | elastic modulus of the GFRP tube | s1/mm | stirrup spacing in the densification zone | σ3/MPa | longitudinal compressive stress |
| σ0, fc | compressive strength of the concrete | S1/mm | stirrup spacing in densification zone in Table 4 | σ′1/MPa | circumferential compressive stress of the core and peripheral concrete |
| /MPa | |||||
| fcc/MPa | axial compressive strength of core concrete | Τ/- | descending parameter | σ′2/MPa | circumferential compressive stress of the core and peripheral concrete |
| f′cc/MPa | compressive strengths of the confined concrete | tc/mm | thickness of the CFRP tube | σ′3/MPa | longitudinal compressive stress of the core and peripheral concrete |
| fco/MPa | axial compressive strength of peripheral concrete | tgfrp/mm | thickness of GFRP tube | σc/MPa | tensile stress of concrete |
| f′co/MPa | compressive strengths of the unconfined concrete | ts/mm | thickness of the steel tube | σp/MPa | peak tensile stress of concrete |
| fco1/MPa | axial compressive strength of plain concrete | tr/mm | relative thickness adjacent layers of GFRP | θ/MPa | relative laying angle adjacent layers of GFRP |
| fcu/MPa | cube compressive strength of the concrete | v12/- | Poisson’s ratio of GFRP | ∆u/mm | ultimate displacement of EGCSSCs |
| fc1/MPa | characteristic value of concrete compressive strength. | Xc/MPa | longitudinal compressive strength of GFRP | ∆y/mm | yielding displacement of EGCSSCs. |
| fl/MPa | tensile strength of the GFRP tube in the circumferential direction | XT/MPa | longitudinal tensile strength of GFRP | η/- | reduction coefficient |
| fli/MPa | circumferential stress of GFRP tube | Yc/MPa | transverse compressive strength of GFRP | ρv/% | ratio of longitudinal reinforcement |
| flo/MPa | circumferential stress of the stirrup | μ/- | ductility index of EGCSSCs | ρs/% | stirrup ratio |
| fsy/MPa | yield strength of steel | YT/MPa | transverse tensile strength of GFRP | α/- | GFRP ratio in the cross-section |
| fy/MPa | yield strength of the rectangular steel tube or the steel bar | μc/- | Poisson’s ratio of the core and peripheral concrete | λf/- | restraint effect coefficients of GFRP tubes |
| fyh/MPa | yield strength of the stirrup | μs/- | Poisson’s ratio of the stirrups | λs/- | restraint effect coefficients of stirrups |
| H/mm | height of the EGCSSCs | μf/- | Poisson’s ratio of the GFRP | λv/- | stirrup characteristic value |
References
- Zhang, Z.; Shi, G.; Wang, S.; Zhou, L. Investigation on buckling behavior of T-shaped box-T section columns under axial load. Eng. Struct. 2022, 254, 113904. [Google Scholar] [CrossRef]
- Jahami, A.; Temsah, Y.; Khatib, J.; Baalbaki, O. The behavior of CFRP strengthened RC beams subjected to blast loading. Mag. Civ. Eng. 2021, 103, 10309. [Google Scholar]
- Ibrahim, M.; Wakjira, T.; Ebead, U. Shear strengthening of reinforced concrete deep beams using near-surface mounted hybrid carbon/glass fibre reinforced polymer strips. Eng. Struct. 2020, 210, 110412. [Google Scholar] [CrossRef]
- Wakjira, T.G.; Al-Hamrani, A.; Ebead, U.; Alnahhal, W. Shear capacity prediction of FRP-RC beams using single and ensenble ExPlainable Machine learning models. Compos. Struct. 2022, 287, 115381. [Google Scholar] [CrossRef]
- Wakjira, T.G.; Abushanab, A.; Ebead, U.; Alnahhal, W. FAI: Fast, accurate, and intelligent approach and prediction tool for flexural capacity of FRP-RC beams based on super-learner machine learning model. Mater. Today Commun. 2022, 33, 104461. [Google Scholar] [CrossRef]
- Vedernikov, A.; Minchenkov, K.; Gusev, S.; Sulimov, A.; Zhou, P.; Li, C.; Xian, G.; Akhatov, I.; Safonov, A. Effects of the Pre-Consolidated Materials Manufacturing Method on the Mechanical Properties of Pultruded Thermoplastic Composites. Polymers 2022, 14, 2246. [Google Scholar] [CrossRef]
- Fedulov, B.N.; Safonov, A.A.; Sergeichev, I.V.; Ushakov, A.E.; Klenin, Y.G.; Makarenko, I.V. Strength Analysis and Process Simulation of Subway Contact Rail Support Bracket of Composite Materials. Appl. Compos. Mater. 2016, 23, 999–1013. [Google Scholar] [CrossRef]
- Cakiroglu, C.; Islam, K.; Bekdaş, G.; Isikdag, U.; Mangalathu, S. Explainable machine learning models for predicting the axial compression capacity of concrete filled steel tubular columns. Constr. Build. Mater. 2022, 356, 129227. [Google Scholar] [CrossRef]
- Rodsin, K.; Hussain, Q.; Suparp, S.; Nawaz, A. Compressive behavior of extremely low strength concrete confined with low-cost glass FRP composites. Case Stud. Constr. Mater. 2020, 13, e00452. [Google Scholar] [CrossRef]
- Bedon, C.; Rajčić, V. Textiles and Fabrics for Enhanced Structural Glass Facades: Potentials and Challenges. Buildings 2019, 9, 156. [Google Scholar] [CrossRef] [Green Version]
- Moskaleva, A.; Safonov, A.; Hernández-Montes, E. Fiber-Reinforced Polymers in Freeform Structures: A Review. Buildings 2021, 11, 481. [Google Scholar] [CrossRef]
- Ji, J.; Zeng, W.; Wang, R.; Ren, H.; Zhang, L.; Liu, Y.; Jiang, L.; He, L.; Lin, Y.; Yu, C. Bearing Capacity of Hollow GFRP Pipe-Concrete-High Strength Steel Tube Composite Long Columns Under Eccentrical Compression Load. Front. Mater. 2021, 8, 768877. [Google Scholar] [CrossRef]
- Ji, J.; He, L.; Jiang, L.; Ren, H.; Ni, S.; Wang, Z.; Li, Y.; Yu, C.; Lin, Y. Seismic Behavior of GFRP Tube Reactive Powder Concrete Composite Columns With Encased Steel. Front. Mater. 2021, 8, 793392. [Google Scholar] [CrossRef]
- Li, S.; Chan, T.-M.; Young, B. Behavior of GFRP-concrete double tube composite columns. Thin-Walled Struct. 2022, 178, 10940. [Google Scholar] [CrossRef]
- Han, L.H. Concrete Filled Steel Tube Structures: Theory and Practice; Science Press: Beijing, China, 2007. [Google Scholar]
- Wang, F.-C.; Han, L.-H. Analytical behavior of special-shaped CFST stub columns under axial compression. Thin-Walled Struct. 2018, 129, 404–417. [Google Scholar] [CrossRef]
- Liu, X.; Xu, C.; Liu, J.; Yang, Y. Research on special-shaped concrete-filled steel tubular columns under axial compression. J. Constr. Steel Res. 2018, 147, 203–223. [Google Scholar] [CrossRef]
- Liu, X.; Liu, J.; Yang, Y.; Cheng, G.; Lanning, J. Resistance of special-shaped concrete-filled steel tube columns under compression and bending. J. Constr. Steel Res. 2020, 169, 106038. [Google Scholar] [CrossRef]
- Chen, Z.; Mo, L.; Li, S.; Liang, Y.; Xu, D. Seismic behavior of steel reinforced concrete L-shaped columns under compression-bending-shear-torsion combined action. J. Build. Eng. 2021, 42, 102498. [Google Scholar] [CrossRef]
- Hassam, M.; Guo, L.; Wang, Y. Experimental and numerical investigation of cross-shaped stub CFSTs under axial compression. Mag. Concr. Res. 2021, 73, 1225–1240. [Google Scholar] [CrossRef]
- Wang, Y.; Guo, L.; Li, H. L-shaped steel-concrete composite columns under axial load: Experiment, simulations and design method. J. Constr. Steel Res. 2021, 185, 106871. [Google Scholar] [CrossRef]
- Ji, J.; Xu, Z.; Jiang, L.; Yuan, C.; Zhang, Y.; Zhou, L.; Zhang, S. Nonlinear Buckling Analysis of H-Type Honeycombed Composite Column with Rectangular Concrete-Filled Steel Tube Flanges. Int. J. Steel Struct. 2018, 18, 1153–1166. [Google Scholar] [CrossRef]
- Ji, J.; Li, Y.; Jiang, L.; Ren, H.; Wang, Q.; Zhang, L.; He, L.; Zhang, Z. Flexural behavior of composite beams with concrete filled steel tube flanges and honeycombed steel webs. Front. Mater. 2022, 9, 991584. [Google Scholar] [CrossRef]
- Ji, J.; Yu, C.; Jiang, L.; Zhan, J.; Ren, H.; Hao, S.; Fan, S.; Jiang, L.; Lin, Y.; He, L. Bearing Behavior of H-Shaped Honeycombed Steel Web Composite Columns with Rectangular Concrete-Filled Steel Tube Flanges under Eccentrical Compression Load. Adv. Civ. Eng. 2022, 2022, 2965131. [Google Scholar] [CrossRef]
- Ji, J.; Lin, Y.; Jiang, L.; Li, W.; Ren, H.; Wang, R.; Wang, Z.; Yang, M.; Yu, C. Hysteretic Behavior of H-Shaped Honeycombed Steel Web Composite Columns with Rectangular Concrete-Filled Steel Tube Flanges. Adv. Civ. Eng. 2022, 2022, 1546263. [Google Scholar] [CrossRef]
- Li, H.; Tong, Y.; Yin, J.; Zhang, H.; Yan, C. Study on Axial Compression Behavior of Cross-Shaped and L-Shaped Multi-cavity Concrete-Filled Steel Tube Special Shaped Column. Int. J. Steel Struct. 2022, 22, 153–175. [Google Scholar] [CrossRef]
- Lam, L.; Teng, J. Design-oriented stress-strain model for FRP-confined concrete. Constr. Build. Mater. 2003, 17, 471–489. [Google Scholar] [CrossRef]
- Huang, L.; Sun, X.; Yan, L.; Kasal, B. Impact behavior of concrete columns confined by both GFRP tube and steel spiral reinforcement. Constr. Build. Mater. 2017, 131, 438–448. [Google Scholar] [CrossRef]
- Sun, H.; Jia, M.; Zhang, S.; Wang, Y. Study of buckling-restrained braces with concrete infilled GFRP tubes. Thin-Walled Struct. 2019, 136, 16–33. [Google Scholar] [CrossRef]
- Ren, F.; Liang, Y.; Ho, J.; Lai, M. Behaviour of FRP tube-concrete-encased steel composite columns. Compos. Struct. 2020, 241, 112139. [Google Scholar] [CrossRef]
- Hui, C.; Li, Y.; Zhou, Z.; Hai, R. Behavior of concrete-filled GFRP tube columns under cyclic axial compression. Constr. Build. Mater. 2021, 294, 123566. [Google Scholar] [CrossRef]
- Long, Y.-L.; Li, W.-T.; Dai, J.-G.; Gardner, L. Experimental study of concrete-filled CHS stub columns with inner FRP tubes. Thin-Walled Struct. 2018, 122, 606–621. [Google Scholar] [CrossRef]
- Wang, Z.; Feng, P.; Zhao, Y.; Yu, T. FRP-confined concrete core-encased rebar for RC columns: Concept and axial compressive behavior. Compos. Struct. 2019, 222, 110915. [Google Scholar] [CrossRef]
- Chen, J.; Zhu, Y.; Wang, F.; Feng, B. Experimental and analytical study of hollow section concrete-filled GFRP tubes in bending. Thin-Walled Struct. 2022, 177, 109297. [Google Scholar] [CrossRef]
- Yuan, J.-S.; Xin, Z.; Gao, D.; Zhu, H.; Chen, G.; Hadi, M.N.; Zeng, J.-J. Behavior of hollow concrete-filled rectangular GFRP tube beams under bending. Compos. Struct. 2022, 286, 115348. [Google Scholar] [CrossRef]
- Su, J.; Wang, J.; Li, Z.; Liang, X. Effect of reinforcement grade and concrete strength on seismic performance of reinforced concrete bridge piers. Eng. Struct. 2019, 198, 109512. [Google Scholar] [CrossRef]
- Qian, J.R.; Cheng, L.; Zhou, D. Behavior of axially loaded concrete columns confined with ordinary hoops. J. Tsinghua Univ. Sci. Technol. 2002, 42, 1369–1373. [Google Scholar]
- GB50010-2010. Chinese Code for Design of Concrete Structure. China Construction Industry Press: Beijing, China, 2010.
- Ji, J.; Wang, W.; Jiang, L.; Ren, H.; Wang, Q.; Xuan, W.; Liu, Y. Bearing Capacity of UHPC-Filled High-Strength Elliptical Steel Tube Composite Columns with Encased High-Strength H-Shape Steel Subjected to Eccentrical Load. Buildings 2022, 12, 1272. [Google Scholar] [CrossRef]
- Bai, W.; Li, Y.; Ji, J.; Liu, Y.; Zhang, L.; Wang, R.; Jiang, L.; He, L. Axial Compression Behavior of Symmetrical Full-Scale Concrete Filled Double Skin Steel Tube Stub Columns. Symmetry 2022, 14, 223. [Google Scholar] [CrossRef]
- Che, Y.; Wang, T.D.; Ban, S.L.; Song, Y.P. Size effect on behavior of concrete confined by stirrups under axial compression. J. Build. Struct. 2013, 34, 118–123. [Google Scholar]
- Radnic, J.; Markic, R.; Harapin, A.; Matesan, D.; Baloevic, G. Stirrup effects on compressive strength and ductility of confined concrete columns. World J. Eng. 2013, 10, 497–506. [Google Scholar] [CrossRef]
- Li, G.C.; Shi, J.J.; Yang, Z.J.; Zhao, Q.H. Experimental Study on Middle Long Columns of High Strength Concrete Filled Square Steel Tube with Inner CFRP Circular Tube under Axial Compressive Load. J. Shenyang Archit. Civ. Eng. Univ. Nat. Sci. 2010, 26, 47–51. [Google Scholar]
- Li, G.C.; Luo, J.L.; Nie, Y.; Ren, Q.S. Experiment on Performance of High-strength Concrete-filled Square Steel Tube Long Columns with Inner CFRP Circular Tube under Axial Compression. J. Archit. Civ. Eng. 2009, 26, 21–25. [Google Scholar]
- Ji, J. Research on Seismic Performance and Design Method of Jacketing Steel Reinforced Concrete Frame Prestressed with Bonded Tendons; Harbin Institute of Technology: Harbin, China, 2008. [Google Scholar]
- Ji, J.; Zeng, W.; Jiang, L.; Bai, W.; Ren, H.; Chai, Q.; Zhang, L.; Wang, H.; Li, Y.; He, L. Hysteretic Behavior on Asymmetrical Composite Joints with Concrete-Filled Steel Tube Columns and Unequal High Steel Beams. Symmetry 2021, 13, 2381. [Google Scholar] [CrossRef]
- Rong, Q.; Hou, X.; Ge, C. Quantifying curing and composition effects on compressive and tensile strength of 160–250 MPa RPC. Constr. Build. Mater. 2020, 241, 117987. [Google Scholar] [CrossRef]
- Ghanem, S.Y.; Elgazzar, H. Predicting the behavior of reinforced concrete columns confined by fiber reinforced polymers using data mining techniques. SN Appl. Sci. 2021, 3, 170. [Google Scholar] [CrossRef]
- Teng, J.G.; Yu, T.; Wong, Y.L.; Dong, S.L. Hybrid FRP-concrete-steel tubular columns: Concept and behavior. Constr. Build. Mater. 2007, 21, 846–854. [Google Scholar] [CrossRef]


| Specimen | B/mm | H/mm | L/mm | D/mm | tgfrp/mm | fcc/MPa | fco/MPa | ρv/% | ρs/% | α/- |
|---|---|---|---|---|---|---|---|---|---|---|
| SSC-1 | 800 | 2400 | 260 | 156 | 3 | 44.5 | 26.8 | 0.9 | 0.5 | 0.6 |
| SSC-2 | 800 | 2400 | 260 | 156 | 3 | 44.5 | 20.1 | 0.9 | 0.5 | 0.6 |
| SSC-3 | 800 | 2400 | 260 | 156 | 3 | 44.5 | 32.4 | 0.9 | 0.5 | 0.6 |
| SSC-4 | 800 | 2400 | 260 | 156 | 3 | 38.5 | 26.8 | 0.9 | 0.5 | 0.6 |
| SSC-5 | 800 | 2400 | 260 | 156 | 3 | 50.2 | 26.8 | 0.9 | 0.5 | 0.6 |
| SSC-6 | 800 | 2400 | 260 | 104 | 3 | 44.5 | 26.8 | 0.9 | 0.5 | 0.4 |
| SSC-7 | 800 | 2400 | 260 | 208 | 3 | 44.5 | 26.8 | 0.9 | 0.5 | 0.8 |
| SSC-8 | 800 | 2400 | 260 | 156 | 1 | 44.5 | 26.8 | 0.9 | 0.5 | 0.6 |
| SSC-9 | 800 | 2400 | 260 | 156 | 5 | 44.5 | 26.8 | 0.9 | 0.5 | 0.6 |
| SSC-10 | 800 | 2400 | 260 | 156 | 3 | 44.5 | 26.8 | 0.5 | 0.5 | 0.6 |
| SSC-11 | 800 | 2400 | 260 | 156 | 3 | 44.5 | 26.8 | 1.5 | 0.5 | 0.6 |
| SSC-12 | 800 | 2400 | 260 | 156 | 3 | 44.5 | 26.8 | 0.9 | 1 | 0.6 |
| SSC-13 | 800 | 2400 | 260 | 156 | 3 | 44.5 | 26.8 | 0.9 | 1.5 | 0.6 |
| SSC-14 | 1000 | 3000 | 340 | 204 | 3 | 44.5 | 20.1 | 0.9 | 0.5 | 0.6 |
| SSC-15 | 1000 | 3000 | 340 | 204 | 3 | 44.5 | 32.4 | 0.9 | 0.5 | 0.6 |
| SSC-16 | 1000 | 3000 | 340 | 204 | 3 | 44.5 | 26.8 | 0.9 | 0.5 | 0.6 |
| SSC-17 | 1000 | 3000 | 340 | 204 | 3 | 38.5 | 26.8 | 0.9 | 0.5 | 0.6 |
| SSC-18 | 1000 | 3000 | 340 | 204 | 3 | 50.2 | 26.8 | 0.9 | 0.5 | 0.6 |
| SSC-19 | 1000 | 3000 | 340 | 136 | 3 | 44.5 | 26.8 | 0.9 | 0.5 | 0.4 |
| SSC-20 | 1000 | 3000 | 340 | 272 | 3 | 44.5 | 26.8 | 0.9 | 0.5 | 0.8 |
| SSC-21 | 1000 | 3000 | 340 | 204 | 1 | 44.5 | 26.8 | 0.9 | 0.5 | 0.6 |
| SSC-22 | 1000 | 3000 | 340 | 204 | 5 | 44.5 | 26.8 | 0.9 | 0.5 | 0.6 |
| SSC-23 | 1000 | 3000 | 340 | 204 | 3 | 44.5 | 26.8 | 0.5 | 0.5 | 0.6 |
| SSC-24 | 1000 | 3000 | 340 | 204 | 3 | 44.5 | 26.8 | 1.5 | 0.5 | 0.6 |
| SSC-25 | 1000 | 3000 | 340 | 204 | 3 | 44.5 | 26.8 | 0.9 | 1 | 0.6 |
| SSC-26 | 1000 | 3000 | 340 | 204 | 3 | 44.5 | 26.8 | 0.9 | 1.5 | 0.6 |
| SSC-27 | 800 | 2400 | 260 | 0 | 0 | 44.5 | 26.8 | 0.9 | 0.5 | 0 |
| E1 /MPa | E2 /MPa | v12 /- | G12 /MPa | XT /MPa | Xc /MPa | YT /MPa | Yc /MPa | θ /° | tr /mm |
|---|---|---|---|---|---|---|---|---|---|
| 52,000 | 8000 | 0.32 | 3000 | 584 | 203 | 43 | 187 | ±80 | 0.5 |
| Dilation Angle/° | Eccentric Ratio/- | fbo/fco/- | K′/- | Viscosity Parameter/- |
|---|---|---|---|---|
| 30 | 0.1 | 1.16 | 0.667 | 0.0005 |
| Specimens | H × bcor× ds× s (×s2) or B1 × Dc × H × tc ×ts/(mm) | fy/MPa | fc/MPa | Ns/kN | Nt/kN | ||
|---|---|---|---|---|---|---|---|
| Che et al. [41] | A-1 | 354 × 95 × 3.5 × 27 × 13.5 | 383 | 42.31 | 387.89 | 384.90 | 0.77 |
| B-1 | 630 × 176 × 6 × 50 × 25 | 532 | 42.31 | 1030.00 | 978.20 | 5.03 | |
| C-1 | 780 × 218 × 8 × 62.5 × 31.3 | 644 | 44.43 | 1985.27 | 1997.10 | 0.60 | |
| D-1 | 1140 × 326 × 12 × 92.5 × 43.6 | 382 | 49.73 | 4408.98 | 4298.20 | 2.51 | |
| Radnic et al. [42] | RC-1 | 600 × 90 × 8 × 50 | 560 | 24.9 | 386.61 | 387.36 | 0.19 |
| RC-2 | 600 × 90 × 8 × 50 | 560 | 35.2 | 519.33 | 532.6 | 2.56 | |
| RC-3 | 600 × 90 × 8 × 50 | 560 | 45.1 | 634.89 | 657.11 | 3.50 | |
| RC-4 | 600 × 90 × 4 × 75 | 500 | 45.1 | 554.75 | 538.59 | 2.91 | |
| Li et al. [43] | CFSSC-3 | 200 × 150 × 800 × 0.334 × 5 | 320 | 90 | 4421.49 | 4560.00 | 3.13 |
| CFSSC-6 | 200 × 150 × 1200 × 0.334 × 5 | 320 | 90 | 4535.05 | 4374.00 | 3.55 | |
| CFSSC-8 | 200 × 150 × 1600 × 0.334 × 5 | 320 | 90 | 4267.99 | 4280.00 | 0.28 | |
| CFSSC-10 | 200 × 150 × 2000 × 0.334 × 5 | 320 | 90 | 4445.83 | 4209.00 | 5.33 | |
| Li et al. [44] | CFSSC-2-1 | 200 × 150 × 2600 × 0.334 × 5 | 320 | 92 | 3926.6 | 3986 | 1.51 |
| CFSSC-2-2 | 200 × 150 × 2800 × 0.334 × 5 | 320 | 92 | 4068.13 | 3910 | 3.89 | |
| CFSSC-2-3 | 200 × 150 × 3000 × 0.334 × 5 | 320 | 92 | 3879.7 | 3760 | 3.09 | |
| CFSSC-2-4 | 200 × 150 × 3200 × 0.334 × 5 | 320 | 92 | 3331.13 | 3490 | 4.77 |
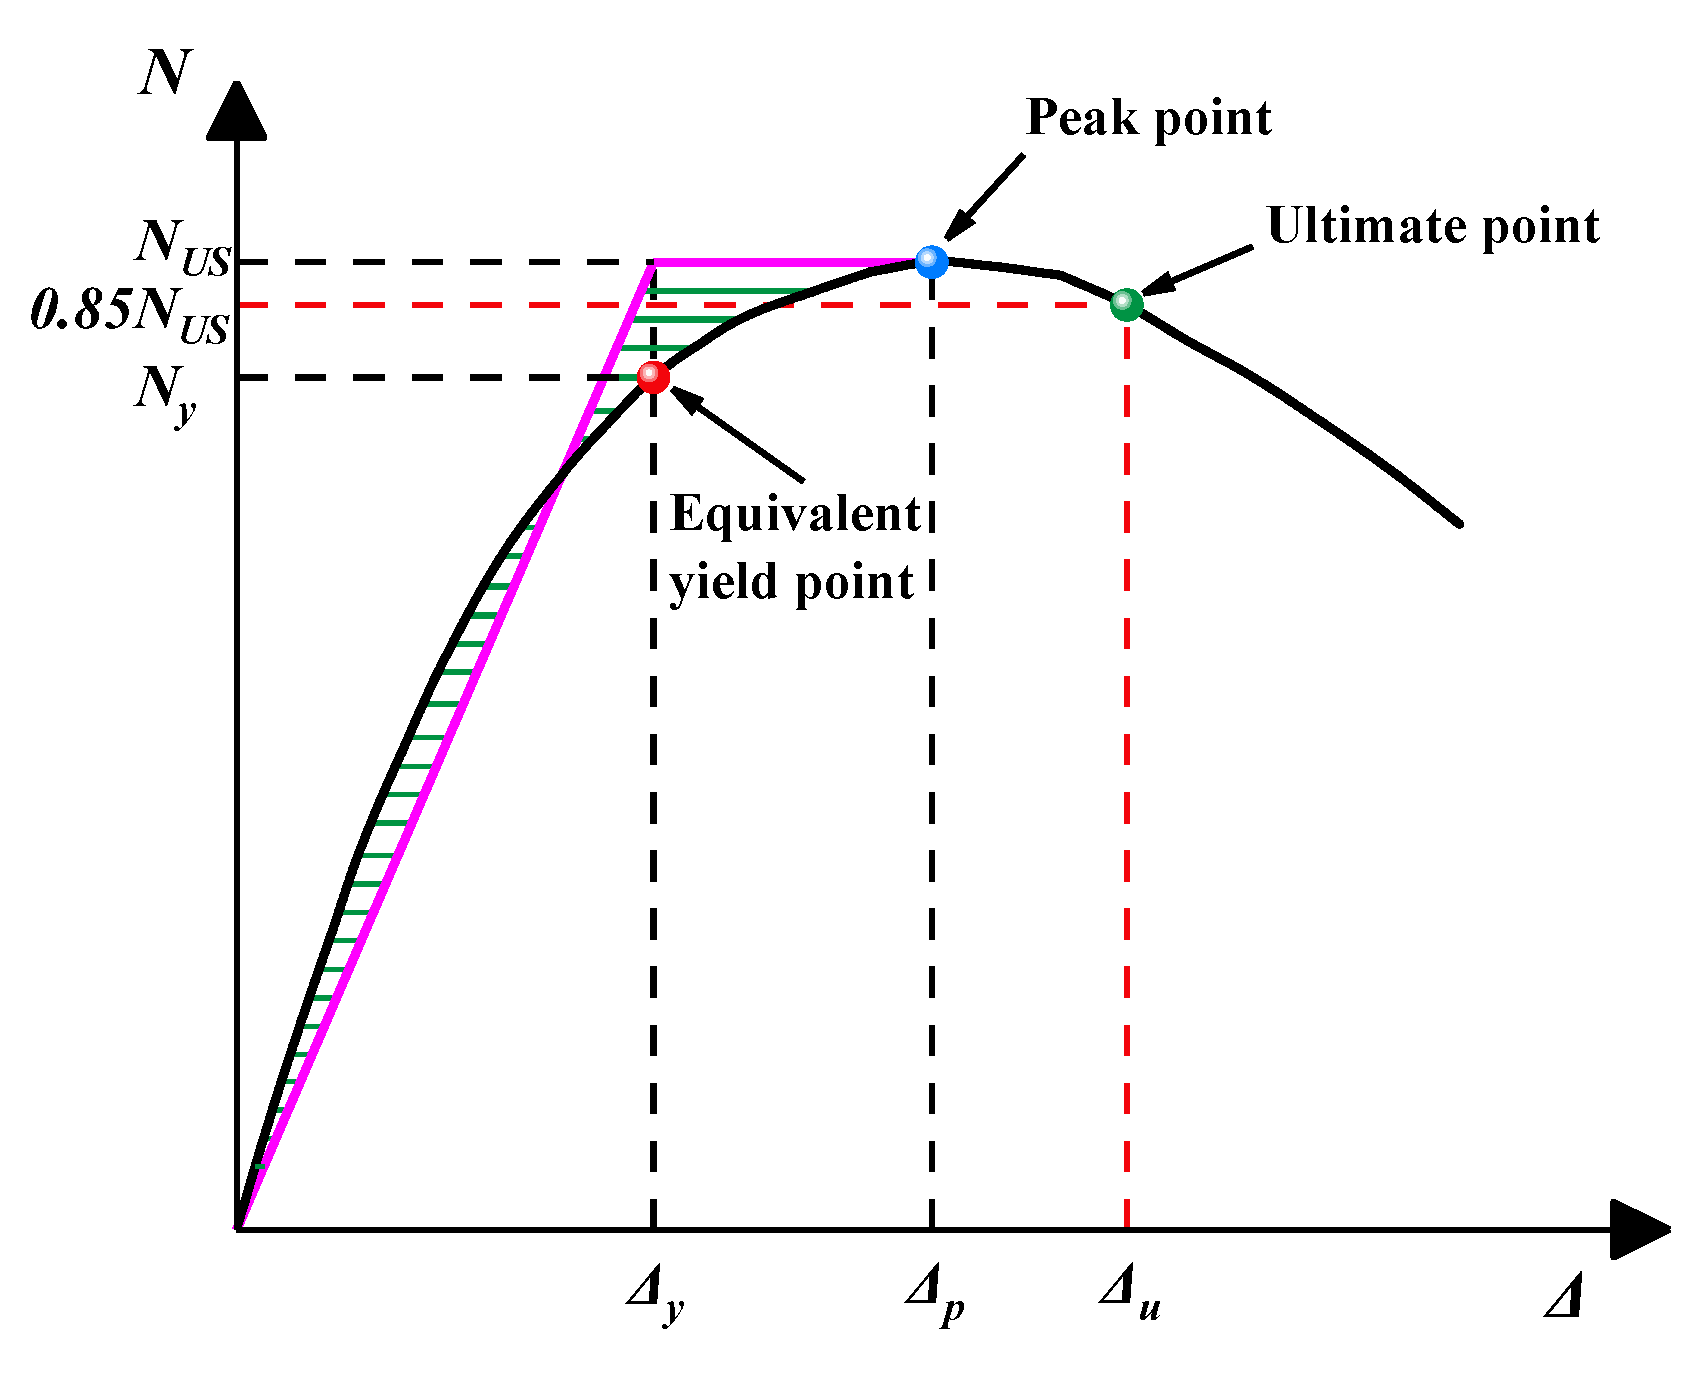
| Specimens | B/mm | K/kN·mm−1 | ∆y/mm | ∆u/mm | µ/- | ||
|---|---|---|---|---|---|---|---|
| SSC-4 | fcc/MPa | 38.5 | 800 | 1938.20 | 5.08 | 30.28 | 5.96 |
| SSC-1 | 44.5 | 800 | 2320.88 | 4.36 | 25.06 | 5.75 | |
| SSC-5 | 50.2 | 800 | 2403.21 | 4.16 | 23.44 | 5.63 | |
| SSC-17 | 38.5 | 1000 | 1884.61 | 7.96 | 45.97 | 5.78 | |
| SSC-14 | 44.5 | 1000 | 2024.05 | 7.41 | 41.47 | 5.60 | |
| SSC-18 | 50.2 | 1000 | 2160.33 | 6.89 | 34.2 | 4.96 | |
| SSC-2 | fco/MPa | 20.1 | 800 | 1799.41 | 5.11 | 36.05 | 7.05 |
| SSC-1 | 26.8 | 800 | 2280.81 | 4.54 | 24.07 | 5.30 | |
| SSC-3 | 32.4 | 800 | 2708.83 | 4.30 | 18.11 | 4.21 | |
| SSC-15 | 20.1 | 1000 | 226.30 | 6.19 | 36.53 | 5.90 | |
| SSC-14 | 26.8 | 1000 | 2046.14 | 7.33 | 41.47 | 5.66 | |
| SSC-16 | 32.4 | 1000 | 2664.54 | 6.43 | 29.20 | 4.54 | |
| SSC-8 | 1 | 800 | 1981.80 | 4.87 | 20.45 | 4.20 | |
| SSC-1 | 3 | 800 | 2280.81 | 4.54 | 24.07 | 5.30 | |
| SSC-9 | tgfrp/mm | 5 | 800 | 2413.17 | 4.41 | 26.85 | 6.09 |
| SSC-21 | 1 | 1000 | 2040.08 | 7.02 | 41.47 | 4.42 | |
| SSC-14 | 3 | 1000 | 2046.14 | 7.33 | 47.28 | 5.66 | |
| SSC-22 | 5 | 1000 | 2109.15 | 7.47 | 41.34 | 6.33 | |
| SSC-10 | ρv/% | 0.5 | 800 | 2257.97 | 4.54 | 24.07 | 5.30 |
| SSC-1 | 0.9 | 800 | 2280.81 | 4.54 | 24.07 | 5.30 | |
| SSC-11 | 1.5 | 800 | 2280.81 | 4.54 | 24.07 | 5.30 | |
| SSC-23 | 0.5 | 1000 | 2044.04 | 7.30 | 41.47 | 5.66 | |
| SSC-14 | 0.9 | 1000 | 2046.14 | 7.33 | 41.47 | 5.66 | |
| SSC-24 | 1.5 | 1000 | 2046.14 | 7.33 | 41.47 | 5.66 | |
| SSC-1 | ρs/% | 0.5 | 800 | 2277.26 | 4.68 | 24.07 | 5.14 |
| SSC-13 | 1.0 | 800 | 2268.45 | 4.87 | 25.26 | 5.18 | |
| SSC-12 | 1.5 | 800 | 2133.39 | 5.40 | 28.68 | 5.31 | |
| SSC-14 | 0.5 | 1000 | 2046.30 | 7.62 | 41.47 | 5.44 | |
| SSC-25 | 1.0 | 1000 | 2037.04 | 8.25 | 46.08 | 5.58 | |
| SSC-26 | 1.5 | 1000 | 2026.67 | 8.55 | 48.00 | 5.61 | |
| SSC-27 | α/- | 0.0 | 800 | 2219.45 | 4.22 | 9.40 | 2.23 |
| SSC-6 | 0.4 | 800 | 2230.51 | 4.65 | 22.18 | 4.77 | |
| SSC-1 | 0.6 | 800 | 2459.30 | 4.38 | 23.02 | 5.26 | |
| SSC-7 | 0.8 | 800 | 2680.55 | 4.41 | 23.66 | 5.37 | |
| SSC-19 | 0.4 | 1000 | 1662.38 | 7.86 | 42.38 | 5.39 | |
| SSC-14 | 0.6 | 1000 | 1980.43 | 7.35 | 42.86 | 5.83 | |
| SSC-20 | 0.8 | 1000 | 2236.21 | 7.23 | 43.27 | 5.98 | |
| Specimen | μ | λf | λs | N′u/kN | Nu/kN | Nus/kN | |N′u − Nus|/N′u/% | |Nu – Nus|/Nu/% |
|---|---|---|---|---|---|---|---|---|
| SSC-1 | 0.905 | 0.69 | 0.05 | 12,858.5 | 11,571.4 | 11,614.1 | 9.68 | 0.37 |
| SSC-2 | 0.905 | 0.69 | 0.07 | 10,688.1 | 9607.2 | 10,425.5 | 2.46 | 8.52 |
| SSC-3 | 0.905 | 0.69 | 0.05 | 14,680.7 | 13,220.5 | 13,054.1 | 11.08 | 1.26 |
| SSC-4 | 0.905 | 0.8 | 0.05 | 12,682.2 | 11,411.9 | 10,702.2 | 15.61 | 6.22 |
| SSC-5 | 0.905 | 0.61 | 0.05 | 13,023.1 | 11,720.4 | 12,461.8 | 4.31 | 6.33 |
| SSC-6 | 0.905 | 1.04 | 0.05 | 12,132.5 | 10,914.4 | 10,257.2 | 15.46 | 6.02 |
| SSC-7 | 0.905 | 0.52 | 0.06 | 13,734.5 | 12,364.2 | 13,451.2 | 2.06 | 8.79 |
| SSC-8 | 0.905 | 0.09 | 0.05 | 12,176.2 | 10,954 | 11,092.7 | 8.90 | 1.27 |
| SSC-9 | 0.905 | 1.73 | 0.05 | 13,459.1 | 12,115 | 12,178.3 | 9.52 | 0.52 |
| SSC-12 | 0.905 | 0.69 | 0.05 | 14,241.2 | 12,822.8 | 13,761.7 | 3.37 | 7.32 |
| SSC-13 | 0.905 | 0.69 | 0.05 | 14,824.0 | 13,350.2 | 12,827.5 | 13.47 | 3.92 |
| SSC-14 | 0.905 | 0.69 | 0.04 | 19,276.4 | 17,379.6 | 17,180 | 10.88 | 1.15 |
| SSC-15 | 0.905 | 0.53 | 0.06 | 16,548.6 | 14,911 | 15,706.7 | 5.09 | 5.34 |
| SSC-16 | 0.905 | 0.53 | 0.04 | 23,009.7 | 20,758.3 | 19,331.5 | 15.99 | 6.87 |
| SSC-17 | 0.905 | 0.61 | 0.04 | 19,174.7 | 17,287.6 | 16,082.3 | 16.13 | 6.97 |
| SSC-18 | 0.905 | 0.47 | 0.04 | 20,330.7 | 18,333.8 | 18,559.5 | 8.71 | 1.23 |
| SSC-19 | 0.905 | 0.79 | 0.04 | 17,784.4 | 16,029.4 | 14,664.7 | 17.54 | 8.51 |
| SSC-20 | 0.905 | 0.4 | 0.05 | 21,375.8 | 19,279.6 | 19,682.8 | 7.92 | 2.09 |
| SSC-21 | 0.905 | 0.07 | 0.04 | 19,117.3 | 17,235.7 | 15,950.4 | 16.57 | 7.46 |
| SSC-22 | 0.905 | 1.1 | 0.04 | 20,885.1 | 18,835.5 | 18,243.5 | 12.65 | 3.14 |
| SSC-25 | 0.905 | 0.53 | 0.04 | 21,650.2 | 19,527.9 | 19,096.7 | 11.79 | 2.21 |
| SSC-26 | 0.905 | 0.53 | 0.04 | 22,225.5 | 20,048.6 | 21,500 | 3.26 | 7.24 |
Publisher’s Note: MDPI stays neutral with regard to jurisdictional claims in published maps and institutional affiliations. |
© 2022 by the authors. Licensee MDPI, Basel, Switzerland. This article is an open access article distributed under the terms and conditions of the Creative Commons Attribution (CC BY) license (https://creativecommons.org/licenses/by/4.0/).
Share and Cite
Ji, J.; Li, J.; Jiang, L.; Ren, H.; Wang, Q.; Wang, X.; He, L.; Zhang, Z. Mechanical Behavior of Special-Shaped Reinforced Concrete Composite Columns Encased with GFRP Core Columns. Buildings 2022, 12, 1895. https://doi.org/10.3390/buildings12111895
Ji J, Li J, Jiang L, Ren H, Wang Q, Wang X, He L, Zhang Z. Mechanical Behavior of Special-Shaped Reinforced Concrete Composite Columns Encased with GFRP Core Columns. Buildings. 2022; 12(11):1895. https://doi.org/10.3390/buildings12111895
Chicago/Turabian StyleJi, Jing, Jiaqi Li, Liangqin Jiang, Hongguo Ren, Qingqin Wang, Xue Wang, Lingjie He, and Zhanbin Zhang. 2022. "Mechanical Behavior of Special-Shaped Reinforced Concrete Composite Columns Encased with GFRP Core Columns" Buildings 12, no. 11: 1895. https://doi.org/10.3390/buildings12111895