Article

Seismic Performance Analysis of RC Frames with ECC Short Columns Based on the IDA Method

1
School of Civil Engineering, Southeast University, Nanjing 211189, China
2
School of Architectural Engineering, Jinling Institute of Technology, Nanjing 211169, China
3
College of Civil Engineering, Tongji University, Shanghai 200092, China
*
Author to whom correspondence should be addressed.
Buildings 2022, 12(11), 1834; https://doi.org/10.3390/buildings12111834
Submission received: 27 September 2022 / Revised: 15 October 2022 / Accepted: 24 October 2022 / Published: 1 November 2022

Abstract

:
Engineered cementitious composite (ECC) is a high-performance composite material with greater shear deformation and shear strength than normal concrete, which has been proposed for use as a shear component in structures. This study modeled three frames, a pure reinforced concrete (RC) frame, an RC frame with concrete short columns and an RC frame with ECC short columns, using the incremental dynamic analysis (IDA) method to evaluate the contribution of ECC to the structural performance. A modified IMK model was applied to model the entire history of the mechanical behaviors of the short columns. The IDA curves, interfloor displacement angle distribution and limit state of the vertex displacement of the frames were analyzed to investigate the seismic responses of the frames. The model analysis results showed that an RC frame with short columns would form a weak layer on the floor where the short columns were located, which greatly weakened the seismic performance of the structure. ECC was certified to be effective in improving the shear formation of the short columns in the frames. The frame with ECC short columns improved the seismic performance of the structure to a certain extent relative to the frame with RC short columns. The deformation capacity of the frame with ECC short columns was close to that of the pure RC frame at the collapse level.

1. Introduction

In practical engineering, short columns are often incorporated into structures as important components for resisting lateral forces. For example, short columns are positioned in the windows of half-high filled walls, produced by a staggered floor and necessitated by architectural modeling requirements. However, short columns are prone to brittle shear failure due to insufficient shear capacity, poor plastic deformation and energy dissipation [1,2,3]. Short columns in the frame always suffer catastrophic damage during earthquakes as they fail by crushing related to the high stiffness and large shear effect [4,5]. Moreover, post-earthquake inspection has confirmed that severe damage to short columns is one of the significant causes associated with structural damage and even collapse [6].
To overcome the limitations of RC short columns, a new type of material, engineered cementitious composite (ECC), was proposed as an alternative method to enhance shear resistance and deformation capacity. ECC was first proposed by Li et al. in the early 1990s [7], and consists of randomly distributed fibers to improve ductility behavior. The ultimate tensile strain of ECC can reach more than 3%, which is several hundred times that of normal concrete [8,9,10]. ECC exhibits pseudo-strain-hardening behavior and multiple fine cracks under tension, which could still bear the force after the propagation of the first crack relative to normal concrete [11,12,13,14]. Currently, some researchers have developed ultra-high-strength ECCs with compressive strengths over 210 MPa and excellent ultimate strains reaching 2–11% [15,16,17]. Experimental studies have been employed to investigate the shear performance of ECCs [18,19,20]. The results show that ECCs had a greater shear deformation capacity and higher shear bearing capacity than ordinary concrete, and the shear failure of ECCs showed ductility under pure shear loading. Thus, replacing normal concrete with ECC has become a trend, to resolve the limitations of concrete in terms of low tensile strength and brittle failure.
Some research on ECC short columns has been conducted through experimental studies. In previous studies [21,22], we reported that ECC was an ideal material for enhancing the shear strength and energy dissipation of columns. Moreover, we proposed a sectional analysis of a RECC column governed by flexure, the results of which were in good agreement with test values [5]. Mashshay and Al-Sibanhya [23] investigated the structural performance of ECC columns with hybrid steel/polypropylene fibers under eccentric loading. The results showed that the ECC columns exhibited a higher loading capacity than normal concrete columns. Deng et al. [24,25,26,27] conducted a series of studies with respect to ECC columns, including pure ECC short columns and RC columns with ECC jackets, to investigate seismic performance under cyclic loading tests. The results showed that columns with ECC jackets exhibited significant improvements in plastic deformation ability, shear strength and energy dissipation capacity relative to the RC columns.
Numerous experimental studies conducted on the component level have verified that ECC short columns significantly improve performance relative to RC columns, However, there are few reports about ECC focusing on the structural level. In a companion to the present study [28], we modeled three frames, including an RC frame, a RECC frame and a hybrid RECC/RC frame, by the IDA method, to investigate the dynamic behaviors of the frames. The results indicated that the RECC frame had a higher deformation capacity than the RC frame, and ECC employed in key regions could improve the seismic response of the structures and control the construction cost. Yuan et al. [29] proposed a constitutive model of ECC under cyclic loading and revealed the contribution of ECC to seismic resistance by modeling three frames, demonstrating that the employment of ECC in the ground columns and beam-column joints of the frame structure could reduce the maximum drift ratio and make dissipation energy more uniform. Moreover, experimental studies were conducted to employ ECC materials in the vulnerable parts of the frame, such as the beam-column joint and plastic hinge regions of the frames [30,31,32,33]. Such studies all indicated that RECC frames had better seismic resistance associated with the deformation capacity, energy dissipation and ductility relative to the RC frame. Research on ECC at the structural level is limited, and reports with respect to the ECC column of the frame are scarce. Thus, further research is needed.
In this paper, we partially replaced normal concrete with ECC to analyze the seismic performance of a frame with short columns. Three frames, a pure RC frame, an RC frame with concrete short columns and an RC frame with ECC short columns, were analyzed based on the incremental dynamic analysis (IDA) method, which avoided the problems of the high cost, long timeframe and large effort involved in experimental studies. The IDA method is widely used to analyze the seismic response of structures and has been proven to be effective by many researchers [34,35,36]. To identify the numerical model of the short columns, the modified IMK model was applied to model the entire history of mechanical behavior associated with the short columns. The IDA curves, interfloor displacement angle distribution and limit state of the vertex displacement of the frames were analyzed to evaluate the contribution of ECC to the seismic performance of the frame structures.

2. Computational Modeling

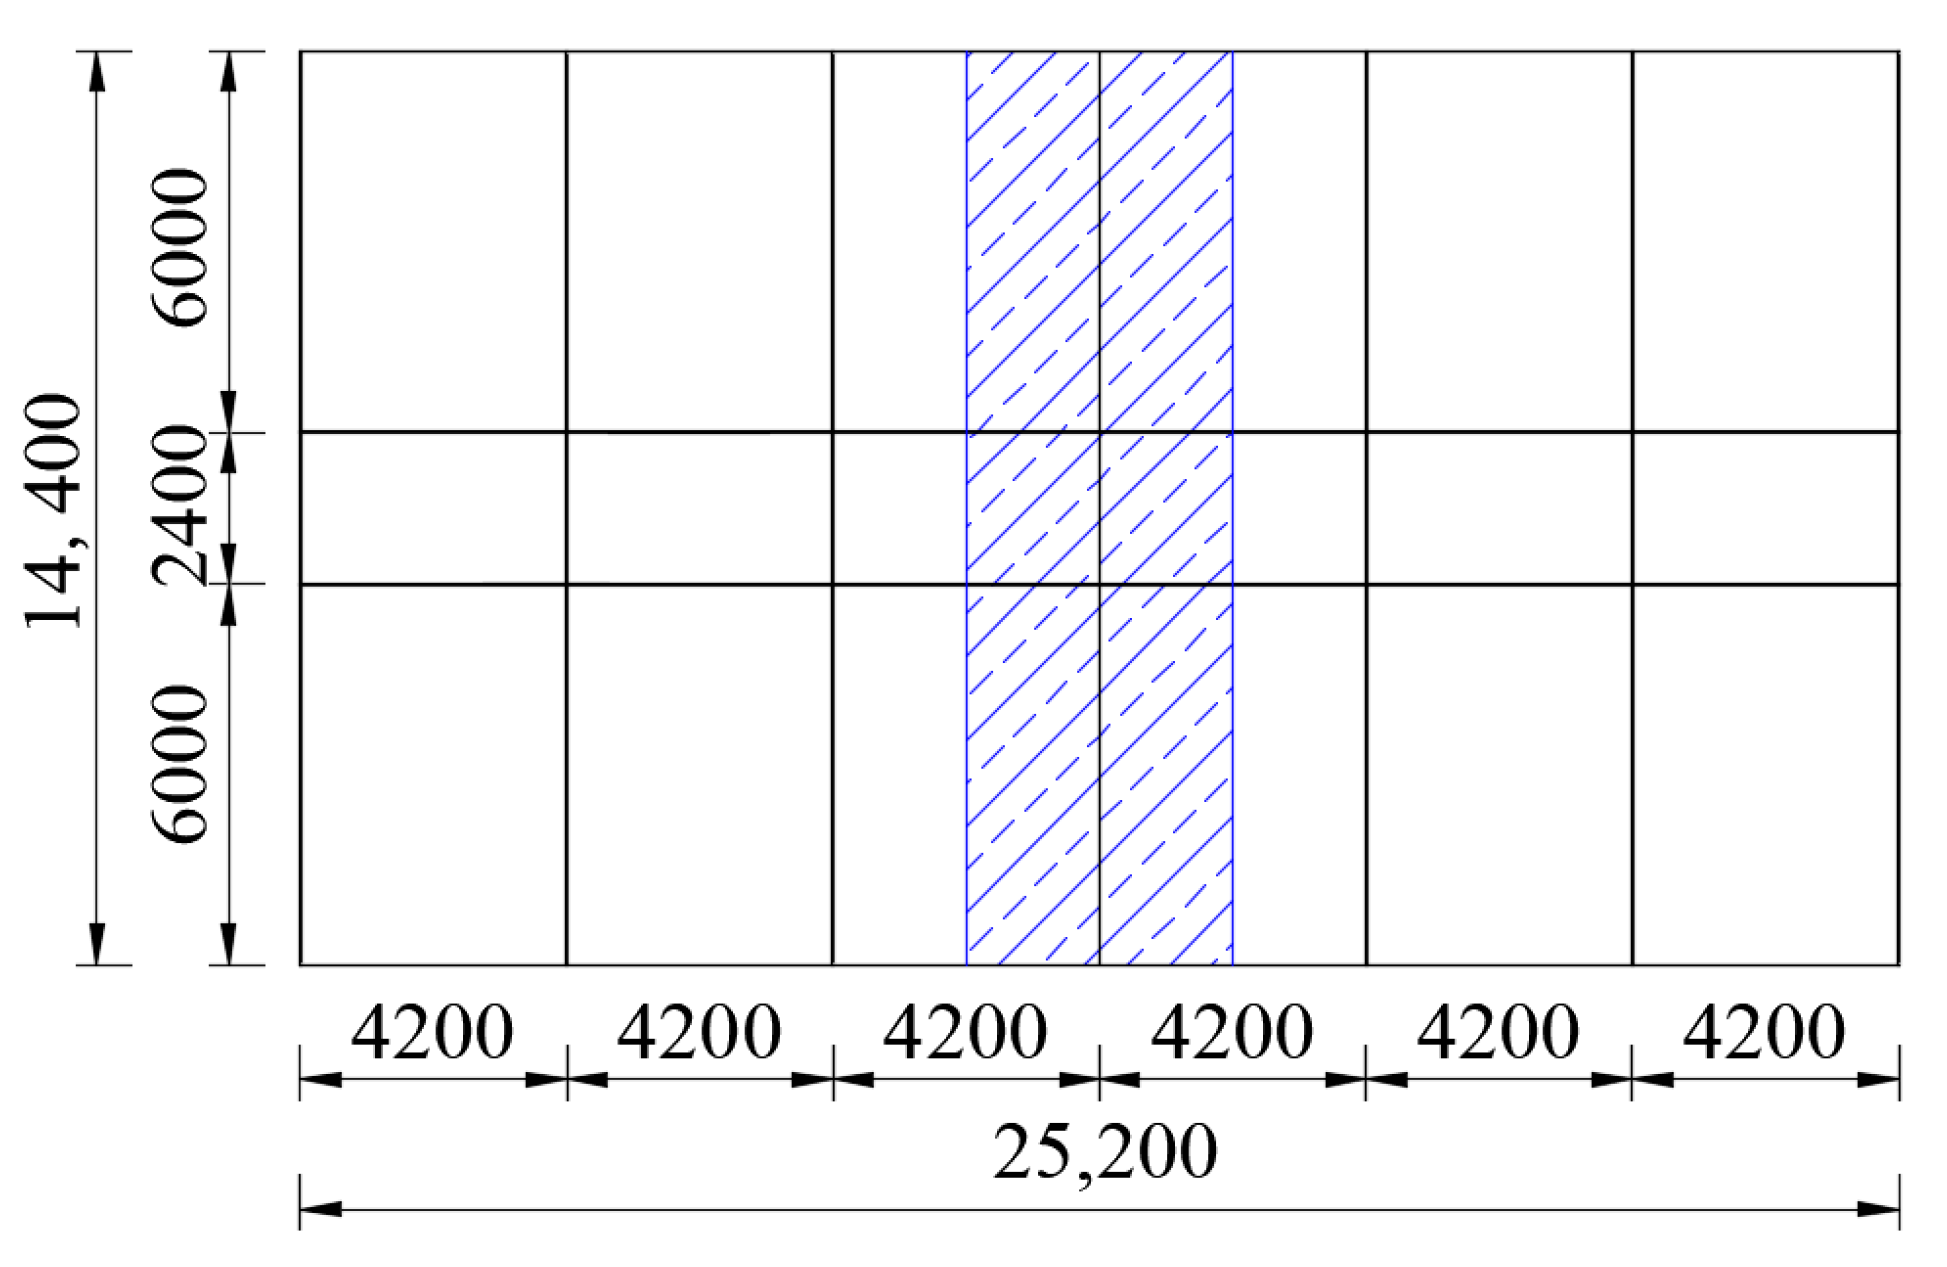
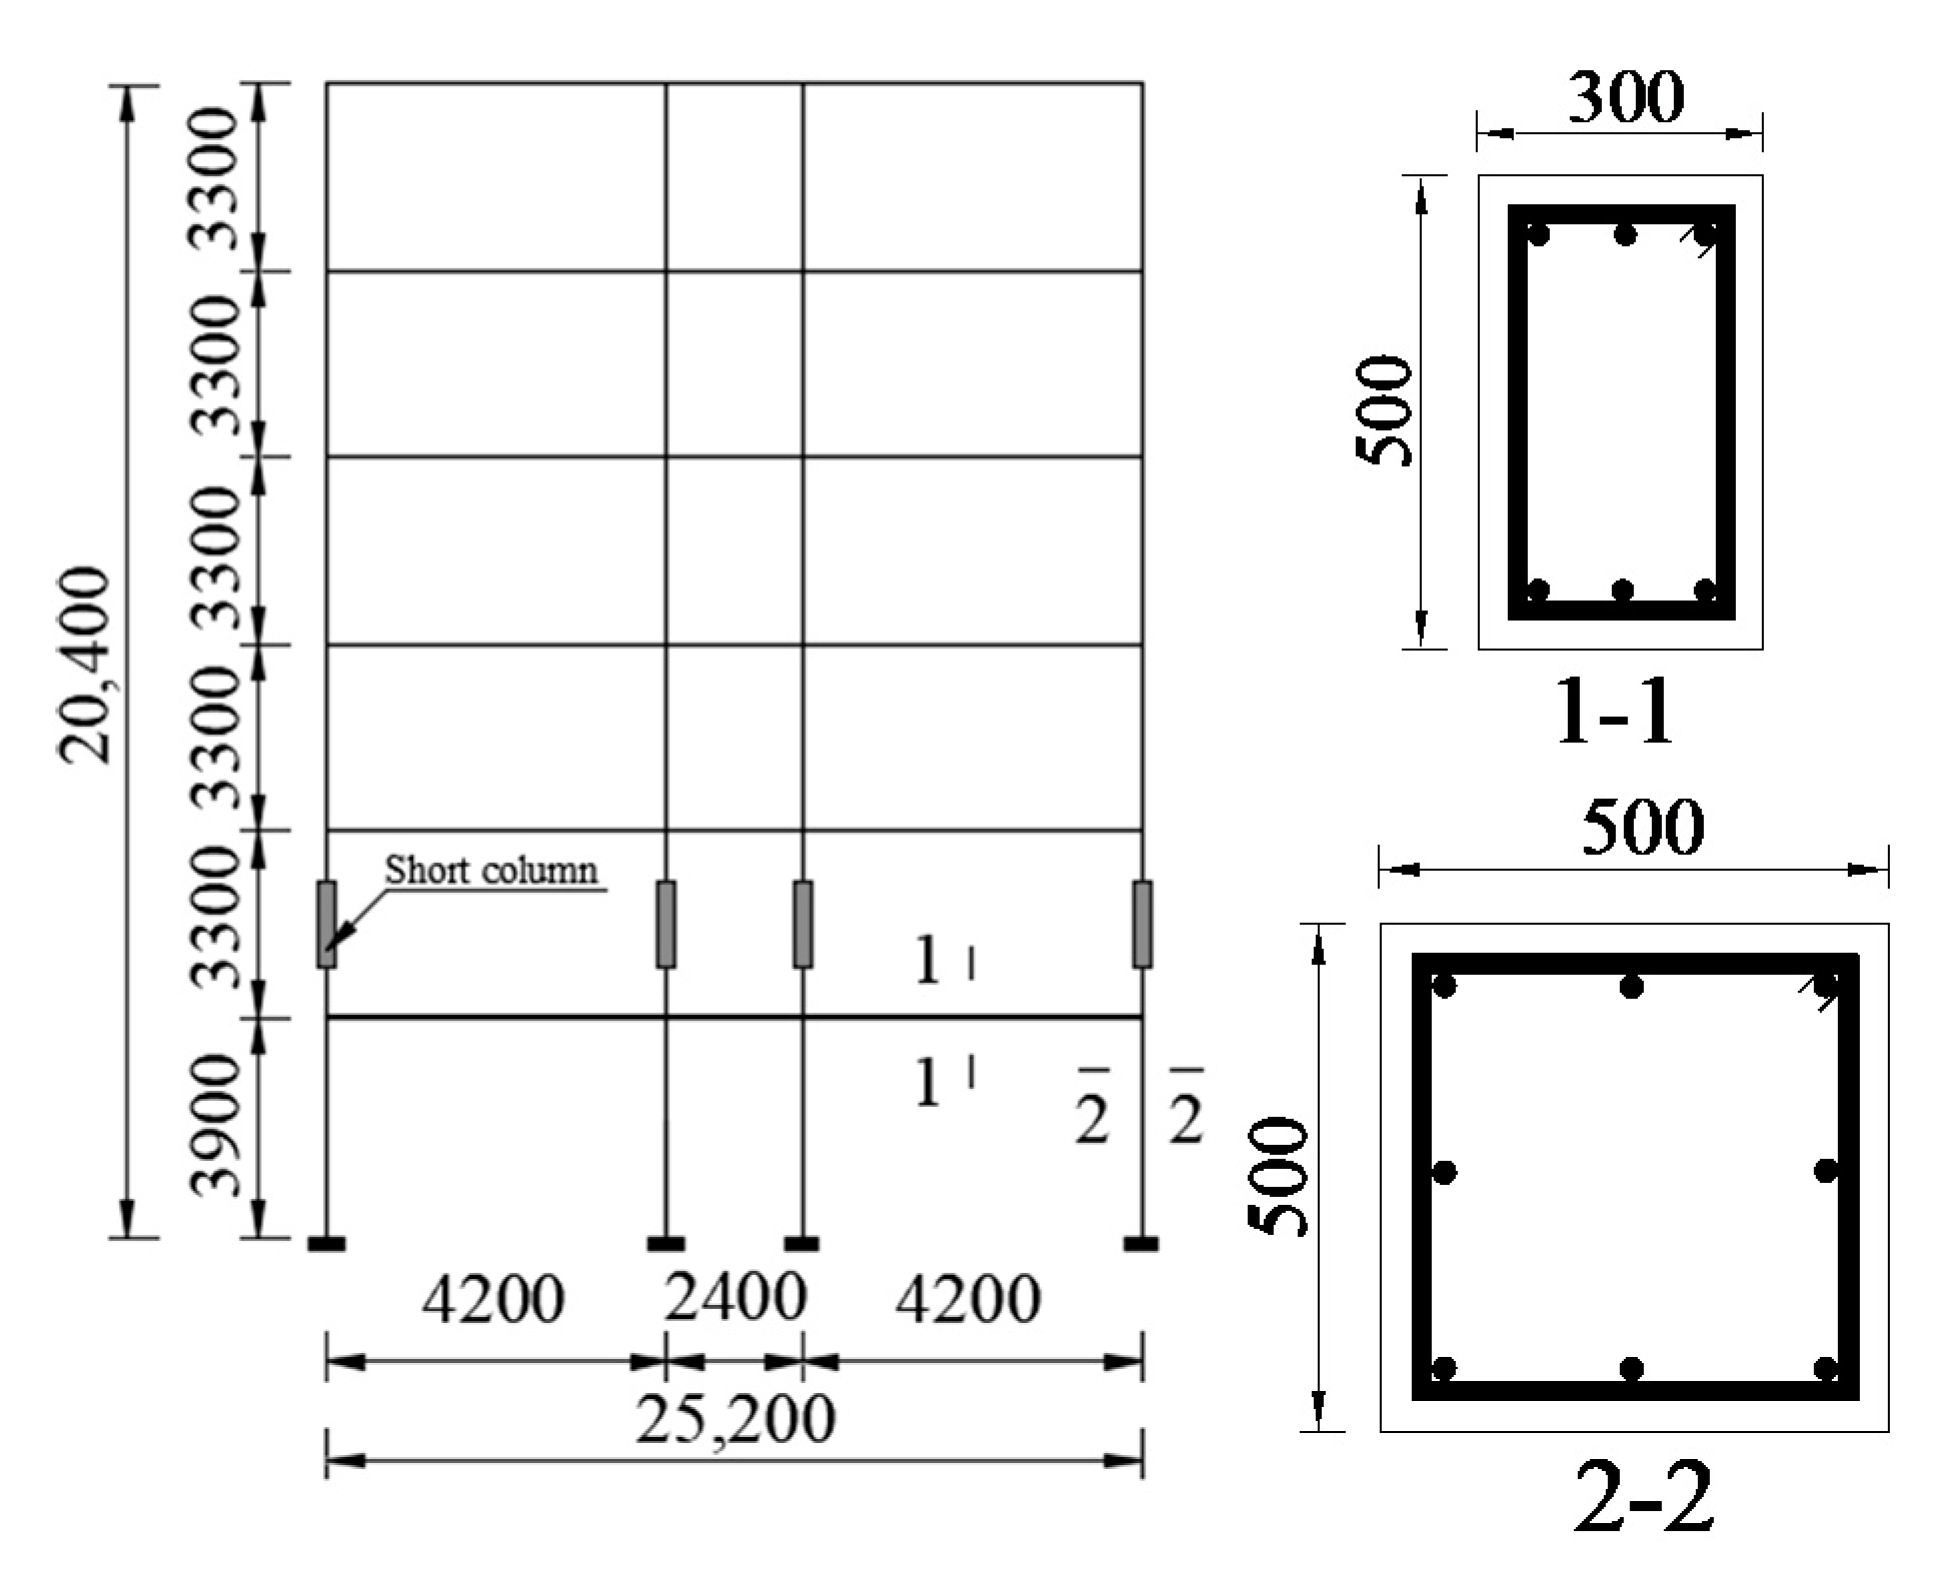
2.1. Basic Structural Information

Three six-story concrete frames were analyzed based on the IDA method, consisting of a pure RC frame and two RC frames with either concrete or ECC short columns. The layout plan of the RC frame is presented in Figure 1. A single frame was selected as the research object for analysis due to the regular plane layout and vertical layout. The vertical view of the single frame is shown in Figure 2. The bottom story was 3.9 m high, and the other stories were 3.3 m high. The short columns were set at an unfavorable position of the second story in the single frames FS1 and FS2, where the deformation was larger than that of other high stories under seismic loading. It should be noted that although the deformation of the bottom story was also large, the height of the bottom story was higher than that of other stories, and thus, it was difficult to set the short column in this frame.
The framework utilized in this paper was designed per Code GB50010-2010. The beams had a cross-section of 300 mm width × 500 mm depth. The columns were 500 mm tall and 500 mm wide. The floors were 100 mm thick. The concrete and ECC were designed as C35. The three reinforcing bars in the top and bottom of the beam were of HRB400 grade (dia. = 20 mm), and the stirrup bars were of HRB335 grade (dia. = 10 mm, spacing = 100 mm). In the columns, the longitudinal bars were again of HRB400 grade (dia. = 20 mm), and the stirrup bars were again of HRB335 grade (dia. = 10 mm, spacing = 75 mm) (Figure 2).

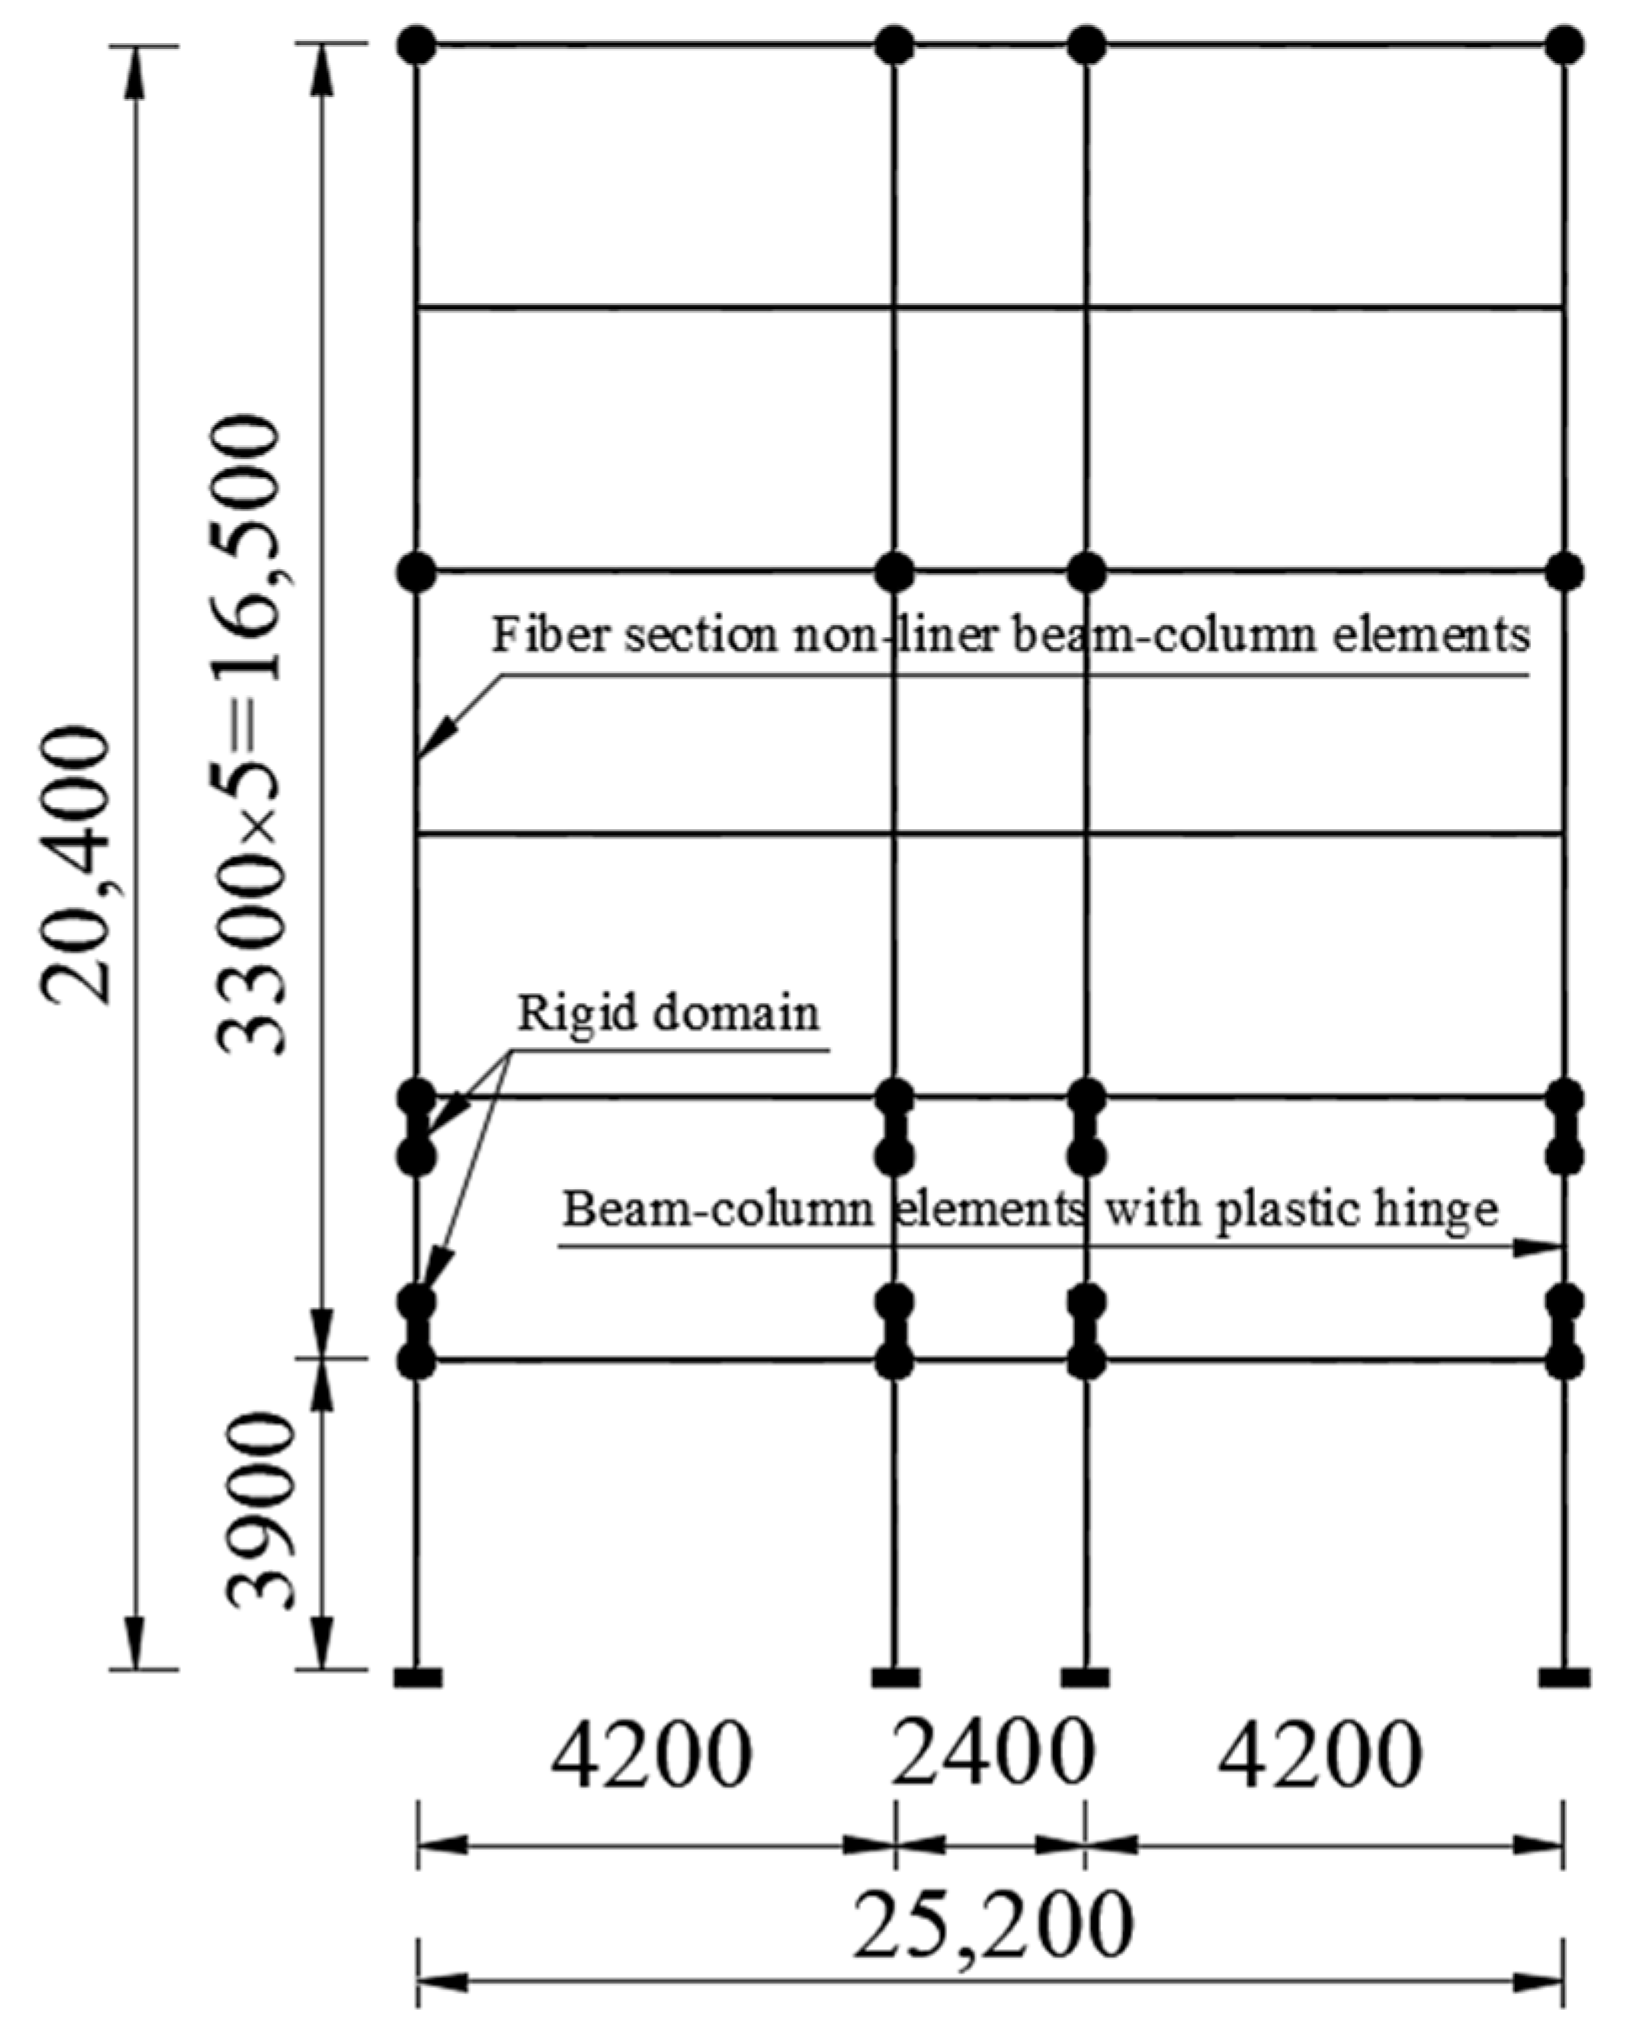
2.2. Finite Element Model

The three RC frames, denoted as F0, FS1 and FS2, were modeled in the open-source FEA software OpenSEES 2.2 for IDA analysis. The basic information on the three RC frames is given in Table 1. F0 was the pure RC frame, which is the same frame as that reported in our companion study [28]. FS1 was the RC frame with concrete short columns and FS2 was the RC frame with ECC short columns. In this paper, an ECC or RC short column was formed by a half-height filled wall; that is, a half-height filled wall was arranged at both ends of the column. The half-height filled wall was 900 mm high, and the ECC or RC short column was 1500 mm high. The generalized shear span ratio was 1.5. The finite element model of the frame structure is shown in Figure 3.
Two types of truss elements, beam-column elements with plastic hinges and fiber section nonlinear beam-column elements, were modeled in the OpenSEES analysis [37,38]. The fiber section nonlinear beam-column element only considered the normal stress along the fiber direction on the section, which was suitable for the analysis of flexural members. In this model, the beams and regular columns in the frame were modeled by fiber section nonlinear beam-column elements. For the short column, the rotation of the two ends of the column was limited by the constraint of the half-height filled wall. In the model, the constraint action of the filled wall was simulated by setting the rigid domain at both ends of the column. The short column with an obvious shear effect between the two rigid domains was modeled by a beam-column element with a plastic hinge. The material constitutive model of the RC frame modeled by the fiber section nonlinear beam-column element was consistent with the concrete constitutive model in our companion study. For the beam-column elements with plastic hinges, the modified Ibarra-Medina-Krawinkler (IMK) degradation model [39,40,41,42,43] was adopted to define the restoring force model of short columns, which will be further discussed in Section 2.3.
As the main purpose of this study is to evaluate the seismic performance of frames with short columns constructed with ECC using IDA at the structural level, only the macro response of the frames is needed. In this case, the ECC type is not specified, i.e., commonly used ECC that exhibits strain hardening behaviors and multiple fine cracks under tension was considered in this study. In this analysis, the tensile strength of ECC was set to be 0.1 fc, where fc is the compressive strength, which is the same as that of C35 concrete. The tensile strain capacity of ECC was set at 3%, while the compressive strain corresponding to the peak compressive stress was set to be 0.005 rather than 0.002 for normal concrete. In the IDA analysis, the fundamental period of vibration in the RC frame with or without the RC column was 0.72 s, while the vibration in the RC column with the ECC column was 0.75 s. This is because ECC has a lower elastic modulus than normal concrete. The IDA procedure is described in [28].

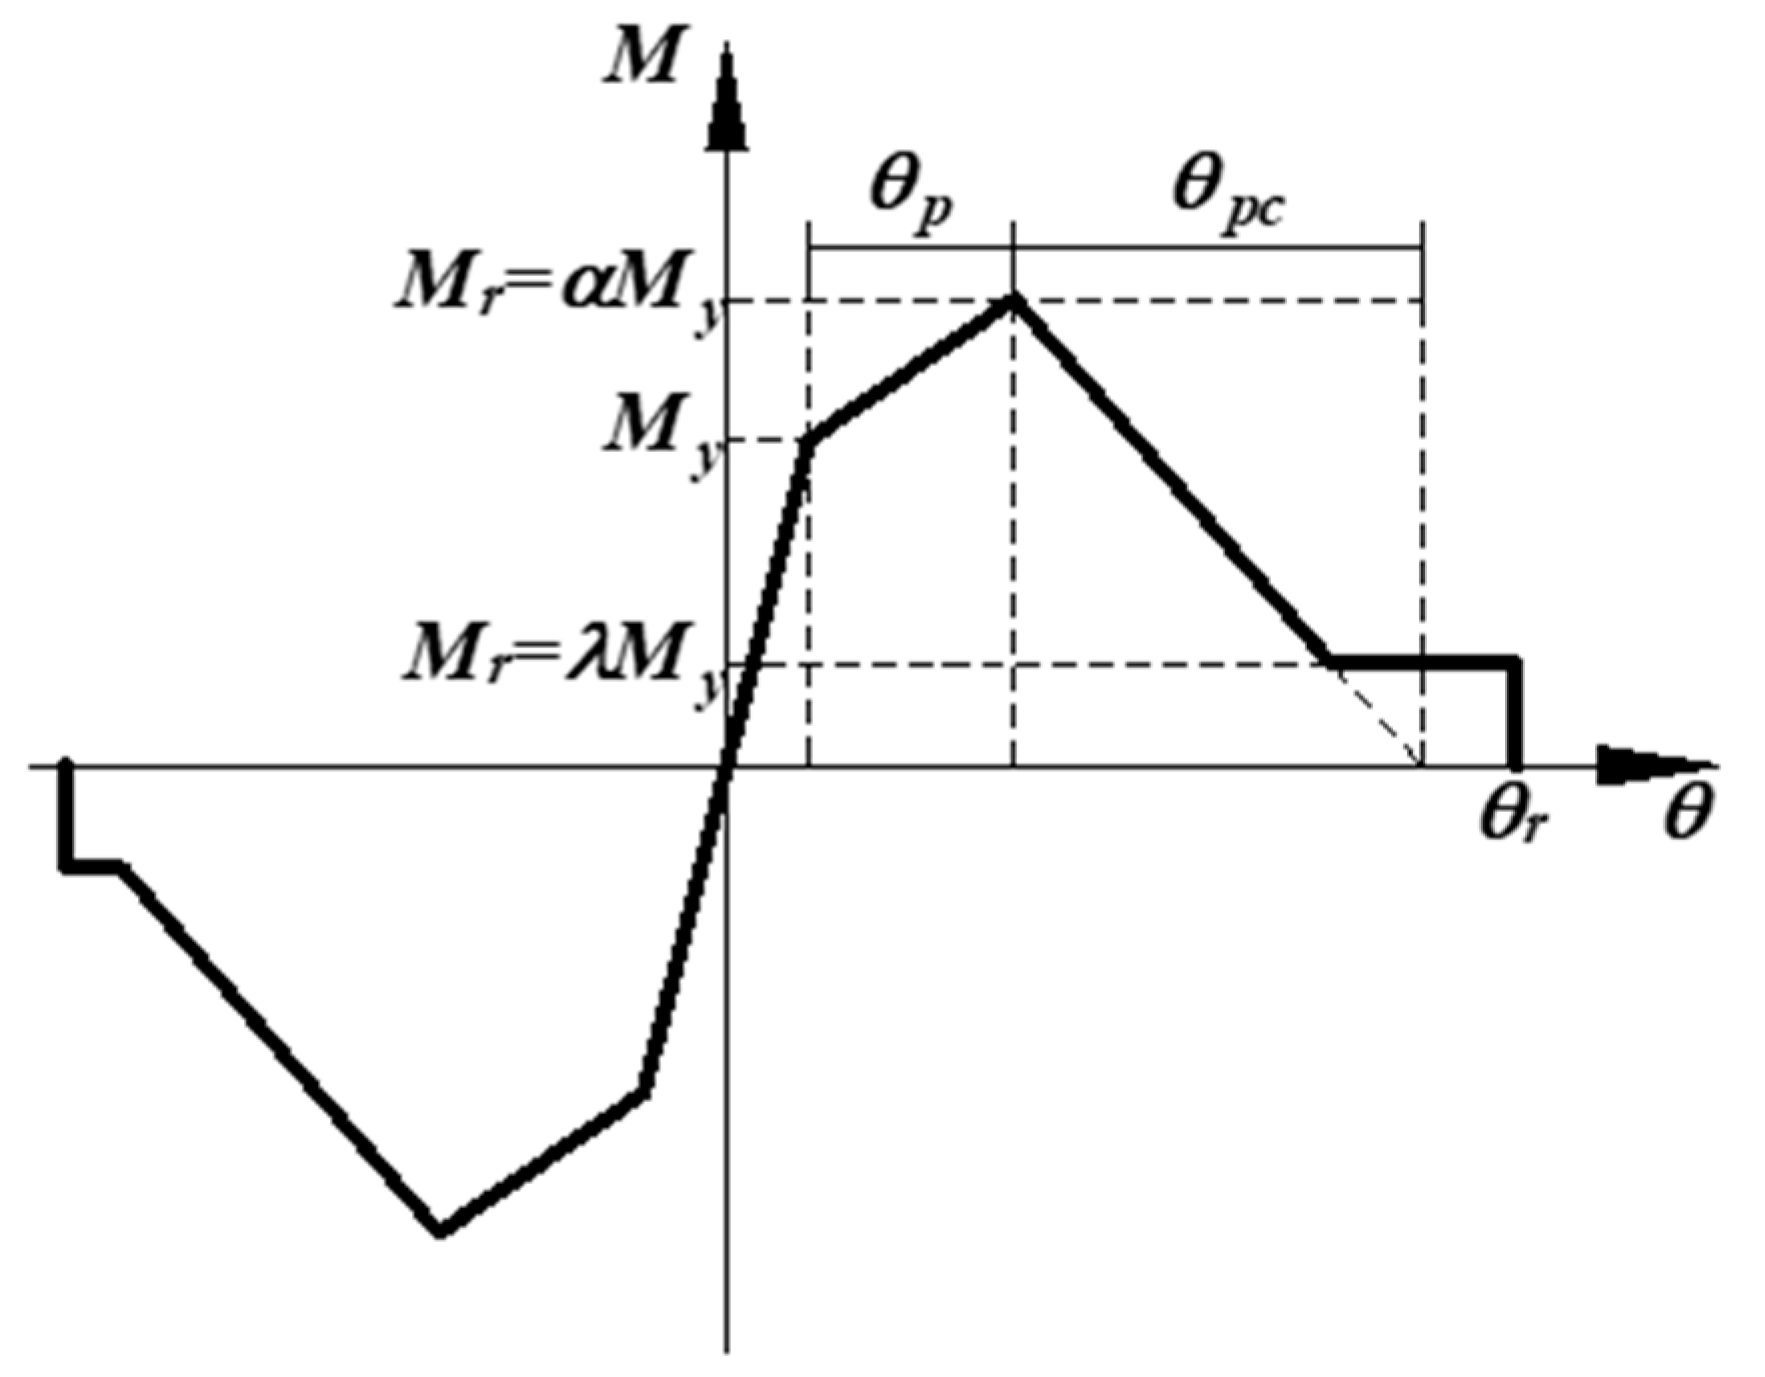
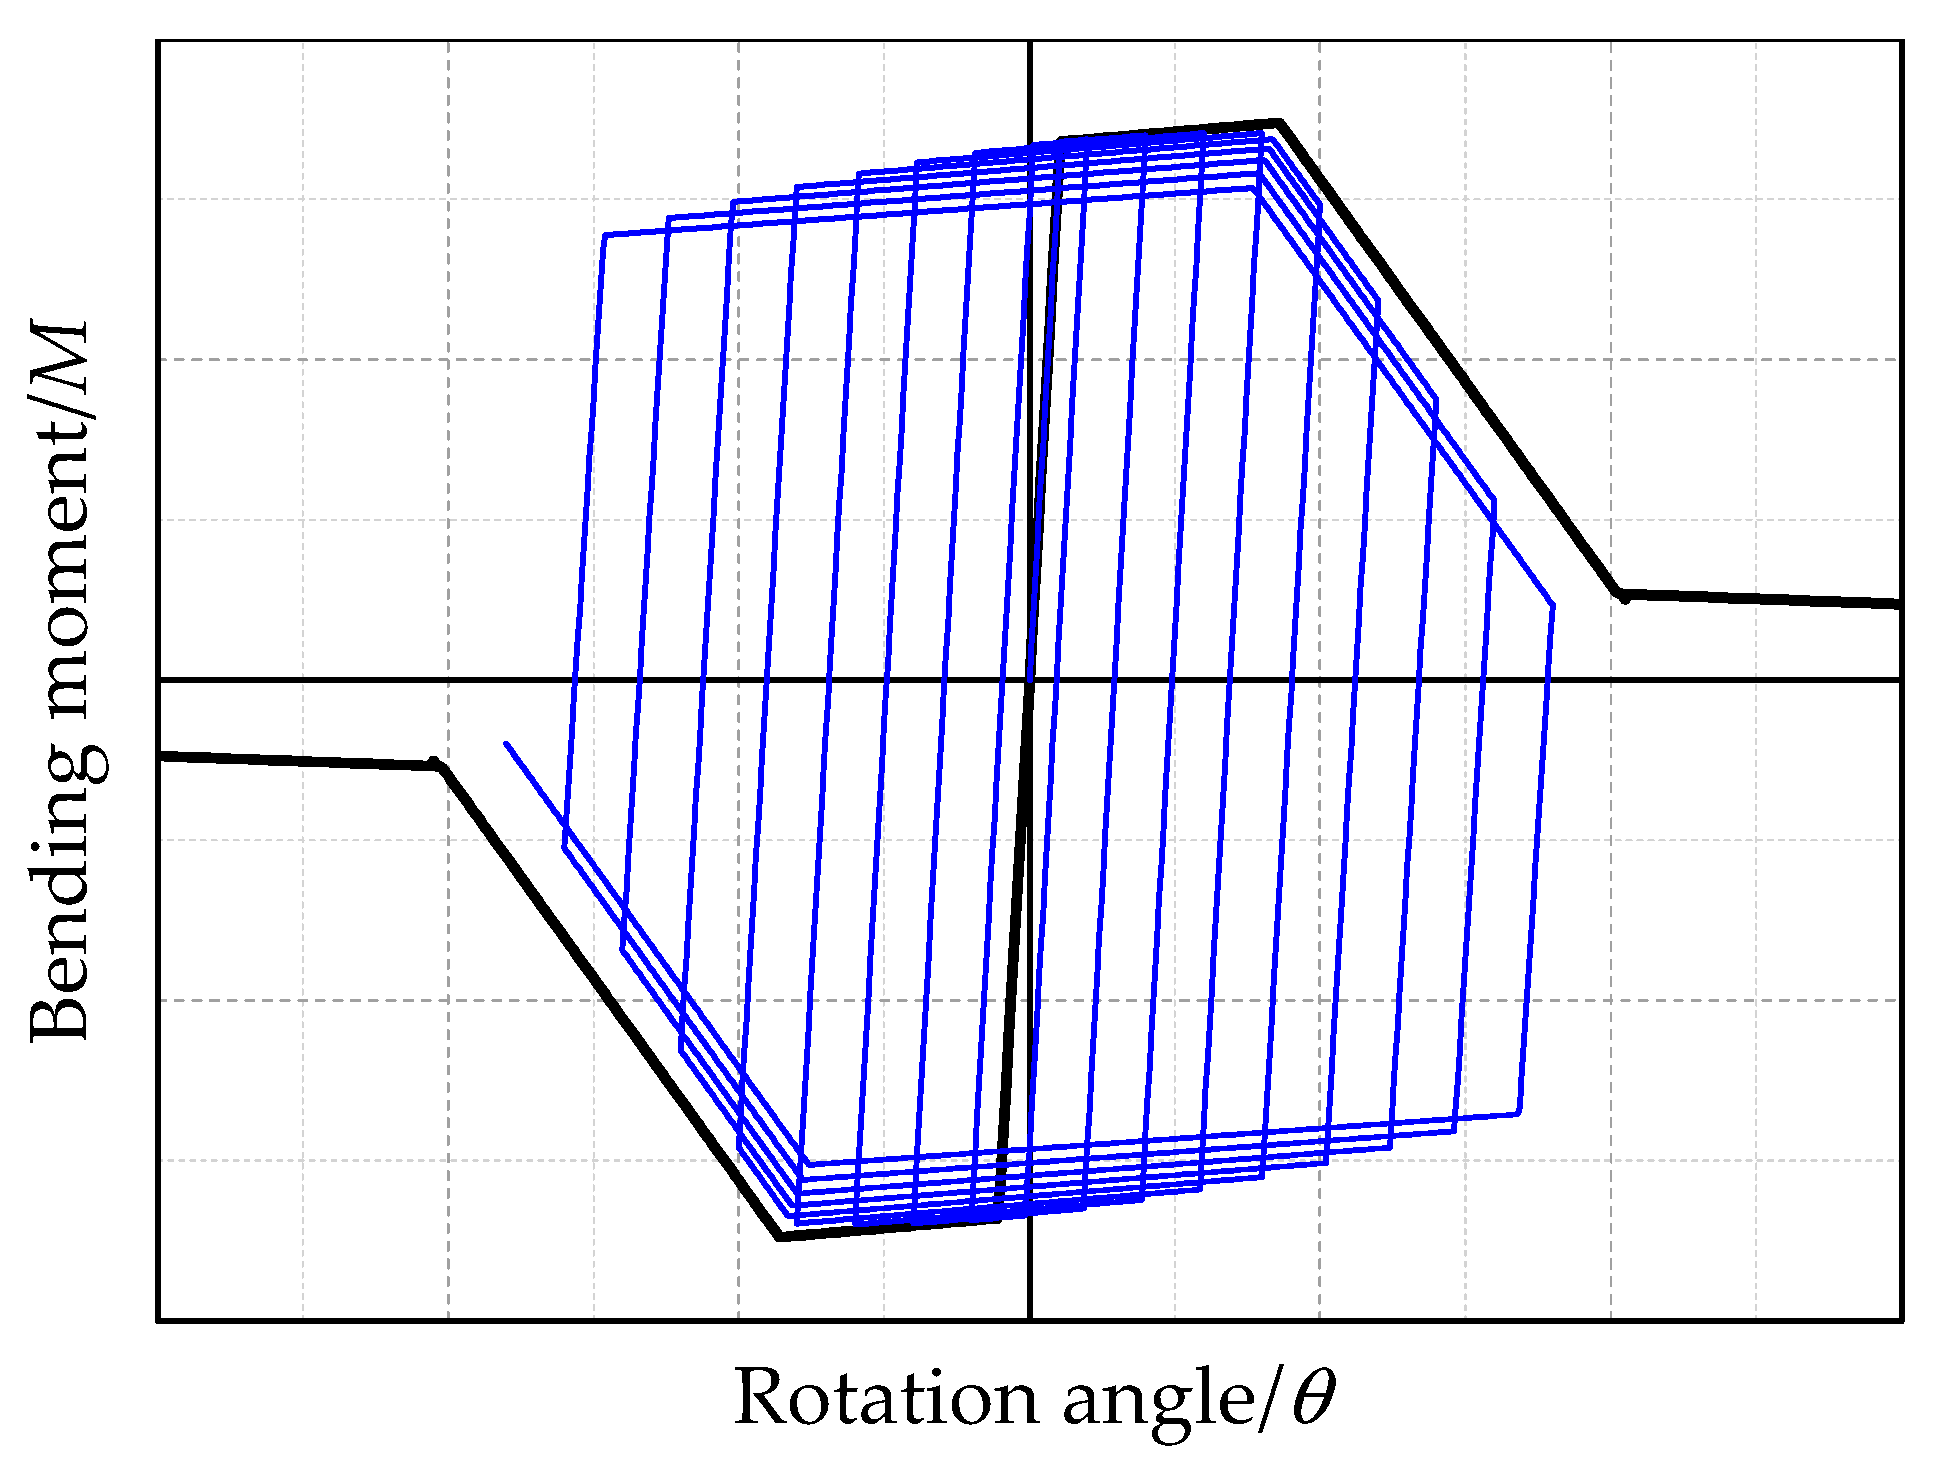
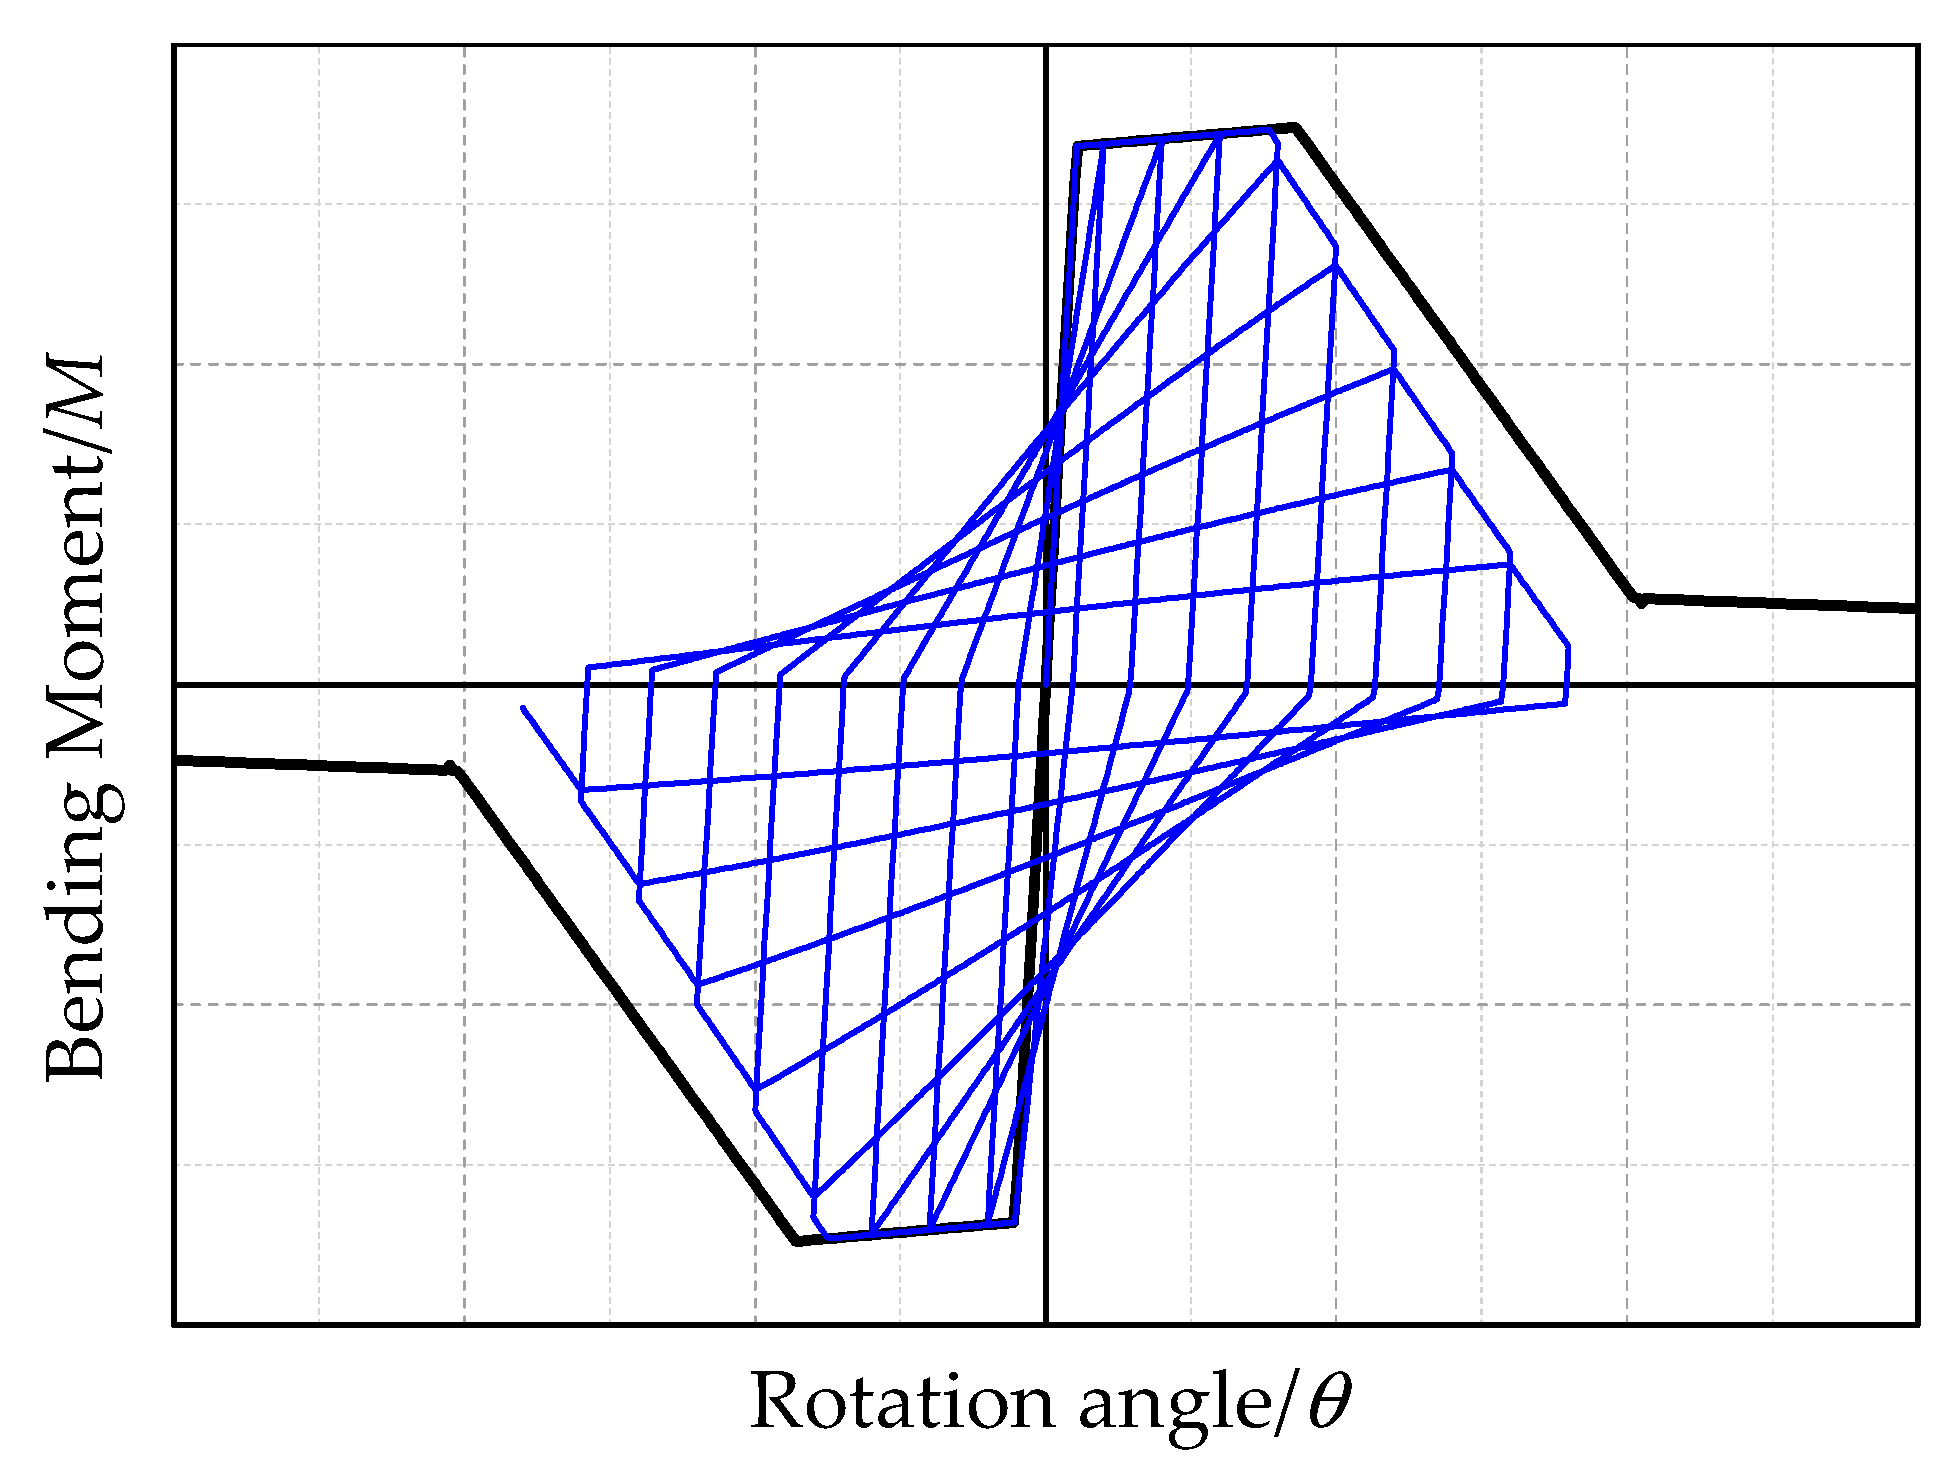
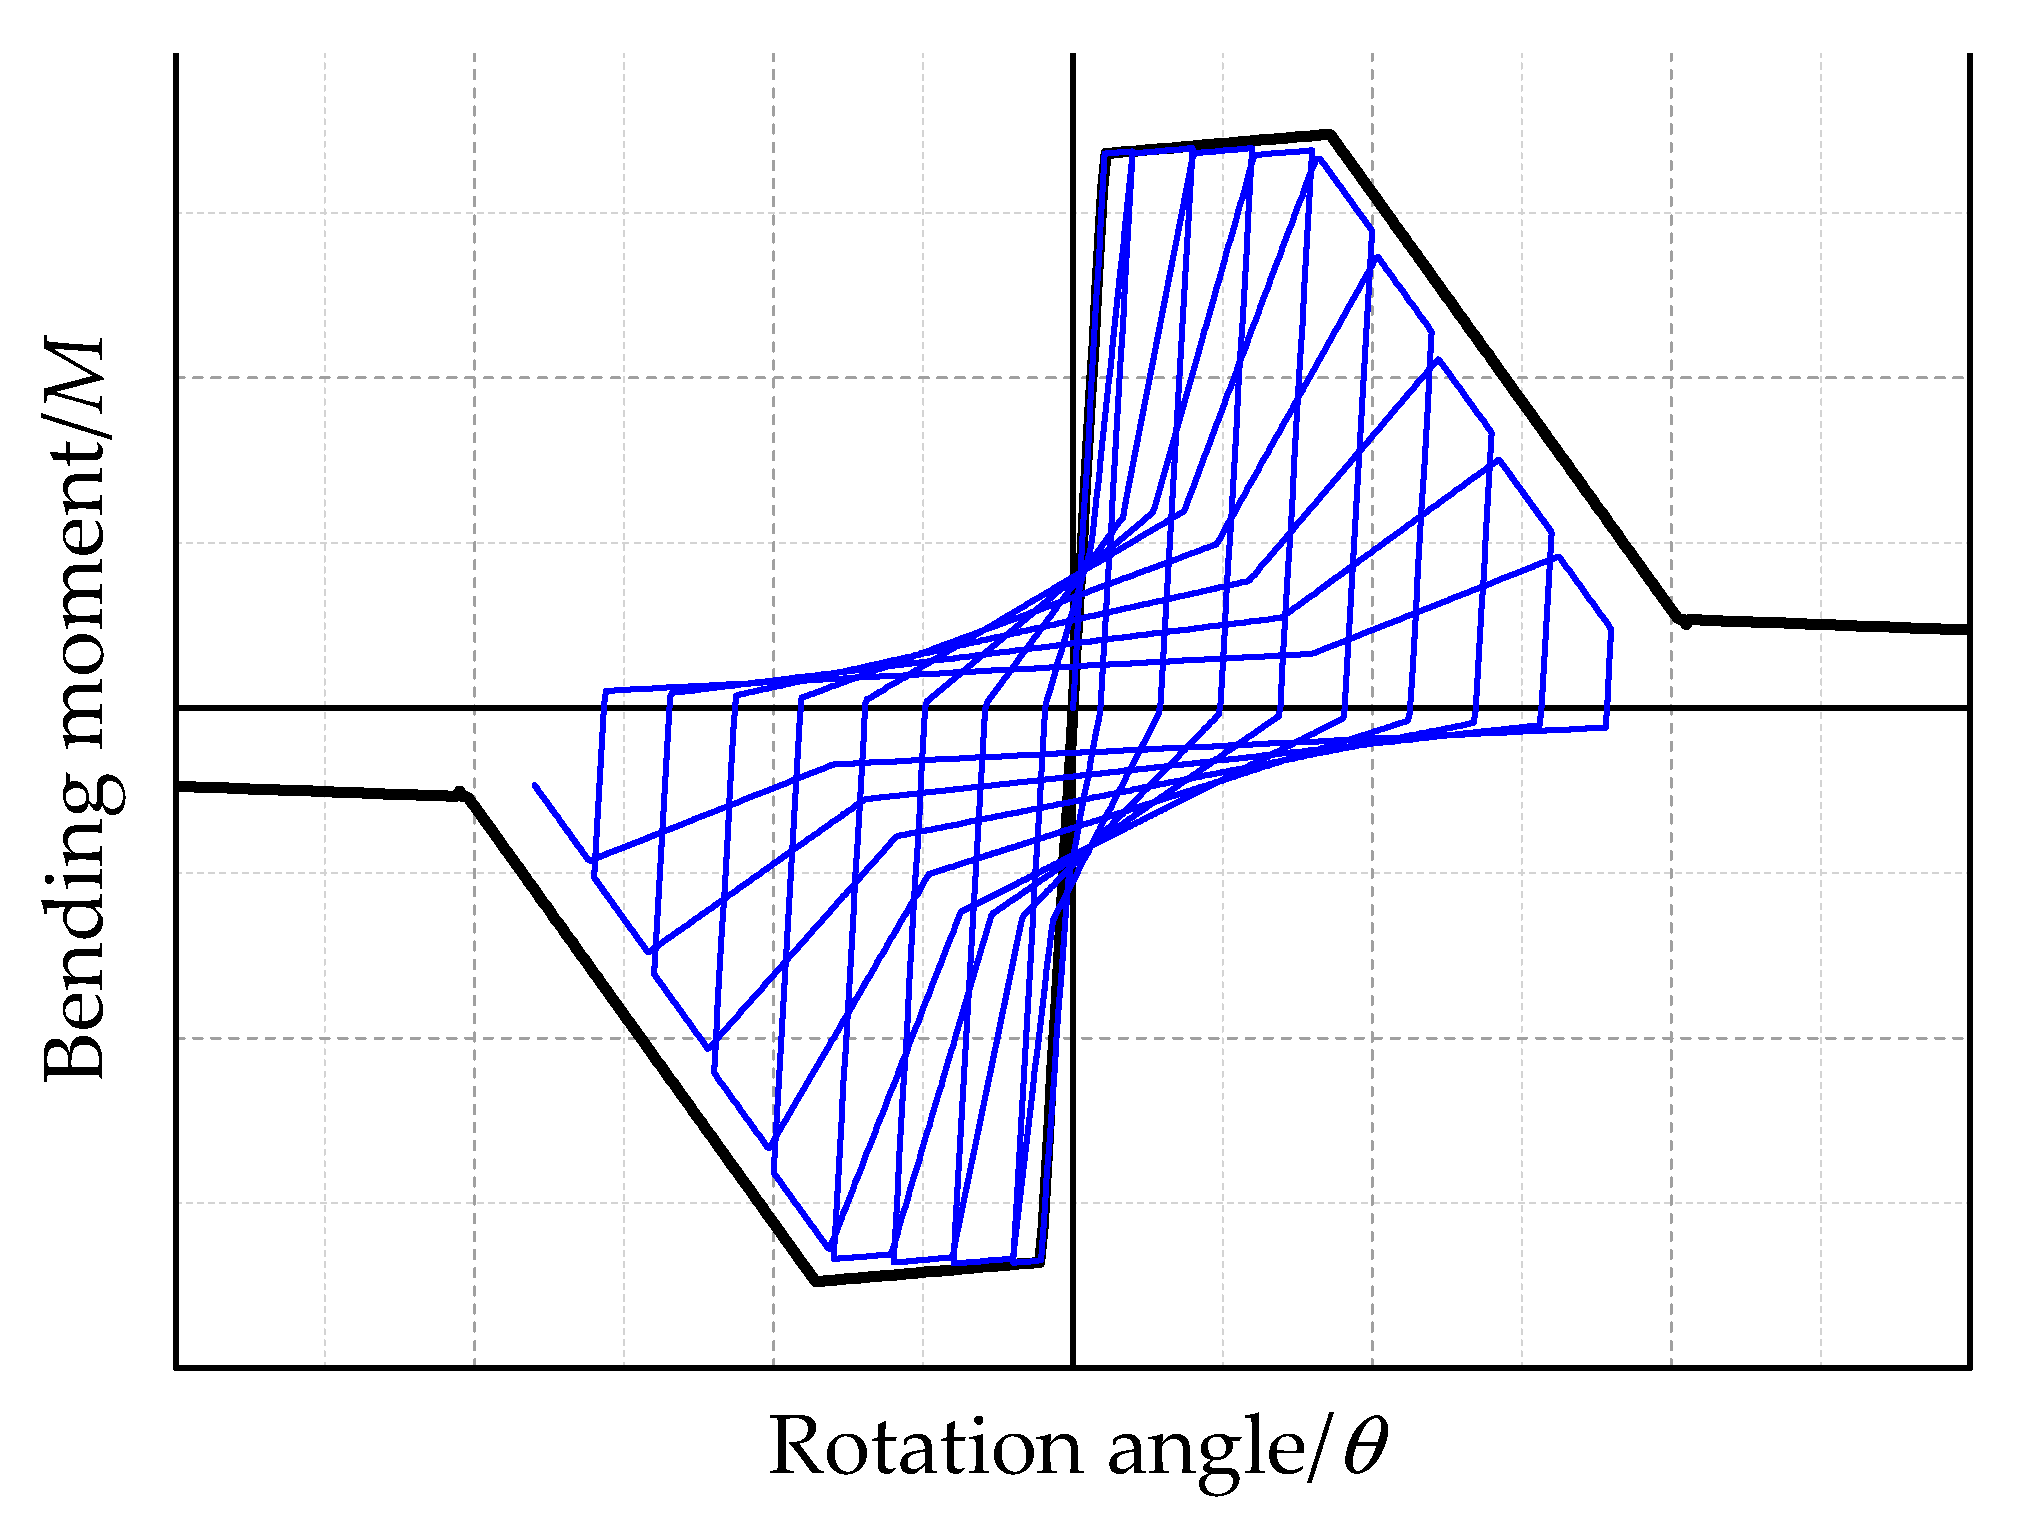
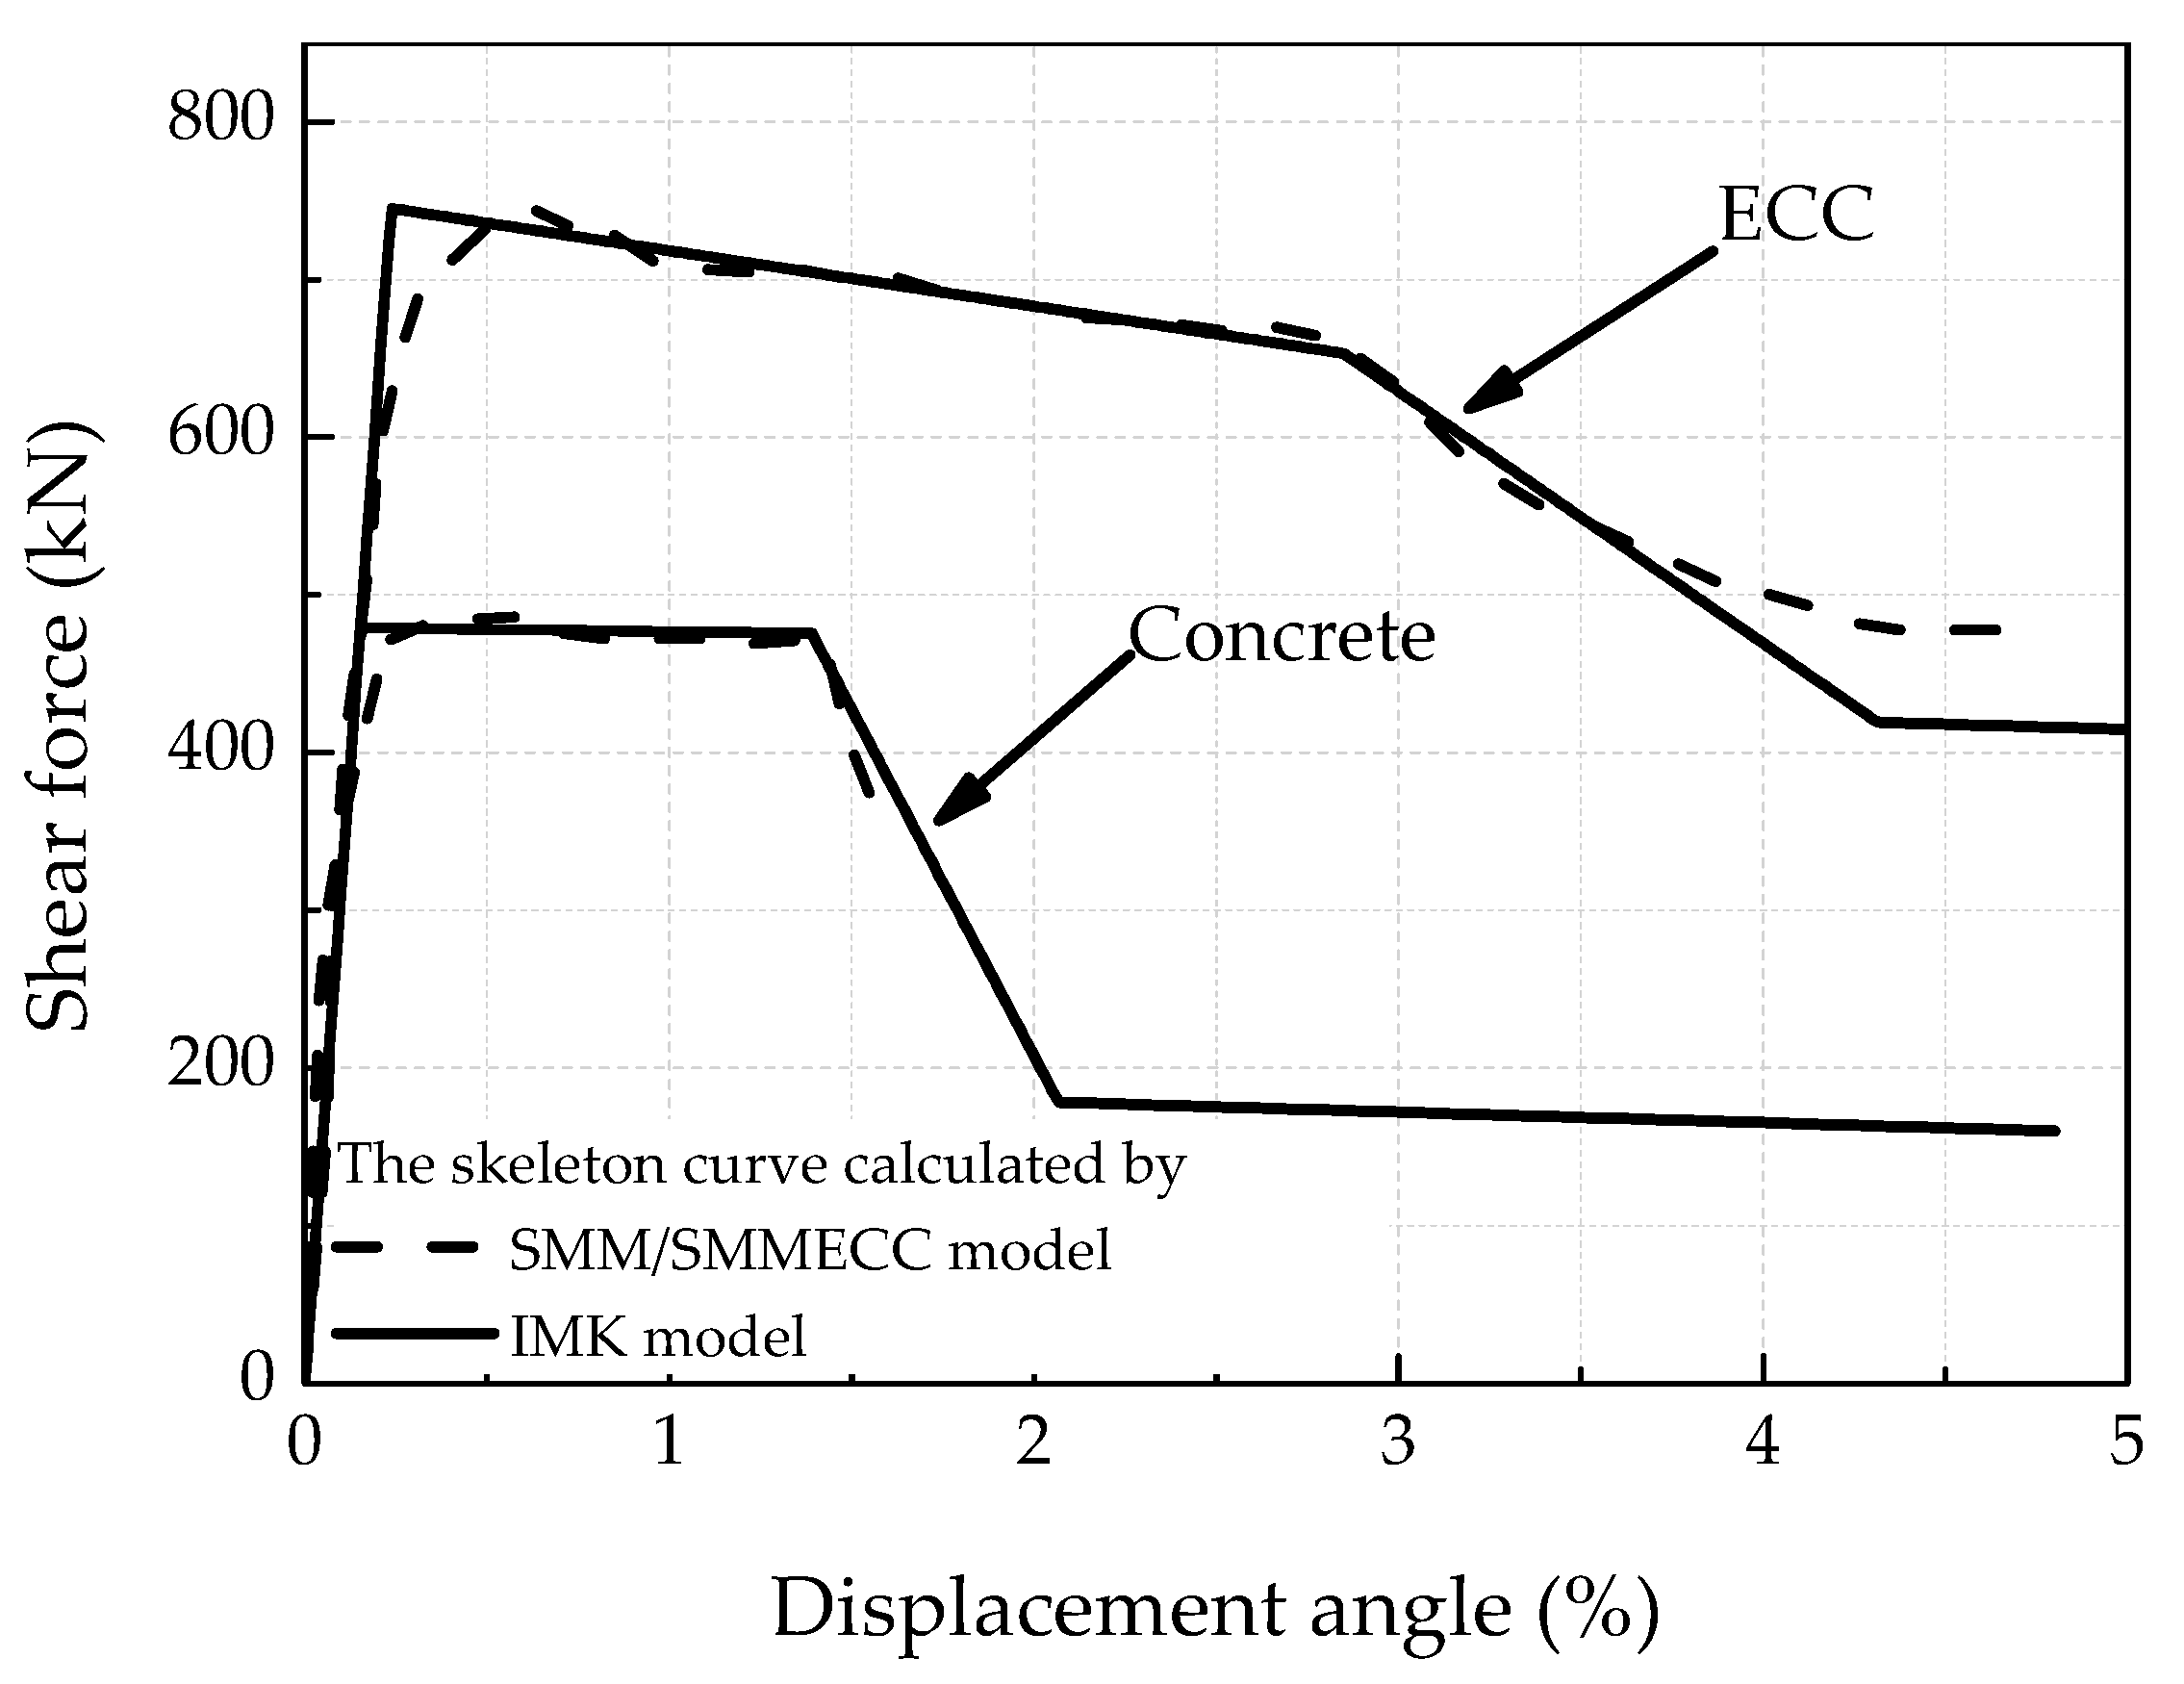
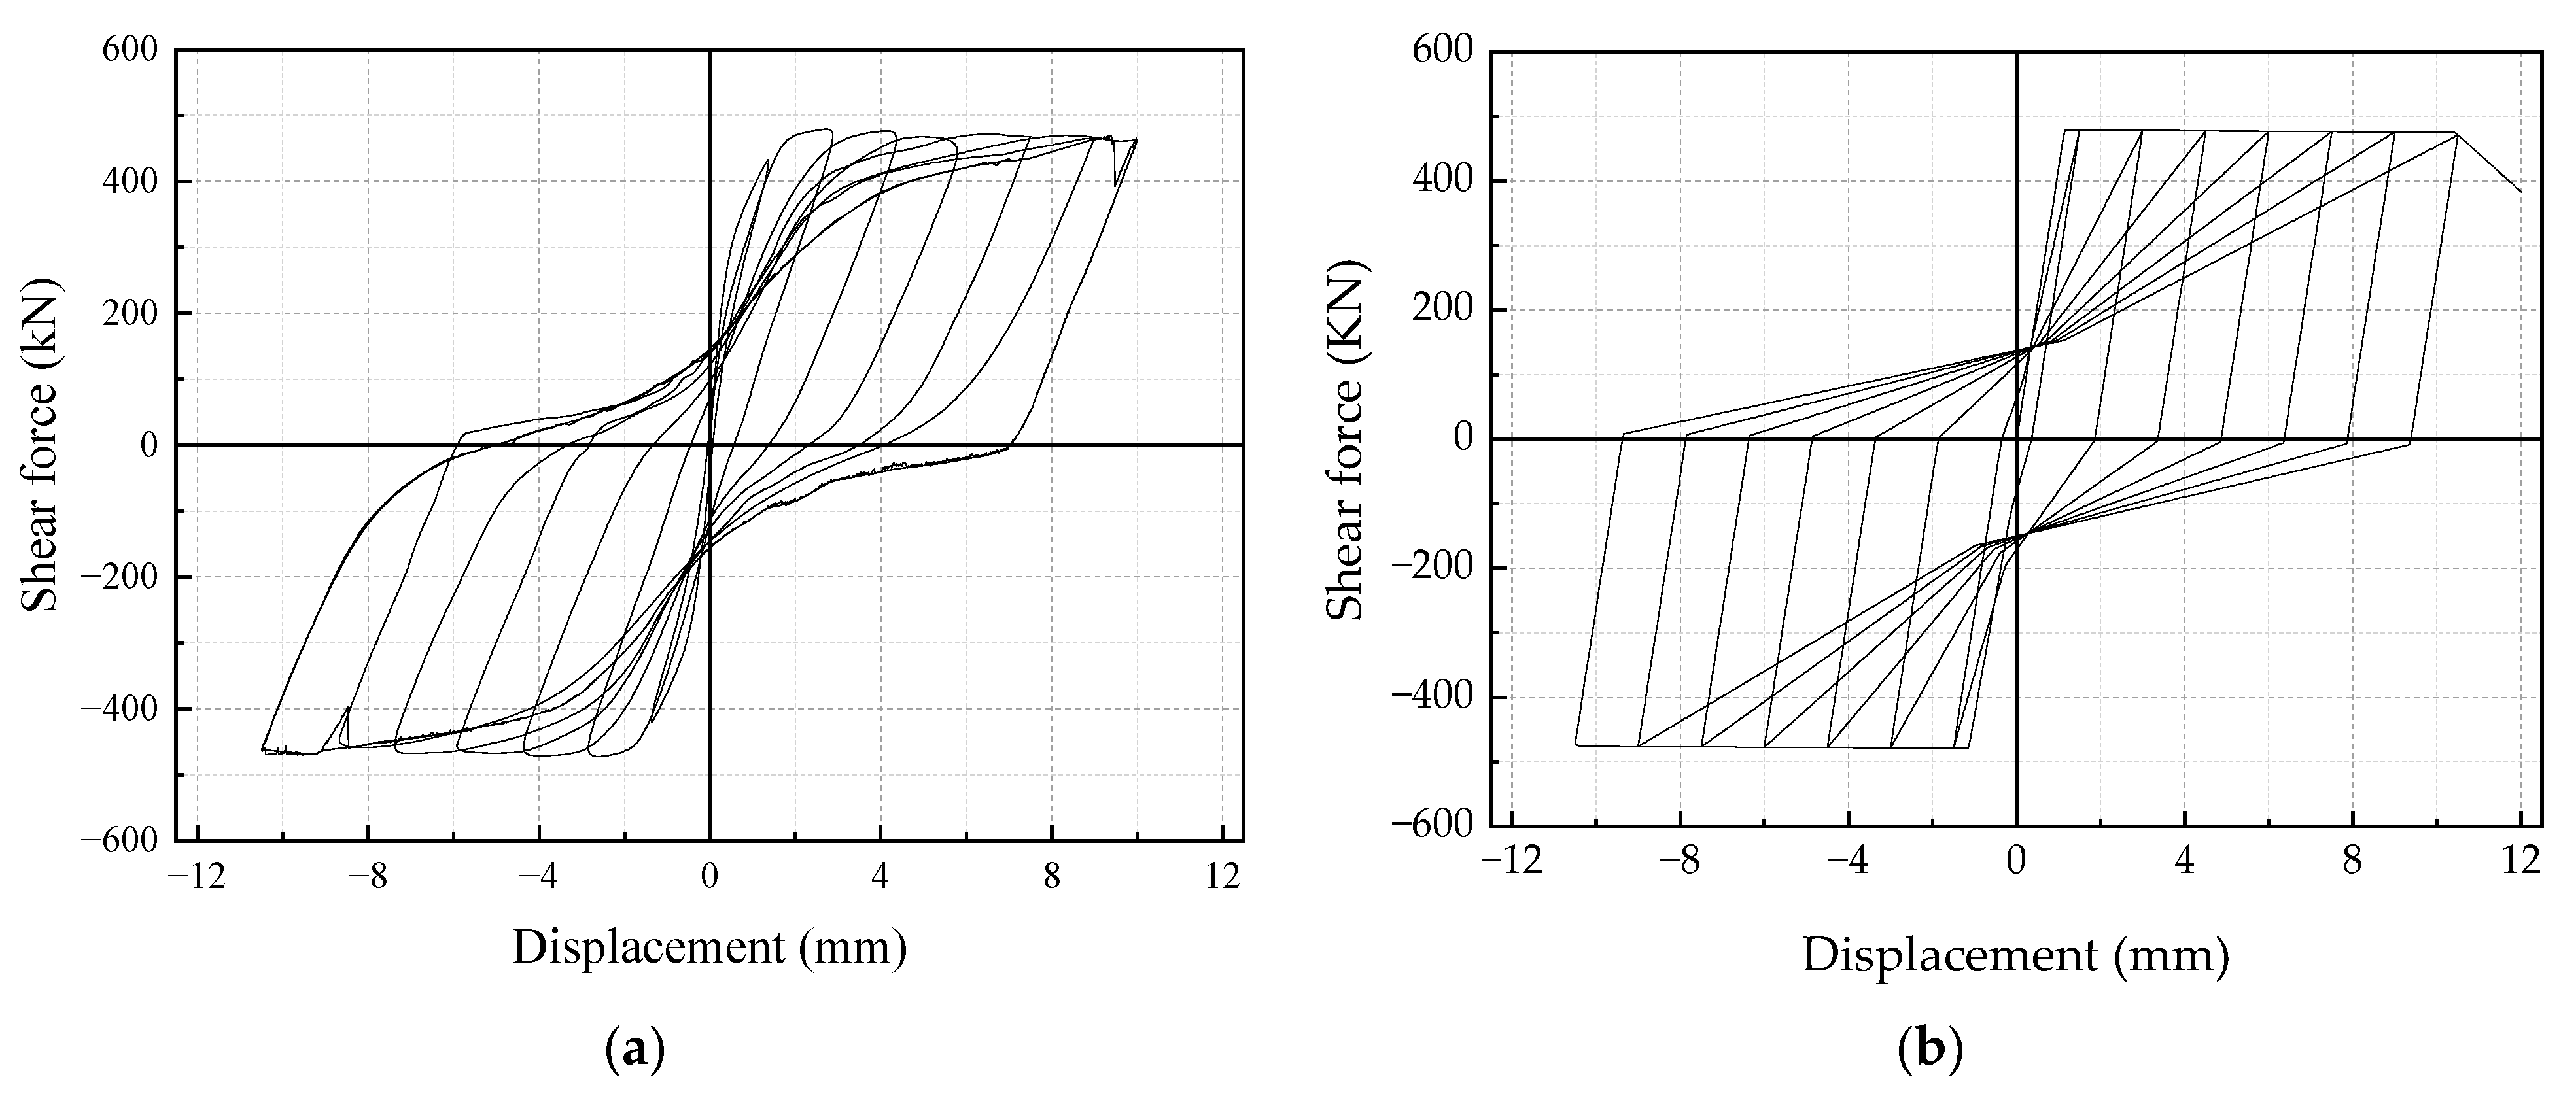
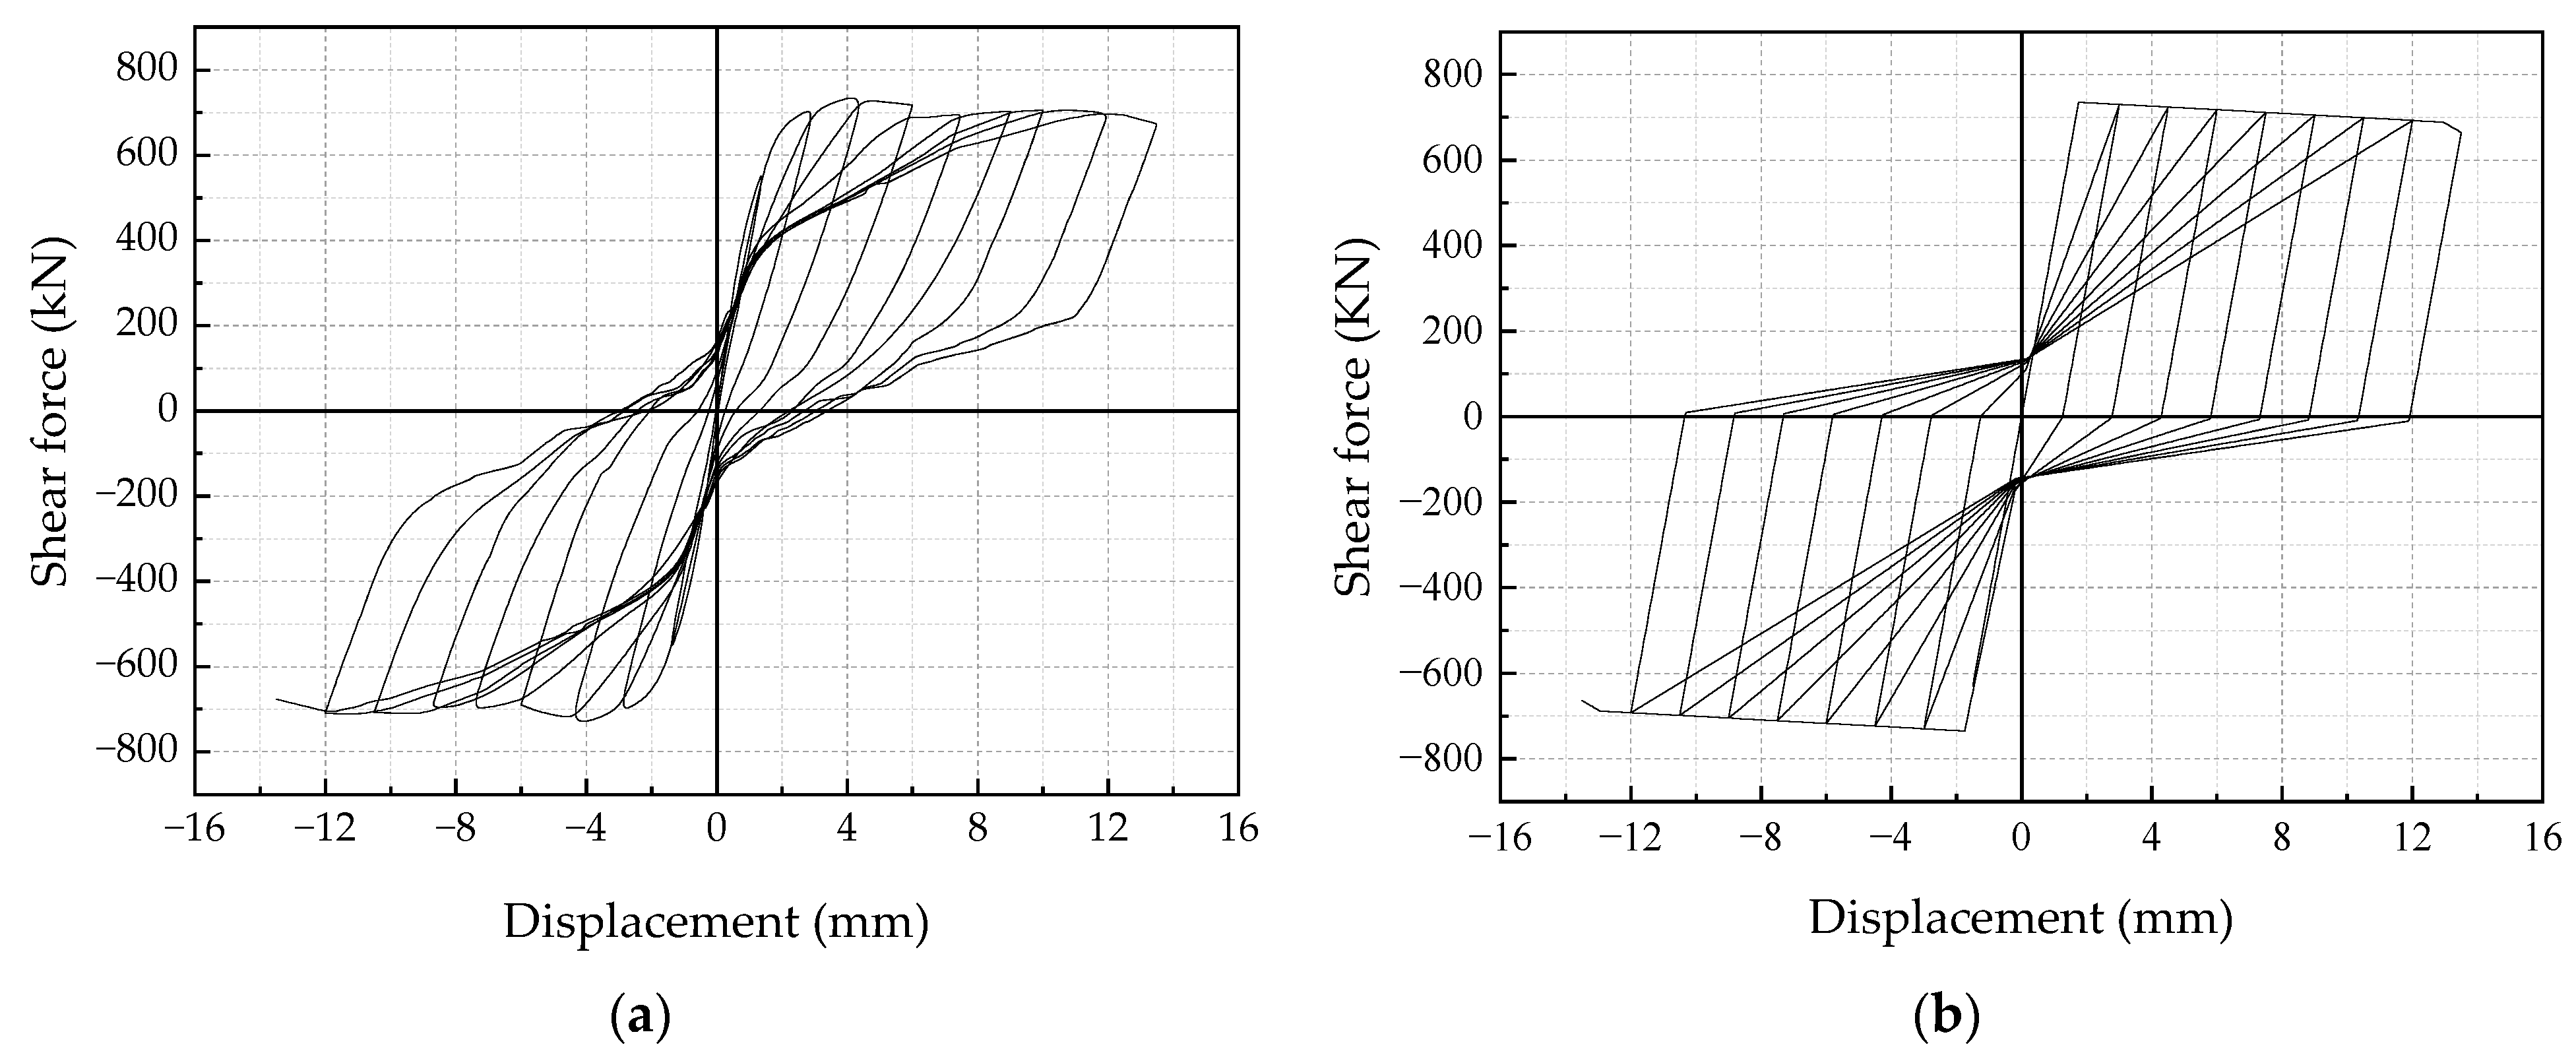
2.3. Restoring Force Model of the RECC Short Column with the Shear Effect

The short columns in the frames were modeled by beam-column elements with plastic hinges, and the modified IMK model was selected as the restoring force model. The modified IMK model could simulate the entire history of mechanical behavior from the elastic stage, to the plastic-elastic stage and final collapse, resulting in the loss of bearing capacity. The skeleton curve of the model, consisting of three stages, the elastic, hardening and softening stages, is shown in Figure 4. The skeleton curve is defined by five parameters, the elastic stiffness (Ke), the yield bending moment (My), the ratio of the peak bending moment to the yield bending moment (α), the angle range of the hardening stage (θp) and the angle range of the softening stage (θpc). θr is the limit of the rotation angle, and λ is the residual strength coefficient of the structure. Three hysteretic models are provided by this model, which correspond to the bilinear hysteresis model for steel structures (Figure 5), the maximum pointing hysteresis model for concrete structures (Figure 6) and the hysteretic model with the pinching effect for wood and concrete structures (Figure 7). The failure of a short column is usually governed by the shear effect, and the hysteresis curve of a short column has an obvious pinching effect. Thus, the IMK hysteresis model corresponding to the pinching effect was applied to model the short column in this paper.
The degradation rate of the model is governed by the degradation index β associated with hysteretic energy dissipation. If it is assumed that the hysteretic energy dissipation capacity of the structure is certain and independent of the load path, then, in the i-th cycle, the degradation index βi is defined by Equation (1).
β i = ( E i E t j = 1 i E j ) c
in which the value range of βi is (0, 1]. The index c represents the degradation rate, ranging from 1 to 2. The degradation rate is constant when index c = 1, while, when the value of index c = 2, the degradation rate is slow in the initial cycle and later increases. The term Ei represents the energy dissipated by the structure in the i-th cycle. The term Et, given by Equation (2), represents the hysteretic energy dissipation capacity of the structure.
E t = γ F y D y
where γ is a parameter for controlling the degree of structural degradation. The smaller γ is, the more serious the structural degradation caused by hysteretic energy dissipation. When the value of γ is infinite, the structure has no cyclic degradation.
Three degradation phenomena will occur in this model after the structure yields, including basic bearing capacity degradation, bearing capacity degradation in the softening stage and unloading stiffness degradation. The three degradation phenomena mentioned above are independent of each other, and each degradation is governed by γ and c to control the degree and rate of degradation. The degradation equation is given by Equation (3):
F i = ( 1 β i ) F i 1 K i = ( 1 β i ) K i 1
where Fi and Ki are the parameters corresponding to the three degradation phenomena.
Each parameter in the IMK model is determined according to experimental data. However, due to the lack of corresponding short column tests, the softened membrane model for ECC (SMMECC) proposed in reference [40] was first used to model the hysteretic behavior of the short columns in the frames, and then the parameters in the IMK model were determined through the fitting method. Since the hysteresis models in the SMMECC model and IMK model are quite different, the fitting was based on the closest approximation of the area wrapped by each hysteresis curve calculated by the two models. According to the cross-section information and reinforcement of the short column on the second floor of the frame, as well as the converted vertical axial pressure, the SMM model and SMMECC model were first used to model the RC short column and RECC short column, respectively. Then, the IMK model was used for fitting. Finally, the skeleton curve and hysteresis curve of the RC short column and ECC short column were calculated by the two models, as shown in Figure 8, Figure 9 and Figure 10. The results show that both the bearing capacity and ultimate plastic rotation of ECC short columns are larger than those of RC short columns.

2.4. Determination of the IDA Index

The IDA curves were obtained by IDA analysis to evaluate the seismic performance, which represented the relationship between the intensity measure (IM) and damage measure (DM). The earthquake intensity corresponding to the IDA analysis could be scaled and monotonically changed. The variables that met the requirement included the peak value of ground motion acceleration (PGA), peak velocity (PGV) and spectral acceleration Sa (T1, 5%) corresponding to the fundamental period with a damping ratio of 5%. Per GB 50011-2010 [44] and American code ATC-63 [45], PGA and Sa (T1, 5%) were selected as the IM for the mode analysis. PGA is unrelated to the structural properties and can be used to compare the seismic intensity of different frames when they reach the same DM value. Sa (T1, 5%), is related to the structural properties, and the discreteness of IDA curve clusters described by Sa (T1, 5%) as the IM is small, which can be used to obtain stable and effective results when determining the structural performance points. For the DM, the maximum interfloor drift angle θmax was selected to analyze the performance of the RC frames. The maximum vertex displacement Δ was selected as DM to evaluate the damage degree of the RC frame with a short column. This is because, due to the existence of short columns, a weak layer was formed on the second floor where the short columns were located, and the mechanical properties and deformation capacity of this floor were different from those of other floors.

3. Analytical Results
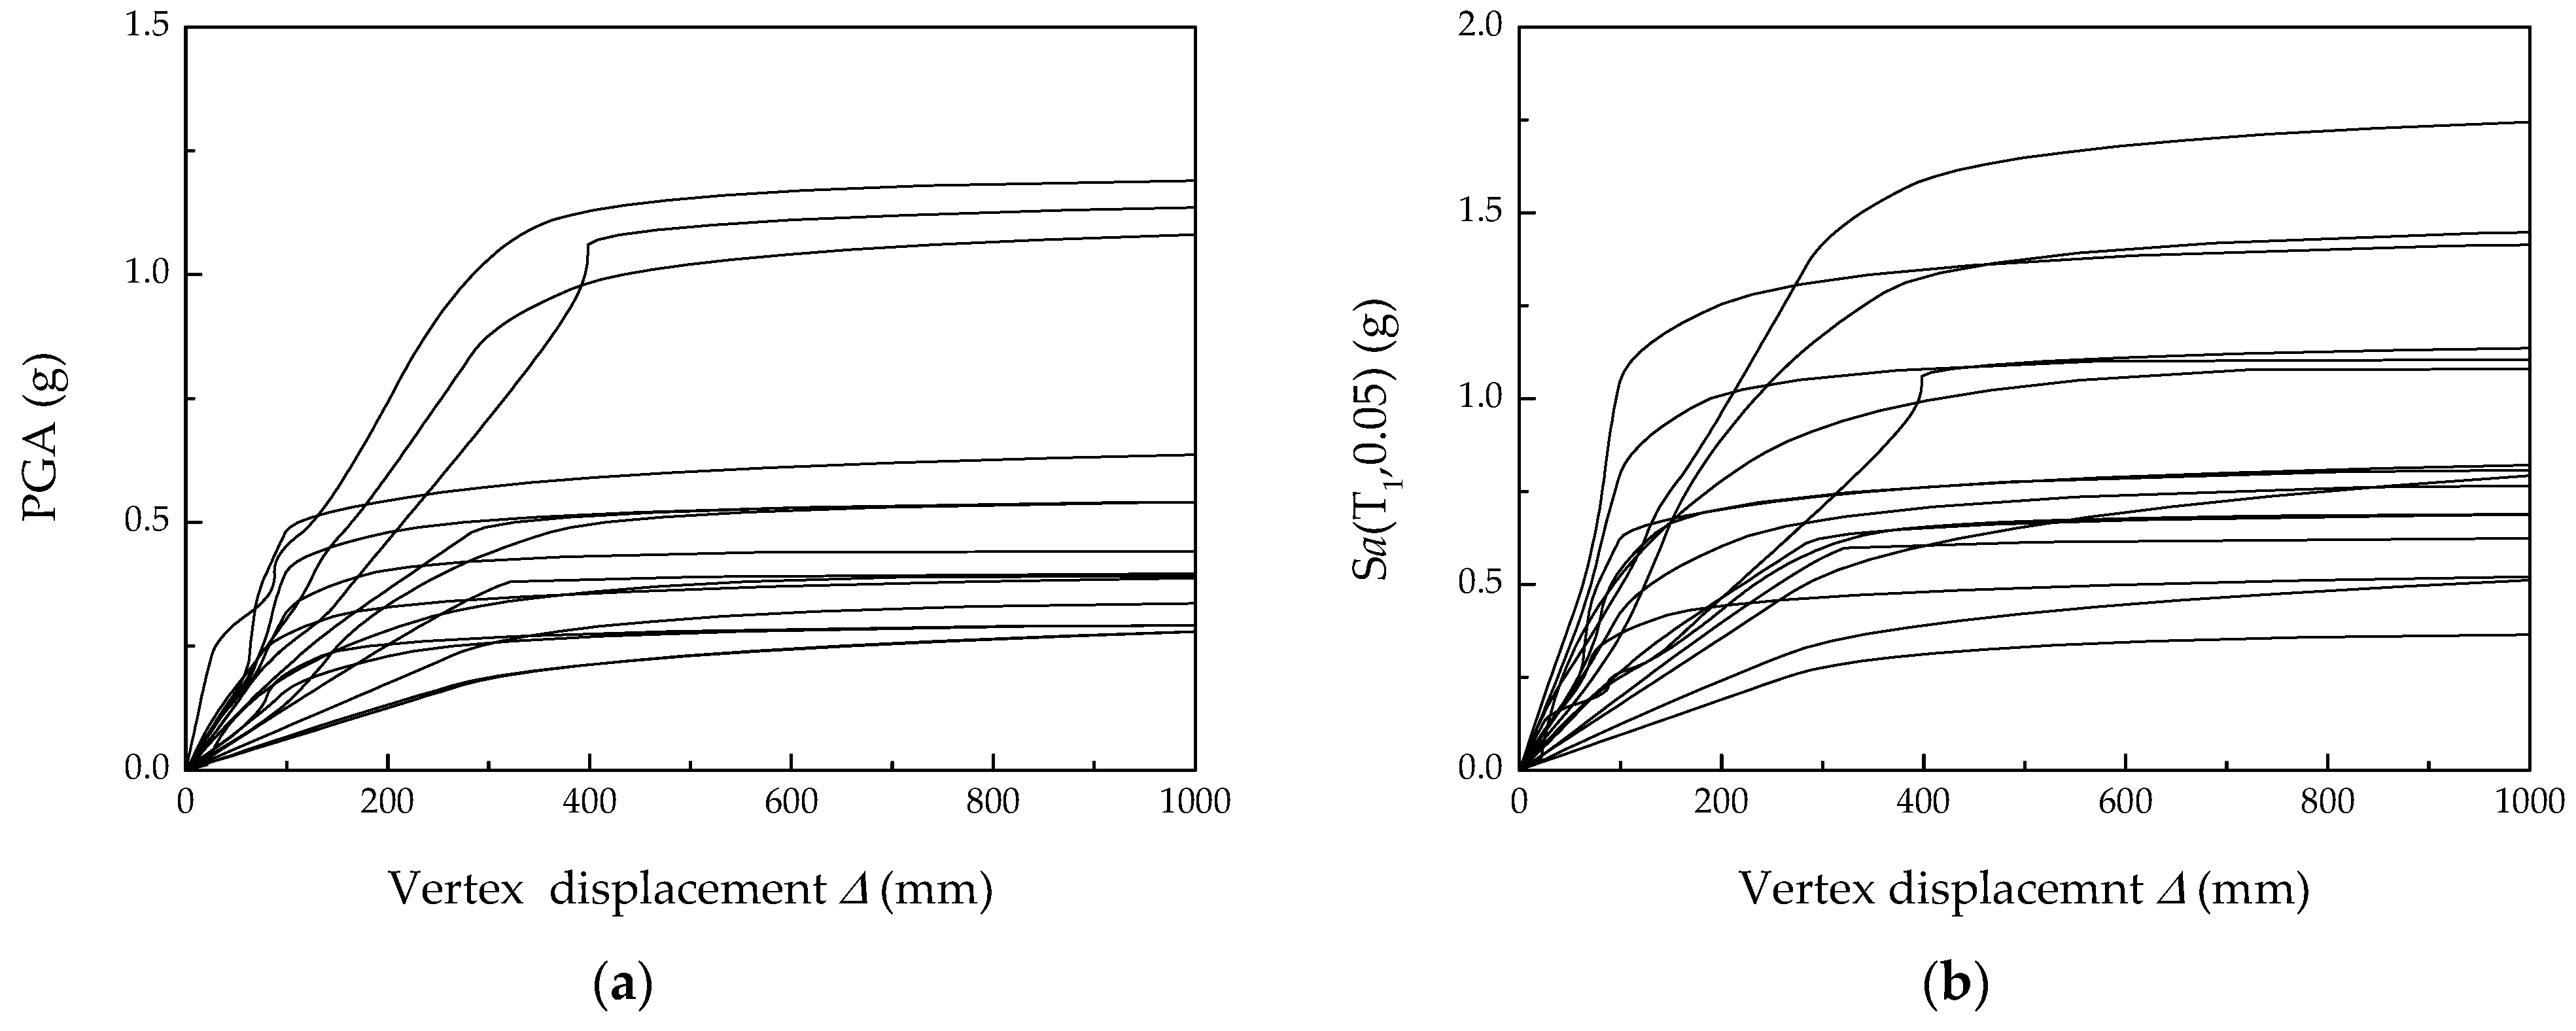
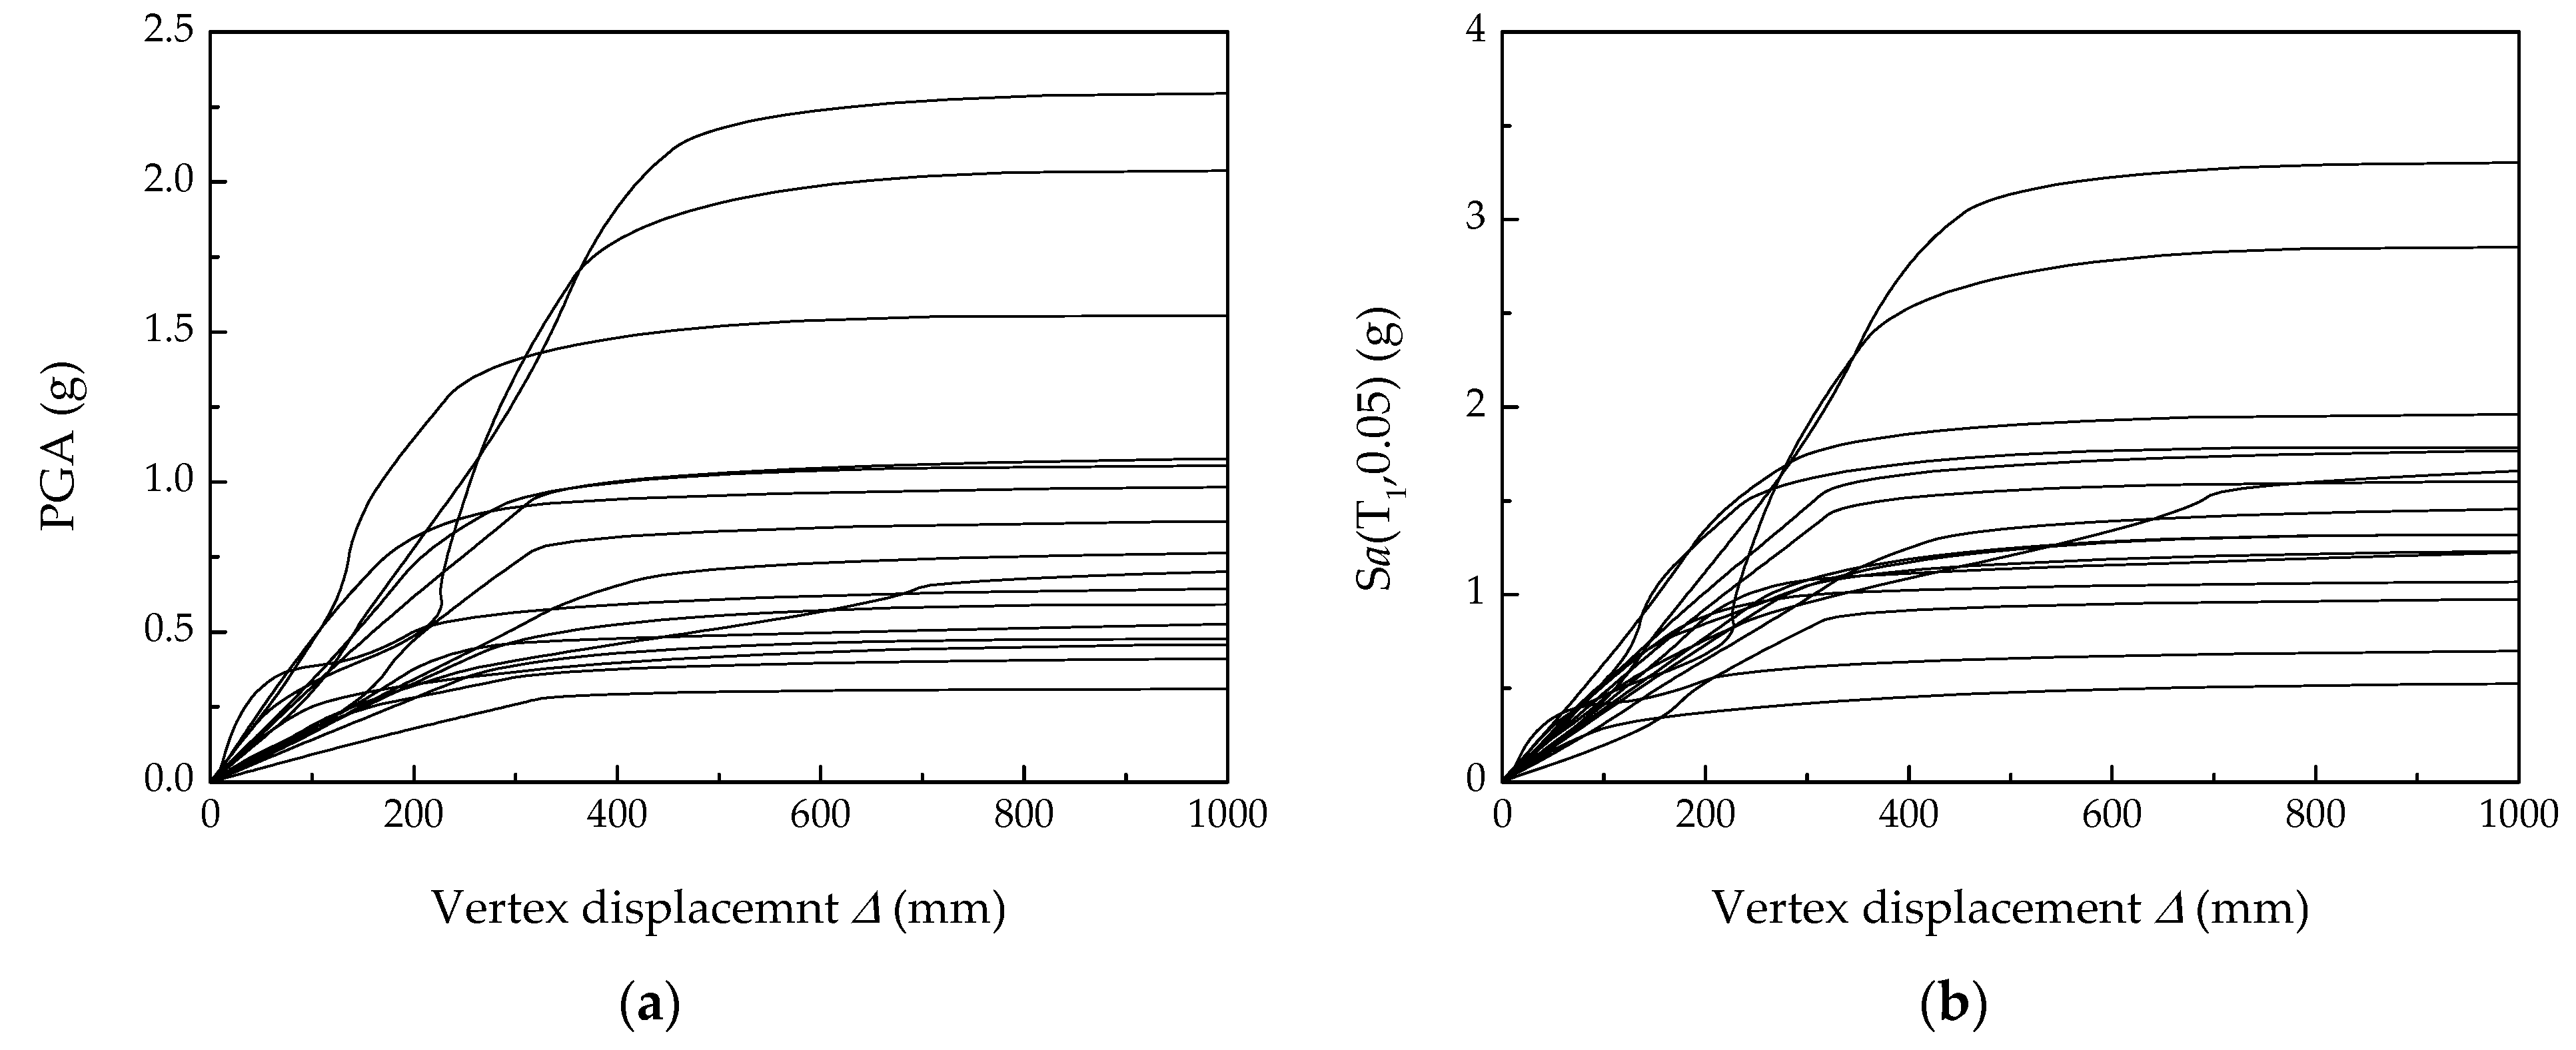
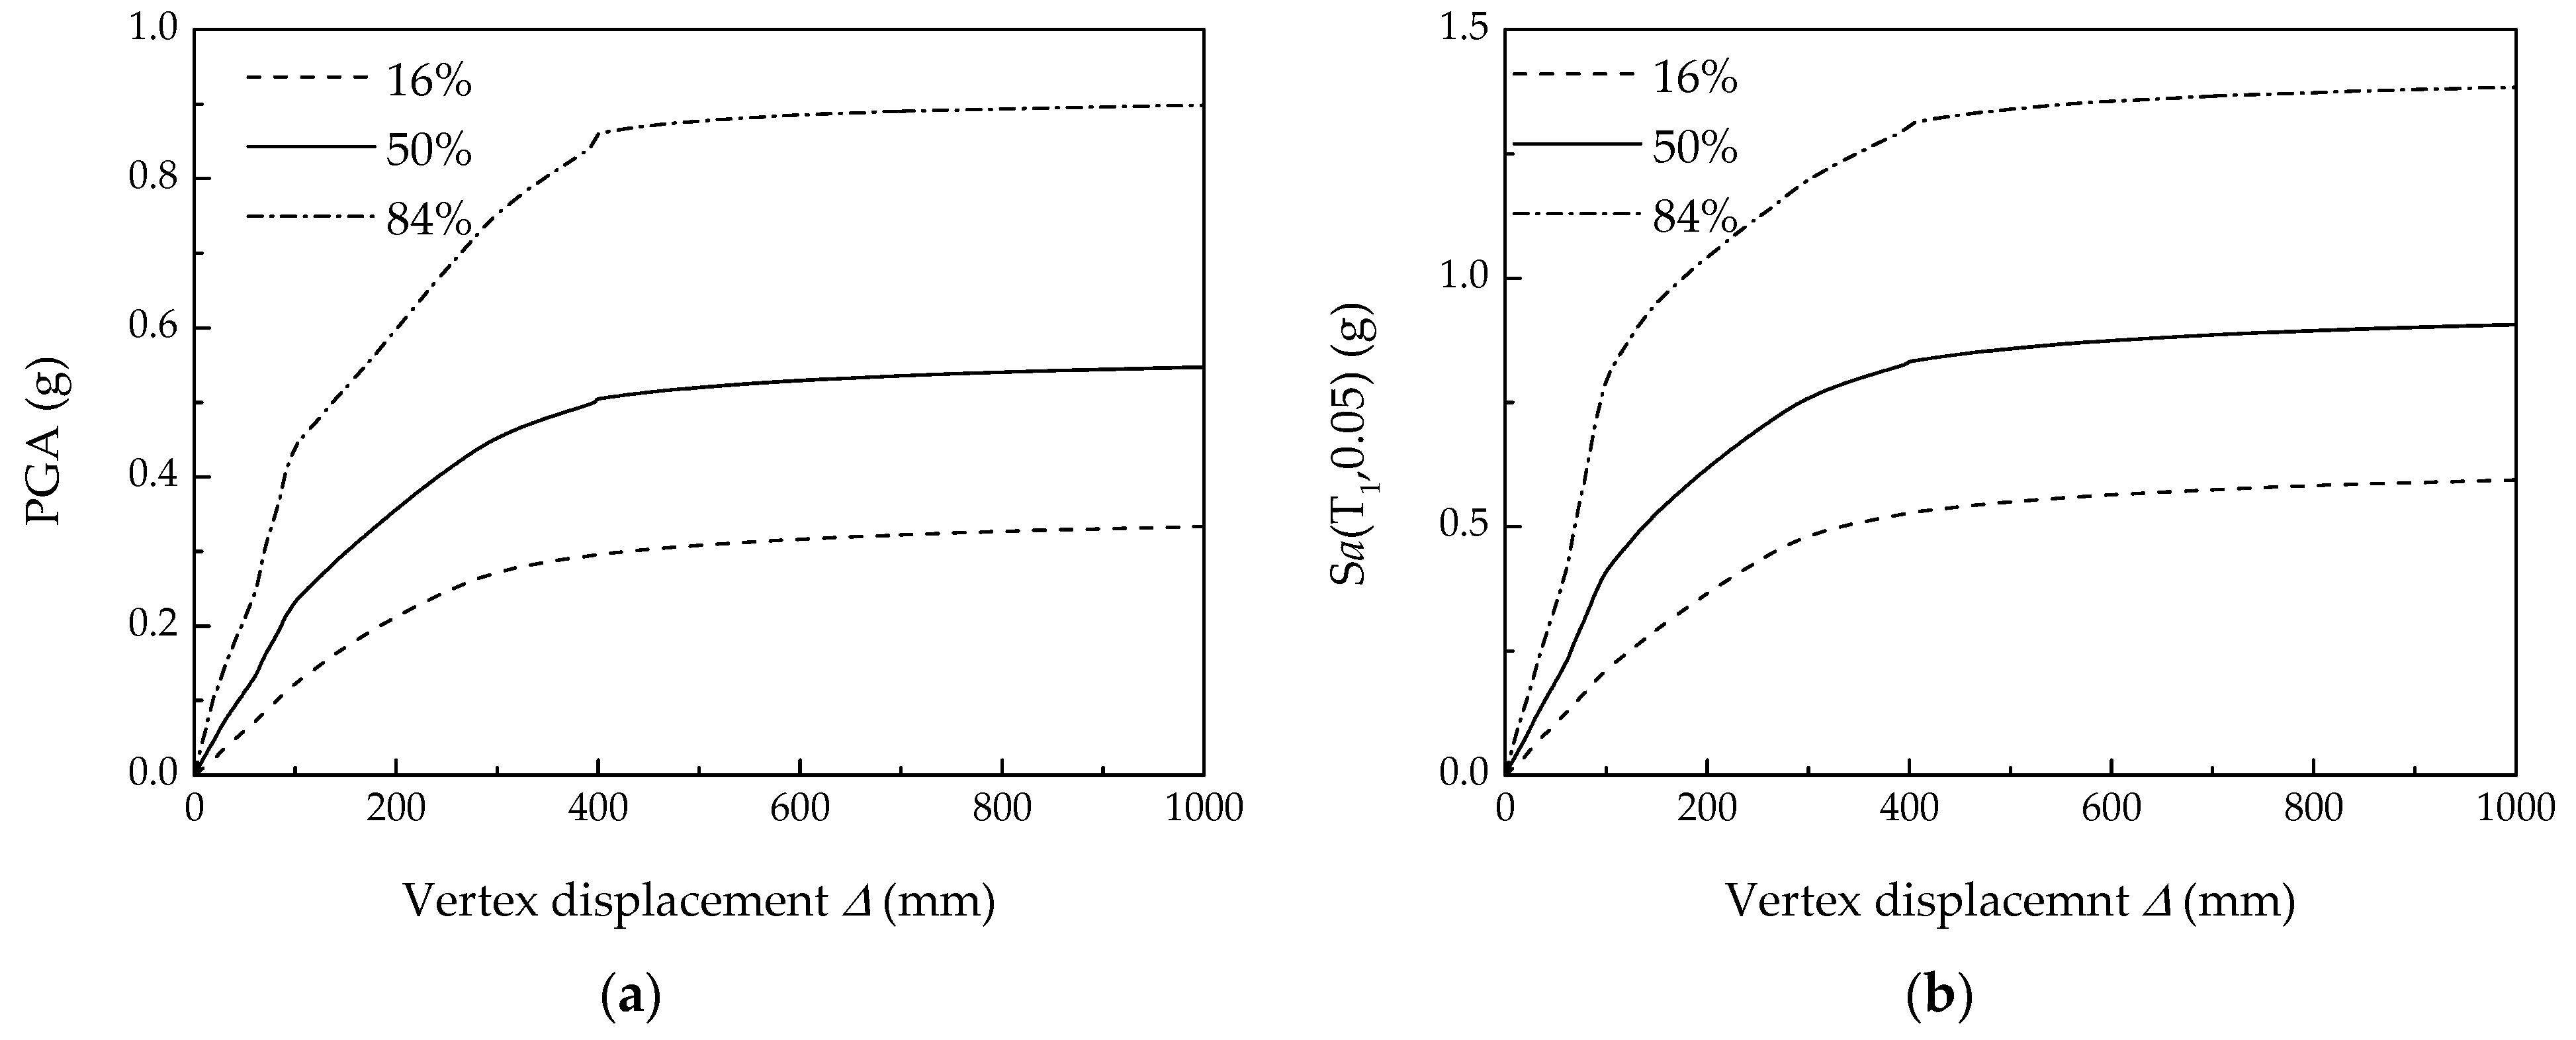
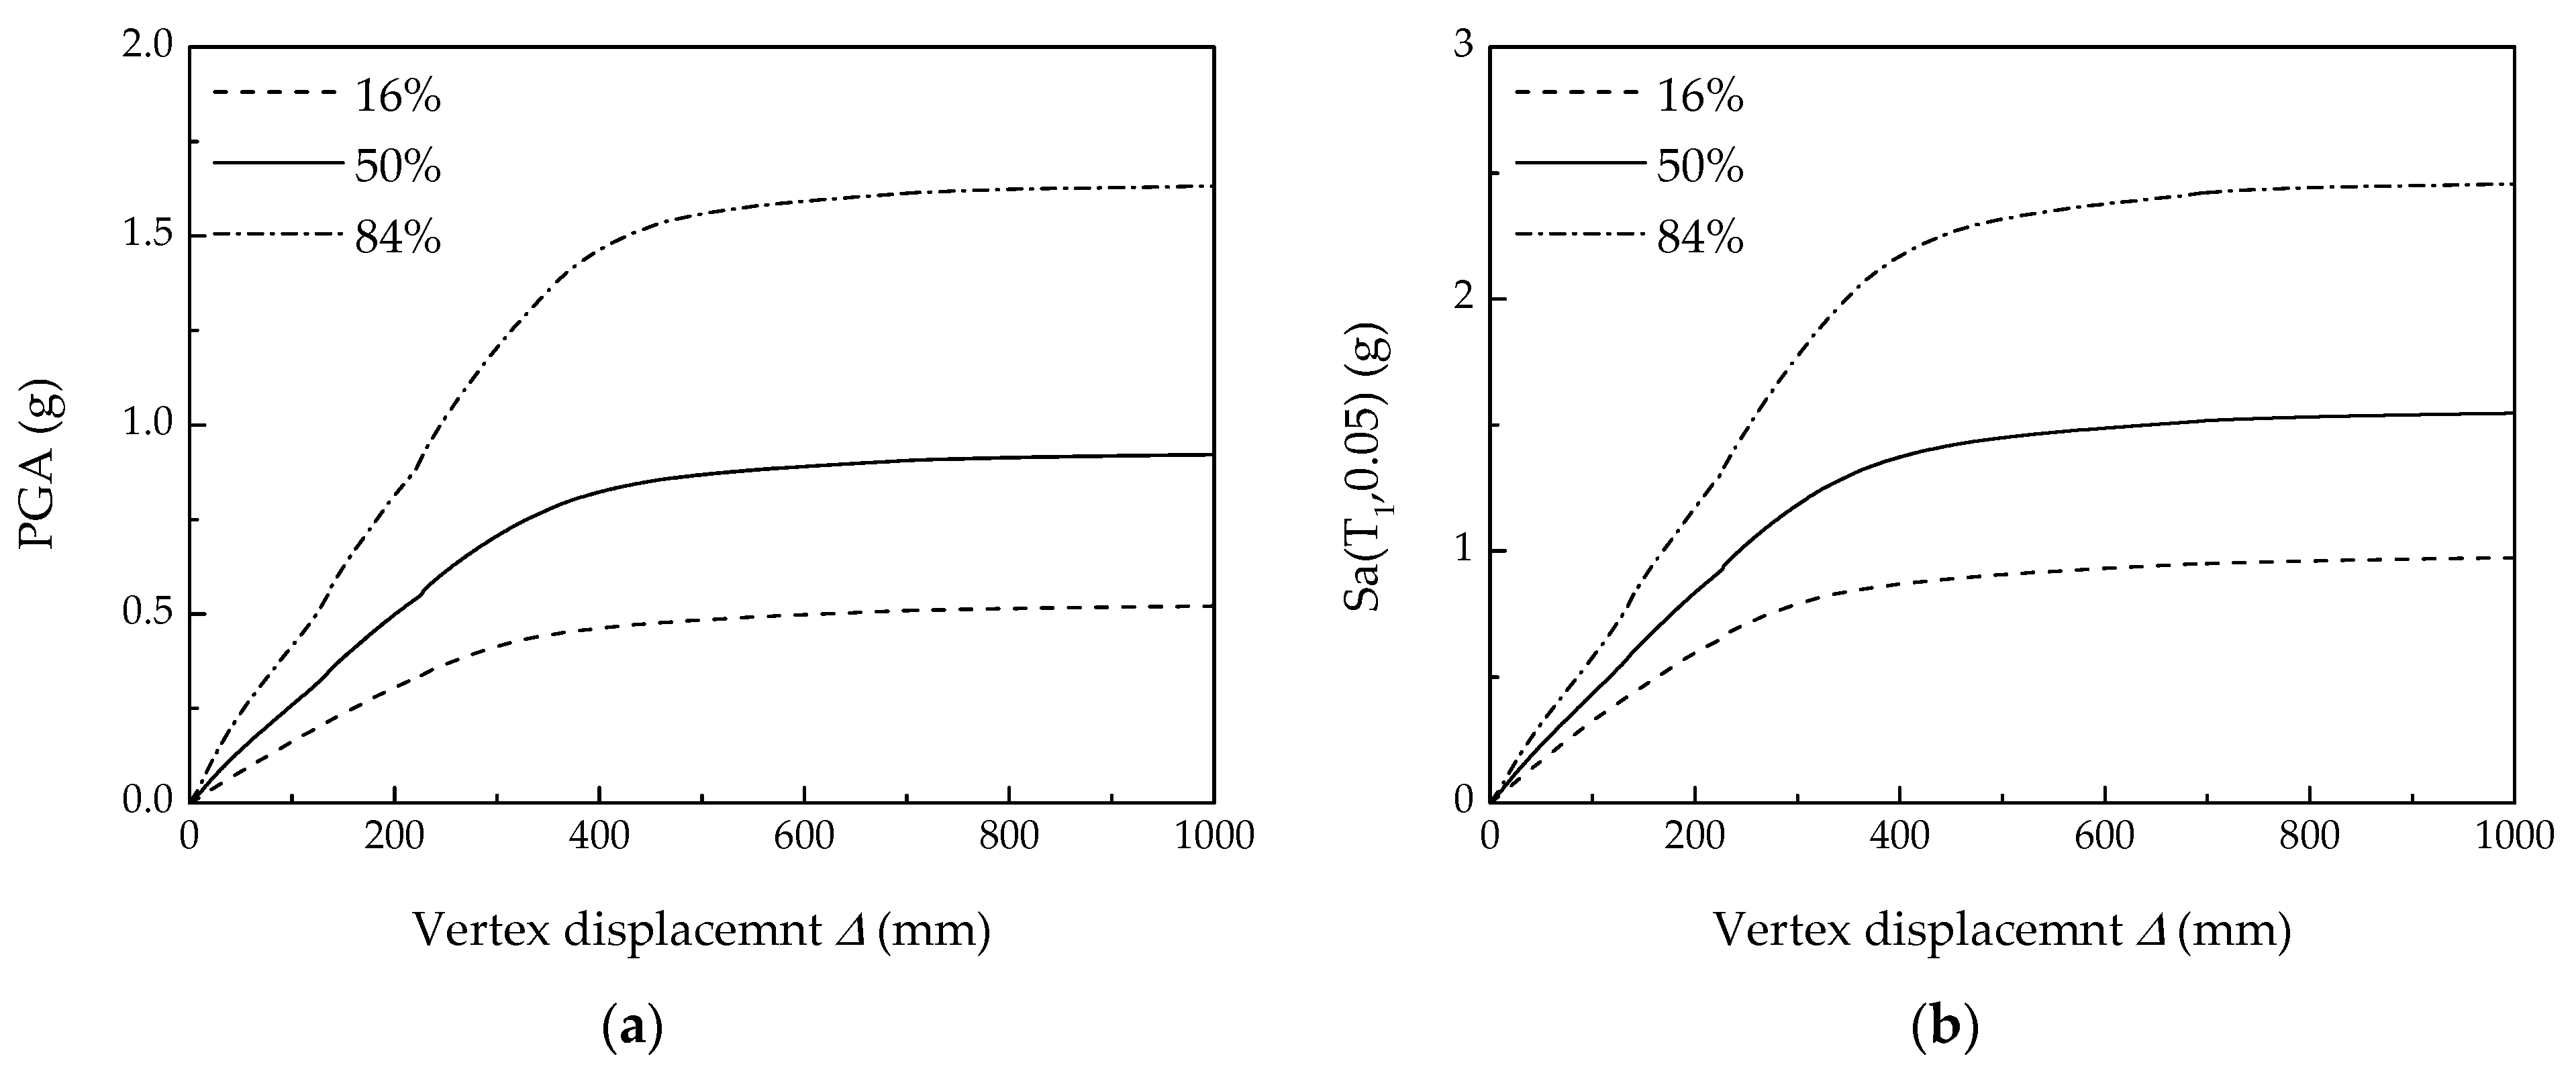
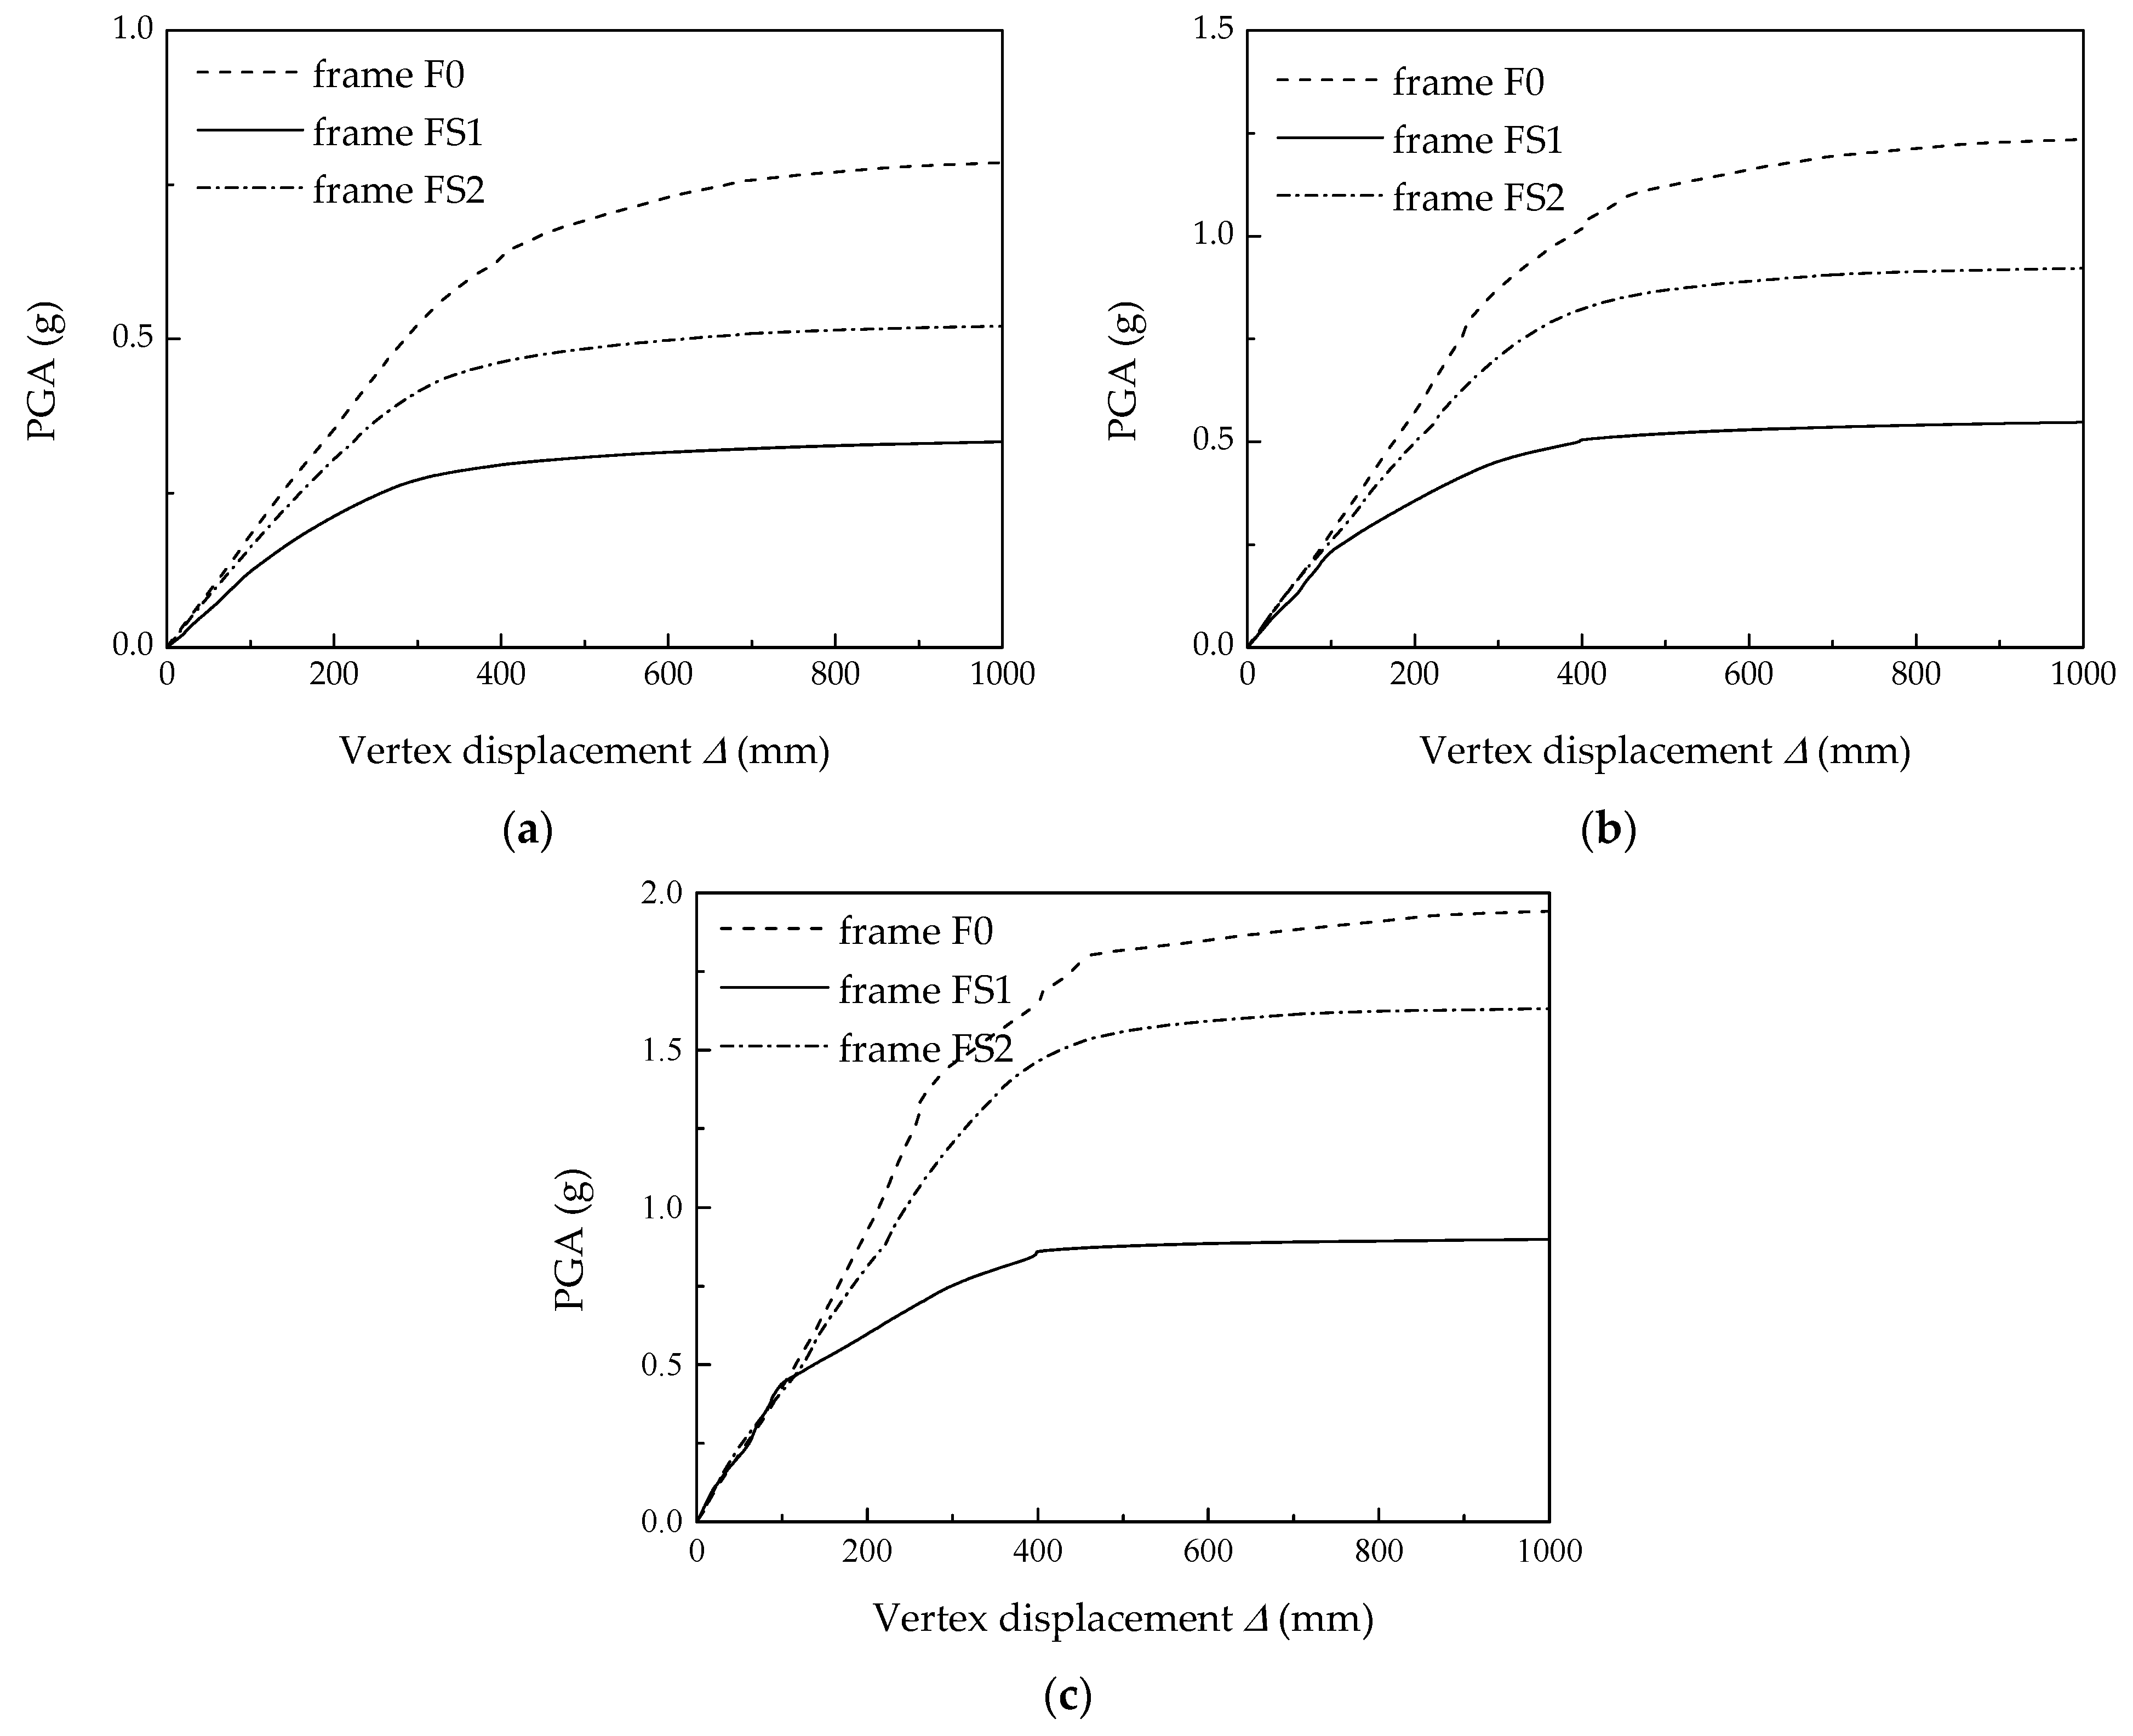
3.1. IDA Curves

Sixteen seismic waves were analyzed by IDA analysis. The IDA curve clusters were obtained, as shown in Figure 11 and Figure 12, with PGA and Sa (T1, 5%) as the y-axis and the vertex displacement Δ as the x-axis. All IDA curves were treated by spline interpolation to make the curves smoother. For the convenience of comparison, the maximum range of the abscissa was set as Δ = 1000 mm, and all the IDA curves diverged; that is, the curves entered the horizontal segment. It can be seen from the figure that all IDA curves with different shapes can be divided into two stages, the initial elastic stage and the gradual dynamic unstable stage, with increasing PGA and Sa (T1, 5%). When the structure was close to collapse, all IDA curves of frame FS2 were larger than those of frame FS1 overall. In our companion study, the frame with short columns showed less curve twisting relative to the frame without short columns. This is because the floor is a weak layer where the short columns are located and the damage is mainly concentrated in this floor, with less transfer to other floors. Therefore, the IDA curves were relatively smooth, and most of them were in the softening mode. In addition, it can be seen from the figure that the IDA curve cluster using Sa (T1, 5%) as the IM was less discrete than the IDA curve cluster represented by PGA. Especially in the initial stage, the IDA curve cluster represented by Sa (T1, 5%) as the IM was obviously more “clustered”, which is consistent with the conclusions obtained in our companion study.
The above IDA curve cluster was statistically analyzed by the direct method to determine the probability, and the quantile lines at different percentages (16%, 50% and 84%) of Δ-PGA and Δ-Sa (T1, 5%) of frames with ECC/RC short columns were obtained, as shown in Figure 13 and Figure 14. The quantile IDA curves at different percentages of frame FS1 with RC short columns were all under those of the corresponding frame FS2 with ECC short columns, indicating that the ground notion level of frame FS1 was lower than that of frame FS2.
Figure 15 shows the IDA curves of the RC frames with either RC or ECC short columns (FS1 and FS2, respectively) and the pure RC frame (F0) at each quantile. It can be seen that the three frames were in an elastic state at a low level of PGA. The 16% quantile IDA curve corresponding to frame FS1 with the RC short columns was slightly lower than that of frames F0 and FS2, while the 50% and 84% quantile IDA curves of the three frames were similar at the initial stage. The slope of the IDA curve corresponding to frame FS1 first decreased rapidly and then plateaued. The IDA curve of frame FS2 was lower than that of RC frame F0, indicating that the maximum ground motion level of the frame with ECC short columns was larger than that of the frame with RC short columns, whereas the curve of FS2 was lower than that of the pure RC frame F0. It should be noted that the short column effect should be avoided in design. When the frames closely entered the collapse level, frame FS2 with ECC short columns had a larger vertex displacement than frame FS1 with RC short columns. The vertex displacement of FS2 was close to that of the pure RC frame F0, indicating that the use of ECC to strengthen short columns can improve the overall deformation capacity of the frame structure under earthquake loading to a certain extent.

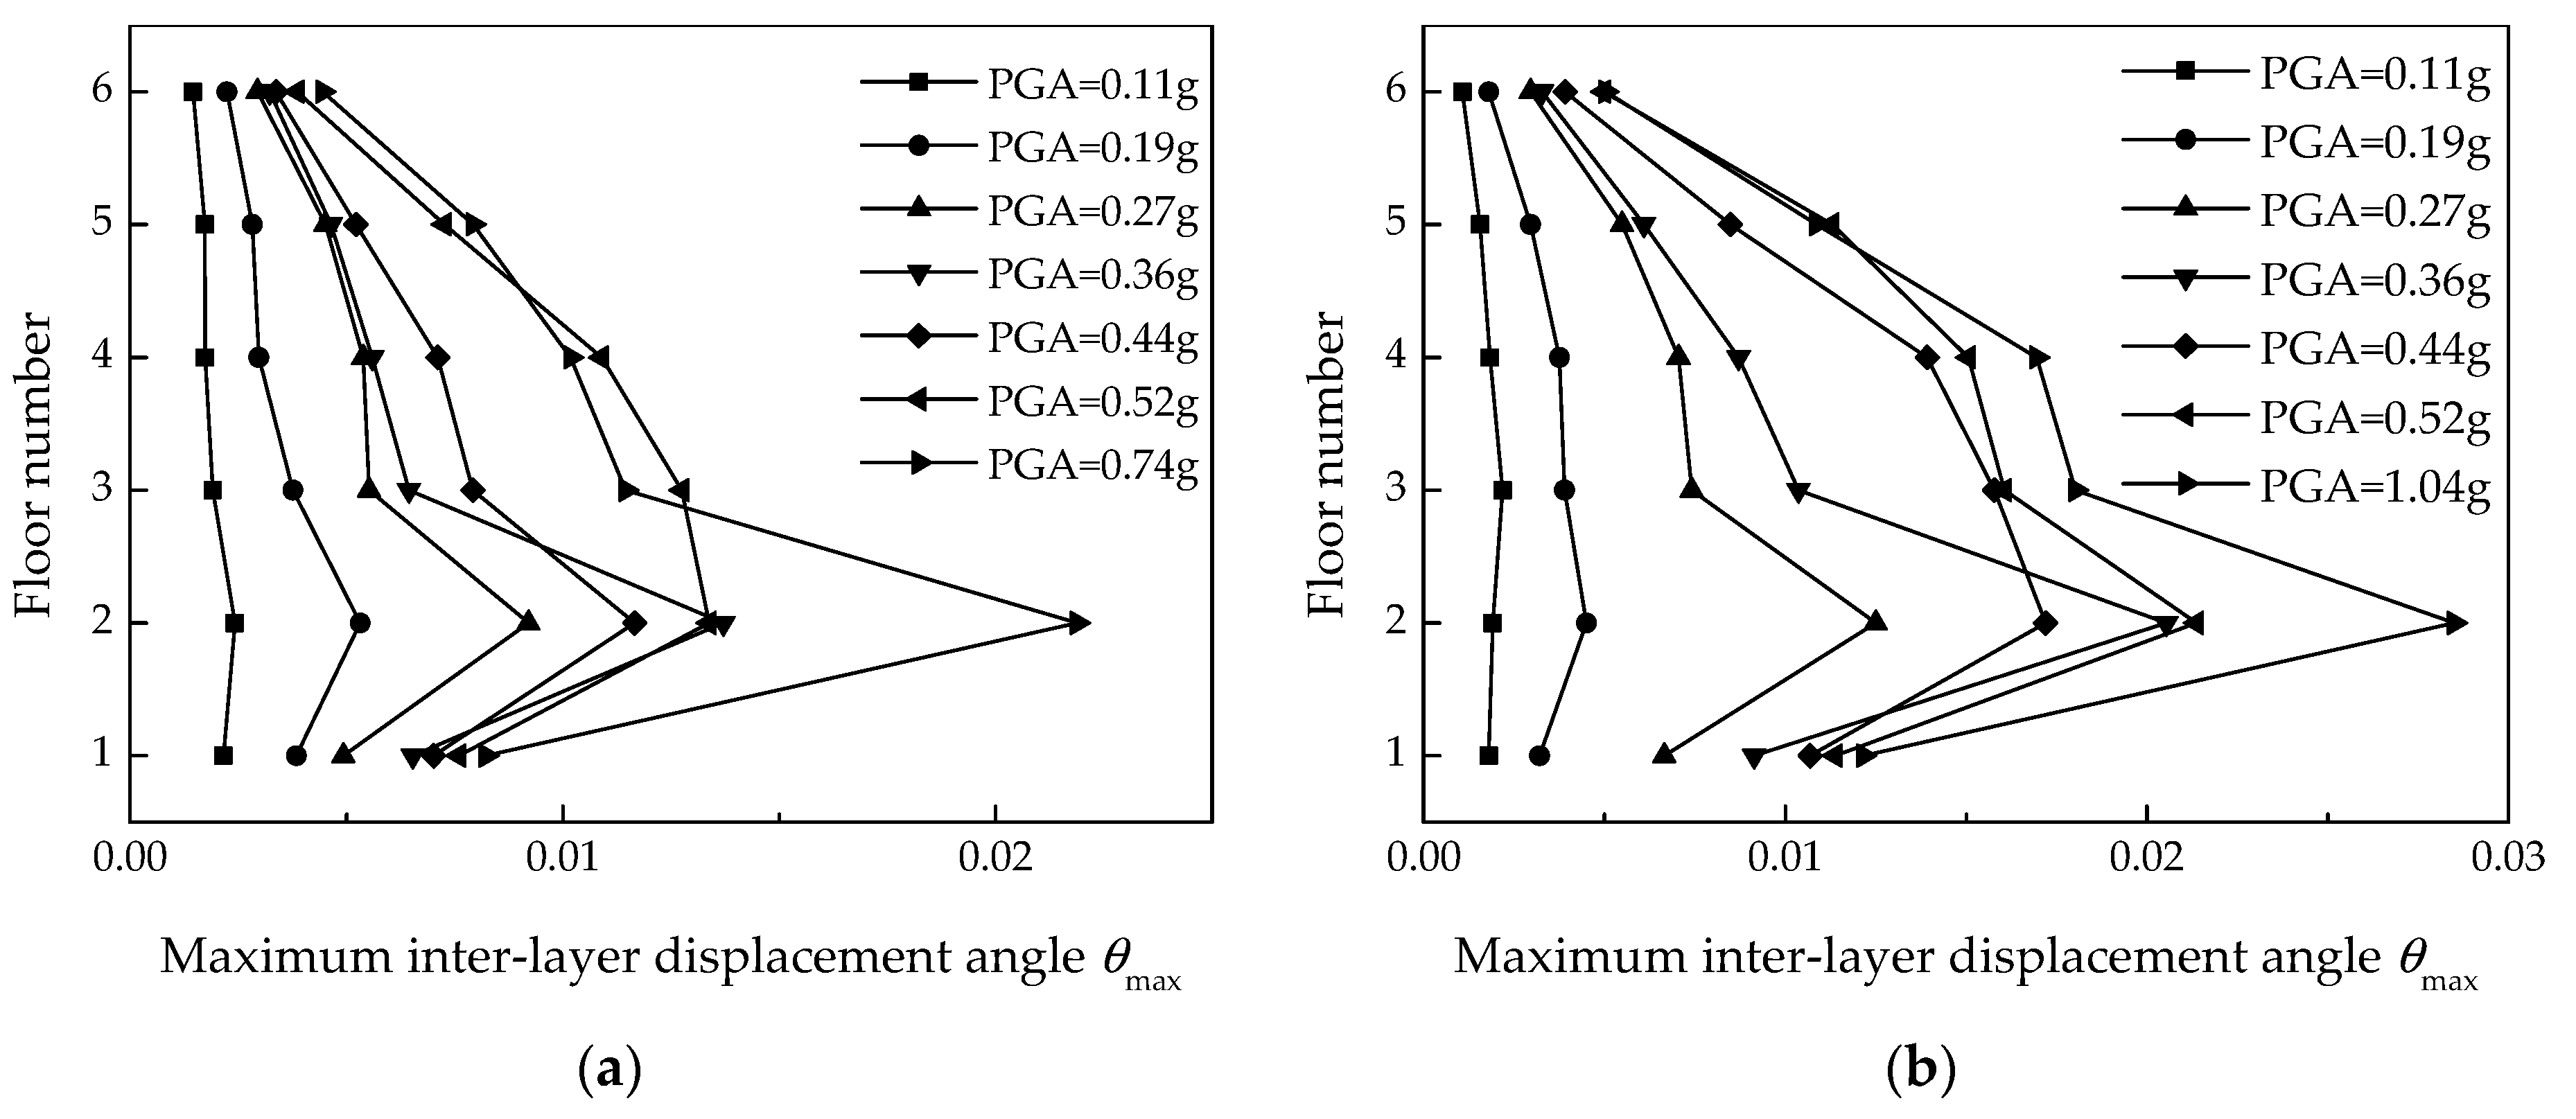
3.2. Interfloor Displacement Angle Distribution

Due to the short column effect, when the frame is close to collapse under the action of seismic waves, the maximum interlayer displacement angle is basically in the weak layer where the short column is located. One representative seismic wave was selected to investigate the variation of the interlayer displacement angle distribution of the two frames with increasing PGA. Envelope diagrams of the displacement angle between each floor of frames FS1 and FS2 are shown in Figure 16, which are plotted after amplitude modulation with different proportional coefficients of seismic waves. It can be seen from the figure that when PGA was small, the displacement angle of each floor of the two frames was also small and evenly distributed. With increasing PGA, the second floor where the short columns of frames FS1 and FS2 were located showed the greatest deformation. Due to the poor ductility of the short columns, a weak layer formed in the frame until the structure was close to collapse. The maximum interlayer displacement angle of the second floor was the largest during the whole process, and the frame finally collapsed due to the excessive horizontal displacement of the weak layer. Since the position of the maximum interlayer displacement angle of frames FS1 and FS2 did not constantly change, the IDA curve shape served as a softening mode.

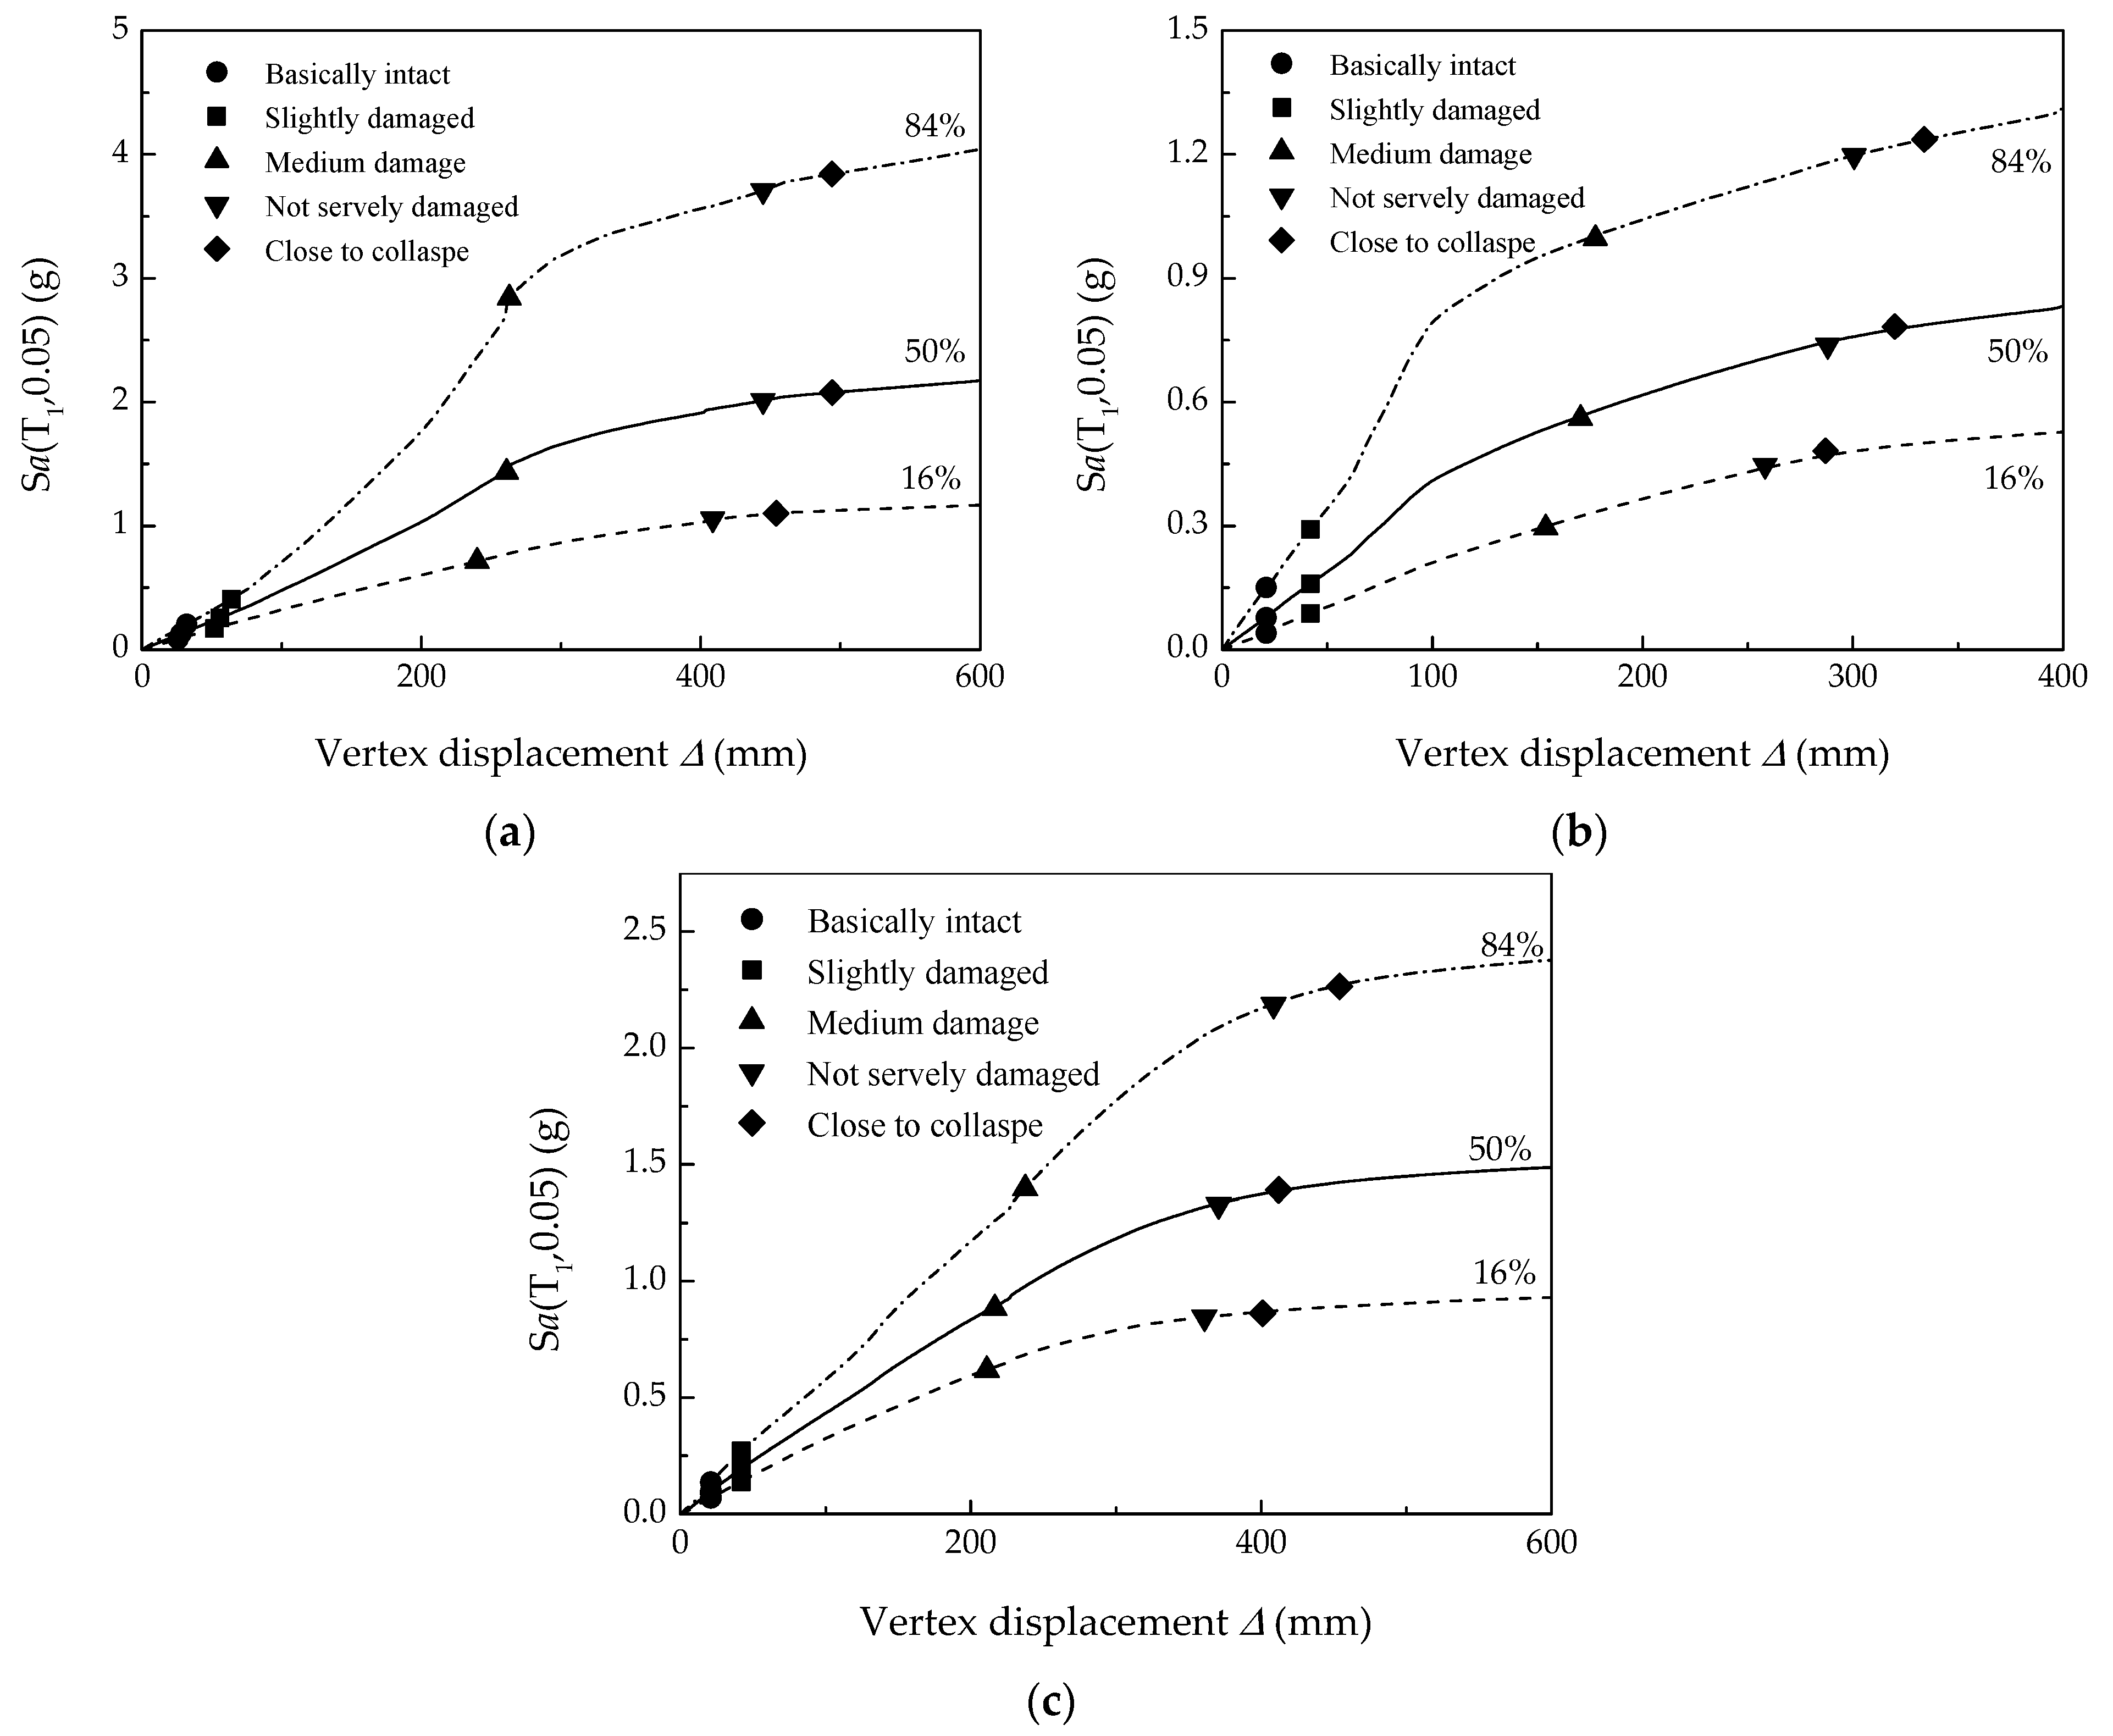
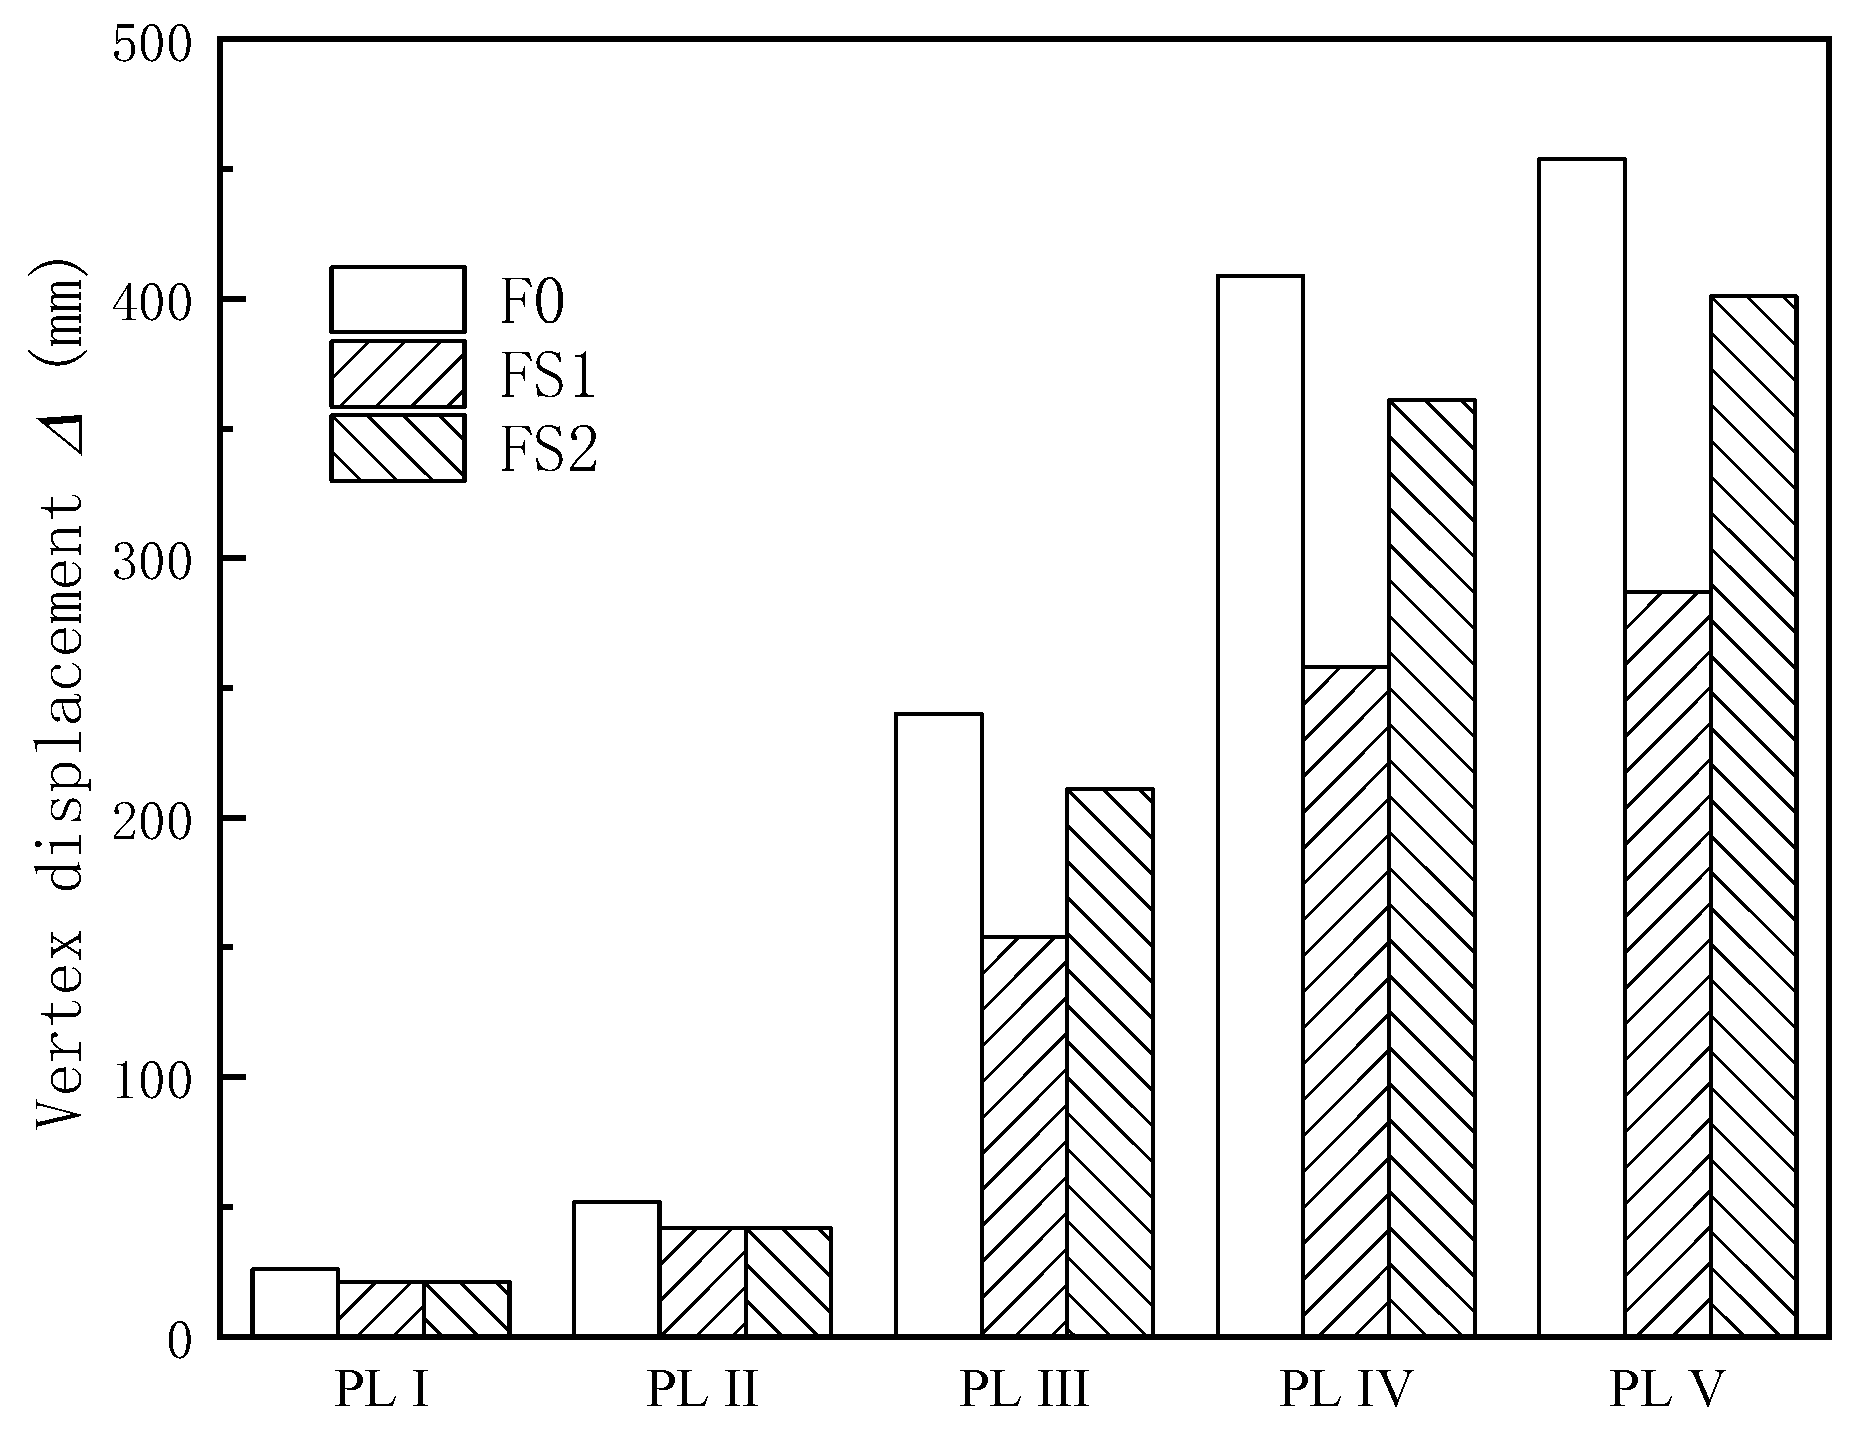
3.3. Limit State of Vertex Displacement

Per GB50011-2010 [44] and GB/T 24335-2009 [46], the seismic performance of the RC frame is classified into five levels, “basically intact”, “slightly damaged”, “medium damage”, “not severely damaged” and “close to collapse”. In this section, statistical analysis was performed on the 16%, 50% and 84% quantile IDA curves of the pure RC frame F0 and the two frames with short columns FS1 and FS2. The vertex displacement Δ was used as the DM to determine the performance level, as shown in Figure 17. It can be seen from the figure that the vertex displacements Δ of the IDA curves corresponding to performance levels of “basically intact” and “slightly damaged” at the 16%, 50% and 84% quantiles of each frame were basically the same; that is, the elastic deformation limit was the same. However, the vertex displacement Δ corresponding to performance levels of “medium damage”, “not severe damage” and “close to collapse” in the three-quantile IDA curves increased with increasing quantiles. Considering the safety of the structures, the deformation limit corresponding to the IDA curve at the 16% quantile can be taken conservatively as the maximum vertex displacement limit calculated by IDA.
The limits of maximum vertex displacement calculated by IDA at each performance level are listed in Table 2 and Figure 18. Due to the high linear stiffness of the short columns, the vertex displacement limit of frames FS1 and FS2 was slightly less than that of pure RC frame F0 at the “basically intact” performance level (level I). The deformation limit of the frame under the “slightly damaged” performance level (level II) was mainly associated with the cracking capacity of the members; thus, the size and rules corresponding to the “slightly damaged” level were basically consistent with those for the “basically intact” performance level. In this paper, it is a reasonable assumption to adopt twice the elastic deformation recommended in the specification as the limit deformation under “slightly damaged”. At the “close to collapse” performance level (level V), the frames may be at a very high risk of being collapsed when their vertex displacements reach the limit value at performance level V listed in Table 2. The limit value of vertex displacement of the RC frame was approximately 450 mm, while the limit value of vertex displacement of the RC frame with the RC short columns (frame FS1) was only 1/3 of that of the ordinary frame. This result indicated that the existence of the short column effect greatly weakened the overall deformation capacity of the frame under the earthquake effect leading to the structure being more vulnerable to collapse, and thus, it should be avoided as much as possible in the seismic structure. Frame FS2 with ECC short columns had a vertex displacement of 401 mm, which was slightly smaller than the ordinary RC frame and was approximately 1.4 times larger than frame FS1. The vertex displacement of frame FS2 was greatly improved relative to frame FS1, indicating that the employment of ECCs could improve the deformation capacity and seismic performance of the frame structure. The vertex displacement limit corresponding to the “medium damaged” performance level (level III) is the mean value of the elastic deformation and elastoplastic deformation limit. The vertex displacement limit corresponding to the “severely damaged” performance level (level IV) is 0.9 times the elastoplastic deformation limit, and its law is consistent with the “close to collapse” performance point.
Through the above comparison, it can be seen that the RC frames with the short columns formed a weak layer on the floor where the short columns were located so that the damage to the structure was mainly concentrated in this layer under the earthquake effect, which greatly weakened the seismic performance of the structure. The ECC short columns had better ductility than the RC short columns, and thus, short columns with ECC material can improve the seismic performance of the structure to a certain extent and make the overall deformation capacity of the structure close to that of the ordinary RC frames. However, due to the concentrated damage, the seismic performance of frames with short columns is still weaker than that of ordinary frames. For short columns in existing frames, the replacement of concrete with ECC material can be used as a method of reinforcement and renovation.

4. Conclusions

In this paper, three RC frames, a pure RC frame and two RC frames with short columns, were modeled by IDA to evaluate the seismic performance of RC frames with short columns. The short columns were modeled with normal concrete and ECC. The indices PGA and Sa (T1, 5%) were selected as the IM, and the maximum vertex displacement Δ was selected as the DM for the mode analysis of RC frames with short columns. The following conclusions can be drawn:
(i) With increasing PGA and Sa (T1, 5%), all IDA curves with different seismic waves can be divided into two stages, the initial elastic stage and the gradual dynamic unstable stage. The IDA curves at different quantile lines all showed that frame FS1 with RC short columns had the lowest IDA curve, and the IDA curve of FS2 with ECC short columns was between those of the curves of F0 and FS2. At the very beginning, the IDA curves of FS1 and FS2 were very close. However, when the frames closely entered the collapse level, the IDA curve of FS2 was significantly higher than that of FS1 and close to that of F0.
(ii) At the “close to collapse” performance level, the limit value of vertex displacement of F0 was approximately 450 mm, while the limit value of vertex displacement of FS1 was only 1/3 of that of the ordinary frame. This result indicated that an RC frame with short columns formed a weak layer on the floor where the short columns were located so that the damage to the structure was mainly concentrated in this layer under the earthquake effect, which greatly weakened the seismic performance of the structure leading to the structure being more vulnerable to collapse.
(iii) Based on the IDA analysis, the limit values of vertex displacements of FS1 and FS2 at performance levels I and II, at which the structures were “basically intact” and “slightly damaged”, are almost the same and are slightly lower than that of F0 due to the high linear stiffness of the short columns. The limit values of vertex displacements of FS2 began to surpass that of FS1 at performance level III, and the gap further widened at performance levels IV and V. Frame FS2 with the ECC short column had a vertex displacement of 401 mm at performance level V, which was slightly smaller than the ordinary RC frame and was approximately 1.4 times larger than frame FS1, indicating that the vertex displacement of frame FS2 was greatly improved relative to frame FS1.
(iv) The above analysis indicated that the use of the ECC possessing 3% strain capacity and the same grade of compressive strength as normal concrete in the construction of short columns can significantly improve the seismic performance of the frame structure by about 40% relative to RC short columns, whose overall deformation capacity was close to that of the pure RC frame at the collapse level. This result can also provide insight into the repairing and retrofitting of short columns in existing frames by replacing concrete with ECC materials.

Author Contributions

Conceptualization, C.W.; investigation, C.W., Y.S. and C.J.; methodology, C.W. and Y.S.; writing—original draft preparation, C.W. and Y.S.; writing—review and editing, C.W., C.J. and Z.P.; supervision, S.M.; funding acquisition, C.W. All authors have read and agreed to the published version of the manuscript.

Funding

This research was funded by the National Natural Science Foundation of China (No. 52108119, No. 52078368) and Natural Science Foundation of Jiangsu Province (No. BK20200376).

Data Availability Statement

The data presented in this study are available on request from the corresponding authors.

Conflicts of Interest

The authors declare no conflict of interest.

References

  1. Dogangun, A. Performance of reinforced concrete buildings during the May 1, 2003 Bingol Earthquake in Turkey. Eng. Struct. 2004, 26, 841–856. [Google Scholar] [CrossRef]
  2. Gu, X.; Hua, J.; Cai, M. Seismic responses of reinforced concrete intermediate short columns failed in different modes. Eng. Struct. 2020, 206, 110173. [Google Scholar] [CrossRef]
  3. Li, Y.; Huang, Y.; Hwang, S. Seismic response of reinforced concrete short columns failed in shear. ACI Struct. J. 2014, 111, 945–954. [Google Scholar] [CrossRef] [Green Version]
  4. Caglar, N.; Mutlu, M. Failure analysis of reinforced concrete frames with short column effect. Comput. Concr. 2009, 6, 403–419. [Google Scholar] [CrossRef]
  5. Wu, C.; Su, Y.; Sun, Y.; Jin, C.H.; Pan, Z.F. Sectional Analysis of Reinforced Engineered Cementitious Composite Columns Subjected to Combined Lateral Load and Axial Compression. Front. Mater. 2022, 9, 135–149. [Google Scholar] [CrossRef]
  6. Li, B.Q.; Tian, M.W.; Mo, S.T.; Wang, Z. Investigation to the Origin and Damages of RC Captive Columns during Earthquakes. Earthq. Resist. Eng. Retrofit. 2014, 3, 120–127. [Google Scholar]
  7. Li Victor, C. Miromechanics of Crack Bridging in Fiber-Reinforced Concrete. Mater. Struct. 1993, 26, 486–494. [Google Scholar]
  8. Qudah, S. and M. Maalej. Application of Engineered Cementitious Composites (ECC) in interior beam–column connections for enhanced seismic resistance. Eng. Struct. 2014, 69, 235–245. [Google Scholar] [CrossRef]
  9. Zhang, J.; Leung, C.; Gao, Y. Simulation of crack propagation of fiber reinforced cementitious composite under direct tension. Eng. Fract. Mech. 2011, 78, 2439. [Google Scholar] [CrossRef]
  10. Zhang, P.; Su, Y.L.; Liu, Y.; Gao, D.Y.; Sheikh, S.A. Flexural behavior of GFRP reinforced concrete beams with CFRP grid-reinforced ECC stay-in-place formworks. Compos. Struct. 2021, 277, 114653. [Google Scholar] [CrossRef]
  11. Liu, H.Z.; Zhang, Q.; Gu, C.S.; Su, H.Z.; Li, V. Influence of microcrack self-healing behavior on the permeability of Engineered Cementitious Composites. Cem. Concr. Compos. 2017, 82, 14–22. [Google Scholar] [CrossRef]
  12. Xu, L.Y.; Huang, B.T.; Dai, J.G. Development of engineered cementitious composites (ECC) using artificial fine aggregates. Constr. Build. Mater. 2021, 305, 124742. [Google Scholar] [CrossRef]
  13. Yıldırım, G.; Zturk, O.; Ulugl, H.; Hatem, M.; Ahmaran, M. Determination of Autogenous Self-healing Capability of Cementitious Composites Through Non-destructive Testing. In RILEM Spring Convention and Conference; Springer: Berlin/Heidelberg, Germany, 2021; Volume 33, pp. 25–38. [Google Scholar]
  14. Zheng, Y.; Zhang, L.F.; Xia, L.P. Investigation of the behaviour of flexible and ductile ECC link slab reinforced with FRP. Constr. Build. Mater. 2018, 166, 694–711. [Google Scholar] [CrossRef]
  15. Huang, B.T.; Zhu, J.X.; Weng, K.F.; Li, V.C.; Dai, J.G. Ultra-high-strength engineered/strain-hardening cementitious composites (ECC/SHCC): Material design and effect of fiber hybridization. Cem. Concr. Comp. 2022, 129, 104464. [Google Scholar] [CrossRef]
  16. Huang, B.T.; Weng, K.F.; Zhu, J.X.; Xiang, Y.; Dai, J.G.; Li, V.C. Engineered/strain-hardening cementitious composites (ECC/SHCC) with an ultra-high compressive strength over 210 MPa. Compos. Commun. 2021, 26, 100775. [Google Scholar] [CrossRef]
  17. Ranade, R. Advanced Cementitious Composites Development for Resilient and Sustainable Infrastructure; University of Michigan: Ann Arbor, MI, USA, 2018. [Google Scholar]
  18. Kanda, T.; Lin, Z.; Li, V.C. Application of Pseudo Strain-hardening Cementitious Composites to Shear Resistant Structural Elements. In Fracture Mechanics of Concrete Structures: Proceedings FRAMCOS-3; AEDIFICATIO Publishers: Freibury, Germany, 1988; pp. 1477–1490. [Google Scholar]
  19. Xoxa, V. Investigating the Shear Characteristics of High Performance Fiber Reinforced Concrete; University of Toronto: Toronto, ON, Canada, 2003. [Google Scholar]
  20. Van Zijl, G.P. Improved mechanical performance: Shear behaviour of strain-hardening cement-based composites (SHCC). Cem. Concr. Res. 2008, 37, 1241–1247. [Google Scholar] [CrossRef]
  21. Wu, C.; Pan, Z.F.; Kim, K.S.; Meng, S.P. Theoretical and Experimental Study of Effective Shear Stiffness of Reinforced ECC Columns. Int. J. Concr. Struct. M 2017, 11, 585. [Google Scholar] [CrossRef]
  22. Wu, C.; Pan, Z.F.; Su, R.K.L.; Leung, C.K.Y.; Meng, S.P. Seismic behavior of steel reinforced ECC columns under constant axial loading and reversed cyclic lateral loading. Mater. Struct. 2017, 50, 78. [Google Scholar] [CrossRef]
  23. Mashshay, S.; Al-Sibahya, A. Structural Behavior of Novel ECC Short Columns Subjected to Eccentric Loading. Al-Qadisiyah J. Eng. Sci. 2020, 13, 31–36. [Google Scholar] [CrossRef]
  24. Deng, M.K.; Zhang, Y.X.; Li, Q.Q. Shear strengthening of RC short columns with ECC jacket: Cyclic behavior tests. Eng Struct. 2018, 160, 535–545. [Google Scholar] [CrossRef]
  25. Deng, M.K.; Zhang, Y.X. Seismic performance of high-ductile fiber-reinforced concrete short columns. Adv. Civ. Eng. 2018, 2018, 3542496. [Google Scholar] [CrossRef] [Green Version]
  26. Zhang, Y.X.; Deng, M.K.; Dong, Z.F. Seismic response and shear mechanism of engineered cementitious composite (ECC) short columns. Eng. Struct. 2019, 192, 296–304. [Google Scholar] [CrossRef]
  27. Zhang, Y.X.; Li, T.; Deng, M.K. Effect of splitting bond on shear response of reinforced engineered cementitious composite short columns under cyclic loading. Eng. Struct. 2022, 251, 113474. [Google Scholar] [CrossRef]
  28. Wu, C.; Pan, Z.F.; Jin, C.H.; Meng, S.P. Evaluation of deformation-based seismic performance of RECC frames based on IDA method. Eng. Struct. 2020, 211, 110499. [Google Scholar] [CrossRef]
  29. Yuan, F.; Pan, J.L.; Leung, C.K.Y. Elastoplastic time history analysis of reinforced engineered cementitious composite or engineered cementitious composite-concrete composite frame under earthquake action. Adv. Civ. Eng. 2017, 20, 491–503. [Google Scholar] [CrossRef]
  30. Lu, T.T.; Liang, X.W. Influence factors for seismic damage mechanism control of ECC frame. Earthq. Resist. Eng. Retrofit. 2021, 43, 8–16. [Google Scholar]
  31. Hosseini, F.; Gencturk, B.; Aryan, H.; Cadaval, G. Seismic behavior of 3-D ECC beam-column connections subjected to bidirectional bending and torsion. Eng. Struct. 2018, 172, 751–763. [Google Scholar] [CrossRef]
  32. Liang, X.W.; Lu, T.T. Seismic evaluation of engineered cementitious composites beam-column-slab subassemblies with various column-to-beam flexural strength ratios. Struct. Concr. 2018, 19, 735–746. [Google Scholar] [CrossRef]
  33. Xu, L.; Pan, J.L.; Leung, C.K.Y.; Yin, W.Y. Shaking table tests on precast reinforced concrete and engineered cementitious composite/reinforced concrete composite frames. Adv. Struct. Eng. 2018, 21, 824–837. [Google Scholar] [CrossRef]
  34. Vamvatsikos, D. Performing incremental dynamic analysis in parallel. Comput. Struct. 2011, 89, 170–180. [Google Scholar] [CrossRef]
  35. Cao, X.Y.; Feng, D.C.; Wang, Z.; Wu, G. Parametric investigation of the assembled bolt-connected buckling-restrained brace and performance evaluation of its application into structural retrofit. J. Build Eng. 2022, 48, 103988. [Google Scholar] [CrossRef]
  36. Dolsek, M. Incremental dynamic analysis with consideration of modeling uncertainties. Earthq. Eng. Struct D 2009, 6, 805–825. [Google Scholar] [CrossRef]
  37. Pozo, J.D.; Hube, M.A.; Kurama, Y.C. Effect of material regularization in plastic hinge integration analysis of slender planar RC walls. Eng. Struct. 2021, 239, 112302. [Google Scholar] [CrossRef]
  38. Scott, M.; Ryan, K. Moment-Rotation Behavior of Force-Based Plastic Hinge Elements. Earthq. Spectra. 2013, 29, 597–607. [Google Scholar] [CrossRef] [Green Version]
  39. Ibarra, L.F.; Medina, R.A.; Krawinkler, H. Hysteretic models that incorporate strength and stiffness deterioration. Earthq. Eng. Struct. D 2005, 34, 1489–1511. [Google Scholar] [CrossRef]
  40. Lignos, D. Sidesway Collapse of Deteriorating Structural Systems under Seismic Excitations; Stanford University: Stanford, CA, USA, 2008. [Google Scholar]
  41. Lignos, D.G.; Krawinkler, H. Development and Utilization of Structural Component Databases for Performance-Based Earthquake Engineering. J Struct. Eng.-Asce. 2013, 139, 1382–1394. [Google Scholar] [CrossRef]
  42. Lignos, D.G.; Krawinkler, H. Deterioration Modeling of Steel Components in Support of Collapse Prediction of Steel Moment Frames under Earthquake Loading. J. Struct. Eng.-Asce. 2011, 137, 1291. [Google Scholar] [CrossRef] [Green Version]
  43. Wu, C.; Pan, Z.F.; Mo, Y.L.; Li, M.; Meng, S.P. Modeling of shear-critical reinforced engineered cementitious composites members under reversed cyclic loading. Struct. Concr. 2018, 19, 1689–1701. [Google Scholar] [CrossRef]
  44. GB50011-2010; National Standard of P. R. China. Code of Seismic Design of Buildings. Building Industry Press: Beijing, China, 2010.
  45. ATC-63; Quantification of Building Seismic Performance Factor (FEMA P695). US Department of Homeland Security: Washington, DC, USA, 2009.
  46. GB/T24335-2009; National Standard of P.R. China. Classification of Earthquake Damage to Buildings and Special Structures. Building Industry Press: Beijing, China, 2009.
Figure 1. Layout plan of frame (unit: mm).
Buildings 12 01834 g001
Figure 2. Vertical view of frame and reinforcement diagram (unit: mm).
Buildings 12 01834 g002
Figure 3. Finite element model of the analytical frames (unit: mm).
Buildings 12 01834 g003
Figure 4. Skeleton curve of the IMK model.
Buildings 12 01834 g004
Figure 5. Hysteretic curve of the double-line IMK model.
Buildings 12 01834 g005
Figure 6. Hysteretic curve of the maximum pointing IMK model.
Buildings 12 01834 g006
Figure 7. Hysteretic curve of the pinching effect IMK model.
Buildings 12 01834 g007
Figure 8. Skeleton curves of the RC short column and ECC short columns simulated by two models.
Buildings 12 01834 g008
Figure 9. Hysteretic curve of the RC short column. (a) SMM model; (b) IMK model.
Buildings 12 01834 g009
Figure 10. Hysteretic curve of the ECC short column. (a) SMMECC model; (b) IMK model.
Buildings 12 01834 g010
Figure 11. IDA curve cluster of frames with RC short columns. (a) PGA-Δ IDA curves; (b) Sa (T1, 5%)-Δ IDA curves.
Buildings 12 01834 g011
Figure 12. IDA curve cluster of frames with ECC short columns. (a) PGA-Δ IDA curves; (b) Sa (T1, 5%)-Δ IDA curves.
Buildings 12 01834 g012
Figure 13. 50%, 16% and 84% quantile of the IDA curves of the RC frame. (a) PGA-Δ quantile curves; (b) Sa (T1, 5%)-Δ quantile curves.
Buildings 12 01834 g013
Figure 14. 50%, 16% and 84% quantile of the IDA curves of the ECC frame. (a) PGA-Δ quantile curves; (b) Sa (T1, 5%)-Δ quantile curves.
Buildings 12 01834 g014
Figure 15. Comparison of the IDA curves of the three different frames. (a) 16% quantile; (b) 50% quantile; (c) 84% quantile.
Buildings 12 01834 g015
Figure 16. Envelope diagram of the interlayer displacement angle of two frames with short columns under different earthquake effects. (a) Frame FS1 with RC short columns; (b) Frame FS2 with ECC short columns.
Buildings 12 01834 g016
Figure 17. Determination of the performance points on the IDA curve of each frame. (a) RC frame F0; (b) Frame with RC short columns FS1; (c) Frame with ECC short columns FS2.
Buildings 12 01834 g017
Figure 18. Comparison of the maximum vertex displacement limit of different frames under various performance levels.
Buildings 12 01834 g018
Table 1. Basic information on the analytical frames.
Frame NumberMaterial of the Short ColumnMaterial of the Other MembersElement of the Short ColumnElement of the Other MembersFundamental Period of Vibration/s
F0/RC/fiber section nonlinear beam column element0.72
FS1RCRCbeam column
element with plastic hinge
fiber section nonlinear
beam column element
0.72
FS2ECCRCbeam column
element with plastic hinge
fiber section nonlinear
beam column element
0.75
Table 2. Maximum interlayer displacement angle limit at each performance level (PL).
Performance LevelDescriptionIDA Calculated Limit of Vertex Displacement/mm
Frame F0Frame FS1Frame FS2
Ibasically intact262121
IIslightly damaged524242
IIImedium damaged240154211
IVseverely damaged409258361
Vclose to collapse454287401
Publisher’s Note: MDPI stays neutral with regard to jurisdictional claims in published maps and institutional affiliations.

