Article

Decision Analysis of a Reinforcement Scheme for In-Service Prestressed Concrete Box Girder Bridges Based on AHP and Evaluation of the Reinforcement Effect

1
School of Water Conservancy and Civil Engineering, Zhengzhou University, Zhengzhou 450001, China
2
Henan Transportation Research Institute Co., Ltd., Zhengzhou 450015, China
*
Authors to whom correspondence should be addressed.
Buildings 2022, 12(10), 1771; https://doi.org/10.3390/buildings12101771
Submission received: 17 September 2022 / Revised: 15 October 2022 / Accepted: 18 October 2022 / Published: 21 October 2022
(This article belongs to the Section Construction Management, and Computers & Digitization)

Abstract

:
Prestressed concrete girder bridges are widely used worldwide due to their mature construction technology, economical cost, and low maintenance. After a certain number of years of service, prestressed concrete girders inevitably suffer from deterioration of their material properties, cracking, and reduced load-carrying capacity due to the natural environment and long-term vehicle loading. When the performance of a bridge declines to the point that it cannot meet the requirements of normal use, reinforcement and maintenance are required. In this study, a 5 × 45 m prestressed concrete continuous box girder bridge that has been in service for 25 years is taken as an example, and the causes of crack development and deterioration of the technical condition of the bridge are analyzed. Based on an analysis of the causes, reinforcement schemes for overall replacement of the girder and adding bridge piers are proposed. According to a comparison of the advantages and disadvantages, a decision analysis of the reinforcement scheme is carried out via the analytic hierarchy process (AHP). The vector weights of the two schemes were found to be 0.4288 and 0.5712, respectively, indicating that adding bridge piers is more advantageous than overall replacement of the girder. Thus, a scheme of adding five piers was adopted to reinforce the bridge. A load test was then performed after the reinforcement, and both the test deflection and strain calibration coefficients were found to be less than 1, indicating that the force state of the added piers and bearings was better than the theoretical calculations. The present study shows that the reinforcement scheme of adding piers can achieve the design goal. The working status of the box girder was significantly improved, the crack development of box girder was suppressed, and the service life of the bridge was prolonged.

1. Introduction

Prestressed concrete has been extensively applied in the construction of bridges. Affected by the natural environment and long-term vehicle loads, prestressed concrete structures using conventional materials are susceptible to corrosion under aggressive exposure conditions [1,2,3]. After a certain period of service, various problems generally occur in prestressed concrete bridges such as concrete carbonization, steel corrosion, local damage, cracking of beams, loss of prestress, and deflection in the middle of the span [1,4,5], which will affect the bearing capacity of the structure and endanger the safety of the bridge. Over 115 bridges collapsed around the globe from 2000 to 2019 [6]. Bridges are significant assets of civil infrastructure and must be protected against multiple hazards to mitigate socio-economic losses due to future harmful events, as well as to ensure the sustainability and resilience of society [2]. In order to identify the problems of a bridge in time and master the technical conditions of that bridge, regular inspections are required during operation. After the inspections are completed, technical conditions should be assessed according to the number and severity of bridge diseases. This process will provide a basis for subsequent bridge maintenance or reinforcement.
The timely reinforcement of problematic bridges can maintain good traffic capacity, prolong bridge service life, save the costs of reconstruction, and provide good social and economic benefits. At present, the most commonly used reinforcement methods for bridges include increasing sections, pasting steel plates, pasting carbon fiber materials, increasing external prestressed reinforcements, and changing structural systems [4,7,8,9,10,11,12]. Sang-Hyun Kim et al. [8] developed a method using external prestressing reinforcement to improve the load-carrying capacity of concrete bridges damaged by ageing or other external environmental factors. Experiments conducted by Boquan Liu et al. [13] showed that the application of prestressing can significantly increase the cracking load, and thus delay the initiation of cracks. Experiments conducted by Jinhua Zou et al. [14] indicated that strengthening via external prestressing tendons is a considerably effective method for improving the load-carrying capacity and stiffness of RC beams. Lena Leicht et al. [15] adopted external prestressing to reinforce a 64-year-old, full-size, simply supported prestressed girder and restored the load capacity of the main girder. Li Jia et al. [16] proposed a method of expanding the cross-section combined with prestressing tendons, and the test results showed that this method can significantly improve the ultimate load capacity and reduce the deflection of the beam. For the reinforcement of prestressed concrete box girder bridges, methods that involve increasing external prestress and structural reinforcement are mostly adopted at present, while the methods of changing the structural system and main load-bearing structure are rarely adopted.
For bridges reinforced by adding extracorporeal prestressing and structural reinforcement, serious diseases can appear again after a few years of service. When these diseases affect the safety of the bridge, secondary reinforcement is required [17]. The secondary reinforcement scheme needs to be developed with an in-depth analysis of the causes of the problem and a target-oriented scheme. The structural system can then be changed, and the main load-bearing elements can be replaced if necessary. Scientific decisions should be involved to ensure the rationality of the reinforcement scheme. Although many scholars have conducted relevant research and engineering practice related to the strengthening of prestressed concrete girder bridges, the comparison and decision-making processes of reinforcement schemes are rarely mentioned. For bridges requiring secondary reinforcement, comparative studies of schemes are also relatively uncommon. The selection of reinforcement schemes based on AHP can make the decision-making process more systematic and scientific and the evaluation results more objective and reliable [18].
In this study, using a 5 × 45 m highway prestressed concrete box girder bridge as a case study, the bridge was reinforced via extracorporeal prestressing and structural reinforcement. The reasons for the development of cracks and technical condition changes of the bridge are analyzed, and two secondary reinforcement schemes are proposed. To scientifically select an appropriate reinforcement scheme, the AHP method is used to make decisions based on a consideration of various influencing factors, which avoids the blindness of scheme selection. After the reinforcement is completed, the reinforcement effect is tested using a load test, and the results show that the actual reinforcement effect of the bridge achieves the design target.

2. The Bridge Profile and Technical Condition Development

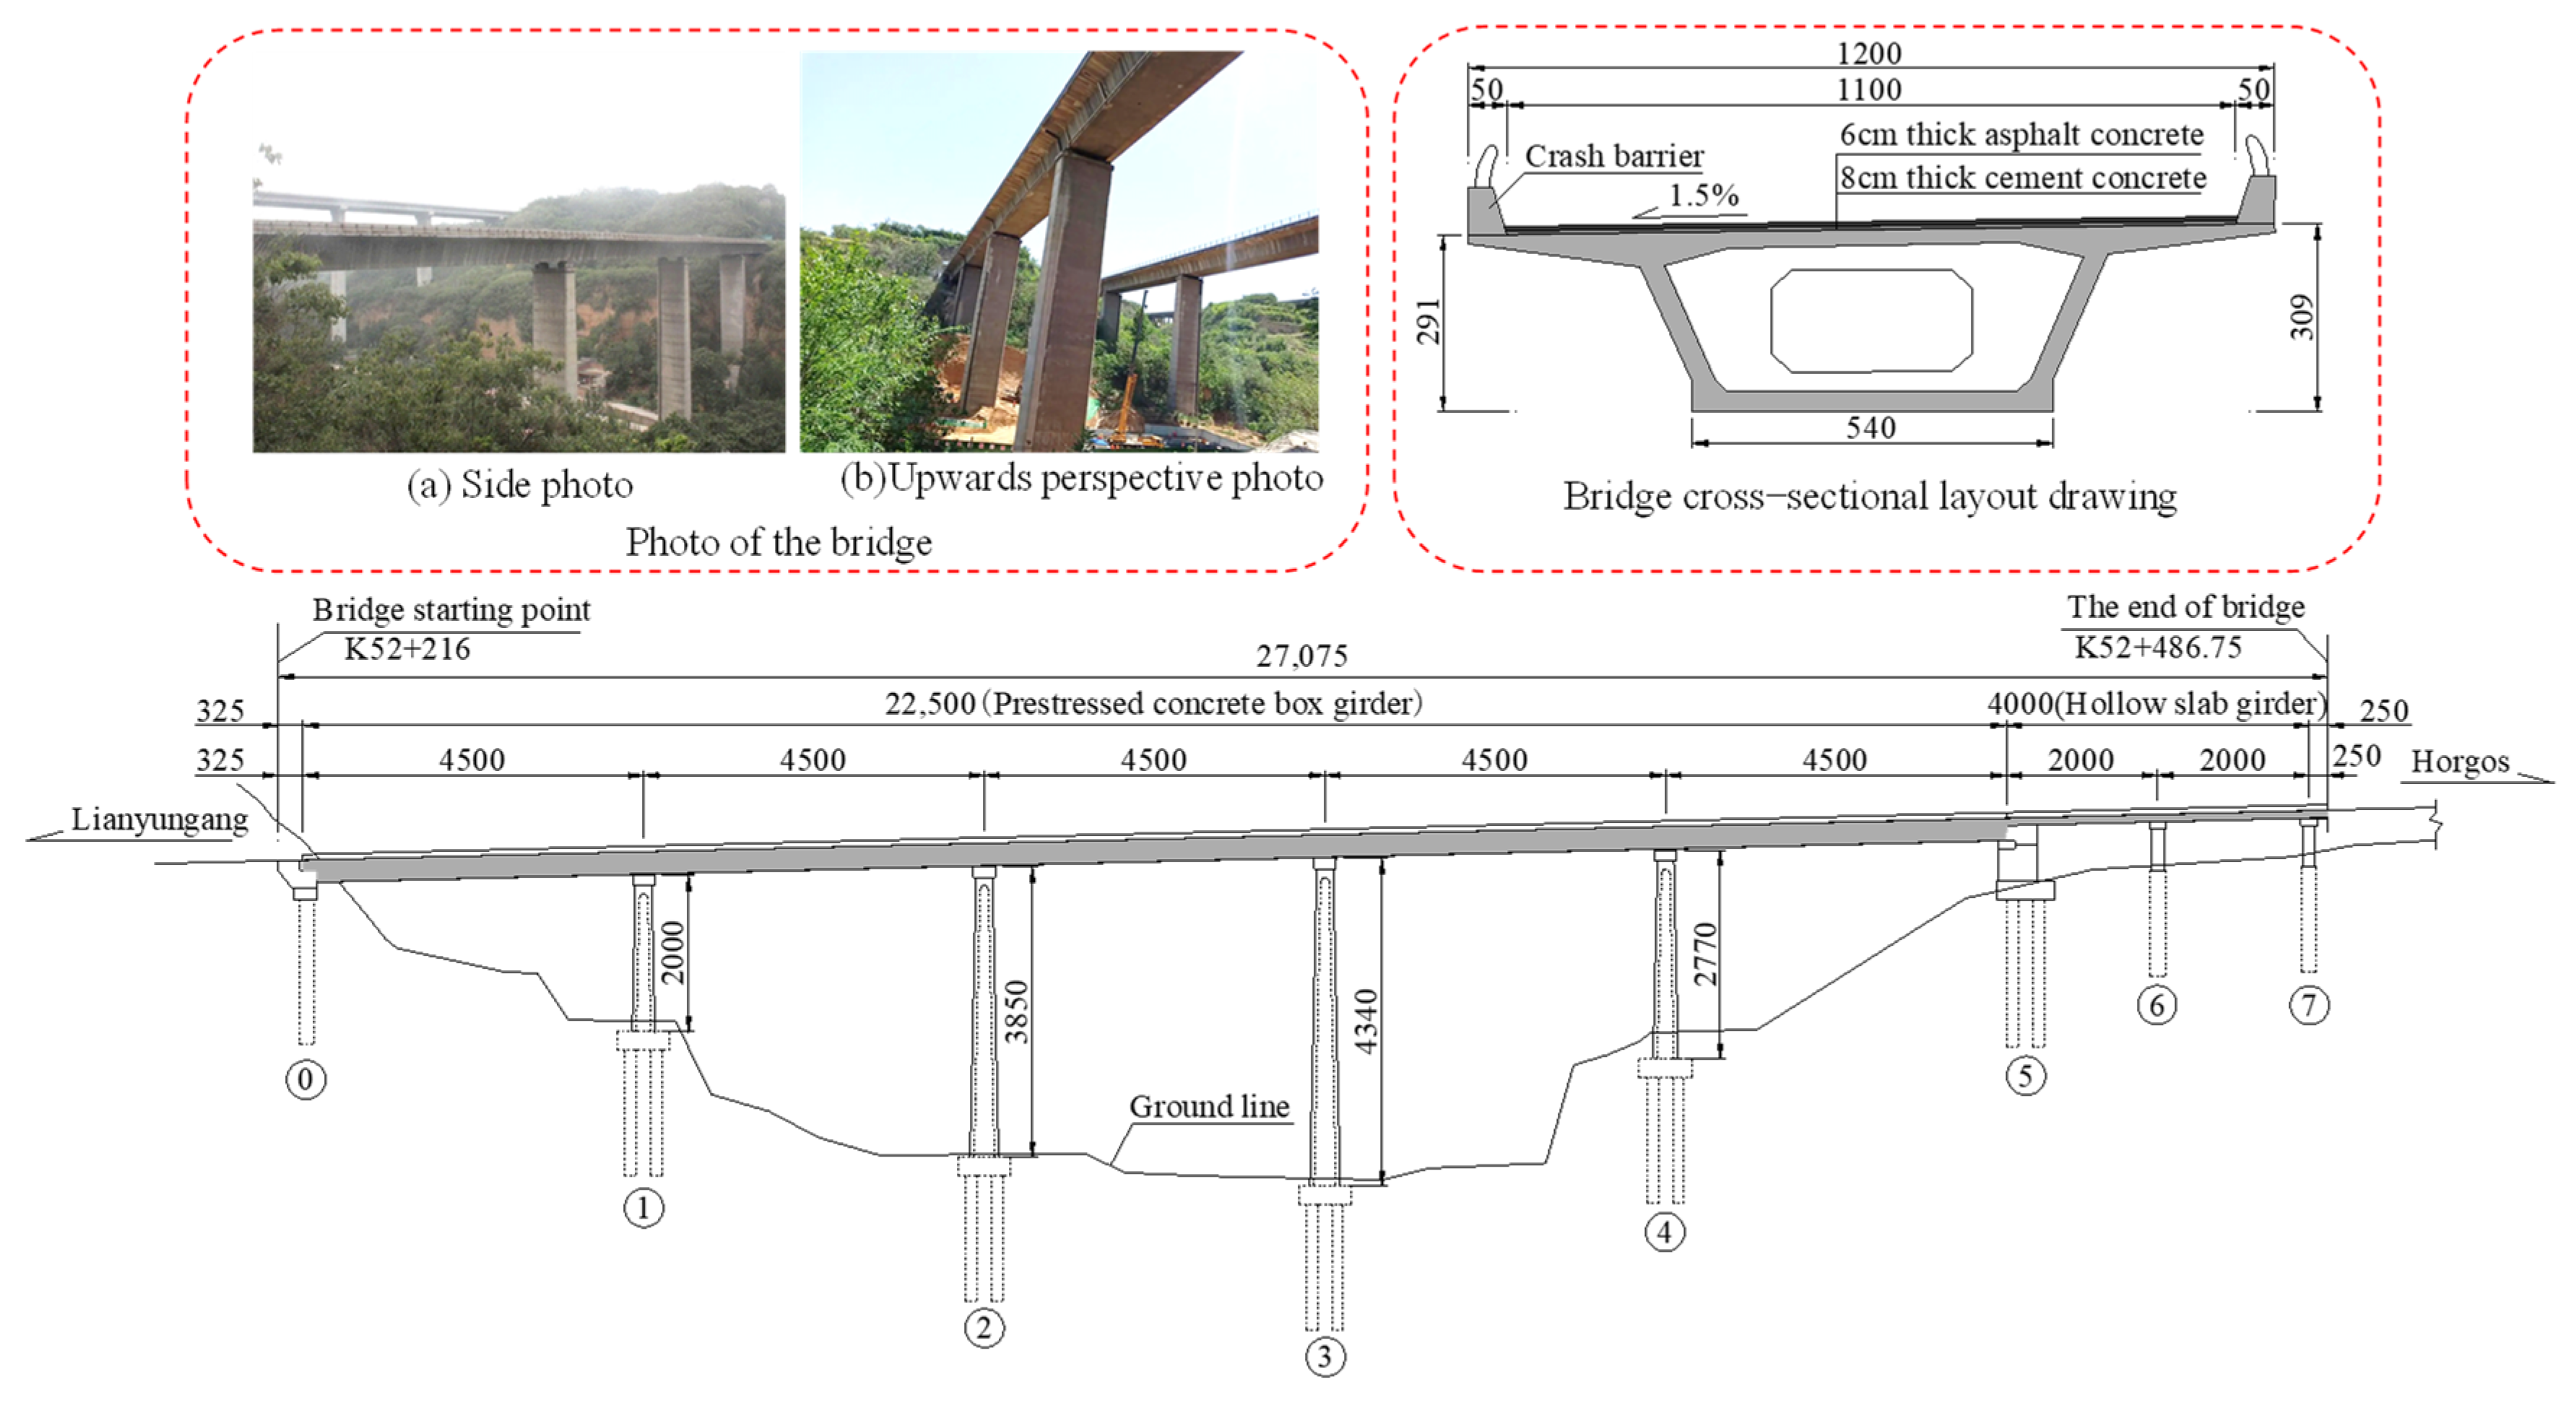
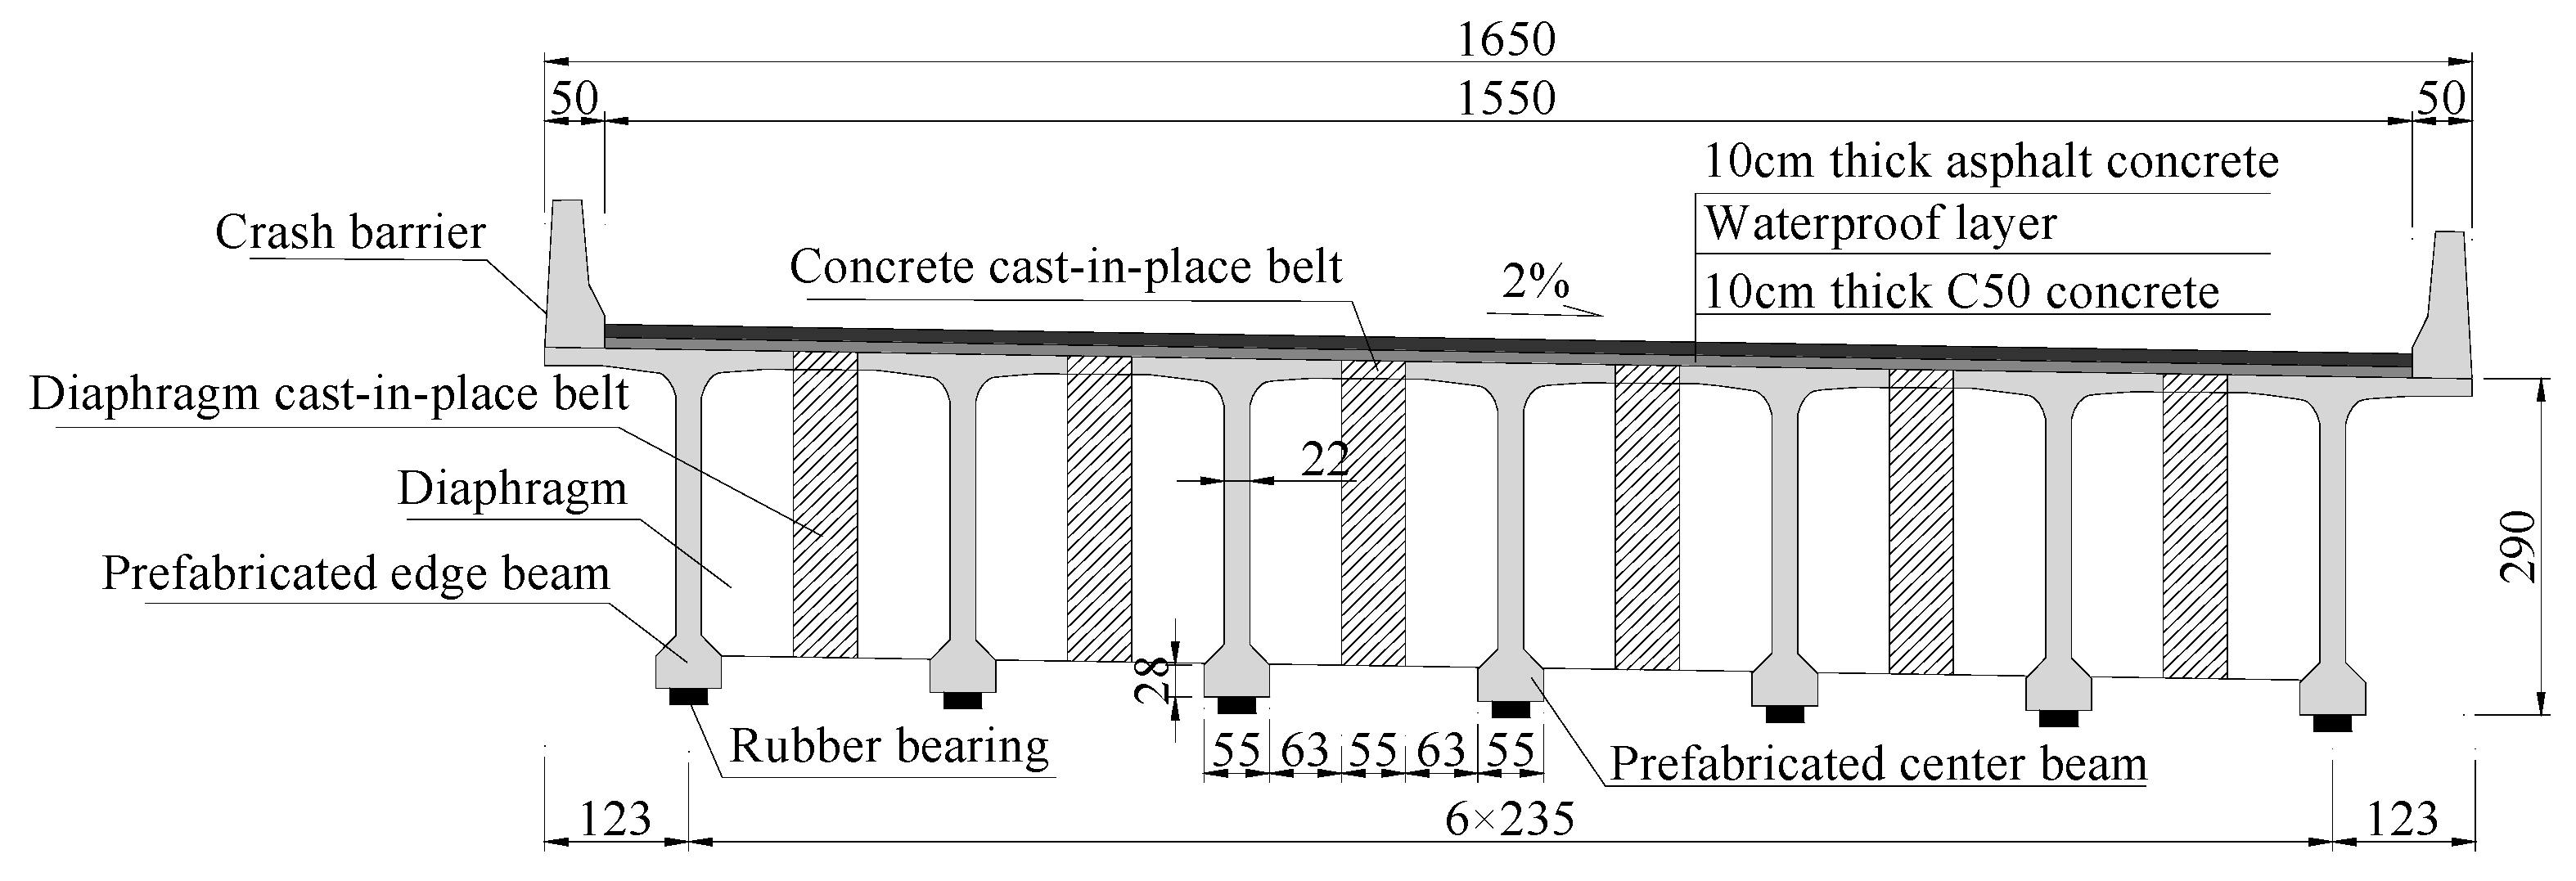
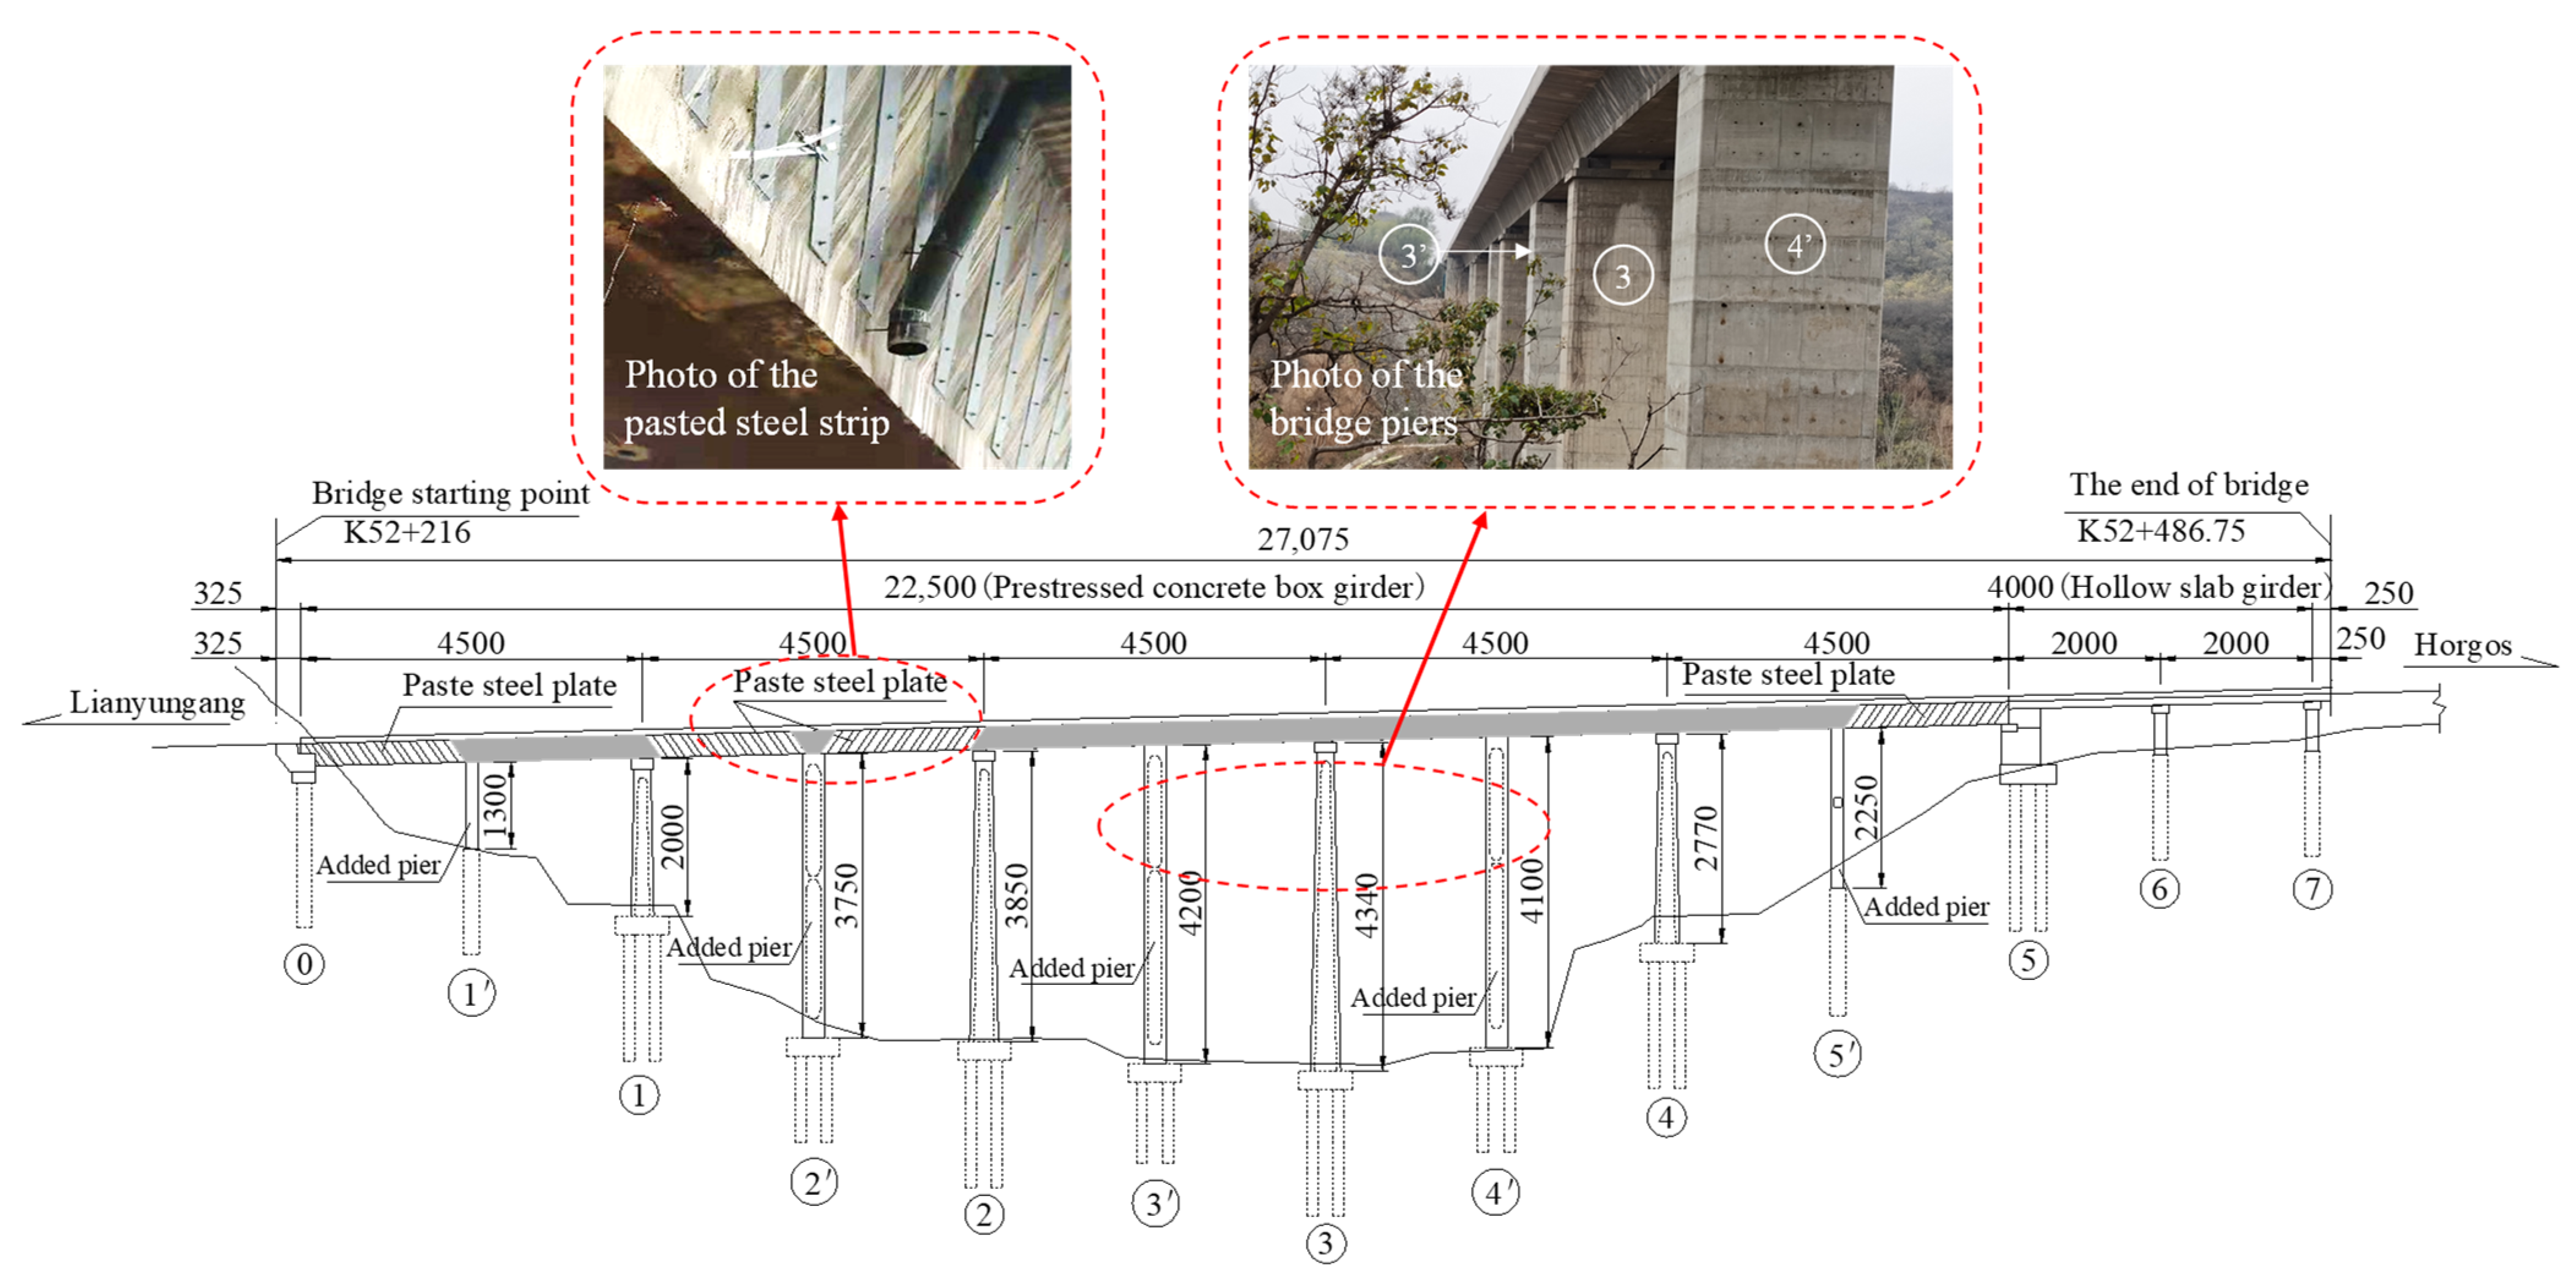
2.1. The Bridge Profile

The study bridge is located on the Lianhuo Expressway in Henan Province, China. The bridge was constructed in 1992 and opened to traffic in 1995. The design load level of the bridge was as follows: automobile-over 20 and trailer-120. The total length of the bridge is 270.75 m. The main bridge was designed as a 5 × 45 m prestressed constant-section single box and single-chamber continuous box girder, and the approach bridge is a 2 × 20 m prestressed hollow slab. The bridge layout plan and photo are shown in Figure 1. The cross slope is set through the webs at different heights of the box girder. The height of the box girder at the center line is 3 m. The transversal width of the bridge is 12.0 m. The cross-section is arranged as a 0.5 m guardrail + 11 m lane + 0.5 m guardrail. The piers of the bridge are hollow piers with box sections, and the foundations of the piers are bored piles. The box girder was designed with C40 concrete, while the abutments and piers were designed with C30 concrete. The cap and pile foundations were designed with C25 concrete, and the bridge bearings are basin rubber bearings.

2.2. Box Girder Cracking and Technical Condition Development

Generally, the structural performance of a bridge will gradually degrade with an increase in service life. The most obvious bridge disease is the development of structural cracks. The crack development process of the bridge is shown in Table 1. The technical grade is assessed according to the Standards for Technical Condition Evaluation of Highway Bridges [19].
As shown in Table 1, after the bridge was opened to traffic for 10 years, 84 cracks appeared in the web of the continuous box girder of the main bridge in 2005, and the bridge was in a dangerous state corresponding to technical grade IV. The box girder was then reinforced for the first time, and the cracks were closed during that year. From 2008 to 2016, no cracks were found in the box girder, and the technical grade was ranked as Class II. The bridge was, therefore, in good condition. From 2017 to 2020, cracks on the box girders developed rapidly, and the technical condition of the bridge deteriorated gradually until again presenting a dangerous state.

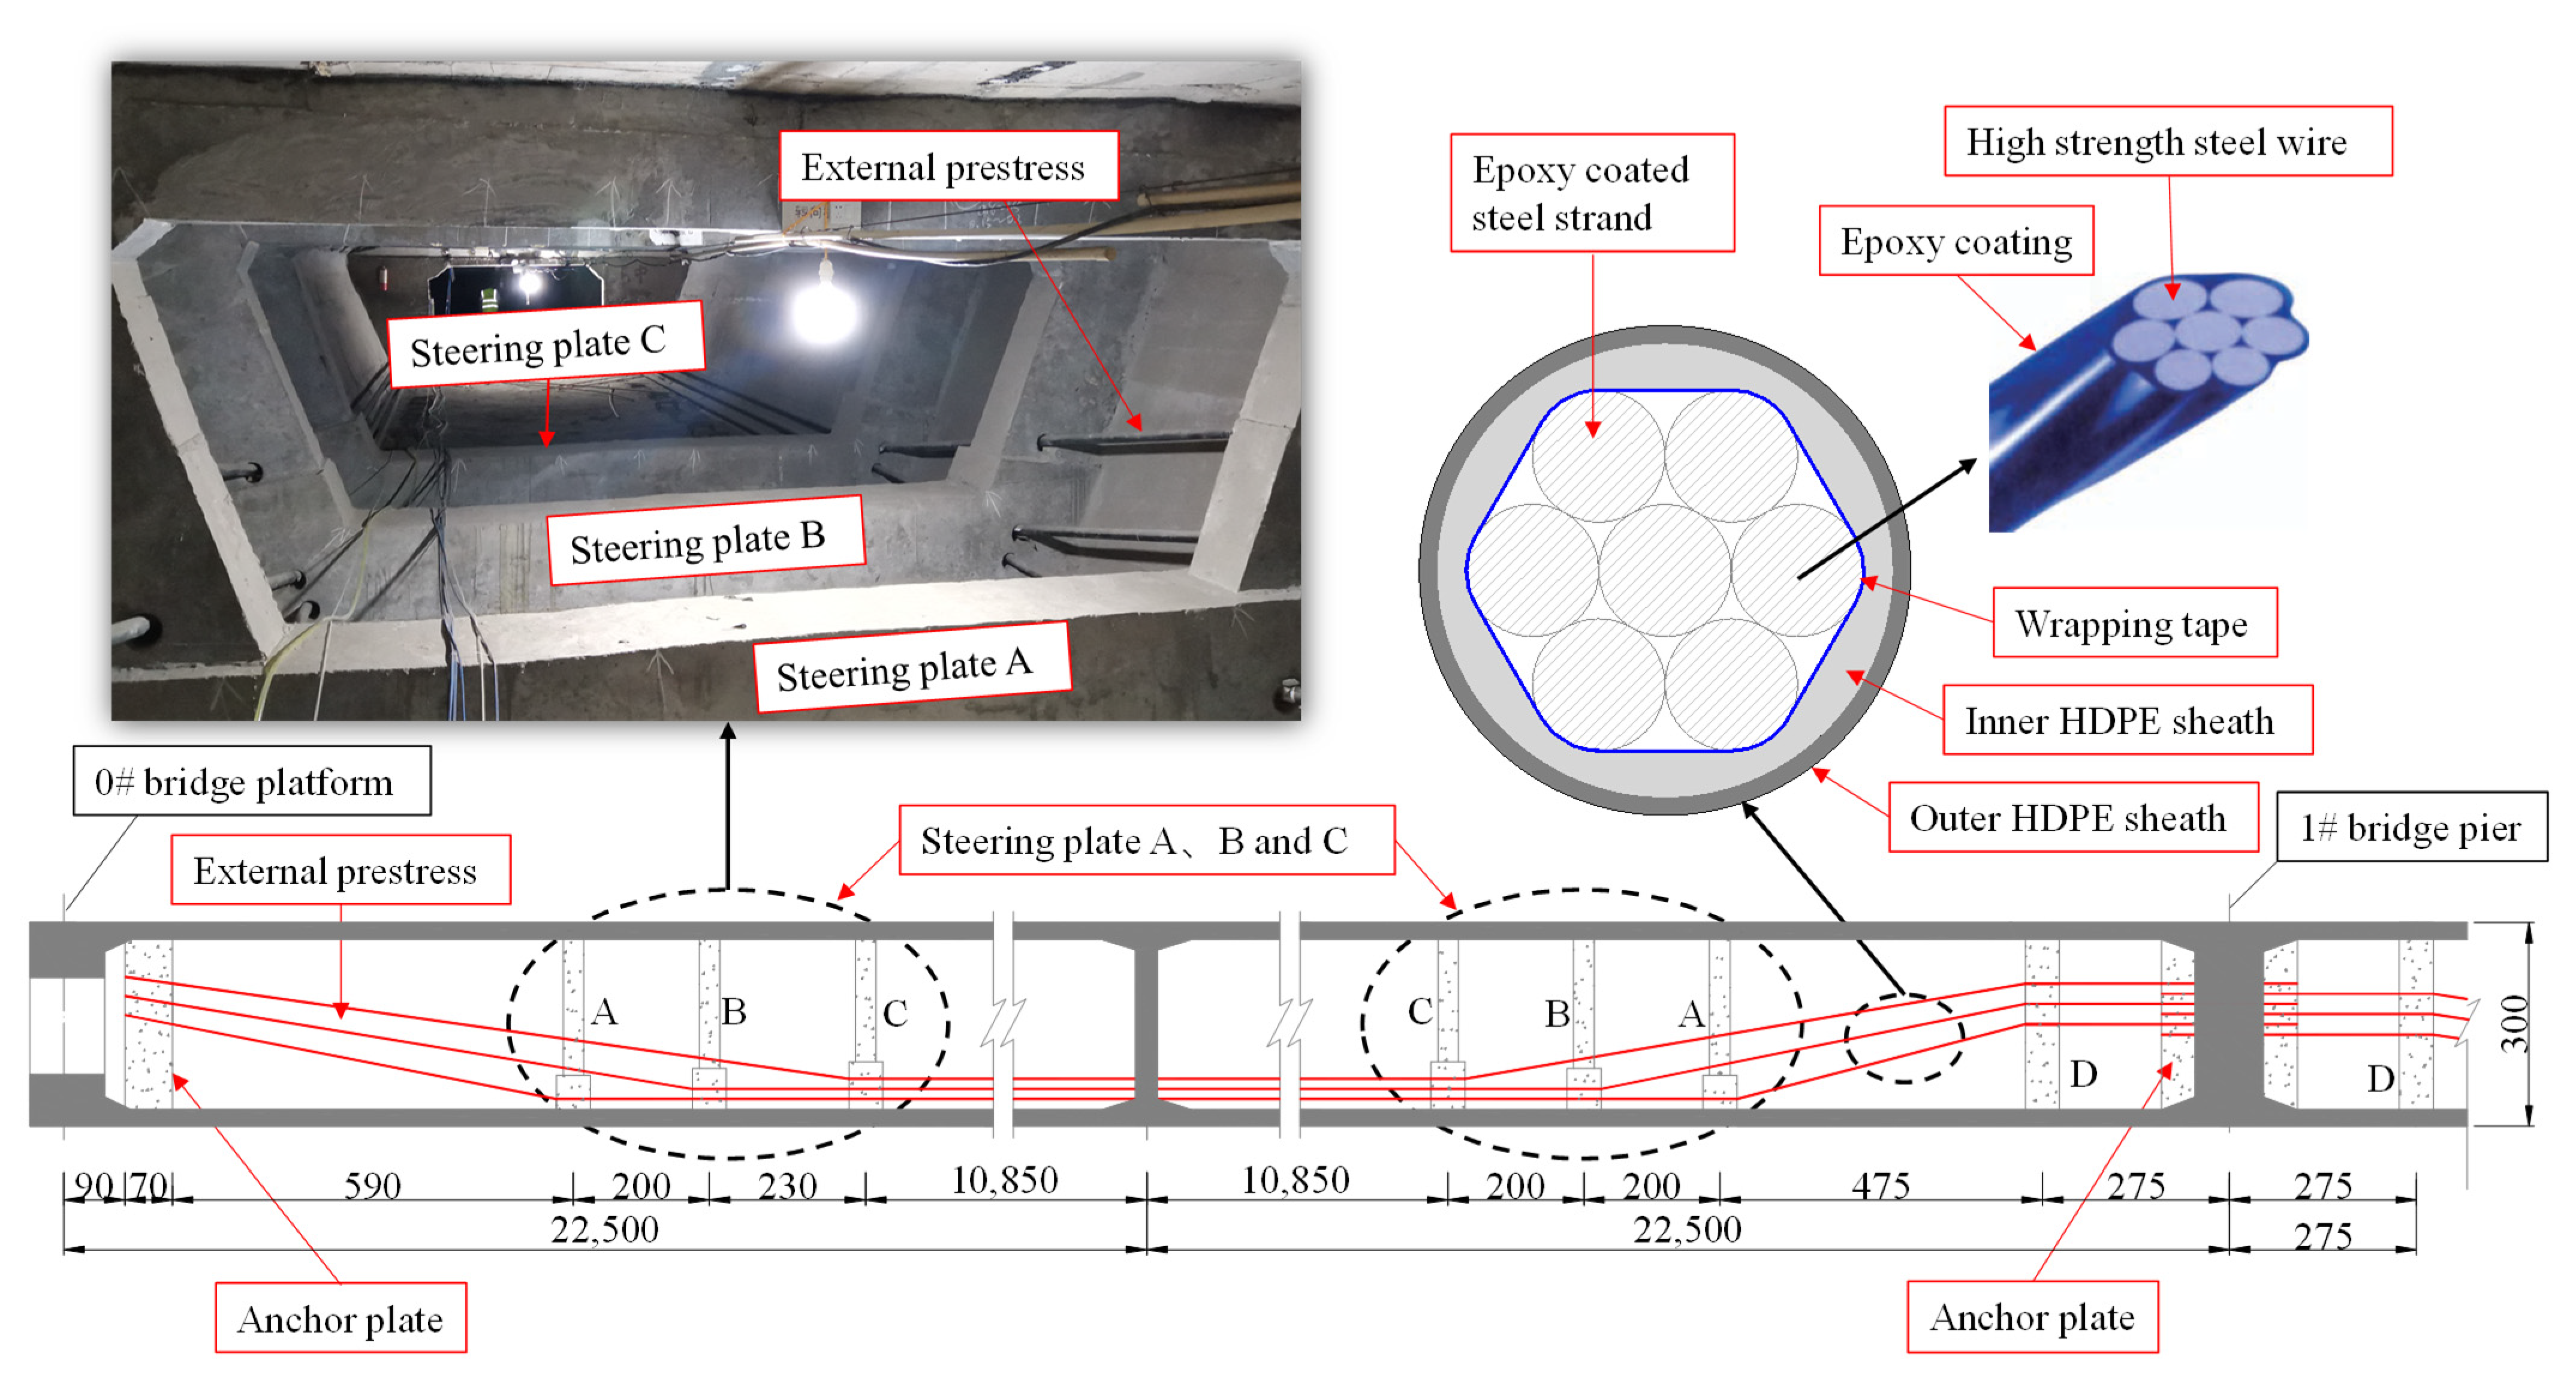
2.3. The First Reinforcement of the Bridge

In 2005, the cracks of the prestressed concrete box girder of the bridge were closed, and the bridge was reinforced. This reinforcement included two aspects: (1) adding external prestressed steel bundles from the 1st span to the 5th span and (2) pasting steel plates on the inside of the web and attaching carbon fiber to the outside of the web. As shown in Figure 2, the external prestressed steel bundles were arranged along the longitudinal direction of the web. Six φ15-7 longitudinally prestressed steel strands were arranged in the box girder from the first span to the fourth span. Four φ15-9 longitudinally prestressed steel strands were arranged in the box of the fifth span. The steel strand was a low-relaxation epoxy-coated steel strand with a diameter of 15.24 mm. The strand’s cross-sectional area was 140 mm2. The standard strength was 1860 MPa, and its elastic modulus was 1.95 GPa.
Since the bridge’s reinforcement in 2005, the bridge maintained good technical condition from 2006 to 2016. However, with the growth of service time, the material properties gradually deteriorated, and with an increase in traffic load, the pre-stressed box girder cracks developed rapidly. The bridge bearing capacity then decreased sharply. In order to ensure the service safety of the bridge, the causes of box girder cracking need to be analyzed, and new reinforcement solutions need to be considered to restore the bridge service function and load-carrying capacity.

3. Analysis of the Causes of Crack Development

3.1. Material Performance Degradation Testing

Concrete is affected by the surrounding environment during service and will undergo different degrees of carbonation. The environmental factors that affect the carbonation of concrete are mainly temperature, humidity, composition, and concentration of airborne harmful gas [20]. Carbonation will lower the concrete’s pH, resulting in much weaker protection of the concrete to the steel bars, which will become more prone to rusting. The corrosion of the steel bars in the concrete makes the effective cross-sectional area of the steel bars decrease and the volume increase, which leads to concrete expansion, spalling, and a reduction in the grip and load-bearing capacity of the steel bars and concrete. In this way, the safety and durability of the concrete structure are directly affected. After 25 years of service, the outer surface of the concrete of the bridge showed more serious carbonation, steel corrosion, and concrete spalling.
The steel corrosion potential visually reflects the corrosion activity of the steel bars in the concrete. As shown in Figure 3, the half-cell potential method was applied here to test the potential difference between the concrete of the box girder web and the reference electrode and to determine the probability of corrosion of the steel bars. Generally, when the potential difference is larger, the possibility of corrosion of the steel bars in concrete is greater. A test was conducted using the double electrode method. The results revealed that the minimum value of the potential level at the measurement point of the box girder web was −383 mV, the maximum value was −280 mV, and the average value was −325 mV. According to the relevant specifications [19], when the minimum value of rust potential is between −300 and −400 mV, there is rusting activity, and the probability of rusting is greater than 90%. Therefore, the test results indicate that there is corrosion activity of steel bars in box girder concrete, and the probability of the occurrence of corrosion is greater than 90%.
Prestressed concrete bridges that have been in service for many years inevitably experience prestress losses. The most serious prestress losses can reach 50% [8]. The pre-stressed steel bars can show different degrees of corrosion and even pit corrosion after years of service [11]. Corrosion of the bars will lead to a reduction in the effective area and a decrease in the effective prestressing force. For the present bridge, the corrosion potential of the reinforcement indicates that the probability of corrosion of the steel bars is over 90%, and the prestressing tendons also have a higher possibility of corrosion. Prestress losses lead to excessive deflections and unexpected cracks, which are further exacerbated by the coupling effect of excessive downward deflections and cracks. Cracking and prestress losses cause a reduction in the bridge’s load-carrying capacity.

3.2. The Increased Traffic and Overloading

With the rapid development of China’s economy, there has been considerable growth in both car ownership and highway cargo transportation. Such an increase in traffic volume and a higher proportion of heavier trucks increase the potential risk of fatigue failure of the bridge structure [21], and the original design approaches the bearing capacity limit [18]. As is well known, highway bridges can possess intended or unintended reserve strength, despite being designed for standard loads [22]. Such reserve strength can be utilized to accommodate occasional overloads but cannot cope with long-term overloading of vehicles. Vehicle overloading, however, is ubiquitous in Chinese highway transportation [23]. Long-term overloading will lead to the accumulation of structural damage and accelerate the crack development and performance degradation of bridges. In some extreme cases, the weight of the overloaded trucks may even exceed the load-carrying capacity of the bridge and directly cause bridge collapse [24]. Table 2 presents the volume of highway traffic in the last 10 years according to the statistical bulletin on the development of the transportation industry published by the Ministry of Transport of the People’s Republic of China.
As shown in Table 2, from 2010 to 2014, the total number of road transport vehicles increased year by year, the number of freight vehicles increased by 38.39%, and the total freight weight increased by 71.55%. From 2014 to 2020, the total number of road transport vehicles gradually decreased, but the total freight weight still increased year by year, and the total freight weight in 2020 increased by 163.08% compared to 2010. After 2014, the total number of freight vehicles decreased, but the total freight weight increased rapidly, which means that the proportion of heavier trucks in road transport also increased rapidly, and the proportion of overloaded vehicles increased.

3.3. Conclusions of the Analysis

The above analysis indicates that after 25 years of service, the concrete, reinforcement, and prestressing of the bridge show significant performance degradation. Material performance degradation is the intrinsic cause of inadequate load-carrying capacity and box girder cracking. The rapid increase in traffic volume in the last decade and the increase in heavy and overloaded vehicles accelerated the fatigue damage of the bridge. Increases in traffic volume and overloading are external causes of structural damage, accelerating the development of cracks and the degradation of bridge performance.

4. Study on the Secondary Reinforcement Schemes

Bridges are critical infrastructure, so informed decision making is essential for bridge operation and maintenance [25]. Bridges suffer from the dual problems of material performance deterioration and increases in traffic flow and loads. Therefore, for the second reinforcement, the reinforcement scheme should be determined in terms of both restoring the material properties of the structure and improving the structural forces, while also considering influencing factors such as construction difficulty, project costs, traffic impacts, social impacts, and environmental impacts. Based on the above considerations, two reinforcement schemes are developed in the following section, and a comparative analysis of the schemes is carried out.

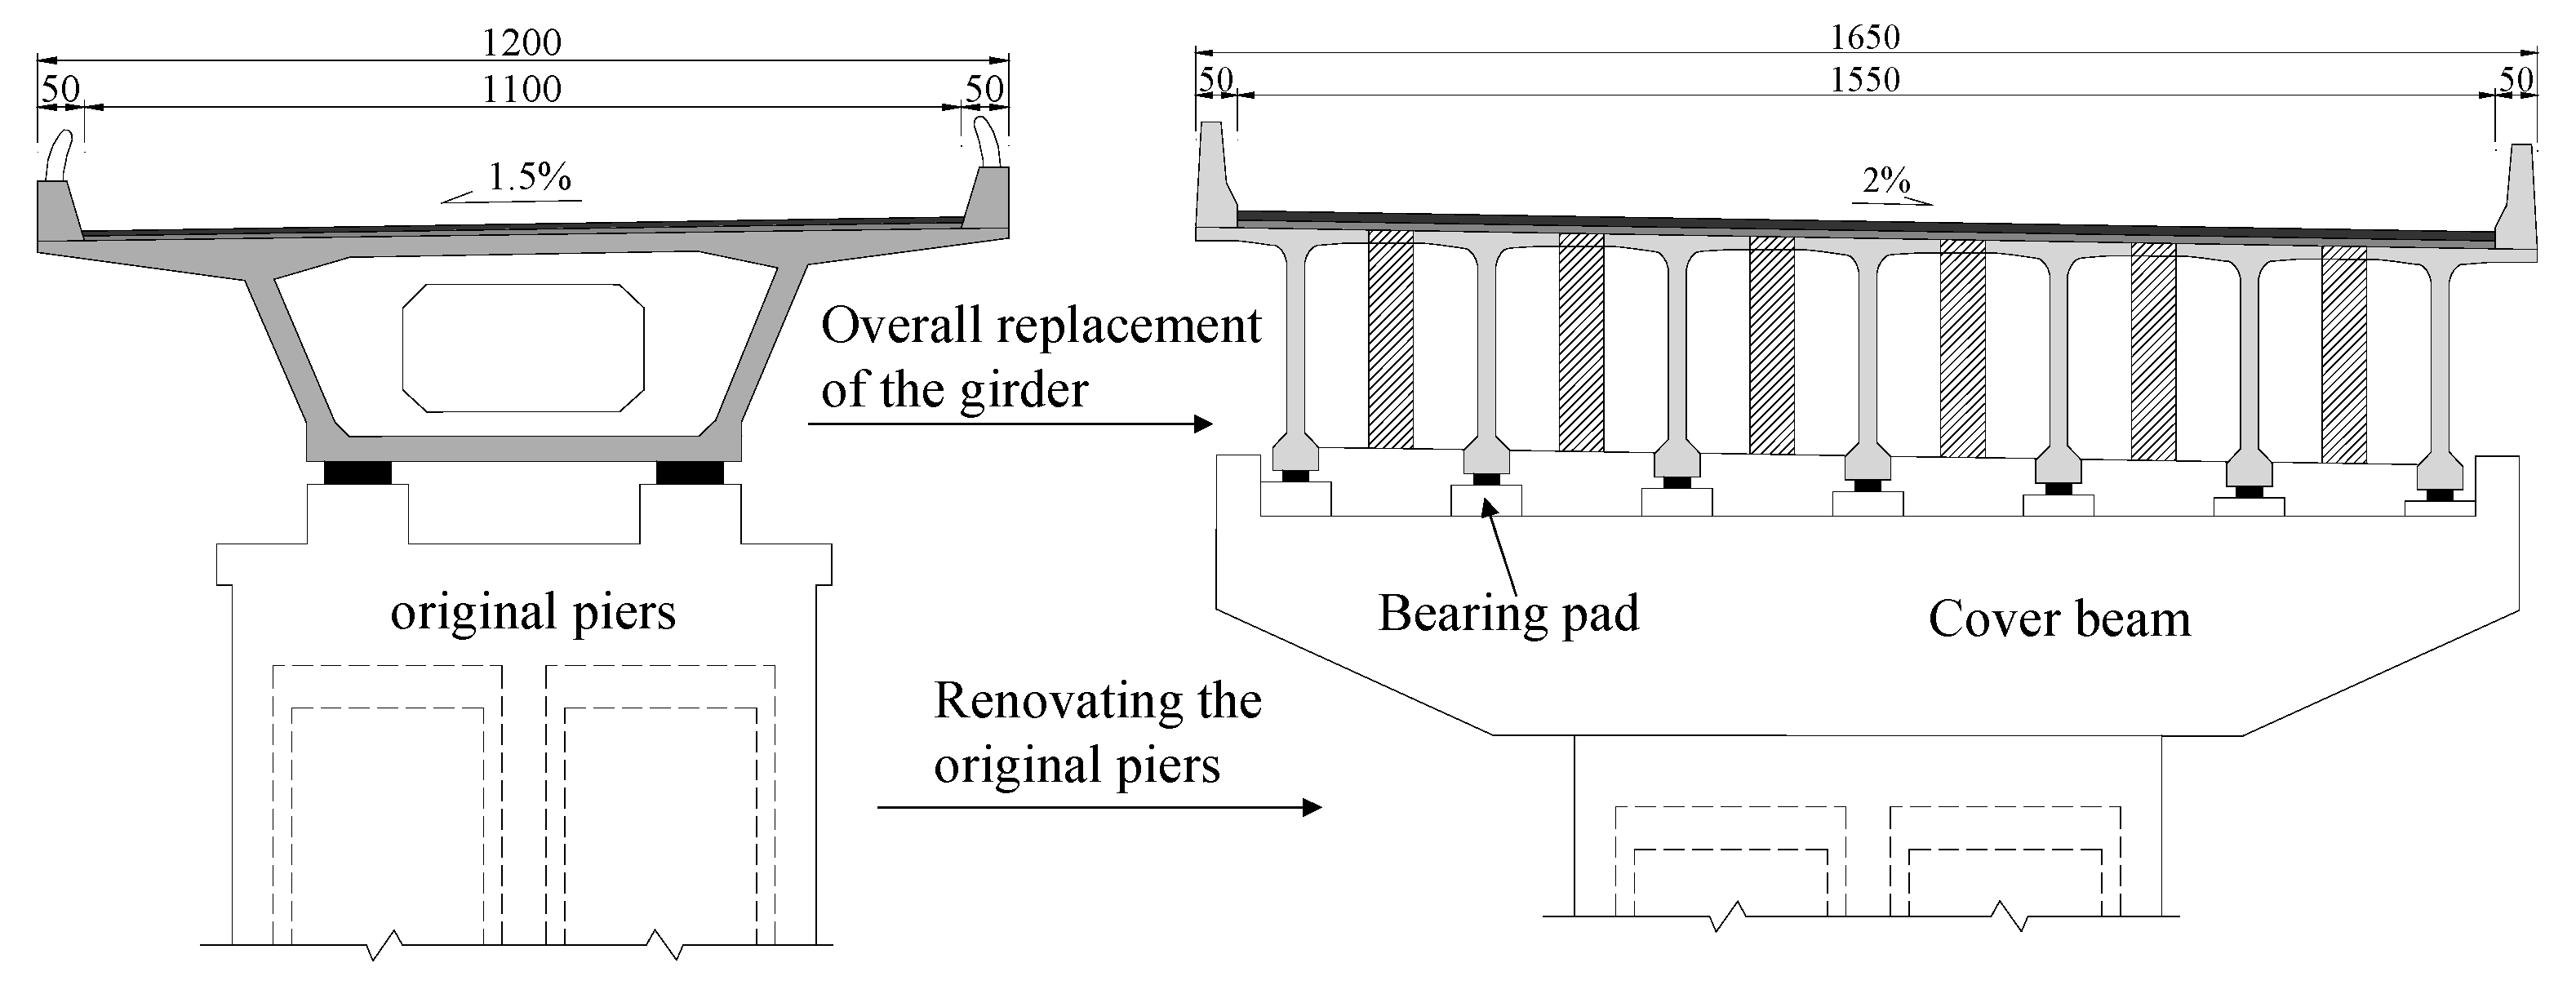
4.1. Scheme 1: Overall Replacement of the Girder

As shown in Figure 4, this scheme mainly involves removing the 5 × 45 m prestressed concrete box girders and modifying the original piers by adding cover girders and bearing pads, as well as replacing the main girders with 5 × 45 m prestressed concrete assembly T-beams. To meet the future demands of increased traffic volume, the full width of the bridge should be increased from 12.0 to 16.5 m. The cross-sectional arrangement of the T-girder is shown in Figure 5. Under this scheme, new T-beams are precast in the workshop and then connected to the whole via post-cast concrete. Both the T-beams and the post-cast concrete are made of C55 concrete, and the height of each T-beam is 2.9 m at the center line. The cross slope of the original bridge deck is adjusted from the original 1.5% to 2%. The deck pavement thickness is also adjusted.
The advantage of this scheme is that it can fully restore material performance and bridge bearing capacity, as well as increase bridge capacity. However, the disadvantages of this scheme include the difficulty of removing the box girder, the high cost of construction measures, the long construction period, high impacts on traffic and the environment, etc. Bridge demolition requires a high level of construction technique. There is a serious risk of bridge collapse if the demolition plan is not adequately considered or if the demolition process is not performed properly [26]. The construction of this scheme requires the long-term interruption of traffic. Thus, vehicles are detoured, which is not conducive to traffic organization. In addition, it is difficult to recycle the demolished concrete, which will generate more concrete waste and is not conducive to environmental protection.
This scheme requires the removal of about 2550 m3 of reinforced concrete. A new bridge requires about 2750 m3 of new concrete and about 350 t of steel, based on calculations showing that 1 m3 of concrete requires 0.5 t of cement, and 1 t of cement directly and indirectly emits about 0.94 t of CO2 [27,28]. Additionally, it is difficult to recycle demolished concrete. Crushing and transportation in the recycling process will also generate a certain amount of carbon emissions, which is difficult to balance with the carbon emissions reduced by recycling. Based on the calculations, scheme 1 will generate at least 2360.5 tons of CO2 emissions.

4.2. Scheme 2: Adding Bridge Piers

As shown in Figure 6, this scheme mainly involves adding piers in the span of the box girder and providing additional support to the main girder. By installing Teflon sliding rubber bearings on top of the piers, the bending moment, shear force, and displacement of the main girder under the action of a vehicle load are reduced. The added piers and bearings only come into contact with the box girder under a dead load and do not bear the dead load of the box girder. However, they can bear the live load together with the original piers to improve the force state of the box girder and prolong the service life of the bridge. In addition, steel plates are installed on the outside of the webs in spans 1, 2, and 5, where the cracks are more serious, to close the cracks and repair the breakage of the box girder. Additionally, 1.6 m diameter cylindrical piers are added in span 1 and span 5, and 6 m × 4 m rectangular hollow thin-walled piers are added in spans 2~4 of the bridge. The diameter of the pier top bearing is 400 mm, and the height of the PTFE sliding rubber bearing is 56 mm. According to the composition of the bearing and bearing area, the vertical compressive stiffness of the bearing is 100 kN/mm.
The main advantage of Scheme 2 is that the service life of the bridge can be extended, and the whole life cycle cost of the structure can be reduced. Carbon emissions and social and environmental impacts can also be reduced. Additionally, there are fewer construction difficulties and impacts on traffic. The disadvantages of Scheme 2 are that the additional piers will occupy the space under the bridge. The reliability of the bridge after reinforcement for normal use is not as good as that of Scheme 1. At the same time, new diseases may appear after some years of use. In addition, Scheme 2 requires new concrete and steel totaling about 3450 m3 and 550 t, which will generate about 2677.3 t of CO2 emissions. This emission quantity is slightly higher than that in scheme 1, but the difference is not significant.

4.3. Comparative Analysis of Reinforcement Schemes

Next, a comparative analysis of the two reinforcement schemes in terms of reinforcement effects, project costs, traffic impacts, social impacts, and environmental impacts is conducted. The results are shown in Table 3. The two schemes have both advantages and disadvantages, creating difficulties in making decisions and requiring the use of scientific decision methods.

5. Reinforcement Scheme Selection Based on AHP

The Analytic Hierarchy Process (AHP) is a simple, effective, systematic, and scientific method for analysis and decision making that has numerous applications in engineering decision making [29,30,31,32]. By analyzing the relative importance of each comparative factor of the reinforcement scheme and constructing a hierarchical analysis model, a comprehensive decision-making method and basis can be provided for the preferential selection of the reinforcement scheme. Based on the decision analysis of AHP, Scheme 2 was selected. The decision process is as follows.

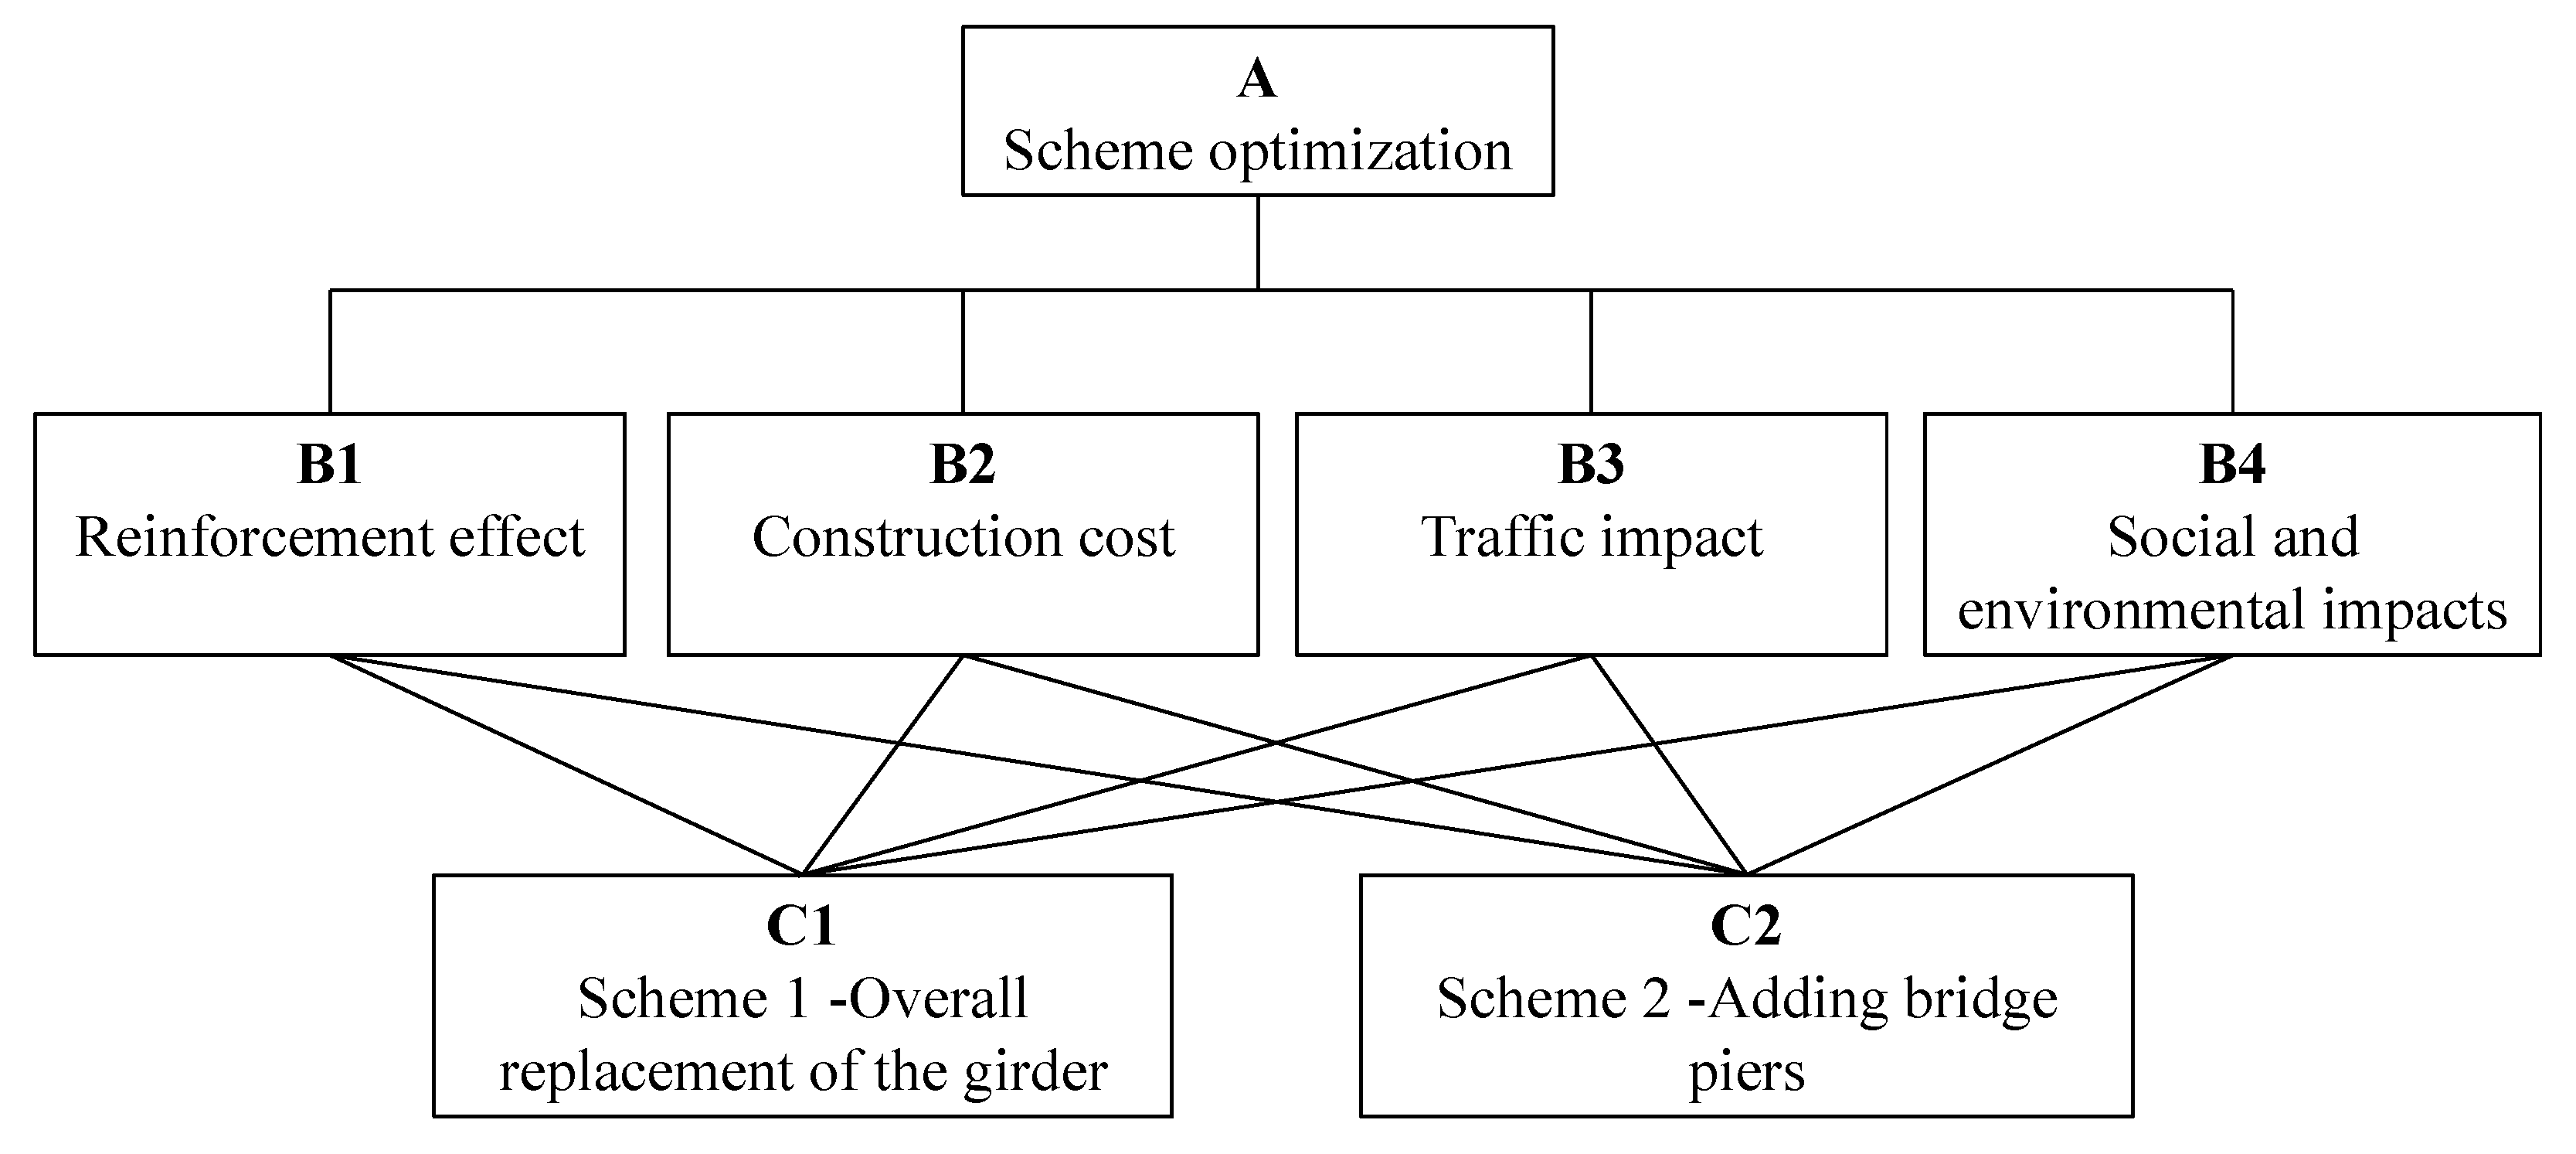
5.1. Hierarchical Analysis Model and Discriminant Matrix

For a preferential decision on the reinforcement scheme of the project, a hierarchical analysis model is established for scheme optimization. The scheme comparison factors and the two reinforcement schemes in accordance with each other are shown in Figure 7, where the scheme optimization is the target layer. The scheme comparison factors are the criterion layer, and the two schemes are the scheme layer.
In Figure 7, the four factors B1~B4 are the reinforcement effect, construction costs, traffic impacts, and social and environmental impacts, respectively. By comparing the importance of each factor relative to the target layer A, the comparison matrix is constructed using the pairwise comparison method according to the comparison scales of 1~9, as presented in Table 4 [33].
For the project, B1 is considered moderately more important than B2, and B1 is considered equally important as B4. Thus, we take a 12 = 3 and a 14 = 1 in Formula (1). The same method is used to compare the importance of the factors. The discriminant matrix of the criterion layer B relative to the target layer A is as follows:
A = ( a 11 a 12 a 13 a 14 a 21 a 22 a 23 a 24 a 31 a 32 a 33 a 34 a 41 a 42 a 43 a 44 ) = ( 1 3 3 1 1 / 3 1 2 1 / 3 1 / 3 1 / 2 1 1 / 5 1 3 5 1 )
Similarly, the discriminant matrix of scheme layer C with respect to criterion layer B is constructed separately as follows:
B 1 = ( 1 5 1 / 5 1 ) ,   B 2 = ( 1 1 / 5 5 1 ) ,   B 3 = ( 1 1 / 3 3 1 ) ,   B 4 = ( 1 1 / 4 4 1 ) .
For the constructed discriminant matrices, the maximum eigenvalue λ max and the eigenvector are derived. The consistency index CI and consistency ratio CR are then determined. Because the second-order judgment matrix has complete consistency, the consistency index and consistency ratio of matrices B1~B4 are 0. The weight vector under the corresponding level of single ordering can thus be obtained. The calculation results are shown in Table 5. Table 5 shows that the consistency ratio CR for the five levels of single ordering is less than 0.1. Therefore, the consistency test of the discriminant matrices meets the requirements.

5.2. Total Hierarchical Ranking and Scheme Optimization

The eigenvector corresponding to the largest eigenvalue of matrix A is normalized to obtain the weight vector a 0 = ( 0.3617 , 0.1427 , 0.0896 , 0.4060 ) T , which reflects that the social and environmental impacts are considered to be the most important, followed by the reinforcement effect, the cost of the project, and the traffic impact when the reinforcement solution is preferred in the target layer. The relative importance of the four factors in the criterion layer of the hierarchical model is determined by each component of the weight vector a . The eigenvectors corresponding to the largest eigenvalues of matrices B1~B4 are then normalized to obtain the weight vectors b 1 ~ b 4 , which are the relative degrees of compliance of the two reinforcement schemes in the scheme layer with respect to the four factors.
The weight vectors b 1 0 ~ b 4 0 are calculated as b 1 0 = ( 0.8333 , 0.1667 ) T , b 2 0 = ( 0.1667 , 0.8333 ) T , b 3 0 = ( 0.2500 , 0.7500 ) T , and b 4 0 = ( 0.2000 , 0.8000 ) T .
The ranking vector of the scheme layer with respect to the target layer is as follows:
c = ( b 1 0     b 2 0     b 3 0     b 4 0 ) a 0 = ( 0.8333 0.1667 0.2500 0.2000 0.1667 0.8333 0.7500 0.8000 ) ( 0.3617 0.1427 0.0896 0.4060 ) = ( 0.4288 0.5712 )
A hierarchical total ranking consistency test is then performed on the hierarchical model, with C I B = ( C I B 1 , C I B 2 , C I B 3 , C I B 4 ) and R I B = ( R I B 1 , R I B 2 , R I B 3 , R I B 4 ) .
The portfolio consistency metric and portfolio consistency ratio are calculated as follows:
C I = C I B a 0 = ( 0 , 0 , 0 , 0 ) ( 0.3617 , 0.1427 , 0.0896 , 0.4060 ) T = 0
R I = R I B a 0 = ( 0 , 0 , 0 , 0 ) ( 0.3617 , 0.1427 , 0.0896 , 0.4060 ) T = 0
C R = C R A + 0 = 0.0183 + 0 = 0.0183
Since C R = 0.0183 < 0.1 , the combination consistency of the hierarchical model can be regarded as acceptable. Then, vector c = ( 0.4288 , 0.5712 ) T can be used as the basis for the target decision scheme preference. The two components of the vector are the relative advantages and disadvantages of the two reinforcement schemes, so Scheme 2 is better than Scheme 1.

5.3. Conclusion of Decision Analysis

The above analysis shows that Scheme 2 has advantages over Scheme 1. Therefore, adding piers is chosen. By comparing the relative importance of each influencing factor and constructing a discriminant matrix to quantify and analyze each influencing factor, AHP improves the scientificity of the decision analysis. Therefore, for the bridge reinforcement scheme decision problem, the non-quantitative influencing factors can be mathematized. This process provides a simple decision method for complex decision problems.

6. Evaluation of the Reinforcement Effect Based on Finite Element and Load Tests

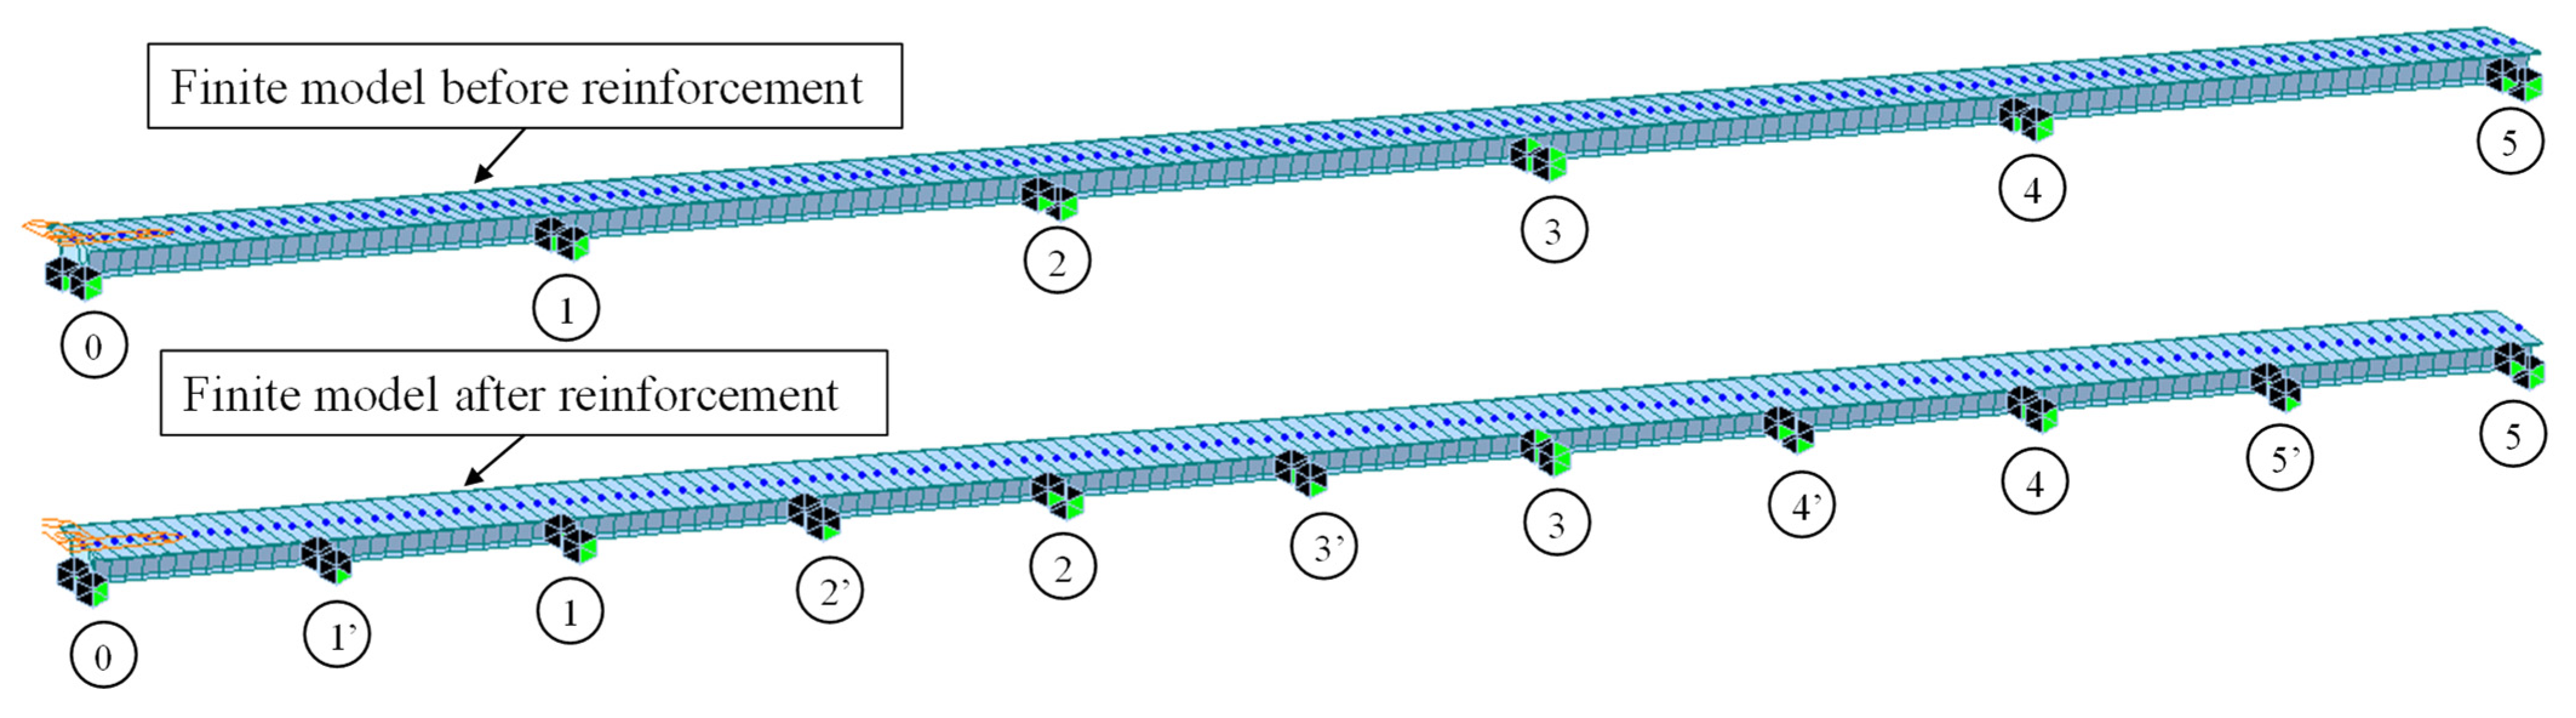
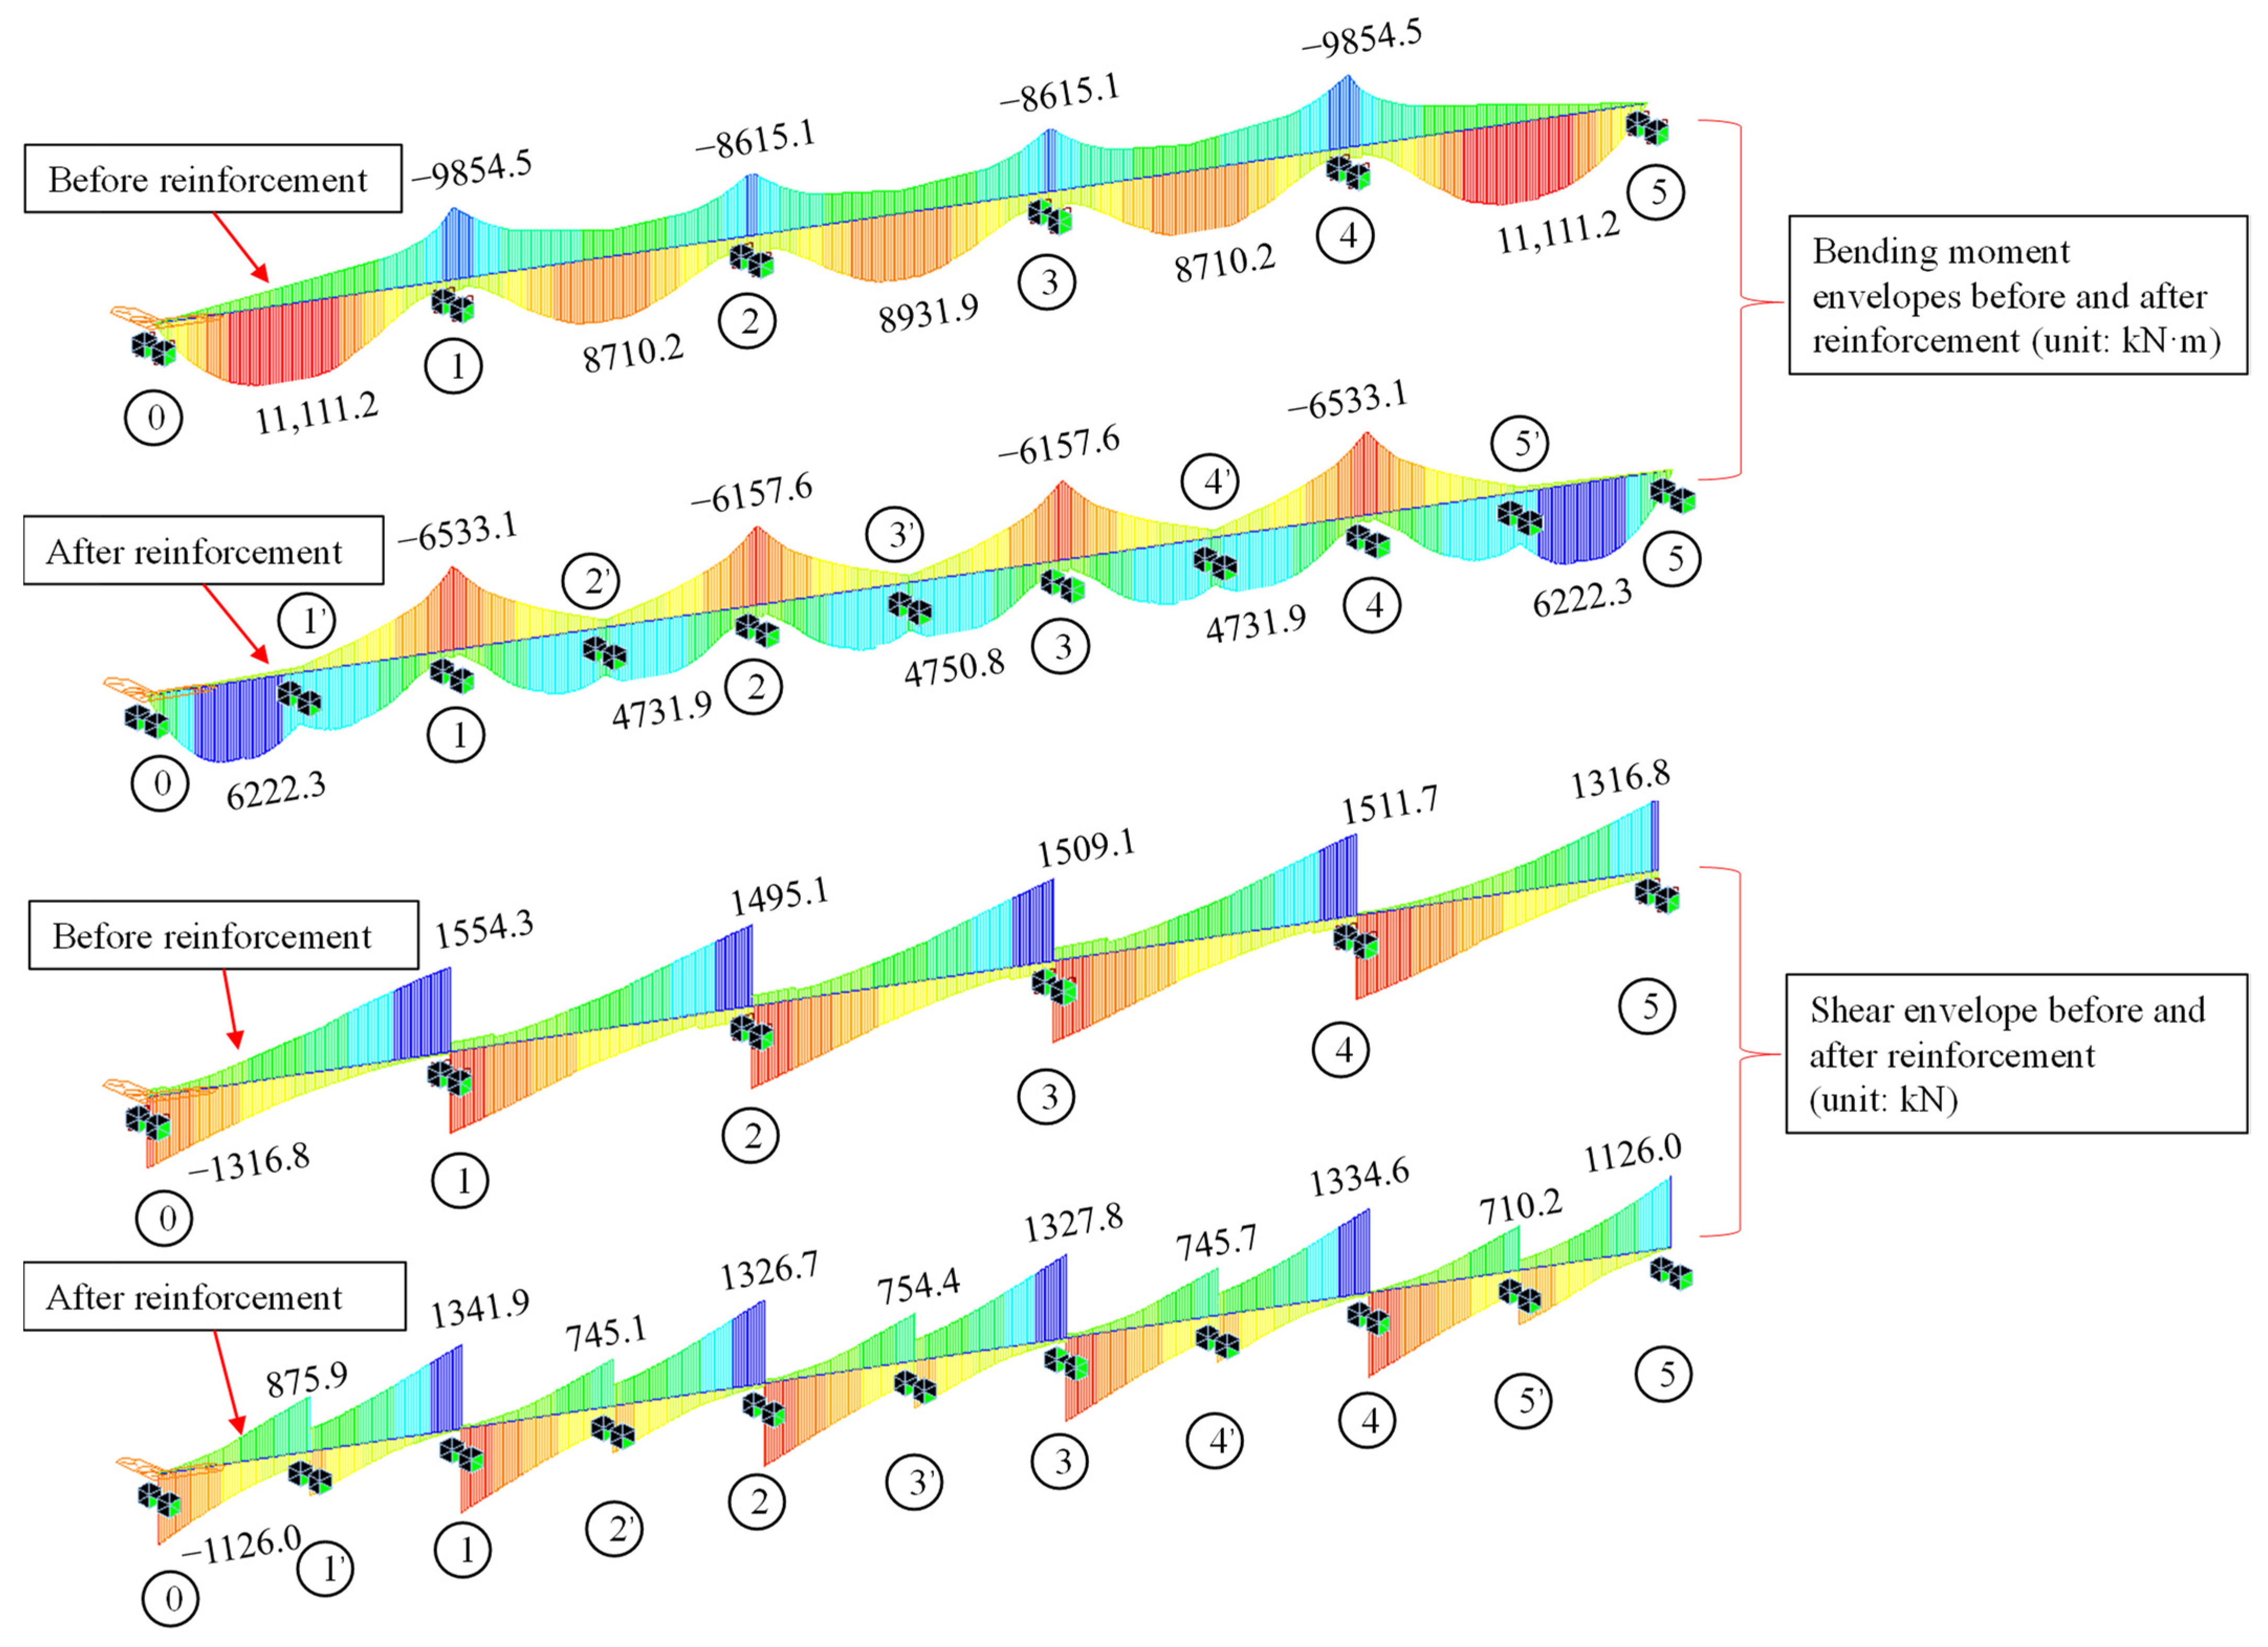
6.1. Analysis of Finite Element Calculation Results

To evaluate the reinforcement effect of Scheme 2, bridge models were established using Midas/Civil finite element analysis software, as shown in Figure 8. According to the specifications in [34], the model is modified according to the situation during the finite element calculation and analysis. For the pre-reinforcement finite element model, structural resistance effects and load effects in the limiting equation of state are corrected by introducing bridge check factor, load-carrying capacity deterioration factors, profile reduction factors, and live load correction factors. For the model after reinforcement, the profile reduction is no longer taken into account in the finite element calculations since the cracks in the structure are eliminated. In addition, the reinforced model adds pier supports 1′ to 5′, which are subjected to vehicle loads jointly with the original piers 1 to 5 and have vertical support stiffness of 100 kN/mm. The bridge models before and after reinforcement are then analyzed.
The results are compared in Figure 9. From the comparison, it can be seen that adding piers and bearings can reduce the maximum bending moment value in the span by 44.00% and reduce the maximum negative bending moment value at the top of the pier by 33.70%. This can significantly improve the bending bearing state of the box girder and inhibit the development of cracks in the top and bottom plates of the box girder. The additional piers and bearings can reduce the maximum shear value of the girder by 13.67%, thus improving the oblique cut-off shear stress and inhibiting the development of oblique cracks in the web of the box girder. The additional piers and bearings can reduce the maximum vertical displacement of the girder by 53.47%, effectively suppressing the deflection of the girder under the action of automobile load. The above analysis results show that the scheme can effectively improve the structural force state and that the reinforcement effect is satisfactory.

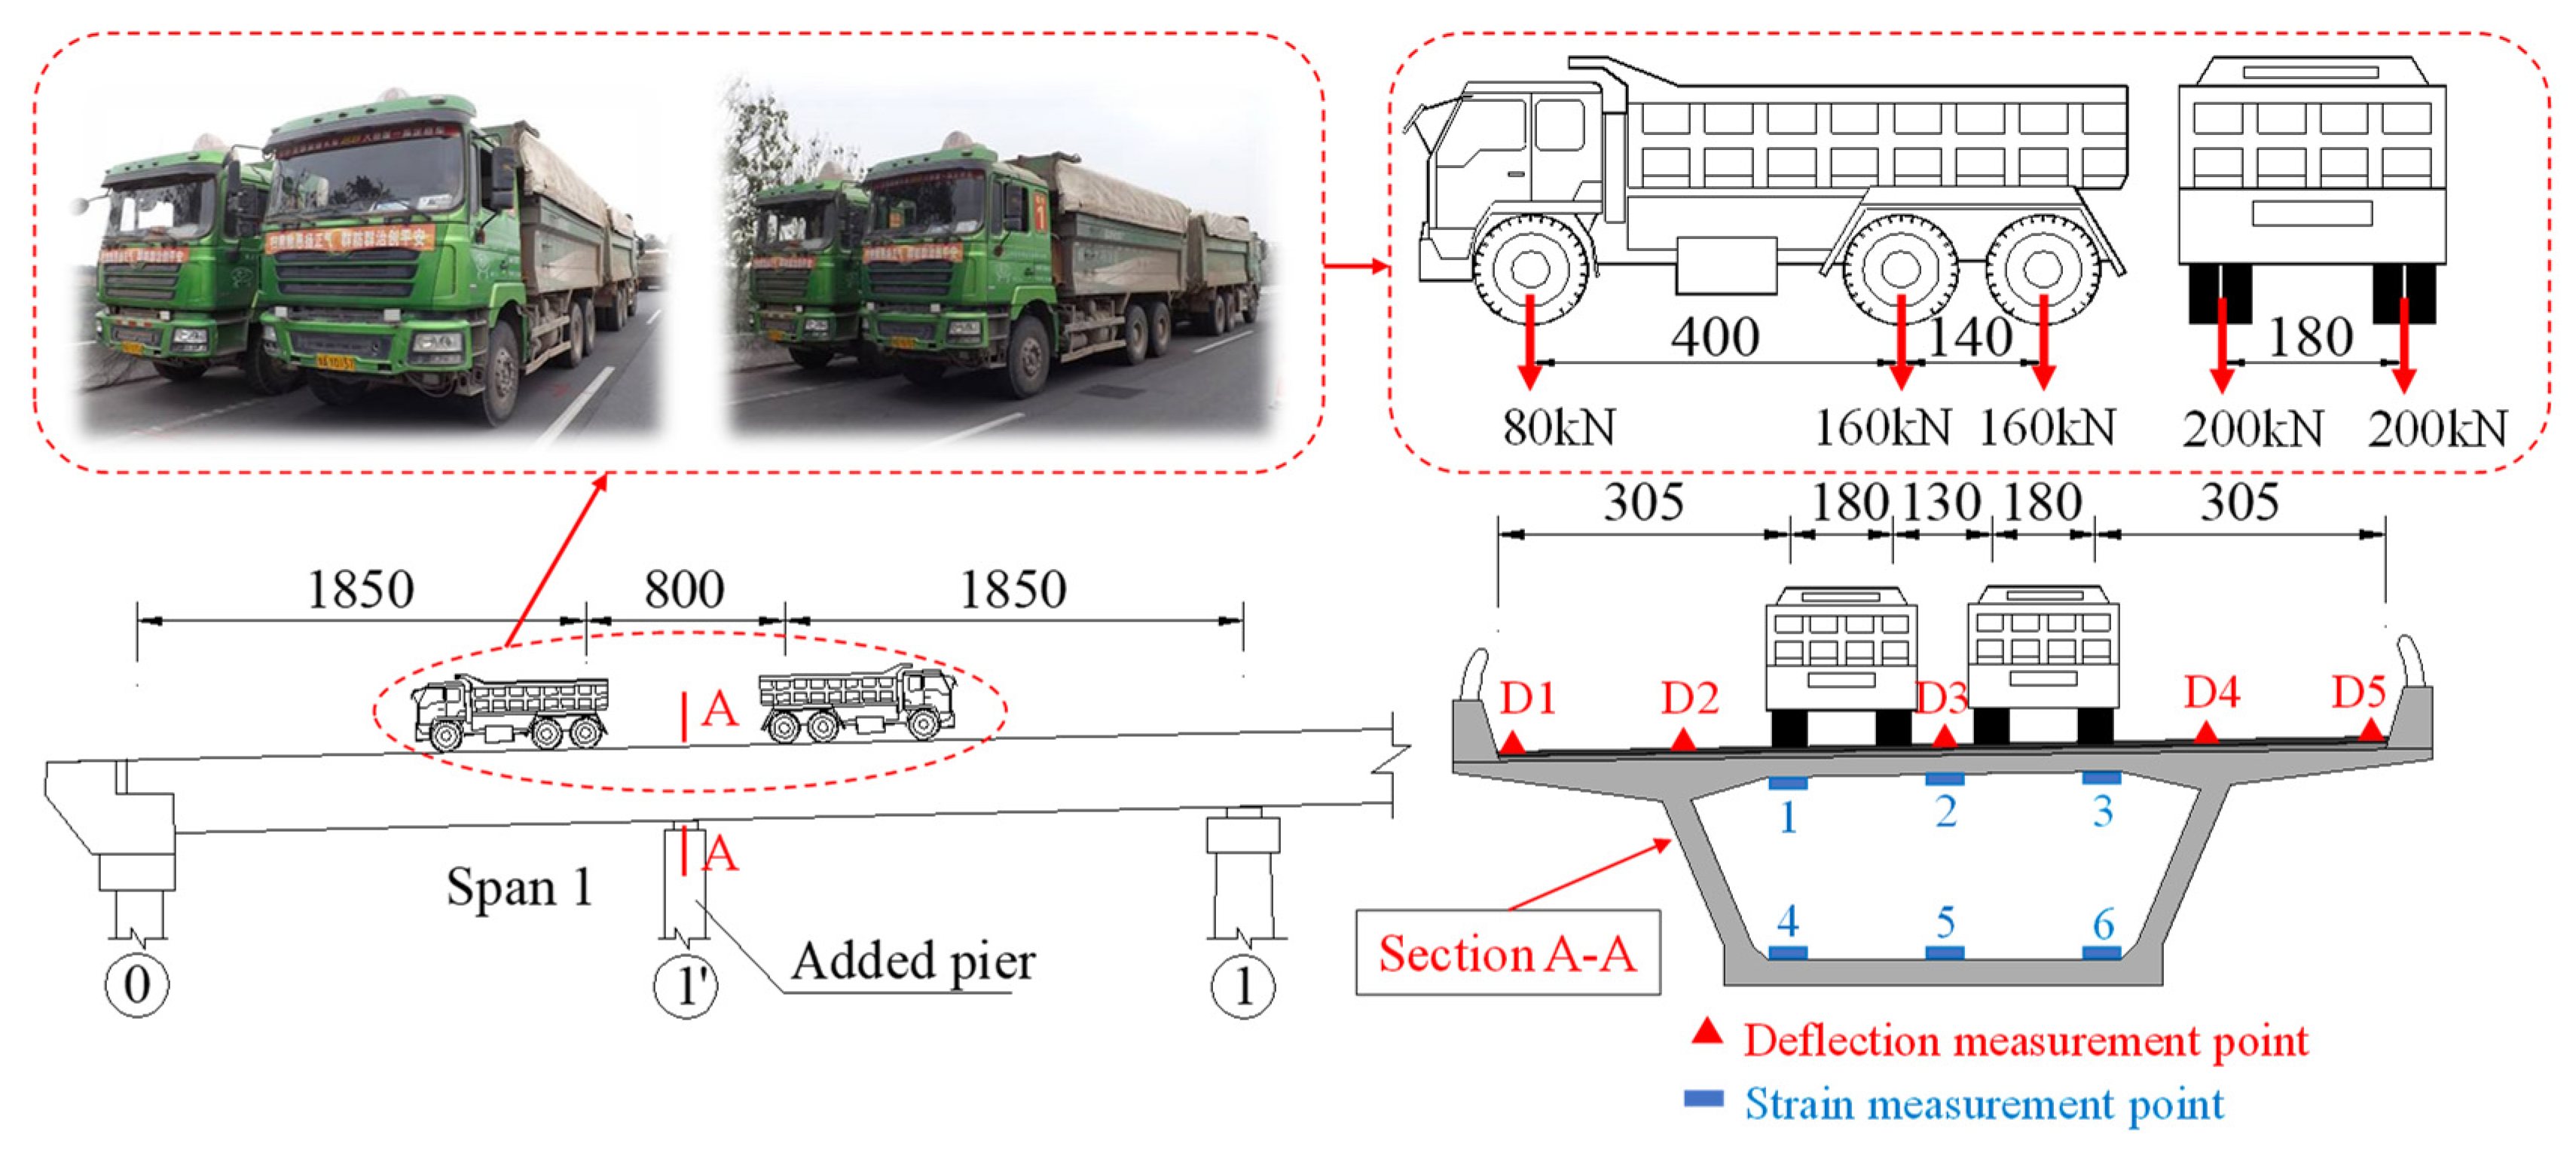
6.2. Load Test Program and Results

A load test is the most direct and effective method to evaluate the carrying capacity of a bridge [35,36,37,38,39]. The reinforcement effect of a bridge can be verified using a load test [5,40]. After the reinforcement is completed using Scheme 2, load tests are next conducted on the bridge using trucks. The test results are compared with theoretical calculations to verify the reinforcement effect. As shown in Figure 10, the load test here uses a three-axle truck with a total weight of 400 kN. According to the specifications in [19,40], the loading efficiency is controlled between 0.95 and 1.05. As shown in Figure 9, the mid-span section of span 1 is selected as the control section and loaded with four trucks. The strain and displacement of the control section are then tested.
The results of Section A-A deflection and strain test under four 400 kN trucks are shown in Table 6. The data results indicate that the deflection calibration coefficients are between 0.79 and 0.89, while the strain calibration coefficients are between 0.76 and 0.93, both of which are less than 1.

6.3. Reinforcement Effect Analysis

The finite element calculation results show that the reinforcement scheme of adding piers can significantly improve the structural force state, with a satisfactory effect. The load test results show that the deflection and strain calibration factors are all less than 1, indicating that the additional piers and bearings have greater force than the theoretical calculations indicate. The actual strengthening effect of the bridge achieves the design goal. The reinforcement is better at improving the force of the girder under live loads, which can inhibit the development of cracks and prolong the service life of the structure.

7. Discussion

On a 95-year-old concrete arch bridge, no corrosion was found in the concrete steel bars [1], indicating that the steel bars can be effectively protected when the concrete is in good condition. However, the tests in this paper show that the probability of steel corrosion in prestressed concrete box girders in service for 25 years exceeds 90%. This result is mainly due to the cracking and carbonation of box girder concrete. The cracking of concrete allows harmful ions, such as chloride ions, in the air to corrode the steel directly and accelerate the development of carbonation depth. Carbonation reduces the PH value of concrete, which further aggravates the development of reinforcement corrosion. Therefore, controlling the development of cracks in prestressed concrete structures during service is very important for developing a reinforcement scheme. Controlling cracks can slow the degradation of material properties.
Vehicle overloading is ubiquitous in Chinese highway transportation [23]. The volume of highway traffic over the last 10 years (Table 2) shows the existence of the overloading phenomenon and the increasing proportion of overloaded vehicles. The long-term effects of vehicle overloading and heavy vehicle loads will undoubtedly lead to damage and destruction of the bridge structure, as confirmed by the rapid development of cracks and deterioration of the technical condition of the bridges over the last 10 years (Table 1).
Bridges often suffer from the dual problems of deteriorating material properties and increasing traffic loads. To solve a reduction in bearing capacity due to material deterioration, strengthening schemes such as replacing members or upgrading the structural system can be applied. Replacing members is undoubtedly a complete solution to the problem, but it is not necessarily the optimal method. Reinforcing prestressed concrete box girder bridges by upgrading the structural system is an effective method [4], which was also confirmed in this paper by the final choice of adding piers through the analytic hierarchy process (AHP). Although AHP has a large number of applications in engineering decision making [29,30,31,32], it also has certain limitations, such as using less quantitative data and more qualitative components that are not as readily convincing. In order to confirm the reinforcement effects, we evaluated the reinforcement impacts based on finite element calculations and load tests and produced a series of quantitative evaluation results, which confirmed the correctness of the reinforcement scheme decision and the reinforcement effect.

8. Conclusions

In the present study, taking the 5 × 45 m prestressed concrete continuous box girder bridge of Lianhuo Expressway as an example, the reasons for the development of cracks in the box girder and changes in the technical condition of the bridge were analyzed, and two schemes for the secondary reinforcement of the bridge were developed. The preferred reinforcement scheme was determined using the analytic hierarchy process (AHP) through a scheme comparison. The bridge was evaluated using a load test after reinforcement to verify the reinforcement effect. Based on the results of the study and tests, the conclusions are as follows.
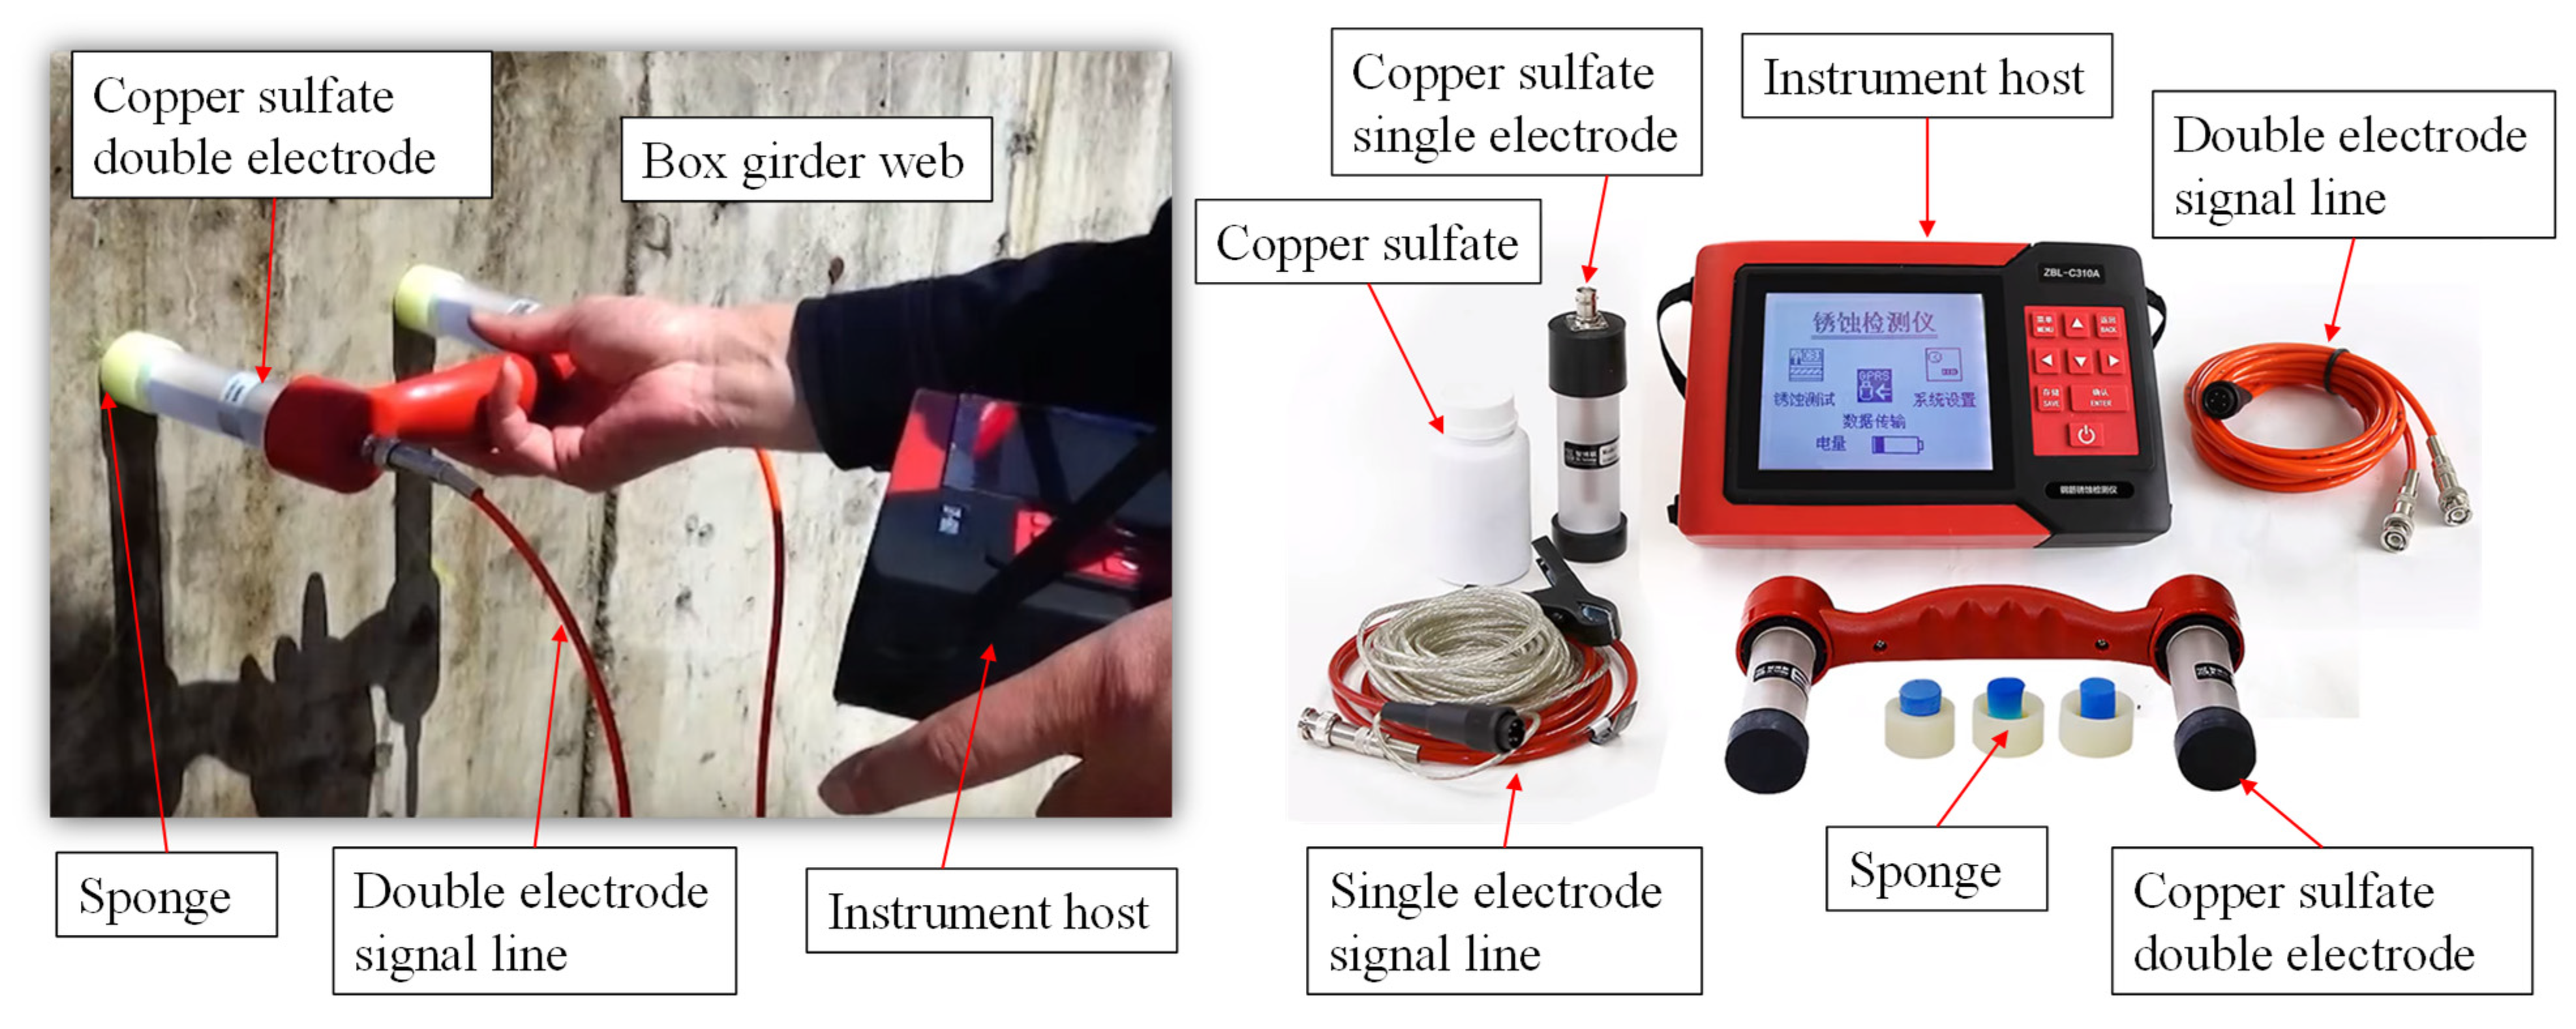
  • After 25 years of service, the concrete, reinforcement, and prestressing bars of the box girder showed significant performance degradation. Corrosion testing of the steel bars in the concrete showed rust activity in the box girders, with a probability of corrosion over 90%. Material performance degradation was determined to be the intrinsic cause of the inadequate load-carrying capacity and box girder cracking.
  • From 2010 to 2020, the total weight of freight increased by 163.08%, and the proportion of heavy trucks and overloaded vehicles in road transport increased rapidly. This increase in traffic volume and the proportion of heavy trucks increased the risk of fatigue failure of the bridge, which was the extrinsic cause of structural damage, and accelerated the development of cracks and bridge performance degradation.
  • Considering the two aspects of restoring the material properties of the structure and improving the structural force, the reinforcement schemes of replacing the main girders and adding piers were, respectively, developed. The advantages and disadvantages of the schemes were analyzed. The reinforcement scheme was chosen by applying the analytic hierarchy process (AHP) considering four aspects: the reinforcement effect, project cost, traffic impact, and social and environmental impacts. The results of the analysis showed that adding piers was better than the other options. The analytic hierarchy process (AHP) is a scientific and effective method for the selection and decision of reinforcement options.
  • The finite element calculation results show that the reinforcement scheme of adding piers can effectively improve the structural force state. The deflection and strain calibration coefficients were less than 1, which indicates that the actual strengthening effect reached the design goal. The reinforcement scheme of adding piers could better improve the force of the main girder under live loads and inhibit the development of cracks.
Notably, in this paper, only two reinforcement schemes were considered for comparison, and the scheme selection was based on this limitation. With the wide range of applications of steel structures and high-performance materials such as UHPC, there are more possibilities for reinforcing prestressed concrete girder bridges. However, the application of new structures and materials tends to increase the cost of the project, so it makes sense to explore the use of economically reasonable new structures and materials for the reinforcement of prestressed concrete bridges in the future.

Author Contributions

Conceptualization, H.L. and J.L.; methodology, J.L.; software, H.L. and D.P.; validation, J.Z. and D.P.; formal analysis, H.L.; investigation, H.L., J.Z. and D.P.; resources, J.L.; data curation, H.L.; writing—original draft preparation, H.L. and J.L.; writing—review and editing, J.L.; visualization, H.L.; supervision, J.L.; project administration, H.L. and J.L.; funding acquisition, H.L. and J.L. All authors have read and agreed to the published version of the manuscript.

Funding

This research was funded by the Transportation Science and Technology Planning Project of Henan Province, China (Grant No. 2021J2, Grant No. 2015X01-2) and Henan Province Major Science and Technology Project, China (Grant No. 151100310900).

Institutional Review Board Statement

Not applicable.

Informed Consent Statement

Not applicable.

Data Availability Statement

All data, models, and code generated or used during this study are available upon request from the corresponding author.

Conflicts of Interest

The authors declare no conflict of interest.

References

  1. Ambroziak, A.; Malinowski, M. A 95-Year-Old Concrete Arch Bridge: From Materials Characterization to Structural Analysis. Materials 2021, 14, 1744. [Google Scholar] [CrossRef] [PubMed]
  2. Miluccio, G.; Losanno, D.; Parisi, F.; Cosenza, E. Traffic-load fragility models for prestressed concrete girder decks of existing Italian highway bridges. Eng. Struct. 2021, 249, 113367. [Google Scholar] [CrossRef]
  3. Cadenazzi, T.; Dotelli, G.; Rossini, M.; Nolan, S.; Nanni, A. Cost and environmental analyses of reinforcement alternatives for a concrete bridge. Struct. Infrastruct. Eng. 2019, 16, 787–802. [Google Scholar] [CrossRef]
  4. Yifan, S.; Wenliang, H.; Yangguang, Y.; Shipu, R. Strengthening Prestressed Concrete Box Girder Bridge by Upgrading Structural System. J. Perform. Constr. Facil. 2020, 34, 04019103. [Google Scholar] [CrossRef]
  5. Zhou, J.; Sun, Z.; Wei, B.; Zhang, L.; Zeng, P. Deflection-based multilevel structural condition assessment of long-span prestressed concrete girder bridges using a connected pipe system. Measurement 2021, 169, 108352. [Google Scholar] [CrossRef]
  6. Morgese, M.; Ansari, F.; Domaneschi, M.; Cimellaro, G.P. Post-collapse analysis of Morandi’s Polcevera viaduct in Genoa Italy. J. Civ. Struct. Health Monit. 2019, 10, 69–85. [Google Scholar] [CrossRef]
  7. Haveresch, K. Nachrechnen und Verstärken älterer Spannbetonbrücken. Beton-und Stahlbetonbau 2011, 106, 89–102. [Google Scholar] [CrossRef]
  8. Kim, S.-H.; Park, J.-S.; Jung, W.-T.; Kim, T.-K.; Park, H.-B. Experimental Study on Strengthening Effect Analysis of a Deteriorated Bridge Using External Prestressing Method. Appl. Sci. 2021, 11, 2478. [Google Scholar] [CrossRef]
  9. Reichenbach, S.; Preinstorfer, P.; Hammerl, M.; Kromoser, B. A review on embedded fibre-reinforced polymer reinforcement in structural concrete in Europe. Constr. Build. Mater. 2021, 307, 124946. [Google Scholar] [CrossRef]
  10. Shimada, Y.; Yamada, S.; Kishiki, S.; Hasegawa, T.; Takeuchi, T. Method of reinforcement for joints between steel roofs and RC columns in existing buildings. Eng. Struct. 2020, 209, 110255. [Google Scholar] [CrossRef]
  11. Vecchi, F.; Franceschini, L.; Tondolo, F.; Belletti, B.; Sánchez Montero, J.; Minetola, P. Corrosion morphology of prestressing steel strands in naturally corroded PC beams. Constr. Build. Mater. 2021, 296, 123720. [Google Scholar] [CrossRef]
  12. Kramer, K.W. Load-Deflection Response of Prestressed Concrete Beams Strengthened with FRP: A Comprehensive Perspective; ProQuest LLC: Ann Arbor, MI, USA, 2020. [Google Scholar]
  13. Liu, B.; Huang, J.; Xing, G. Crack behavior of concrete beam in flexure strengthened with NSM prestressing screw-thread steel bars. Mater. Struct. 2020, 53, 80. [Google Scholar] [CrossRef]
  14. Zou, J.H.; Huang, Y.H.; Feng, W.X.; Chen, Y.H.; Huang, Y. Experimental study on flexural behavior of concrete T-beams strengthened with externally prestressed tendons. Math. Biosci. Eng. 2019, 16, 6962–6974. [Google Scholar] [CrossRef] [PubMed]
  15. Leicht, L.; Roberts-Wollmann, C.L.; Koutromanos, I.; Hebdon, M.H.; Mosig, O. Experimental and Analytical Investigation of a 64-Year-Old Prestressed Beam Retrofitted with External Posttensioning. J. Bridge Eng. 2022, 27, 04022015. [Google Scholar] [CrossRef]
  16. Jia, L.; Tao, L.; Hong, H.; Jian, J.; Zhi, H. Experimental Test on Bridge Reinforcement by Enlarging Section-Prestress Method. In Proceedings of the 2nd International Conference on Civil Architecture and Energy Science, CAES 2020, Changchun, China, 20–22 March 2020. [Google Scholar]
  17. Zhang, X.; Li, S.; Zhang, W.; Ikechukwu, O.; Dai, L.; Wang, L. Second Remediation of Long-Term Deflection and Cracking of PT Box-Girder Bridge Using External Post-Tensioning. J. Perform. Constr. Facil. 2020, 34, 04020090. [Google Scholar] [CrossRef]
  18. Tan, Y.; Zhang, Z.; Wang, H.; Zhou, S. Gray Relation Analysis for Optimal Selection of Bridge Reinforcement Scheme Based on Fuzzy-AHP Weights. Math. Probl. Eng. 2021, 2021, 8813940. [Google Scholar] [CrossRef]
  19. Ministry of Transport of the People’s Republic of China. Standards for Technical Condition Evaluation of Highway Bridges; China Communications Press: Beijing, China, 2011; pp. 4–110.
  20. Wu, L.; Kaewunruen, S. Performance and durability of concrete structures in railway environment under extreme climate. In Proceedings of the 1st International Conference on Rail Transportation 2017: Railway Development, Operations, and Maintenance, ICRT 2017, Chengdu, China,, 10–12 July 2017. [Google Scholar]
  21. Zhuang, C.; Zhang, J.; Jiang, R. Fatigue Flexural Performance of Short-Span Reinforced Concrete T-Beams Considering Overloading Effect. Balt. J. Road Bridge Eng. 2020, 15, 89–110. [Google Scholar] [CrossRef]
  22. Fu, G.; Hag-Elsafi, O. Vehicular Overloads: Load Model, Bridge Safety, and Permit Checking. J. Bridge Eng. 2000, 5, 49–57. [Google Scholar] [CrossRef]
  23. Huang, C.; Zhang, J.; Yi, Z. Research on Vehicle Overloading Influenced to Roadbed. In Proceedings of the Eighth International Conference of Chinese Logistics and Transportation Professionals (ICCLTP), Chengdu, China, 8–10 October 2008; pp. 2528–2533. [Google Scholar]
  24. Deng, L.; Wang, W.; Yu, Y. State-of-The-Art Review on the Causes and Mechanisms of Bridge Collapse. J. Perform. Constr. Facil. 2016, 30, 04015005. [Google Scholar] [CrossRef]
  25. Wu, C.; Wu, P.; Wang, J.; Jiang, R.; Chen, M.; Wang, X. Critical review of data-driven decision-making in bridge operation and maintenance. Struct. Infrastruct. Eng. 2020, 18, 47–70. [Google Scholar] [CrossRef]
  26. Peraza, D.B.; Erdem, I. Bridge collapse during demolition. In Proceedings of the 8th Congress on Forensic Engineering 2018: Forging Forensic Frontiers, Austin, TX, USA, 29 November–2 December 2018. [Google Scholar]
  27. Woodson, R.D. Appendix I—Background Facts and Issues Concerning Cement and Cement Data. In Concrete Portable Handbook; Woodson, R.D., Ed.; Butterworth-Heinemann: Boston, MA, USA, 2012; pp. 195–283. [Google Scholar]
  28. Webster, M.D.; Meryman, H.; Kestner, D.M. Carbon emissions and building structure: What the structural engineer needs to know about carbon in the 21st century. In Proceedings of the Structures Congress 2011, Las Vegas, NV, USA, 14–16 April 2011. [Google Scholar]
  29. Akaa, O.U.; Abu, A.; Spearpoint, M.; Giovinazzi, S. A group-AHP decision analysis for the selection of applied fire protection to steel structures. Fire Saf. J. 2016, 86, 95–105. [Google Scholar] [CrossRef]
  30. Andreolli, F.; Bragolusi, P.; D’Alpaos, C.; Faleschini, F.; Zanini, M.A. An AHP model for multiple-criteria prioritization of seismic retrofit solutions in gravity-designed industrial buildings. J. Build. Eng. 2022, 45, 103493. [Google Scholar] [CrossRef]
  31. Contreras-Nieto, C.; Shan, Y.; Lewis, P.; Hartell, J.A. Bridge maintenance prioritization using analytic hierarchy process and fusion tables. Autom. Constr. 2019, 101, 99–110. [Google Scholar] [CrossRef]
  32. Ikpong, A.; Chandra, A.; Bagchi, A. Alternative to AHP approach to criteria weight estimation in highway bridge management. Can. J. Civ. Eng. 2021, 48, 1181–1191. [Google Scholar] [CrossRef]
  33. Coyle, G. The Analytic Hierarchy Process: Practical Strategy. Open Access Material, AHP; Pearson Education Limited: London, UK, 2004. [Google Scholar]
  34. Ministry of Transport of the People’s Republic of China. Specification for Inspection and Evaluation of Load-Bearing Capacity of Highway Bridges; China Communications Press: Beijing, China, 2011; pp. 1–40.
  35. Abedin, M.; De Caso y Basalo, F.J.; Kiani, N.; Mehrabi, A.B.; Nanni, A. Bridge load testing and damage evaluation using model updating method. Eng. Struct. 2022, 252, 113648. [Google Scholar] [CrossRef]
  36. Jeon, S.H.; Yim, H.J.; Huh, J.; Cho, K.-I.; Ahn, J.-H. Full-scale field testing of a precast concrete buried arch bridge with steel outriggers: Field loading test. Eng. Struct. 2021, 242, 112563. [Google Scholar] [CrossRef]
  37. Kovács, N.; Kövesdi, B.; Dunai, L.; Takács, B. Loading Test of the Rákóczi Danube Bridge in Budapest. Procedia Eng. 2016, 156, 191–198. [Google Scholar] [CrossRef] [Green Version]
  38. Lantsoght, E.O.L.; van der Veen, C.; de Boer, A.; Hordijk, D.A. State-of-the-art on load testing of concrete bridges. Eng. Struct. 2017, 150, 231–241. [Google Scholar] [CrossRef] [Green Version]
  39. Park, Y.H.; Park, C.; Park, Y.G. The behavior of an in-service plate girder bridge strengthened with external prestressing tendons. Eng. Struct. 2005, 27, 379–386. [Google Scholar] [CrossRef]
  40. Ministry of Transport of the People’s Republic of China. Load Test Methods for Highway Bridge; China Communications Press: Beijing, China, 2015; p. 64.
Figure 1. Layout plan and photo of the bridge (unit: cm).
Buildings 12 01771 g001
Figure 2. Diagram of the external prestressing arrangement of the first span (unit: cm).
Buildings 12 01771 g002
Figure 3. Corrosion potential testing of steel bars in concrete.
Buildings 12 01771 g003
Figure 4. Overall replacement of the girder (unit: cm).
Buildings 12 01771 g004
Figure 5. Scheme 1 cross section layout of bridge (unit: cm).
Buildings 12 01771 g005
Figure 6. Reinforcement schematic of Scheme 2 (unit: cm).
Buildings 12 01771 g006
Figure 7. Hierarchical model for selecting the optimal scheme.
Buildings 12 01771 g007
Figure 8. Bridge finite element models.
Buildings 12 01771 g008
Figure 9. Bending moment and shear envelopes before and after reinforcement.
Buildings 12 01771 g009
Figure 10. Loading test truck and measuring point arrangement (unit: cm).
Buildings 12 01771 g010
Table 1. The crack development process of the bridge.
Inspection YearCracks in the 5 × 45 m Continuous Box Girder (Strip)Technical Status Rating
Longitudinal Cracks in the Top PlateWeb Vertical CracksDiagonal Cracks in the WebTransverse Cracks in the Bottom PlateLongitudinal Cracks in the Bottom Plate
2000001311Class II—good state
2002015511Class III—bad state
2005018411Class IV—dangerous state (Reinforcement)
2008–201600000Class II—good state
2017001106Class II—good state
20182901106Class III—bad state
2019149132446Class IV—dangerous state
2020165153386Class IV—dangerous state
Table 2. Statistics of China’s road traffic (2010~2020).
YearTotal Number of Vehicles
(10,000 vehicles)
Passenger VehicleCargo Vehicle
Total Number (10,000 vehicles)Total Seats (10,000 seats)Large Buses (10,000 vehicles)Total Number (10,000 vehicles)Total Cargo Weight
(10,000 tons)
20101133.3283.132017.0924.781050.195999.82
20111263.7584.342086.6626.831179.417261.20
20121339.9086.712166.5528.701253.198062.14
20131504.7485.262170.2629.901419.489613.91
20141537.9484.582189.5530.671453.3610,292.47
20151473.1283.932148.5830.491389.1910,366.50
20161435.7784.002140.2630.571351.7710,826.78
20171450.2381.612099.1830.571368.6211,774.81
20181435.4879.662048.1130.271355.8212,872.97
20191165.4977.672002.5330.311087.8213,587.00
20201171.5461.261840.89/1110.2815,784.17
Table 3. Comparative analysis of reinforcement schemes.
Reinforcement SchemesComparative Factors of the Two Schemes
Reinforcement EffectsConstruction CostsTraffic ImpactSocial and Environmental Impacts
Scheme 1 The reinforcement effect is very good, and the bridge bearing capacity can be fully restored.The estimated cost is about 40 million yuan.Large impact: The total construction period is about 8 months, during which the traffic is interrupted.Large impact: The reconstruction cost is high, and the life span of the bridge is much shorter than the design life, which has a large social impact; the demolition of the bridge will cause some noise, dust, and concrete waste; at least 2360.5 t of carbon dioxide emissions will be generated.
Scheme 2 The reinforcement effect is good, diseases can be eliminated, and structural stress can be improved.The estimated cost is about 21 million yuan.General impact: The total construction period lasts about 6 months, and the traffic interruption lasts about 1 month.General impact: The reinforcement cost is relatively low, which can prolong the service life of the bridge and has a small social impact; the construction difficulty is small, and the environmental impact is relatively small; about 2677.3 t of carbon dioxide emissions will be generated.
Table 4. The 1~9 scales for pairwise comparisons in the AHP [33].
Importance IntensityDefinition
1Equal importance
3Moderate importance of one over another
5Strong importance of one over another
7Very strong importance of one over another
9Extreme importance of one over another
2,4,6,8Intermediate values
ReciprocalsReciprocals for inverse comparison
Table 5. Calculation results of the discriminant matrices.
MatrixesEigenvector λ max CIRICR
A a = ( 0.6354 , 0.2507 , 0.1574 , 0.7132 ) T 4.04880.01630.890.0183
B1 b 1 = ( 0.9806 , 0.1961 ) T 2.0000000
B2 b 2 = ( 0.1961 , 0.9806 ) T 2.0000000
B3 b 3 = ( 0.3162 , 0.9487 ) T 2.0000000
B4 b 4 = ( 0.2425 , 0.9701 ) T 2.0000000
Indicators C I = ( λ max n ) / ( n 1 ) , C R = C I / R I , n is the matrix order and RI is the random consistency indicator.
Table 6. The girder deflection and strain test results.
Deflection Measuring PointsDeflection Test ResultsStrain Measurement PointsStrain Test Results
Measured Value (mm)Theoretical Calculated Value (mm)Check Validation CoefficientMeasured Value (με)Theoretical Calculated Value (με)Check Validation Coefficient
D1−2.82−3.5920.791−32.1−42.00.76
D2−3.02−3.5920.842−35.6−42.00.85
D3−3.19−3.5920.893−33.9−42.00.81
D4−3.13−3.5920.87479.586.40.92
D5−3.04−3.5920.85580.286.40.93
////678.686.40.91
Publisher’s Note: MDPI stays neutral with regard to jurisdictional claims in published maps and institutional affiliations.

