1. Introduction
Vapor barrier systems are used in temperate and cold climates to ensure the required airtightness and to reduce diffusion of water vapor into the building envelope [
1,
2]. The temperate climate zones are located in the regions of the earth between the tropic regions and the polar regions. Temperate climates are characterized by relatively moderate mean annual temperatures, with average monthly temperatures above 10 °C in their warmest months and above −3 °C in their colder months [
3]. Most regions with a temperate climate present four seasons, and temperatures can change greatly between summer and winter [
4]. In these climates, airtightness is also required to reduce energy consumption and is specified as a requirement in some building regulations, e.g., [
5]. Reducing diffusion secures against high levels of moisture within the thermal insulated building envelope [
6]. Independently of whether an air barrier or a vapor barrier is needed, the tightness of the joints between its components is crucial [
2]. Furthermore, the joints must stay tight throughout the service life of the membrane. In this case, joints are defined as the seam between two lengths of membrane, and joints between membrane and other building parts. Tapes or adhesives can be used to seal joints. Manufacturers sell membranes and sealants as system solutions, preferably including collars for any pipes that may penetrate the membrane. Using a system solution is a way to ensure that membranes and sealants are compatible and a system solution is usually required by manufactures to guarantee product performance.
Polyethylene (PE) membranes are frequently used as vapor barriers that, together with a specified tape, perform as system solutions. In the past, it was common for PE membranes to be made from pure (virgin or 100% new) PE, but today, an increasing number of membranes on the market contain regenerated, or a mixture of regenerated and pure polyethylene. As part of the increased interest in sustainability in construction [
7,
8,
9,
10], it is expected that demand will increase for fully or partially-regenerated membranes.
Virgin PE is defined as a material that has been fabricated only once. Whereas 100% new PE is defined as a material that has not been used after fabrication as well as offcuts and residual material from the production of virgin PE. This 100% new PE contains a significant proportion of the additives from the production of virgin PE. The quantity and the types of additives in 100% new PE varies. Regenerated PE is fabricated from collected, post-use plastic, also called recycled plastic. The plastic is sorted, cleaned, and washed before it is melted and supplemented with additives. A combination of pure and regenerated PE is used to fabricate a layered membrane. The base layer comprises regenerated PE and thinner layers of 100% new PE or virgin PE are added to one or both sides of the base layer.
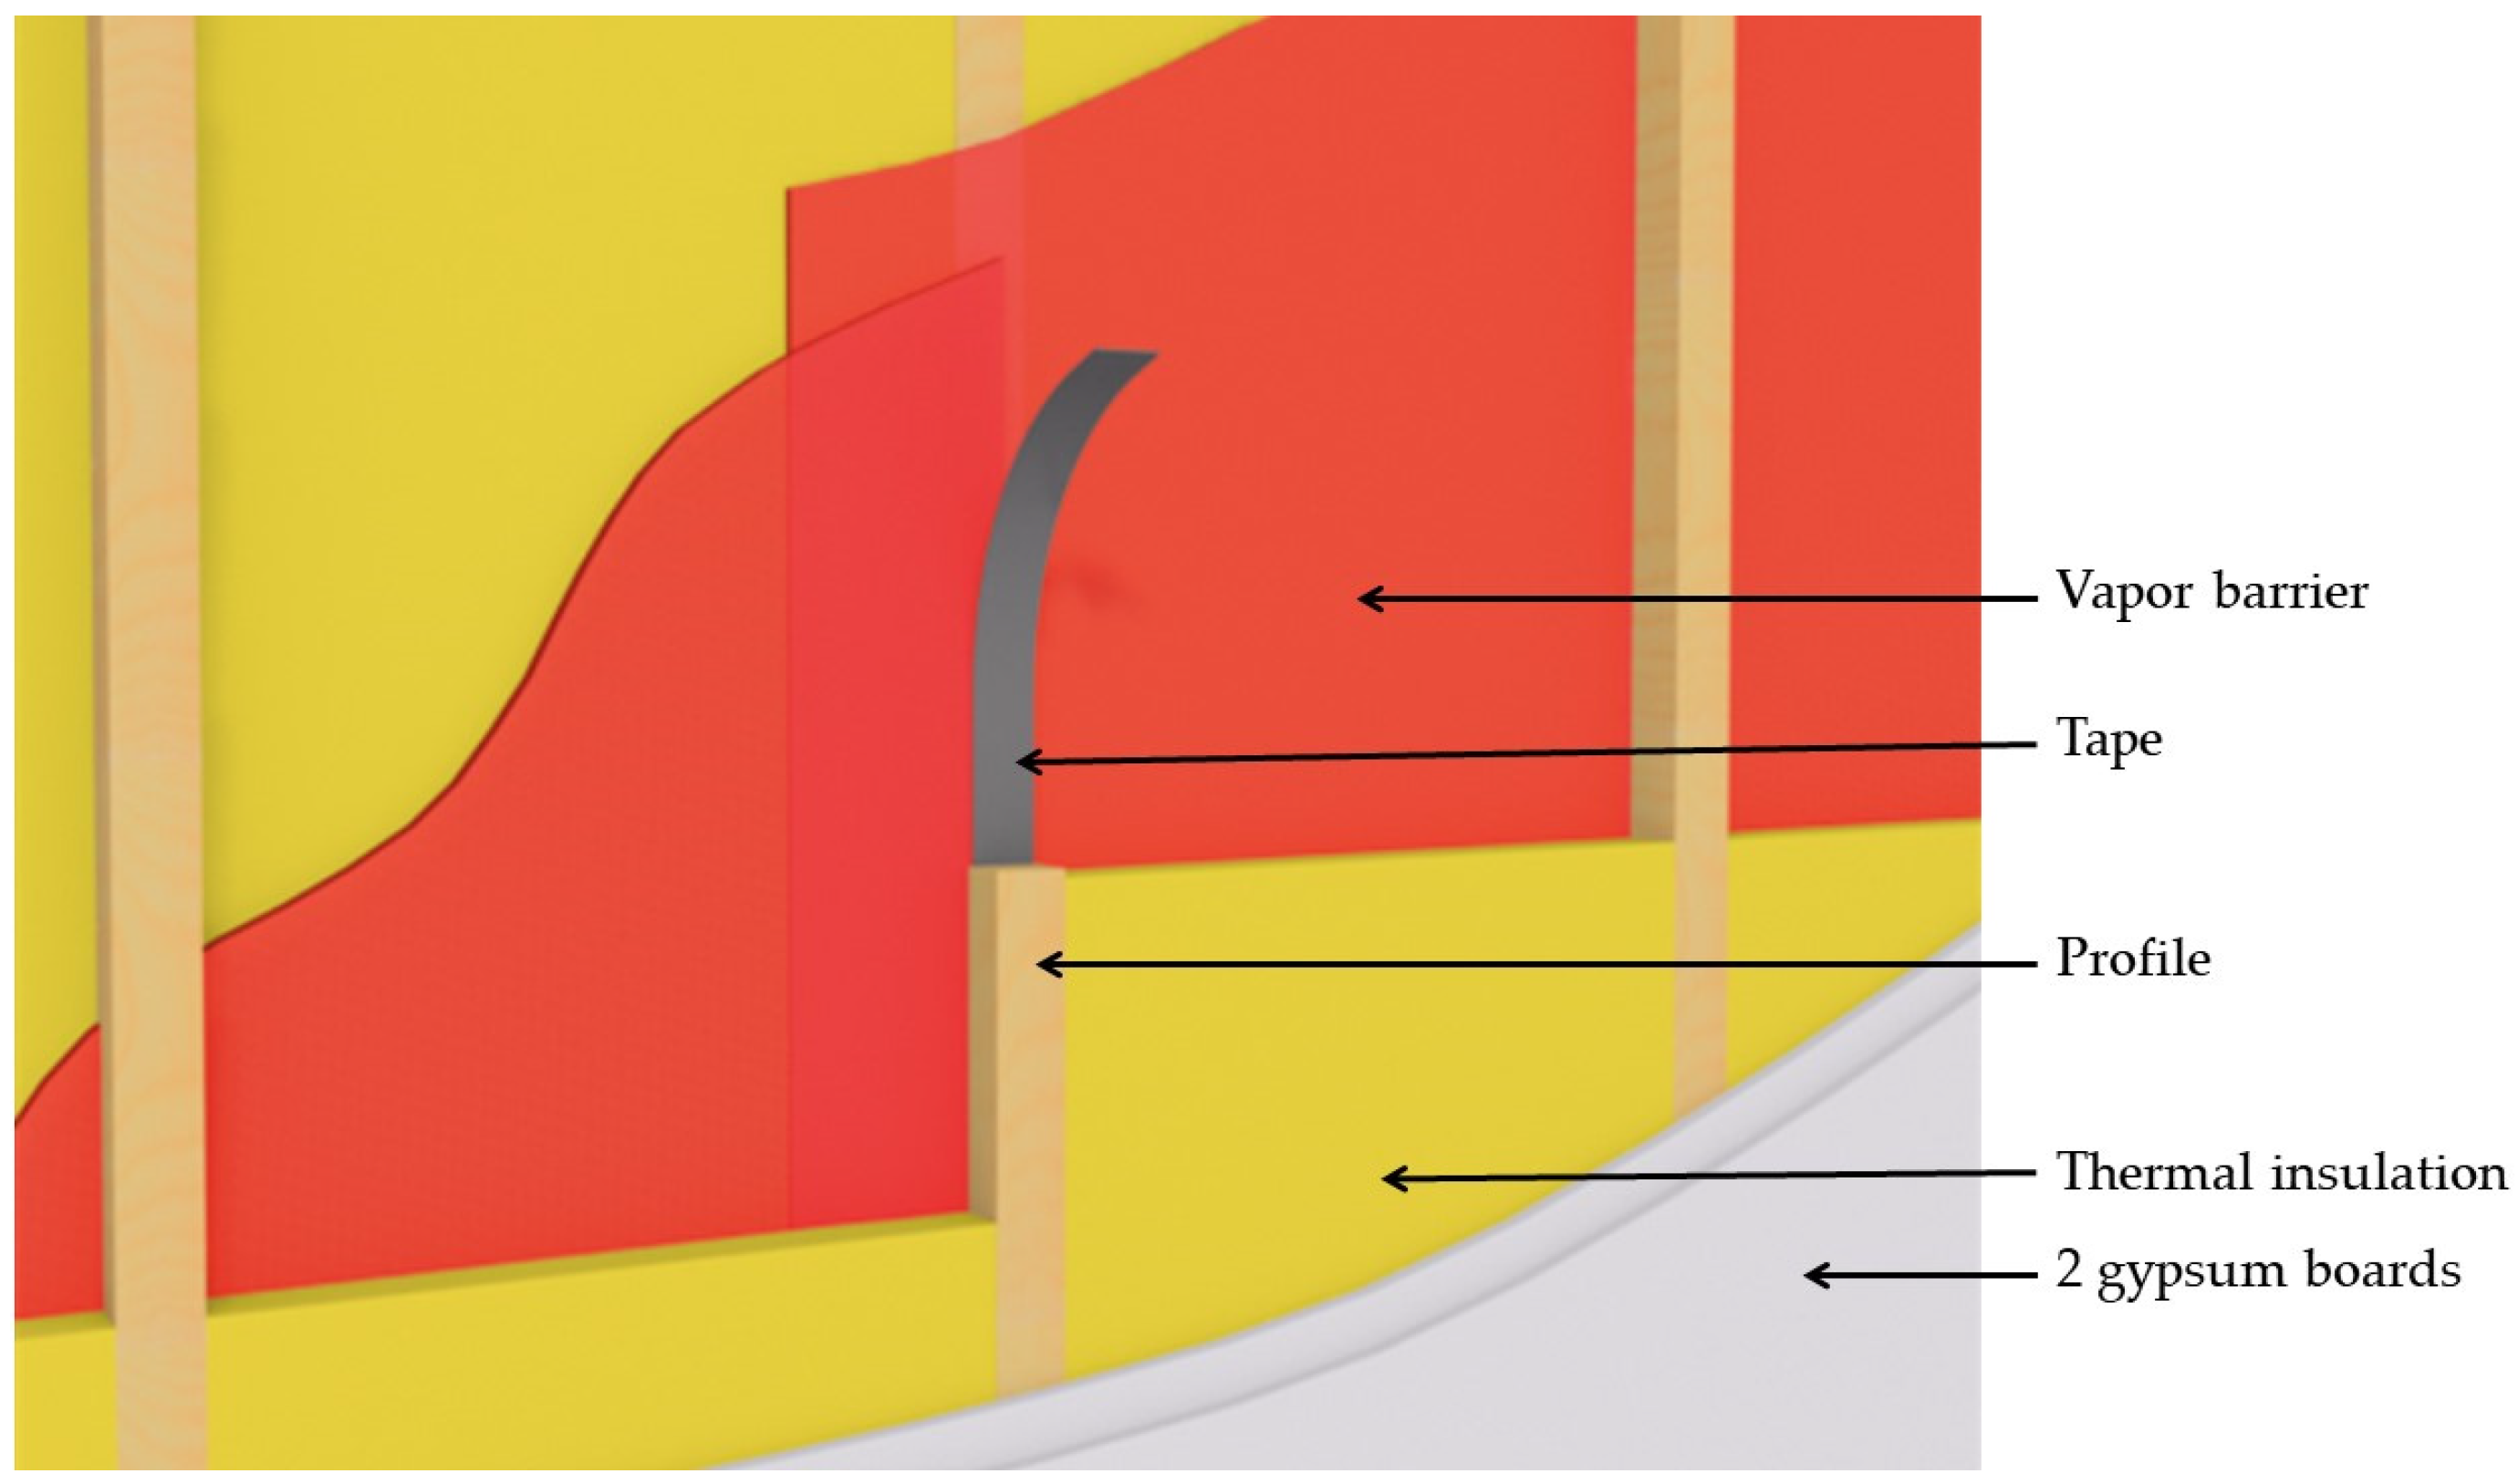
Vapor barrier systems in temperate and cold climates are mounted on the warm side of the thermal insulated exterior building envelope [
11]; see
Figure 1. Knowledge and experience of vapor barrier systems comprising membranes of pure PE (100% new PE and virgin PE) has been acquired through years of use. However, knowledge and documentation of the performance, particular in the long-term, of newer vapor barriers containing regenerated PE membranes are lacking [
12].
This paper assesses the long-term performances of vapor barrier systems comprising PE membranes joined with the appropriate tape or butyl adhesive. Furthermore, the paper identifies, evaluates and compares the compositions, durability and long-term performances of vapor barrier membranes comprising virgin PE, 100% new PE, regenerated PE and a single membrane comprising PE layered with virgin and regenerated materials. Commercially available vapor barrier systems comprising nine different membranes were selected for examination and purchased. Membranes were assessed both before and after accelerated thermal aging using chemical analyses and physicomechanical tests to determine the material properties and stabilities of the membranes as well as the strength of joints.
2. Materials and Methods
Tests were performed to determine the material properties of vapor barrier systems and the stabilities of the membranes. Samples from vapor barrier systems were assessed using six types of chemical analyses and 13 physicomechanical tests. Samples comprised both membranes and joined membranes using adhesives as tape and butyl, respectively. All test methods were based on standardised methods described by the standard [
13] and in ISO or DIN standards. The exceptions were the chemical analyses that followed standard laboratory protocols performed with specialized equipment and visual examination. Most of the tests were performed both before and after aging.
2.1. Materials
The tested vapor barrier systems were selected from those most commonly used by contractors in Denmark. Nine different vapor barrier systems were selected for the study comprising nine different PE membranes. PE membranes comprised two fabricated from virgin PE, two from 100% new PE and five from regenerated PE. One of the five membranes of regenerated PE, according to its manufacturer, consisted of a base layer of regenerated PE between two layers of pure PE. One roll of each membrane and associated tape was purchased from retail building material businesses located randomly in Denmark to maintain independency from the suppliers. An additional five rolls of each of the membranes containing regenerated PE were purchased for visual examination. Each roll contained between 250 and 500 m
2 of membrane. The properties of the membranes (identified by ID numbers) provided by the manufacturers are shown in
Table 1. Membranes comprising virgin PE were identified as T7482-1 and T7482-2. Membranes comprising 100% new PE were numbered as T7482-3 and T7482-4. Membranes comprising regenerated PE were known as T7482-5, T7482-6, T7482-7, and T7482-9. One membrane, denoted as T7482-8 contained three layers of PE, comprising one base layer of regenerated PE sandwiched between two layers of virgin PE. ID numbers assigned to membranes are also used for presenting results for adhesive strength of taped joints for vapour barrier systems and adhesive strength of joints using butyl.
2.2. Aging
Accelerated thermal aging was used to predict the long-term performance of membranes within a convenient period of time. All evaluation tests were performed both on unaged and aged samples, except for the chemical tests comprising Beilstein test, X-ray fluorescence spectroscopy (XRF) and the Loss on Ignition test which were only conducted on unaged samples and not expected to change with time, see
Table 2.
Aging was performed by placing the samples for 84 days in a climate chamber at 70 ± 2 °C and 90 ± 2% relative humidity (RH), followed by 84 days at 70 °C and RH lower than 10 ± 2% RH to examine the effect of change in RH. In addition, samples of membranes were exposed to an extended aging period comprising 80 days in a climate chamber at 70 °C and RH lower than 10 ± 2% to further examine long term performance of membranes.
When aging plastic, temperature is often used as the accelerating parameter. The higher the temperature, the faster the evaporation of the volatile substances in the material, and the faster changes occur in the molecular structure and thus the mechanical properties of the material. The relationship between thermal aging and the choice of temperature can generally be described by the Arrhenius’ velocity expression [
14], relating the rate of aging, k, the time, t, and the temperature, T. The relationship may be described by the expression:
where:
E = the activation energy for the primary degradation reaction
A = the pre-exponential factor
R = the universal gas constant [J/(mol∙K)]
T = temperature [K].
From the expression, it is clear that the speed of the aging or degradation reaction doubles each time the temperature is increased by 10 °C. Holmström and colleagues have investigated whether this also applies to LDPE, and the work is referenced in Verksnorm, 2000, published by Sveriges Plastförbund [
15].
Assuming that a vapor barrier when used in the finished building has an average temperature of 10 °C, an aging temperature of 70 °C will correspond to: 2(60/10) = 64 times faster aging. Additionally, 100 days aging at 70 °C corresponds to 6400 days, i.e., natural aging of approximately 18 years at 10 °C. Assuming that the vapor barrier when used in the finished building has an average temperature of 20 °C, 168 days aging at 70 °C corresponds to natural aging of approximately 15 years at 20 °C. Moreover, 218 (168 + 50) days aging at 70 °C corresponds to approximately 19 years of real time, calculated on the basis that the service temperature of the membranes and assembled systems is 20 °C and 248 (168 + 50 + 30) days aging at 70 °C corresponds to approximately 22 years of real time.
2.3. Chemical Analyses
Five samples of each membrane were analysed to determine their chemical structures both before and after aging. The analyses performed are shown in
Table 2.
2.3.1. Attenuated Total Reflection—Fourier Transform Infrared (ATR-FTIR)
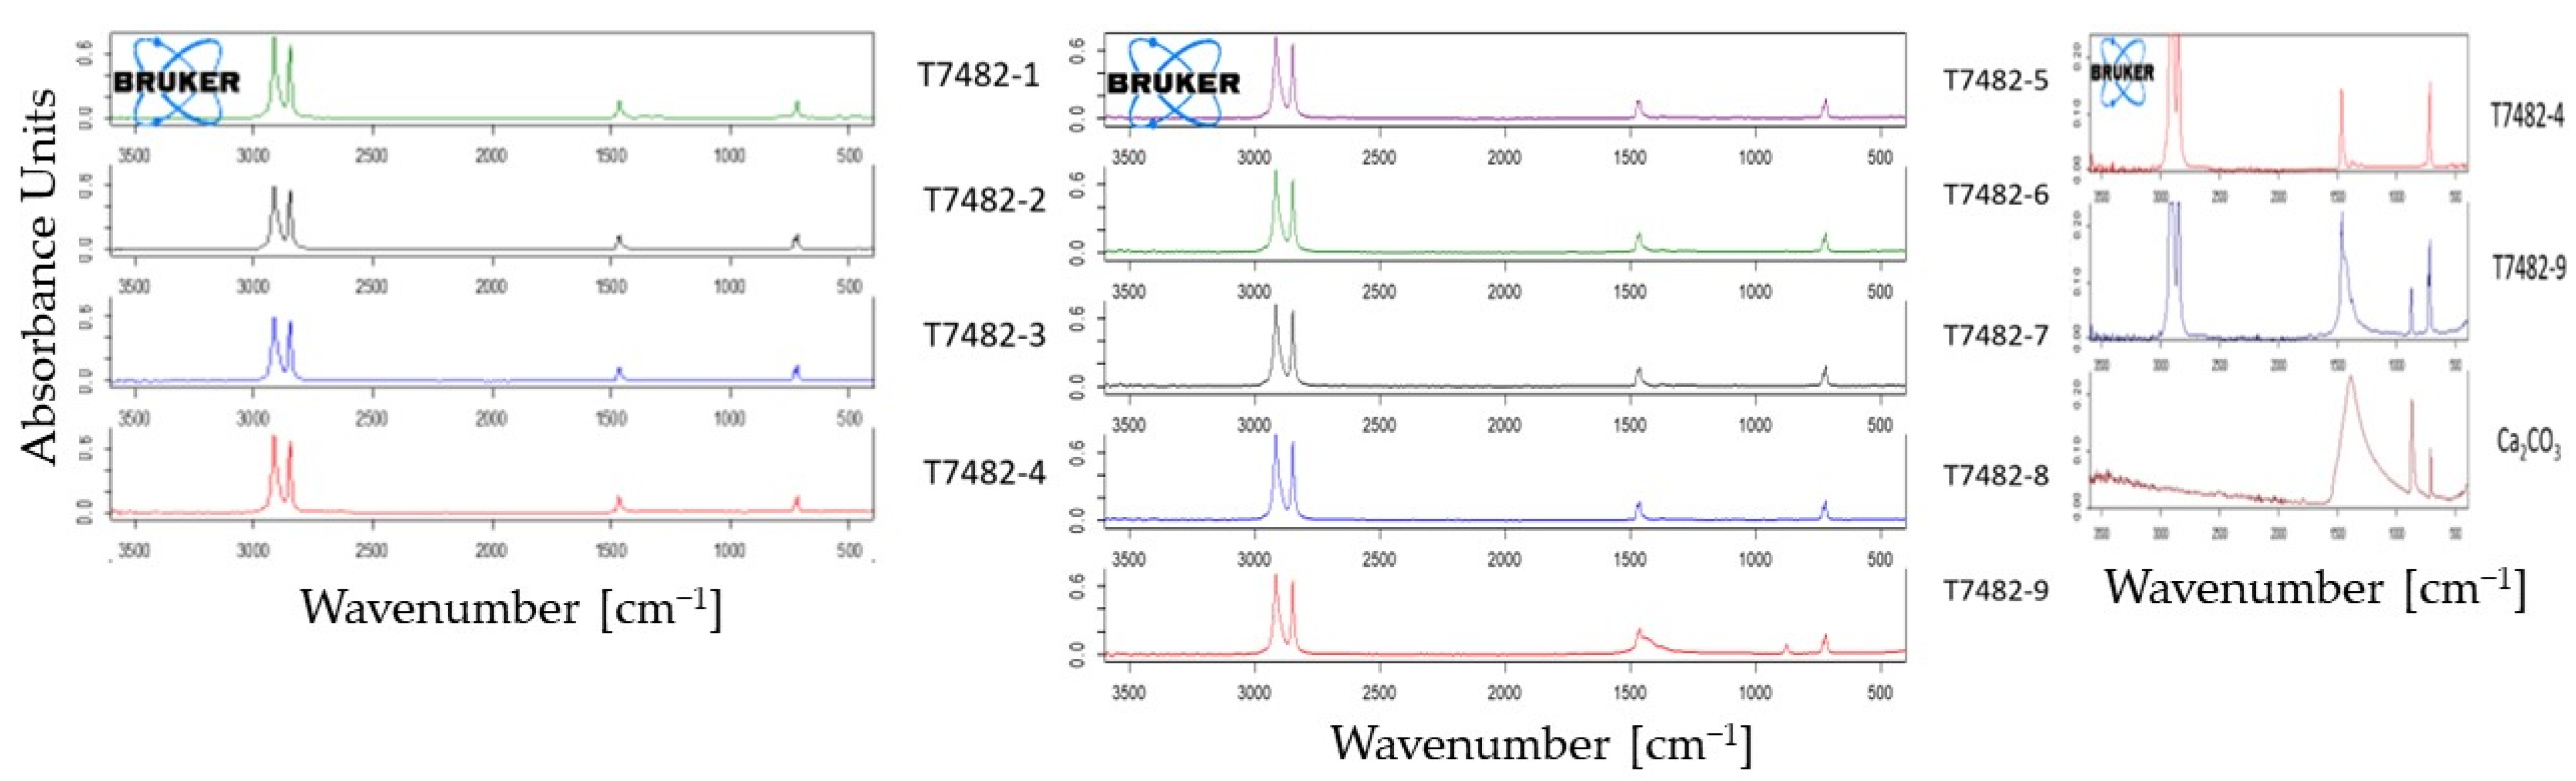
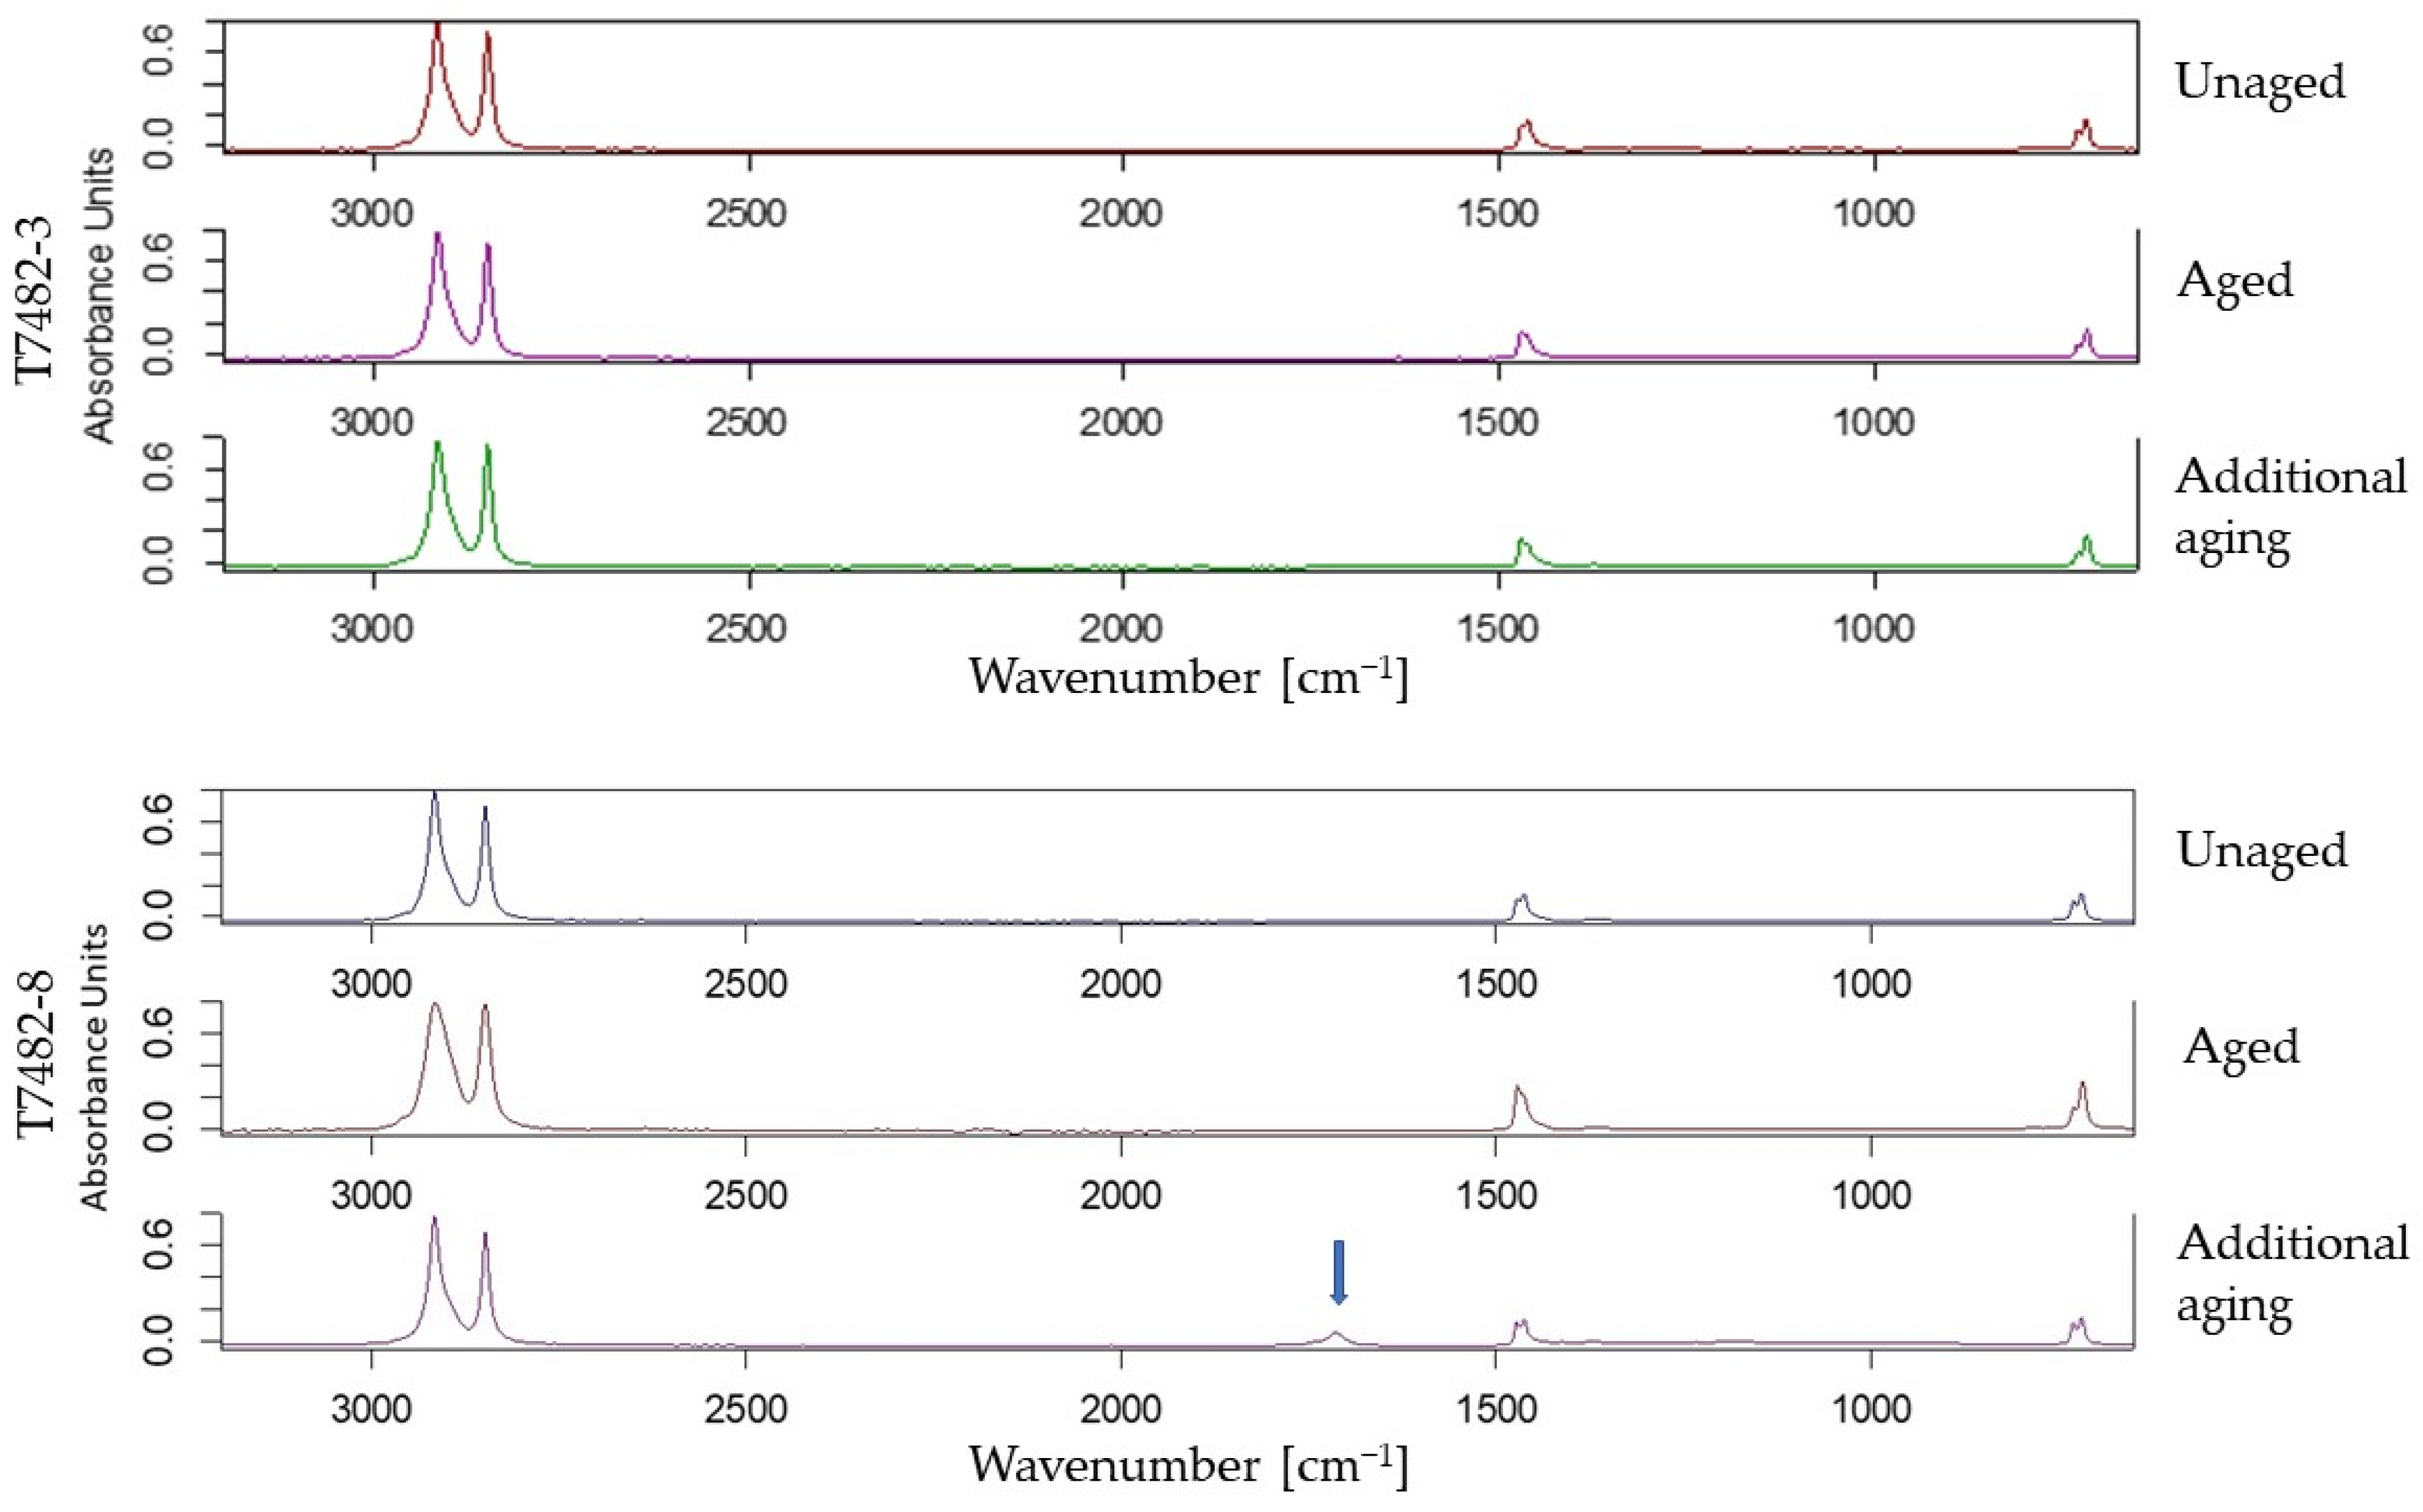
ATR-FTIR spectroscopy was used to identify the chemical structure of the polymer and additives of each membrane and to evaluate their chemical stabilities. To investigate whether samples showed signs of chemical degradation with time, ATR-FTIR spectra of aged samples were compared with those of unaged samples [
16]. Samples with the size 50 × 50 mm were used.
2.3.2. Acid-Detection (A-D)
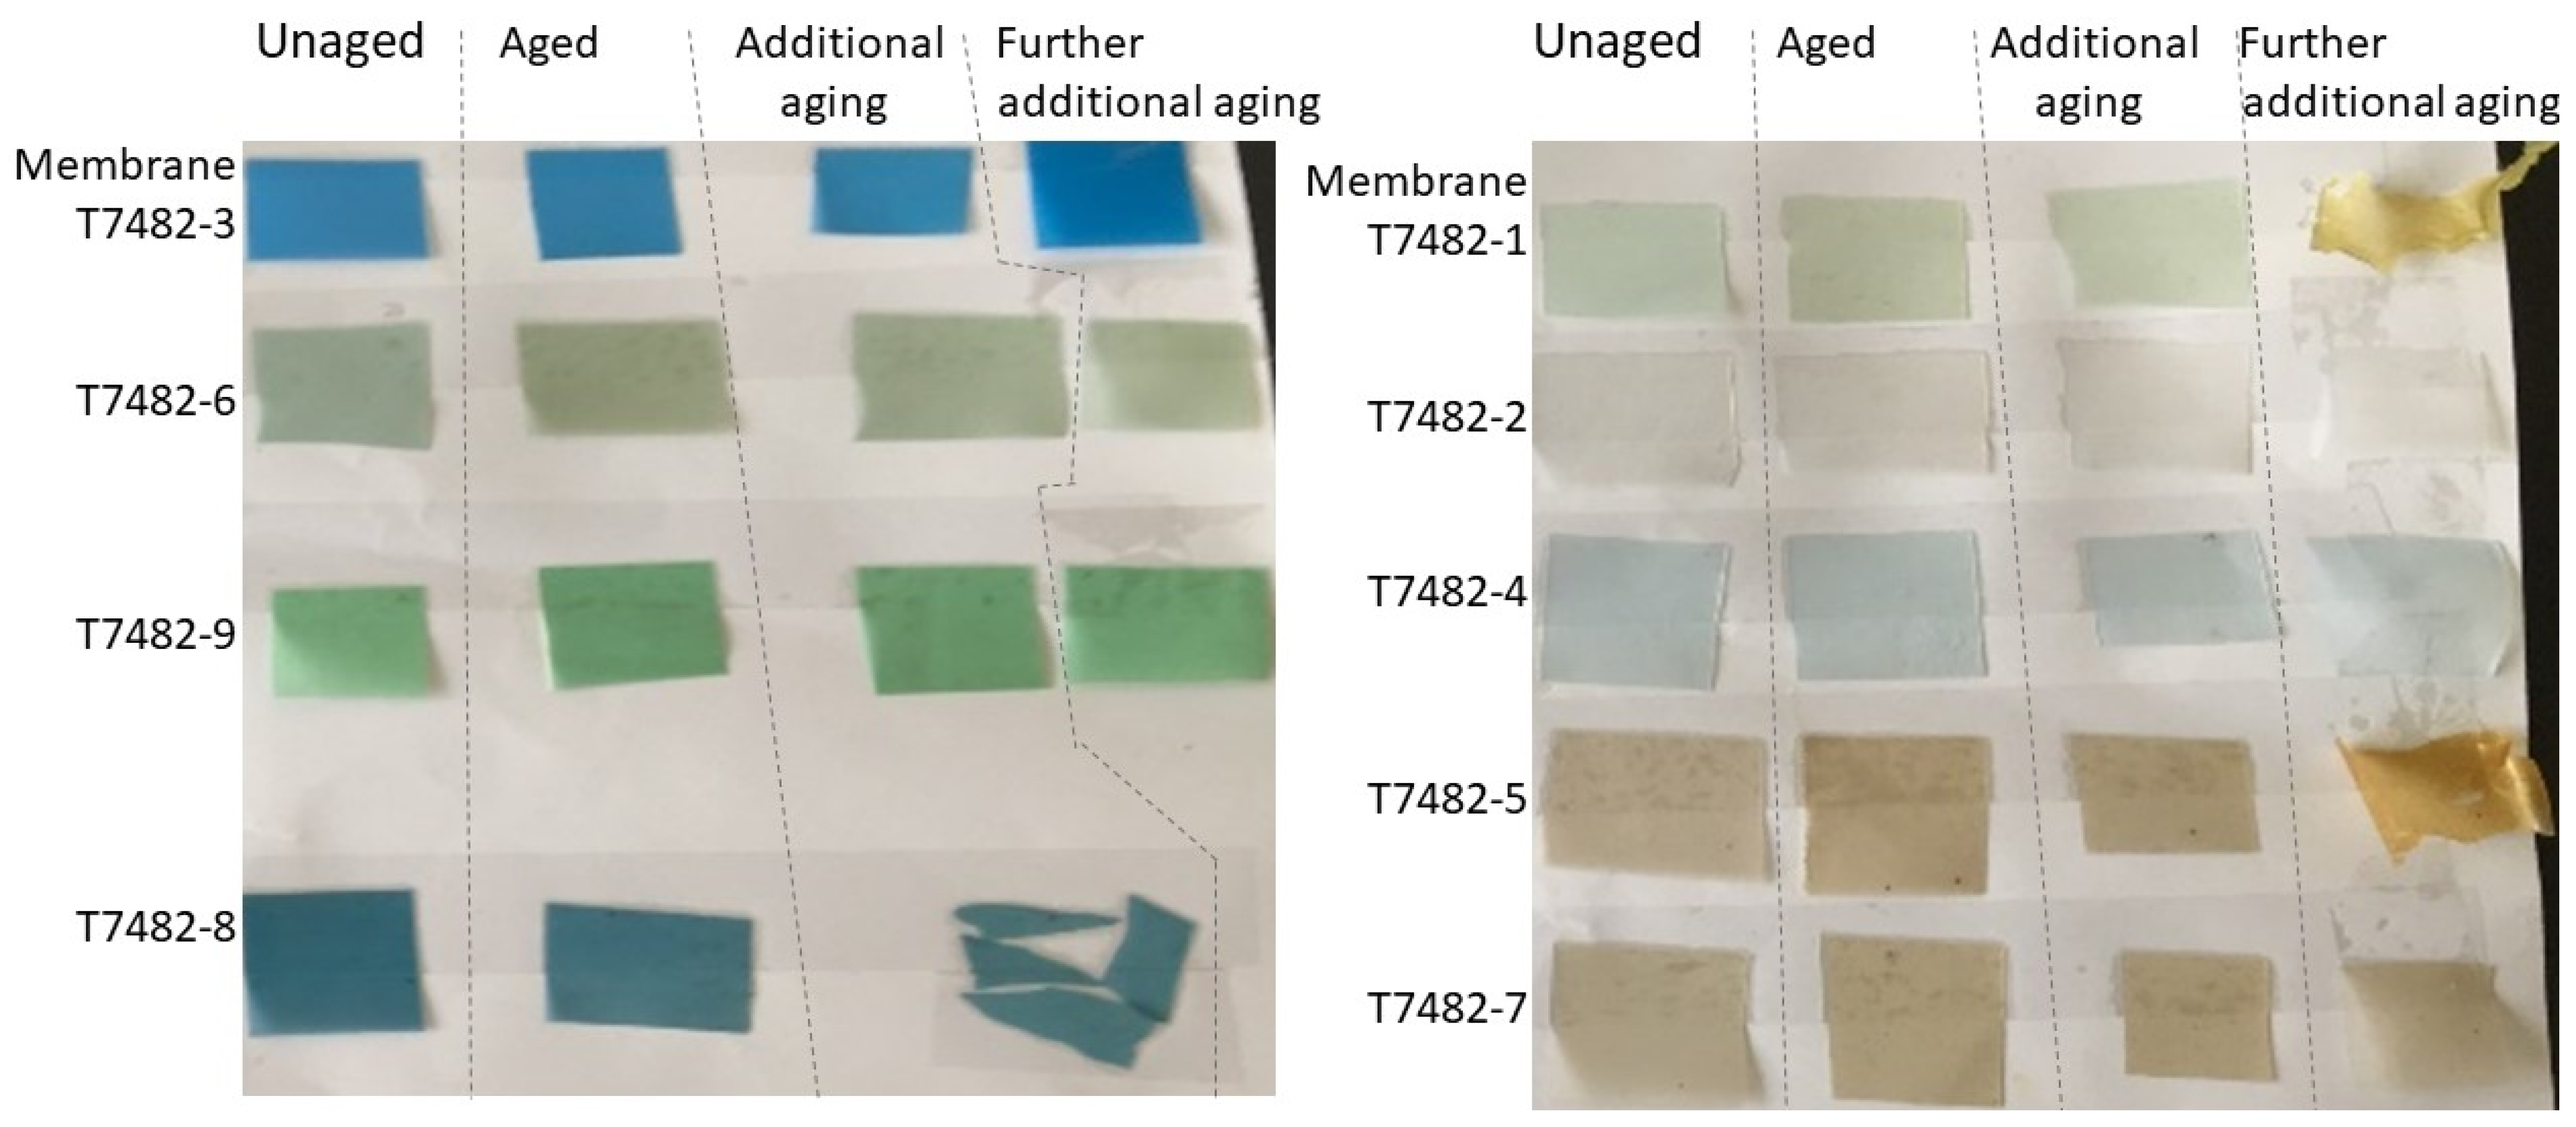
A-D indicator strips were used to show the release of volatile organic acids from membranes which indicated a potential reduction in service life of the materials. A-D strips are paper-based indicators that use the pH-sensitive indicator bromocresol green to detect the presence of acids evolved by all materials, including plastics. Their advantage over universal pH indicator papers is that they are used dry and do not require water. When A-D strips are placed in a closed container with the specimen, the strips change colour from blue at pH 5.4 to green (slightly acidic) and then to yellow at pH 3.8 (highly acidic) if acid gases are released. The colour changes within 24 h [
16,
17]. Samples with the size, 50 × 50 mm were used.
2.3.3. Beilstein Test
The Beilstein test [
18] was used to identify the presence of the plastic type polyvinyl chloride, PVC in samples. PVC is chemically unstable, can emit toxic plasticizers and hydrogen chloride and is therefore undesirable in building materials designed for long term use [
16].
For the test, a powerful gas flame from a gas burner, for example, and an approximately 30 cm long copper wire was used. The tip of the copper wire was heated until it glowed, and all impurities were burned away. Sheets of specimens were touched with the tip of the copper wire. The copper wire with plastic was then returned to the flame. If the flame burned green, PVC was detected. If not, then PVC was not present in the sample.
2.3.4. X-ray Fluorescence Spectroscopy (XRF)
XRF was used to determine the elemental composition of samples. XRF is a non-destructive, surface measurement technique that can in principle detect and measure the content of all elements, however with a reduced sensitivity for the lightest elements [
19]. A Bruker Tracer III-V, that detect elements with a higher atomic number than magnesium was used [
16]. XRF spectrometer head was used on sheet-like samples of 1 × 1 m.
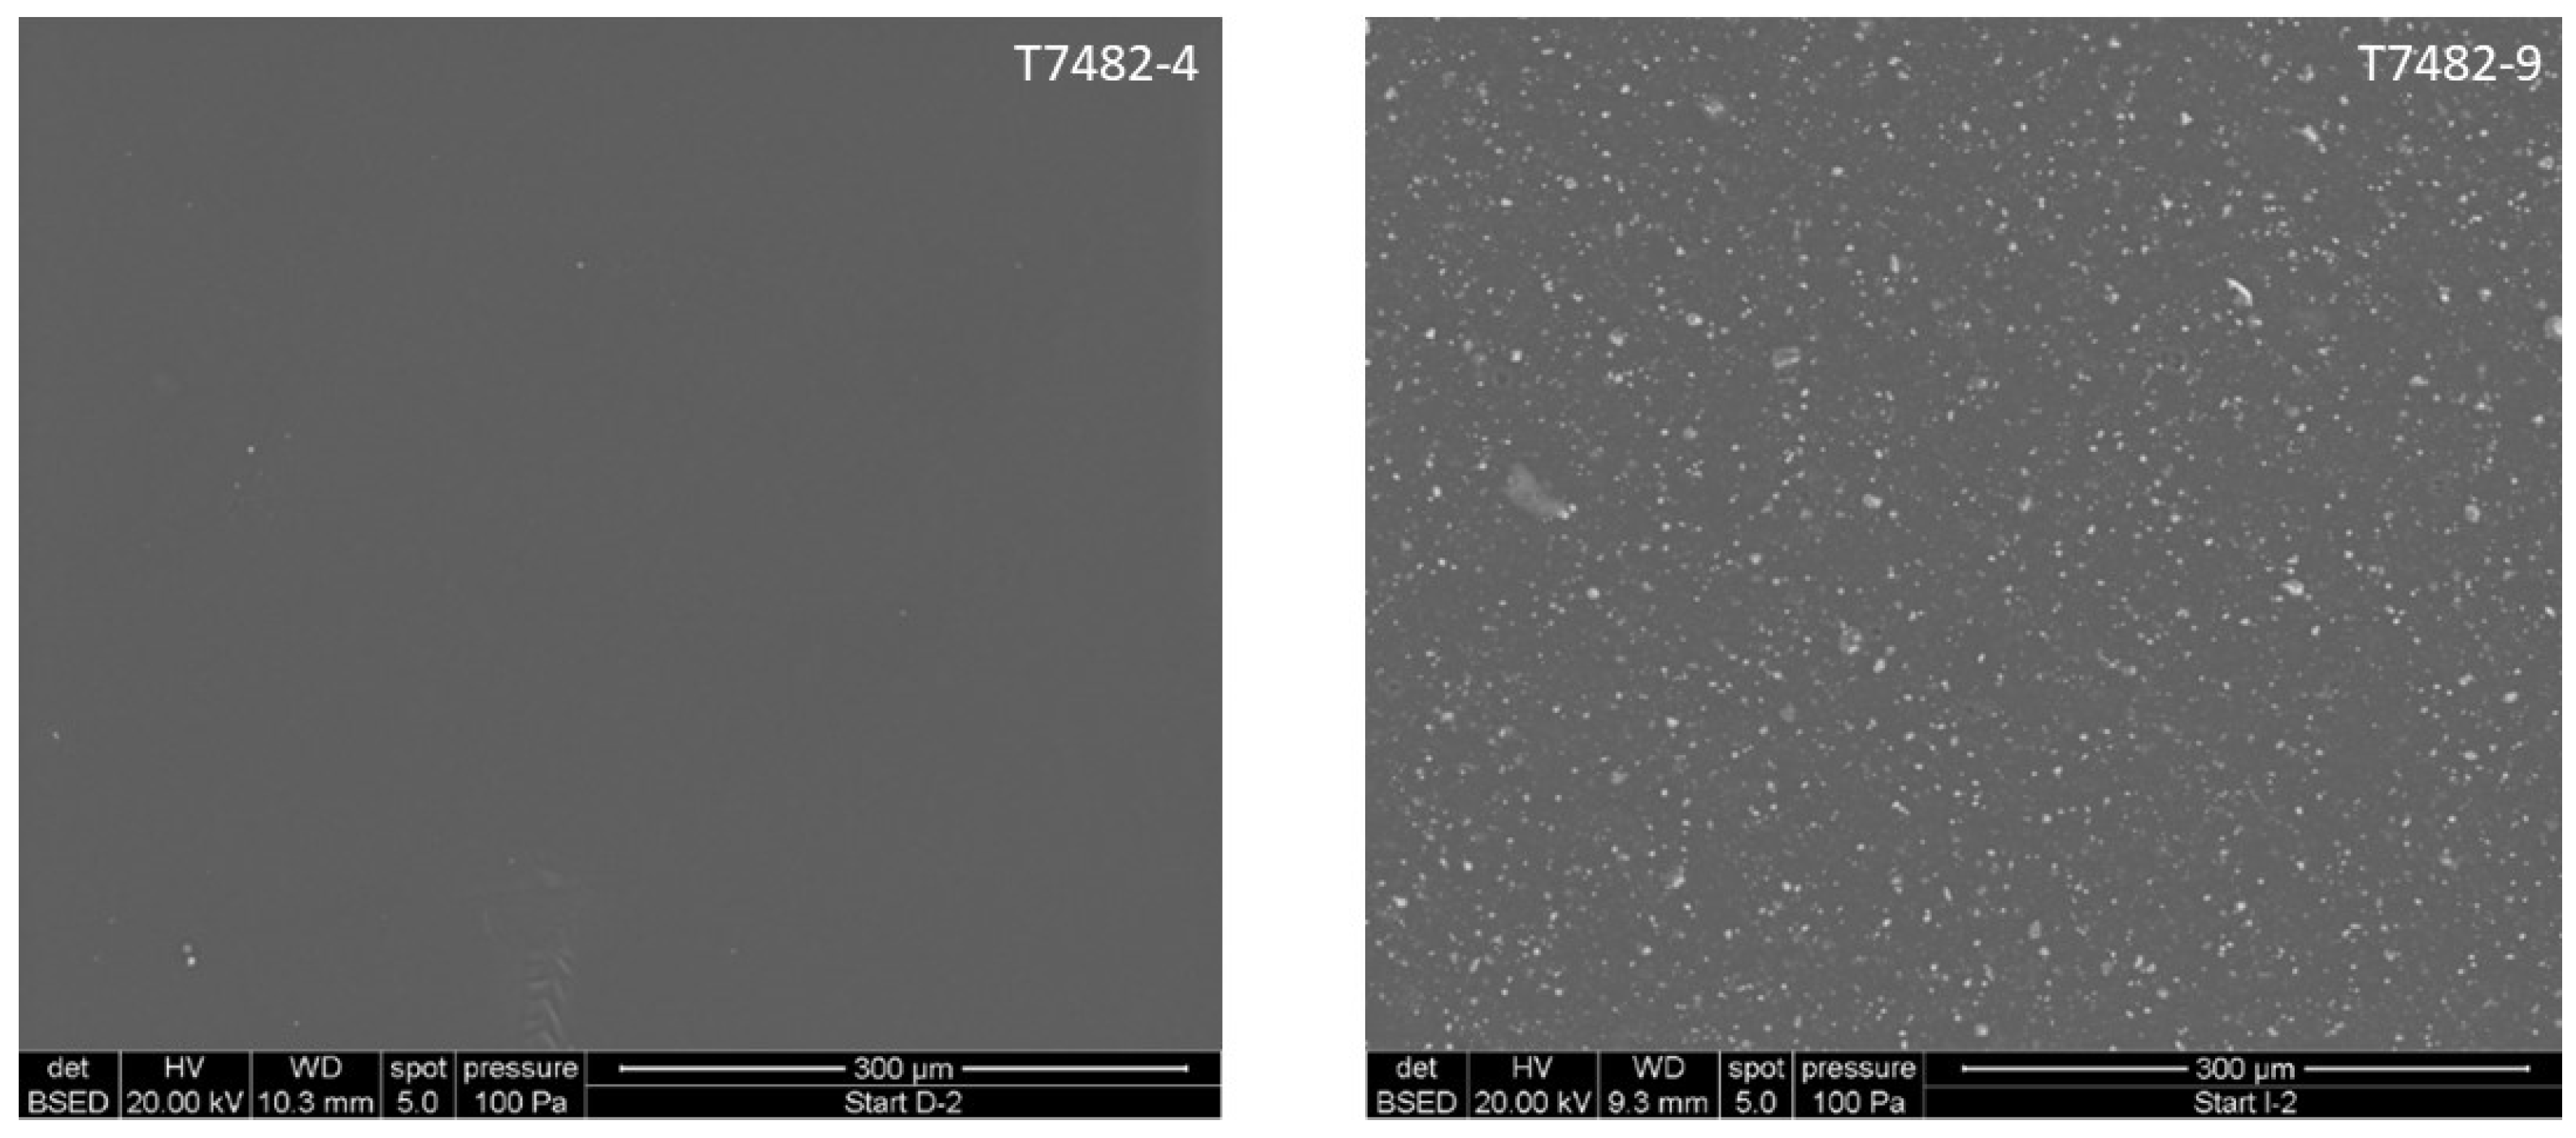
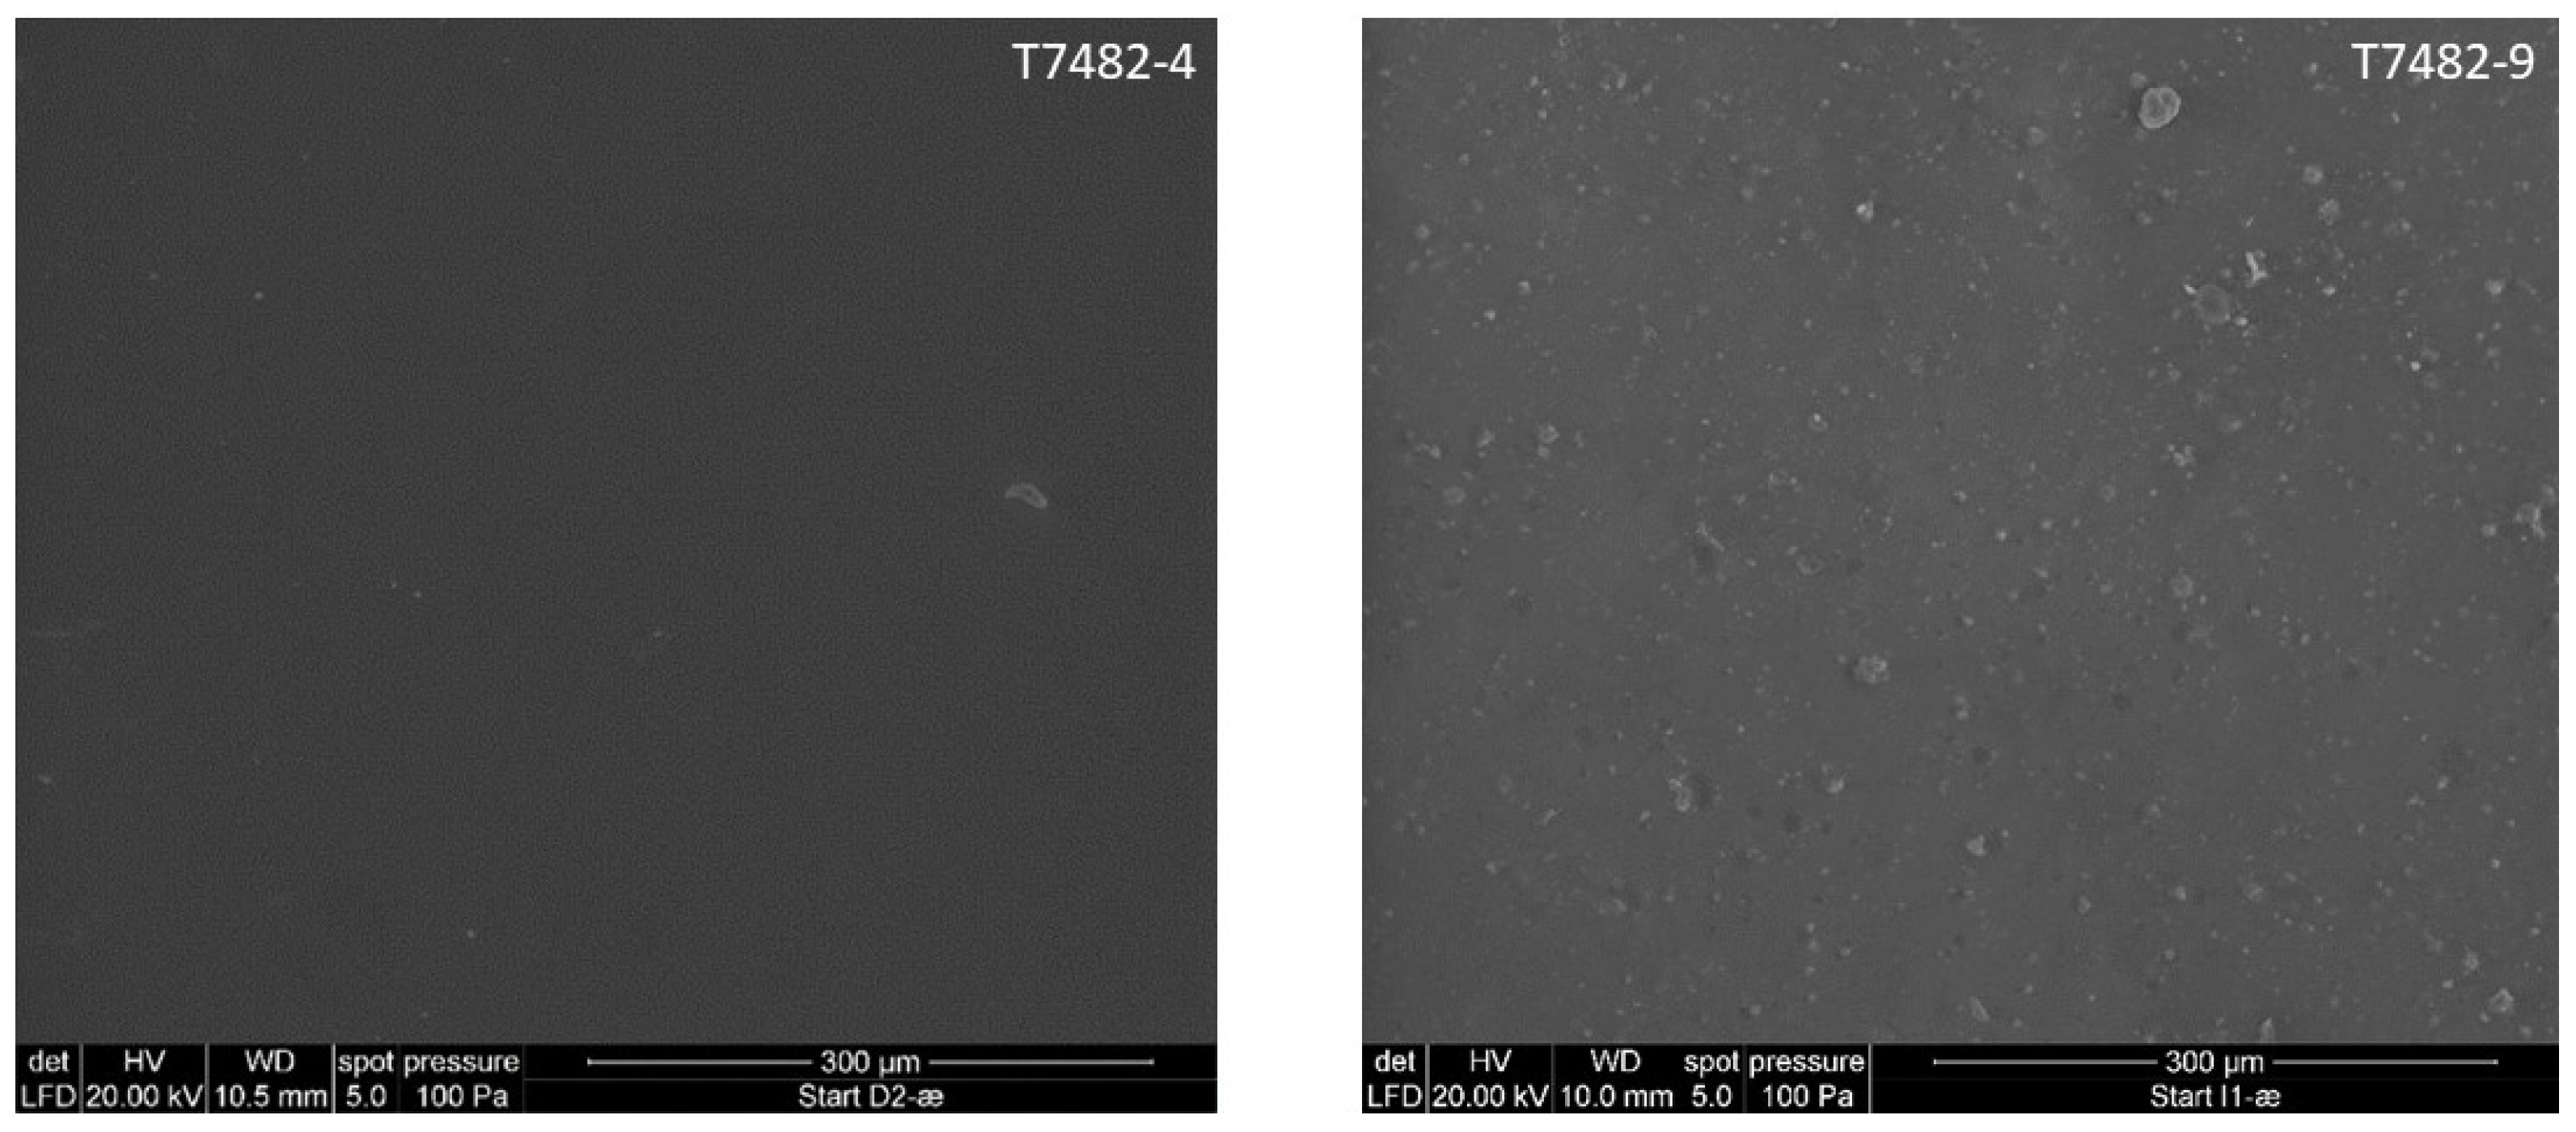
2.3.5. Scanning Electron Microscopy (SEM)
SEM was used to examine the surfaces of plastic sheets (15 × 15 mm) non-destructively. SEM uses electromagnetic radiation to obtain a greater resolution than can be obtained by ordinary light microscopy, and one can thus observe objects down to the nanometer scale [
16]. Instead of glass lenses, which are used in light microscopy, SEM uses electric and magnetic lenses, which focus the electrons in a similar way to that used by optical lenses to focus light.
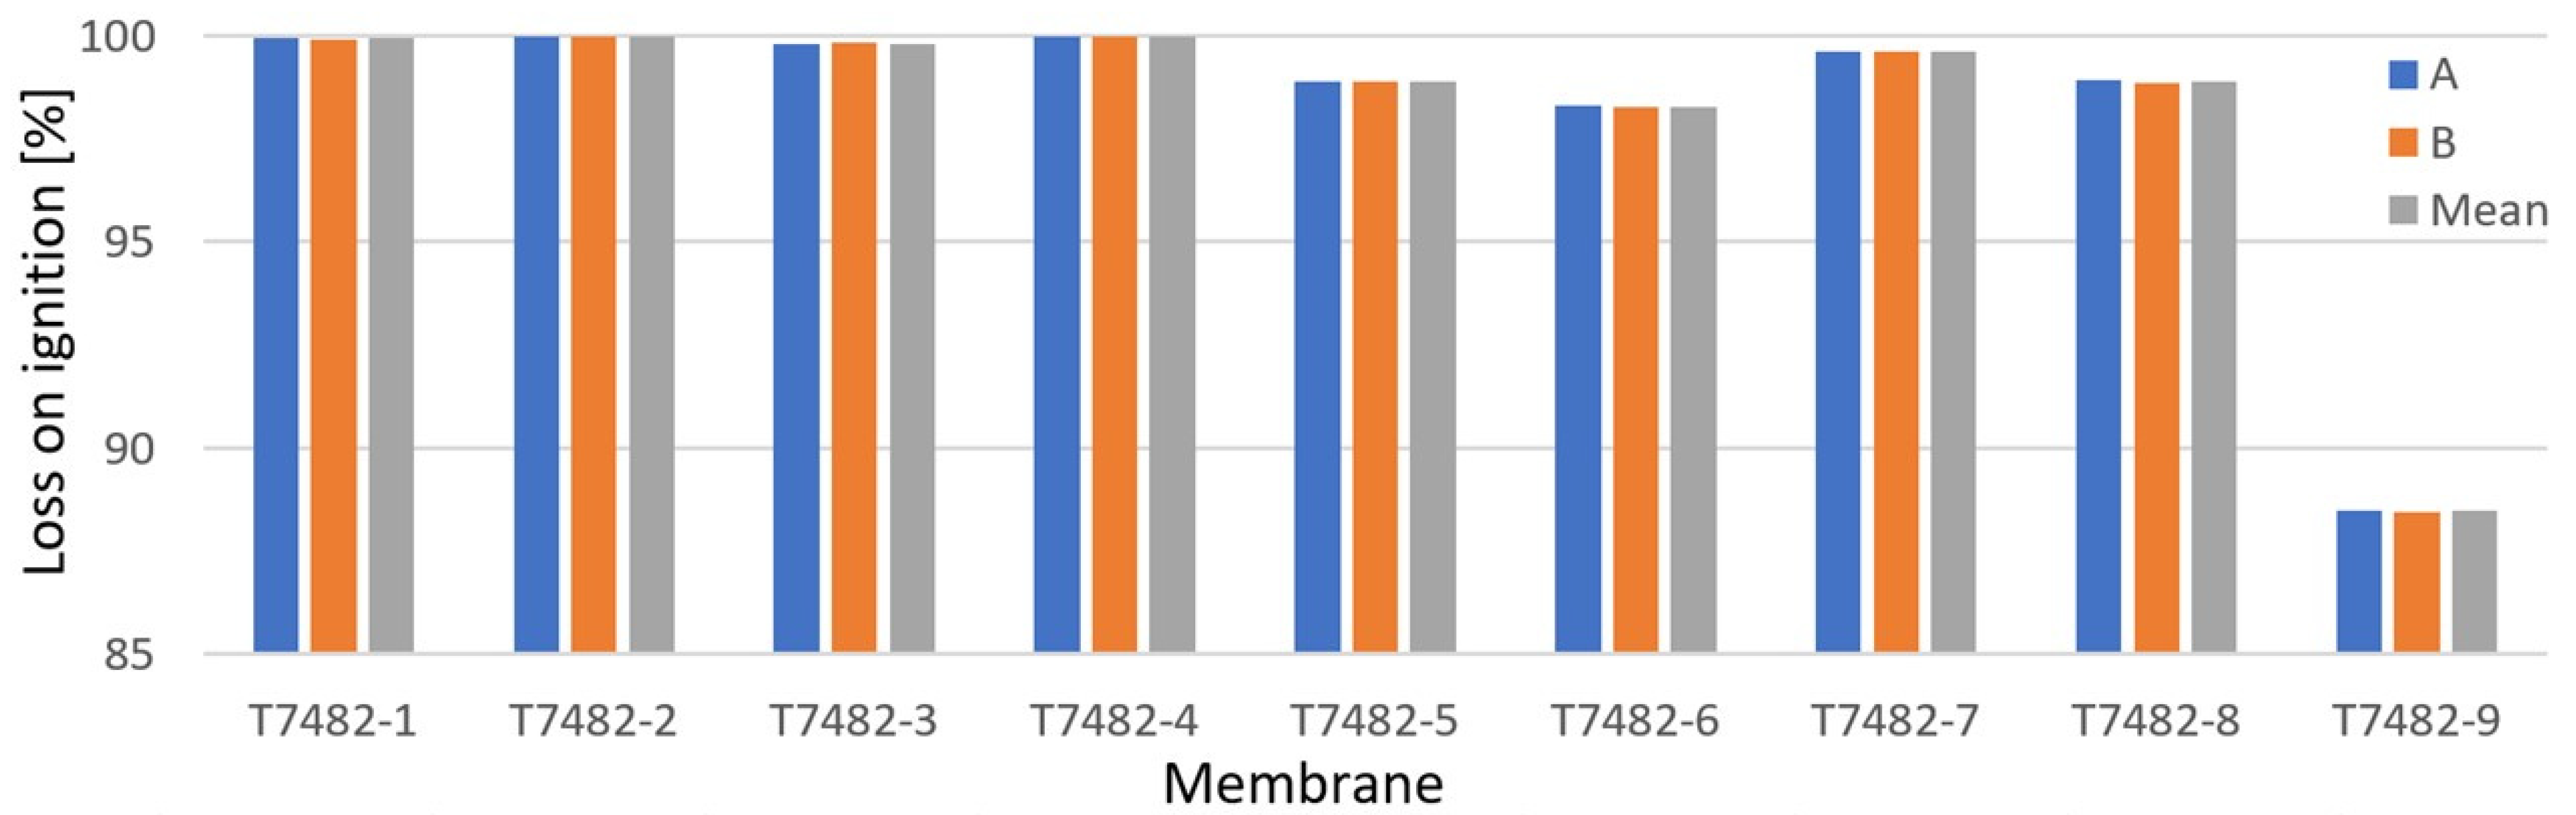
2.3.6. Loss on Ignition
Loss on Ignition was used to quantify the content of organic material in samples. Samples were annealed at a temperature of 550 °C and the weight loss was measured. Polyethylene is fully decomposed at this temperature, whereas inorganic additives and mineral impurities will only be decomposed by much higher temperatures. PE is annealed to a weight percent of 0% at 480 °C [
20]. Samples of 2–2.5 g were cut from each membrane, pre-dried at 105 °C and then annealed at 550 °C in a muffle furnace. The mass of the pre-dried samples (m
0) and the mass after annealing (m
g) were weighed to 4 decimal places. The loss on ignition is defined as weight loss on annealing and calculated as ((m
0 − m
g)/m
0) × 100 [
16].
2.4. Physicomechanical Tests
Five samples of each membrane (the water vapor diffusion resistance test was conducted on two samples of each membrane, and adhesive strength conducted on seven samples) were analysed, using 13 physicomechanical tests. The tests were performed both on unaged and aged samples. Bending force was only conducted on unaged membranes. The tests performed, [
12,
13,
14,
15,
16,
17,
18,
19,
20,
21,
22,
23,
24,
25,
26,
27,
28] are shown in
Table 3.
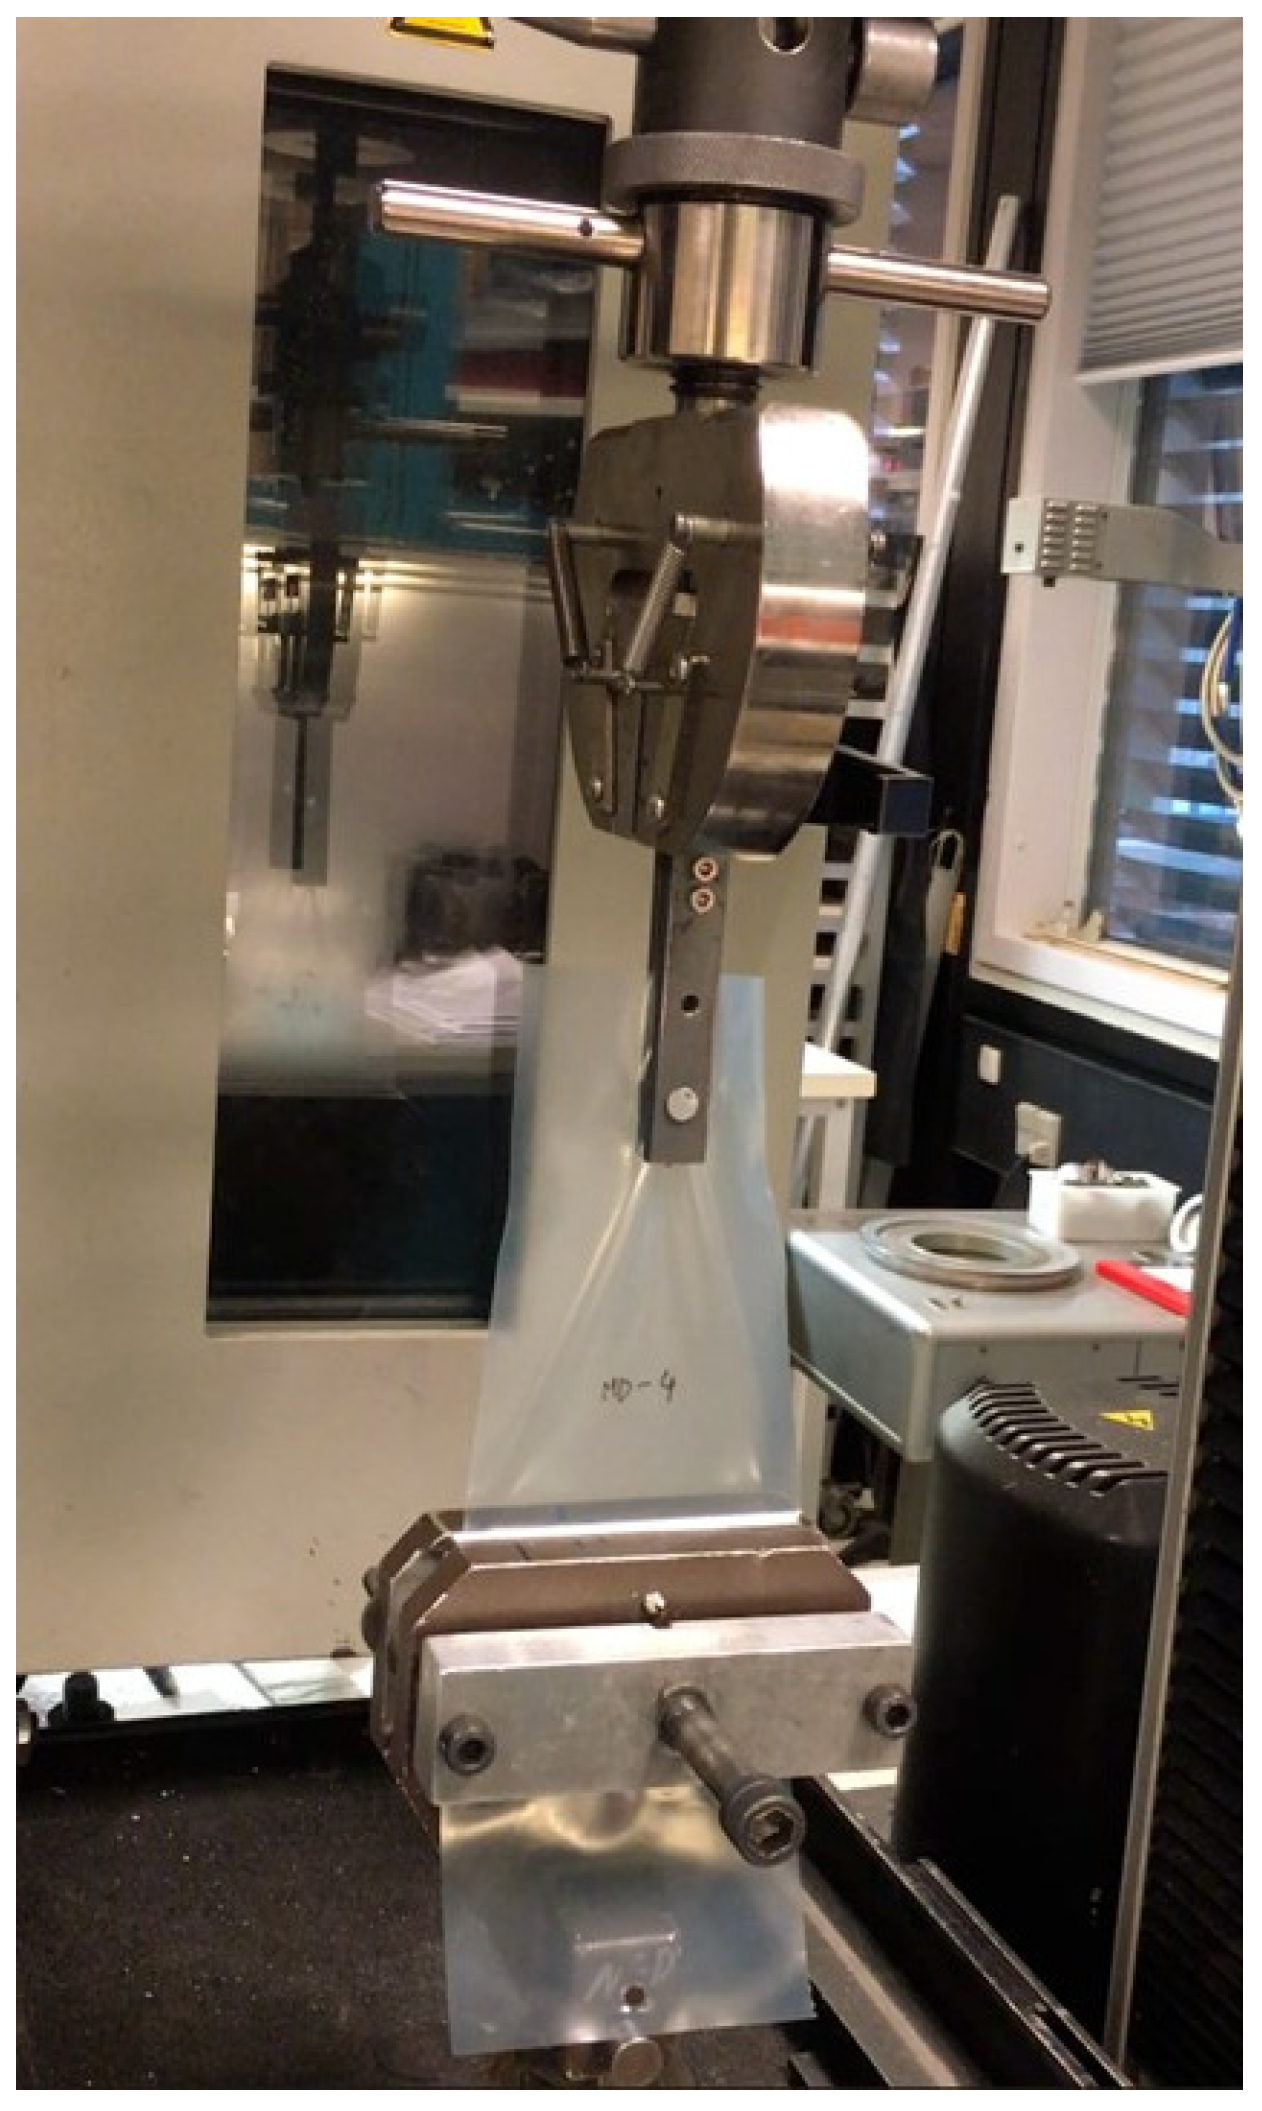
2.4.1. Tensile Strength, Fracture Elongation and Young’s Modulus
The tensile strength was determined as the highest measured stress during the test. Elongation at break was determined as the strain at break. Young’s modulus was determined at 0.5–1.0% elongation, although it is not part of the standard used [
21]. Samples are shaped like meat bones, according to the specification described in [
21], Type 5 in the specification. The size of the meat bones-shaped specimens were as follows: the width of the narrow part of the bone was 6 ± 0.4 mm; the length of the narrow part of the bone was 33 ± 2 mm; the width of the ends of the bone was 25 ± 1 mm; the overall length of the bone was a minimum of 115mm, and the initial distance between the grips was 80 ± 5 mm. Tests were performed on a tensile testing machine of the type: Shimadzu machine model AG-X, class 0.5 load cell 500 N, see
Figure 2. To measure the strain, a click-on extensometer from Shimadzu, class 1 was used. To measure the thickness of the sample, a micrometer was use of the type: Mitutoyo Thickness gauge. Tests were performed at 23 ± 1 °C and 50 ± 2% RH. The towing speed was 100 mm/min.
2.4.2. Tear Strength
The tear strength was determined as the highest measured strength during the tear strength test. Tests were performed on a tensile testing machine of the type: Instron tensile testing machine equipped with a 5 kN load cell. Samples shaped like sheets, according to the specification described in [
22] of 100 × 100 mm in size were mounted in the tensile tester in a sample fixture, as shown in
Figure 3, and perforated with a mandrel for this purpose. The fixture is also shown in [
22]. The mandrel was pulled through the sample and the traction force was measured continuously during the experiment. Tests were performed at 23 ± 1 °C at 50 ± 2% RH. The towing speed was 100 mm/min.
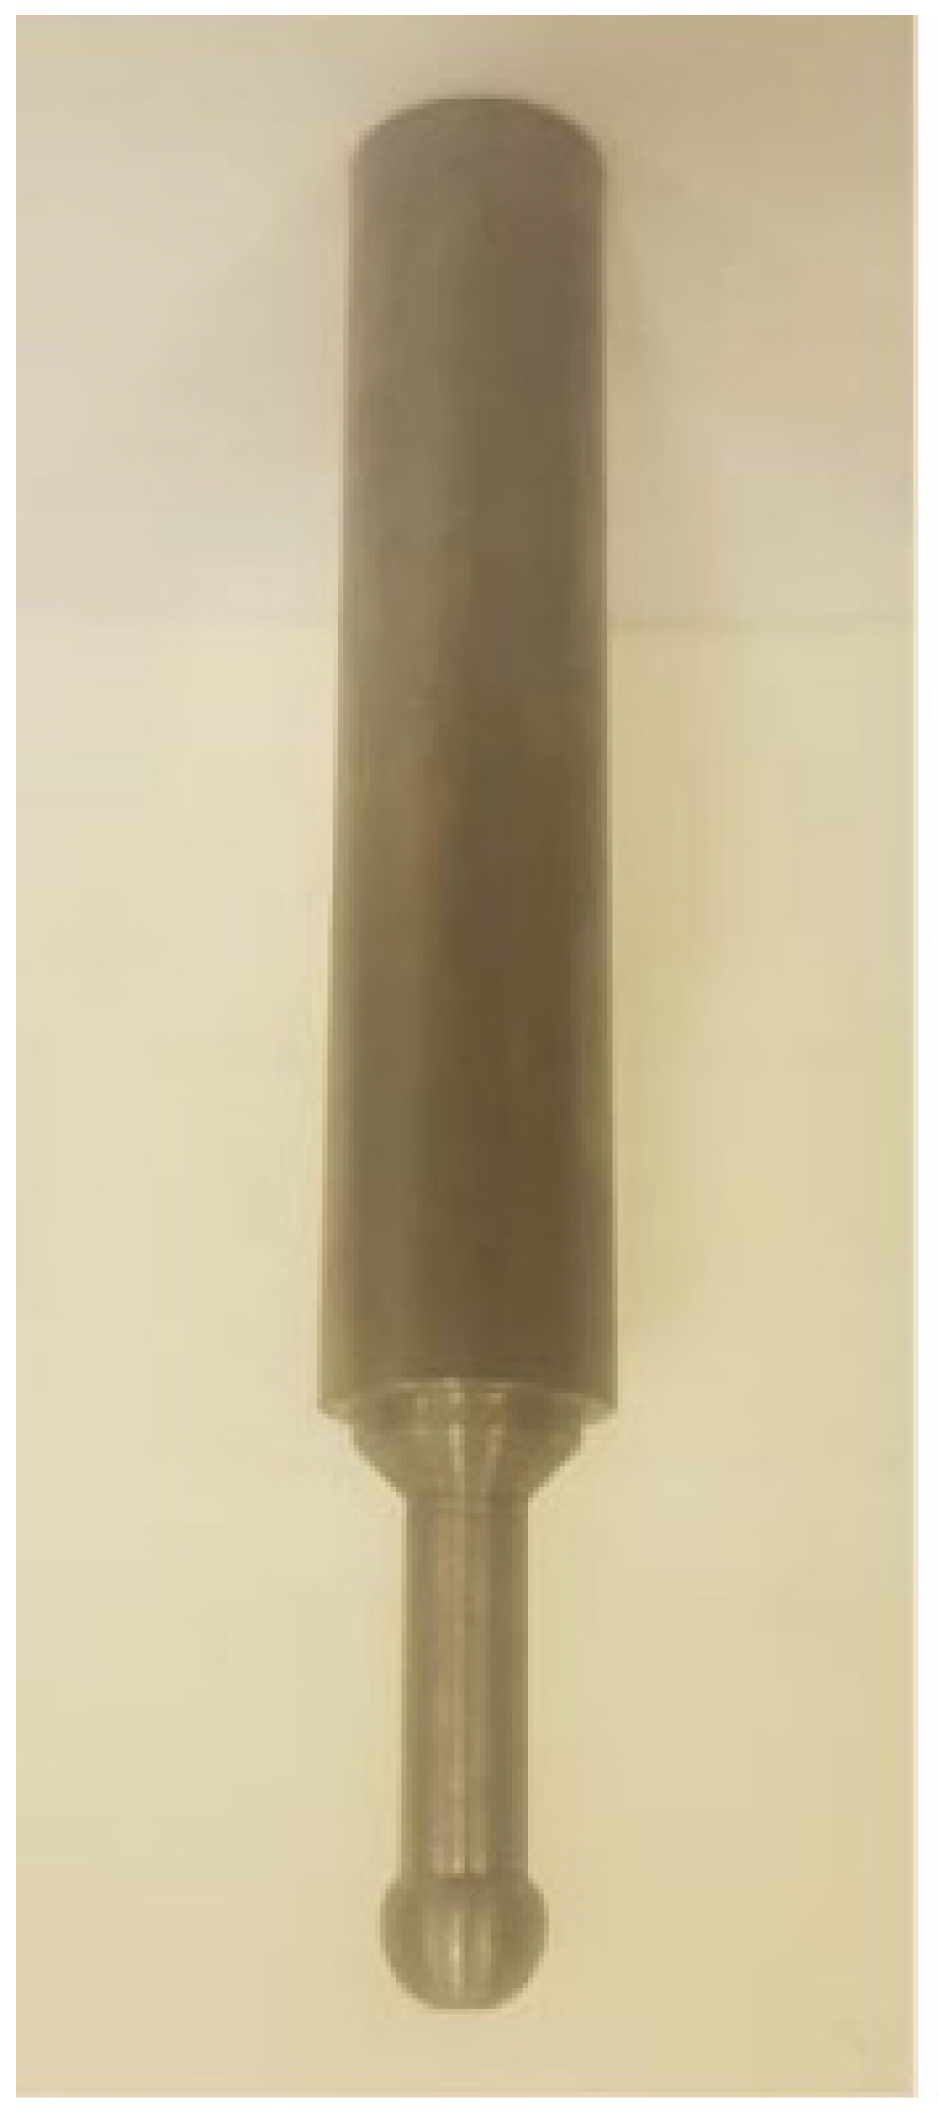
2.4.3. Resistance to Impact
Resistance to impact was determined by measuring the impact at which the membrane was perforated. The resistance to impact was expressed as the maximum height from which a weighted ball can be released without penetrating the specimen. The drop weight, shown in
Figure 4 weighs 500 g ± 5 g and the diameter of the ball at the bottom of the drop head was 12.7 mm. The drop weight falls from up to 2 m above the point where the drop weight hits. The distance between the holes in which the split could be placed varies with the height: between 200 and 500 mm height there was 50 mm between the holes, between 500 and 1000 mm there was 100 mm between the holes and for heights above 1000 mm there was 250 mm between the holes. The test specimen was placed on a base consisting of a 3 mm thick aluminium plate with an area of 300 mm × 300 mm. The aluminium plate was moved 25 mm between each measurement. The drop weight sets a mark in the plate; therefore, it was important that the drop weight on the next attempt hits a flat surface without a mark. Below the aluminium plate, a cast tile with a steel plate on top in the same dimensions as the aluminium plate, was placed. Samples shaped like sheets of 100 × 100 mm in size were used. Samples were assessed visually to identify whether a hole occurred. If holes were not visible a vacuum was applied. Resistance to impact was quantified as the height at which a minimum of 4 out of 5 samples passed the test height.
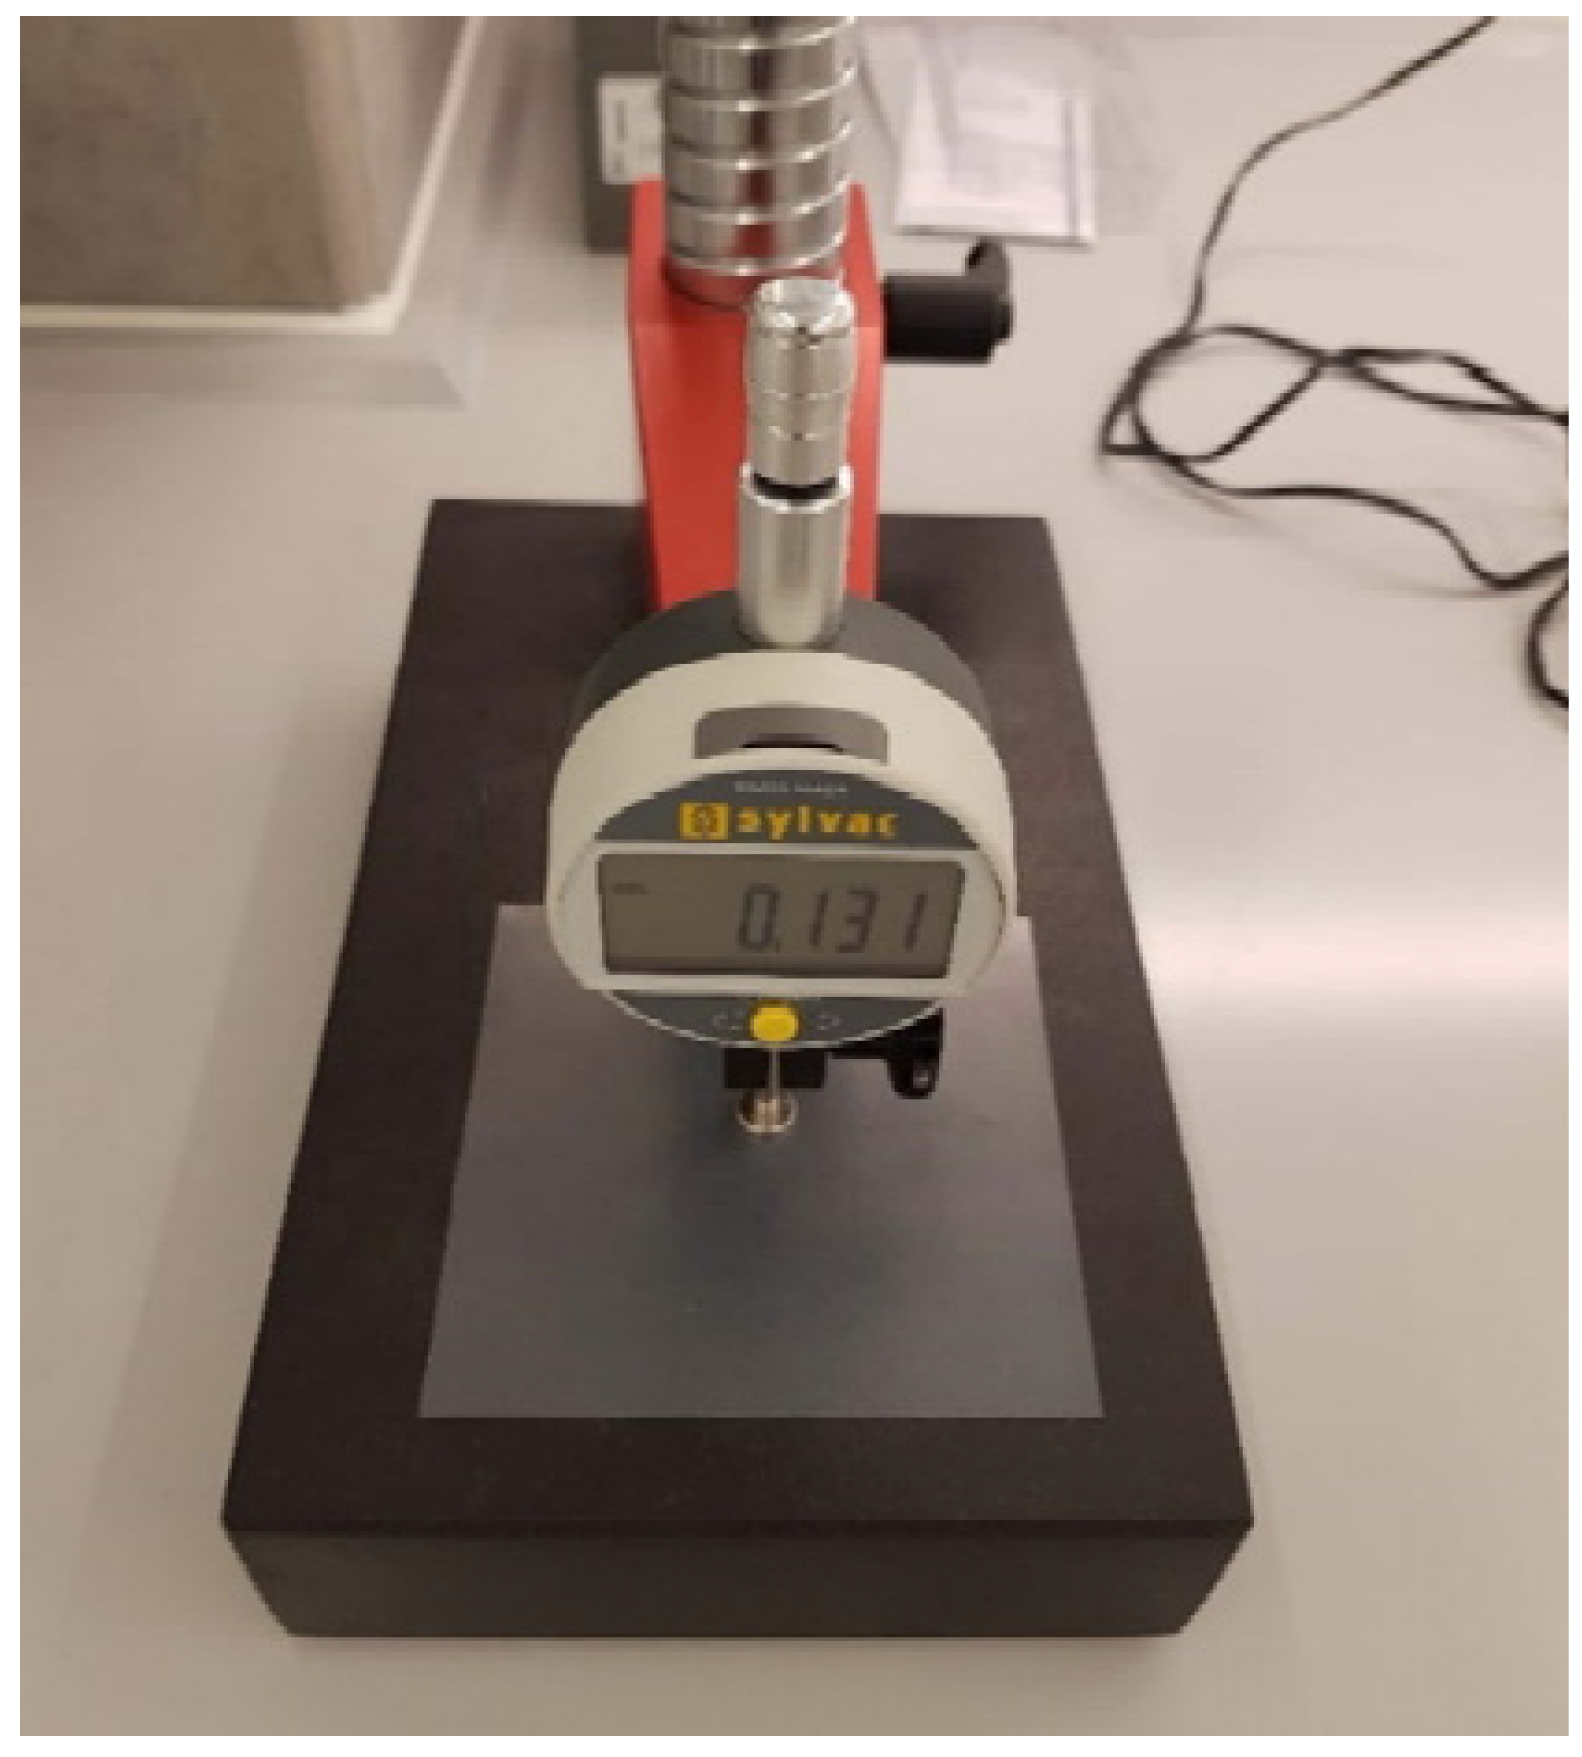
2.4.4. Mass per Unit Area and Thickness
Samples were taken from the individual membranes according to [
29]. Samples in sheet form, 100 × 100 mm in size with areas 10,000 ± 100 mm
2 were weighed before aging conditioned at 27 °C and 56.3% RH (basis weight). The thickness was measured mechanically with a dial gauge from Sylvac shown in
Figure 5. The thickness was indicated with a precision of 0.01 mm. The flat surface measured had a diameter of 10 mm ± 0.05 mm under a pressure of 20 kPa ± 10 kPa.
The samples were weighed on a scale to the nearest 0.01 g. Results were given in g/m2.
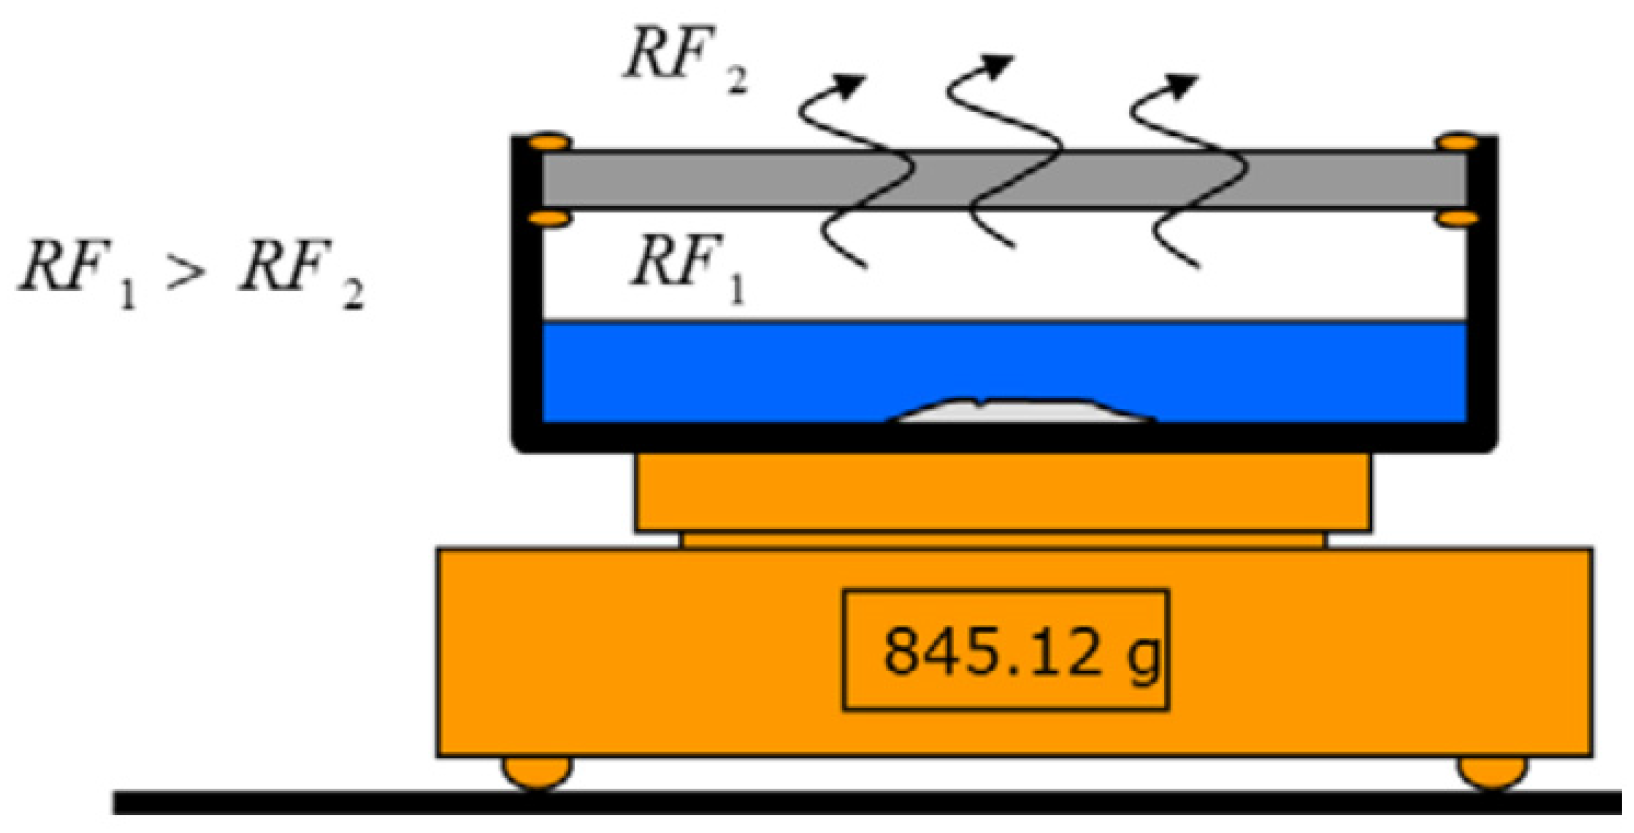
2.4.5. Water Vapor Diffusion Resistance
Water vapor diffusion resistance was determined using a cup sealed with a lid consisting of a test membrane, see
Figure 6. A saturated saline solution (KNO
3) inside the cup ensures a constant relative humidity of 93% (
RF1). The cups were placed in a climate chamber at 23 ± 1 °C and 50 ± 2% RH (
RF2). The lid area was 0.00785 m
2. The lid area was identical to the size of samples. The water vapor flux was found by recording the weight change over time. As the moisture flow stabilizes, a straight line is recorded. The slope of the curve was determined describing a constant moisture flow.
The flux through a membrane at a given time can be determined from:
where,
mi is the mass of the cup at a given time, ti, i = 1, 2, [kg]
ti is the time [s]
A is the area for the flow [m2]
Water vapor diffusion resistance (Z) [GPa s m
2/kg] is a material property that describes a materials resistance to vapor diffusion:
where, p
1 and p
2 are the partial pressures inside and outside the cup respectively. These partial pressures are based on knowledge of RH and temperature during the experiment. The temperature was 23 ± 1 °C. RH1 and RH2 were 93% and 50%, respectively. At 23 °C the saturation pressure is p
s = 2810 Pa [
30]. Partial pressure p = p
s × RH, i.e., p
1 = 2613 Pa and p
2 = 1405 Pa.
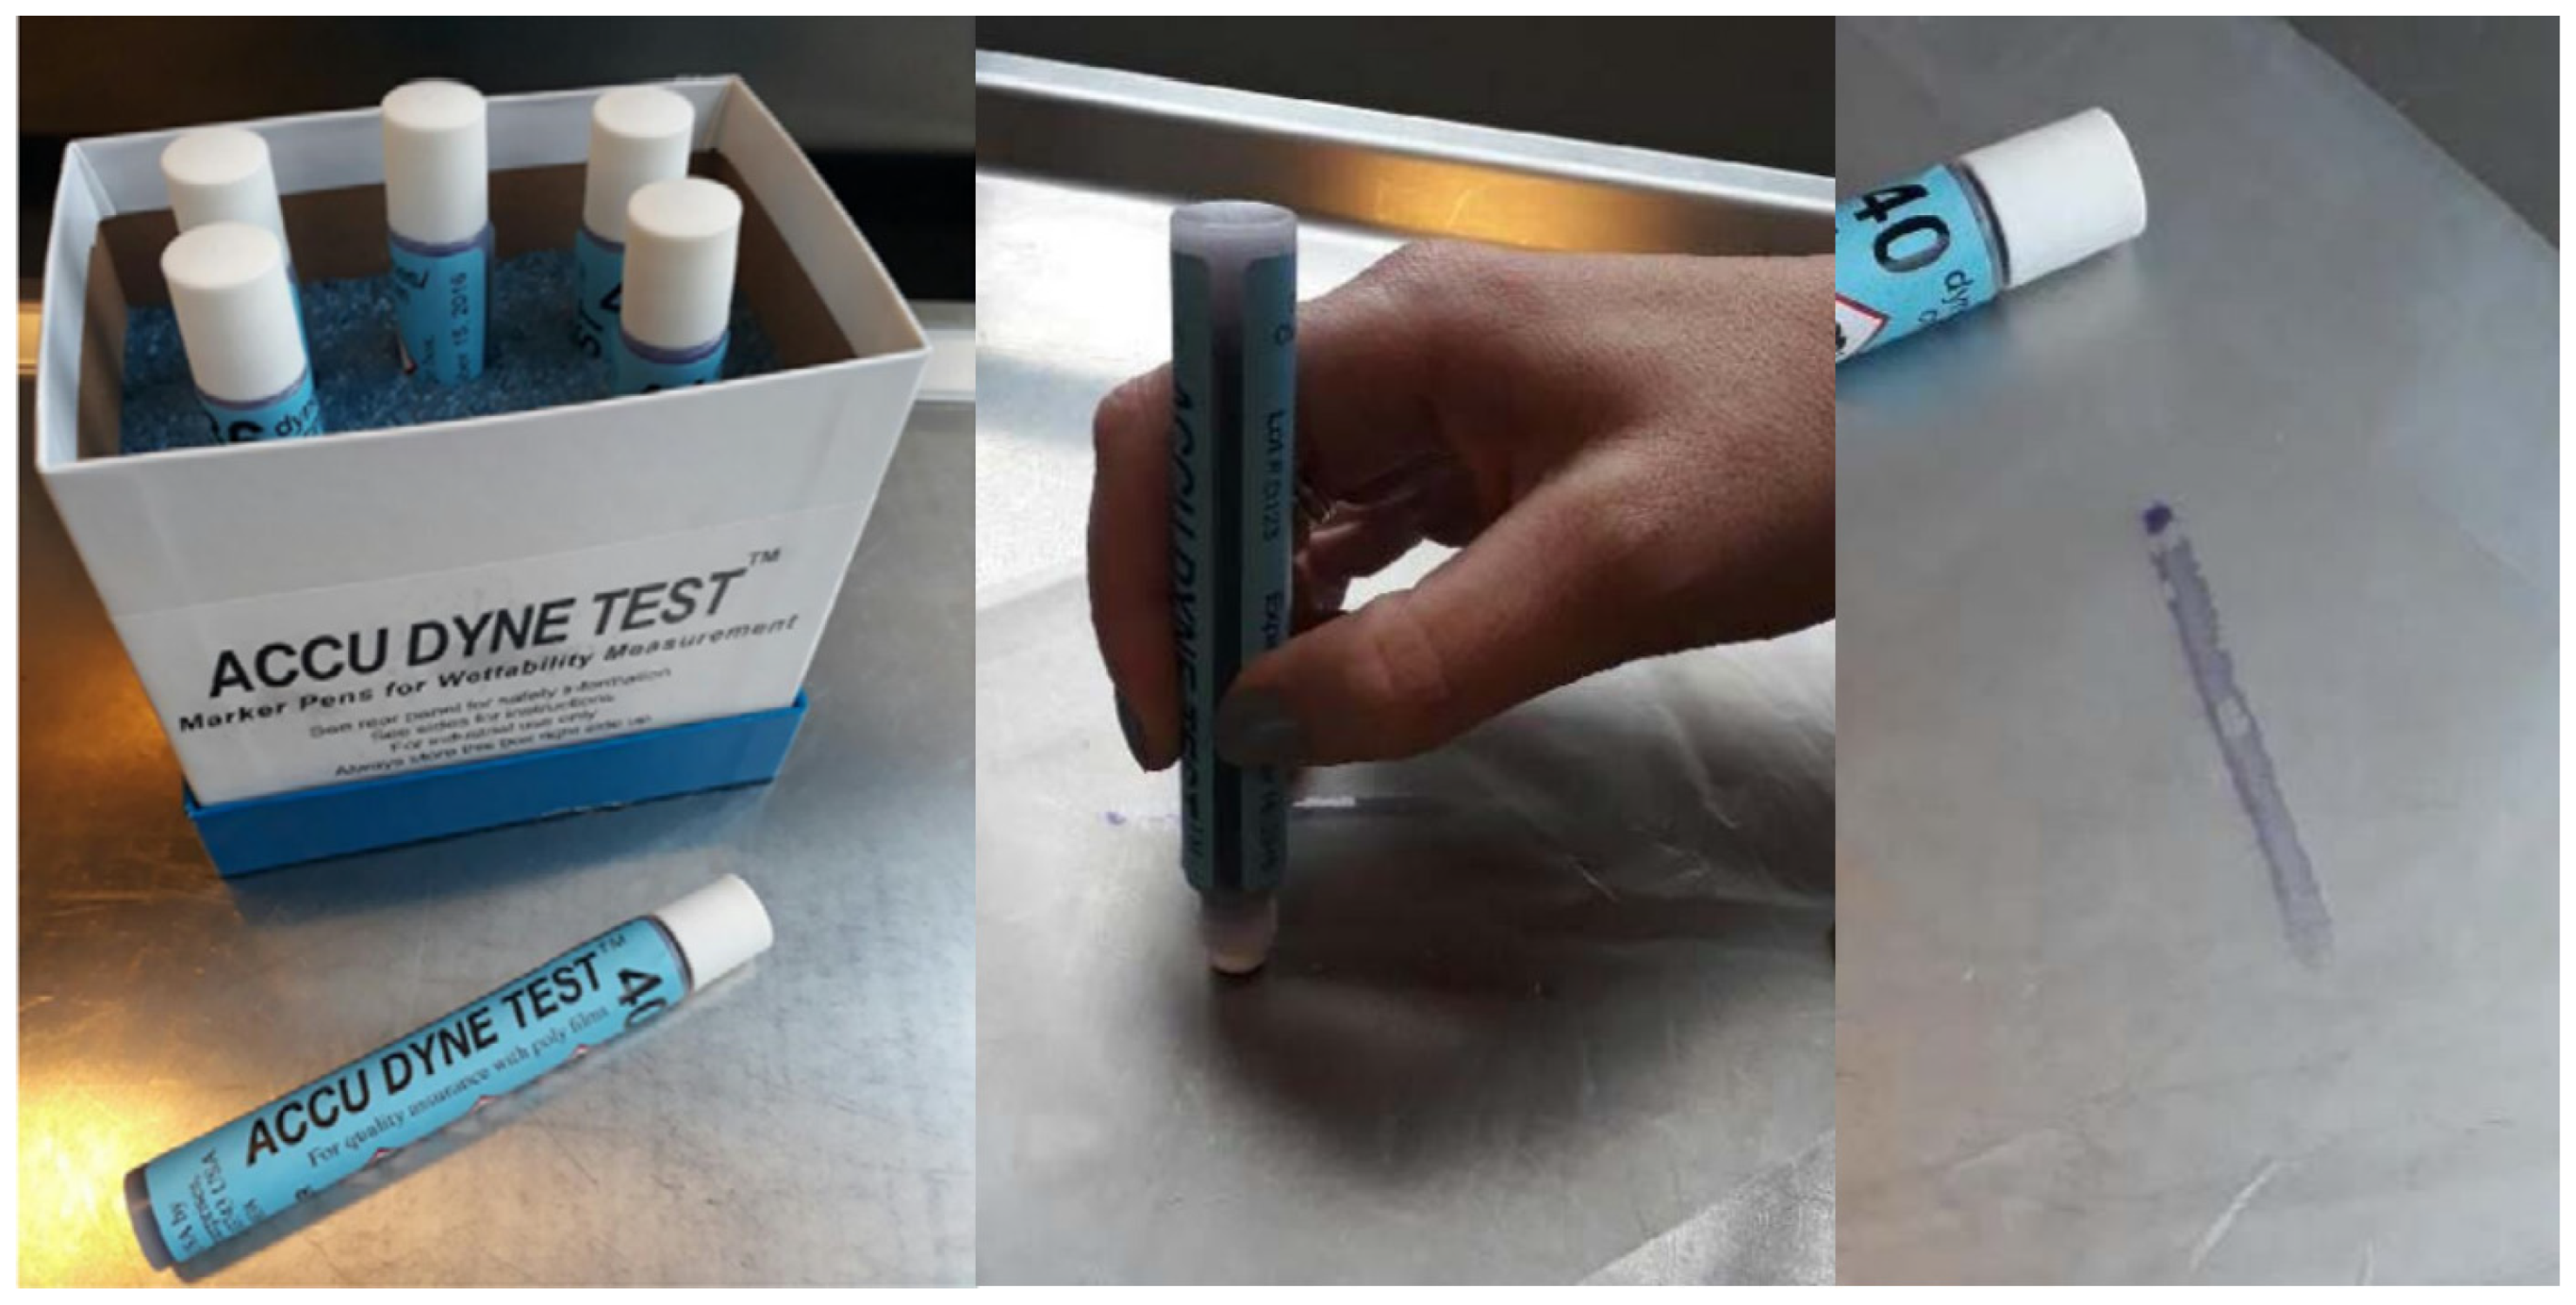
2.4.6. Surface Tension
Surface tension was determined using the Accu Dyne TestTM pen. A set of pens with different liquids was used, see
Figure 7. The method is based on [
26] Standard Test Method for Wetting Tension of Polyethylene and Polypropylene (PP) Films, where the surface tensions of PE and PP membranes are determined by measuring contact angles of droplets on the membrane with the same liquids. The Accu Dyne TestTM pens contain the same liquids, but the assessment of the surface tension has been simplified. The result of the test is a “duvet level”, which can be used to compare membranes. Information about the pens can be found on the website
https://www.accudynetest.com/pentest.html (accessed on 20 October 2022).Three parallel lines are drawn lightly on a piece of membrane, and development of the line within the first three seconds is assessed. If the area below the line remains damp and the line is intact for more than 3 s, the dyne level is too low and the pen with a higher dyne level tested. If, on the other hand, the line separates or becomes thin within one second, the dyne level is too high and a pen with a lower dyne level. The right dyne-level is found when the line holds its shape for one to three seconds before changing form. Membranes were stored for 24 h, and the test was performed at 24–25 °C and 35–38% RH. Sheets of 150 × 150 mm in size were used as samples.
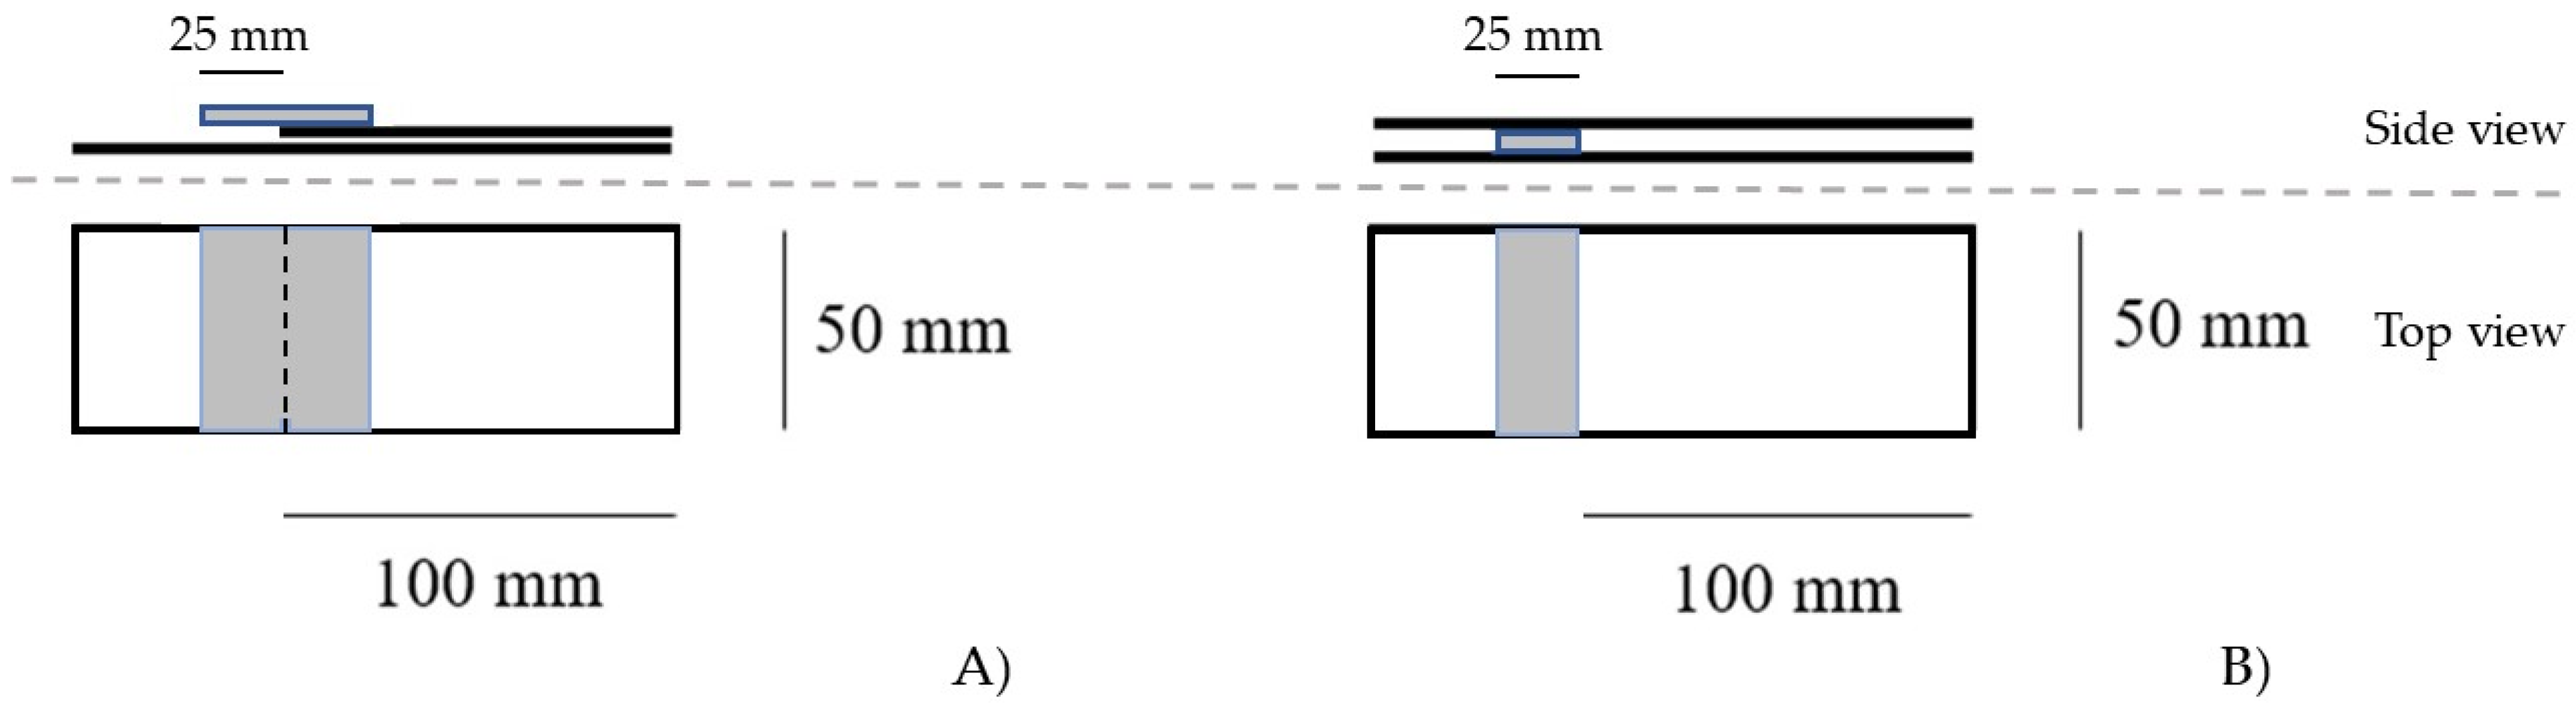
2.4.7. Adhesive Strength
Adhesive strength of taped joints of membranes and joints adhered with butyl adhesive were measured as described in [
27]—Part 2: Plastic and rubber membranes for roofing. Sampling was performed according to [
29]. Samples with the dimension 50 × 100 mm to the joint, see
Figure 8 was formed. Joints were pressed with a steel roll with the following specifications: outer diameter (including rubber bandage): (85 ± 2.5) mm, button roller weight: (2000 ± 10) g, width: (50 ± 1.5) mm, hardness of the rubber band: (80 ± 5, Shore A). Samples tested before aging were conditioned at 24 °C at 54% RH.
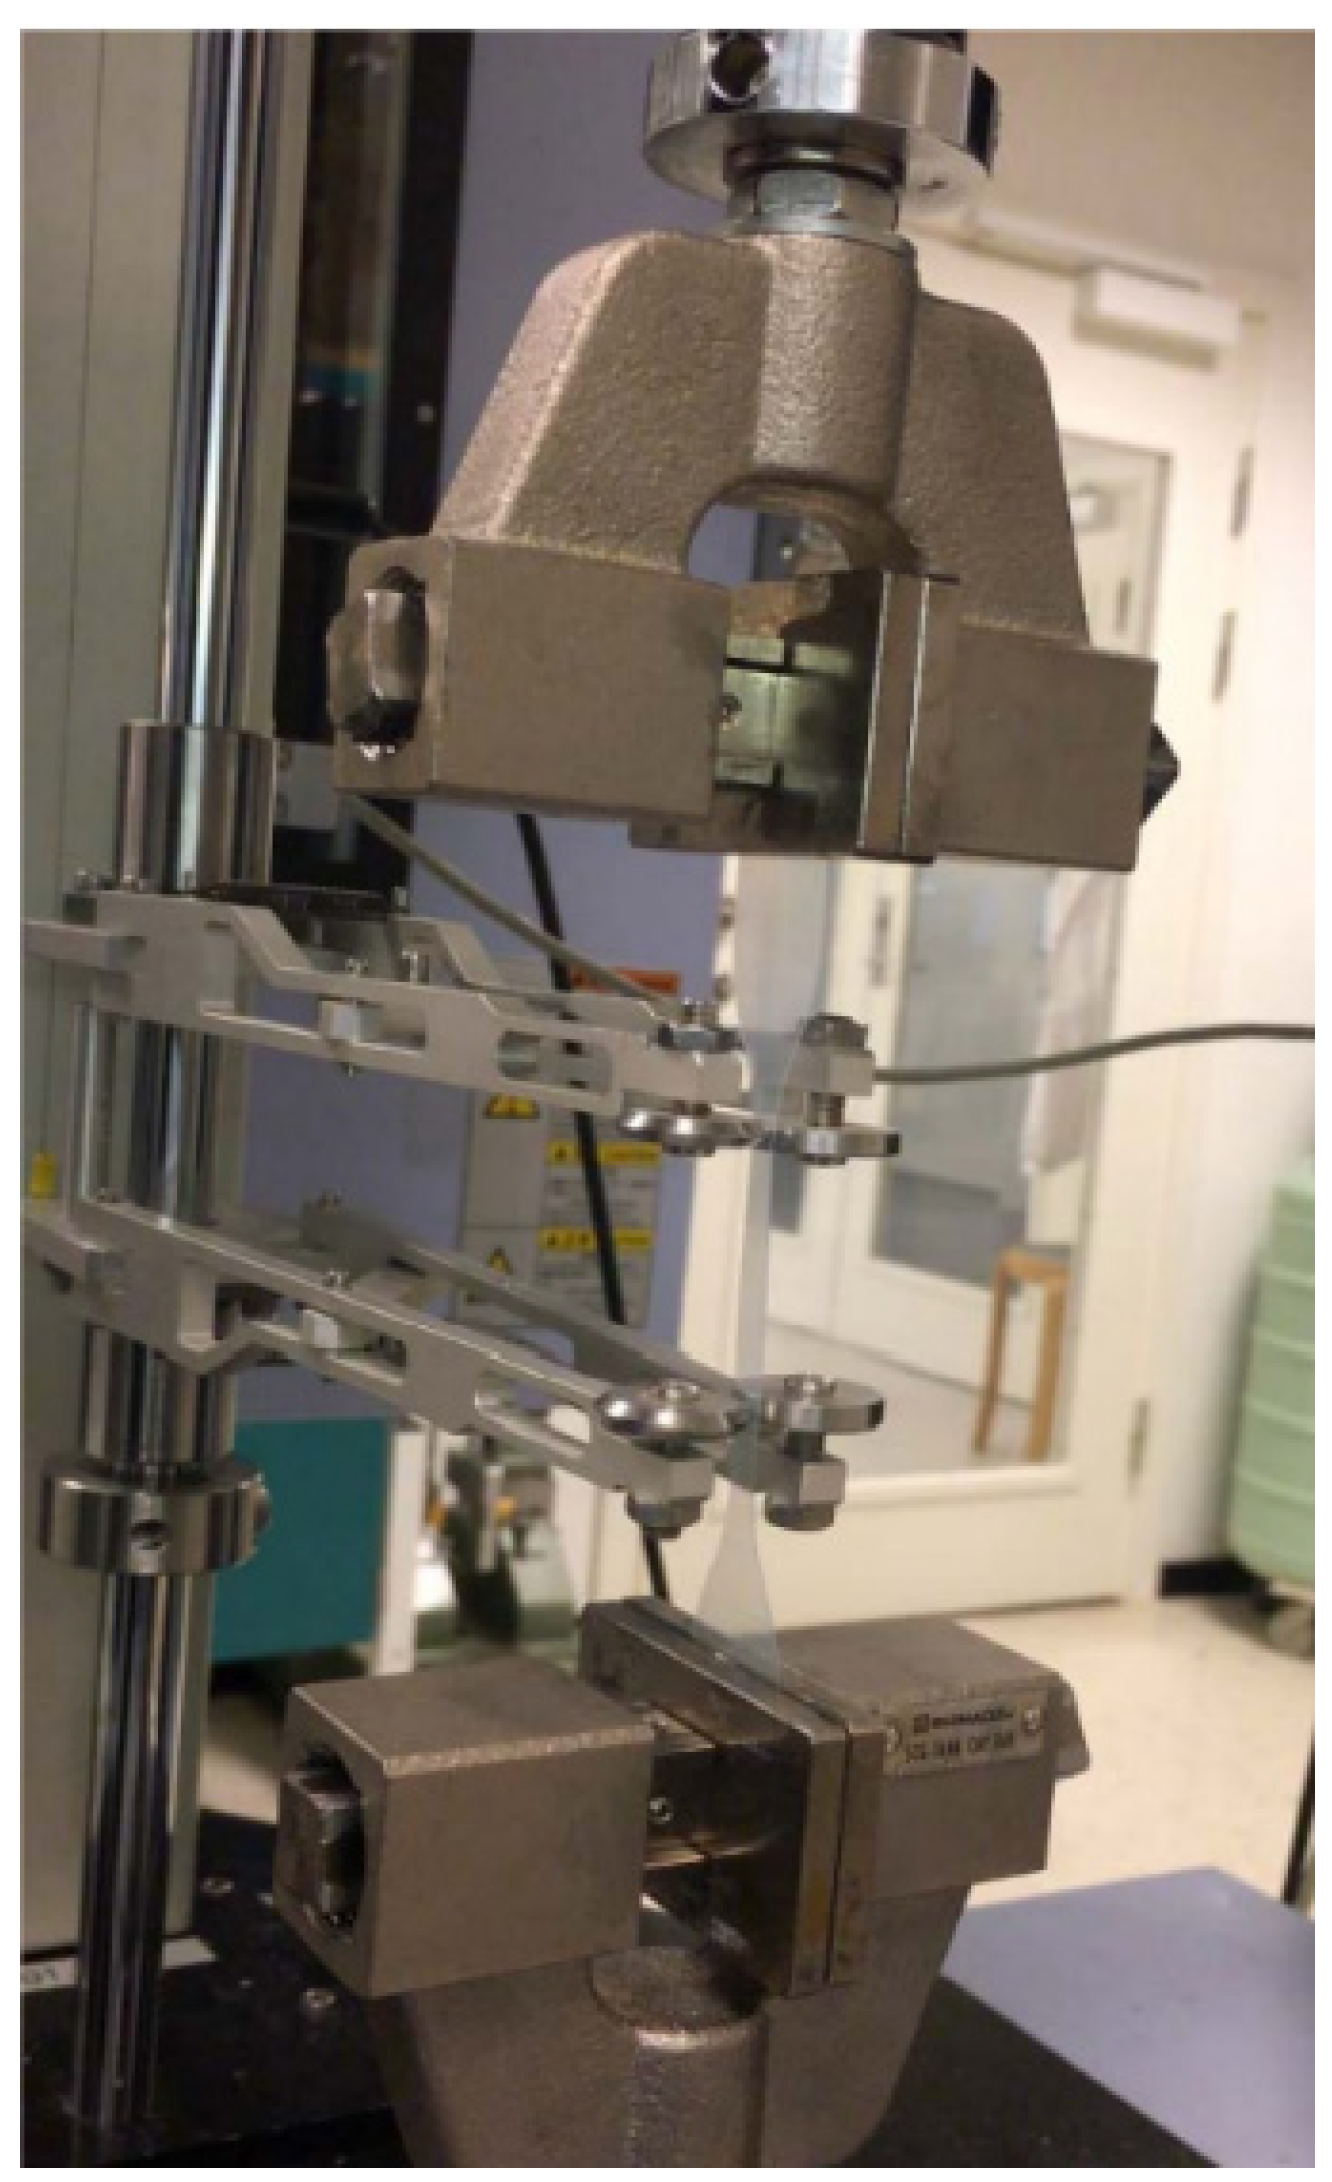
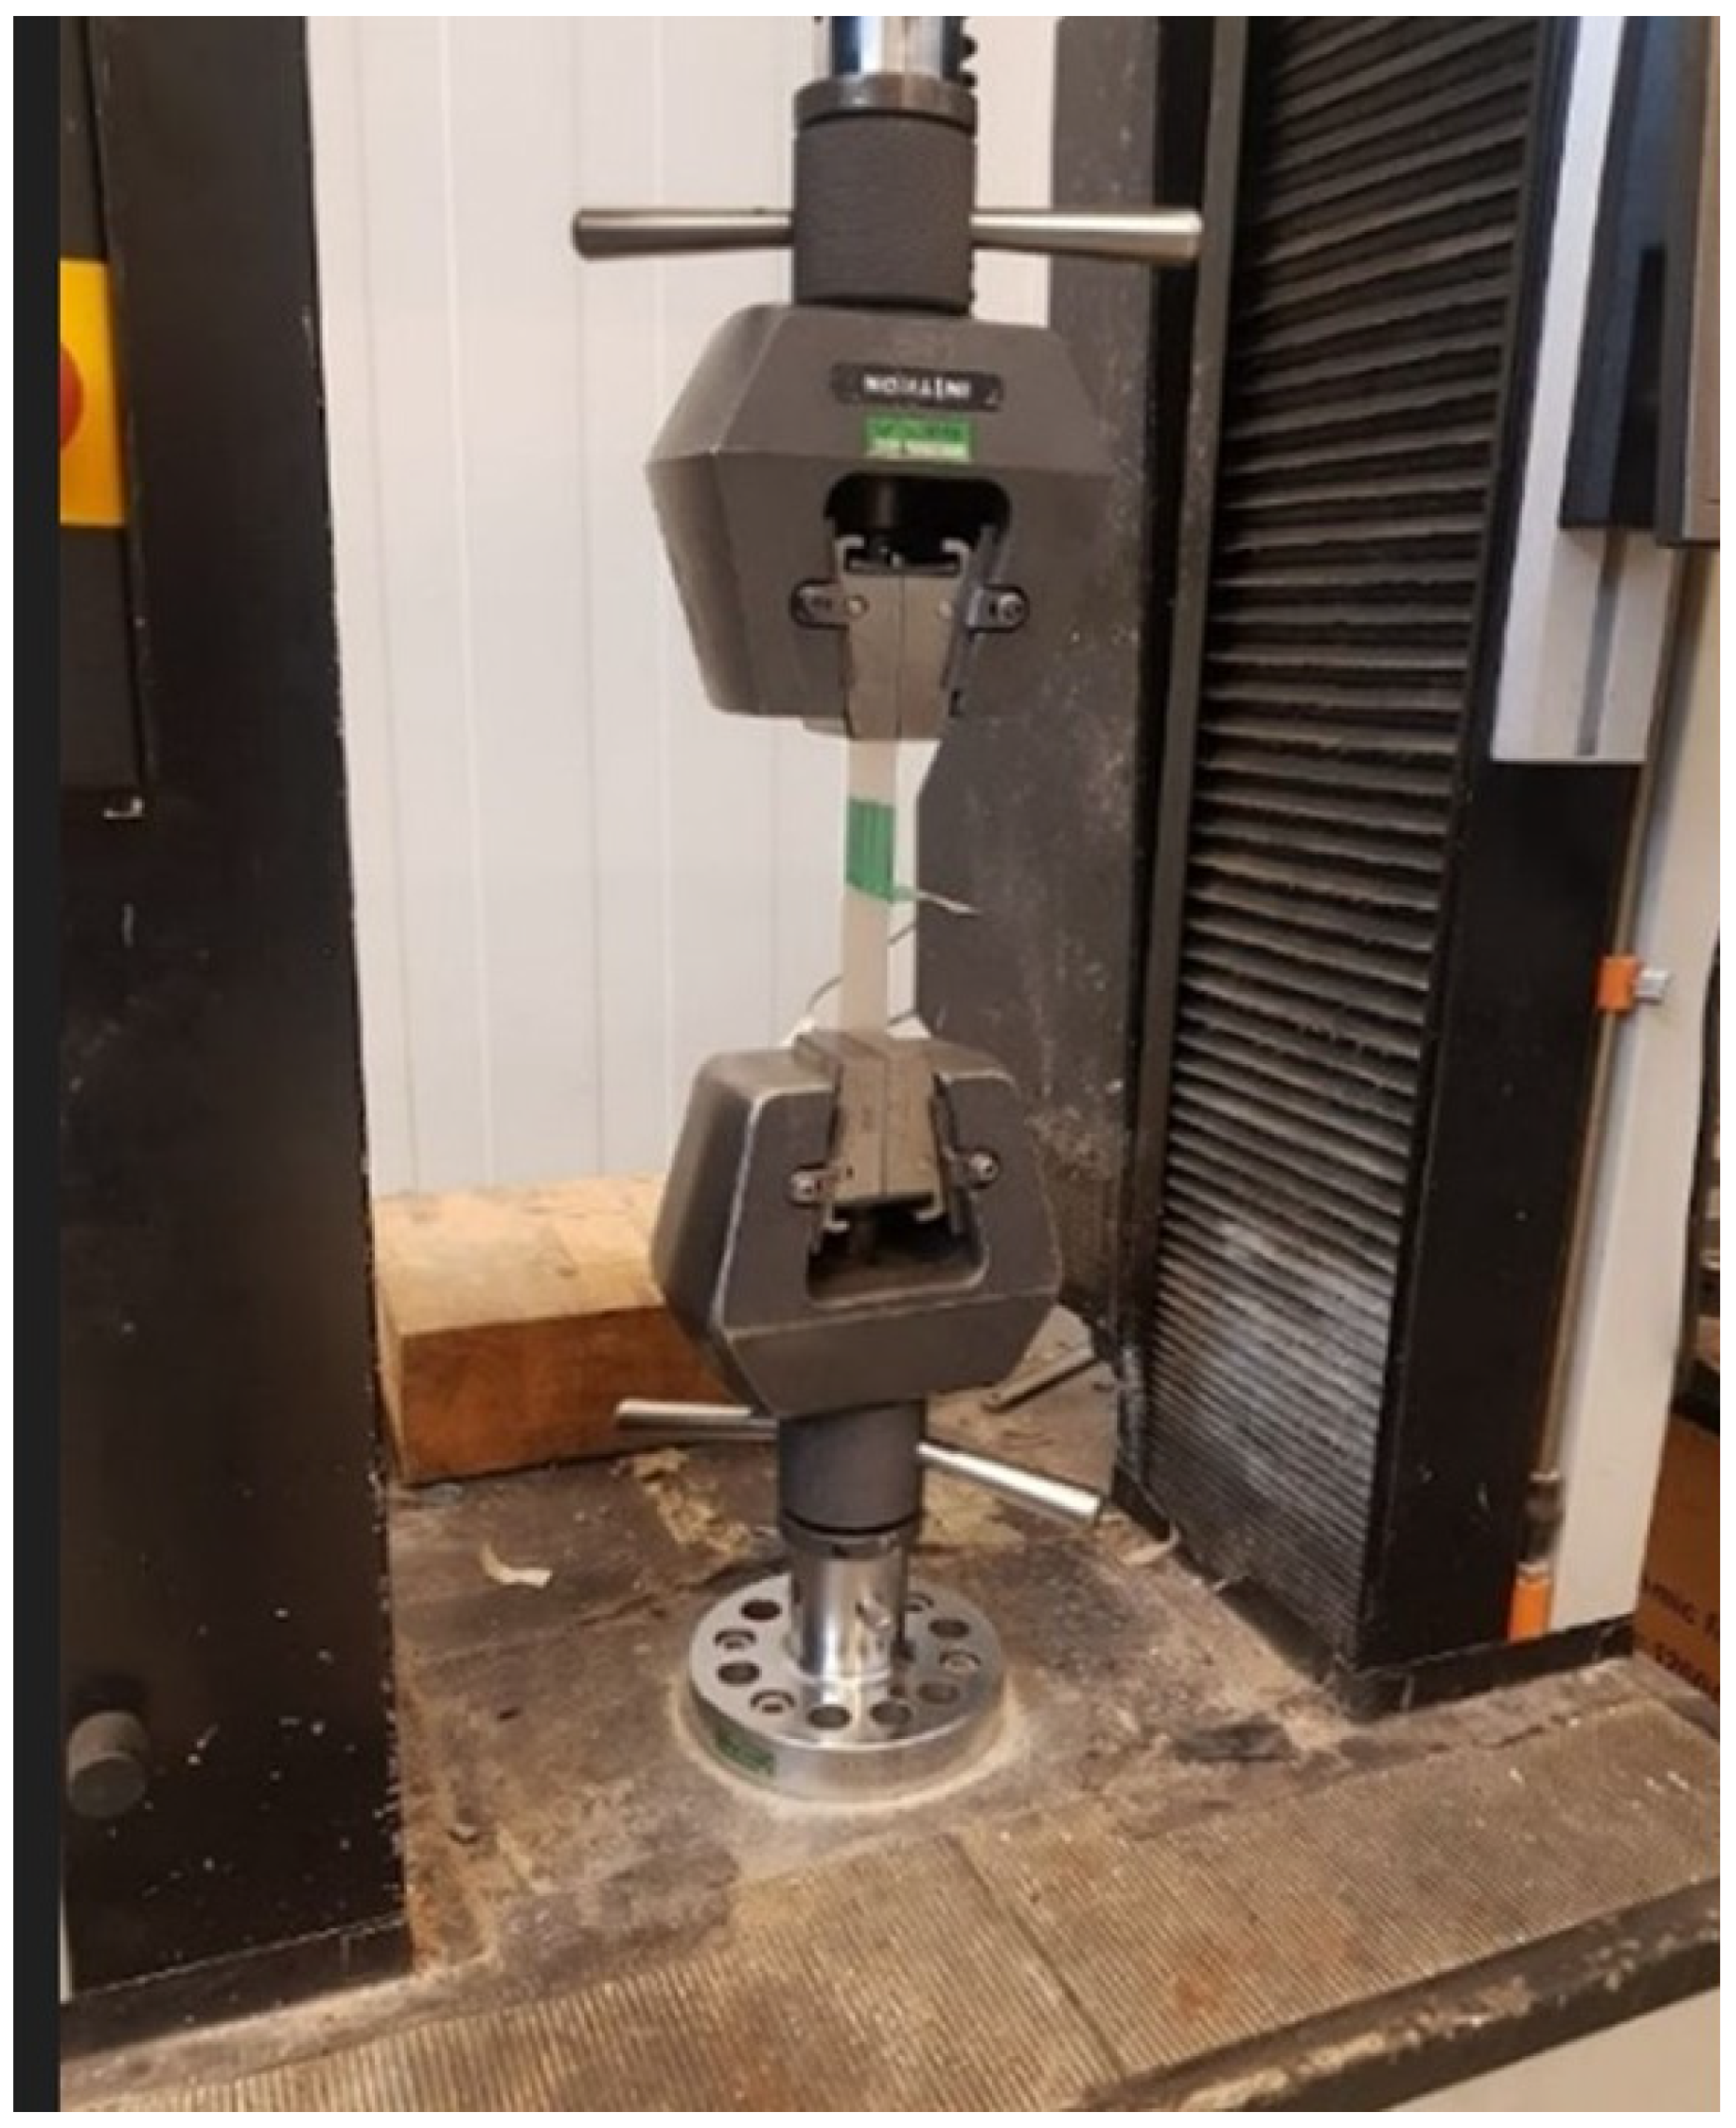
The adhesive strength was measured using an Instron test machine, see
Figure 9. The adhesive strength was measured at a constant grip operating speed of 100 mm ± 10 mm/min. The results were given in N.
2.4.8. Bending Force
Bending force was determined as described in [
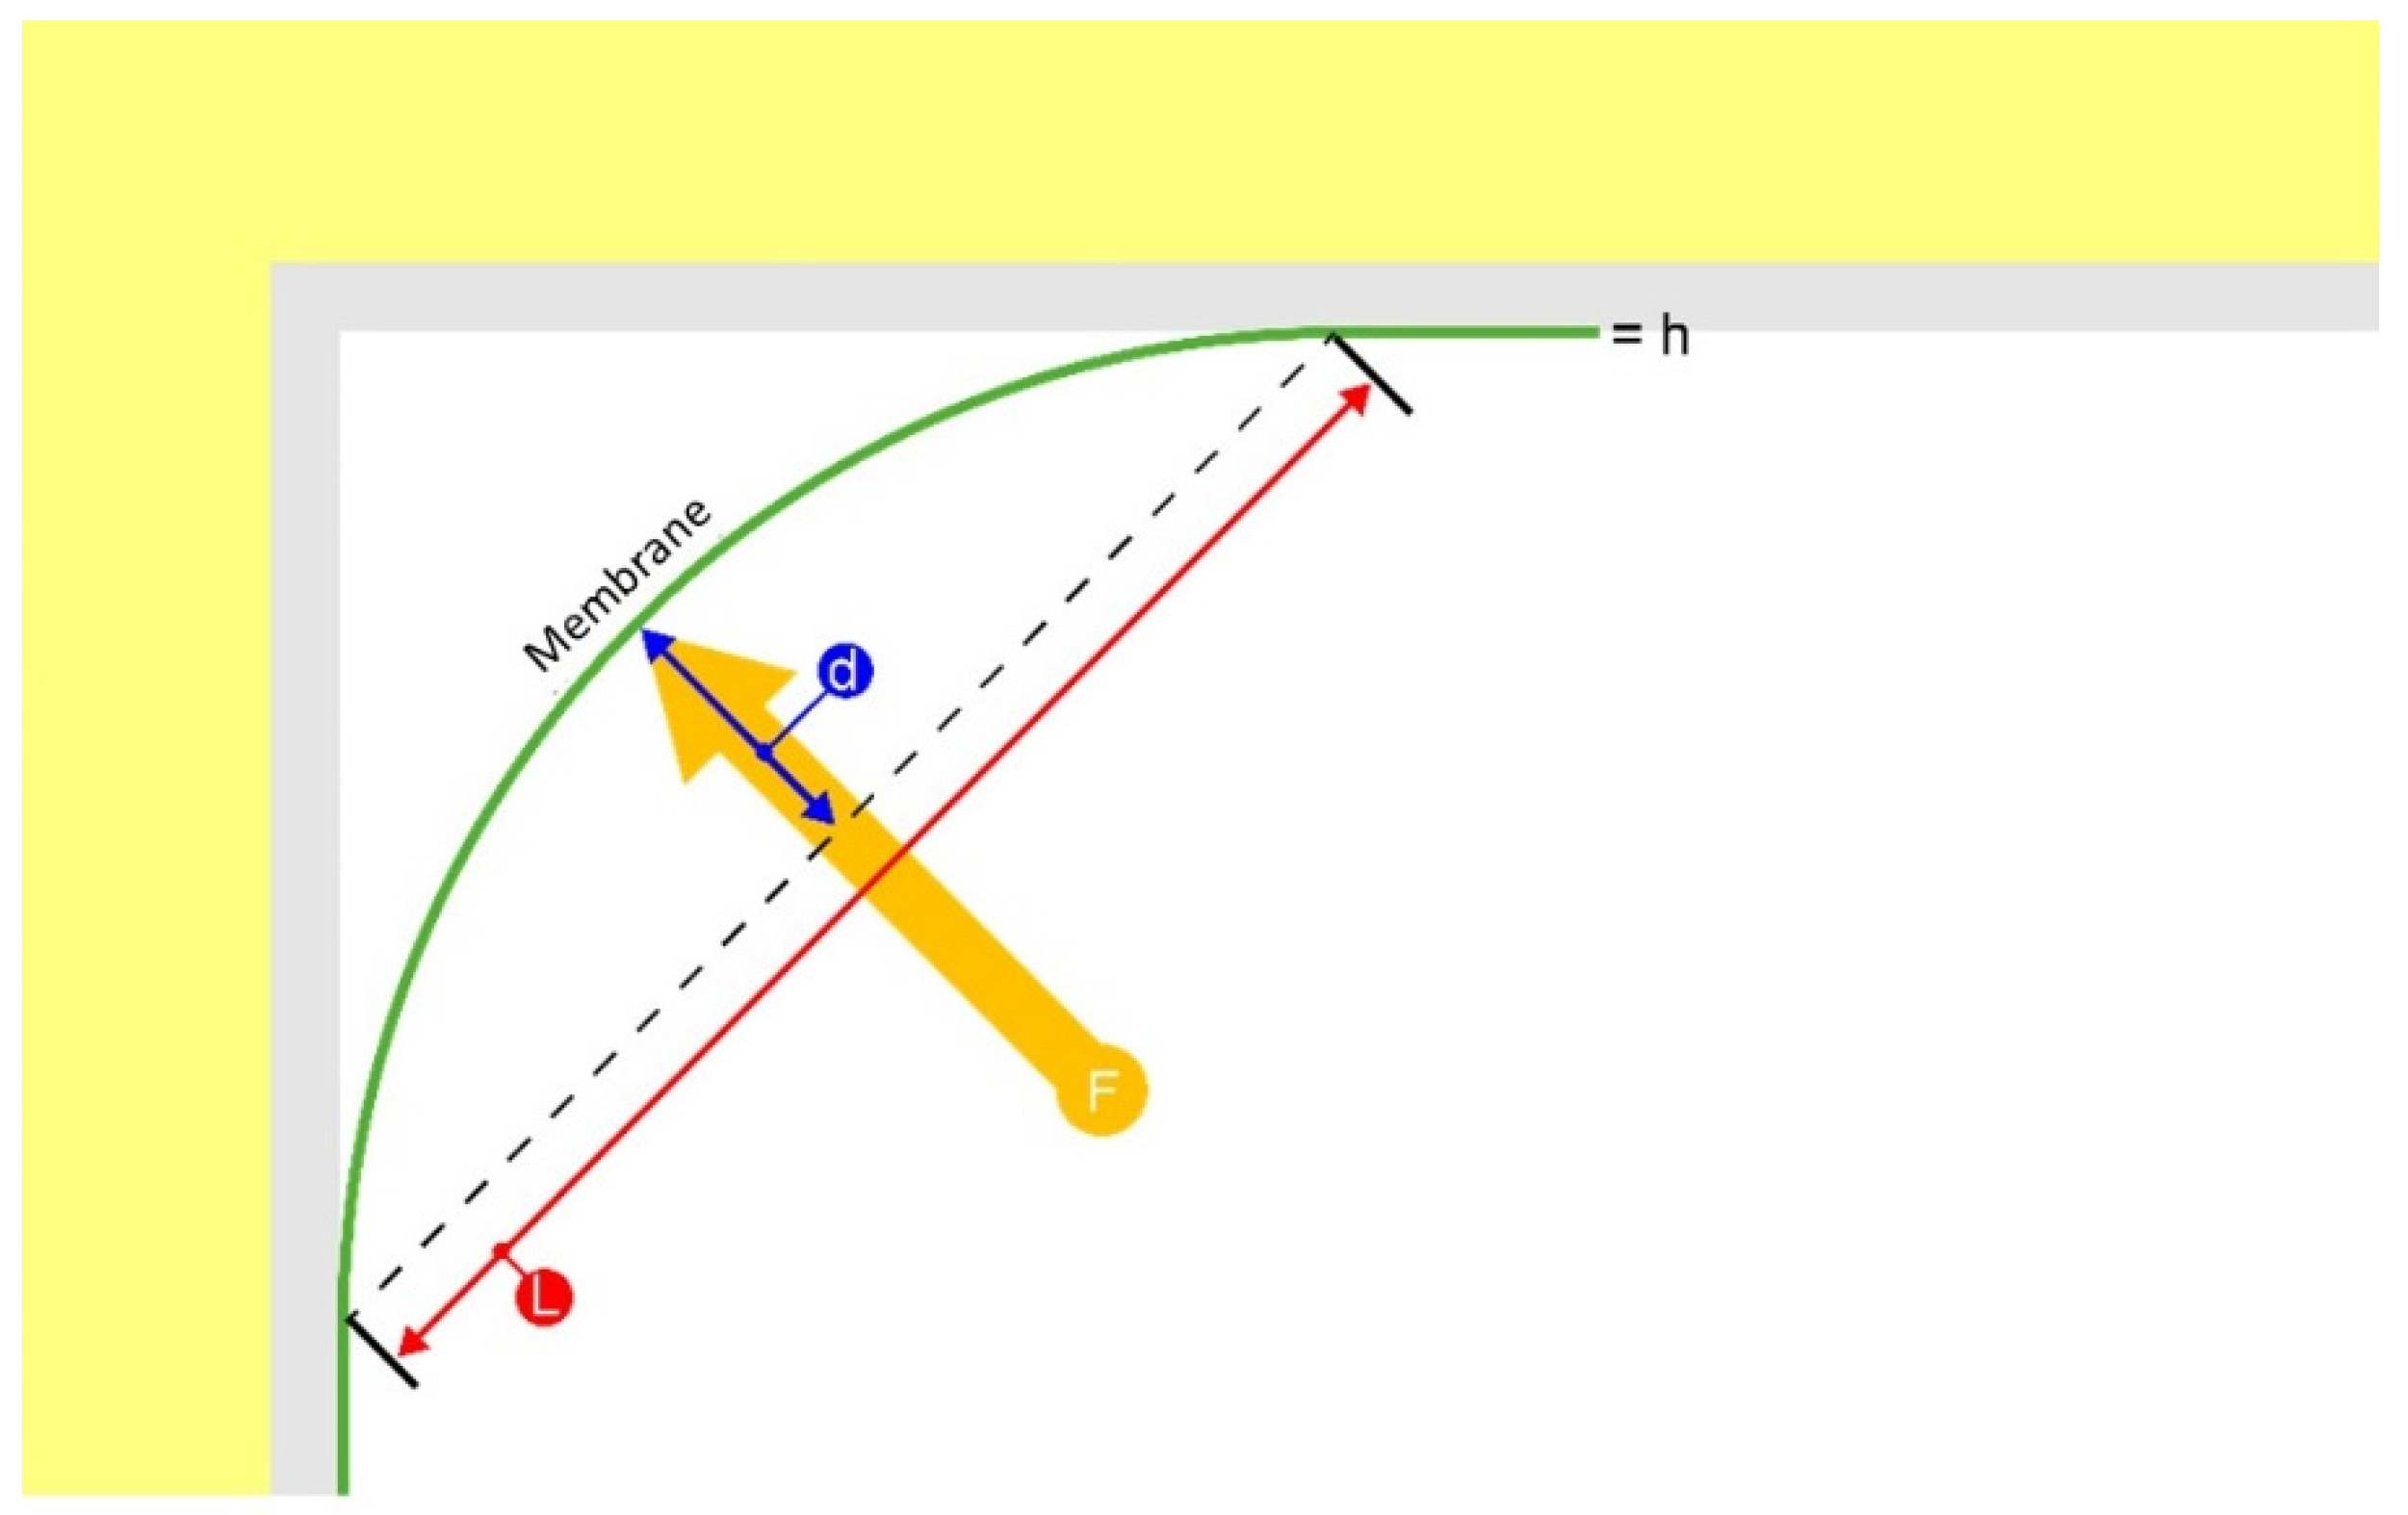
28]. The bending force of membranes was compared using an index. The index determines how easily one membrane compared to another can be handled on site,
Figure 10. The bending force depends on the bending force, Young’s modulus, thickness, width and length of the sample. For the calculation of the bending force, assumptions have been made with regard to d, L and w for comparison purposes. The assumptions were; d = 1 mm, L = 10 mm and w = 1 m. Samples described in the standard [
28] were used.
The bending force is defined as:
where,
F: Bending force [N]
E: Young’s modulus for membrane [MPa]
h: thickness of membrane [m]
d: deflection [m]
L: Length between support points [m]
w: width of membrane [m].
2.5. Visual Examination
Five complete rolls of each membrane containing regenerated PE were examined for cracks, larger fragments and weak areas. Rolls were opened to their full width and length, so they could be fully examined in a single session. The membranes were examined visually in detail, piece by piece.
Cracks, large fragments and weak areas in the individual membrane were cut out and assembled for further classification. The visual examination of membranes thus served to check and compare the sorting and purification of all membranes comprising regenerated PE and its combination with pure PE, had been conducted to an acceptable degree under production.
Detailed information on the manufacturing process was not disclosed by the suppliers, but sorting, purifying, washing, and addition of stabilizers were believed crucial in production of membranes comprising regenerated PE. Membranes of regenerated PE are extruded from molten granules to which stabilizers are added. Granules have been pre-sorted, cleaned and washed. Membranes are extruded and folded before being rolled around a cardboard tube in lengths of typically 25 or 50 m. Rolls were 1 m wide, and the membranes folded in the middle. During visual examination, membranes were unfolded and pulled over a table, 2 m at a time. When the membrane was on the table, the fold-line was examined first followed by the flat surfaces of the membrane itself.
4. Discussion
ATR-FTIR spectroscopy suggested that all membranes, both those comprising pure and regenerated PE, were based on LDPE. No other polymers were found using ATR-FTIR. The Beilstein Test proved negative for the presence of PVC. Signs of chemical degradation of PE on aging were detected by the development of carbonyl groups (C = O) in ATR-FTIR spectra attributed to oxidation of the plastic.
Development of carbonyl groups were only detected after the additional period of thermal aging for 80 days in total (248 days of aging). Based on chemical changes after aging, expected service lifetime of membranes can be divided into short, medium and long, as follows:
T7482-8 is the membrane is expected to have the shortest service lifetime
T7482-1 and T7482-5 are expected to have medium service lifetimes
T7482-2, T7482-3, T7482-4, T7482-6, T7482-7 and T7482-9 are expected to have the longest service lifetimes.
From the latter group, membranes T7482-3, T7482-6 and T7482-9 showed minor signs of oxidation whereas membranes T7482-2, T7482-4 and T7482-7 showed no evidence of oxidation.
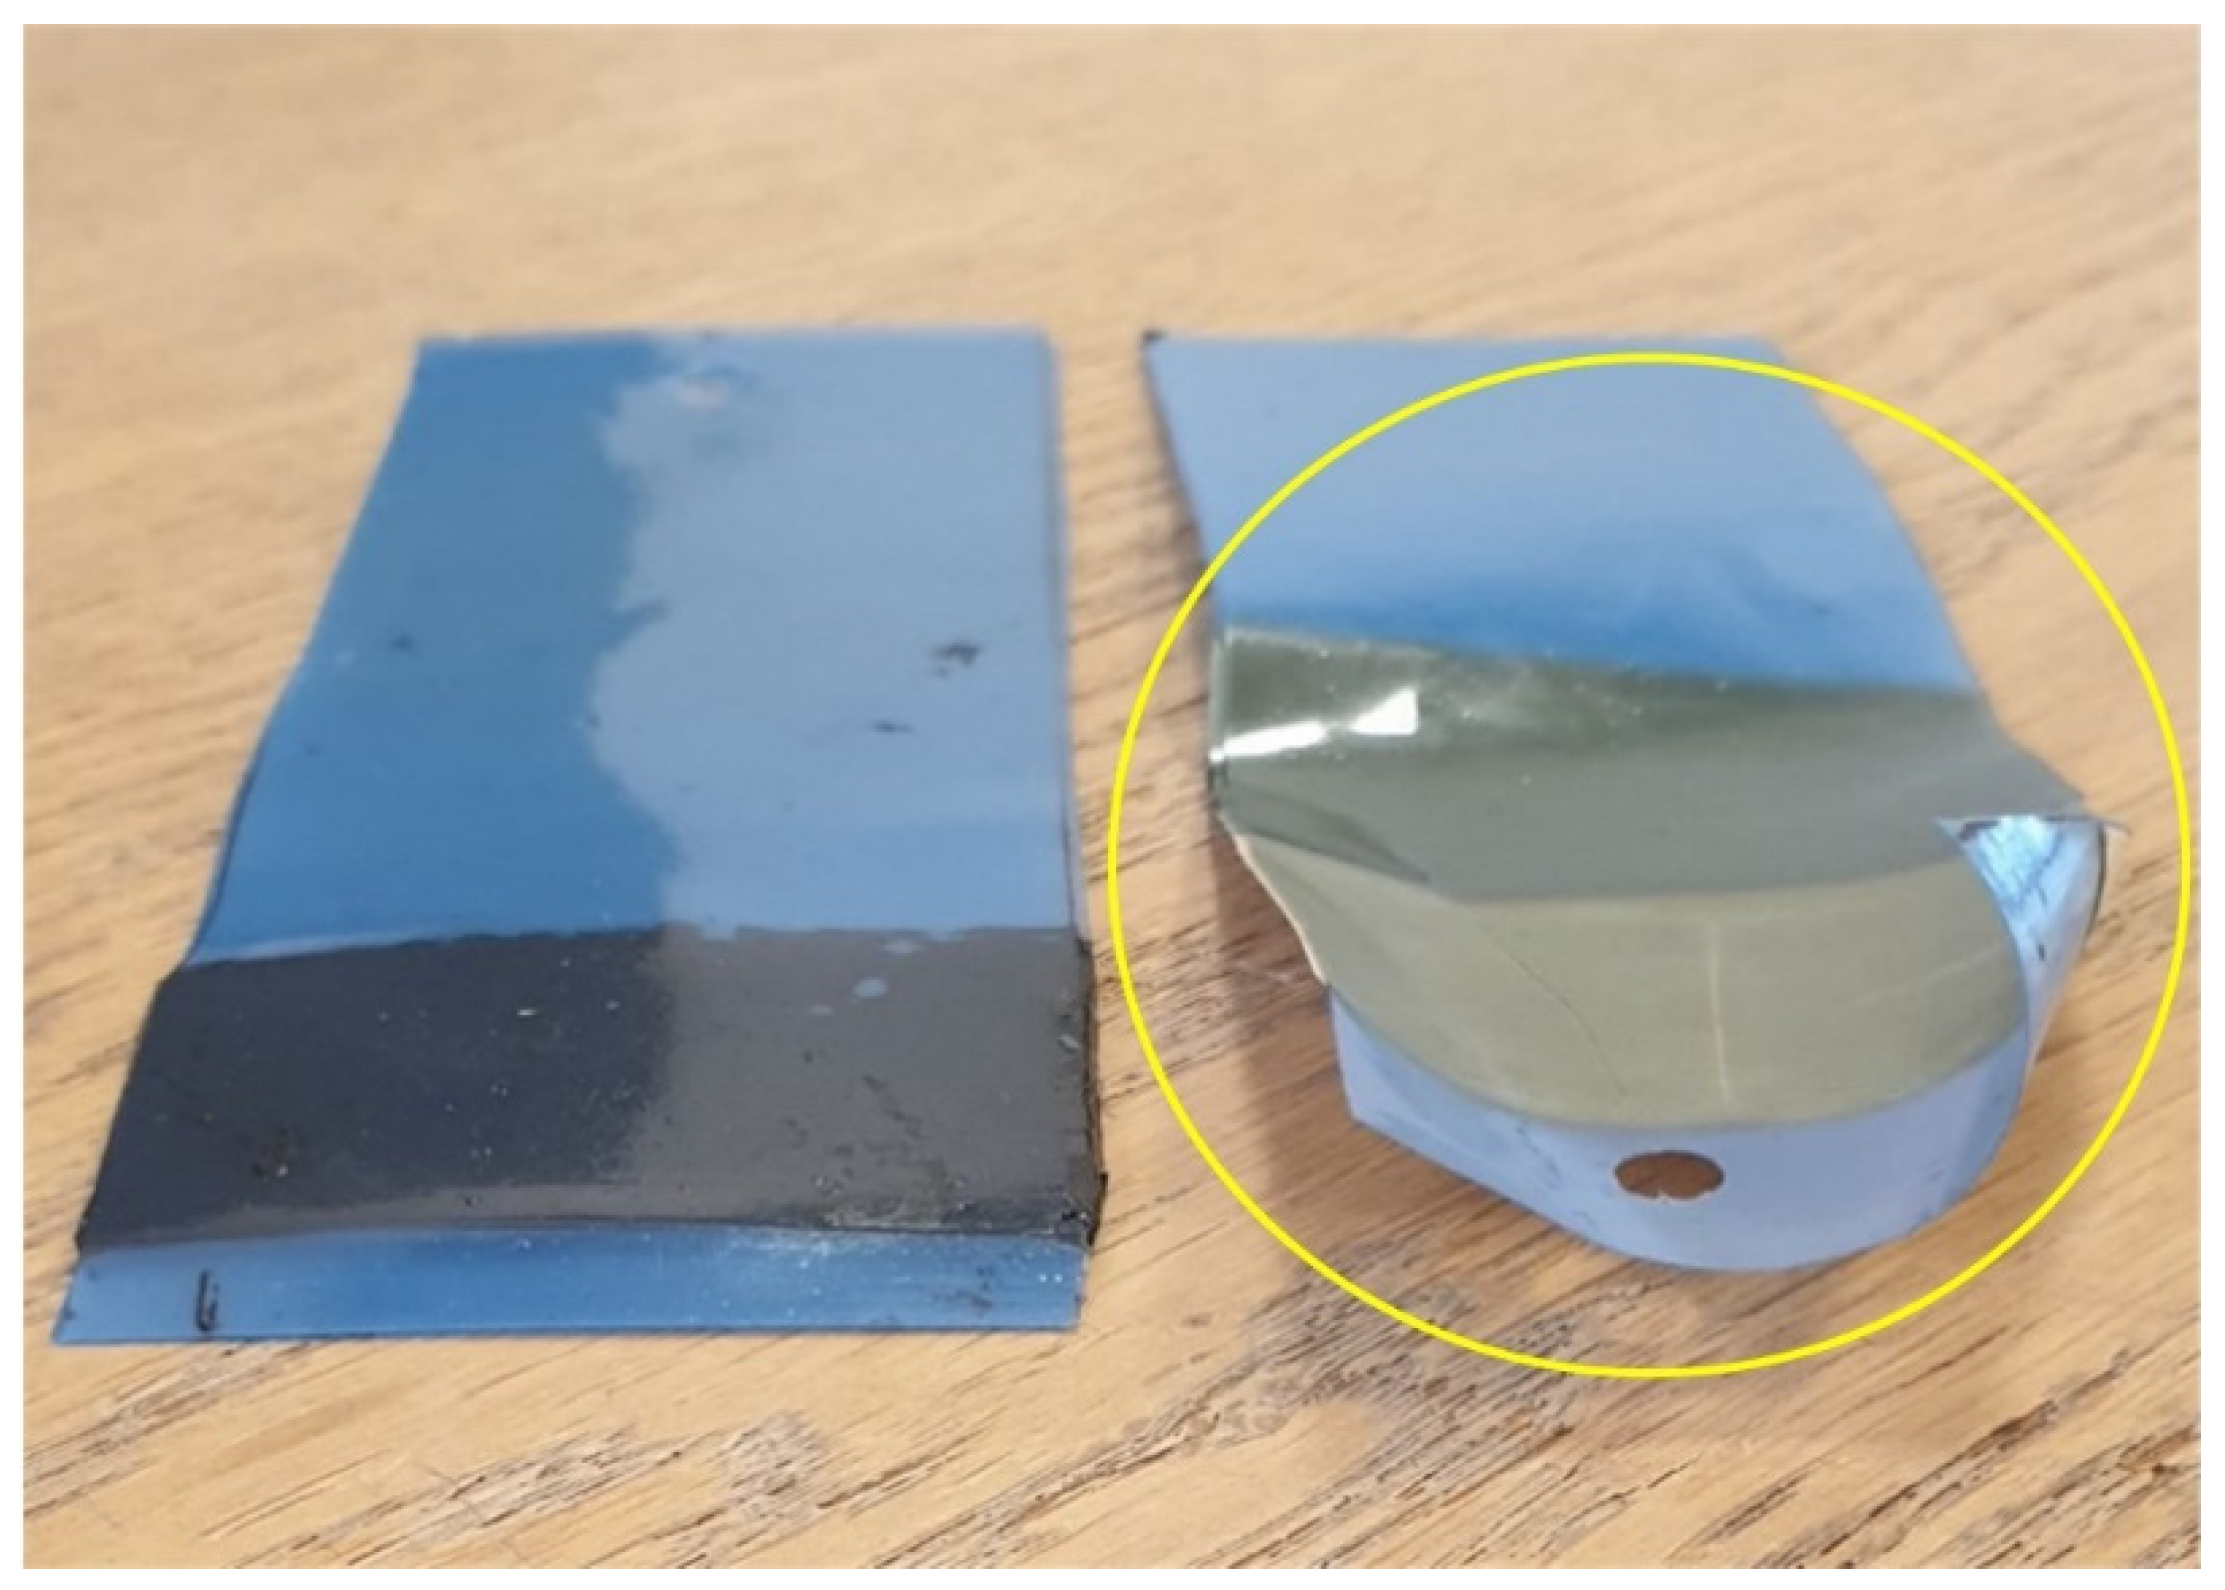
The effects of oxidation of membranes were also reflected in the adhesive strength of taped joints for the vapour barrier system T7482-8. Aged samples of T7482-8 in contact with and in the immediate vicinity of the tape were brittle and the adhesive joints of all samples failed when inserted into the jaws of the Instron test machine (
Figure 20).
The ability of membranes to produce acidic degradation products with time was negated by the results of A-D test. None of the membranes tested caused a change in colour of A-D strips from blue to green or yellow.
In addition to PE polymer, XRF detected elements calcium, titanium, and zinc in the form of calcium carbonate, titanium oxide and zinc oxide in all samples containing regenerated PE. It seems likely that these elements belong to the fillers added to many regenerated polymers to increase their strength and reduce opacity. Titanium oxide is also used to impart white colouration and to reflect UV light from the surfaces of the material. Together with zinc oxide, titanium oxide protects the polymer from sunlight and degradation. These inorganic additives were also detected using SEM. Samples of unaged and aged membranes showed a clear difference in the structure of the surface of the membranes, where membrane T7482-9 showed many inclusions compared with, for example, membrane T7482-4, which appeared to be more homogeneous in structure.
The quantity of inorganic additives in each membrane was determined using loss on ignition measurements. All membranes with virgin and 100% new PE had lower content of inorganic material (highest loss on ignition) compared to the membranes with regenerated PE. Only membrane T7482-4 comprised 100% organic and no inorganic material. Membrane T7482-9 had a loss on ignition of approximately 88.5% and thereby was the membrane containing the highest quantity of inorganic material.
Indexed flexural force of the investigated PE membranes sorted by easiest to work with are T7482-1, T7482-9, T7482-5, T7482-4, T7482-2, T7482-3, T7482-8, T7482-7 and T7482-6, respectively. It is seen that PE membrane T7482-6 has a bending force index which is four times higher than PE membrane T7482-1, which is due to a combination of its higher Young’s modulus and greater thickness.
Tear strength showed no significant change for membranes on aging. However, it should be noted that the average tear strength of aged membranes was slightly higher than for unaged. The resistance to impact varied between the unaged membranes between 2.0 m and 0.45 m. Two of the PE membranes (T7482-1 and T7482-5) have the same resistance to impact before and after aging whereas the remaining seven PE membranes lost resistance to impact after aging, from 1.50 m to 0.35 m. No correlation was detected between resistance to impact and membranes containing pure PE and regenerated PE.
Water vapor moisture resistance number (Z-value) for PE membranes with a thickness of 0.15 mm is published as between 300 and 600 GPa m
2 s/kg [
30]. In the current study, none of the membranes showed moisture resistances below 300 Gpa m
2 s/kg, and some showed above 1000 Gpa m
2 s/kg. All the membranes evaluated had satisfactory resistance to water vapor.
Surface tension tests on unaged samples showed the membranes T7482-2 and T7482-8 stood out by having more than one dyne level difference between the front and the back, where the front has the highest dyne level. For aged samples, the difference in dyne level for the front and the back sides of these two membranes is smaller, but still such that the dyne level is highest for the front side. This means that when mounting membrane systems T7482-2 and T7482-8 one needs to be aware to tape joints at the front side of the membrane. However, the surface tension effect declines with time.
Tensile strengths for all the membranes were relatively similar at about 15–20 MPa. The single exception was membrane T7482-2 that showed significantly higher tensile strength, although the membrane was also the thinnest of those studied. This is accounted for when calculating the tensile strength in order to compare results. In general, variations in tensile strength between unaged and aged samples were small. Elongation at break along the direction perpendicular to the production direction for all membranes, both for unaged and aged samples, was between 550% and 750%, regardless of whether the PE membrane contains pure PE or regenerated PE. No effect of aging was detected based on Young’s modulus. However, it should be noted that Young’s modulus is subject to great uncertainty because it is calculated in a very narrow strain range.
Joints of PE membranes prepared with butyl adhesive were not weakened during aging. In contrast, the adhesive strength of vapour barrier systems prepared with tape was reduced on aging. The least effect of aging was found for the vapour barrier systems T7482-2, T7482-3 and T7482-4. For vapour barrier systems T7482-1, T7482-5 and T7482-6, the adhesive strength is below 3 N/50 mm for the aged samples. For all seven specimens of the vapour barrier system T7482-8, the membrane cracked in the immediate vicinity of the taped joint during handling, and it was therefore not possible to measure the adhesive strength. The adhesive strength was reduced after aging by respectively; 21% for membrane T7482-2, 55% for membrane T7482-3, 60% for membrane T7482-4, 85% for membrane T7482-7, 87% for membrane T7482-9, 94% for membrane T7482-5, 96% for membrane T7482-6 and 99% for membrane T7482-1 for taped joints.
Although T7482-8 joined using tape becomes very fragile after aging, this was not the case when it was joined using butyl adhesive. The fragility of the membrane was therefore assumed to be related to the behaviour of the tape or interaction between the tape and membrane during aging. Additionally, it was observed that the tape induced curling of the membrane, probably due to different coefficients of expansion during aging, caused by heat, moisture, or both, see
Figure 21. None of the other tested taped joints exhibited similar behaviour.
Visual examination of membranes containing regenerated PE showed that all contained fragments of less than 1 mm and single fragments up to 4 mm. Cracks and holes were found in membranes from several different rolls. For membrane T7482-6, three holes were found in the flat surface of the foil of the membrane and 2 holes in the membrane’s fold-line. The holes were between 10 and 20 mm long and 3 mm wide. The holes in the membrane’s fold-line were smaller than 3 mm. For membrane T7482-8, no holes were observed in the fold-line. By contrast, 15 holes were found in the flat surface of the membrane with dimensions up to 18 mm in length and 12 mm wide.
5. Conclusions
This study evaluated and compared the long-term performances of vapor barriers comprising virgin polyethylene (PE), 100% new PE, recycled PE and a combination of new and recycled PE. Membranes were evaluated both alone and as part of assembled systems. All membranes, tapes and adhesives were purchased for this study to retain independence.
The moisture barrier membranes and assembled systems purchased for this project were evaluated and compared using, amongst others, standard laboratory tests described by the standard [
3], that is currently also accepted as a Danish standard. Evaluating tests were conducted on the materials before and after exposure to an aging regime comprising 168 days at 70 °C in total. The purpose of aging was to promote the chemical changes expected to take place within the normal service lifetimes of the vapour barrier systems so that they took place within a convenient period for the study. The aging regime used was equivalent to approximately 30 years of real time, calculated on the basis that the service temperature of the membranes and assembled systems is 10 °C (184 days aging at 70 °C). However, if the assumed usage temperature is increased to 20 °C, the real time corresponds to approximately 15 years. Materials were evaluated using six types of chemical analyses and 13 physicomechanical tests.
No general differences between the performance of membranes solely based on whether they were produced from pure PE (virgin PE and 100% new PE), regenerated PE or a combination of pure and regenerated PE were found. Importantly, water vapor diffusion resistance measurements showed that all membranes examined performed satisfactorily as vapor barriers when new and on aging. The PE membranes examined were found to be based on low density polyethylene, LDPE alone. All membranes examined were chemically stable and none of the membranes examined contained or produced acids upon aging.
Suppliers of the examined membranes suggest that regenerated PE comprises collected PE that is sorted, washed, purified, and stabilized with additives. The study shows that chemical and physical properties for regenerated PE membranes are similar to those of membranes produced from pure PE.
Visual examination of membranes containing regenerated PE showed that they all contain fragments smaller than 1 mm and up to 4 mm. For two out of five of the examined types of membranes of regenerated PE, fractures and holes were observed in the membrane between 3 and 20 mm. Based on visual examination, it may be concluded that a higher degree of quality is needed to produce vapor barrier membranes of regenerated PE. Producing membranes containing regenerated PE to be used for vapor barrier without significant defects is clearly a challenge for some manufacturers and is an issue that needs to be addressed.
Measurement of adhesive properties of taped membrane assemblies suggested that there was a general reduction in adhesion after aging, although one membrane appeared to interact with tape on aging and became so brittle that it fragmented before testing.
To examine their performance in the long term, additional aging of up to 80 days (in total 248 days) was performed on all membranes prior to re-examining them visually and chemically. No significant differences were measured in the performances of membranes comprising virgin PE, 100% new PE, recycled PE or a combination of new and recycled PE. However, it should be noted that chemical changes started taking place soon after the standard aging period described by the standard [
13], which recommends aging according to [
33], as used in this study. Based on the additional aging regime, the present study suggests the following:
- T7482-8
is the membrane expected to have the shortest service lifetime;
- T7482-1
and T7482-5 are expected to have medium service lifetimes;
- T7482-1
T7482-2, T7482-3, T7482-4, T7482-6, T7482-7 and T7482-9 are expected to have the longest service lifetimes.
It was not possible to distinguish between aging properties for membranes comprising virgin PE, 100% new PE, regenerated PE or multi-layered virgin and regenerated PE.

 ,
, 


