Article

Comprehensive Evaluation of Thermal Comfort in Ship Cabins: A Case Study of Ships in Yangtze River Basin, China

School of Urban Design, Wuhan University, Wuhan 430072, China
*
Author to whom correspondence should be addressed.
Buildings 2022, 12(10), 1766; https://doi.org/10.3390/buildings12101766
Submission received: 29 August 2022 / Revised: 29 September 2022 / Accepted: 5 October 2022 / Published: 21 October 2022
(This article belongs to the Section Building Energy, Physics, Environment, and Systems)

Abstract

:
In recent years, the waterway navigation and transportation industry has been developing rapidly, and the living environment of ship cabins has not received much attention. Using questionnaire surveys, data collection and computer simulations, this study explored the problems and causes related to thermal comfort that affect a crew living onboard. The survey showed differences in the thermal sensations of the crew. Cabins below the deck of a ship are usually more comfortable than those above deck. These differences were related to the range of frequent activities undertaken in the cabins. The data and calculations show that the thermal comfort in the stern winch cabin and the engine cabin was significantly higher than in the top living cabin and the meeting cabin. For cabins without windows in winter, the PMV and PPD indexes of those below deck were on average 11.95% higher and 7.03% lower, respectively, than those above deck, indicating better overall thermal comfort below deck. The simulation showed that the simulated PMV of an occupied cabin was up to 17.55% higher than the actual PMV, indicating that the number of crew members in the cabin significantly affected its level of thermal comfort. The results provide a reference for understanding and improving the thermal environment of ships and temporary water facilities.

1. Introduction

The thermal comfort of interior spaces has always been an important indicator of environmental quality, but most research has been traditionally confined to traditional buildings and some temporary structures, such as ships, float on water have been neglected for long periods. In recent years, China’s shipping industry has entered a track of rapid development, which depends not only on technological progress but the professionalism of the qualifications of seafarers. One of the core elements of a ship is the quality of its crew’s living quarters, which has not received widespread attention [1]. Improving the crew’s thermal comfort not only benefits their mental and physical health during long voyages but also plays a very important role in enhancing their professional identities and motivation. Moreover, the living quarters are an important part of the green development of a ship’s whole life cycle, which includes its manufacturing and operating costs. A comprehensive approach has been applied in this research to explore the thermal comfort of ship cabins that have not received much attention. Many studies have discussed the thermal comfort of buildings as an important indicator for indoor environmental evaluation. For example, Rupp predicted the thermal comfort of office buildings in Brazil for both temperate and humid climates [2]. Antonio Martinez-Molina et al. conducted a study on a primary school located within a historic building in Spain [3]. Zhang Dong et al. conducted a comprehensive evaluation and optimization of rural heating methods and thermal comfort in cold areas [4]. There are obvious differences in the external environments and structural patterns of buildings and ship spaces. The users of buildings are more flexible in their behaviors and have greater autonomy over their spaces, whereas the crews of ships have less autonomy over their spaces because of their special working environments and relatively small cabins. Therefore, the crews would be more dependent on their ships’ environments.
Traditionally, research on thermal comfort has mainly combined questionnaires with microenvironment data collection and calculations, among which the standard effective temperature (SET), global thermal climate index (UTCI), physiological equivalent temperature (PET), and predicted mean vote-predicted percentage dissatisfied (PMV-PPD) model are the most common [5]. Most studies on typical indoor environments have been based on the PMV method proposed by Fanger, which uses a stable and well-controlled uniform climate chamber to establish thermal comfort evaluation indicators [6]. Thermal comfort standards based on PMV models for building design and operation have been widely accepted [6] and adopted as official methods by many national and international standards organizations [7], such as ISO 7730 [8], ASHRAE 55 [9], EN 15251 [10], and China GB/T 50785 [11]. Hiroki Ikeda et al. pointed out that evaluations using the PMV index for naturally ventilated buildings have significantly differed from subjective voting [12]. Huan Zhang et al. also proposed that the traditional PMV index could not comprehensively evaluate the thermal comforts of buildings with large areas of glass lighting [13]. To resist wind and rain, the sizes of portholes have been designed to be very small. For this study, the PMV-PPD model is suitable but not completely applicable to all scenarios, as it performs better in steady-state environments than in transient ones. The thermal comfort of the human body needs an adaptation process [14].
Different geographical locations and customs have resulted in people having different heat tolerances and expectations, so the above standard cannot be completely applicable to all environments. To solve this problem, Fanger and Tofum [15] introduced the ePMV model to highlight people’s expectations based on local climate and the popularity of mechanical adjustments. There have been only a few studies on the differences in the thermal comfort of different working environments. Shi Mingde used PMV to build a general simulation model that could predict the thermal conditions and human behaviors in an airplane’s cockpit [16] but could also be applied to a ship’s cockpit. Only a few scholars have paid attention to the thermal comfort evaluation of water-based vehicles. Liu Hongmin et al. explored the thermal comfort of cabin environments in winter, then presented statistics with subjective and objective data on the subjective thermal sensations of passengers who resided briefly on a moving ship [17]. Zhang Shuai, He Dengkai, et al. analyzed the thermal comfort of a cabin in a Jiaolong manned submersible vehicle and proposed a PMV-based evaluation method for its thermal characteristics and comfort that could be applied to a manned deep-sea submarine [18]. Chen Senyang et al. believed that different furniture arrangements in cruise cabins would affect thermal comfort, so they formulated appropriate schemes and simulations [19]. Hongshan Guoa, B, Dorit Aviva, et al. critically examined the complexity of the mean radiation temperatures of dynamic environments inside vehicles [20]. Hamza Zahid et al. proposed real-time sensor data to establish dynamic evaluation indexes for thermal comfort by using the Internet of Things to reach effective solutions for thermal comfort evaluations of real-time changes in the external environments of spaces within ships [21]. Maohui Luo et al. showed that the thermal expectations among people significantly differed according to the location and nature of their work [22]. The thermal expectations of sailors working on the deck or mechanics working in the engine rooms differed from those working in other locations and professions. Moreover, even the same person could have different physiological states in different environments. H. Liu et al. studied the adaptation values of the thermal comfort, metabolic rates, and clothing insulation of passengers in air-conditioned cabins [23]. Hence, differentiated studies on thermal comfort in different working environments are required.
The following summary regards specific research methods. B. Goujard et al. evaluated cabin comfort from the perspective of acoustics by collecting 100 questionnaires featuring both open and closed questions, then evaluated the factors, such as temperature and light, related to acoustic comfort [24]. Yong Li et al. conducted a questionnaire survey and set of environmental measurements for underground buildings, then found that the actual thermal sensations of the users were not as bad as had been predicted by PMV [25]. Sanaz Amindeldar et al. conducted measurements in a target study area for five consecutive days, thus correcting for neutral temperatures in the cold season [26]. Federico Rossi et al. summarized the influencing factors of materials on thermal comfort by monitoring the numerical changes in the lower microenvironments of two different shading materials [27]. Anastasios Ioannou et al. corrected the thermal comfort zones of residential interiors in the Netherlands by combining measurements and questionnaires [28]. Alfano et al. introduced a thermal environment assessment method for built spaces, then discussed the main aspects of their thermal comfort design and assessment, as well as the value and significance of continuous measurements of temperature and humidity [29]. Many achievements in the simulations of thermal environments have been made. P.H. Shaikh et al. simulated a thermal environment and found the simulation to be helpful in design optimization [30]. Rakshitha Vidhyashankar et al. simulated spatial changes in the thermal comfort of indoor open spaces by using architectural simulation tools that solved the problems of traditional simulation methods, which could not distinguish thermal comfort at different points in a single room [31]. Katarzyna Nowak-Dzieszko et al. simulated the structure and various internal parts of a residential building to analyze the differences in thermal comfort under different microclimate conditions and balcony forms [32]. Unlike a high-density urban environment, a river surface is more open and the vessels traveling on it do not have fixed orientations as do buildings on land, so the direct radiations of the decks and cabins are more complicated. Because the working modes and water levels caused by climate change to the ships and water contact states are not the same, the influence factors of the thermal environments in the cabins are more complicated. Users of such spaces generally think of thermal comfort as more important than visual comfort, acoustic comfort, and air quality because thermal comfort is directly related to behavioral quality [33]. A crew’s health and work efficiency are strongly affected by thermal environments in cabins, so an investigation of them would be quite significant.
Our study focused on changes in the thermal comfort of cabins caused by factors, such as temperature and relative humidity, of a ship’s external environment. We compared and analyzed the thermal comfort data of different cabin spaces in a geotextile-laying vessel, as an example of an inland river ship, operating in the Wuhan basin of the Yangtze River.

2. Research Methodology

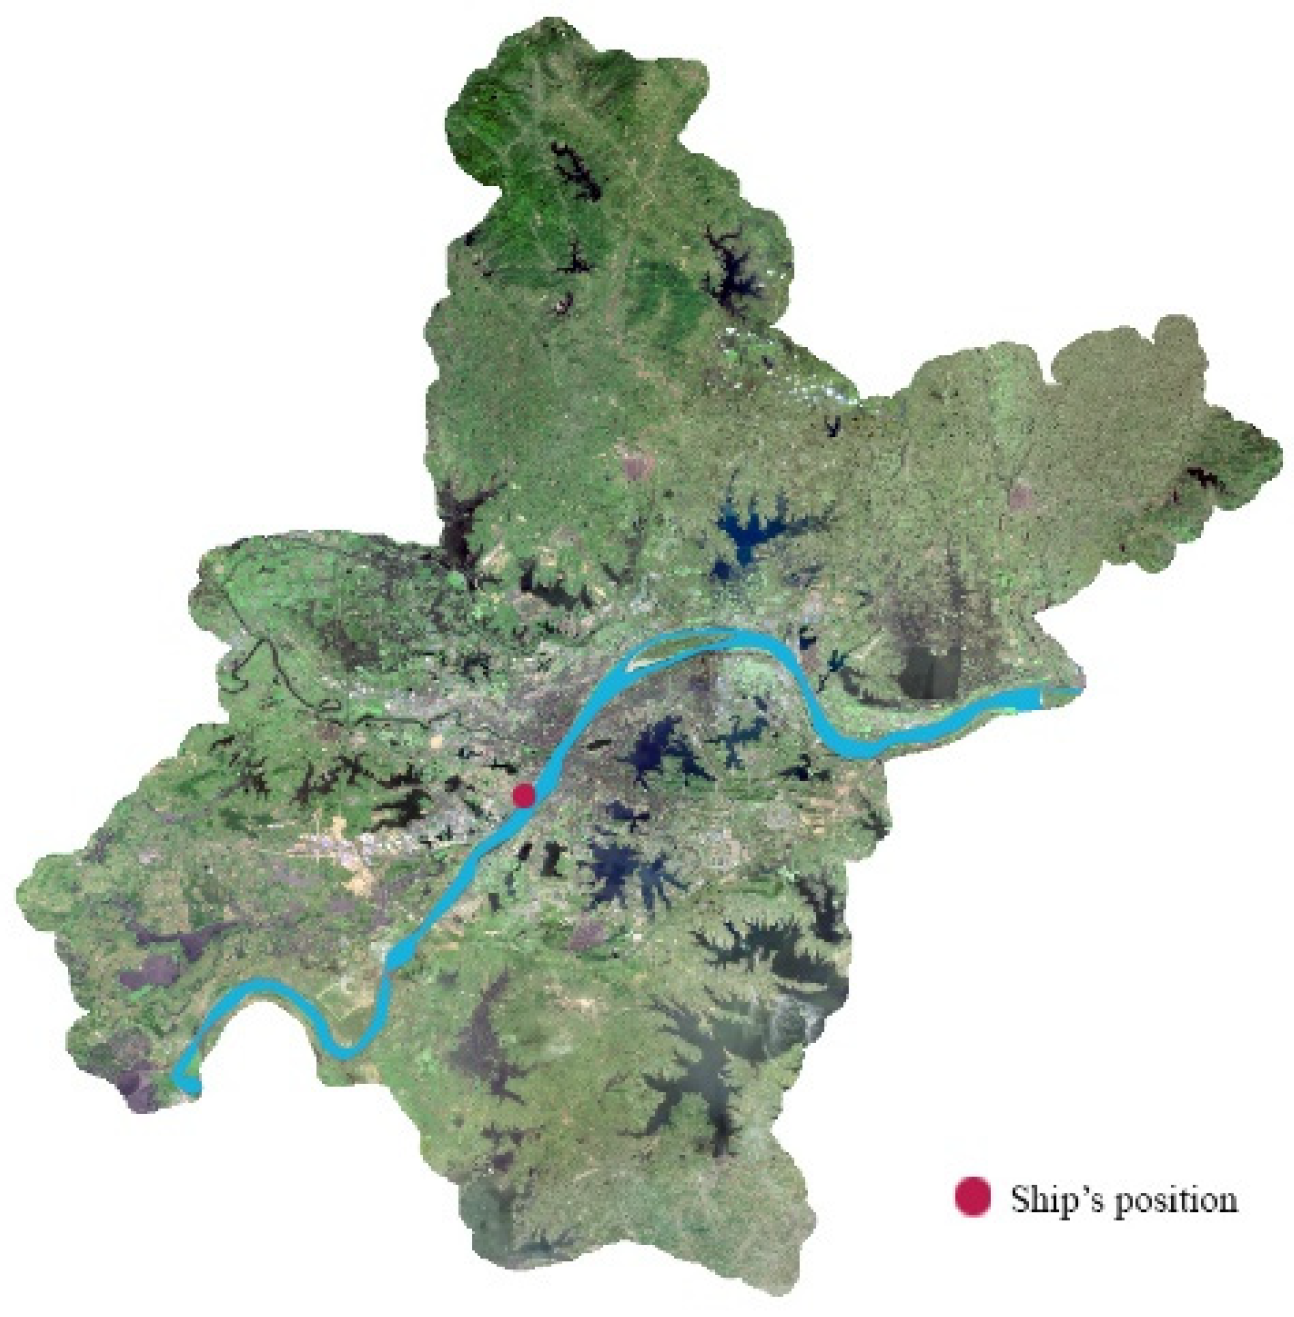
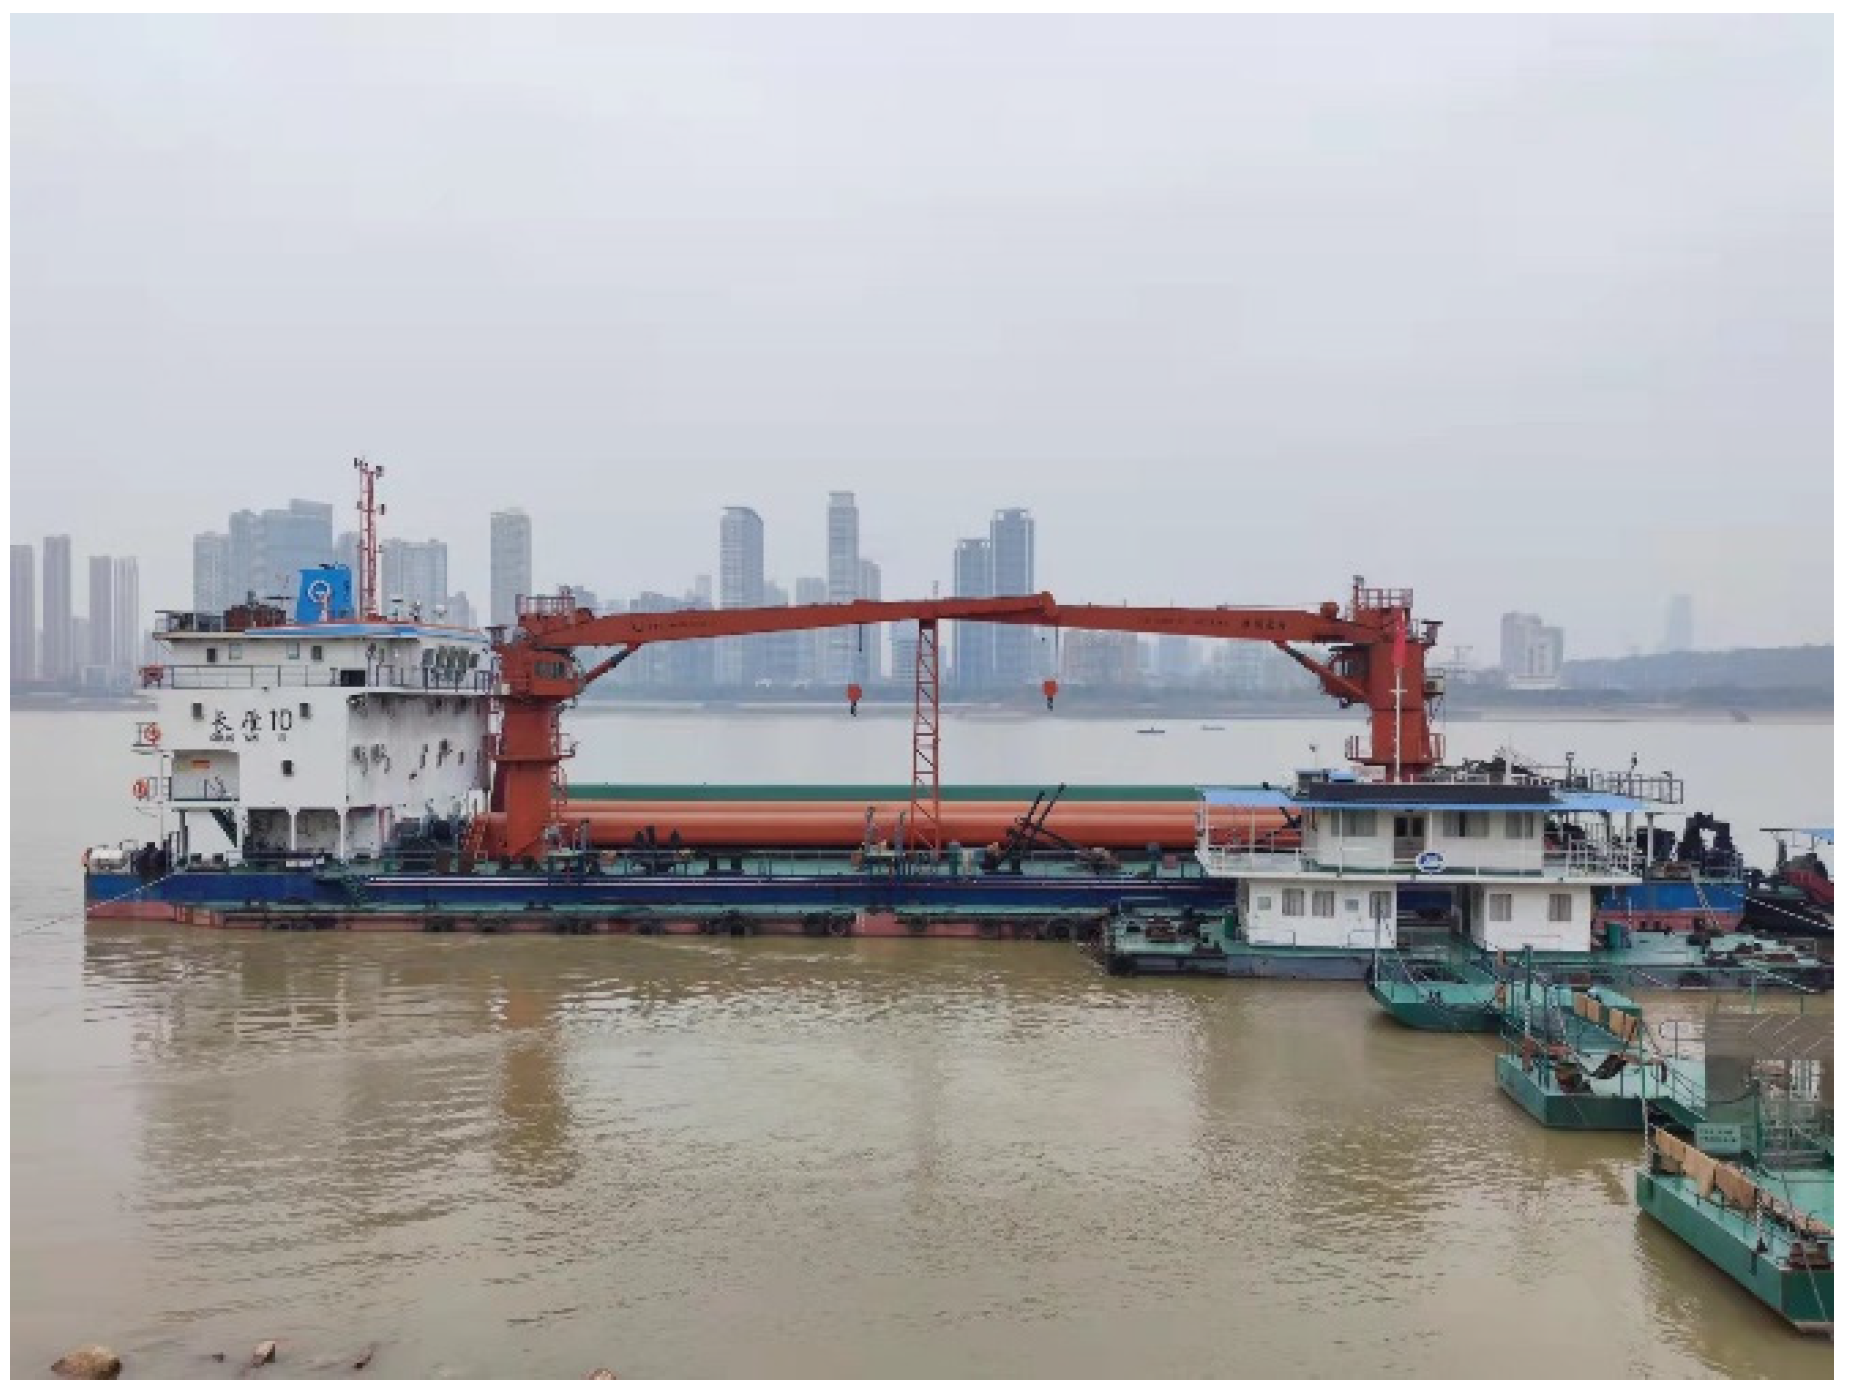
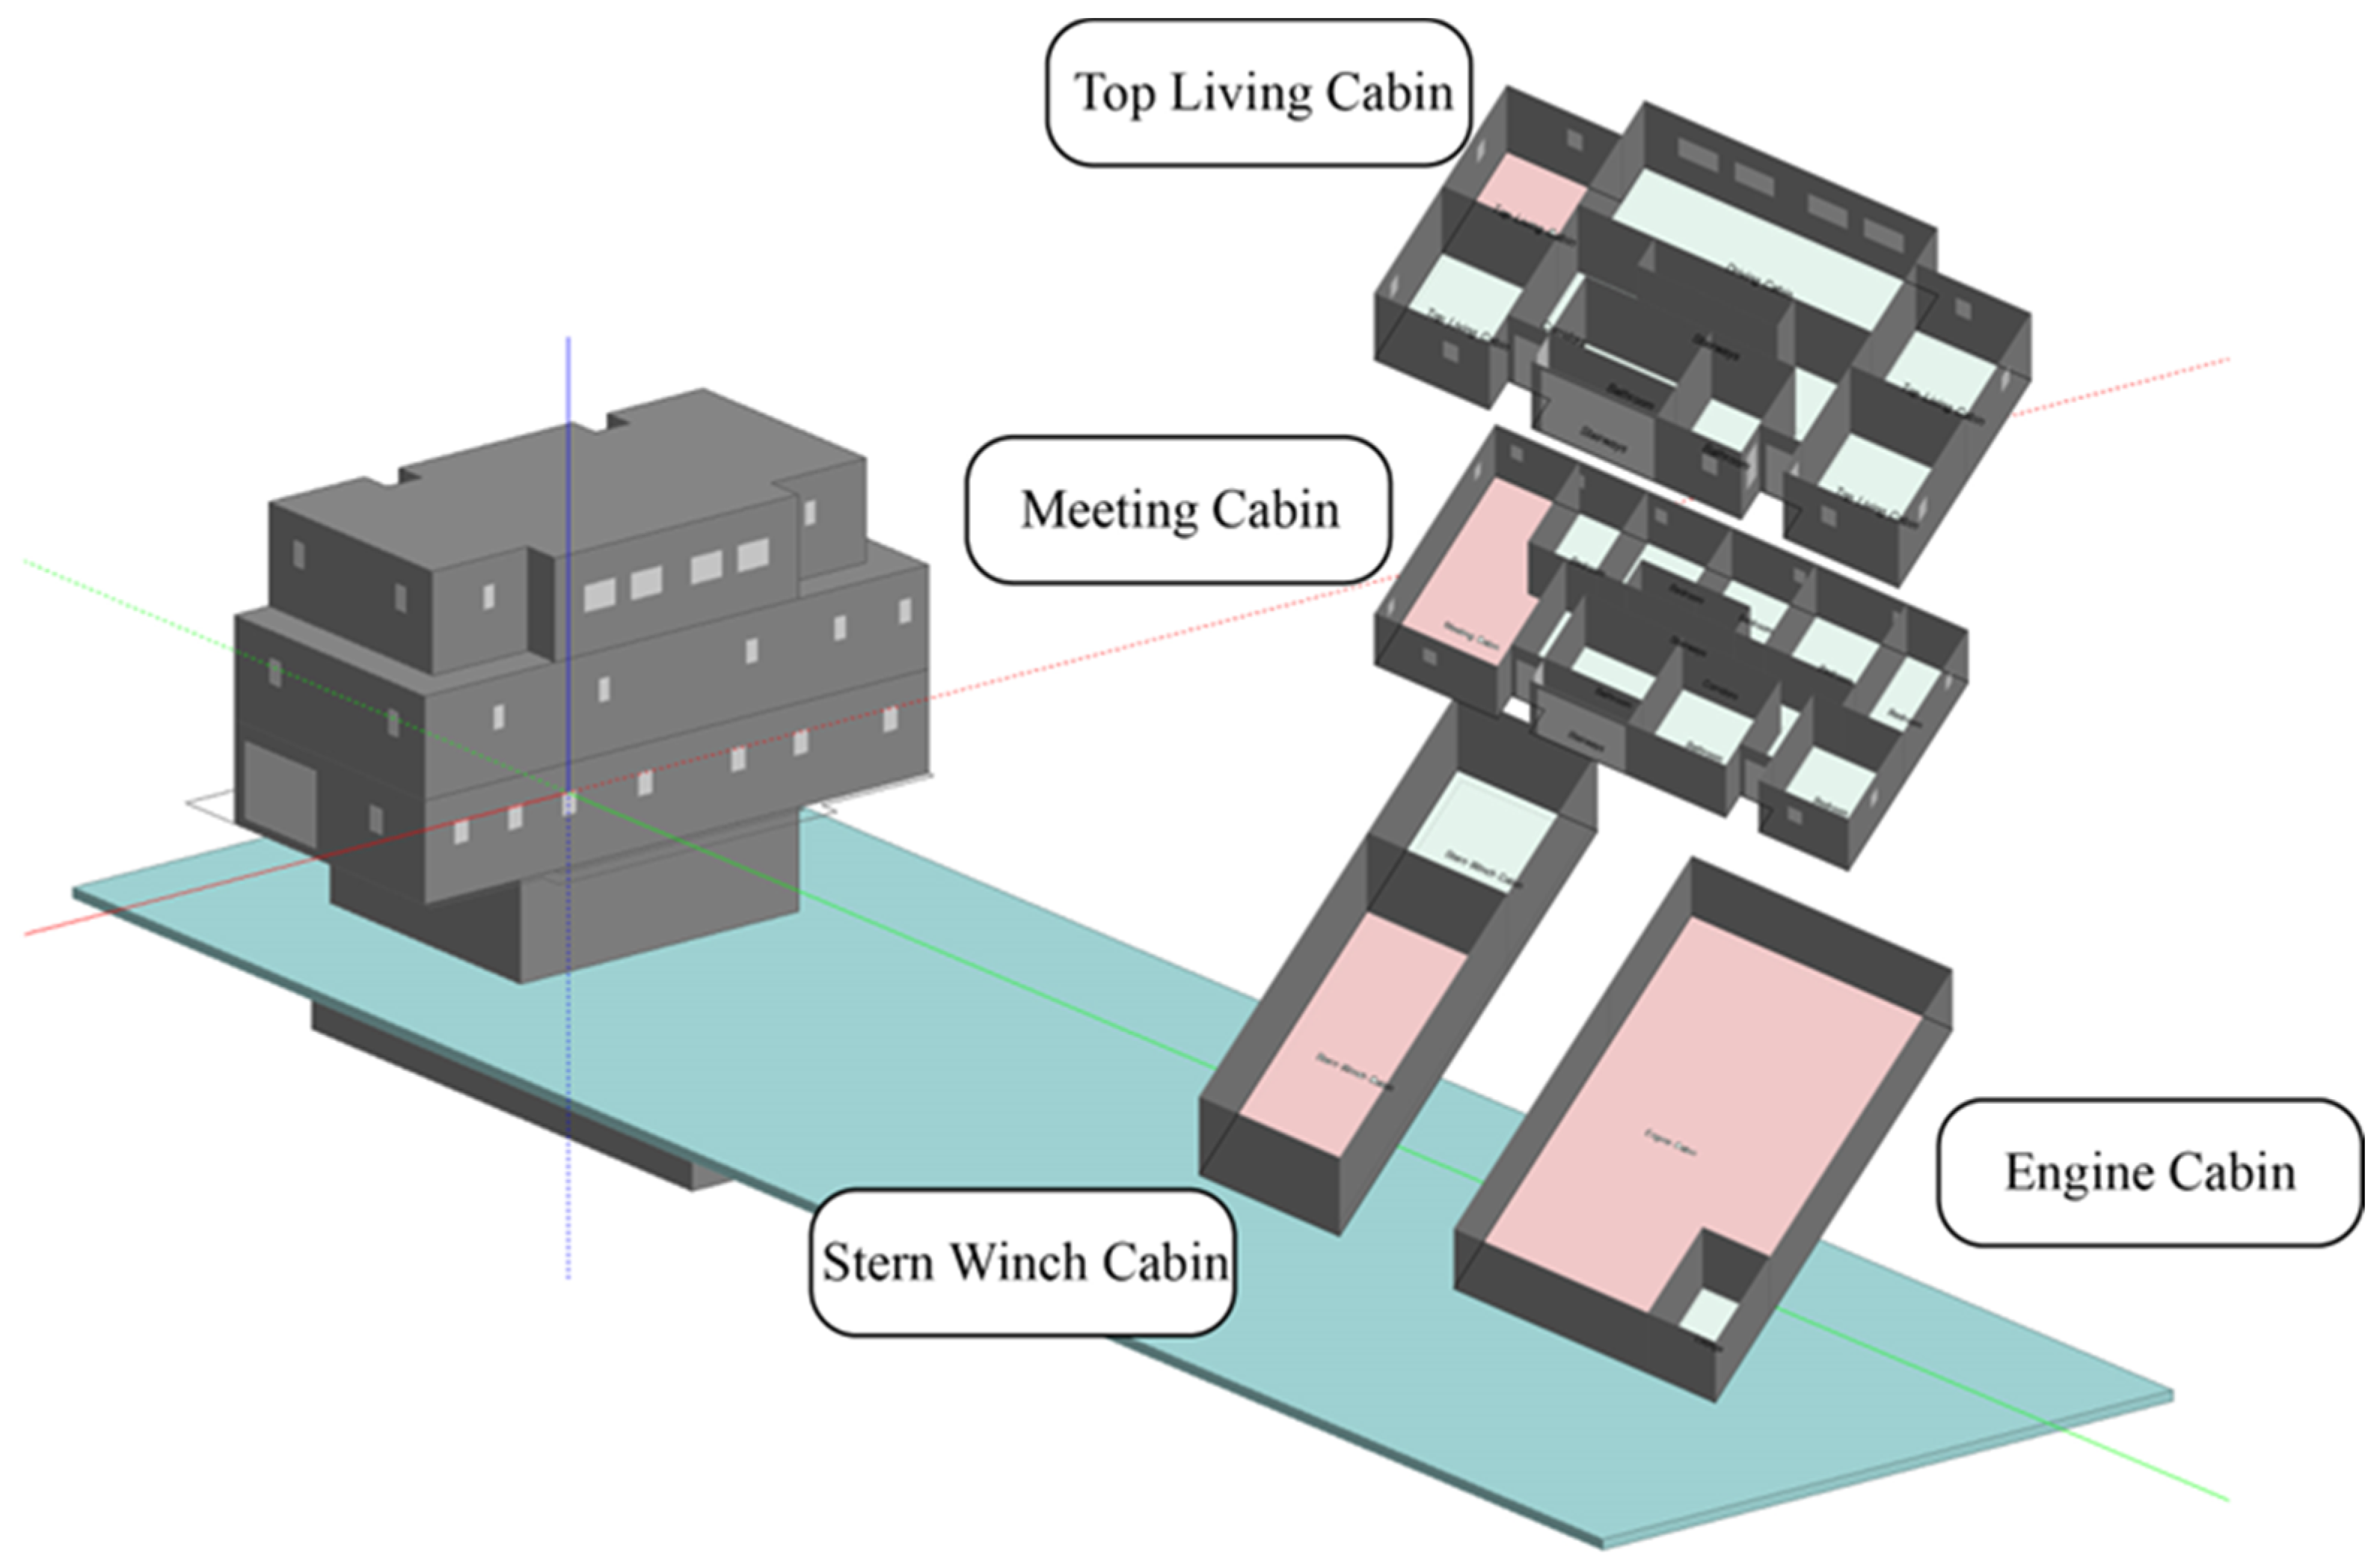
2.1. Research Area and Object

Wuhan has a subtropical monsoon humid climate with abundant annual rainfall and four distinct seasons, including cold winters and hot summers. The Yangtze River, the third-longest river in the world, and its largest tributary, the Han River, run through Wuhan [34]. With the large number of ships sailing on it every year, the Yangtze River basin plays a very important role in China’s inland river transportation industry. The high summer and low winter temperatures have significant effects on the thermal comfort of the ships. Figure 1 shows a remote sensing image of Wuhan.
This study took Changyan no. 10 ship, a geotextile-laying barge operating both offshore and in the Yangtze River Basin, as the research object. Details of the vessel are given in Figure 2. Its total length is 70 m, width is 20 m, design draft is 3.0 m, and displacement is 4304.8 t. It has four levels altogether with a height of 12.8 m above deck and a depth of 7 m below deck. The rooms above deck include the crew’s living cabins, kitchen, lounge, meeting cabin, cockpit, and a cabin for other daily activities. Below deck is the main engine, storage, and other cabins. The ship can accommodate up to 14 crew members and 10 construction personnel at the same time.
A comprehensive analysis of the answered questionnaires, cabin data, and simulation data was adopted to strengthen the connection between subjective feelings and objective data. The data were collected from July to December 2021. The locations of the indoor survey were the living, meeting, stern winch, and engine cabins. As Changyan no. 10 ship is a special engineering vessel, its working mode has a strong periodicity. For work, it is led to the construction area by a towboat; otherwise, it stays docked.
During the data collection, the ship was berthed at Wuhan Yangsi Port. The positions of the four control groups are shown in Figure 3.
The chief and second engineers’ cabins on the top floor are the most thermically unfavorable points of the whole barge. Two maintenance walls in the room are in direct contact with the external environment and the ceiling is affected by solar radiation. The second engineer’s cabin was vacant for some time, so it had a conventional environment that had not experienced much interference. It is designated as the top living cabin A in Figure 3. The meeting cabin (B in Figure 3) is located on the third floor and has an area larger than that of A. It is occasionally used for small meetings at ordinary times. Except for the lack of direct heat transfer from the ceiling, the conditions are the same as that of A.
A stern winch cabin is a compartment at the stern of a ship where the anchor line, the winch, and some sundries are stored. Changyan no. 10 ship has two stern winch cabins on the port and starboard sides below deck at 1.8 m below the waterline. This study collected data from the portside stern winch cabin (C in Figure 3), which is the main space in the upper level under the orthographic projection, a small space directly under a layer of the deck, and a space between two parts with a solid wall.
The engine cabin (D in Figure 3) is also below deck and in the middle of the ship. It is about twice the size of Cabin C and about half of it is under the horizontal orthographic projection of the deck erection and the other half is below deck. The draft depth is about 1.6 m. While the ship is berthed, its engine mostly idles while occasionally maintaining itself, so its influence on the temperature and humidity of the engine cabin was ignored. The names, functional attributes, and layouts of all four cabins are shown in Table 1, in which the test points for each chamber have been marked.
Located at the upper part of the deck is a frame composed of plates and profiles. The parts used to separate the spaces are called bulkheads, which are similar to the filling walls in buildings. The bulkheads are mainly made of lightweight materials and do not bear structural loads but function as partitions. The deck structure consists of a deck plate and a deck frame. Details of the bulkheads and deck construction are shown in Figure 4.
The sizes of the cabin portholes are very small at only 350 mm by 700 mm. Usually, they are kept closed, which is very consistent with the applicable scope of the PMV-PPD index: an indoor space with calm wind and no solar short-wave radiation. Therefore, this index was used for the thermal comfort evaluation.
In the measurement, this study aimed to: (1) conduct a quantitative analysis of the variations in temperature, humidity, and other parameters in order to evaluate the thermal comfort of different cabins under direct solar radiation, water contact, and other factors; (2) conduct qualitative research on correlations between the ship’s hull and factors such as water and solar radiation to evaluate thermal comfort. Cabins A, B, C, and D are in different environments. Cabins A and C are directly heated by solar radiation. Cabins A and B have similar interior structures. Cabins C and D are partially submerged, so they are affected by the watery environment. Cabins B and D are in relatively closed states. A comparative analysis of the variations and numerical differences in the thermal comfort-related indexes of the above four cabins revealed the different influences of the external environments.

2.2. Research Methods

The PMV-PPD model was adopted as the evaluation index of thermal comfort for all cabins. The calculations were based on six factors such as the dry-bulb temperature, mean radiant temperature, air speed, relative humidity, metabolic rate, and insulation of the clothing worn by the crew [35]. According to ASHRAE’s definition of thermal sensation, −1.5 to −0.5 is slightly cool, −2.5 to −1.5 is cool, and less than −2.5 is cold. The first four factors are mainly determined by the external environment, whereas the last two factors are determined by the bodies and clothing of the crew members. Since PMV cannot fully reflect the thermal sensations of different people, Fanger introduced the PPD index as an indicator to predict the level of dissatisfaction with the thermal environment [35] and to evaluate the thermal comfort. Hence, this indicator considers the differences in individual thermal preferences. The respective formulas of the PMV and PPD indexes are [35]:
PMV = f (Ta, Tmrt, V, Pa, M, Icl)
where:
  • Ta: dry-bulb temperature, °C
  • Tmrt: mean radiant temperature, °C
  • V: air speed, m/s
  • Pa: relative humidity, %
  • M: metabolic rate, met
  • Icl: clothing insulation, clo
PPD = 100 − 95 × exp (−0.003353 × PMV4 − 0.2179 × PMV2)
The dry-bulb and mean radiant temperatures have the most significant influences on the PMV index, whereas fluctuations in relative humidity do not. In addition, the clothing and activities of the crew have obvious influences on calculations of thermal comfort [36,37]. The mean radiant temperature is the key to understanding the heat exchange between the human body and its surrounding environment [20]. This indicator is usually measured indirectly with a black-globe thermometer [38], which consists of a hollow copper sphere coated with black paint and containing the thermal element. When the thermometer is in equilibrium, it reflects the convective and radiative heat exchanges of its surroundings [39]. The formula for the relationship between the black-globe and mean radiant temperatures is [40]:
T r = [ ( T g + 273.15 ) 4 + 1.1 × 10 8 V a 0.6 ε D 0.4 × ( T g T a ) ] 0.25 273.15
where:
  • Tr: mean radiant temperature, °C
  • Tg: black-globe temperature, °C
  • Va: air speed, m/s
  • Ta: dry-bulb temperature, °C
  • D: sphere diameter, m
  • ε: emissivity
(ASHRAE Handbook Fundamentals 2017. Chapter 37 Measurement and Instruments: 14 Thermal Comfort Measurement [40]).
Relative humidity limits changes in the level of thermal comfort by affecting the sweat evaporation rate of the human body. Relative humidity does not affect the thermal comfort zone boundary but does affect calculations of PMV and PPD. The window-to-wall ratio of these cabins is very low, with a maximum of 0.026. Moreover, less windowing time leaves them in almost windless states According to ASHRAE Standard 169-2020, an air speed below 0.15 m/s can be regarded as “still air” [41] and a typical indoor environment treatment can be used to test indoor thermal comfort.
The metabolic rate of the human body [9,35] mainly refers to the rate at which it generates energy, which is related to its motion states. The metabolic rates of crew members working in different cabins will differ. Increasing active metabolic rates would shift the thermal comfort zone toward low temperatures because increased heat production by the body would require lower-temperature environments to feel comfort, whereas reducing active metabolic rates would require the opposite environment [42]. The thermal comfort of different cabins was compared for the sitting metabolic rates of the crew members on Changyan no. 10 ship as a unified standard. The metabolic rate of each crew member’s sitting quietly and motionless was considered as 1.0 MET [40]. Because of the clear division of labor on the ship, the working environment and intensity of both the staff in the deck and engine departments were different. More accurate data were obtained from the questionnaires.
The clothing insulation represents the degree of hindrance posed by the clothing to heat gain and loss between the body and its surroundings [9,35]. Changing the type of clothing is often a convenient and effective method for improving thermal comfort. On-site visits and consultations with the crew revealed that during the data collection, they usually wore long-sleeved shirts with fleece pants, cotton socks, and athletic shoes. Accordingly, the clothing insulation was calculated to be about 1.00 clo. A list of the types of clothing and their thermal insulation can be found in [43].

2.2.1. Questionnaires and Interviews

The offline and online questionnaires were used in parallel. The interviewees of the former were the crew members. In-depth interviews were conducted for development issues while the online questionnaire collected the perceptions of the full-time crew members’ sailing experiences. This study focused on the monitoring and simulating of environmental indicators. The questionnaires’ results assisted in the comprehensive judgment of the objective indicators.
The questionnaire requested three types of information: (1) basic personal information (age, gender, and position) for gauging the individual differences, thermal information (the ranges and intensities of the activities, thermal sensations in different seasons, thermal preferences, thermal acceptability, and thermal resistances of types of clothing), and other information on some open influencing factors; (2) scope of work activities. By asking questions such as “In which department do you work?” and “What is your activity level on the ship?”, we were able to learn about the working departments and environments of the interviewees so as to distinguish the main spaces used by different crew members for their work. Questions about the levels and scopes of activities can determine the relationships among the positions, area, and the intensities of the activities; (3) subjective evaluations of thermal comfort in non-air-conditioned environments. The crew members were questioned about the effects of temperature, humidity, and wind speed on the cabin environments. They were also asked questions such as “Have detected differences in thermal comfort brought by ships in different water areas?” to gauge the subjective feeling of the sailors and their sensitivity to changes in the thermal environment of the ship’s running state, which complements the dynamic changes that could not be involved in this experiment.
See Appendix A for the contents of the questionnaire.

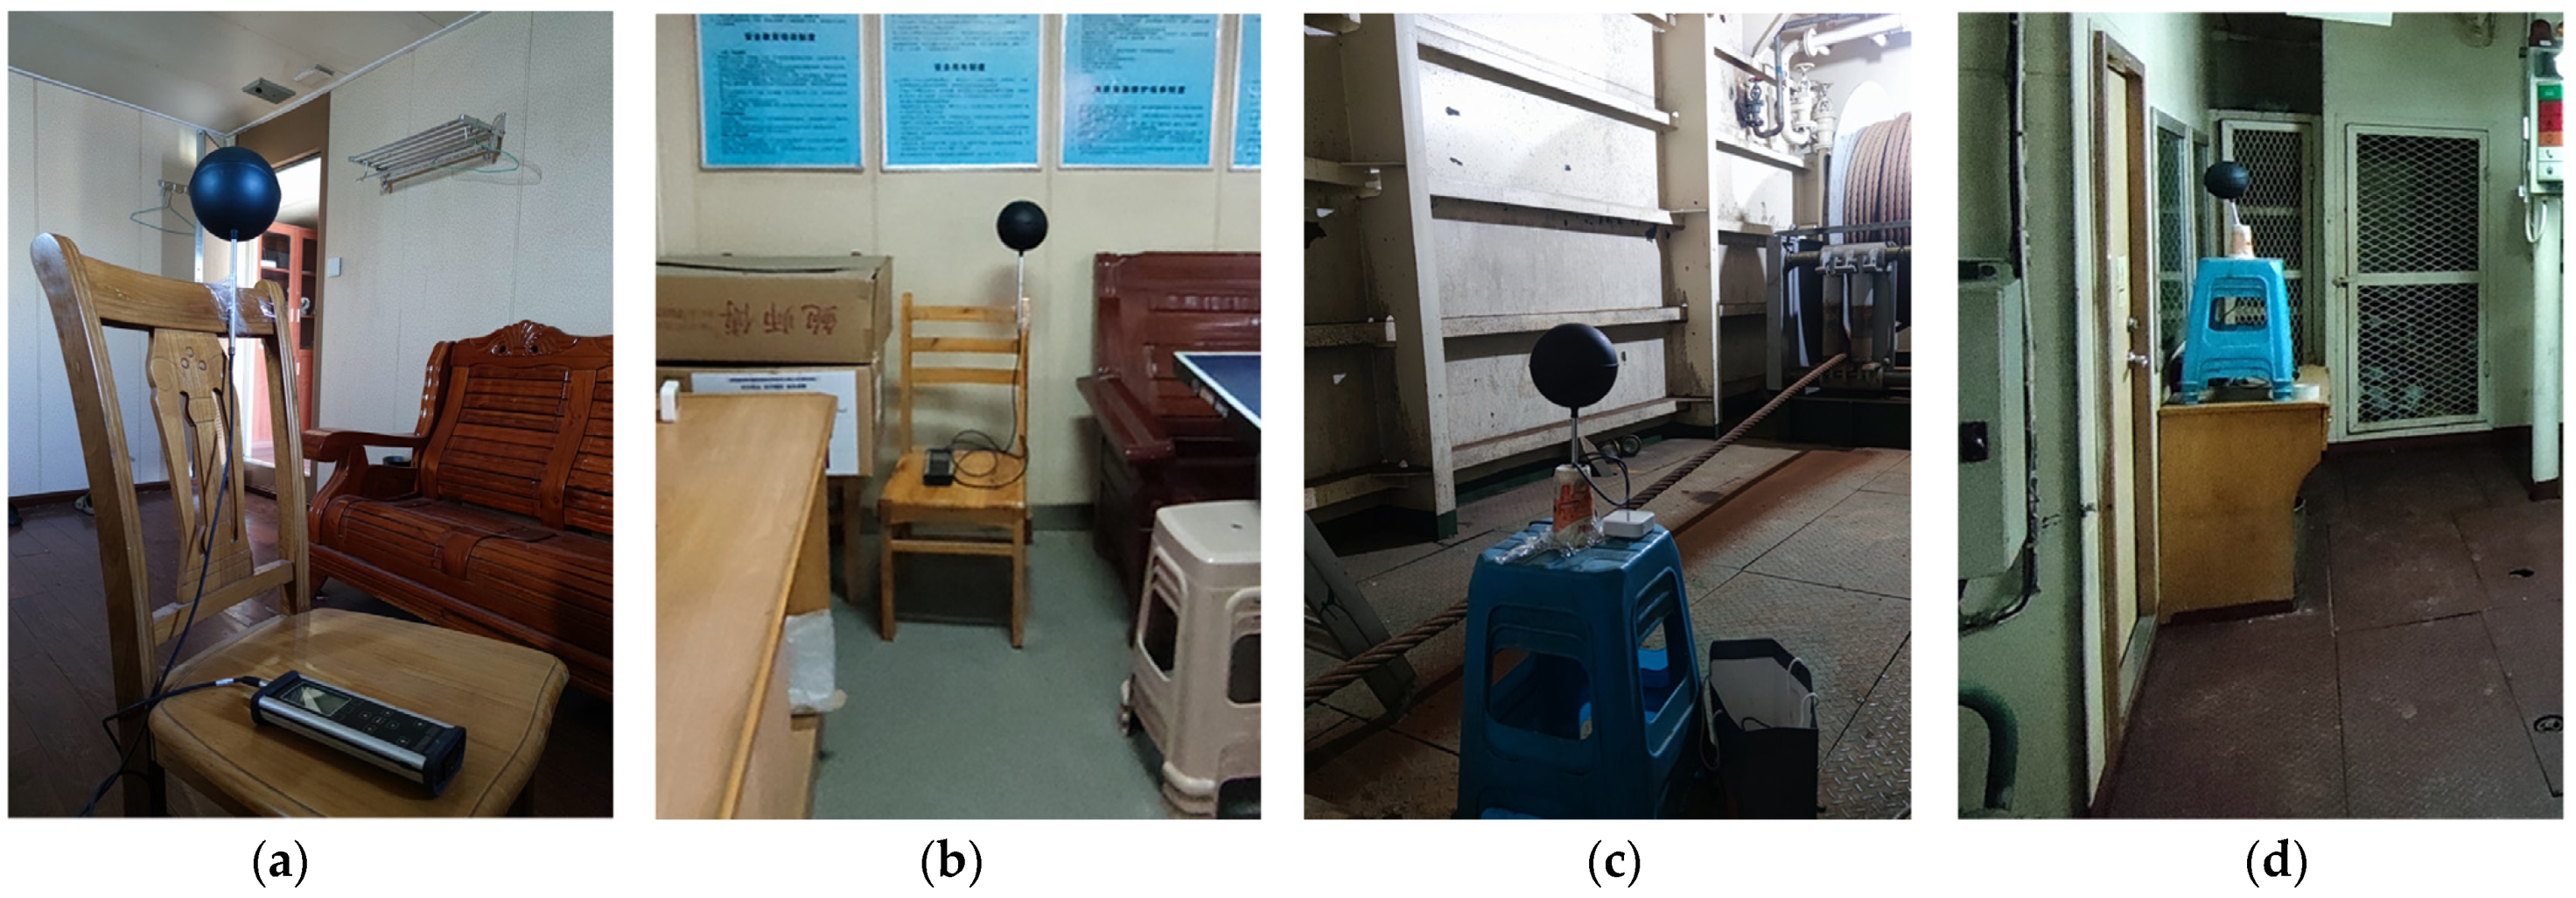
2.2.2. Data Monitoring and Collection

The main sensors used were a temperature and humidity meter, an anemometer, a black-globe thermometer, and a thermal imaging camera. The dry-bulb temperatures, black-globe temperatures, and relative humidity of the air in the four cabins were measured. Thermal images of the cabin maintenance structure were also collected.
Most studies have roughly equated the mean radiant temperature with dry-bulb temperature to calculate the thermal comfort [32] but the results have not always been accurate. In fact, the former was mainly calculated indirectly from the black-globe and dry-bulb temperatures. To ensure the accuracy of the data, the black-globe temperature was collected separately.
Placed inside the cabins, the instruments took readings at half-hour intervals. The technical specifications of the devices are shown in Table 2 and the specific statuses of the in-cabin experiments are shown in Figure 5. The data were collected over the following periods. (1) From 29 July to 4 August 2021: dry-bulb temperature, relative humidity, and thermal imaging data; (2) from 4 to 6 October 2021: dry-bulb temperature, relative humidity, and black-globe temperature during rapid changes in the weather; (3) from 2 to 5 December 2021: dry-bulb temperature, relative humidity, black-globe temperature, and indoor air speed, which was measured by the thermal anemometer. The cabins were windowless, so the wind speed was stable and below 0.1 m/s, which met ASHRAE’s requirements for typical indoor wind speeds.

2.2.3. Simulation Analysis

A computer simulation is a conventional experimental method for evaluating thermal comfort [44]. The accurate setting of a ship’s hull structure during a simulation can produce a more accurate analysis. The external environment of a ship is mainly water, which exerts a strong influence on the physical environment inside a cabin, so the appropriate parameters regarding the external watery environment were set. The collected data of measurements were used to compare and modify the simulated data.
DesignBuilder software was used to simulate the thermal comfort of the main parts of the ship. The external environment settings were first accomplished by the Location module, Wuhan was selected for the climate setting, and the ship space layout file of the site mapping was imported. In each area, several corresponding separated spaces were divided according to the mapped drawings. After the plane space separations, the doors, windows, and portholes were drawn according to their actual layouts. The reflectance and refractive indexes were used to approximate the water’s surface. The environmental analysis model and typical plane layout of the ship are shown in Figure 6.
DesignBuilder software was used to set the behavior properties of each space. The different activities conducted in a space significantly affected the simulated results of some indicators related to thermal comfort. The specific settings of the simulation parameters are shown in Table 3. After the above parameters, the ranges of the simulation parameters were also set. The period of the simulation was also 2 to 5 December, since this had been used to calculate PMV. The simulated step frequency was set to 0.5 h for the calculations, which were consistent with the actual calculations. The default settings of the other parameters were maintained.

3. Results

3.1. Overall Situation

For a preliminary understanding of the ship’s thermal environment and the difference between the thermal comfort of the cabins above and below deck, the data were collected from 29 July to 4 August 2021, which is a typically unfavorable period of thermal comfort with the highest temperatures outside Wuhan City. According to Figure 7, a preliminary analysis of the obtained data has shown a significant temperature difference between the cabins above and below deck. The temperature of Cabin A above deck is significantly higher than that of Cabin D (the engine cabin). The temperature range of the former is wide and reaches 10.9 °C, whereas that of the latter is relatively narrower with a maximum temperature difference of 5.5 °C. At about 14:00 h, the temperature difference between the cabins reaches its peak at 5.2 °C.
Figure 8 shows the changes in relative humidity with temperature. The humidity of the cabins above deck is significantly lower than that of the cabins below deck. The largest difference is 20.4%, which is due to the partial submersion of the engine cabin below water.

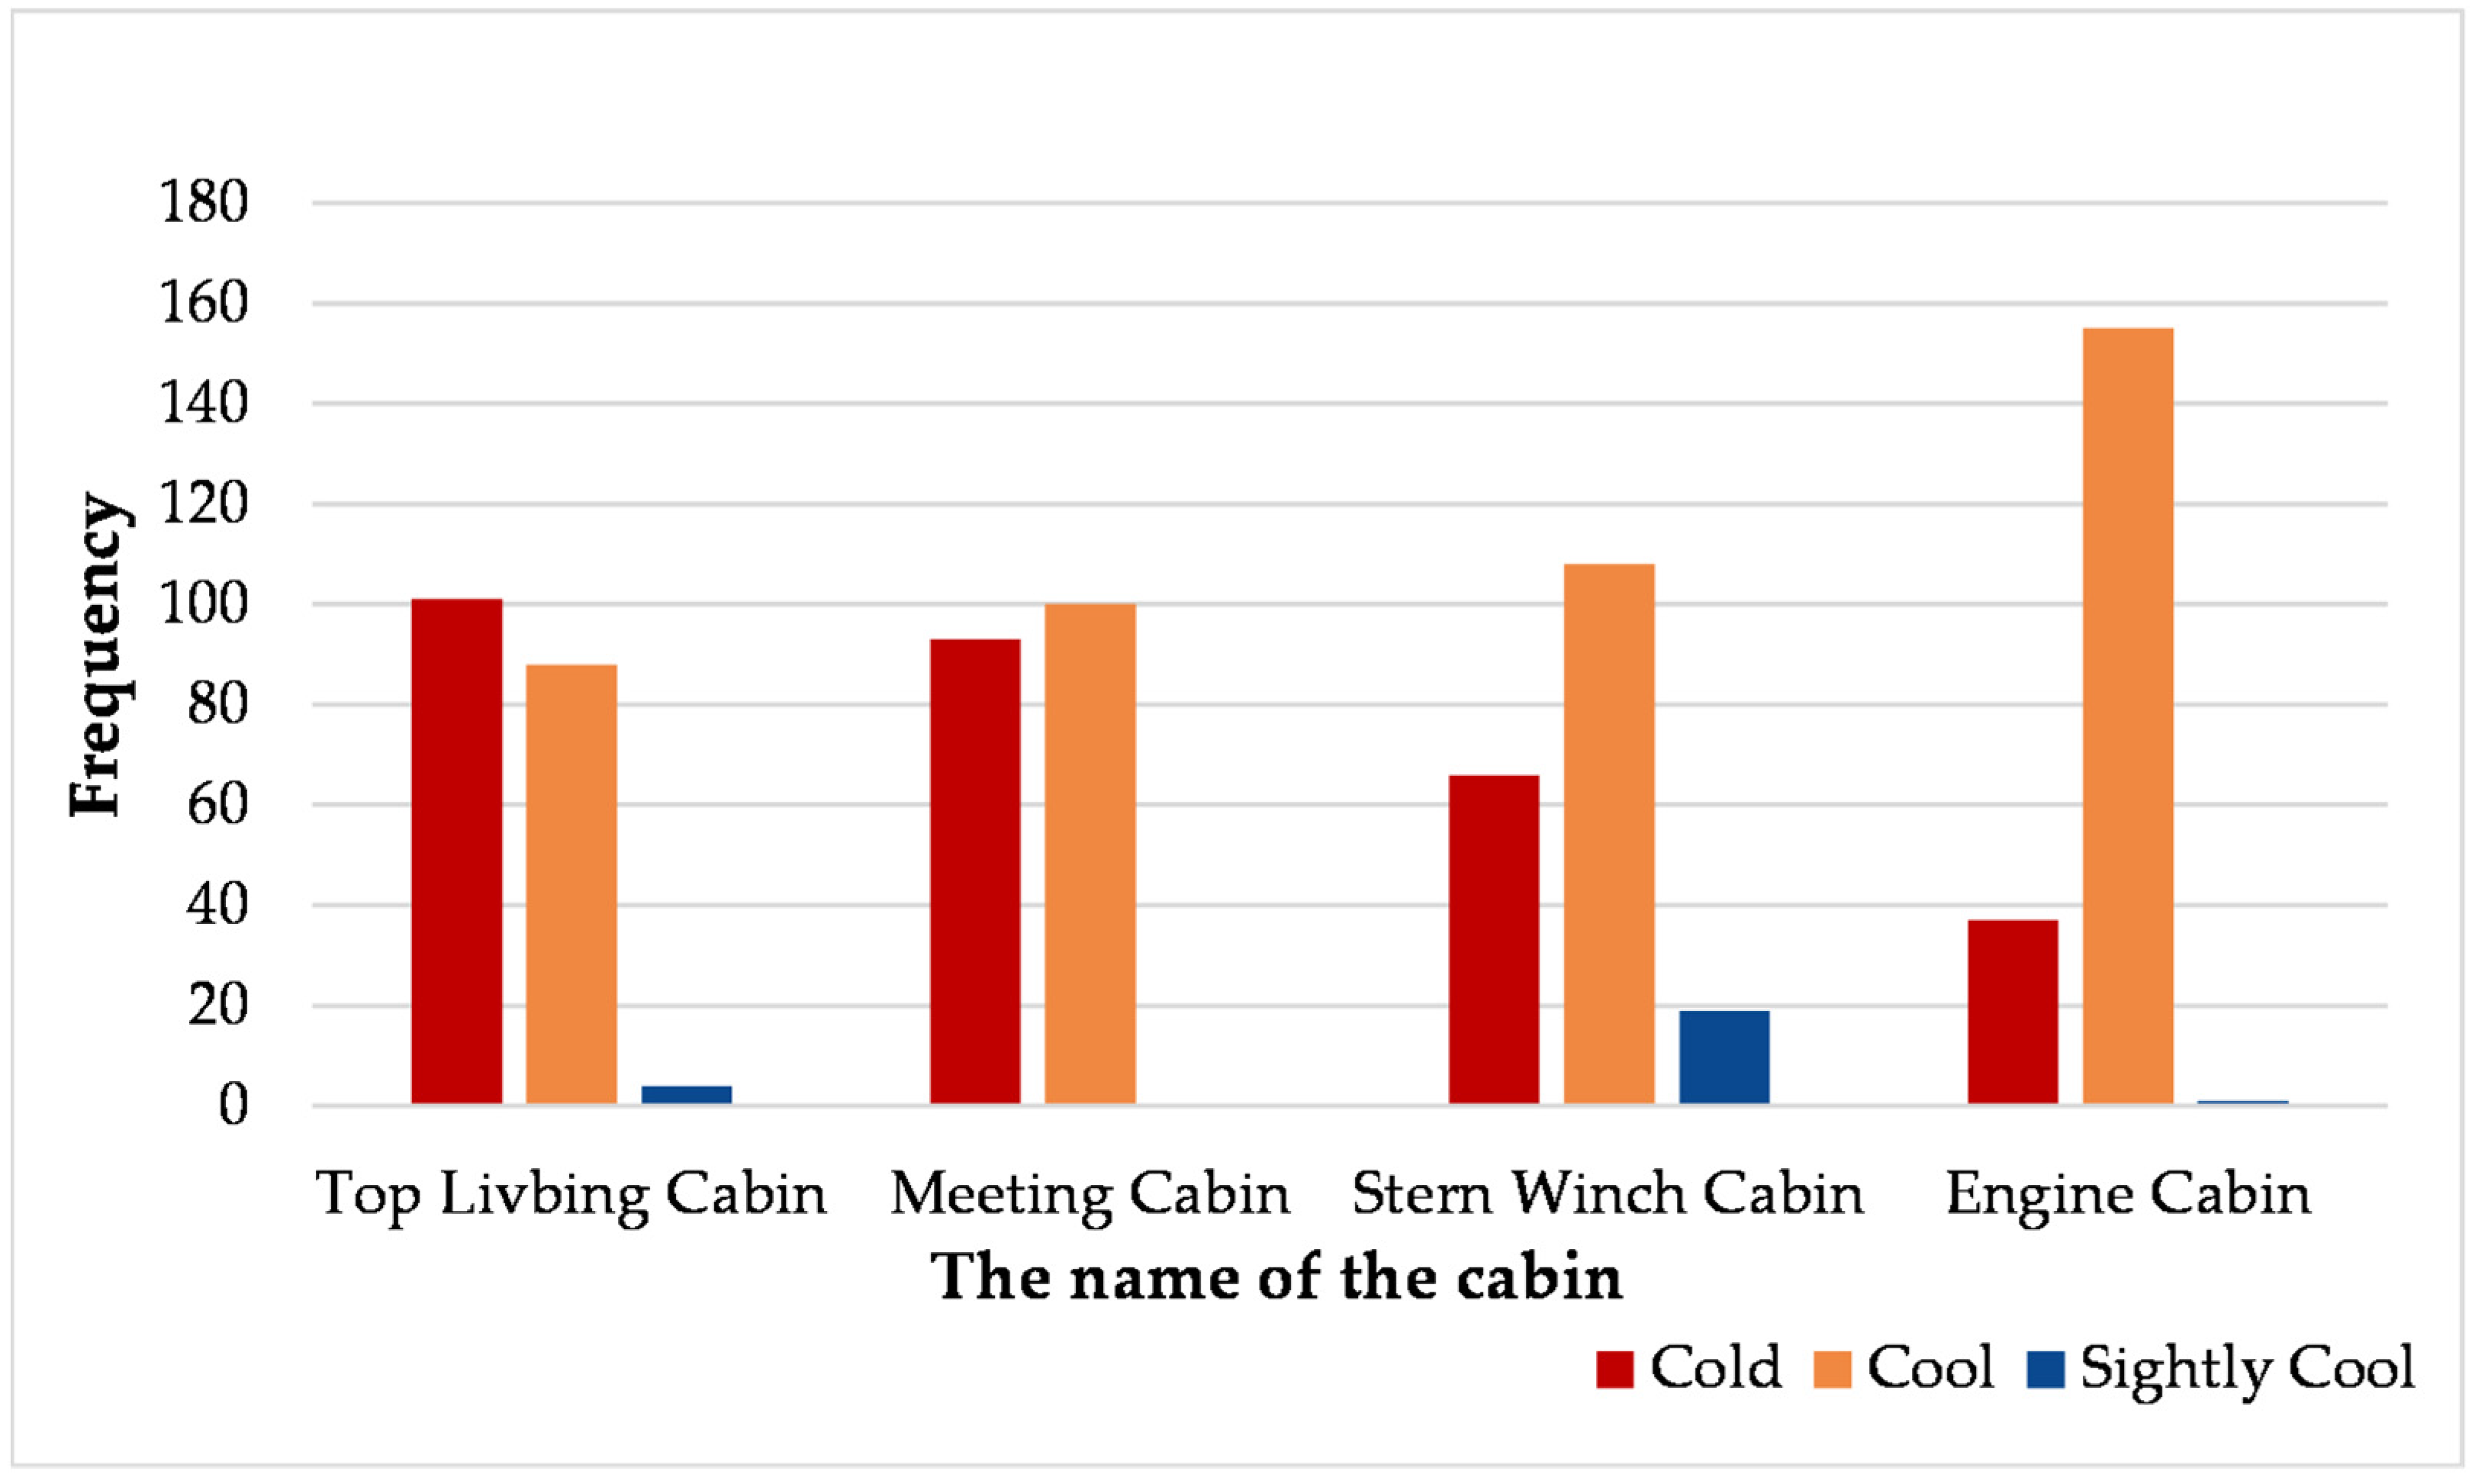
3.2. Results of Questionnaire Survey

The results indicate the crew’s perceptions of the thermal environments of the cabins. The following two sets of questions illustrated the relationship between the environments and the crew’s sensations of thermal comfort. Figure 9 and Figure 10 show the distribution of the answers. The data analysis in Table 4 and Table 5 show that the two groups of problems are significantly correlated.
A cross-analysis was conducted on the acceptability of the thermal conditions of the cabins. The activity levels of the interviewees showed significant differences in the thermal tolerance of the different sample groups when p = 0.030 < 0.05. In the autumn and winter, when the questionnaire was conducted, the seafarers whose work content was quiet and fixed, accounting for 70.0% of the total number of this group, often had a slow metabolism for a short period of time and had more difficulty in accept the thermal environment (without air conditioning) on the ship. Of those working at moderate and high intensity, 51.2% said that it had been difficult to accept the thermal environment on the ship. This proportion was much lower than that of the members with low-intensity work. Crew members whose work required more intense physical activity were more receptive to a cabin’s thermal environment because of their higher metabolic rates. However, the applicability of the thermal comfort model decreases when the activity intensity is greater than 2.0 MET. The results were reversed in summer, when people feel hotter due to intense activity, thus leading to a decrease in thermal tolerance.
The data show very significant differences in the sensitivity of the crew at different positions on the ship, indicating changes in the thermal comfort due to the changes in the external environment. When p = 0.015 < 0.05, the proportion of the crew in the deck department who could feel the difference is 72.86%. However, only 58.89% of the crew in the engine department and only 35% of those in the other departments believed that they could feel the changes. Since the deck department crew worked above deck, they could clearly perceive the changes in the external air temperature and wind speed, whereas those that spent much of their time below deck or in all enclosed interior spaces could not because the changes in temperature and humidity were subtler. Those who had been on the ship only briefly were almost evenly divided. In conclusion, crew members working in different microenvironments for a long time would perceive changes in the external thermal environment differently.
The results of the questionnaire confirmed that the crew members had different perceptions of the thermal environment and comfort. In general, crew members working in more static and closed environments were less tolerant than those in more active and open environments to changes outside the thermal neutral range. The latter group was more sensitive to dynamic changes.

3.3. Index Monitoring in Different Cabins

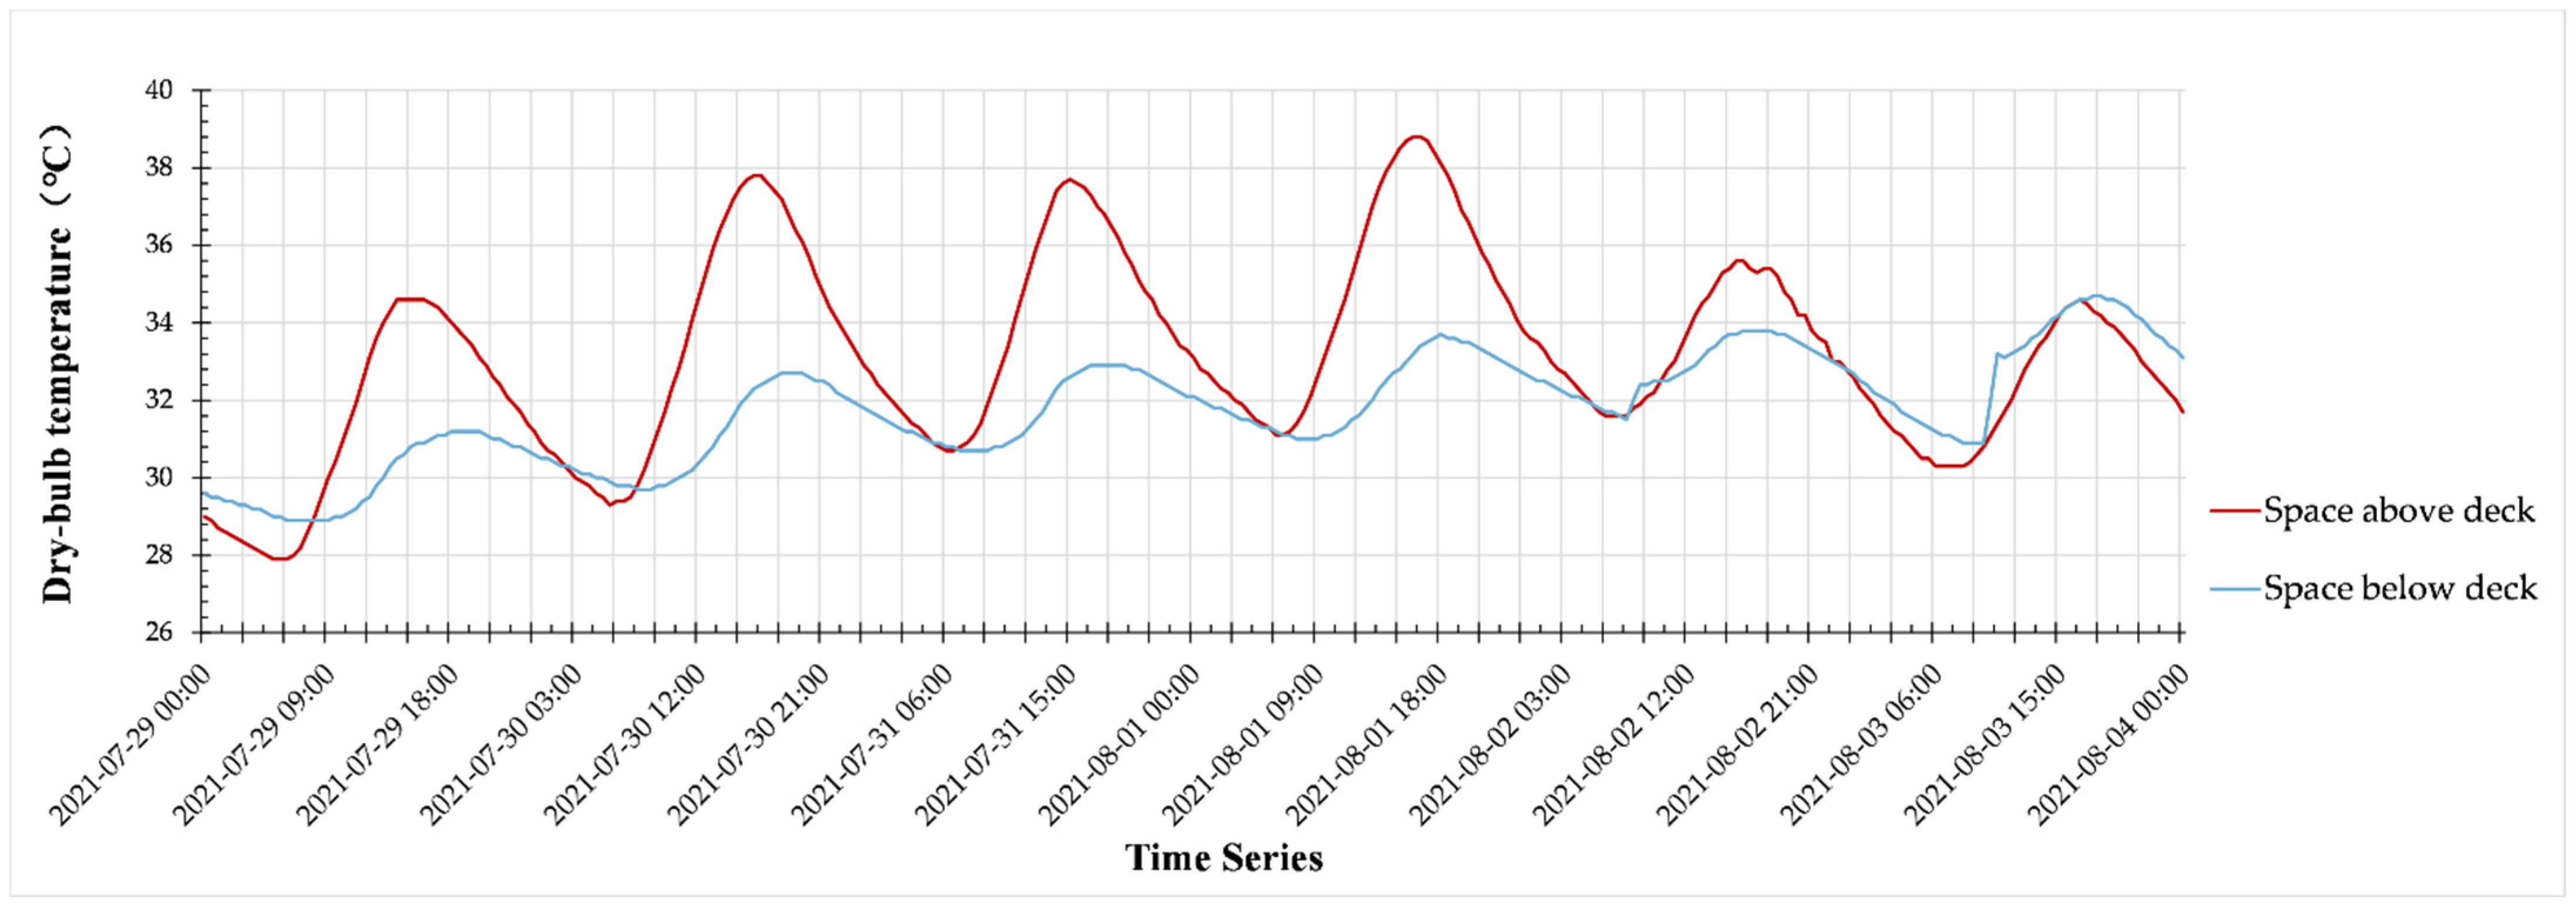
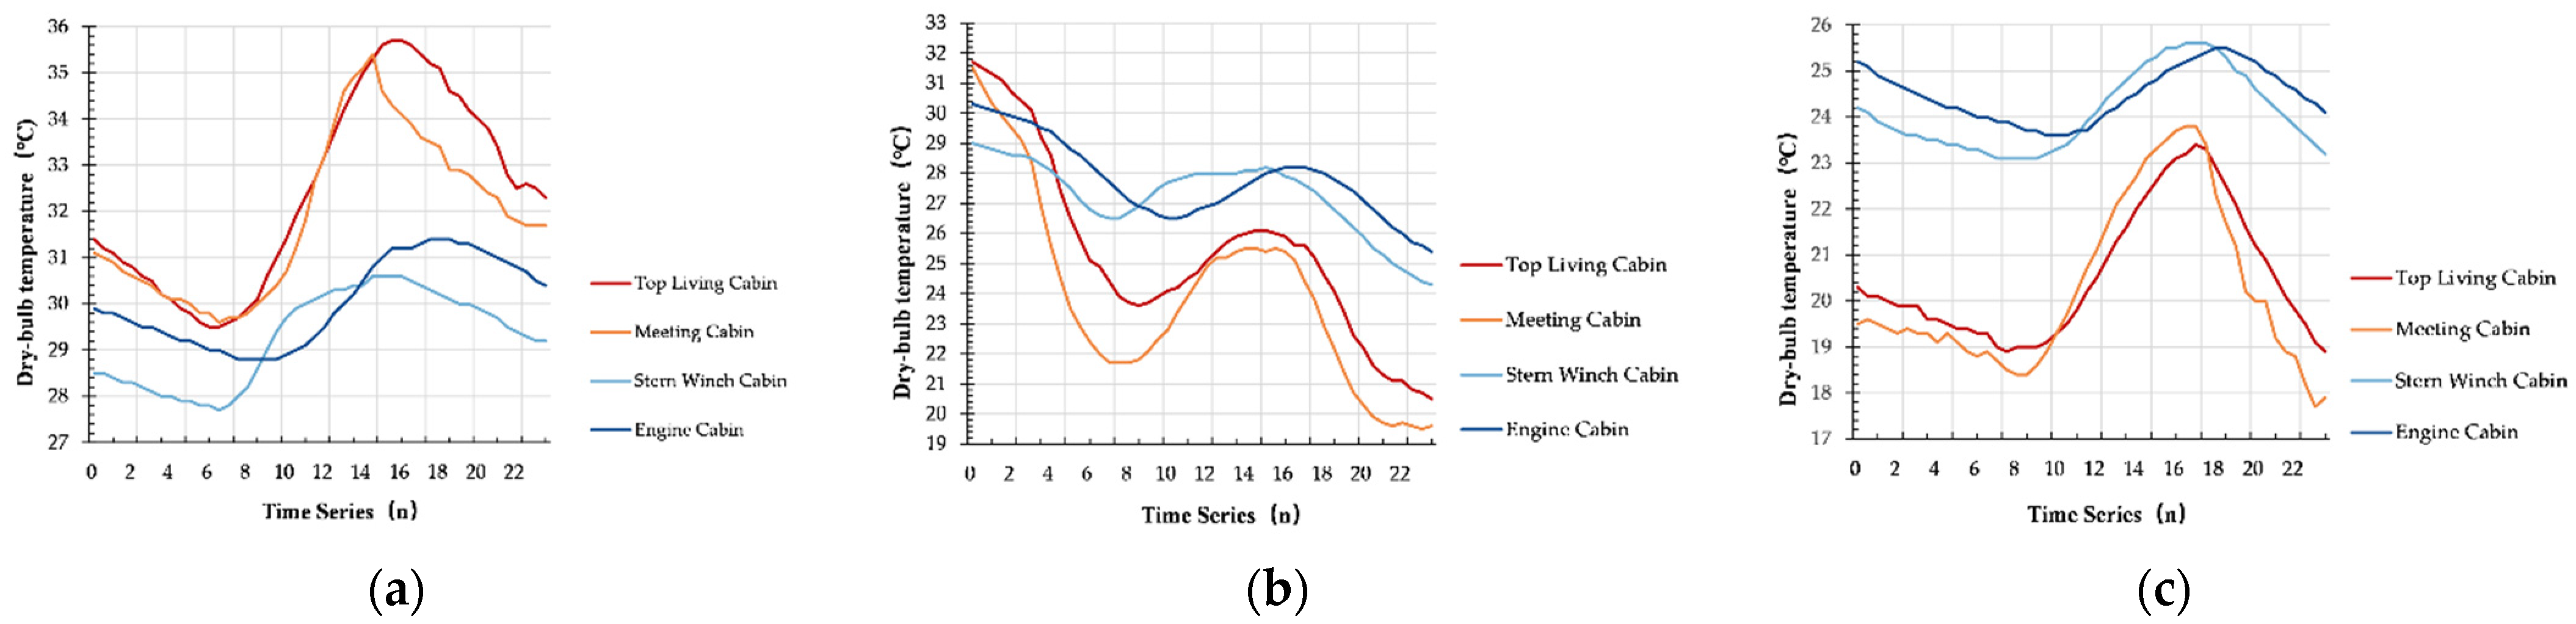
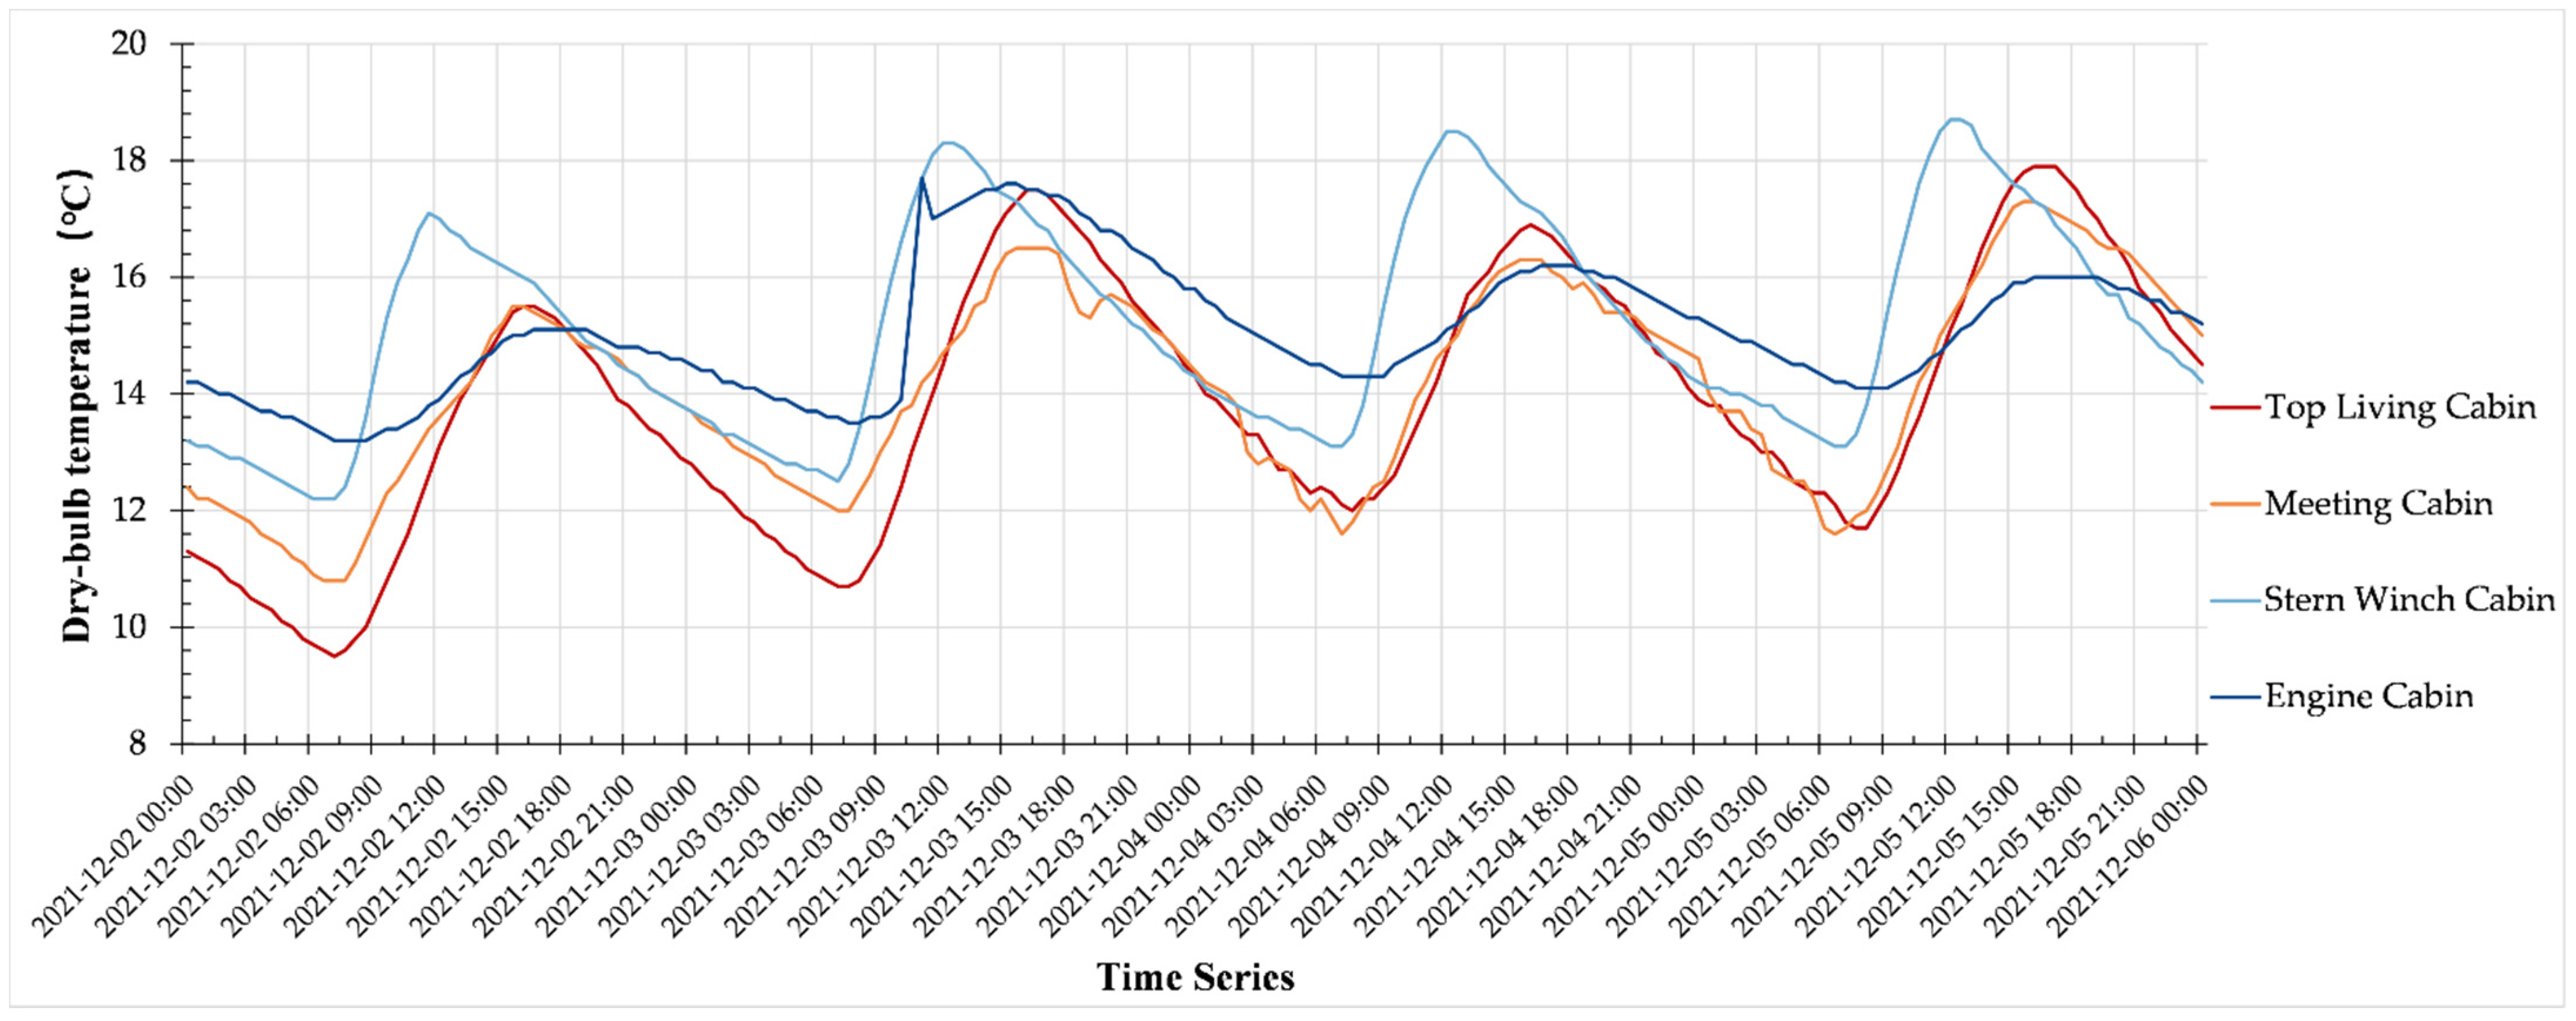
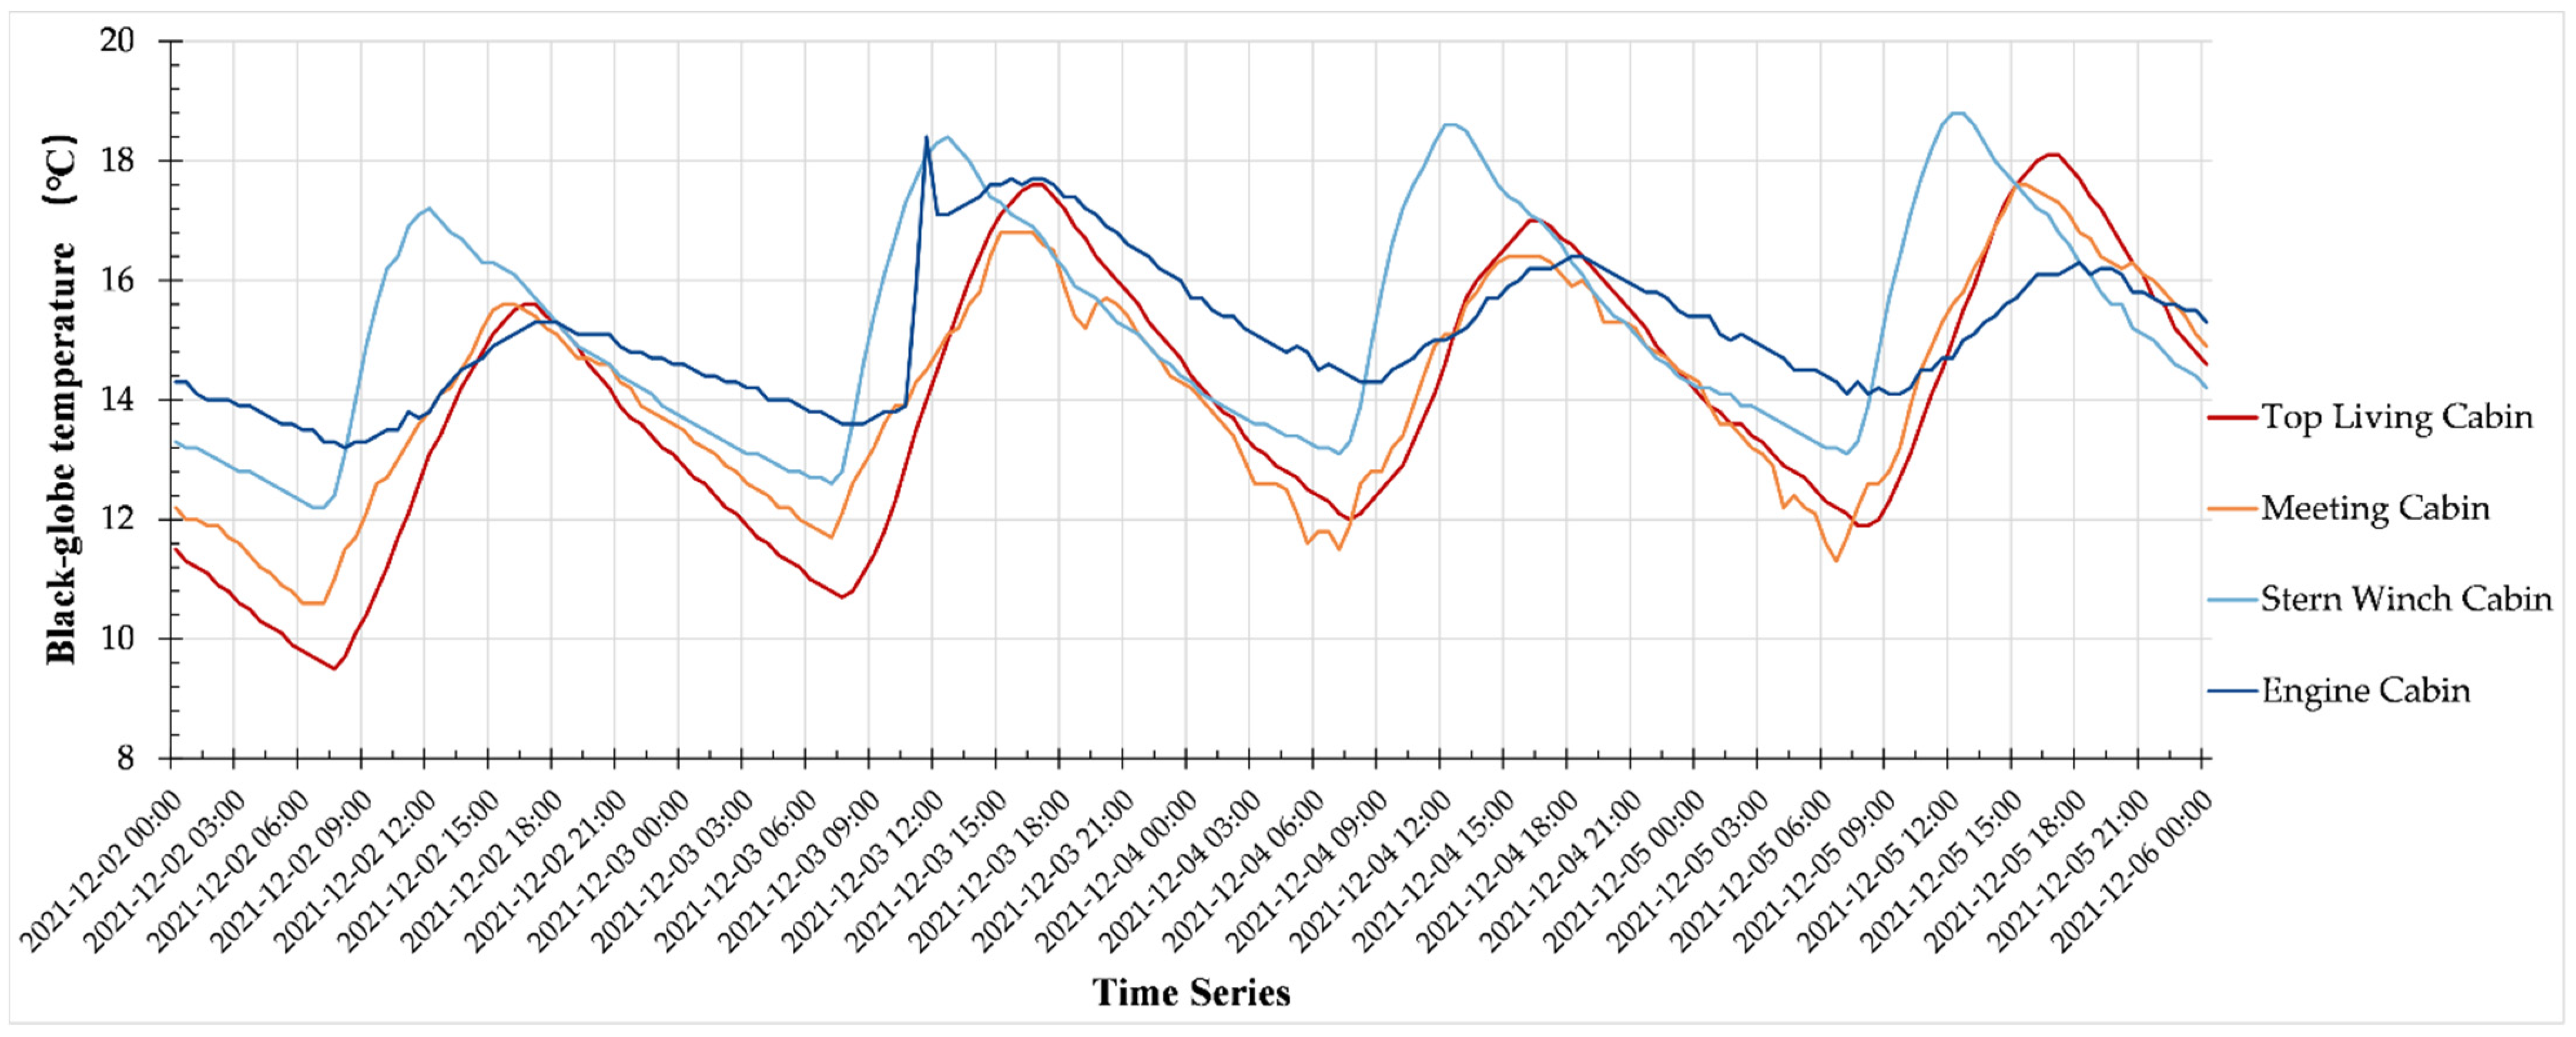
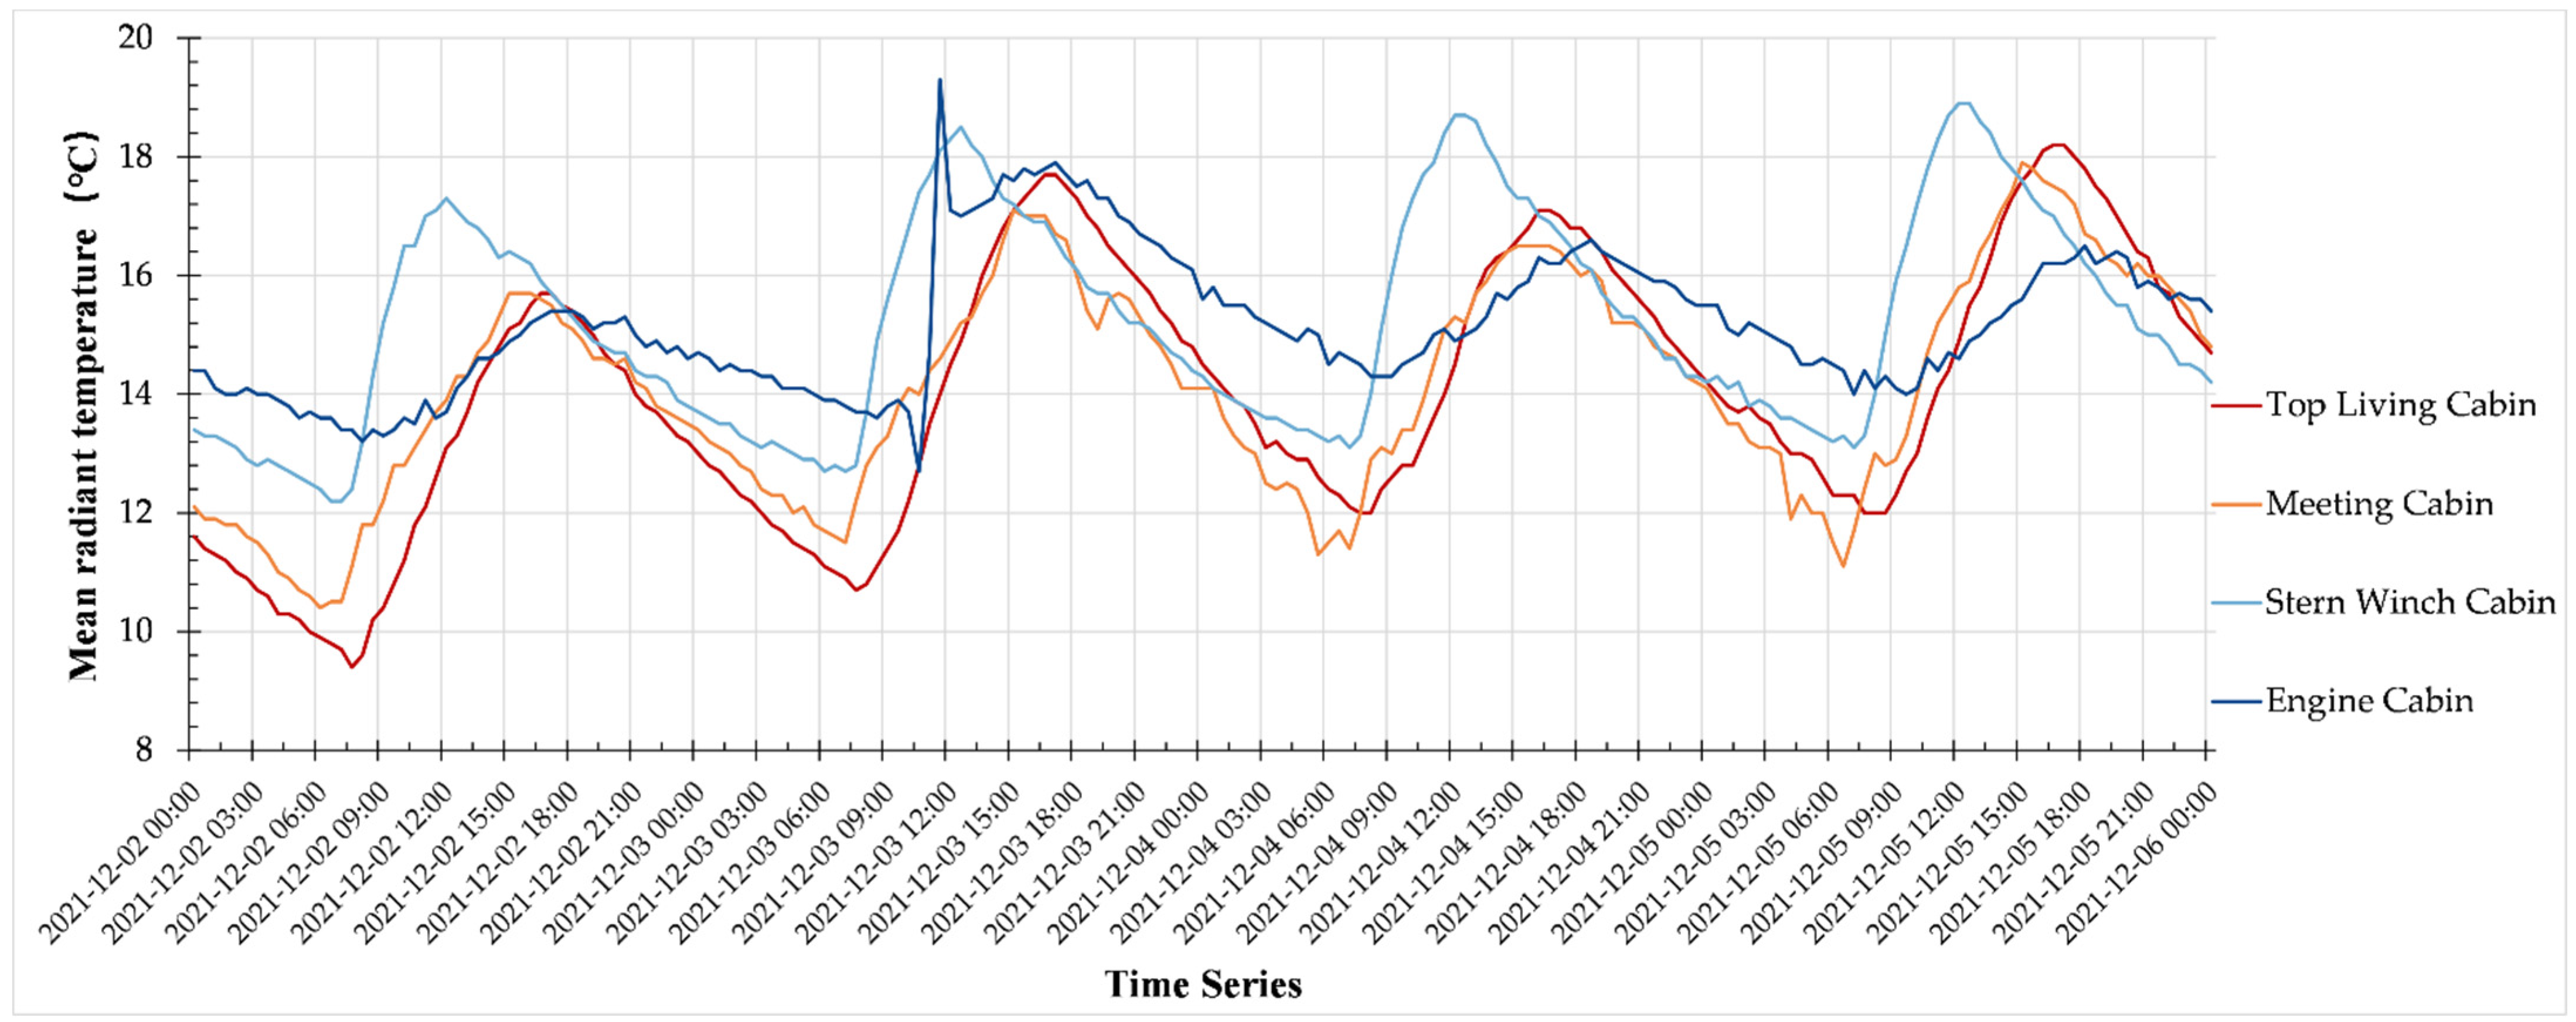
3.3.1. Temperature Changes

The data collected from 4 to 6 October were selected as typical for detailed hourly analysis. These three days experience severe weather changes as summer transitions to autumn in Wuhan, so they were suitable for taking measurements on the effects of the external environment on the cabins’ interiors. The following temperature data were taken from the National Meteorological Information Center in Wuhan. On 4 October, the lowest temperature was 27.7 °C at 05:00 h, the highest was 36.0 °C at 14:00 h, and the maximum difference was 8.3 °C. On 5 October, the lowest was 17.7 °C at 23:00 h, the highest was 27.2 °C at 14:00 h, and the maximum difference was 9.5 °C. On 6 October, the lowest was 16.4 °C at 23:00 h, the highest was 23.3 °C at 14:00 h, and the maximum difference was 6.9 °C.
The dry-bulb temperatures in the four cabins were statistically compared. The spaces and structures of the engine cabin were similar to those of the stern winch cabin while those of the top living cabin were similar to those of the meeting cabin. The temperature curves show that the two cabins above deck are similar in dry-bulb temperature, as are the two cabins below deck. As shown in Figure 11, the top living and meeting cabins had more obvious temperature fluctuations. During these three days, the temperature ranges of the former and latter were 16.8 °C and 17.7 °C, respectively, whereas those of the stern winch and engine cabins were only 7.5 °C and 7.8 °C, respectively. The average temperatures of the top living, meeting, stern winch, and engine cabins decreased by 11.9 °C, 11.6 °C, 5.2 °C, and 5.5 °C, respectively. In general, the cabins above and below deck were more affected by changes in the external temperatures of the air and river, respectively.
The times at which the dry-bulb temperatures in the cabins reached their maximum values were slightly different but generally appeared at about 14:00 h. On 4 October, when the external temperatures and solar radiation were highest, the cabins above deck were more affected than those below deck. The highest and lowest temperatures of the top living cabin reached 35.7 °C and 29.5 °C, respectively, which were 5.1 °C and 1.8 °C higher, respectively, than those of the stern winch cabin. On 5 October, the highest temperature in Wuhan decreased by 8.8 °C from that of the previous day. The highest temperature in the top living cabin was 31.7 °C, which was 2.7 °C higher than that of the stern winch cabin. As the external air temperature continued to drop to a short-term low, the dry-bulb temperatures of the cabins above deck were significantly lower than those below deck. On 6 October, the highest and lowest temperatures of the top living cabin were 23.4 °C and 18.9 °C, respectively, which were 2.2 °C and 4.2 °C lower, respectively, than those of the stern winch cabin. In sum, when the external air temperature was low, the dry-bulb temperatures in the cabins above deck were lower and the variation fluctuations were larger than in those below deck. The variations in the dry-bulb temperatures in all four cabins indicate that the ones above deck had similar trends of stronger fluctuations with the external air temperature, whereas the ones below deck had similar smoother fluctuations. To further observe the regularity in the temperature changes, measurements were made every half-hour from 2 to 5 December 2021, with the temperature and humidity meter, as well as the black-globe thermometer. Figure 12 and Figure 13 show the dry-bulb and black-globe temperature curves, respectively.
The analysis of the dry-bulb temperatures during this period shows that the respective highest and lowest temperatures of the top living cabin were 17.9 °C and 9.5 °C, of the meeting cabin were 17.3 °C and 10.8 °C, of the stern winch cabin were 18.7 °C and 12.2 °C, and of the engine cabin were 17.7 °C and 13.2 °C. The average high and low temperatures dropped from 21 °C and 13 °C, respectively, in October to 12 °C and 2 °C, respectively, in December. Taking the meeting cabin as an example, the average indoor dry-bulb temperature during December was 14.1 °C, which was much lower than 25.4 °C in October. However, the temperature difference between the four cabins at this time is different from that of October. The highest and the lowest temperatures of all four cabins did not differ significantly in December. The highest temperature of the stern winch cabin was 1.4 °C higher than that of the meeting cabin while the lowest temperature of the top living cabin was 3.7 °C lower than that of the engine cabin. The fluctuation range of the top living cabin was up to 8.4 °C, whereas that of the engine cabin was only 4.5 °C. The external watery environment of the cabins below deck caused the overall changes to be gentler, thus indicating that changes in the temperatures below deck were more affected by changes in the river temperatures rather than in the air temperatures.
An analysis and comparison showed the changes in the black-globe temperatures of each cabin to be highly consistent with the dry-bulb temperatures both in trends and specific values. The temperature error was kept within 0.1–0.3 °C.

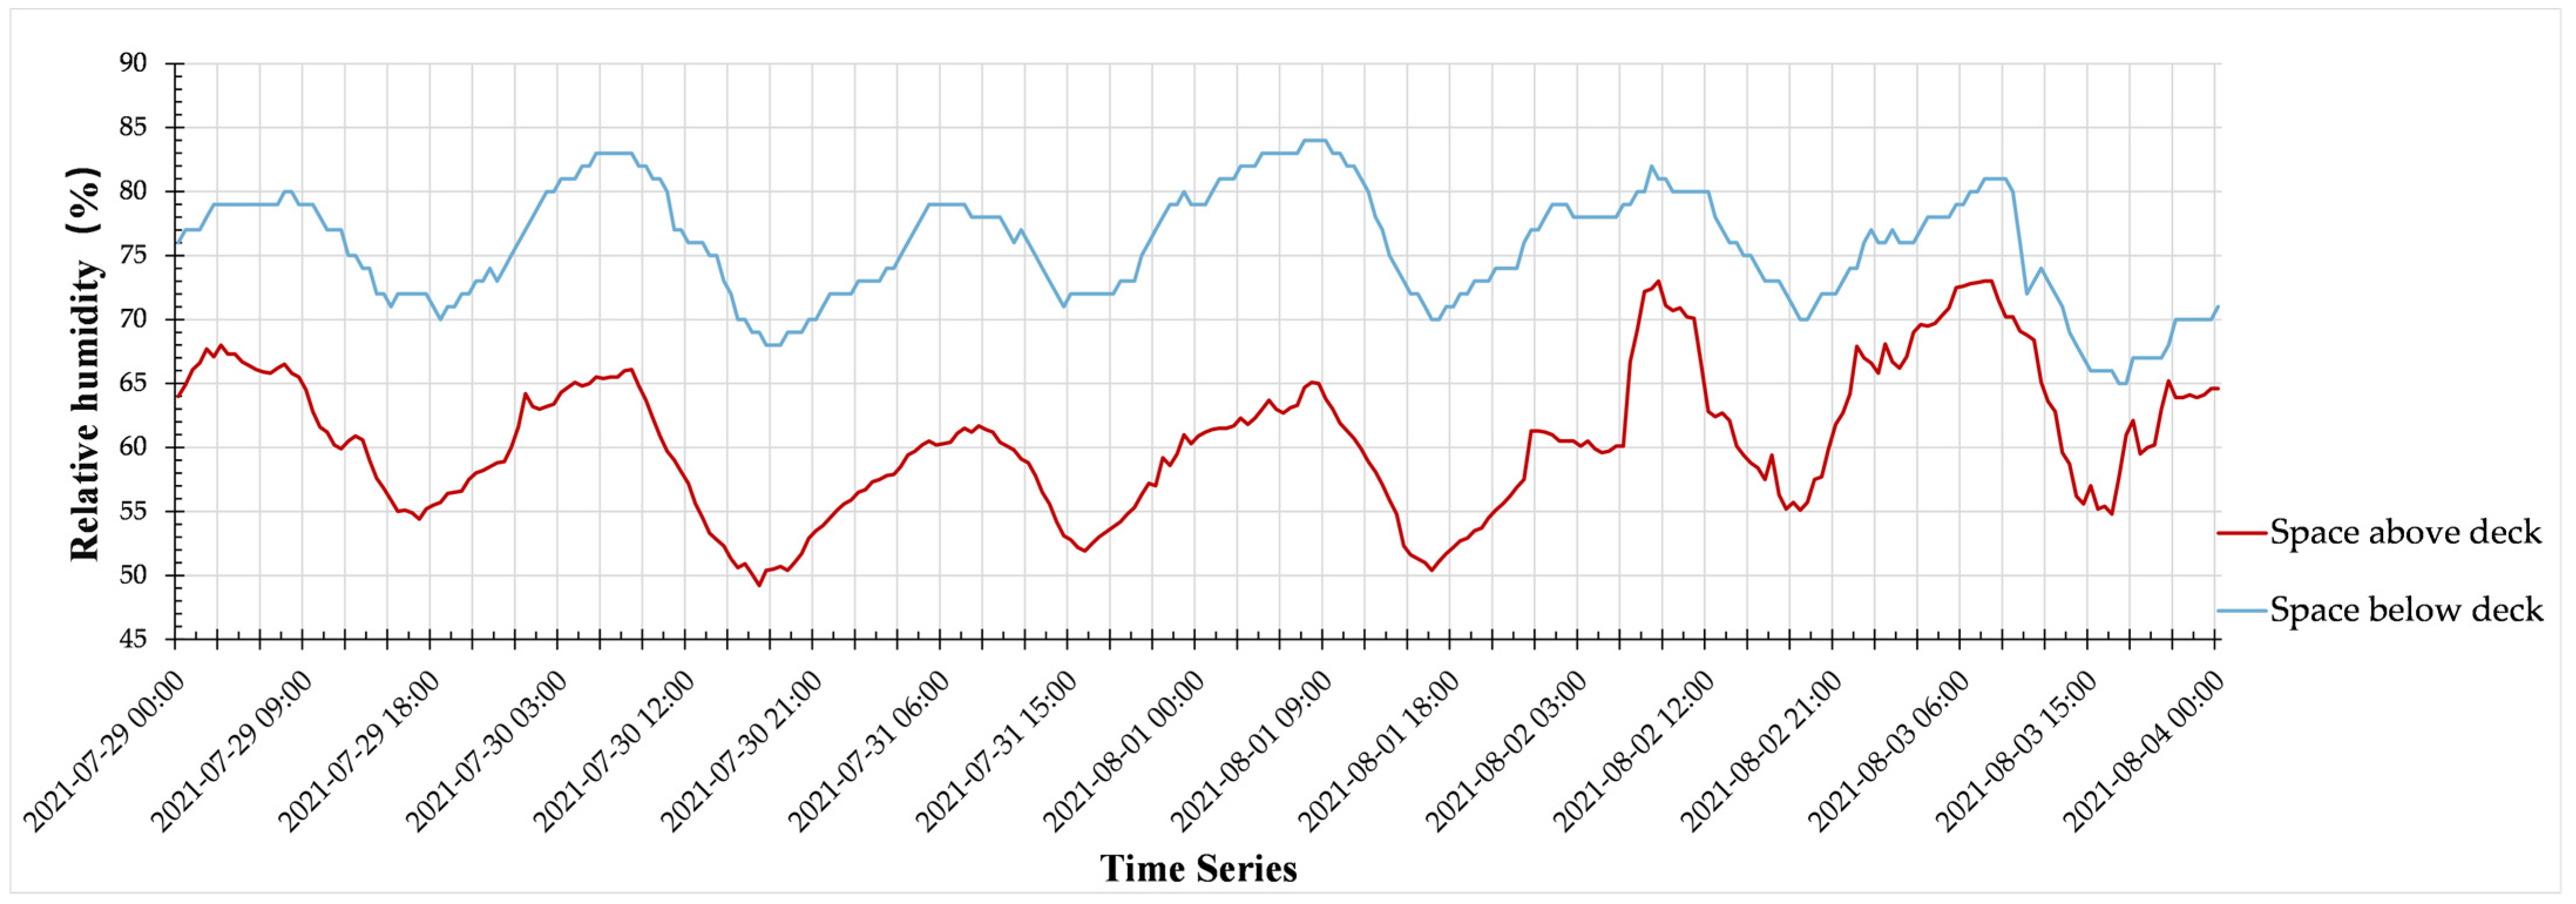
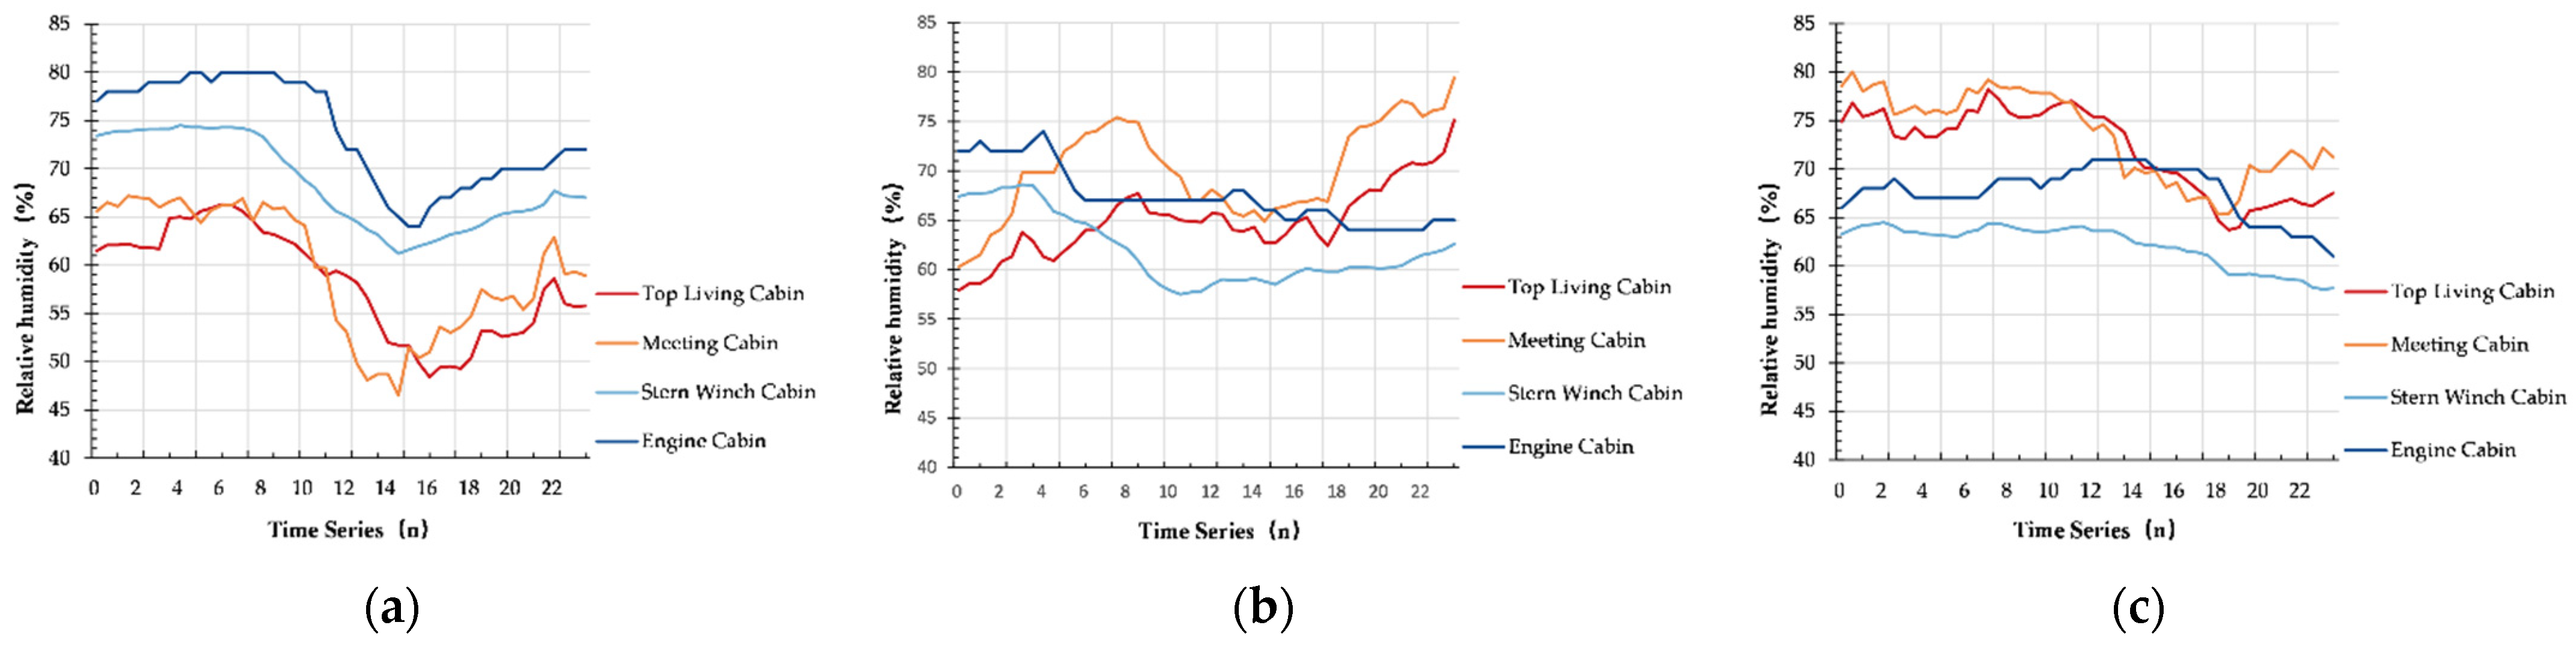
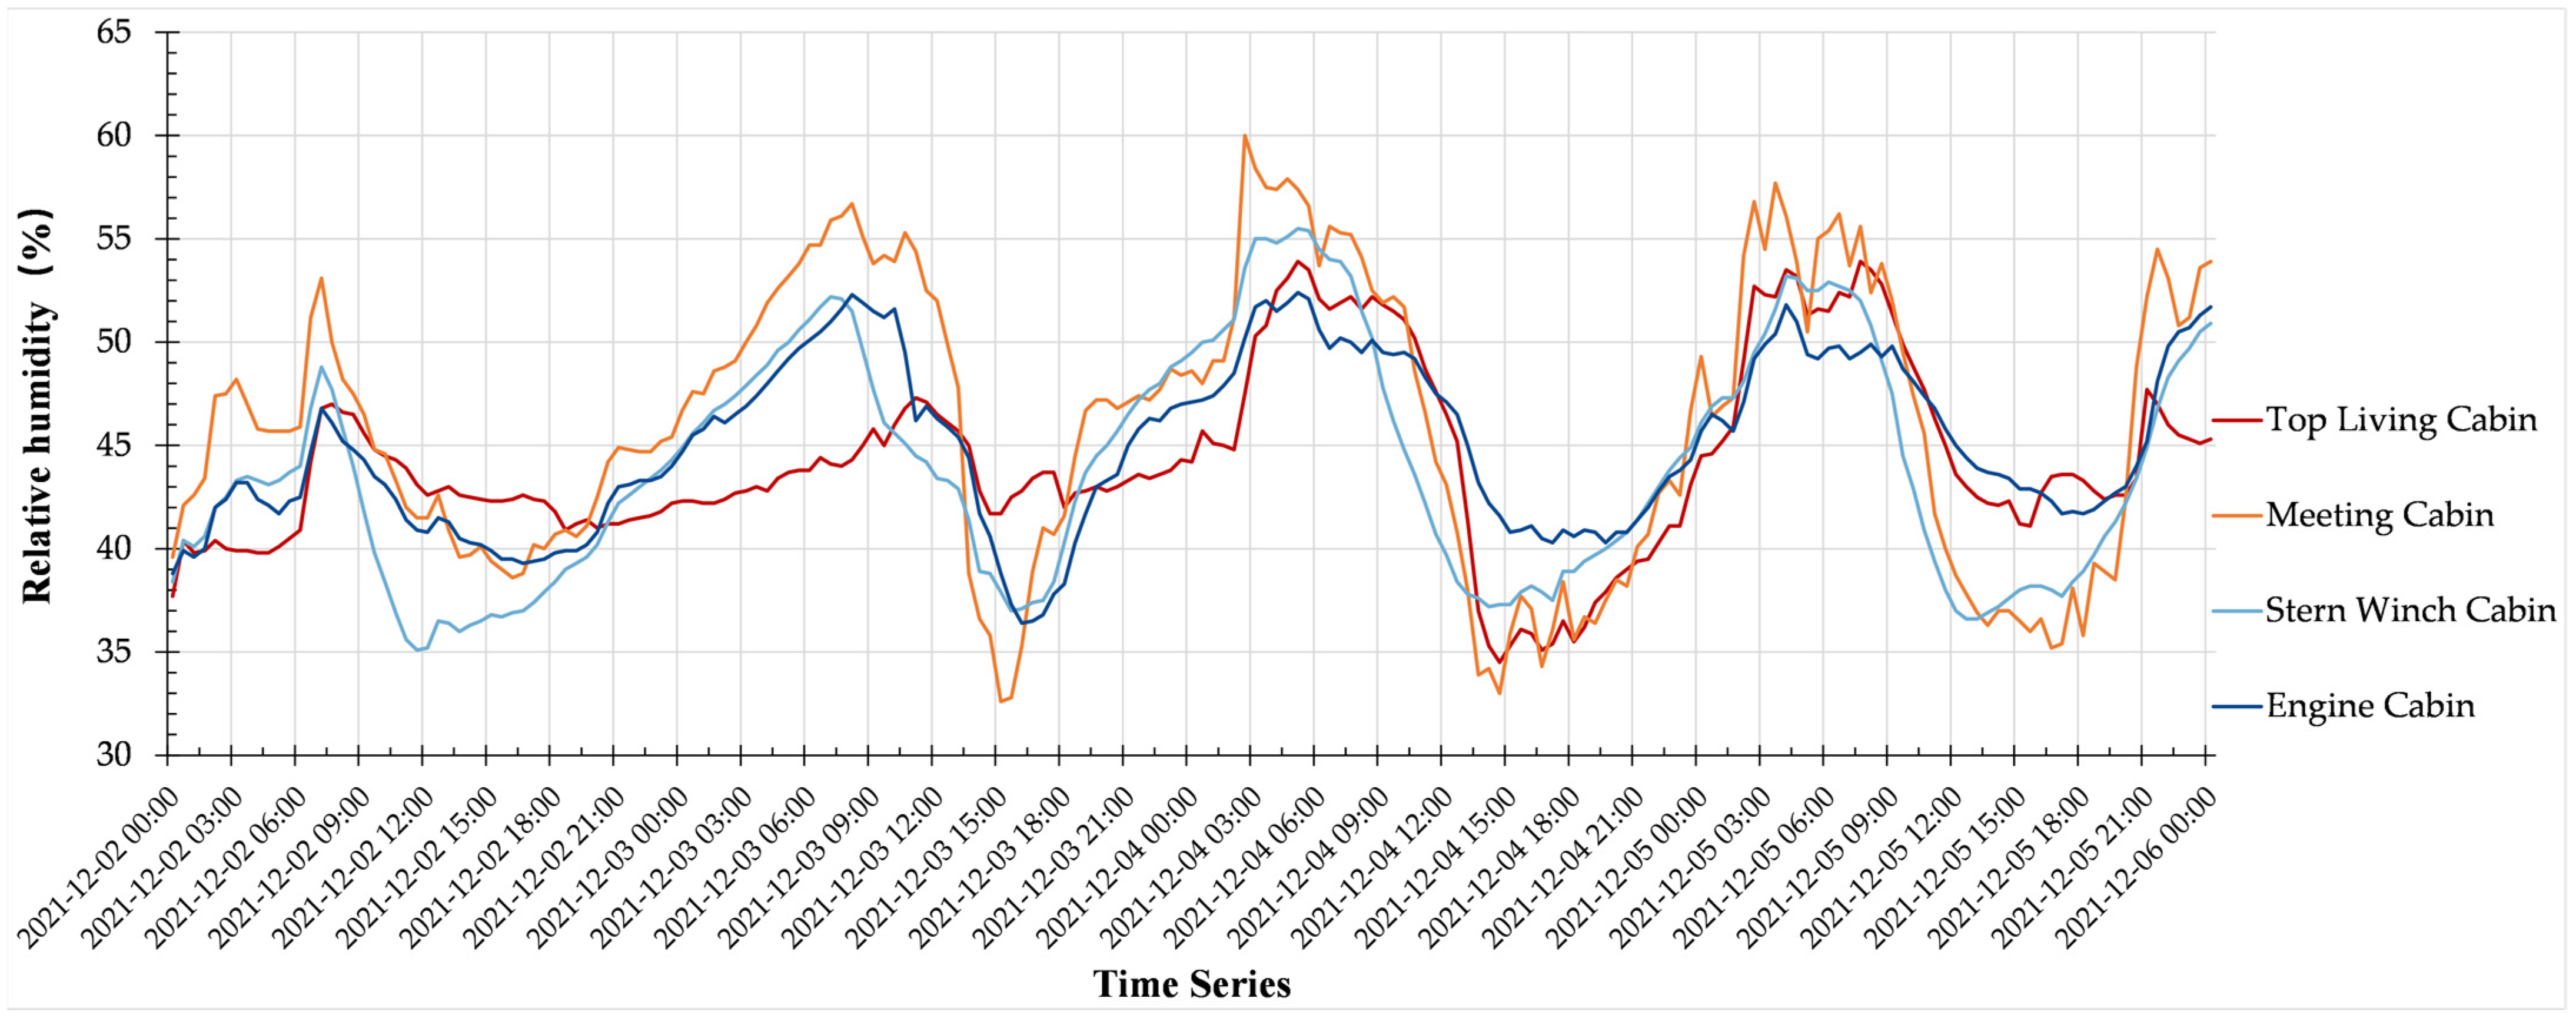
3.3.2. Changes in Relative Humidity

In Figure 14, the analysis of relative humidity changes from 4 to 6 October showed that the average humidity values of the two cabins above deck differed from each other by only 2.7%. The humidity in the engine cabin was higher with an average difference of 5.4% than in the stern winch cabin at almost all times. On 4, 5, and 6 October, the average humidity in the top living cabin was 10.2% lower, 3.0% higher, and 4.3% higher, respectively, than in the stern winch cabin. On the whole, the humidity difference between the two cabins above deck is small, but below deck is large with the engine cabin being almost always higher because of its larger area, so the heat exchange efficiency was also higher. The influence of the external low temperature on the engine cabin is greater than on the stern winch cabin. If the absolute air humidity in each cabin remains unchanged, then the humidity in the engine cabin would always be higher than in the stern winch cabin because the humidity is related to the external medium in contact with the maintenance structure of the cabin. Obviously, the closed environment of the stern winch cabin allows it to stay dry.
Relative humidity is also affected by the environment, of which the influencing factors are more complex [33,36]. On the whole, it shows an opposite trend to the changes in dry-bulb temperature. Although the variation in humidity also shows a correlation with temperature, it is not as obvious as the trend displayed by the temperature curve. Compared with the dry-bulb temperature curve, the variation in the relative humidity curve is more turbulent. For example, from 03:00 to 09:00 h on 5 December, the relative humidity curve, which fluctuated sharply in the short term, for the meeting cabin shows several local peaks.
In Figure 15, the analysis of the data from 2 to 5 December shows that the humidity differences are smaller than the temperature differences. Every day, the relative humidity in each cabin reaches its maximum and minimum at 06:00 and 16:00 h, respectively. The average relative humidities of the top living, meeting, stern winch, and engine cabins are 44.2%, 46.0%, 44.0%, and 45.0%, respectively, with corresponding ranges of 34.5–53.9%, 32.6–60.0%, 35.1–55.5%, and 36.4–52.4%. The meeting and engine cabins experienced the most dramatic and gentlest changes, respectively. The relative humidity in the meeting cabin remained high most of the time and had the highest frequency of crew access. In conclusion, a closed cabin with high personnel will have a corresponding increase in relative humidity. The data show that 45% relative humidity is a cut-off point. When most of the interior of the ship is below this point, the relative humidities of the two cabins below deck are higher than that of the meeting cabin.

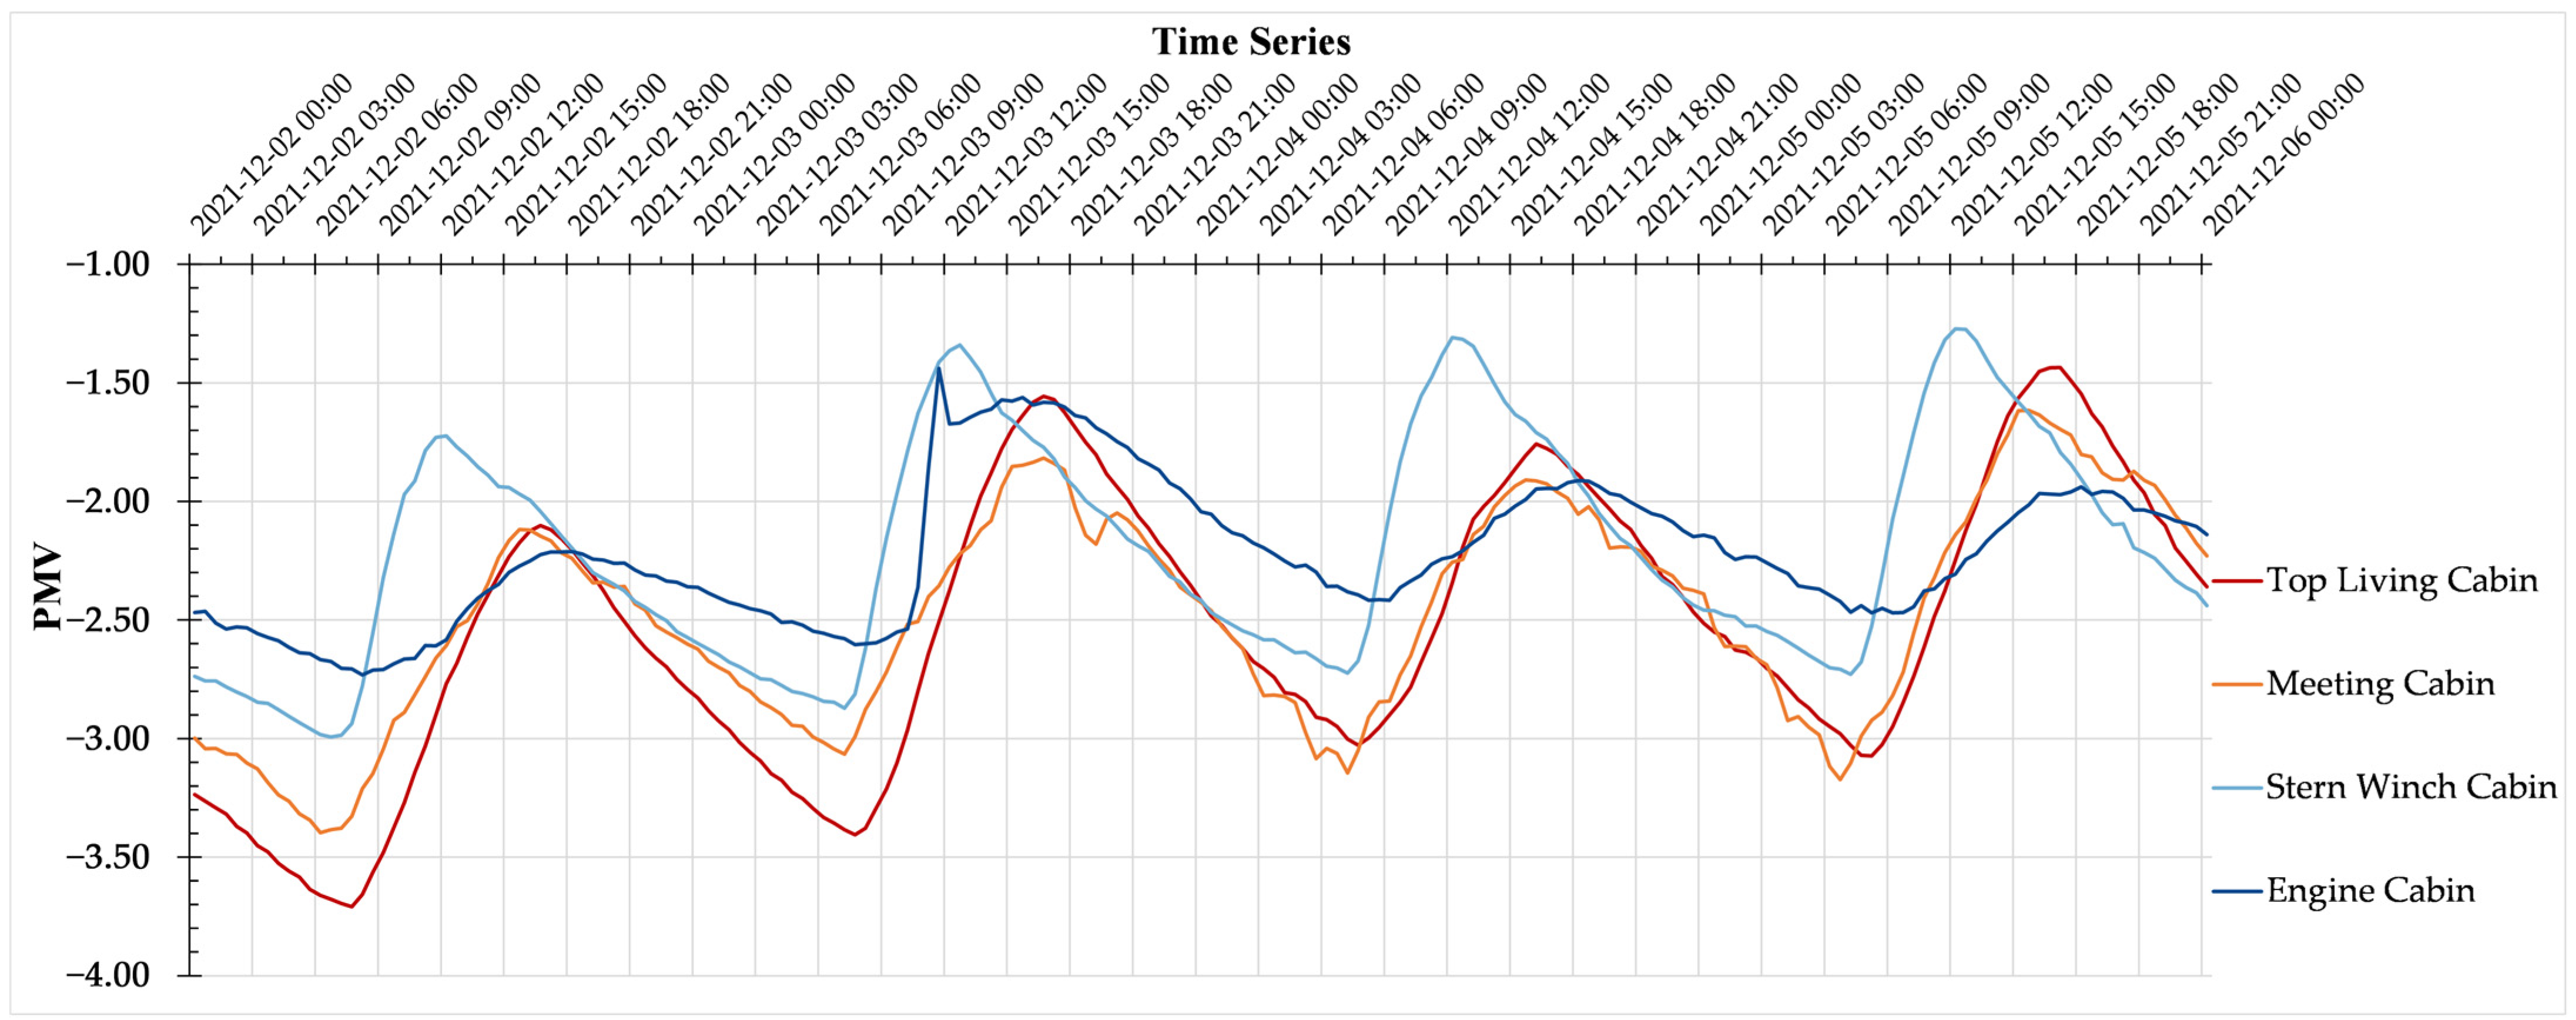
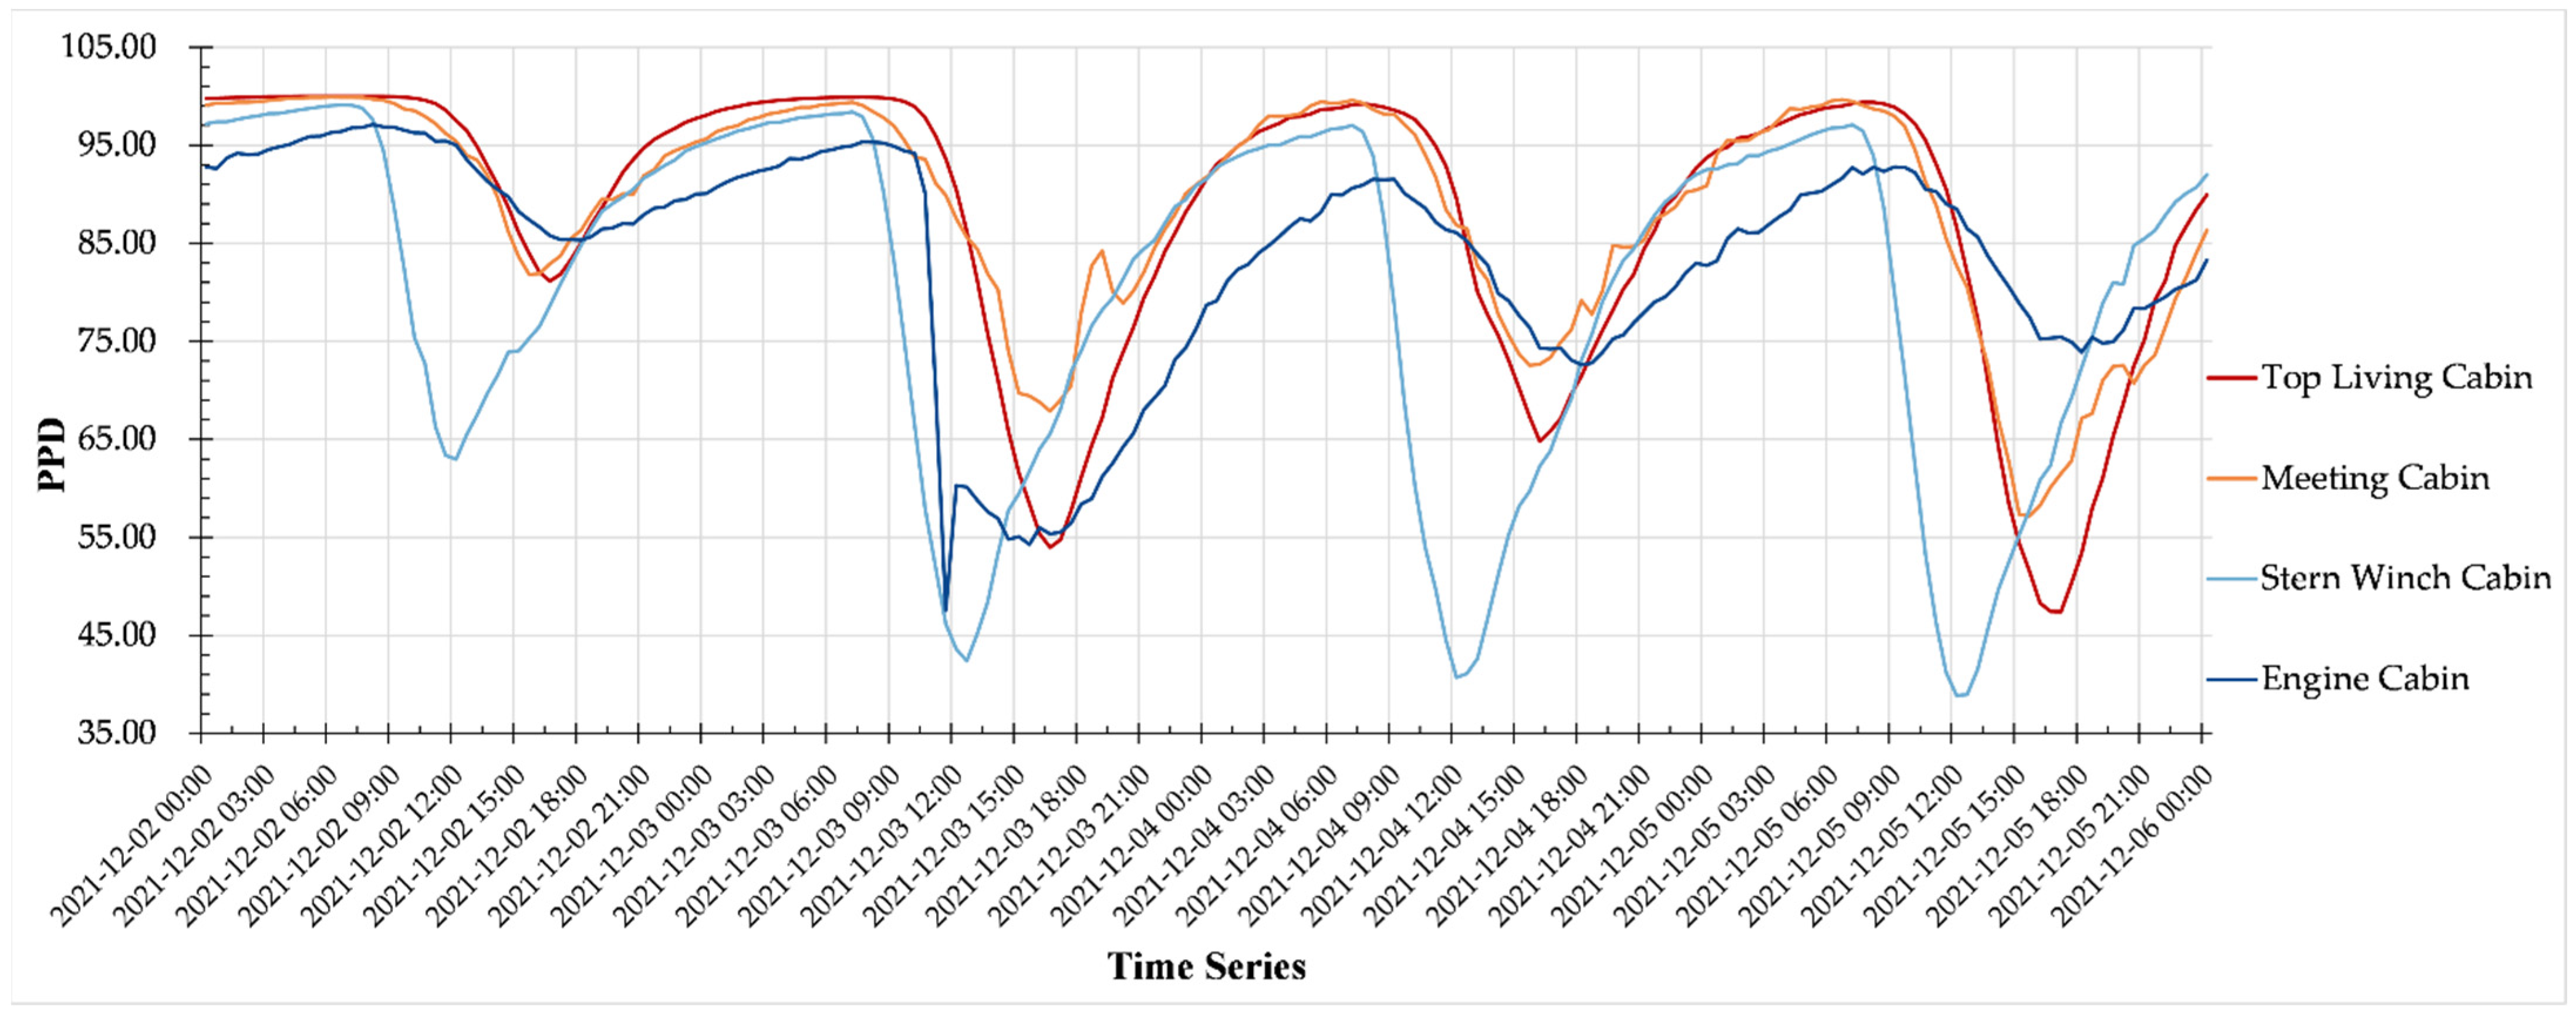
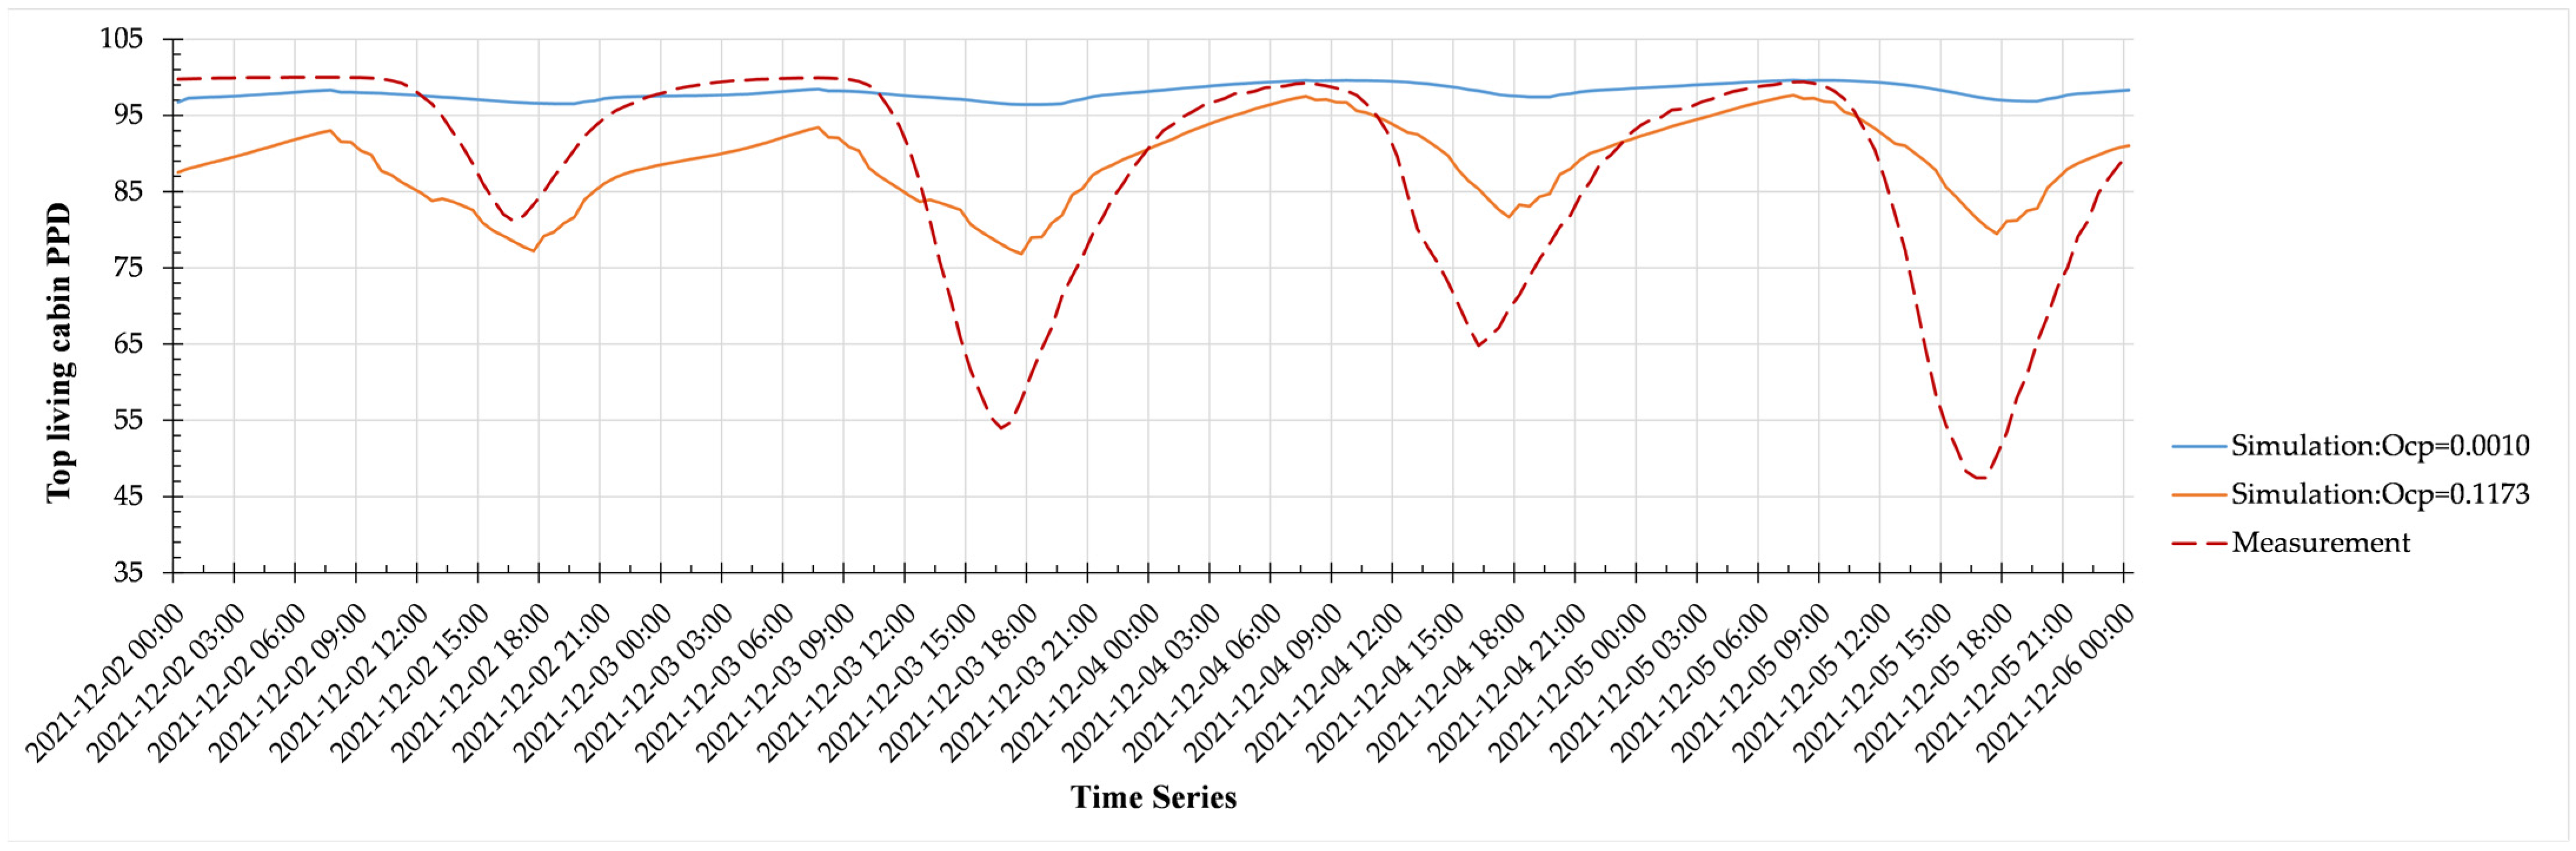
3.3.3. Calculations of PMV/PPD in Real Environment

The curve of the mean radiant temperatures is shown in Figure 16. The deviation range between them and the dry-bulb temperatures is 0.2–0.6 °C. The curve is similar to the ones for the dry-bulb and black-globe temperatures. These results confirm the consistency between the mean radiant and dry-bulb temperatures in a typical indoor environment.
Next, the PMV-PPD of four cabins during the period from 2 to 6 December 2021 was calculated. The dry-bulb temperature, relative humidity, black-globe temperature using direct measurement data, and the mean radiant temperature were calculated from the measured data. Air speed refers to typical indoor environment standards, and clothing insulation and individual metabolic rate (activity) are provided by crew.
Wuhan enters the early winter season in December, so both the air and mean radiant temperatures are low. Therefore, within the test range, the PMV of the two cabins is always below −0.5, i.e., below thermal neutrality. The numerical changes in the PMV of all the cabins are strongly correlated to both temperatures. The values of PMV and PPD were calculated with the above formula. Figure 17 and Figure 18 show the corresponding PMV and PPD curve charts.
The PMV value of the stern winch cabin is significantly better than those of the other three. When the difference is the largest, it is about 1.5 higher, i.e., the thermal comfort is about 40% higher, than that of the top living cabin. Both dry-bulb and mean radiant temperatures are also higher than those of the other three cabins. The above chart shows that the dry-bulb temperature almost plays a decisive role.
Although both are partially submerged, the engine cabin and stern winch cabin in the peak time of PMV are not synchronized. The PMV value of the two cabins indicated an alternation rule of daily at four o ‘clock in the afternoon to eight in the morning the next day, and the engine cabin thermal environment will be more comfortable. From 16:00 h, 2 December to 08:00 h, 3 December, the PMV of the engine cabin was 9.1% higher than that of the stern winch cabin but was significantly lower on the other days. The thermal comfort of the cabins above deck did not show much difference. In general, the cabins below deck, which were also underwater, showed superior thermal comfort during the winter.
The data showed high PPD in all four cabins in winter conditions, but dissatisfaction in the stern winch cabin was still much lower than in the other three. At about 14:30 h, 4 December, the PPD of the stern winch cabin was 50%, which means that at least half of the people had been satisfied with the thermal comfort, whereas the PPD of the meeting cabin was 72%, which is a 22% difference from that of the stern winch cabin. The PPD in the stern winch cabin was also significantly lower than in the other three for nearly 10 h. A comparison of the curves of PMV and PPD shows opposing trends, i.e., the closer PMV is to 0, the lower is its corresponding PPD. Lower levels of thermal comfort correspond to feelings of more intense cold by the crew. The PMV values of the four cabins were converted into more intuitive “thermal sensations” for statistics. The results in Figure 19 show 193 sets of data. The top living cabin had the worst thermal comfort, i.e., the crew felt it to be the coldest, during 52% of December, whereas the engine cabin was felt to be cold only 19.2% of the time. The stern winch cabin felt colder but not as much as the cabins above deck.

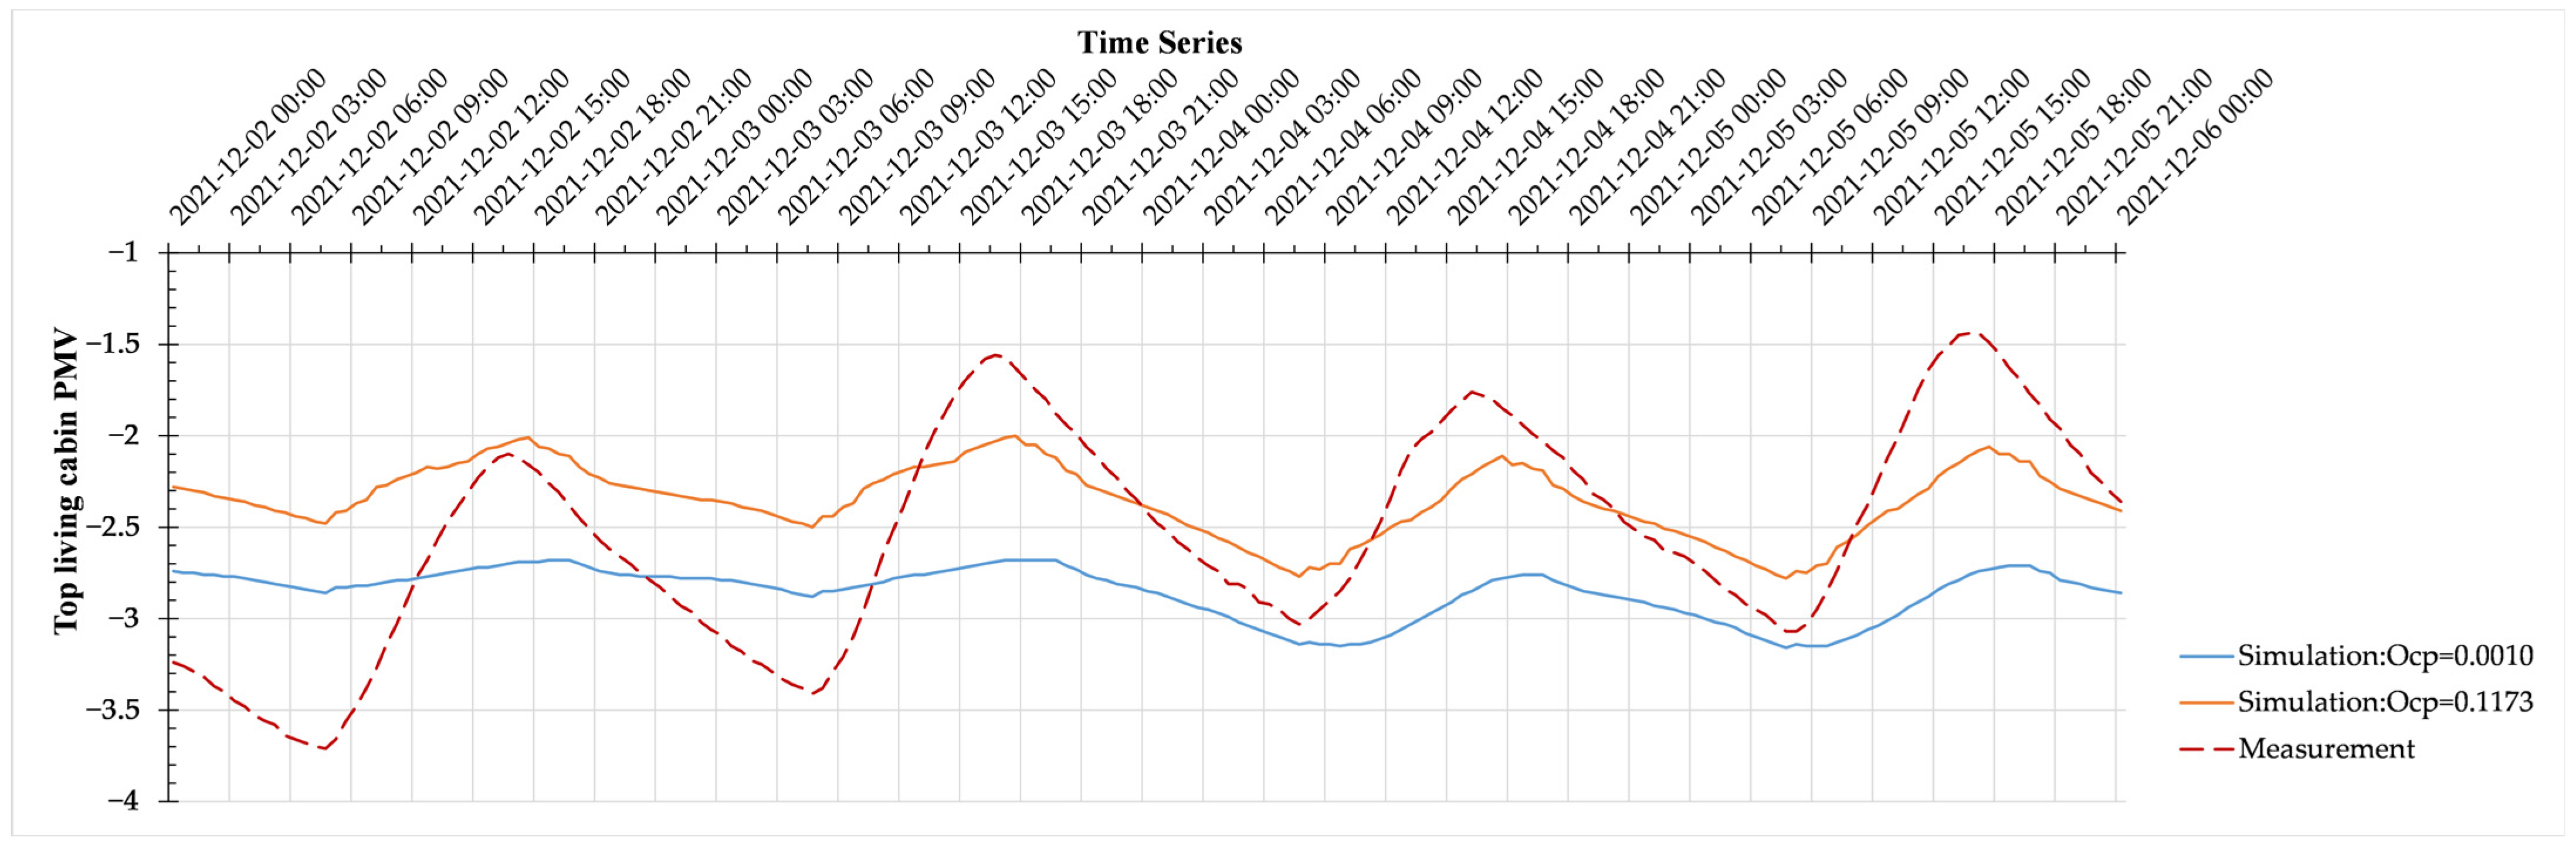
3.4. Results of Software Simulation

DesignBuilder was used to digitally simulate the experimental space. The simulated environment differed from the real environment. The most important difference was most measurements having been taken in empty cabins, i.e., in the absence of humans and other heat sources. The human body itself is a source of heat emissions and has a strong influence on indoor environments. A normal adult can radiate about 100–160 W of heat [45]. Therefore, in the simulation, the indoor personnel density per unit area, which is measured as the number of people occupying a unit area, had to be adjusted to control for the effects of human heat sources on the mean radiant temperature in a cabin. In the software simulation, the density was set at 0.1137 people/m2, which is the default value in the simulated office environment template. The actual data collection did not consider human heat sources, so the value was adjusted to 0.0010 people/m2. The simulated and measured data with these two density values for the top living cabin as an example are shown in the following Figure 20 and Figure 21 compare the PMV and PPD of the cabin.
The measured and simulated values of the top living cabin have similar trends, but the amplitude of the former is larger than that of the latter, indicating that the actual external environment had changed more dramatically. In December, the maximum and minimum values of the measured PMV were −1.44 and −3.71, respectively, with a fluctuation of 2.27. When the personnel density in the cabin was 0.0010 people/m2, the maximum and minimum values were −2.68 and −3.16, respectively. For 0.1173 people/m2, they were −2.00 and −2.78, respectively. Hence, when the parameter is set to an empty cabin, the fluctuation range of PMV is smaller than that of an occupied one. The numerical analysis shows that a simulated empty cabin felt colder and its PMV value was generally lower than in a simulated office environment. The maximum value of the PPD index of the top living cabin was 99.99%, which means that almost all the crew members had felt dissatisfied, while the minimum value was 47.43%, which means that less than half had felt dissatisfied. In the simulated environment, the dissatisfaction at both personnel density values was higher than in the real one. The same analysis was conducted for the remaining three cabins. The results are only briefly discussed here, but detailed charts are shown in Appendix B, Figure A1, Figure A2, Figure A3, Figure A4, Figure A5 and Figure A6.
(1) The simulated results show that the average PMV and PPD of an empty cabin are 0.46 lower and 3.33% higher, respectively, than those of an occupied cabin. For the meeting cabin, the maximum, minimum, and fluctuation of the measured PMV are −1.62, −3.4, and 1.78, respectively, while the maximum and minimum measured PPD are 99.91% and 57.21%, respectively. When the personnel density is 0.0010 people/m2, the maximum and minimum PMV are −2.51 and −2.99, respectively, which is an overall higher range than that of the top living cabin, while the PPD is 99.07% and 93.62%, respectively. When the density is 0.1173 people/m2, the maximum and minimum PMV are −1.88 and −2.66, respectively, while those of PPD are 96.2% and 71.15%, respectively. The real PMV fluctuates greatly. In the simulation, an increase in density leads to the fluctuation of the PMV decreasing to 0.78, indicating a more stable thermal environment in the cabin.
(2) The maximum, minimum, and fluctuation of the measured PMV of the stern winch cabin are −1.27, −2.99, and 1.72, respectively, while the maximum and minimum measured PPD are 99.09% and 38.85% respectively. When the density is 0.0010 people/m2, the maximum value of PMV is −1.84 and the minimum value is −2.42. The maximum and minimum PPD are 91.52% and 69.25%, respectively. When the density is 0.1173 people/m2, the maximum and minimum PMV are −1.2 and −2.08, respectively, while those of PPD are 80.14% and 35.42%, respectively. The measured and simulated data show that the thermal comfort is significantly higher than in the top living and meeting cabins.
(3) The maximum, minimum, and fluctuation of the measured PMV of the engine cabin are −1.44, −2.73, and 1.29, respectively, while the maximum and minimum measured PPD are 97.11% and 47.58%, respectively. When the density is 0.0010 people/m2, the maximum and minimum PMV are −1.86 and −2.49, respectively, while those of PPD are 93.22% and 70.31%, respectively. When the density is 0.1173 people/m2, the maximum and minimum PMV are −1.12 and −2.11, respectively, while those of PPD are 81.62% and 31.22%, respectively. A comparison of the engine and stern winch cabin data shows that their thermal comfort indexes are very similar to their values in the simulated environment, as the mean differences in PMV and PPD are less than 0.05 and within 2%, respectively, indicating that they had almost the same thermal environment in the simulation. The PMV and PPD peaks and fluctuations between the two cabins are higher in the real environment. The reasons for this difference between the cabins would be more complicated.
To explore the relationship between the thermal comfort of the cabins when the density is 0.1173 people/m2, the PMV-PPD data in simulation were further analyzed. Compared with the measured data, the simulation’s results show different data relationships in Figure 22 and Figure 23. Although significant differences among the measured values of the four cabins are obvious, some overlap intervals and alternate states between their respective curves are visible. The simulation shows a very obvious difference between the cabins above and below deck, as their PMV are in the ranges of −2.78 to −1.88 and −2.11 to −1.12, respectively. The two sets of data did not even intersect. The radiation from the human bodies increases the mean radiant temperatures in all the simulated occupied cabins, thus leading to values of PMV that are more favorable than in the real environment. The most significant improvement is in the simulated occupied engine cabin, whose PMV increases by 17.55%. When there are more crew members, their feelings of cold become relieved more significantly.
The simulated results show that when a cabin is densely populated, the simulated PPD value is significantly lower than the actual value, which is close to 100% nearly half of the time, indicating that all crew members are not satisfied with the real thermal environment nearly half of the time. In the densely populated simulation, the situation significantly improves as the number of scenarios with simulated PPD greater than 90% decreases significantly both above and below deck. The latter showed greater decreases, as the maximum and minimum simulated PPD dropped by 17.47% and 7.63%, respectively. In summary, the thermal comfort of a cabin significantly improves when densely populated. DesignBuilder assisted this study by supplementing the data on factors easily neglected for real environments, in which the test is often affected by some objective conditions. In contrast, a simulated environment allows more flexible parameters for comparison and prediction.
This study also compared the simulation’s fitting accuracy with the two personnel density settings. Regarding the simulation’s optimization efficiency, the correlation between the simulated and actual results for above deck reached 0.67, whereas that for below deck was slightly weak at 0.42. These results show that the simulated results are worse for below deck because of the more complicated underwater environment. However, in general, the simulated results meet expectations and can reflect the actual thermal comfort more accurately.

4. Discussion

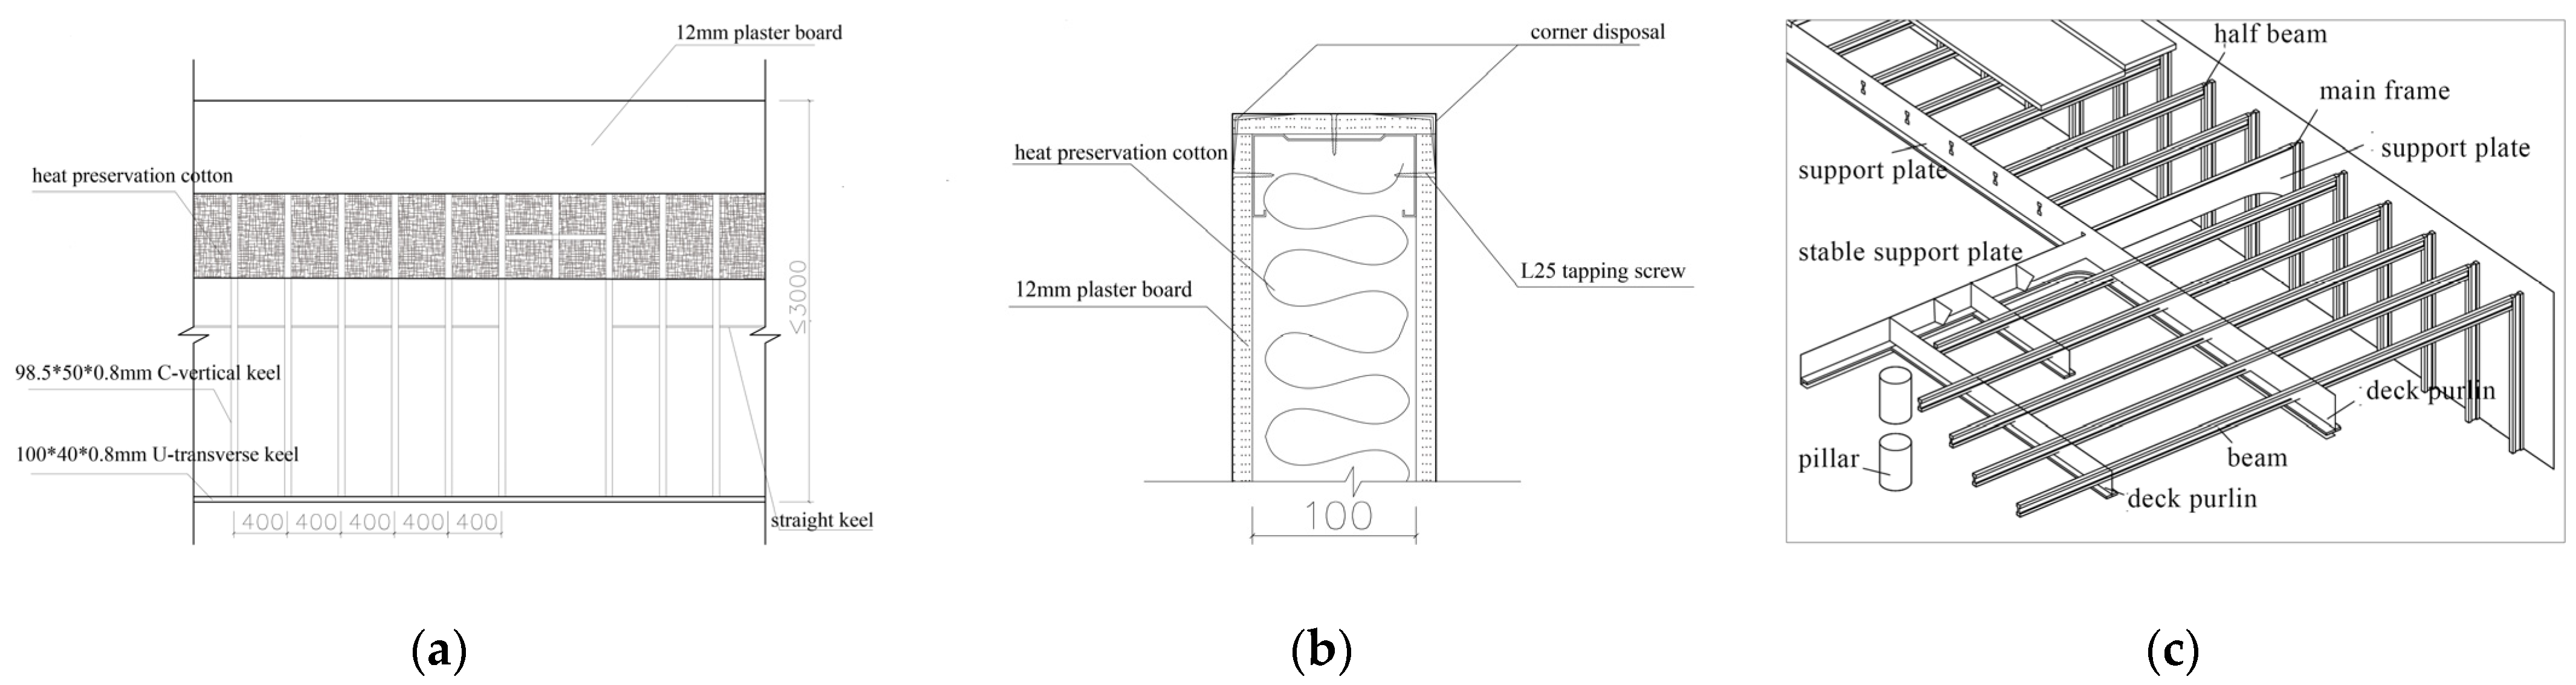
4.1. Particularities of Cabin Environments

There are significant differences in the indoor environments and thermal comfort evaluations of ship cabins and buildings on land. The structures of the latter are usually more complex because of the numerous differences between urban and watery environments. A ship is more directly exposed to its watery environment, so the heat transfer coefficient of the maintenance structure, the surface radiation, and other factors affect the thermal environments inside the cabins. Because of their intensive functional arrangements, different cabins of different ships have significant environmental and functional differences. In cabins above deck, solar radiation directly heats the bulkheads and indirectly affects the air temperatures. In addition to the direct effects of solar radiation, the cabins below deck are also affected by radiation and convective heat transfer from the watery environment.
The thermal comfort of ships in the Yangtze River basin is reflected in the physiological and mental health of their crews. This study investigated the thermal comfort in Changyan no. 10 ship, then found that the temperature and humidity of the auxiliary buildings above deck varied more significantly. In winter, the interior spaces showed lower PMV, i.e., lower thermal comfort, whereas the engine and stern winch cabins located below deck, which are partially immersed in water, had relatively good thermal conditions. Solar radiation heats the cabins above deck while the lower bulkhead is in direct contact with the surrounding water, from which heat is conducted. As the specific heat capacity of water is 4.2 × 10³ J/(kg °C), the temperature change due to the same amount of heat absorbed or released by the water is much smaller than that by the air. Moreover, the temperature change in water is much more gradual, so the temperature change in a cabin in direct contact with the river would be much more stable.
The results show that the significant differences in the internal space arrangements and external environments of the cabins lead to obvious numerical differences in temperature and humidity. Almost half of the engine cabin exchanges heat directly with the deck, so its temperature changes are more affected by the external air temperature. The stern winch cabin is located under the superstructure of the ship, so it has a smaller area for direct heat exchange with the deck. Naturally, the two cabins would have different levels of thermal comfort and the magnitude of the differences would be related to the deck and bulkhead materials. The coupling effect of indoor and radiation temperatures on human thermal comfort in a non-uniform thermal environment implies that the thermal comfort of the same indoor environment at different surface temperatures in a steady-state environment would be different from that of a uniform space [28].
Although part of the engine cabin is directly below deck, more than 50% of its space lies under the bridge level projection. A thermal imaging camera revealed a distinct temperature pattern, with a maximum temperature of 41.6 °C, as shown in Figure 24.
The remaining lower part of the cabin had a minimum temperature of only 32.5 °C, which was caused by the attenuation effect of temperature conduction in solids and the fact that the lower part of the cabin was submerged. Hence, more heat exchange occurs between the engine cabin and the external environment than for the stern winch cabin, even though both are entirely below deck. Thermal imaging also showed a uniform temperature distribution, ranging from 30 °C to 36.2 °C, except for the area of the deck that was in direct contact with the outside. Different cabins in the same ship can have significant differences in their thermal environments caused by different external environments, such as air or water. Such differences affect the crew’s thermal comfort, which, in turn, affects their working and living on the ship.

4.2. Further Discussion for the Results

The special use and structure of ships make different areas with different functions and special artificial heat sources (such as running turbines). At the same time, the ship’s cabins are affected by a combination of water surface, air environment and solar radiation, which makes the thermal comfort partition on the ship to be more complex and diverse. The four cabins involved in this study can objectively reflect the representative spatial environment on the ship. In this study, several physical quantities related to the indoor environment were measured for each typical cabin, and it was found that the inhomogeneous environment between the cabins brought about different variations in physical quantities, especially with the deck as the division, and the cabins above deck and below deck showed obvious differences in several physical dimensions.
Among the physical quantities that affect the thermal environment of a ship, air and water are two environmental media that differ significantly. In the study above, the temperature variation of the cabins above deck tends to be more closely related to the temperature outside the ship, while the indoor temperature of the cabins below deck has a greater relationship with the water temperature. The temperature fluctuations in the cabins above deck are significantly greater than those in the cabins below deck. Interviews with crew members during the fall and winter months also revealed that they felt more comfortable in in the cabins which are lower floor or below deck. The mechanism of relative humidity variation can be a bit more complex. In general, the regularity of relative humidity variation within individual cabins is weaker than the variation in dry-bulb temperature, with large fluctuations in relative humidity at certain times. According to these characteristics, the relative humidity is influenced by the dry-bulb temperature, but also with the water vapor content inside the cabin. Different cabins have different sources of water vapor inside them, thus leading to more frequent local variations of relative humidity.
In this study, PMV-PPD was used as the thermal comfort index to evaluate the thermal environment in the cabin and the parallel method of actual measurement and simulation was performed to make a comprehensive evaluation. Two different groups of parameters were set in the software simulation to describe the situation with and without people. Then a data comparison between one set of actual measurement data and two sets of simulation data were performed for each cabin. The maximum value of PMV and the minimum value of PPD in each cabin almost always appeared around 6:00 pm, which was the most comfortable time of the day for the crew. The influence of solar radiation decreases at this time, and the large heat capacity of the water surface gradually plays a greater stabilizing role. Further research shows that there are many spaces on the ship that are located below the water surface, and these spaces are able to maintain relatively good thermal comfort performance in a non-air-conditioned environment. It can be seen that the water plays a role similar to that of an insulating film for these cabins and is able to keep these cabins in a relatively smooth thermal condition.

4.3. Limitations of This Study

This study introduced a comprehensive method of determining the thermal comfort in the cabins of a ship by means of actual measurements, questionnaire surveys, and computer simulation. The limitations of this study are as follows. This study focused on thermal comfort while the ship was docked. When the ship enters its annual operation period, the construction equipment on board will be functional and the engine cabin will undergo dynamic changes, which can be examined in subsequent research. Studies on buildings located nearby water bodies have shown that the thermal comfort resulting from proximity to a watery environment was indeed different from that resulting from a dry environment [37]. Therefore, this study not only can provide reference data for designing ship cabins with regard to thermal comfort but can also extend its findings to small waterfront buildings. The calculations of PMV-PPD made use of data collected during the autumn and winter seasons, so the measured and simulated values of PMV were all negative, thus reflecting the problem of the crew’s feelings of cold and discomfort inside the relevant cabins. Further research can be conducted on the sensations and causes of discomfort. Another limitation is the study object being a single ship with a relatively small number of employees surveyed and interviewed, so future research could be extended to all the crews of the ships working on the Yangtze River and given more consideration to the possibility of adaptive thermal comfort arising in long-term working environments.

5. Conclusions

A combined study was conducted through questionnaires, measurements, and simulations to evaluate the thermal comfort in ship cabins from subjective and objective perspectives for more objective, accurate, and comprehensive references for solving problems regarding the thermal comfort of ship cabins or temporary waterfront structures. The study reached the following conclusions:
(1) The cabins below deck were more comfortable than those above deck. Especially in winter, the mean PMV of the top living, meeting, stern winch, and engine cabins were −2.54, −2.48, −2.22, and −2.20, respectively. The average PMV of the cabins above deck were −2.51, and the average PMV of the cabins below deck were −2.21. The PMV and PPD of these cabins (windows closed) in winter were 11.95% higher and 7.03% lower, respectively, than those above deck.
(2) In the cabins above the deck, the top living cabin was more comfortable than the meeting cabin during the afternoons of most of the days in the test period. The maximum difference in the PMV of the two cabins was 13.19%. At other times, the thermal comfort of the meeting cabin with 8.89% higher PMV on cooler days was better than that of the top living cabin. The above analysis indicates that the top floor cabins are more affected by the natural environment such as the intensity of solar radiation. It leads to more drastic changes in the area’s indoor thermal comfort, lower PMV, and more frequent thermal sensations of coldness in winter.
(3) In the cabins below the deck, the study showed that the change in dry-bulb temperature and PMV was less synchronized. During the test period, the dry-bulb temperature and PMV-PPD curves of the stern winch cabin reached their peaks and troughs about 5.5 and 2.0 h, respectively, earlier than those of the engine cabin. In the measurement, the indoor dry-bulb temperature has the most influence on the above-mentioned hysteresis process.
(4) The results simulated by DesignBuilder software were compared with the measured results and showed approximate similarity. The simulation also showed that the correlation coefficient of the simulated PMV at two different personnel density values of the top living, meeting, stern winch, and engine cabins ranged from 0.46–0.67, 0.46–0.70, 0.13–0.46, and 0.19–0.37, respectively. Their ranges for the correlation coefficients of the simulated PPD were 0.51–0.69, 0.37–0.62, 0.08–0.41, and 0.27–0.42, respectively. The simulated results for occupied cabins showed their thermal comfort to improve by 17.55% on average over empty cabins.
(5) The results of the questionnaire show a significant relationship between the thermal comfort felt by the crew and the cabins where they work and live. The subjective thermal evaluations of crew members in different departments also differ. Among the crew members who work quietly and routinely, the proportion of those who think that the thermal environment of the ship is unacceptable is 70%, which is much higher than those who think alike but work with medium and high intensity. The proportion of those working in the deck, engine, and other departments who could feel the changes in the external thermal environment are 72.86%, 58.89%, and 35%, respectively. The above results show that considering the adaptability to different working environments. Those crew members who work in a free pattern and have a greater range of movement are better able to detect changes in the thermal environment. They are more tolerant of poor thermal conditions.

Author Contributions

Conceptualization, D.X. and K.L.; methodology, D.X. and K.L.; software, D.X.; validation, D.X.; formal analysis, D.X. and K.L.; investigation, D.X.; resources, K.L.; data curation, D.X.; writing—original draft preparation, D.X. and K.L.; writing—review and editing, D.X. and K.L.; visualization, D.X.; supervision, K.L.; project administration, D.X. and K.L.; funding acquisition, K.L. All authors have read and agreed to the published version of the manuscript.

Funding

This research was funded by Basic Work of Science and Technology of China (Grant No. 2013FY112500) and the National Natural Science Foundation of China (Grant No. 51208389).

Data Availability Statement

Not applicable.

Conflicts of Interest

The authors declare no conflict of interest.

Appendix A. Questionnaire regarding Thermal Comfort of Ships

Thermal Environment Survey
(1) Date (dd/mm/yy)
(2) Time
(3) Gender
□Man □Woman
(4) Age
□18–25
□25–35
□35–45
□45–60
□60 or more
(5) In which department do you work?
□Deck department
□Engine department
□Other sectors
□Had experience on board, but not as a crew member
(6) Dress on board the ship
□Crew uniforms
□Clothing that fits the season
□Other
(7) What is your activity level on the ship?
□Active, often requiring walking or limb movements
□Moderately active, with occasional physical movements required
□Quiet and fixed, no need for frequent activity
(8) Working on the ship, whether there have been headaches, dizziness and other phenomena
□Frequent
□Occasionally
□Less common
□Never
(9) What do you think of the thermal comfort level of the cabin (without air conditioning) indoor environment?
□Intolerable
□Very uncomfortable
□Not comfortable
□Slightly uncomfortable
□Comfortable
(10) In the summer, in order to achieve a comfortable experience you think the cabin indoor temperature should be?
□Elevated
□Unchanged
□Lower
(11) In winter, in order to achieve a comfortable experience you think the cabin indoor temperature should be
□Elevated
□Unchanged
□Lower
(12) In the summer, in order to achieve a comfortable experience you think the cabin indoor wind speed should be
□Elevated
□Unchanged
□Lower
(13) In winter, in order to achieve a comfortable experience you think the cabin indoor wind speed should be
□Elevated
□Unchanged
□Lower
(14) In the summer, in order to achieve a comfortable experience you think the cabin indoor humidity should be
□Elevated
□Unchanged
□Lower
(15) In winter, in order to achieve a comfortable experience you think the cabin indoor humidity should be
□Elevated
□Unchanged
□Lower
(16) In general, do you think the thermal environment of the cabin (without air conditioning) is acceptable
□Acceptable
□Unacceptable
(17) Do you think the furniture in the cabin is properly arranged
□Reasonable
□Irrationality
(18) Can you detect the difference in thermal comfort when guiding the ship to different waters
□Feel the difference
□No difference is felt
(19) When the ship is working or the two ships meet back to produce a large noise, will you feel more dry and hot or stuffy
□Yes
□No
(20) The degree of impact of the ship’s vibration and noise on you is (gradually increasing from 1 to 5)
□Shake12345
□Noises12345
(21) What do you think of the height of the suspended ceiling in the cabin
□High
□Moderate
□Short
(22) The overall feeling of the space in the cabin is
□Empty
□Moderate
□Narrow
(23) As a ship employee (or a frequent passenger), do you feel like you have better heat or cold resistance than others
□Yes
□No
(24) Have you ever had glare on a ship
□Appeared
□It didn’t appear
(25) What other suggestions do you have for cabin comfort improvements

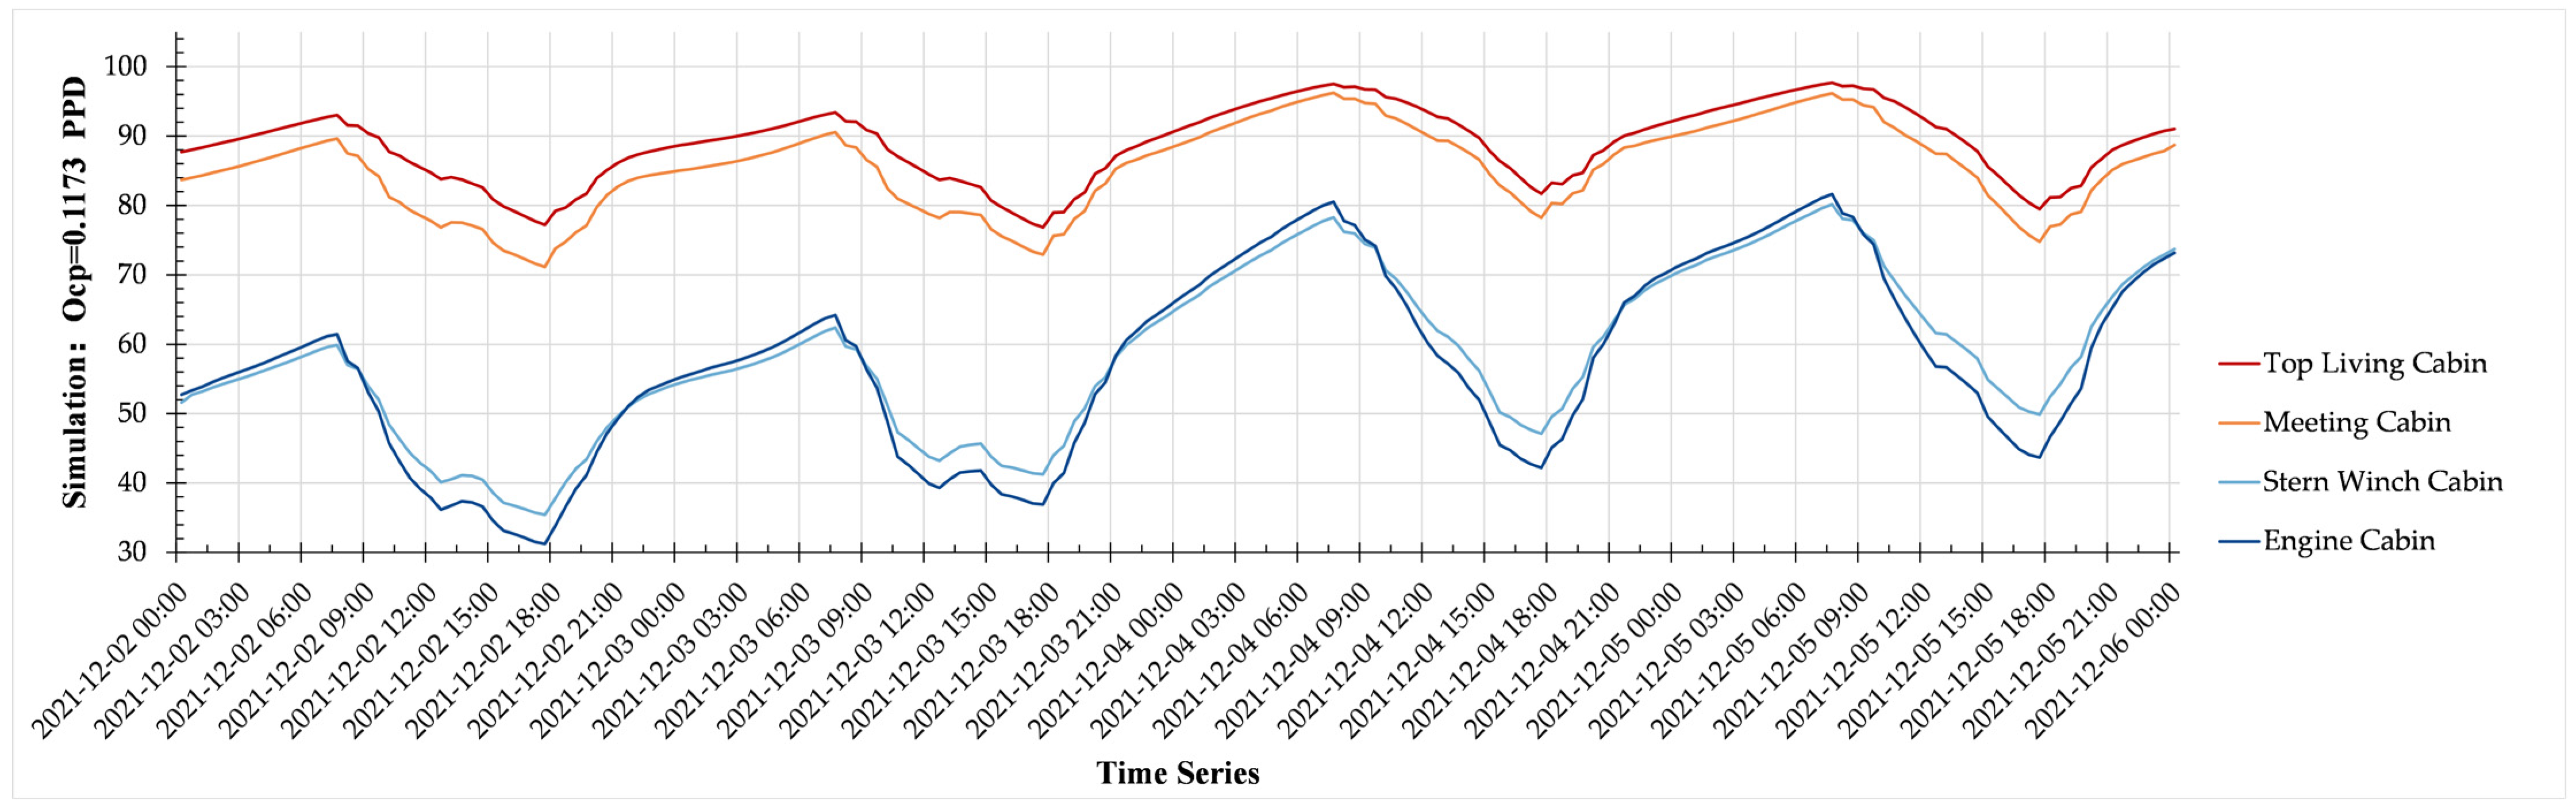
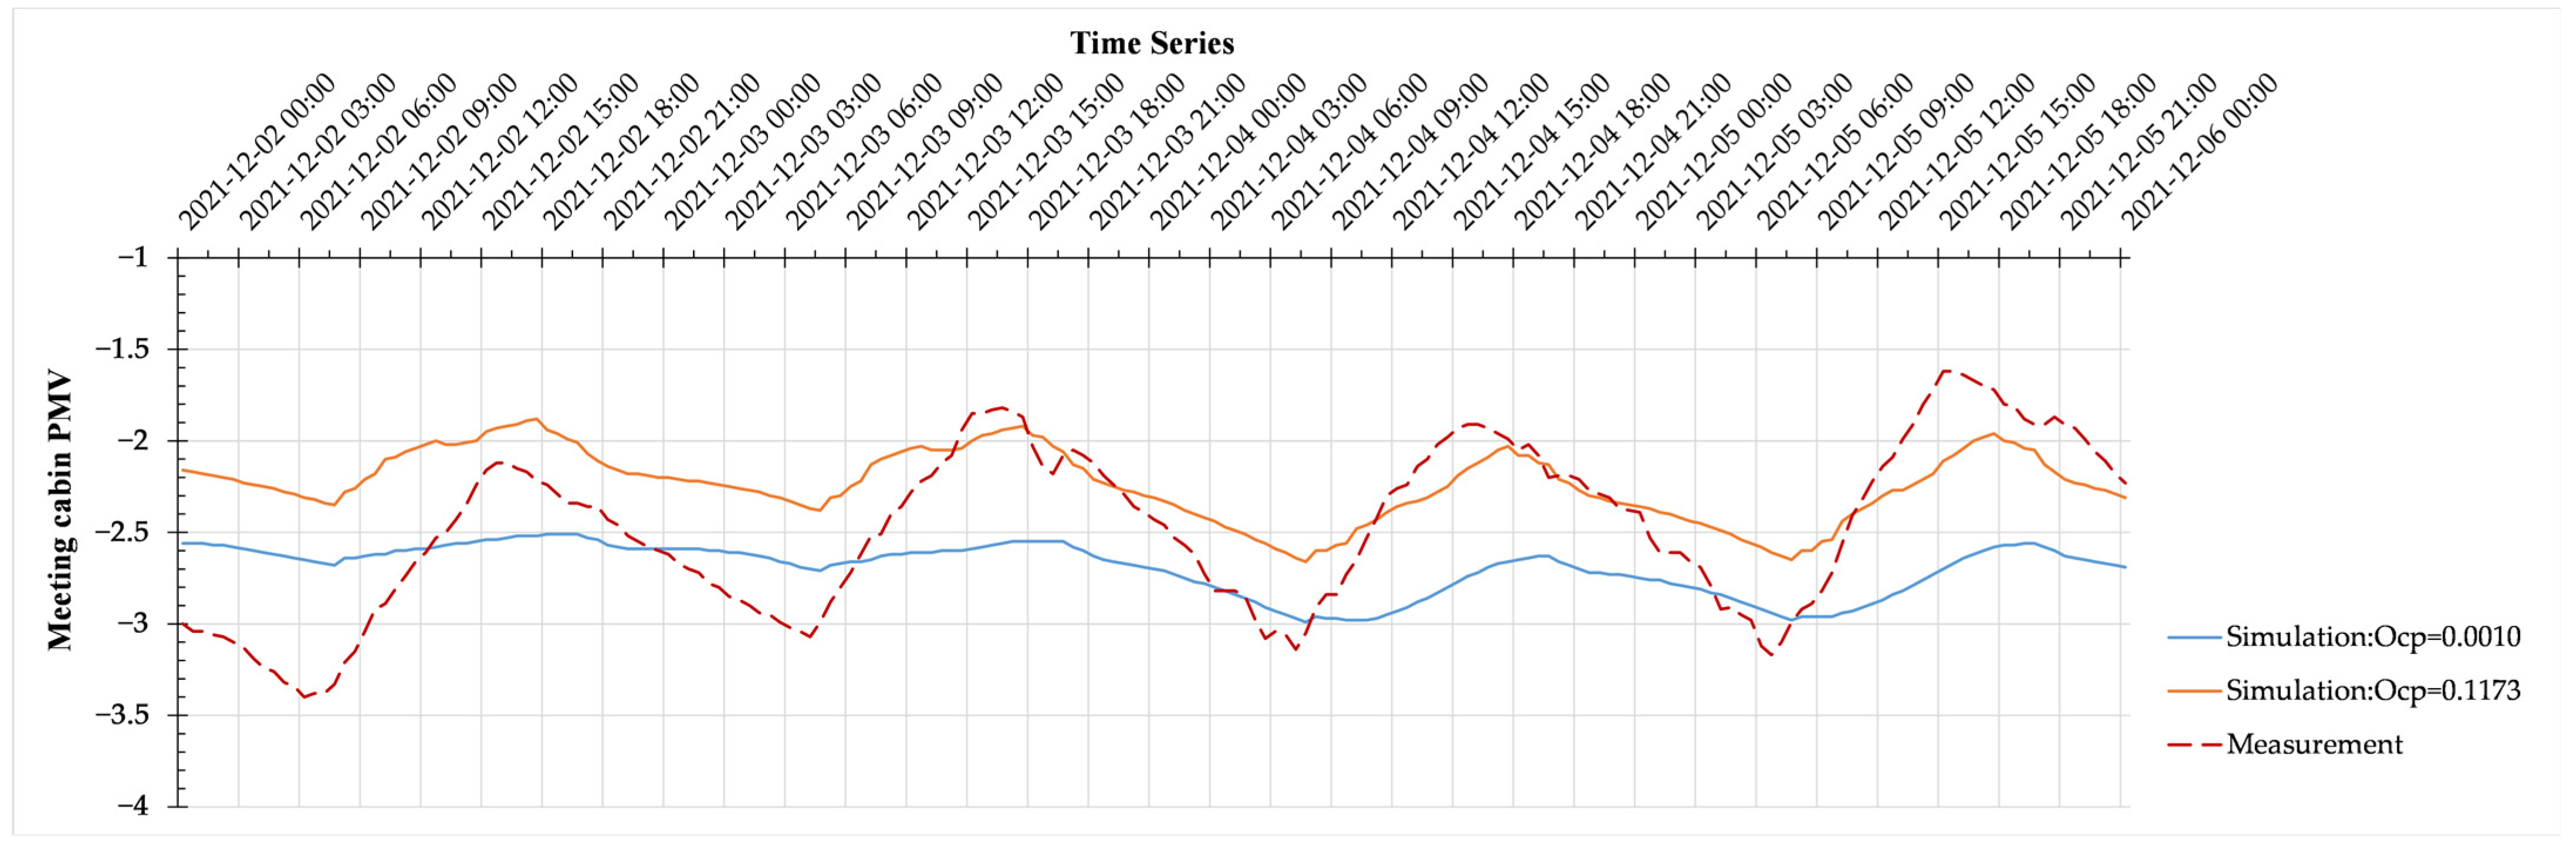
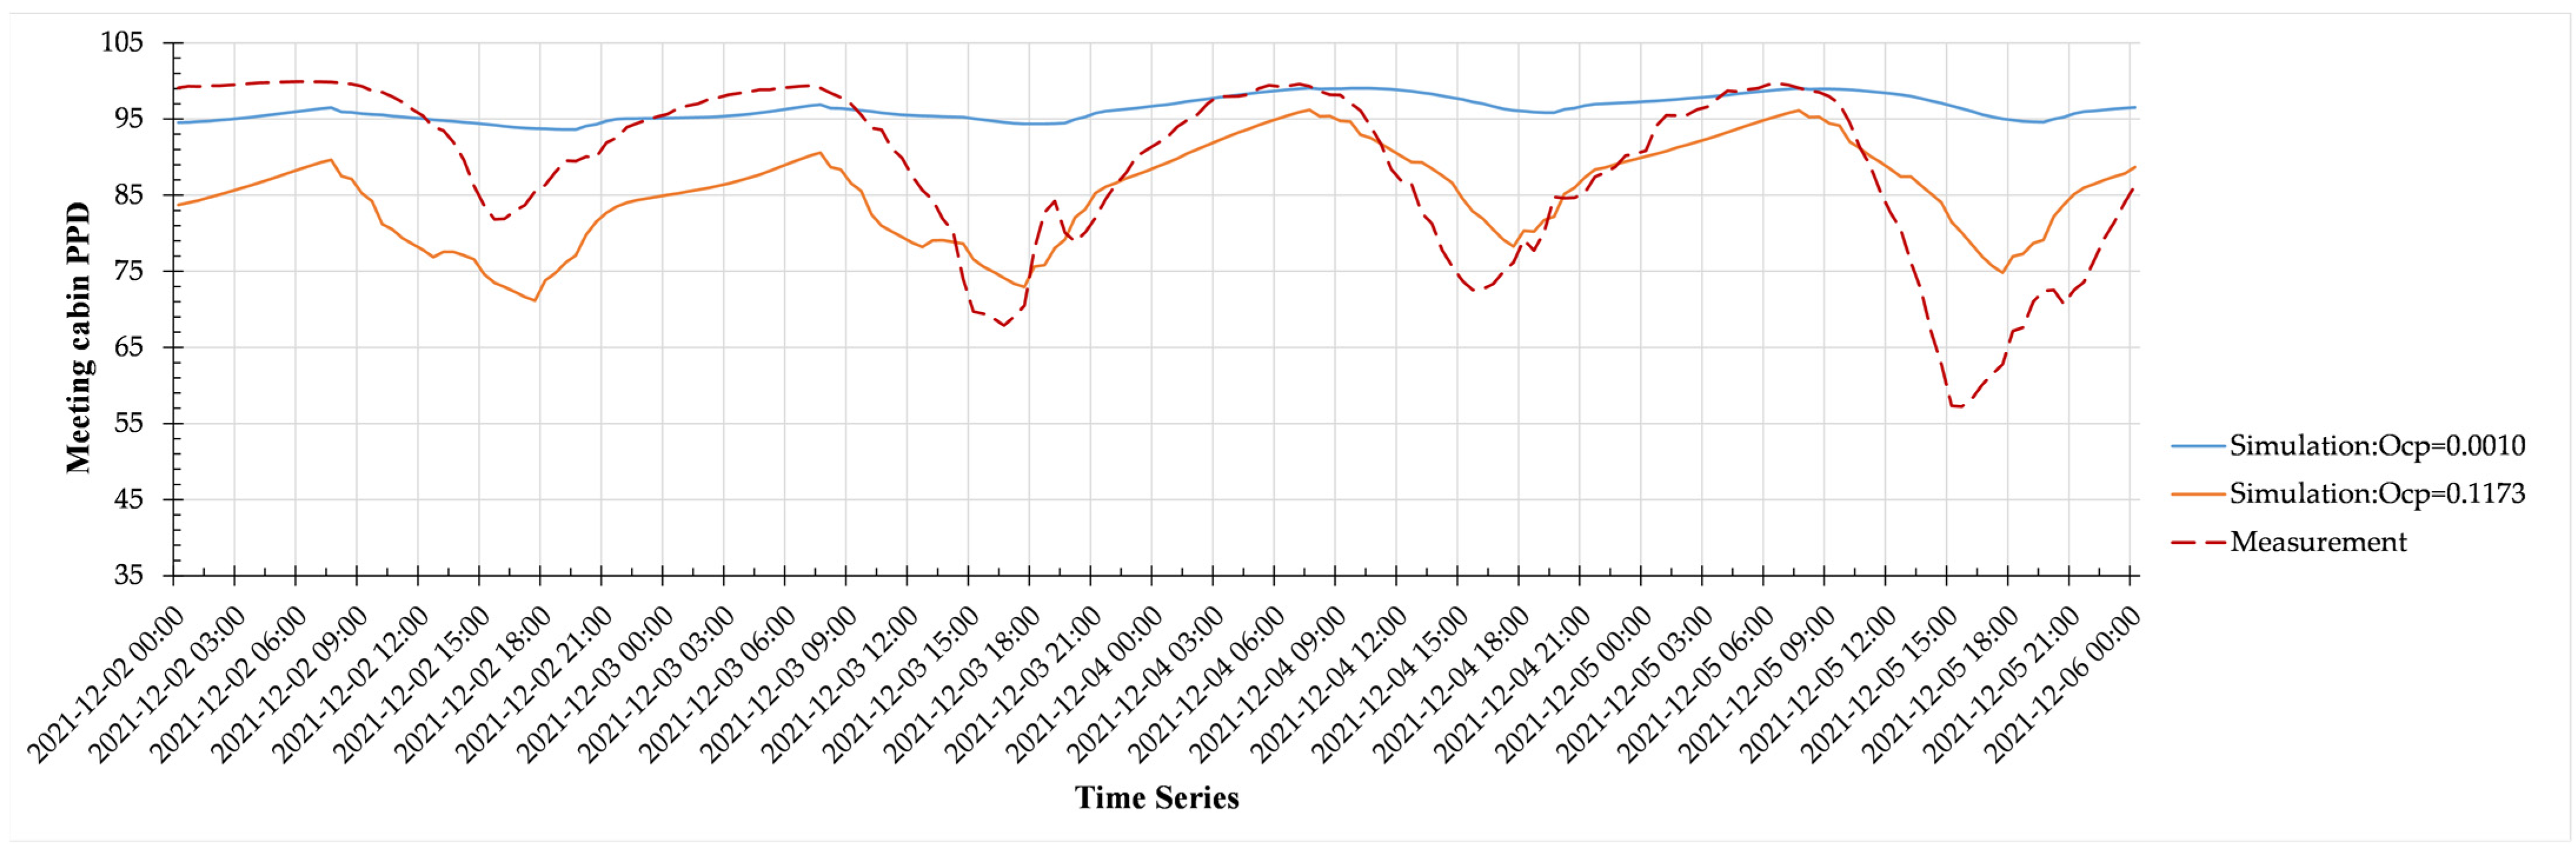
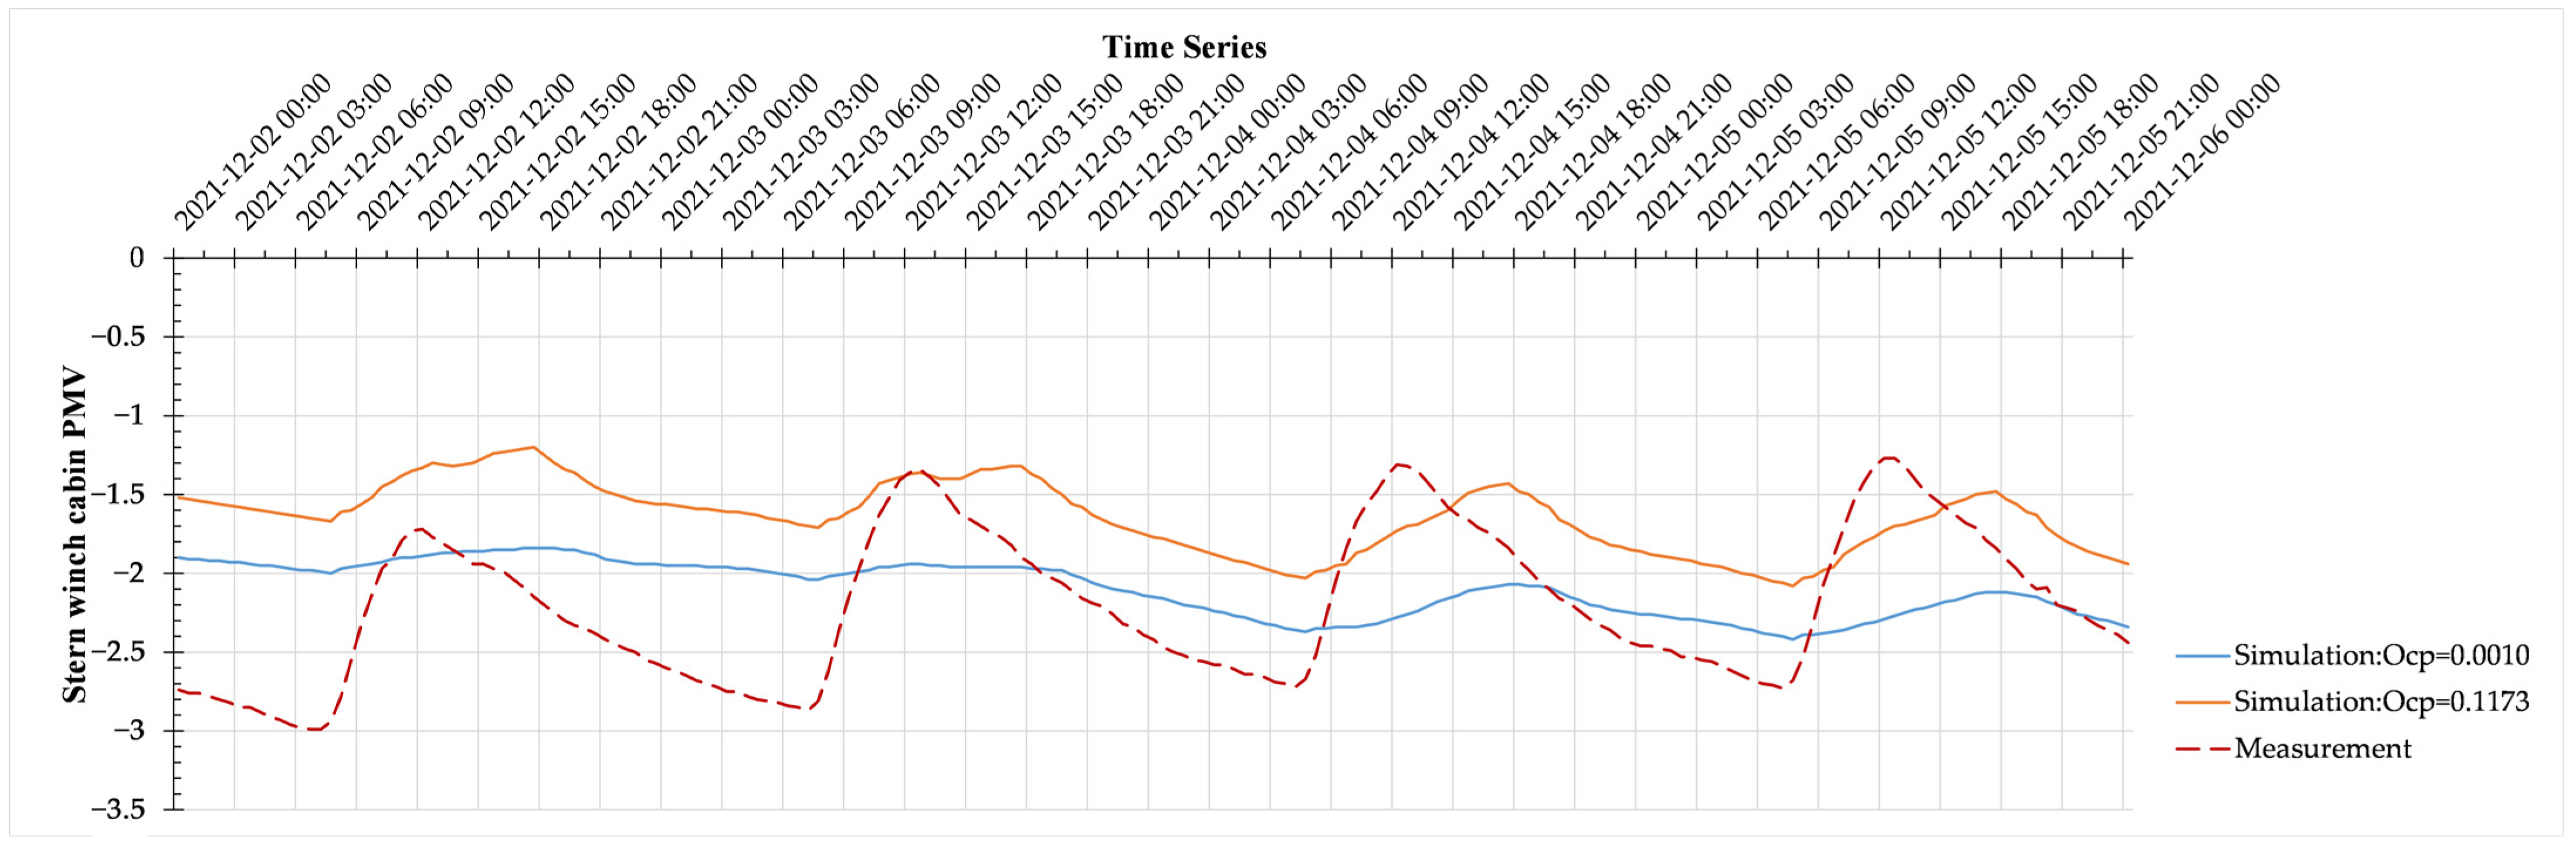
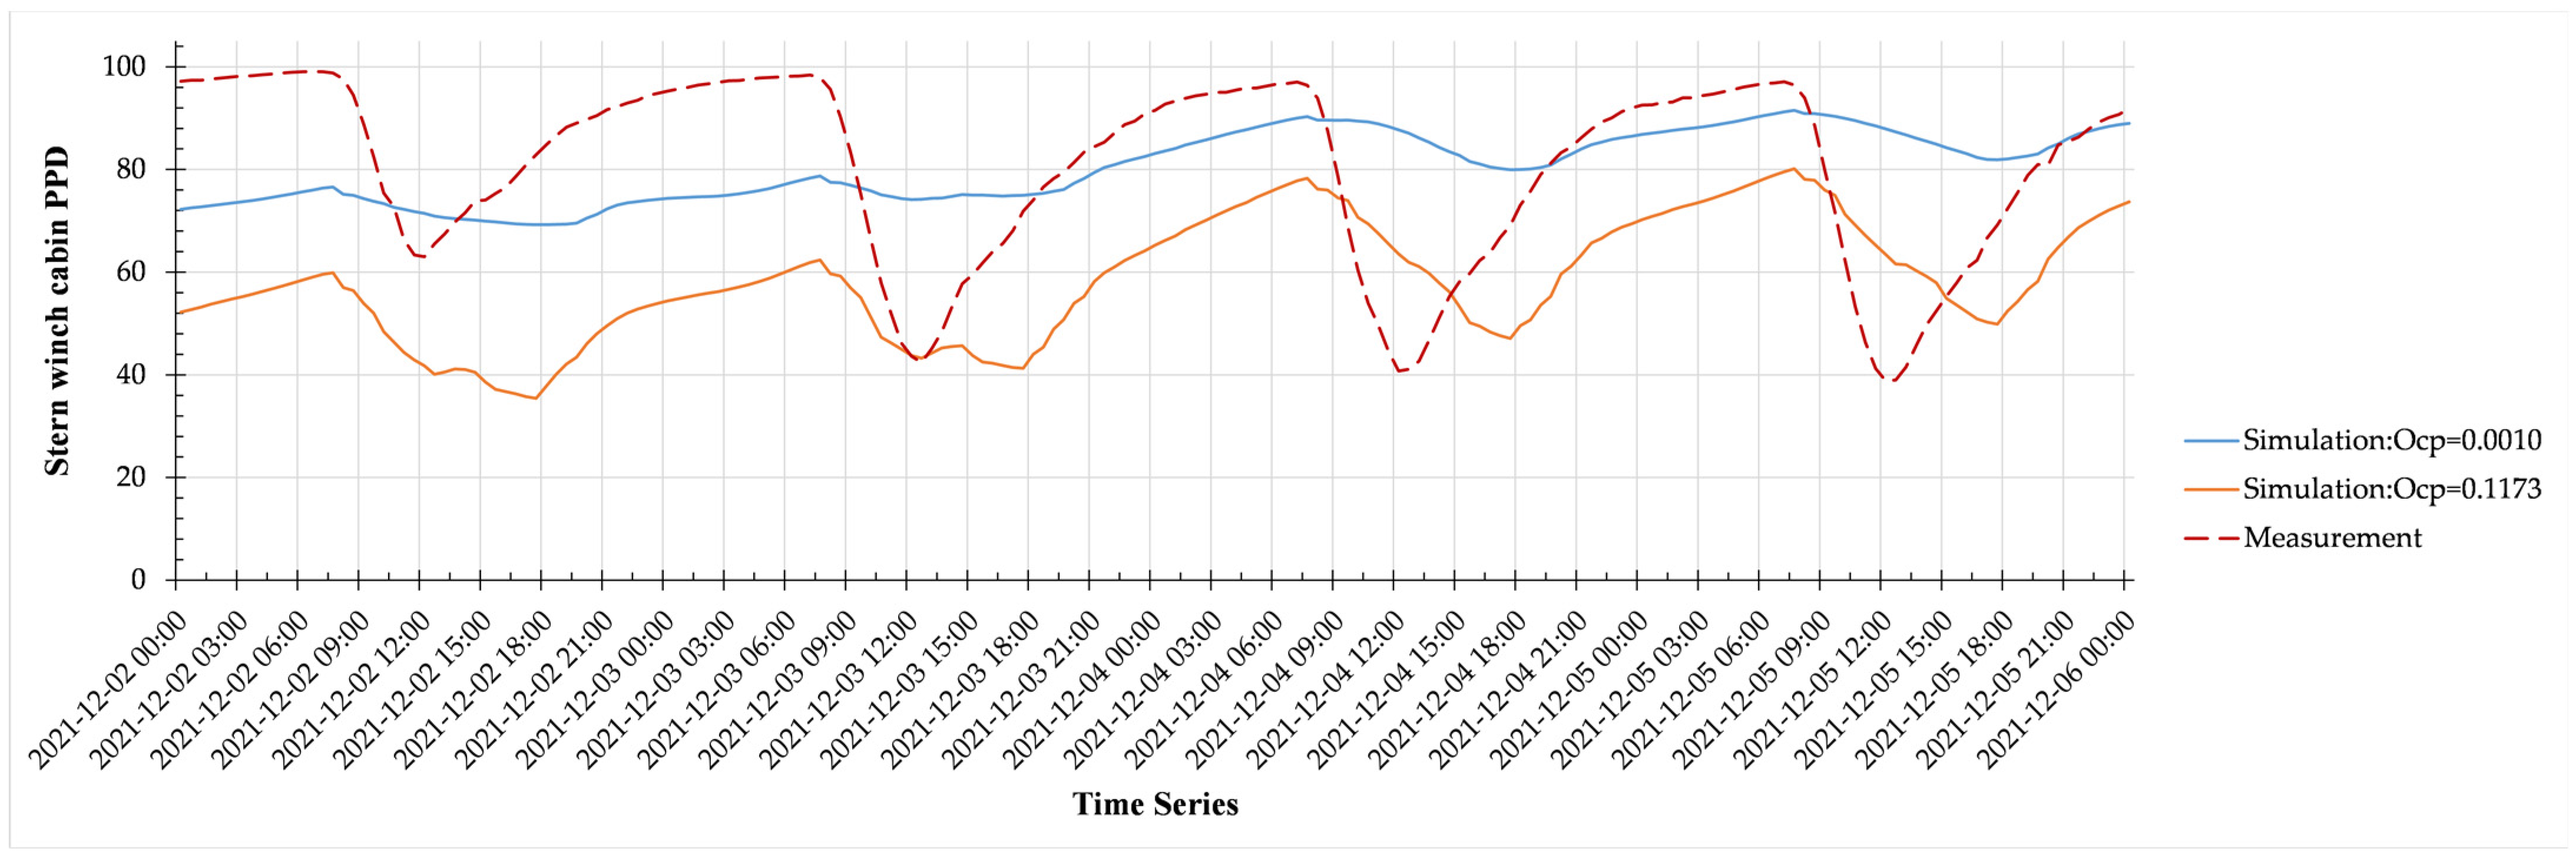
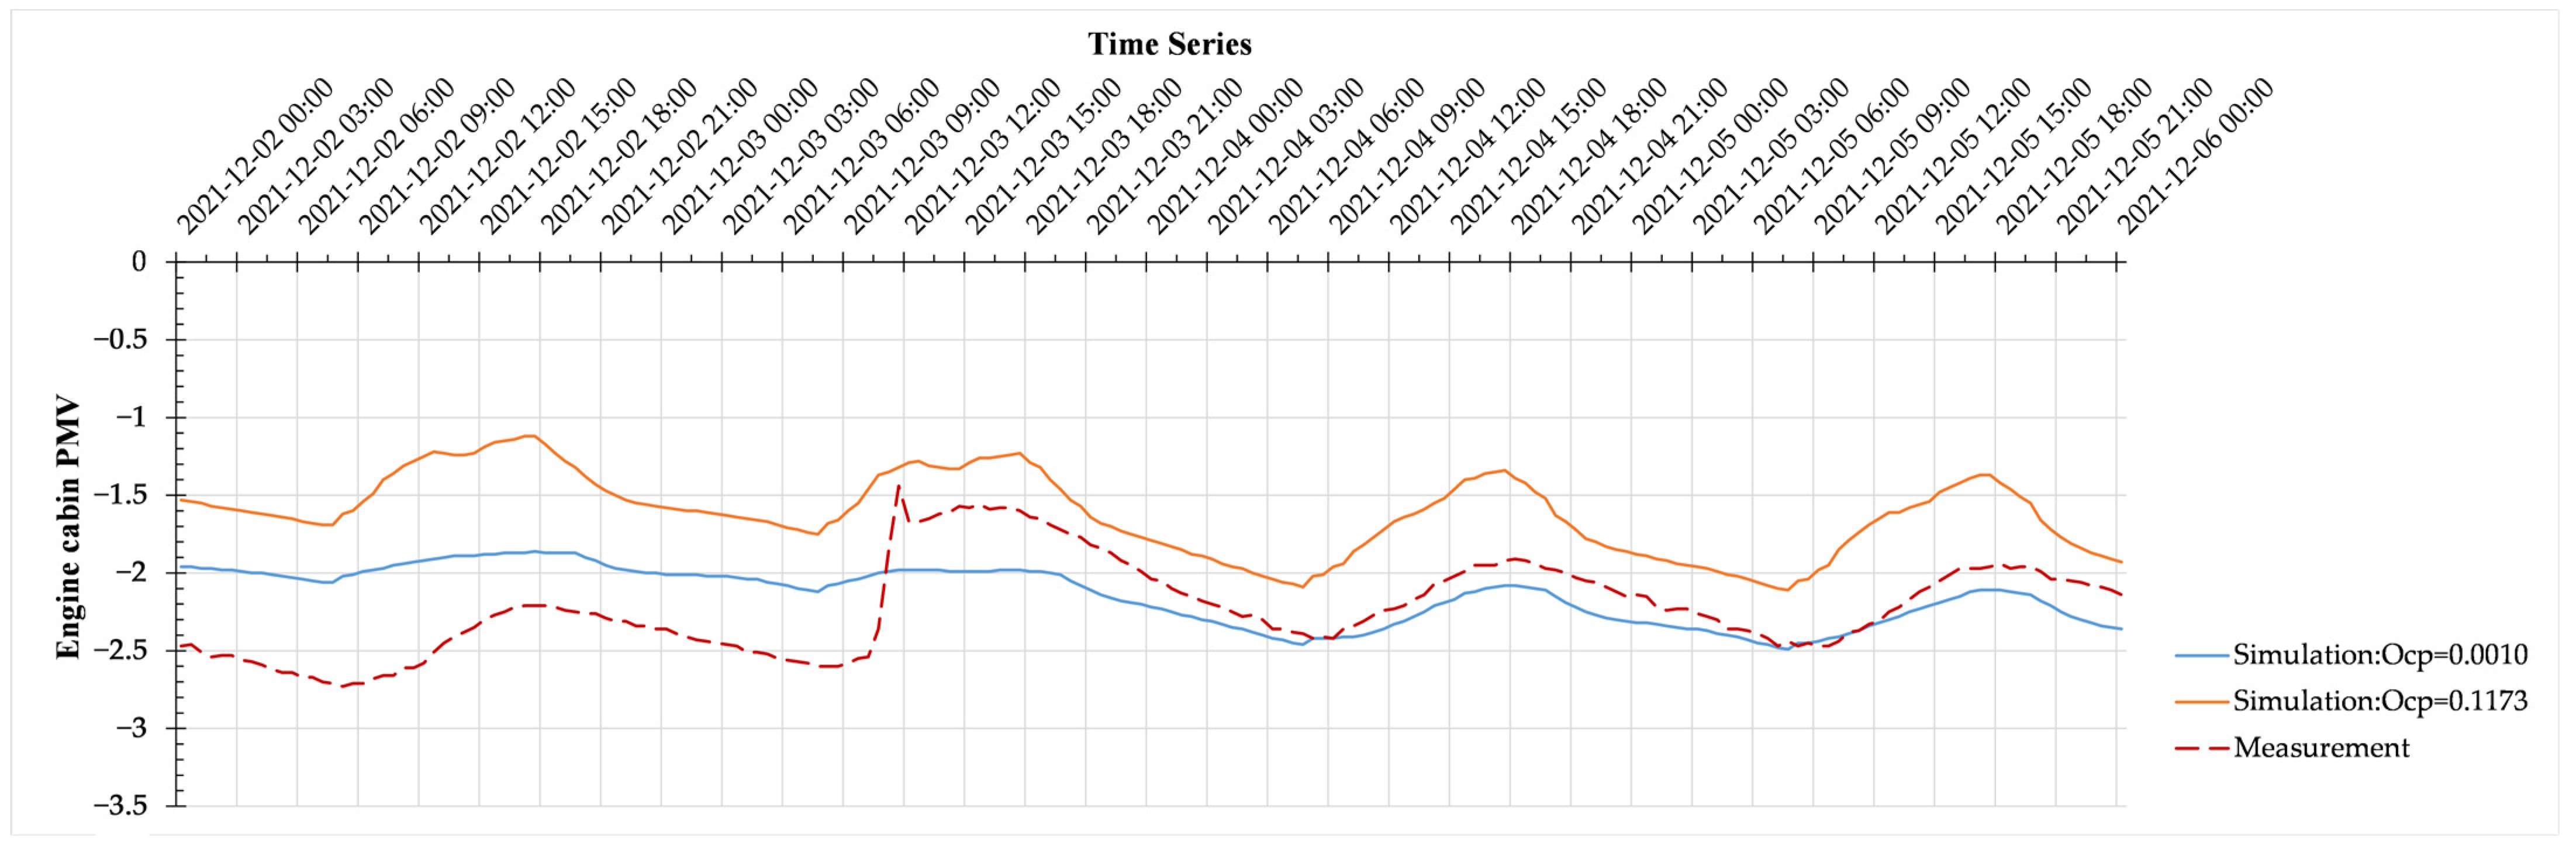
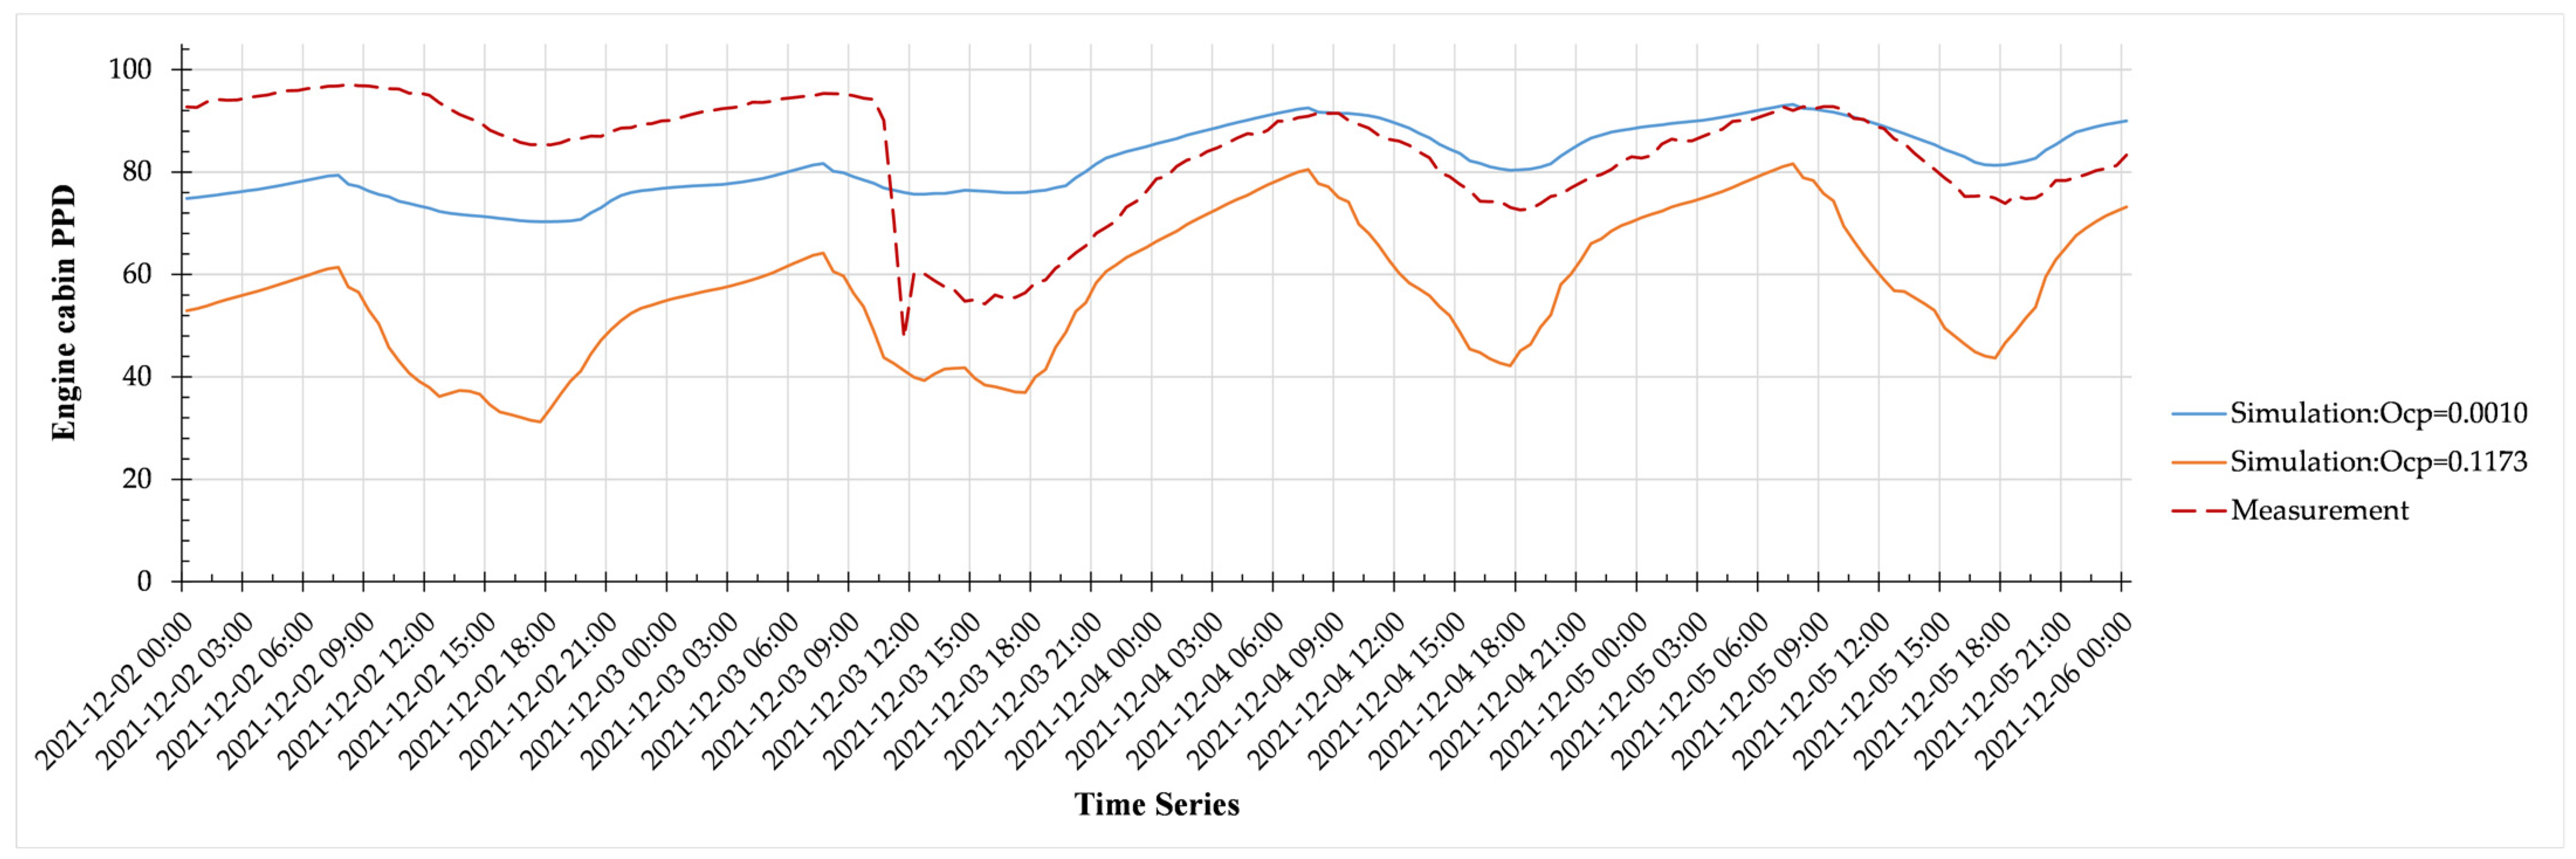
Appendix B. Comparison of Measurements in PMV-PPD Simulation for Meeting, Stern Winch, and Engine Cabins

Figure A1. Meeting cabin: predicted mean vote between 2 and 5 December 2021.
Buildings 12 01766 g0a1
Figure A2. Meeting cabin: predicted percentage dissatisfied between 2 and 5 December 2021.
Buildings 12 01766 g0a2
Figure A3. Stern winch cabin: predicted mean vote between 2 and 5 December 2021.
Buildings 12 01766 g0a3
Figure A4. Stern winch cabin: predicted percentage dissatisfied between 2 and 5 December 2021.
Buildings 12 01766 g0a4
Figure A5. Engine cabin: predicted mean vote between 2 and 5 December 2021.
Buildings 12 01766 g0a5
Figure A6. Engine cabin: predicted percentage dissatisfied between 2 and 5 December 2021.
Buildings 12 01766 g0a6

References

  1. Osterman, C.; Hult, C.; Praetorius, G. Occupational safety and health for service crew on passenger ships. Saf. Sci. 2019, 121, 403–413. [Google Scholar] [CrossRef]
  2. Rupp, R.F.; Ghisi, E. Predicting thermal comfort in office buildings in a Brazilian temperate and humid climate. Energy Build. 2017, 144, 152–166. [Google Scholar] [CrossRef]
  3. Martinez-Molina, A.; Boarin, P.; Tort-Ausina, I.; Vivancos, J.L. Post-occupancy evaluation of a historic primary school in Spain: Comparing PMV, TSV and PD for teachers’ and pupils’ thermal comfort. Build. Environ. 2017, 117, 248–259. [Google Scholar] [CrossRef]
  4. Zhang, D.; Qu, B.Y.; Liu, P.F.; An, Z.J. Comprehensive evaluation and optimization of rural space heating modes in cold areas based on PMV-PPD. Energy Build. 2021, 246, 111120. [Google Scholar] [CrossRef]
  5. Rupp, R.F.; Vasquez, N.G.; Lamberts, R. A review of human thermal comfort in the built environment. Energy Build. 2015, 105, 178–205. [Google Scholar] [CrossRef]
  6. Zare, S.; Hasheminezhad, N.; Sarebanzadeh, K.; Zolala, F.; Hemmatjo, R.; Hassanvand, D. Assessing thermal comfort in tourist attractions through objective and subjective procedures based on ISO 7730 standard: A field study. Urban Clim. 2018, 26, 1–9. [Google Scholar] [CrossRef]
  7. Kosonen, R.; Tan, F. Assessment of productivity loss in air-conditioned buildings using PMV index. Energy Build. 2004, 36, 987–993. [Google Scholar] [CrossRef]
  8. ISO7730:2006; Ergonomics of the Therma Environment. ISO: Geneva, Switzerland, 2006; p. 42.
  9. ASHRAE55; ANSI/ASHRAE Standard55, Thermal Environmental Conditions for Human Occupancy. ANSI/ASHRAE Stand; ASHRAE: Atlanta, GA, USA, 2004. [CrossRef]
  10. EN15251; Indoor Environmental Input Parameters for Design and Assessment of Energy Performance of Buildings–Addressing Indoor Air Quality, Thermal Environment, Lighting and Acoustics. European Committee for Standardization: Brussels, Belgium, 2007; Volume 3, pp. 1–57. [CrossRef]
  11. Li, B.Z.; Yao, R.M.; Wang, Q.Q.; Pan, Y.G. An introduction to the Chinese Evaluation Standard for the indoor thermal environment. Energy Build. 2014, 82, 27–36. [Google Scholar] [CrossRef]
  12. Ikeda, H.; Nakaya, T.; Nakagawa, A.; Maeda, Y. An investigation of indoor thermal environment in semi-cold region in Japan—Validity of thermal predictive indices in Nagano during the summer season. J. Build. Eng. 2020, 35, 101897. [Google Scholar] [CrossRef]
  13. Zhang, H.; Yang, R.Q.; You, S.J.; Zheng, W.D.; Zheng, X.J.; Ye, T.Z. The CPMV index for evaluating indoor thermal comfort in buildings with solar radiation. Build. Environ. 2018, 134, 1–9. [Google Scholar] [CrossRef]
  14. Nikolopoulou, M.; Steemers, K. Thermal comfort and psychological adaptation as a guide for designing urban spaces. Energy Build. 2003, 35, 95–101. [Google Scholar] [CrossRef]
  15. Fanger, P.O.; Toftum, J. Extension of the PMV model to non-air-conditioned buildings in warm climates. Energy Build. 2002, 34, 533–536. [Google Scholar] [CrossRef]
  16. Schminder, J.; Gardhagen, R. A generic simulation model for prediction of thermal conditions and human performance in cockpits. Build. Environ. 2018, 143, 120–129. [Google Scholar] [CrossRef] [Green Version]
  17. Liu, H.M.; Lian, Z.W.; Gong, Z.H.; Wang, Y.C.; Yu, G.J. Thermal comfort, vibration, and noise in Chinese ship cabin environment in winter time. Build. Environ. 2018, 135, 104–111. [Google Scholar] [CrossRef]
  18. Zhang, S.; He, W.P.; Chen, D.K.; Chu, J.J.; Fan, H.; Duan, X.S. Thermal comfort analysis based on PMV/PPD in cabins of manned submersibles. Build. Environ. 2018, 148, 668–676. [Google Scholar] [CrossRef]
  19. Chen, S.; Xu, L.; Fang, Y.; Xia, M.; Liu, Y. Numerical Simulation Analysis of Thermal Comfort in Different Arrangement of Cruise Cabin. J. Wuhan Univ. Technol. (Transp. Sci. Eng.) 2021, 45, 896–900. (In Chinese) [Google Scholar]
  20. Guo, H.S.; Aviv, D.; Loyola, M.; Teitelbaum, E.; Houchois, N.; Meggers, F. On the understanding of the mean radiant temperature within both the indoor and outdoor environment, a critical review. Renew. Sustain. Energy Rev. 2019, 117, 109207. [Google Scholar] [CrossRef]
  21. Zahid, H.; Elmansoury, O.; Yaagoubi, R. Dynamic Predicted Mean Vote: An IoT-BIM integrated approach for indoor thermal comfort optimization. Autom. Constr. 2021, 129, 103805. [Google Scholar] [CrossRef]
  22. Luo, M.H.; Wang, Z.; Brager, G.; Cao, B.; Zhu, Y.X. Indoor climate experience, migration, and thermal comfort expectation in buildings. Build. Environ. 2018, 141, 262–272. [Google Scholar] [CrossRef]
  23. Liu, H.M.; Ni, J.J.; Xing, N.; Han, H.D. An Investigation and Analysis of Indoor Environment in Air-Conditioned Chinese Ship Vessel Cabins. Indoor Built Environ. 2011, 20, 377–385. [Google Scholar] [CrossRef]
  24. Goujard, B.; Sakout, A.; Valeau, V. Acoustic comfort on board ships: An evaluation based on a questionnaire. Appl. Acoust. 2005, 66, 1063–1073. [Google Scholar] [CrossRef]
  25. Li, Y.; Geng, S.B.; Zhang, X.S.; Zhang, H. Study of thermal comfort in underground construction based on field measurements and questionnaires in China. Build. Environ. 2017, 116, 45–54. [Google Scholar] [CrossRef]
  26. Amindeldar, S.; Heidari, S.; Khalili, M. The effect of personal and microclimatic variables on outdoor thermal comfort: A field study in Tehran in cold season. Sustain. Cities Soc. 2017, 32, 153–159. [Google Scholar] [CrossRef]
  27. Rossi, F.; Cardinali, M.; Di Giuseppe, A.; Castellani, B.; Nicolini, A. Outdoor thermal comfort improvement with advanced solar awnings: Subjective and objective survey. Build. Environ. 2022, 215, 108967. [Google Scholar] [CrossRef]
  28. Ioannou, A.; Itard, L.; Agarwal, T. In-situ real time measurements of thermal comfort and comparison with the adaptive comfort theory in Dutch residential dwellings. Energy Build. 2018, 170, 229–241. [Google Scholar] [CrossRef]
  29. Alfano, F.R.D.; Olesen, B.W.; Palella, B.I.; Riccio, G. Thermal comfort: Design and assessment for energy saving. Energy Build. 2014, 81, 326–336. [Google Scholar] [CrossRef]
  30. Shaikh, P.H.; Nor, N.B.; Nallagownden, P.; Elamvazuthi, I.; Ibrahim, T. A review on optimized control systems for building energy and comfort management of smart sustainable buildings. Renew. Sustain. Energy Rev. 2014, 34, 409–429. [Google Scholar] [CrossRef]
  31. Vidhyashankar, R.; Vinze, R.; Nagarathinam, S.; Natrajan, V.K. Modelling spatial variations in thermal comfort in indoor open-plan spaces using a whole-building simulation tool. J. Build. Eng. 2021, 46, 103727. [Google Scholar] [CrossRef]
  32. Nowak-Dzieszko, K.; Rojewska-Warchał, M. Influence of the Balcony Glazing Construction on Thermal Comfort of Apartments in Retrofitted Large Panel Buildings. Procedia Eng. 2015, 108, 481–487. [Google Scholar] [CrossRef]
  33. Hongmin, L. Simulation and Optimization of Indoor Thermal Environment in a Ship Air-conditioning System. Procedia Environ. Sci. 2011, 11, 1055–1063. [Google Scholar] [CrossRef] [Green Version]
  34. Zhou, Y.; Gao, W.; Yang, C.; Shen, Y. Exploratory analysis of the influence of landscape patterns on lake cooling effect in Wuhan, China. Urban Clim. 2021, 39, 100969. [Google Scholar] [CrossRef]
  35. Fanger, P.O. Thermal Comfort: Analysis and Applications in Environmental Engineering; Danish Technical Press: Copenhagen, Denmark, 1970. [Google Scholar]
  36. Enescu, D. A review of thermal comfort models and indicators for indoor environments. Renew. Sustain. Energy Rev. 2017, 79, 1353–1379. [Google Scholar] [CrossRef]
  37. Frontczak, M.; Wargocki, P. Literature survey on how different factors influence human comfort in indoor environments. Build. Environ. 2011, 46, 922–937. [Google Scholar] [CrossRef]
  38. Vanos, J.K.; Rykaczewski, K.; Middel, A.; Vecellio, D.J.; Brown, R.D.; Gillespie, T.J. Improved methods for estimating mean radiant temperature in hot and sunny outdoor settings. Int. J. Biometeorol. 2021, 65, 967–983. [Google Scholar] [CrossRef] [PubMed]
  39. Kuehn, L.A.; Stubbs, R.A.; Weaver, R.S. Theory of the globe thermometer. J. Appl. Physiol. 1970, 29, 750–757. [Google Scholar] [CrossRef]
  40. ASHRAE. Handbook Fundamentals; ASHRAE: Atlanta, GA, USA, 2017. [Google Scholar]
  41. Ashrae Standard 169-2020; Thermal Environmental Conditions for Human Occupancy. American Society of Heating, Refrigerating and Air-Conditioning Engineers: Atlanta, GA, USA, 2020.
  42. Zhang, Y.; Zhou, X.; Zheng, Z.; Oladokun, M.O.; Fang, Z. Experimental investigation into the effects of different metabolic rates of body movement on thermal comfort. Build. Environ. 2019, 168, 106489. [Google Scholar] [CrossRef]
  43. Hoyt, T.; Schiavon, S.; Tartarini, F.; Cheung, T.; Steinfeld, K.; Piccioli, A.; Moon, D. CBE Thermal Comfort Tool; Center for the Built Environment, University of California Berkeley: Berkeley, CA, USA, 2019. [Google Scholar]
  44. Diler, Y.; Turhan, C.; Durmuş Arsan, Z.; Gökçen Akkurt, G. Thermal comfort analysis of historical mosques. Case study: The Ulu mosque, Manisa, Turkey. Energy Build. 2021, 252, 111441. [Google Scholar] [CrossRef]
  45. Liu, G.; Wang, Z.; Li, C.; Hu, S.; Chen, X.; Liang, P. Heat exchange character and thermal comfort of young people in the building with solar radiation in winter. Build. Environ. 2020, 179, 106937. [Google Scholar] [CrossRef]
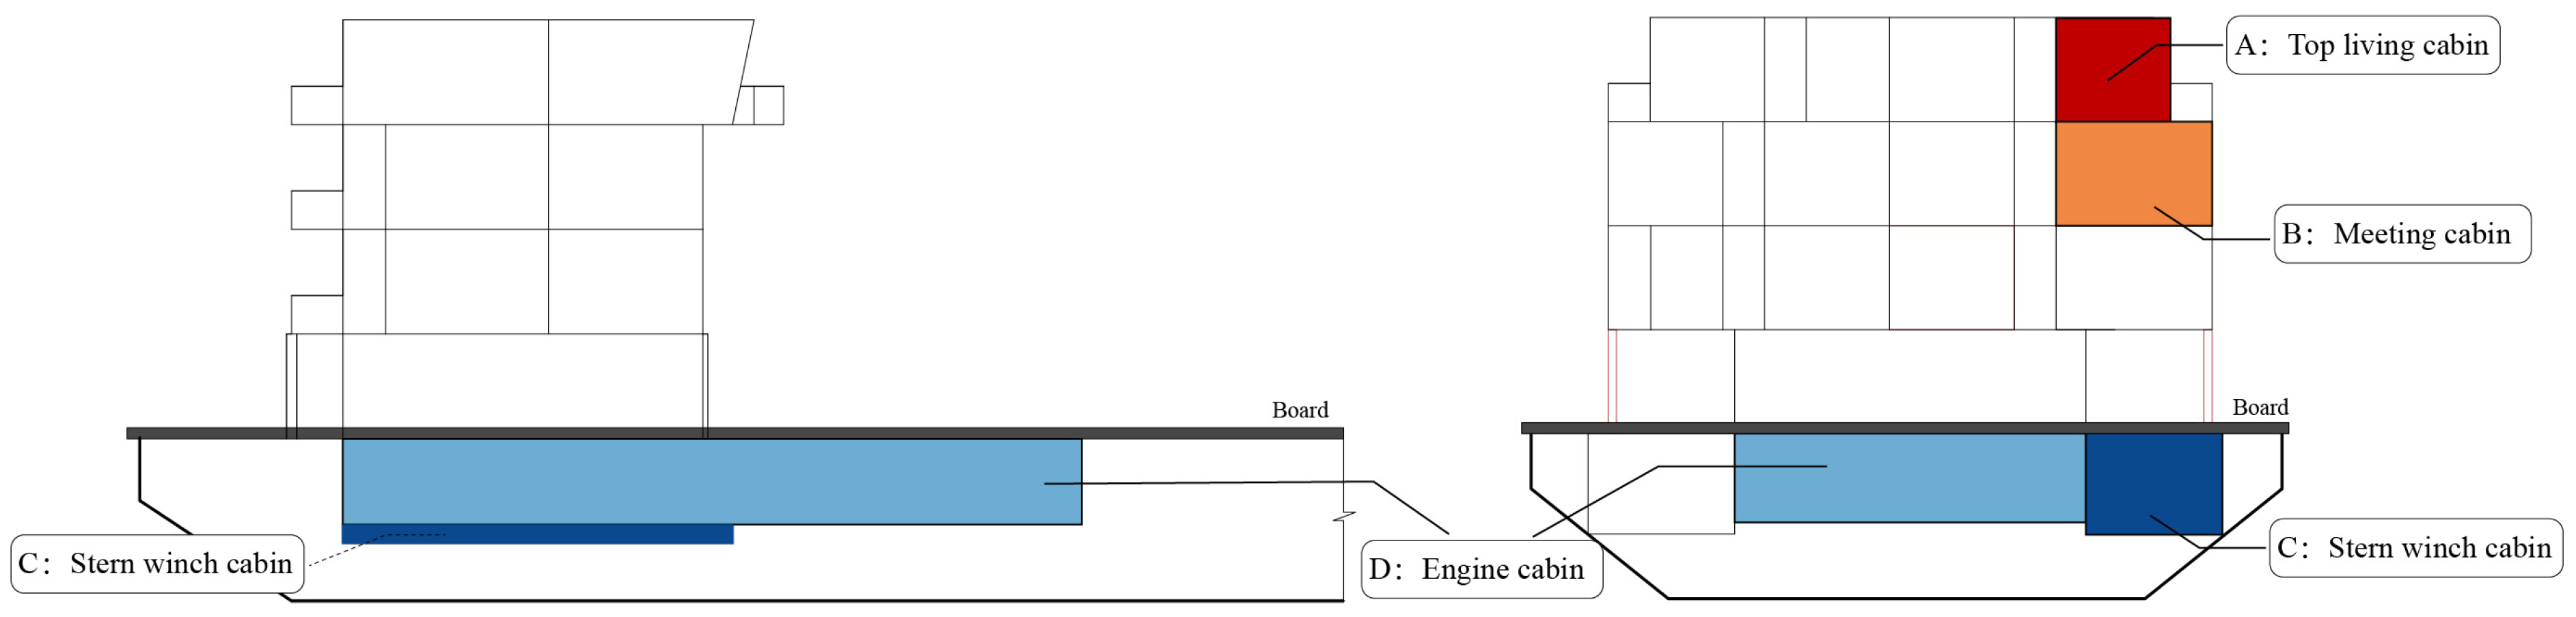
Figure 1. Satellite image of Wuhan City (source of base map: Resource Satellite 3).
Buildings 12 01766 g001
Figure 2. Changyan no. 10 ship.
Buildings 12 01766 g002
Figure 3. Cabin profile map of ship.
Buildings 12 01766 g003
Figure 4. Bulkhead and deck construction. (a) Bulkhead construction, (b) Bulkhead profiles, (c) Deck construction.
Buildings 12 01766 g004
Figure 5. Data collection scenario in the ship. (a) Top living cabin, (b) meeting cabin, (c) stern winch cabin, (d) engine cabin.
Buildings 12 01766 g005
Figure 6. Simulation model of the ship.
Buildings 12 01766 g006
Figure 7. Temperatures in the ship between 29 July and 4 August 2021.
Buildings 12 01766 g007
Figure 8. Relative humidity in the ship between 29 July and 4 August 2021.
Buildings 12 01766 g008
Figure 9. Questionnaire for activities and thermal tolerance.
Buildings 12 01766 g009
Figure 10. Questionnaire for departments and thermal sensitivity.
Buildings 12 01766 g010
Figure 11. Dry-bulb temperatures in the ship on (a) 4, (b) 5, and (c) 6 October 2021.
Buildings 12 01766 g011
Figure 12. Dry-bulb temperatures in the ship from 2 to 5 December 2021.
Buildings 12 01766 g012
Figure 13. Black-globe temperatures in the ship from 2 to 5 December 2021.
Buildings 12 01766 g013
Figure 14. Relative humidity in the ship on (a) 4, (b) 5, and (c) 6 October 2021.
Buildings 12 01766 g014
Figure 15. Relative humidity in the ship between 2 and 5 December 2021.
Buildings 12 01766 g015
Figure 16. Mean radiant temperature in the ship between 2 and 5 December 2021.
Buildings 12 01766 g016
Figure 17. Predicted mean vote in the ship between 2 and 5 December 2021.
Buildings 12 01766 g017
Figure 18. Predicted percentage dissatisfied in the ship between 2 and 5 December 2021.
Buildings 12 01766 g018
Figure 19. Thermal comfort frequency in the ship.
Buildings 12 01766 g019
Figure 20. Top living cabin: predicted mean vote between 2 and 5 December 2021.
Buildings 12 01766 g020
Figure 21. Top living cabin: predicted percentage dissatisfied between 2 and 5 December 2021.
Buildings 12 01766 g021
Figure 22. Simulation of PMV in the ship between 2 and 5 December 2021.
Buildings 12 01766 g022
Figure 23. Simulation of PPD in the ship between 2 and 5 December 2021.
Buildings 12 01766 g023
Figure 24. Thermal images of the ship’s structure. (a) Bottom of deck, (b) Bottom of deck building, (c) Diagram of the thermal imaging area.
Buildings 12 01766 g024
Table 1. Details of cabins.
LabelCabinFunctionRoom Size
ATop Living CabinLivingBuildings 12 01766 i001
BMeeting CabinWorkBuildings 12 01766 i002
CStern Winch CabinStoreBuildings 12 01766 i003
DEngine CabinWorkBuildings 12 01766 i004
Table 2. Technical specifications of measurement and data collection devices.
Technical Parameter
Name and ModelMeasured ParametersRangePrecisionDistinguishability
Qingping Temp and RH Dry-bulb temperature
Relative humidity
−10~+50 °C
0~100%RH
±0.5 °C
±2.5%RH
0.1 °C
0.1%RH
Swema3000-Black-Bulb ThermometerBlack globe temperature−10~+50 °C±0.3 °C0.1 °C
0.1%RH
Testo405v1-Thermal anemometerWind speed0~10 m/s±0.1 m/s (0~+2 m/s)0.01 m/s
Testo 869-Thermal imagerThermal image−20~280 °C±2 °C0.1 °C
Table 3. DesignBuilder parameter settings.
DesignBuilder parameters
LocationLocation TemplateWuhan
Exposure to wind3-Exposed
Ground TextureFlowing water
ActivityActivity TemplateDepending on the room
Metabolic Seated quiet (1.00 met)
ClothingWinter1.00 clo
Summer0.50 clo
ConstructionWalls U-value0.500 W/m2-K
Roof U-valueTop living cabin0.460 W/m2-K
Meeting cabin
Stern winch cabin0.600 W/m2-K
Engine cabin
Floor U-value0.460 W/m2-K
Calculation OptionsDataDec2-Dec5
Output Intervals for ReportingSub-hourly
Table 4. Questionnaire for activities and thermal tolerance.
(Q7) The Level of Activity on Board the Ship?
TitleOptionActive, Often Requiring Walking or Limb MovementsModerately Active, with Occasional Physical Movements RequiredQuiet and Fixed, No Need for Frequent ActivityTotalp
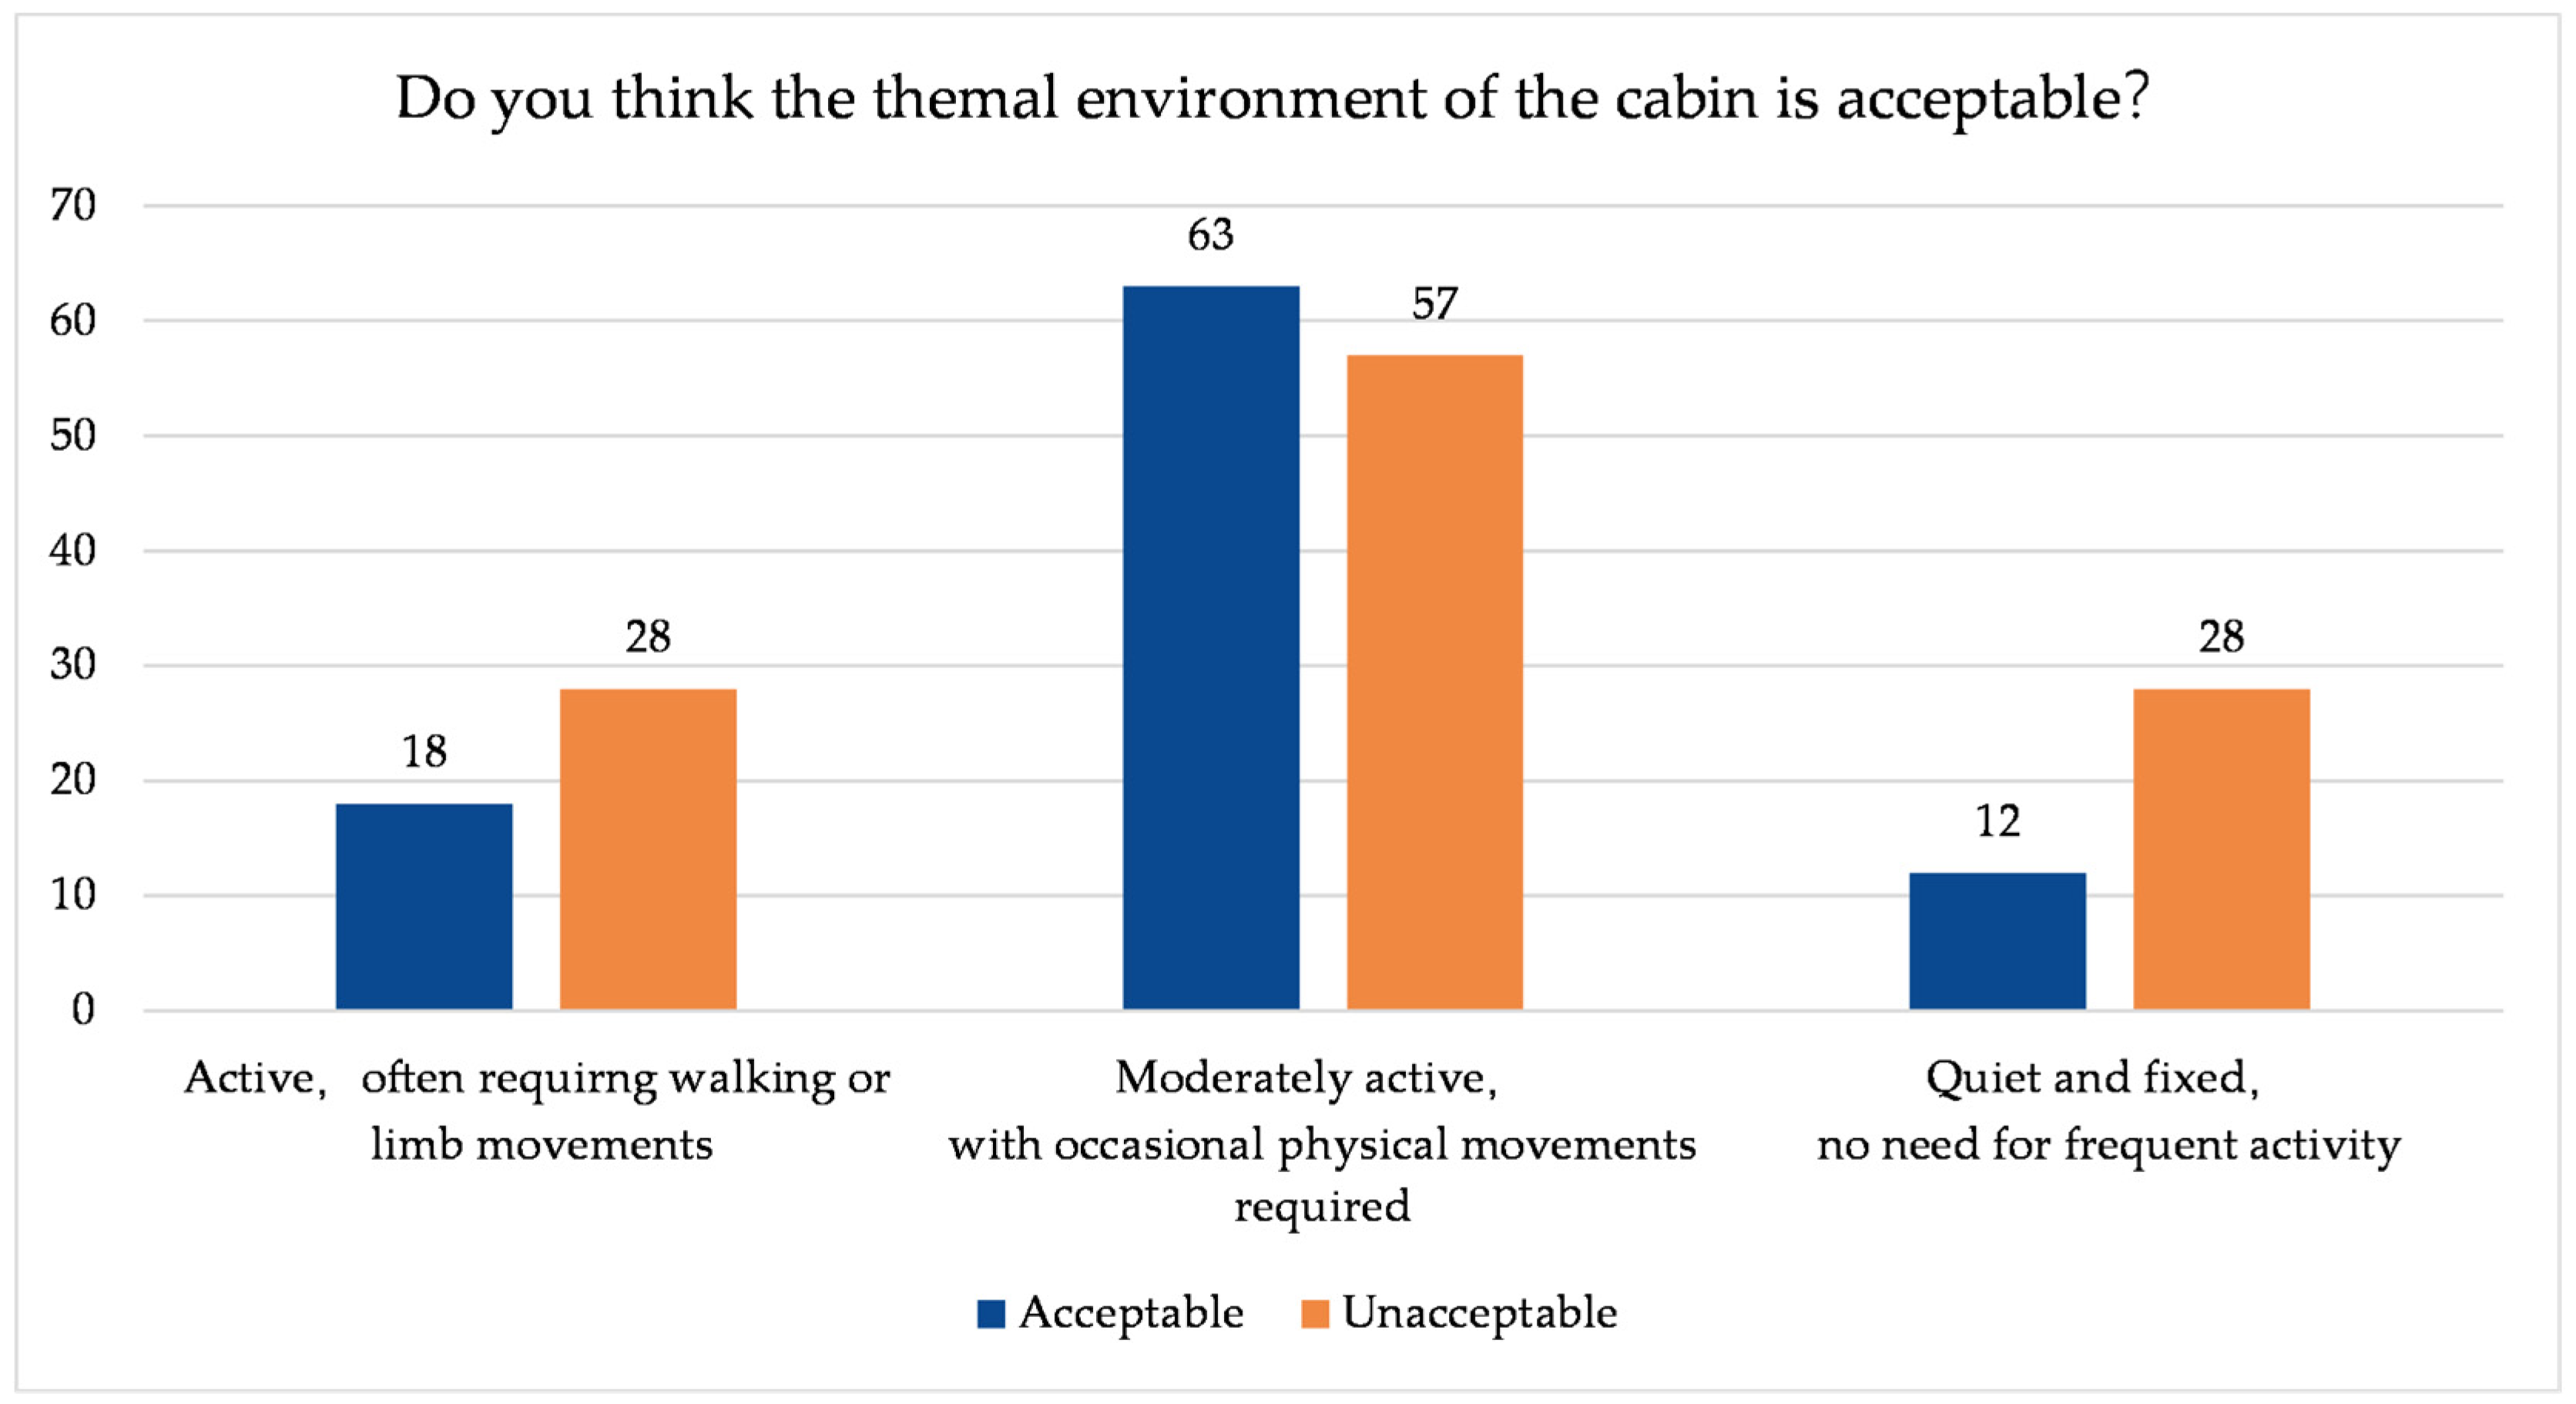
(Q16) Do you think the thermal environment of the cabin (without air conditioning) is acceptable?Acceptable18 (39.13%)63 (52.50%)12 (30.00%)93 (45.15%)0.030 *
Unacceptable28 (60.87%)57 (47.50%)28 (70.00%)113 (54.85%)
Total4612040206
* p < 0.05
Table 5. Questionnaire for departments and thermal sensitivity.
(Q5) The Subordinate Department on Board the Ship?
TitleOptionDeck DepartmentEngine DepartmentOther SectorsHad Experience on Board,
but Not as a Crew Member
Totalp
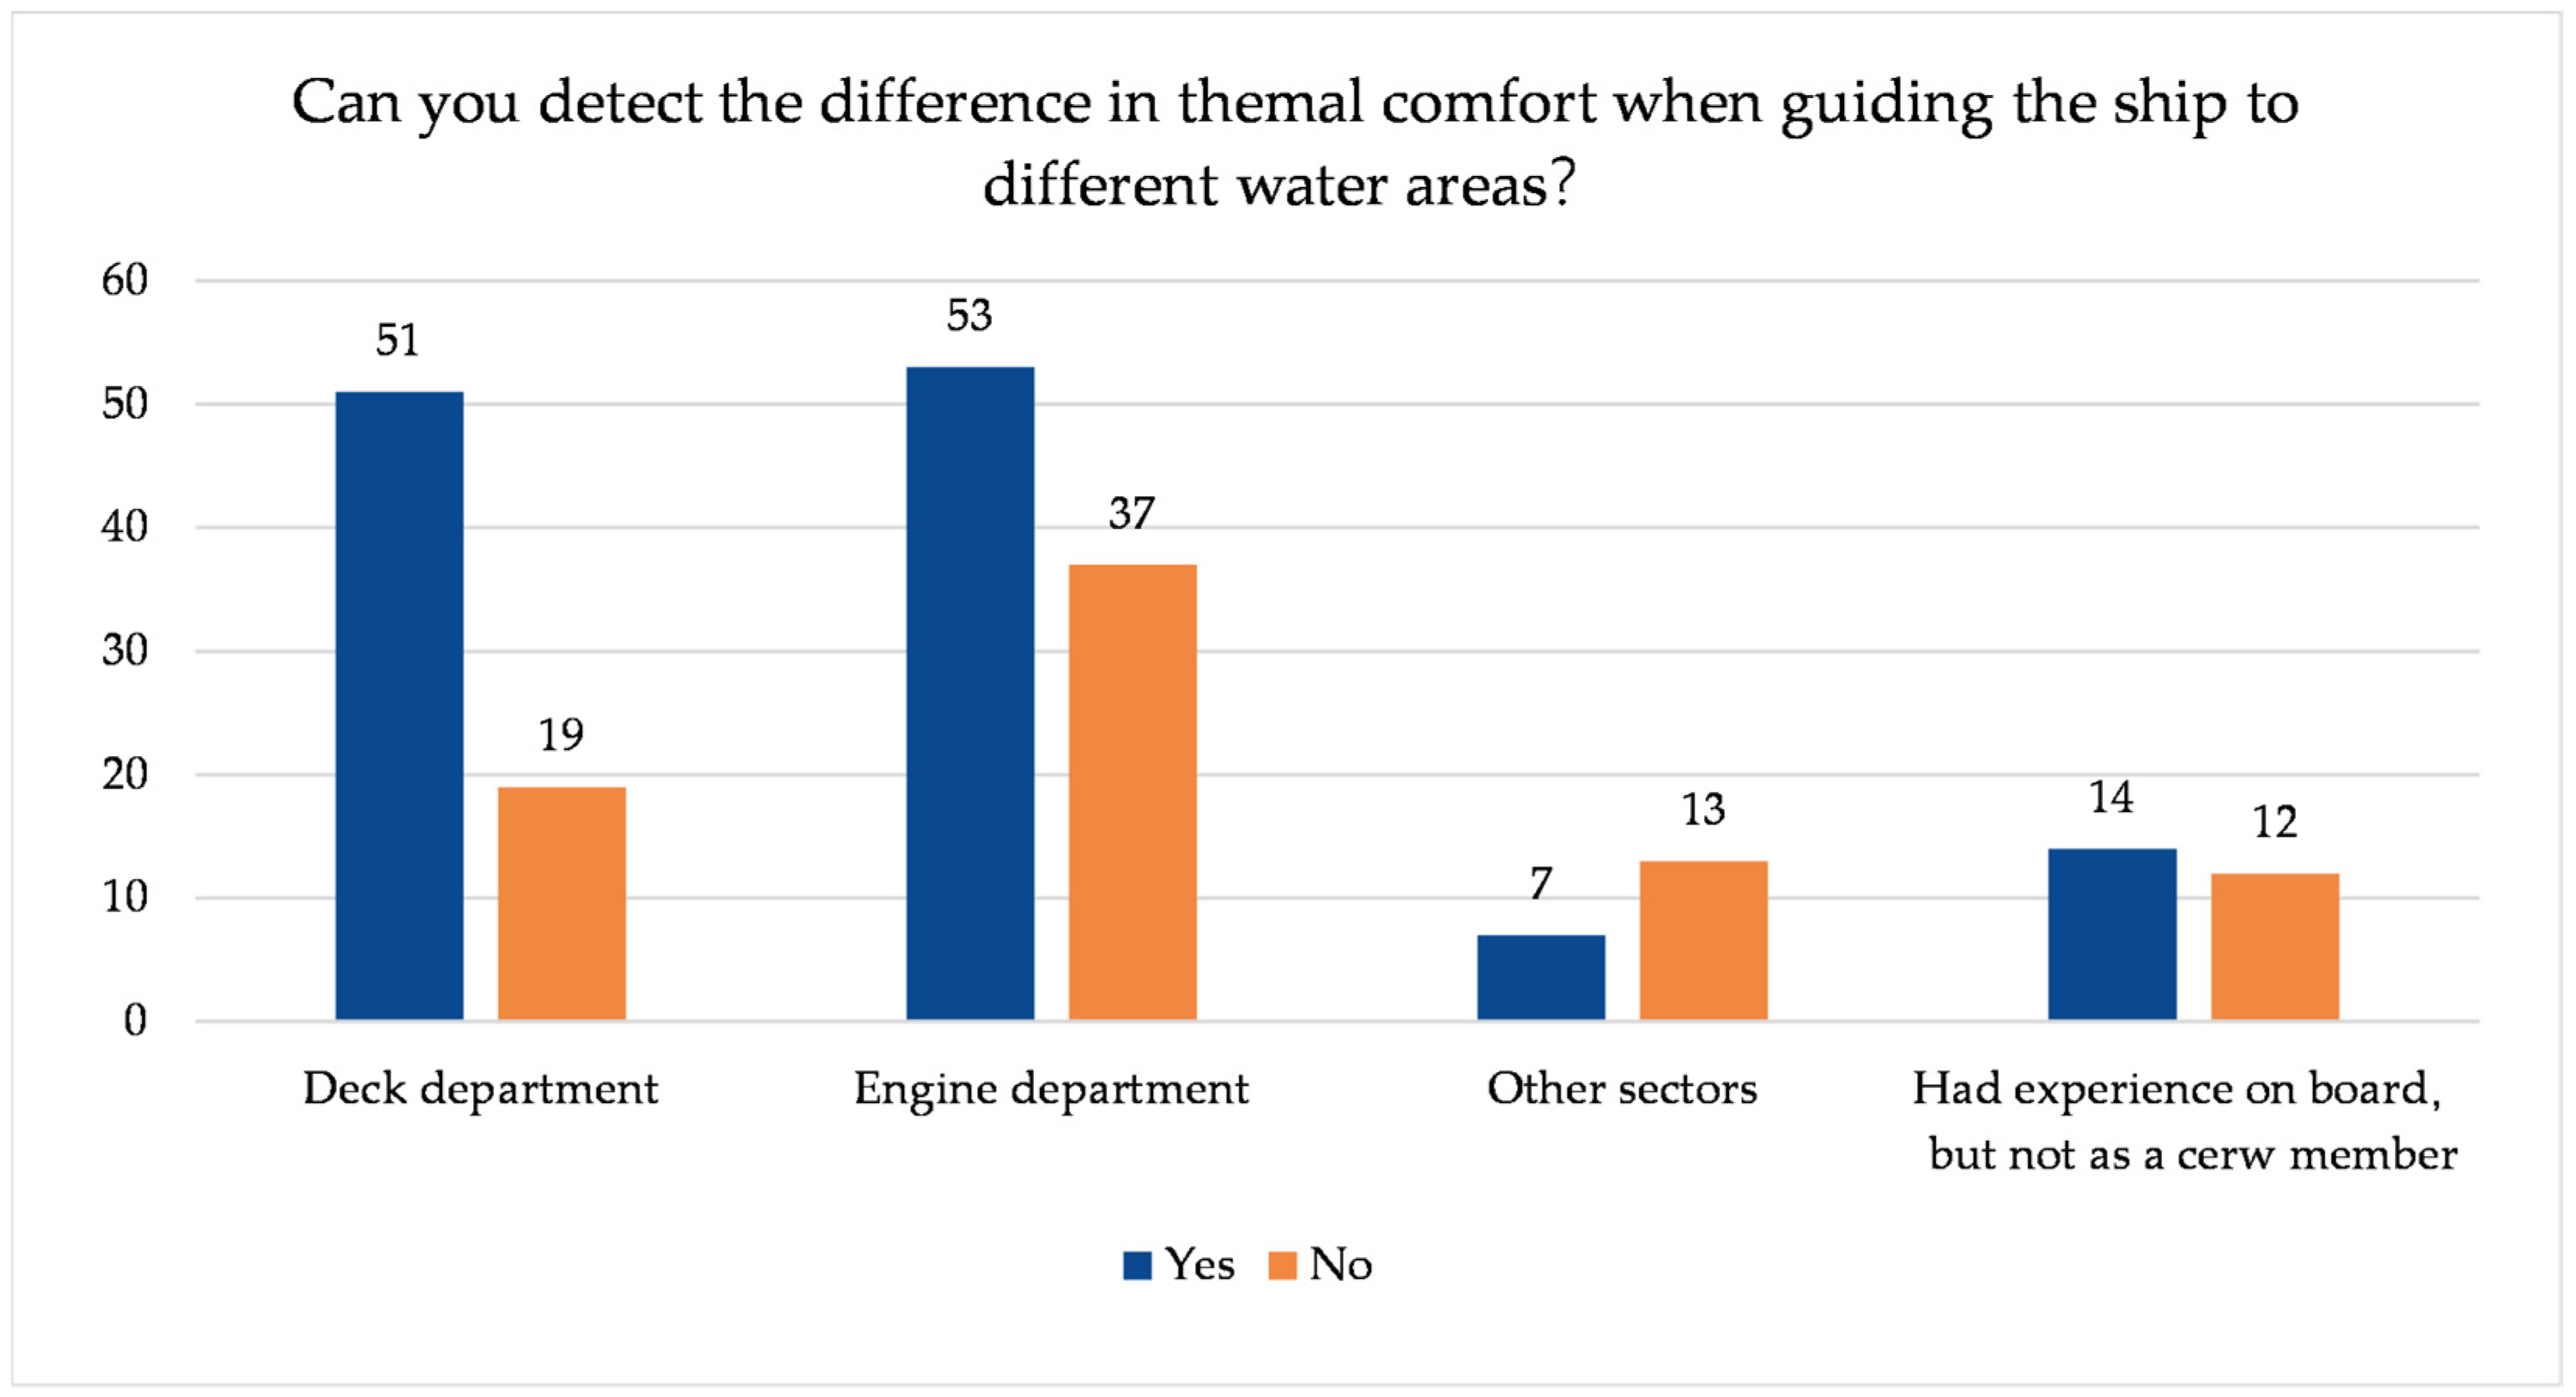
(Q18) Can you detect the difference in
thermal comfort when guiding the ship to
different water areas?
Yes51
(72.86%)
53
(58.89%)
7
(35.00%)
14
(53.85%)
125
(60.68%)
0.015 *
No19
(27.14%)
37
(41.11%)
13
(65.00%)
12
(46.15%)
81
(39.32%)
Total70902026206
* p < 0.05
Publisher’s Note: MDPI stays neutral with regard to jurisdictional claims in published maps and institutional affiliations.

