Article

Climate Change Performance of nZEB Buildings

by
Germán Ramos Ruiz
1,* and
Alba Olloqui del Olmo
2
1
Department of Building Construction, Services and Structures, School of Architecture, Universidad de Navarra, 31009 Pamplona, Spain
2
Marta González Arquitectos S.L., 28043 Madrid, Spain
*
Author to whom correspondence should be addressed.
Buildings 2022, 12(10), 1755; https://doi.org/10.3390/buildings12101755
Submission received: 23 September 2022 / Revised: 13 October 2022 / Accepted: 15 October 2022 / Published: 20 October 2022
(This article belongs to the Special Issue Building Energy-Saving Technology)

Abstract

:
Buildings are one of the key factors in working towards a low-carbon economy to help mitigate climate change. For this reason, many of the current regulations aim to reduce their consumption and increase their efficiency, as is the case in the European Union with the Energy Performance of Buildings Directive (EPBD). Terms such as nearly zero-energy buildings (nZEB) or zero-emission buildings (ZEB) are increasingly used. However, these terms and regulations focus on energy and emissions, ignoring user comfort. This research shows the performance of these buildings in the face of climate change, as their strengths are not limited to energy consumption or emissions, but also to improving user comfort. By examining the compliance of a real semi-detached house with the different Spanish energy regulations (NBE-CTE 79, CTE-DB HE 2013 and CTE-DB HE 2019), its performance in terms of energy and comfort in different future scenarios defined by the Intergovernmental Panel on Climate Change (IPCC) is evaluated. The results show that the building with nZEB criteria (CTE-DB-HE 2019) reduces its energy consumption by an average of 84.36% compared to the other two energy standards. In terms of comfort, measured according to the Fanger criteria (steady state model), the hours throughout the year in the “neutral” thermal sensation category are similar; however, the hours in the “slightly cool” category are reduced by 57%, improving by up to eight times the “slightly warm” category. The nZEB building proves to be more resilient to climate change by mitigating and homogenizing its response to climatic variations.

1. Introduction

High temperatures, drought and wildfires, availability of fresh water, floods, sea-level rise and coastal areas, etc. are some of the natural consequences of climate change [1]. Unfortunately, these are common words today, which is why there is global concern about climate change. Since the entry into force of the Paris Agreement, countries have pledged to take action to mitigate this situation. The goal is to reduce CO2 emissions to hold “the increase in the global average temperature to well below 2 C above preindustrial levels and pursuing efforts to limit the temperature increase to 1.5 C above preindustrial levels” [2,3]. In the case of the European Union, the objective is to cut emissions by at least 55% by 2030 compared to 1990 levels, with an ultimate goal of reaching climate neutrality by 2050. This requires action in all sectors of the economy in a balanced and fair manner to preserve the EU’s competitiveness. For these reasons, the European Commission announced in December 2019 the European Green Deal as its roadmap to achieving EU climate neutrality by 2050 [4]. This document emphasizes the importance of buildings, since their construction, use and renovation require large amounts of energy and resources, being responsible for 40% of the energy consumed. In fact, in order to achieve these objectives, the European Commission estimates that existing buildings require an annual renovation rate twice as high as the current one (0.4–1.2%).
This roadmap includes among its documents the Energy Performance of Buildings Directive (EPBD). Its initial objectives (2002) [5] were the creation of a general framework for an energy calculation methodology for buildings, the application of minimum requirements for new buildings and for those undergoing major renovations, the implementation of energy performance certificates and the need for an inspection of HVAC systems in buildings older than 15 years. Subsequently, there was a recast (2010) [6], the “20/20/20” directive, the objective of which was to reduce energy consumption by 20%, increase the energy efficiency of HVAC systems by 20% and increase the use of renewable energies by 20% by 2020. In this version, the term nearly Zero Energy Building (nZEB) started to be used. Its initial definition was: “a building that has a very high energy performance, (...). The nearly zero or very low amount of energy required should be covered to a very significant extent by energy from renewable sources, including energy from renewable sources produced on-site or nearby”. Then, in 2018 [7], there was an amendment emphasizing the need for a progressive “transformation of existing buildings into nearly zero-energy buildings, in particular by an increase in deep renovations” and Member States were encouraged to provide guidelines and outline measures to achieve these goals on an equal basis for all citizens.
Currently, there is a proposed recast of the EBPD (2021) [8], which qualifies the definition of the term nearly Zero Energy Building, emphasizing that nZEB buildings require, to a significant extent, to be covered by renewable energy, rather than should be. As can be seen, the definition of the term nZEB is not so straightforward due to both economic and building design implications [9,10]. Many aspects remain to be defined, for example, the frequency with which the energy balance of the building should be calculated in order to take into account renewable energies. What is correct, an annual, monthly or hourly energy balance? [11,12]. In the case of dwellings with a Mediterranean climate, a zero annual energy balance may be easy to achieve due to the high energy generation that can be obtained in summer, but if the balance is considered on a monthly basis, it is difficult to achieve a zero energy balance in the winter months. This problem can be overcome if it is possible to share energy with other buildings throughout the year [13].
EU Member States should regularly monitor compliance with this Directive and are obliged to submit a report every four years to the Commission, but it is up to the Member States to define how to achieve these objectives. The best way is through the mandatory building regulations of each country , in particular those related to energy savings. In the case of Spain, the starting point is the energy code NBE-CT 79 of 1979 (“Norma Básica de la Edificación Condiciones Térmicas de los edificios”) [14] , which was updated in 2006 with the technical building code CTE-DB-HE (“Código Técnico de la Edificación-Documento Básico-Ahorro de Energía”) [15] . This standard has been updated several times over the years as building requirements have increased. In 2017, this document defined a nearly zero energy consumption building—similar to nZEBs—as a building that meets the regulatory requirements established for new buildings in the CTE [16]. Fortunately, the requirements have been increasing in the following updates, the last one being CTE-DB HE 2019, which defines requirements close to the passive house, and approaches the definition of nZEB established by the EPBD directive [17].
There are several studies that analyze the savings potential of nZEB buildings based on the Spanish technical building code, such as the one by Cerezo-Narváez et al. that studied the impact of nZEB buildings in southern Spain, where energy savings of 69% to 127% are achieved, and a reduction in carbon dioxide emissions of 65% to 118% [18]; or the one conducted by García-Ballano et al. in which, using a geographic information system (GIS) with data of the transmittance of buildings, they delimit priority areas to increase the impact of European funds for the improvement of buildings [19].
In general, when we refer to an nZEB building, we are considering a building with an energy balance close to zero; however, there are other aspects to take into account in buildings, such as user response and their ability to create their own operating profiles and specify their comfort conditions [20]. This aspect, as Aste et al. point out [21], is one of the factors responsible for the energy performance gap between energy models and reality. Buildings are designed according to energy regulations—based on reducing energy consumption—but when the building is used, users demand comfort and their changes in the use of the building alter its energy consumption.
The main objective of this research is to show the climate change performance of nZEB buildings, in particular of buildings considered nZEB by Spanish energy regulations. This behavior will be analyzed from two approaches: energy consumption and user comfort. The correlation of both aspects, taking into account climate change, allows us to know the advantages and disadvantages of this type of building so that they can be useful for designers, architects, engineers, etc., as well as for users and investors. There are quite a few studies that deal with nZEB buildings and their energy or comfort performance; some even deal with both topics at the same time, but none has been found that deals with both topics and focuses on the performance that this type of building has under climate change.
Regarding studies related to nZEB buildings and their energy consumption, there are examples that have studied from residential buildings [22] to university campuses [23]. D’Agostino et al. analyze the impact of the climate zone in which the building is located by studying eight different locations in the European Union [24]. Ascione et al. analyzed the resilience of nZEB buildings against climate change, highlighting that, in the future, the energy demand for heating or cooling is likely to increase due to thermal discomfort [25].
From research analyzing the comfort of nZEB buildings, all under real weather conditions, the main trend is the risk of overheating that occurs during free oscillation periods when the HVAC system is off [26,27]. Yang et al. highlight in their review of the implications of building energy consumption on user comfort [28] that the risk of the overheating of buildings whose cooling is based on natural ventilation is even greater in the context of climate change. In this regard, there is some resistance to include comfort limits in the definitions of nZEB buildings, as Attia et al. highlight: “Indoor environmental quality requirements regarding discomfort risk and mechanical ventilation are not well developed in most nZEB national plans”. The fact is that energy savings and comfort limits are opposing objectives, as Guillén-Lambea et al. explain: “setting the thermal comfort parameters for a nZEB is a big challenge because the parameters must provide adequate indoor thermal conditions while at the same time guaranteeing the sustainability of buildings”.
There are two main approaches to analyzing user comfort: the steady state model or heat balance and the adaptive comfort model. The first is based on the studies conducted by Fanger in the 1970s [29,30], in which he proposes two indices related to the perception of each user: the predicted mean vote index (PMV) and the predicted percentage of dissatisfied index (PPD); and classifies the indoor environment according to a scale that predicts the thermal sensation that users will have. It is the basis for UNE-EN ISO 7730:2006 [31] and ASHRAE 55-1992 [32]. The second model is based on the user’s thermal sensation and their ability to adapt according to the ventilation and relative humidity of the spaces. It has indoor temperature ranges of 18–30 C with relative humidities up to 80%. ASHRAE 55 standards from 2010 [33,34] and UNE-EN 16798-1:2020 [35], which replaces UNE-EN 15251:2008 [36], are based on this model.
In this research, the Fanger criterion (steady state model) has been chosen since the objective is to show the impact of climate change on the thermal sensation of nZEB buildings. This criterion allows to obtain a comfort category value in all indoor temperature ranges. In contrast, the adaptive criterion takes into account the outside temperature, and ranges within limits (18–30 C) between which the user has the capacity to adapt its thermal comfort sensation with clothing, natural ventilation, etc. Outside these limits, no adaptive comfort values are obtained; however, with the Fanger criterion, the user’s degree of discomfort is obtained on a thermal sensation scale.
The research is structured as follows. In Section 2 , the process followed to obtain the results is described. The starting point is the creation of a building energy model (BEM) based on a real semi-detached house, to which different retrofits are carried out to comply with three updates of the Spanish energy regulation (Section 2.1). Then, the process of obtaining the weather files with which each building will be simulated is explained (Section 2.2). The building energy models are simulated with a total of 38 weather files, from the normative one of the Spanish regulation to weathers created taking into account the scenarios of the Intergovernmental Panel on Climate Change (IPCC). Finally, Section 2.3 describes the simulation process to obtain the energy and comfort results for each combination. Section 3 shows the energy results obtained in terms of total, heating and cooling energy, and in relation to comfort, the hours of the year within each thermal sensation category (according to Fanger). Finally, Section 4 and Section 5 show the discussion and conclusions of the research.

2. Analysis Method

Figure 1 shows the outline of the analysis method used to measure the performance of buildings with nZEB criteria to climate change, both in terms of energy consumption and comfort. It is divided into three sections: the development of the building energy model (BEM) in EnergyPlus, in this case according to the different Spanish technical energy codes; the preparation of the weather files with which the energy models will be simulated; and the results to be analyzed: energy consumption and user comfort.

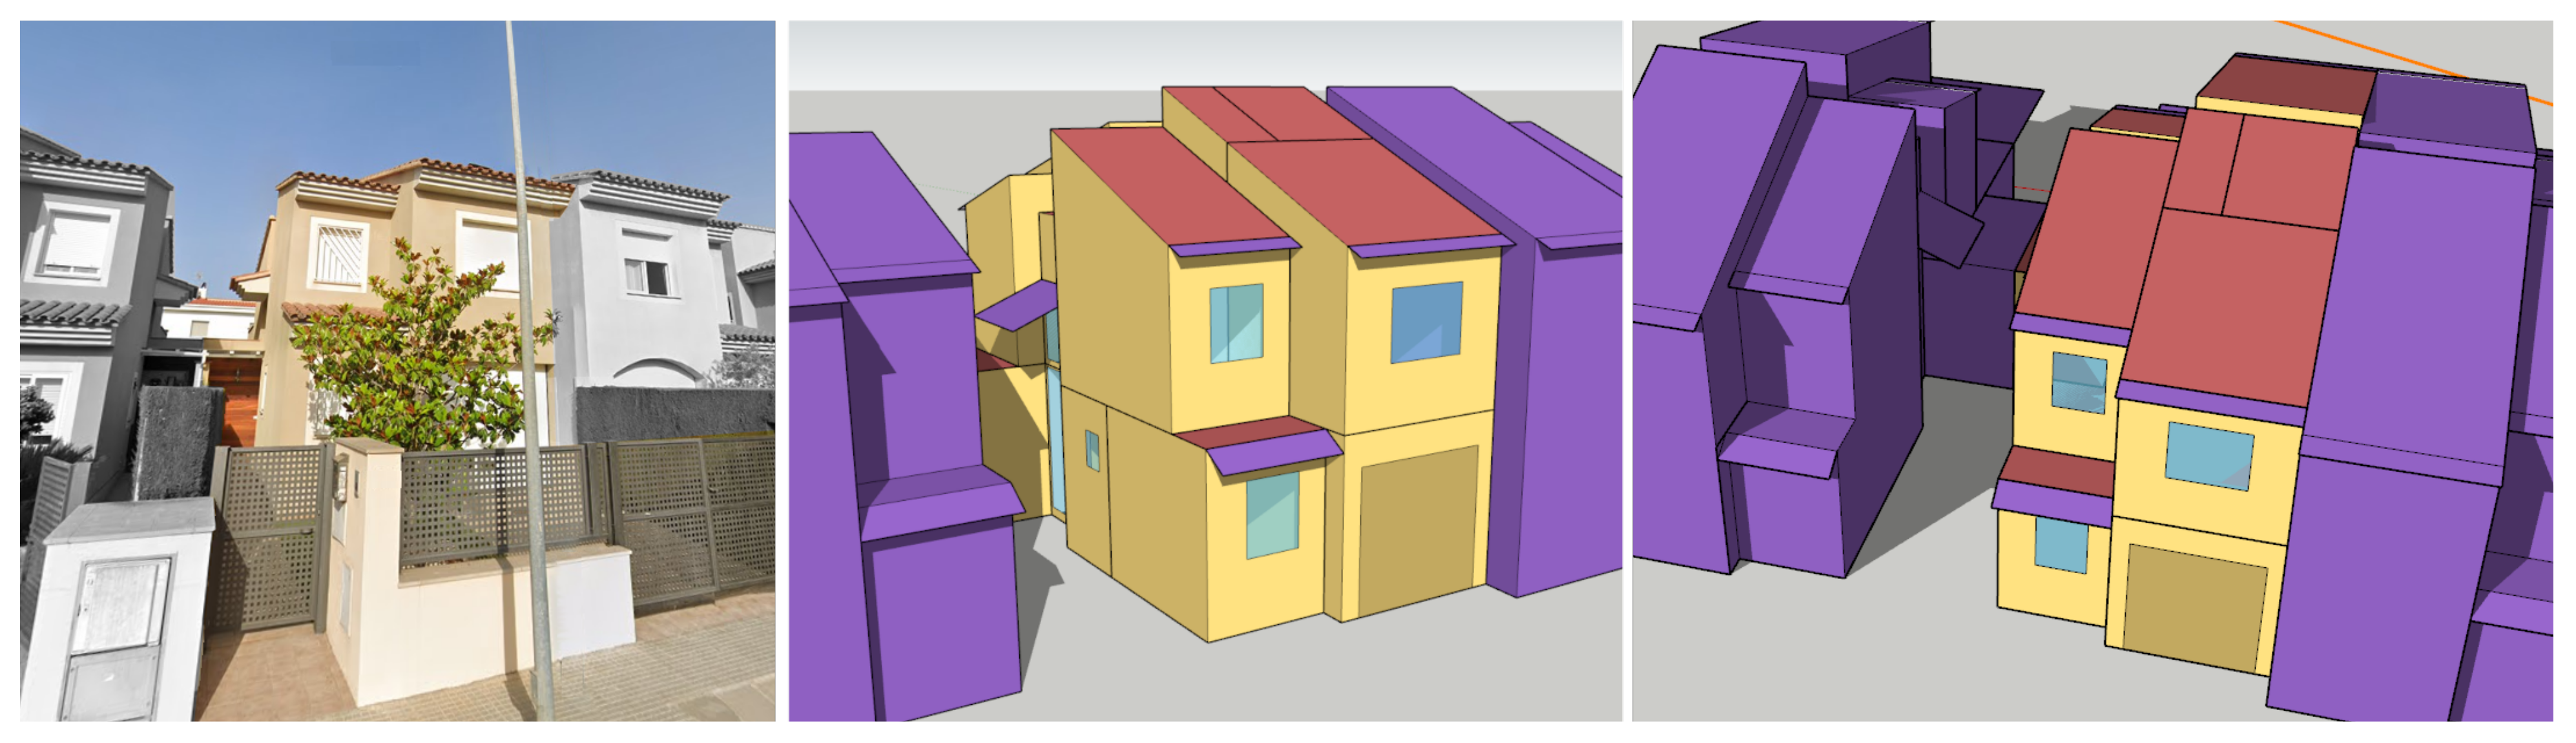
2.1. Building Energy Model Used

The starting point is the creation of the building energy model in a simulation software, in this case EnergyPlus [37] as it is one of the most widely used softwares for performing energy simulations [38]. This software passed the BESTEST set by the ASHRAE 140 standard in 2004 [39,40] , and has a very active community of developers who continue to make improvements to it to provide more capabilities while improving its accuracy. In May 2022, its buildings database was upgraded to the 2020 version of ASHRAE 140 standard [41].
This energy model is based on a semi-detached house built in 2005. Figure 2 shows, from left to right, an actual image of the building, together with the graphical representations of the model made in OpenStudio, one of the softwares that serve as the graphical interface for EnergyPlus [42,43]. It is a two-storey detached house with four bedrooms, two bathrooms and a toilet, living-dining room, kitchen and garage. It has a northeast–southwest orientation and has a series of verandas and overhangs that protect the building from solar radiation.
The use of this building has been considered appropriate because it was built before the first Spanish technical building code and, specifically, is based on the NBE-CT-79 standard. Based on this, two models were made to comply with the technical building codes of 2013 and 2019, since they are the ones that include significant changes focused on obtaining buildings with nZEB criteria. Table 1 shows some of the significant aspects that differentiate each of the energy codes.
As a summary of the evolution of building regulations in Spain, the energy code (NBE-CT-79) was based on obtaining a value that expressed an overall transmittance coefficient, called the K-value, which is the weighted average of the thermal transmittance of each element of the thermal envelope as a function of its surface area. Some thermal envelope values were limited according to their climatic zone, so the K-value had to be below certain limits. In 2006, the technical building code was approved, eliminating this K-value and increasing the thermal transmittance requirements for each of the envelopes. Two new criteria have been added: limitation of primary energy consumption, both total and from non-renewable sources; and limitation of energy demand. In this case, Table 1 shows these parameters for the 2013 technical code instead of the 2006 version, as the latter is less demanding.
Finally, the current energy standard in force in Spain, the 2019 technical building code, implemented significant changes with respect to the previous ones. The limitation of energy consumption was eliminated, focusing on its control. The characteristics of the envelope were further limited and new aspects related to solar control in summer and the envelope air-tightness at 50 Pa were added. The K-value was also restored with limits depending on the compactness of the building, so that compact buildings with reduced overall transmittance are encouraged. The minimum contribution percentages of renewable energies to cover DHW demand were also increased. Although there is still room for improvement, the overall treatment of the different aspects of the building means that buildings designed to this standard can be considered nZEB buildings, as will be seen in their energy and comfort performance in Section 3.
The initial building energy model is based on the information about the real building as it was built. Thereafter, this model was modified to comply with the technical building codes CTE-DB-HE 2013 and CTE-DB-HE 2019, as if they were energy retrofittings of the real building. Since EnergyPlus does not have modules to certify that a given design complies with Spanish energy regulations, the process of creating the models involves the use of other software to provide us with the necessary information on the modifications to be made to these models to comply with the different Spanish energy regulations. This software is a plugin of Openstudio, the SG-Save [44] . The initial model takes into account the characteristics of the as-built building, which are modified and validated with SG-Save to comply with the two Spanish technical building codes, the CTE-DB HE 2013 and the CTE-DB HE 2019.
Table 1. Differences between the Spanish technical energy codes.
NBE-CT-79 [14]CTE-DB-HE 2013 [45]CTE-DB-HE 2019 [17]Unit
Limitation of primary energy consumption ( 1 )
-Non-renewable primary energy limit-9038kWh/m 2 year
-Total primary energy limit--76kWh/m 2 year
Limitation and control of energy demand ( 2 )
-Energy demand heating limit-47-kWh/m 2 year
-Energy demand cooling limit-15–20-kWh/m 2 year
Characteristics of the building envelopes (facades, roofs, etc.) ( 3 )
-Walls and floors in contact with outside air1.2–1.40.60.41W/m 2 K
-Ceilings in contact with outside air0.90.40.35W/m 2 K
-Walls, floors and ceilings in contact with non-habitable spaces or with the ground1.60.60.65W/m 2 K
-Dividing walls or interior partitions belonging to the thermal envelope1.60.85–1.20.65W/m 2 K
-Openings (frame, glass and, if applicable, shutter box)-2.71.8W/m 2 K
-Doors with semi-transparent surface equal to or less than 50%--5.7W/m 2 K
-Horizontal interior partitions (same use)1.41.21.2W/m 2 K
-Vertical interior partitions (same use)1.81.21.2W/m 2 K
-Horizontal interior partitions (different use)1.40.850.85W/m 2 K
-Vertical interior partitions (different use)1.80.850.85W/m 2 K
-Air permeability of openings (100Pa overpressure)-279m 3 /h · m 2
-K-value limit as a function of building shape (compactness)0.84–1.47-0.48–0.67W/m 2 K
-Solar control of the thermal envelope ( 4 ) --2kWh/m 2 month
-Limit value of the air change ratio at a pressure of 50 Pa ( 5 ) --6–3ACH
Building use profiles
Schedules (setpoints, loads, ventilation, etc.)- ( 6 ) ( 7 )
Contribution of renewable energies
Minimum annual solar contribution for DHW-5070%
( 1 ) Based on a 100 m2 house. ( 2 ) The CTE-2013 is based on the limitation of energy demand and the CTE-2019 on its control. ( 3 ) All values are for the city of Pamplona (climate D1 according to the Spanish technical code). ( 4 ) Ability to block solar radiation and involves the full activation of the mobile shading devices. Month of calculation: July. ( 5 ) Depending on the compactness. More demanding the less compact. ( 6 ) All values are defined by the Spanish technical code. ( 7 ) Same schedules as in CTE-2013, except for the absence of 4 nighttime ACH in summer. This avoids the possibility of free cooling in summer.
Table 2 shows the general differences between the three models developed. As can be seen, the baseline energy model is very close to the CTE-DB-HE 2013 model. The year of construction, 2005, is very close to the creation of the first version of the Spanish technical building code (2006), so its construction characteristics are closer to that standard than to the NBE-CT 79. Its modifications are mainly based on the increase of insulation in façades, roofs and slabs-on-grade foundations; and on the replacement of window glazing beads, which slightly decreases their permeability, slightly reducing the overall infiltration of the building.
However, the CTE-DB-HE 2019 model does have significant changes with respect to the other two models, since the current regulation aims to obtain buildings that achieve the objectives set by the European Commission regarding the energy efficiency of buildings. In addition, if they follow the requirements of the CTE-DB-HE 2019 in terms of new buildings, they are considered nZEB buildings in Spain.
Regarding the building envelope, not only was the thermal transmittance of the façades, roofs and slabs-on-grade foundations significantly decreased, but also the glazing and window frames were modified to reduce both the U-value of the glazing and the conductance of the window frames, reducing their permeability. As for the building’s HVAC systems, the boiler was replaced with a more efficient one and solar thermal collectors were installed to reduce the energy demand for domestic heat water (DHW). No changes were made to the cooling system since the demand is not significant due to the weather of the site (Pamplona). Regarding air exchange between a building and the outside environment, there are two aspects to take into account: ventilation (natural or mechanical) and infiltrations. The NBE-CT 79 and CTE-DB-HE 2013 models have natural ventilation in their spaces, while the CTE-DB-HE 2019 model has a heat recovery unit that makes it possible to take advantage of the thermal energy of the air (heating or cooling), which means significant savings in its energy demand. All these actions contribute to reducing the overall infiltration of the building (air changes per hour-ACH), which reduces the energy demand to comply with the consumption limits established by the Spanish technical building code.
Finally, another key aspect of any nZEB building is the reduction of energy consumption due to the production of energy from renewable sources in or near the building itself. In the case of the CTE-DB HE 2019 model, it has solar thermal collectors that provide 76.7% of the annual DHW demand. However, as will be explained in Section 3 , this contribution will not be taken into account in the results since the comparisons between the models are made only for heating and cooling, without taking into account DHW energy demand, since its energy demand is the same for the three models.

2.2. Weather File Creation

The second aspect of the analysis method is the creation of the weather files, with which we will perform the simulations. As shown in Figure 1, three types of weather files will be used: typical meteorological year (TMY), actual meteorological year (AMY) and future weather scenarios based on the Intergovernmental Panel on Climate Change (IPCC) [46,47]. As Bhandari et al. point out, each of these weather files should be selected based on the purpose, location, and engine used in the simulation [48].
Typical meteorological year files represent the weather at a location over a given period of time without taking into account extreme weather conditions. They are used to check the performance of buildings under standard conditions, to obtain energy performance certificates, etc. In this case, the weather used is the one established by the Technical Building Code (CTE) for the place of the case study (Pamplona, Spain), which corresponds to D1 weather.
Actual meteorological year (AMY) files are specific to a given location and time period. They are produced using data from actual weather stations located in or around the building, and can even be obtained by interpolating data from other nearby weather stations. The latter option is often used by external data providers (third-party weather companies). This type of file takes into account what has happened at a particular place and time, so it includes information regarding unusual weather events that have occurred, such as heat and cold waves. They are used to calibrate building energy models, calculate utility costs and energy bills, study the actual performance of HVAC systems, etc. [49]. In this case study, the weather files are developed from the data of the weather stations of the Government of Navarra [50] and using the EnergyPlus auxiliary program, weatherconverter. Ten years have been chosen, from 2010 to 2020, which represent to some extent the onset of the climate change we are experiencing, as they include several hot and cold waves [51,52]. They also provide climate continuity with the IPCC future weathers (2020 to 2100).
Finally, future weather files that take into account the different climate change scenarios. Three tools are currently available to generate such files [53]: the CCWeatherGen tool, developed by Jentsch et al. in 2013 [54]; the WeatherShift tool, which is a collaborative project of Arup North America Ltd (Arup) and Argos Analytics LLC [55]; and the Meteonorm software [56,57], which allows access to typical meteorological years and historical time series, as well as modifying weather files based on global climate models according to the IPCC Fourth Assessment Report (AR4-2007).
The CCWeatherGen tool, initially only valid for UK weather files, was later adapted to the whole world (CCWorldWeatherGen). Using a Microsoft Excel sheet, the weather file in *.epw format (EnergyPlus weather) was transformed into a future weather file through a morphing methodology that allowed us to obtain future weather files for the years 2020, 2050 and 2080 [54,58]. The WeatherShiftTM tool is based on the representative concentration pathway emission scenarios (RCP4.5 and RCP8.5) of the IPCC fifth assessment report (AR5-2015). However, it generates weather files for cities near Madrid and Barcelona (in the case of Spain), quite far from Pamplona, the city under study. The Meteonorm software allowed us to process weather files from 2020 to 2100 every 10 years for any location in the world. They are based on three future emissions scenarios—B1, A1B and A2—in order of weather severity. The B1 scenario is based on world population growth peaking mid-century, with rapid changes in economic structures towards a service and information economy; the A1B scenario assumes very rapid economic growth, a world population similar to B1 and rapid introduction of new, more efficient and balanced technologies using all energy sources; and the A2 scenario describes a very heterogeneous world with high population growth, slow economic development and slow technological change [59]. Due to its versatility and ease of use, it was the tool used for the generation of future weather scenarios in this study. Twenty-seven weather files are generated, nine for each climate change scenario (B1, A1B and A2 in order of climate severity), at 10-year intervals, from 2020 to 2100.

2.3. Simulation and Variables under Study

Once the building energy models and weather files to be used were defined, the next step of the methodology was the selection of the results to be analyzed. The results to be analyzed were energy (total, heating and cooling) and comfort levels; the former to analyze the impact on energy consumption of the requirements for a building to be considered nZEB according to the Spanish technical building code, and the latter to measure the performance of this type of buildings with regard to climate change. Whereas energy consumption is simple to measure (kWh/m 2 year), the measurement of user comfort can depend on many variables, as highlighted in the introduction (see Section 1).
As explained above, two main comfort models are available, the steady state model or heat balance and the adaptive comfort model. The Spanish technical building code does not consider the adaptive comfort model, but establishes, for example at residential level, limits for the temperature set-points at which users are supposed to be comfortable. The quantitative drawback of the adaptive model is that it does not provide information on the user’s degree of comfort, but rather on his or her ability to adapt thanks to the outside environment. EnergyPlus has different modules for measuring user comfort (Fanger, Pierce Two-Node, Kansas State University Two-Node, ASHARE 55, etc.). Among them, the Fanger steady-state method was chosen because it allowed us to establish different comfort levels in the whole possible comfort–discomfort range. This facilitates the measurement of the degree of improvement or worsening of buildings with nZEB criteria in terms of comfort levels, where the “neutral” level is the desirable level as opposed to the extreme levels of “hot” and “cold”.
With all these data, it was possible to analyze the performance of buildings with nZEB criteria to climate change.

3. Results

Figure 3 shows the energy consumption results of the HVAC systems for the different models, taking into account all the weather scenarios described in Section 2.2. The DHW consumption of the models has not been taken into account in the plots since it is the same consumption for the three Spanish energy codes, although it is true that the CTE-DB HE 2019 model, in addition to having a higher efficiency boiler, has solar thermal collectors to reduce the DHW energy demand, specifically more than 75% of the energy required. It was decided not to add this consumption in order to highlight the differences that depend on the thermal envelope, since it is the envelope that is responsible for user comfort, which will be analyzed later in Figure 4, Figure 5, Figure 6, Figure 7, Figure 8 and Figure 9.
The structure of Figure 3 is based on three bar charts, from top to bottom: total energy consumption, heating consumption and cooling consumption in kWh/m 2 year. As can be seen, the predominant consumption in Pamplona is heating, with cooling consumption being around 8.5% on average with respect to heating [for NBE-CT-79 and CTE-DB HE 2013 models]. Each color represents a model, with brown-sienna corresponding to the NBE-CT-79 model, gray to the CTE-DB HE 2013 model and dark green to the CTE-DB HE 2019 model. The weather scenarios are ordered from left to right as follows: the first one is the typical normative weather of the Spanish technical building code, in this case corresponding to climate zone D1 (similar to typical meteorological year-TMY); followed by ten real weather events of Pamplona from 2011 to 2020 (actual meteorological year-AMY), in which the background has been shaded to facilitate their analysis; and finally, the weather scenarios developed with the Meteornorm v7 software taking into account the IPCC considerations for climate change scenarios B1, A1B and A2 (in order of weather severity). They have been grouped by years, from 2020 to 2100.
As can be seen, the CTE D1 regulatory weather is similar to the real weather from 2011 to 2020, being one of the most demanding in terms of heating and therefore less severe in terms of cooling. However, what is really remarkable from the consumption graphs is the important difference between the NBE-CT-79 and CTE-DB HE 2013 models versus the CTE-DB HE 2019 model (an average of 84.36%). As explained in Section 2.1, this model complies with the requirements of the CTE-DB HE 2019 for new buildings, being considered by the Spanish regulations an nZEB building. The requirements of this standard make the building robust to the great weather variability of the years (2011 to 2020). The models of the previous technical building codes reproduce in their consumptions the weather changes with oscillations in their total consumptions of up to 30.9 kWh/m 2 year compared to 5 kWh/m 2 year of the CTE-DB HE 2019 model. This proves that nZEB buildings not only substantially reduce their consumption but are also prepared to deal with weather changes and are therefore robust.
Regarding future weather scenarios, all graphs show a logical trend—global warming causes a decrease in heating consumption and an increase in cooling consumption. However, the change in total consumption is more noticeable in the NBE-CT-79 and CTE-DB HE 2013 models, with oscillations of up to 23.67 kWh/m 2 year compared to 1.79 kWh/m 2 year for the CTE-DB HE 2019 model. This variation appears to be larger for cooling consumption, but this is due to the scales of the graphs (10 kWh/m 2 year versus 90 kWh/m 2 year for heating). In summary, it can be concluded that nZEB buildings are better prepared for climate change in terms of their energy consumption.
The next point to be analyzed is user comfort. Figure 4, Figure 5, Figure 6, Figure 7, Figure 8 and Figure 9 show the comfort values of the different models both for the CTE D1 normative weather scenario and the real weathers from 2011 to 2020 (Figure 4, Figure 5 and Figure 6) and for the future weathers taking into account the climate change scenarios defined in the IPCC, in this case those corresponding to scenario A2 (Figure 7, Figure 8 and Figure 9). Appendix A shows these same comfort graphs, but with the remaining scenarios, A1B and B1.
Each of the figures is divided into three sections, from top to bottom, corresponding to the NBE-CT-79, the CTE-DB HE 2013 and the CTE-DB HE 2019 Spanish technical building codes. Each section has two views, since the bar diagram hides the results of the lower height bars. The height of each bar corresponds to the hours in which the living spaces are in the same comfort category according to Fanger’s steady-state method [29,30]. Each year has a total of 8760 h, hours in which the spaces are configured with users undertaking a sedentary activity, with 1 “clo” of clothing and in which the temperature and relative humidity depend on the conditions of the envelope and the outside conditions (weather). Fanger established a temperature-based psychophysical scale to measure the degree of comfort or discomfort of users, with the following thermal sensations: “cold”, “cool”, “slightly cool”, “neutral”, “slightly warm”, “warm” and “hot”. What each bar shows is the annual sum of hours in each comfort category for a given model in a given weather. This facilitates the comparison of the comfort performance of the different models for the different weathers analyzed.
As can be seen in the graphs in Figure 4, Figure 5 and Figure 6, the comfort level behavior of the NBE-CT-79 and CTE-DB HE 2013 models is similar, with a greater tendency towards “slightly cool” thermal sensations, with mean values of hours: “slightly cool” = 3502 h, “neutral” of 5132 h and “slightly warm” of 26 h. In contrast, the CTE-DB HE 2019 model not only has more hours of the year within the “neutral” range according to Fanger, with oscillations from 4432 to 6077 h, but its temperature distribution is more well-balanced with means of “slightly cool” of 2241 h and “slightly warm” of 926 h. It is true that there are hours when there may be a slight overheating of the spaces, which corresponds to what has been highlighted in Section 1; however, its overall thermal behavior is better in relation to the other models.
In the case of the graphs in Figure 7, Figure 8 and Figure 9, those corresponding to weathers that take climate change into account, their behavior is similar. There is a greater range of hours in the “neutral” classification of the NBE-CT-79 and CTE-DB HE 2013 models (5611–6437 h) versus the CTE-DB HE 2019 model (5608–5991 h); however, the distribution of thermal sensations is more well-balanced in the CTE 2019 model, with averages of “slightly cold” hours of 1081 h and “slightly warm” of 1419 h, reducing the former by 57% and improving the latter by up to eight times. It is likely that nZEB buildings will have higher cooling consumptions in the future due to global warming; however, they will also have a more well-balanced thermal behavior than the rest of the buildings without nZEB criteria.

4. Discussion

One of the drawbacks of analyzing comfort in a building that follows the temperature setpoints of the energy standard is that these setpoints are defined in terms of user comfort ranges, so envelope retrofitting should only affect energy consumption and not comfort. In fact, for the residential case, the Spanish technical building code establishes minimum temperature ranges for winter of 17 C from 23 h to 7 h and 20 C from 7 h to 23 h; and in summer, maximum temperature ranges of 25 C from 15 h to 23 h and 27 C from 23 h to 7 h; which means that out of the 8760 h of the year, the residential building is only in free oscillation from 7 h to 15 h in summer. However, these values are lower (winter) and upper (summer) limits, which do not correspond to Fanger’s “neutral” thermal sensation (the desirable one), so the distribution of thermal sensations based on this scale not only gives us information on which model has a greater number of hours in each comfort ranges, but also on how it is distributed throughout the year, both at times when it is within the setpoint temperature and when there are no limit values, the hours of free oscillation. As can be seen in the results, although the analyzed building is within the setpoint temperatures most of the year, its thermal behavior, directly related to the number of hours in each comfort range, varies significantly among the different Spanish technical building codes, with the CTE-DB HE 2019 being the one that achieves a building with a robust performance in the face of climate change.
The global energy crisis we are experiencing is forcing countries to consider different strategies to reduce their energy consumption and, therefore, reduce their energy dependence. In the case of Spain, on 1 August 2022, Royal Decree-Law 14/2022 was approved, which temporarily modifies the temperature setpoints established in the energy regulations [60]. New minimum winter temperature limits of 19 C and maximum summer temperature limits of 27 C have been established. The Royal Decree-Law estimates that each degree of temperature increase or decrease represents an annual energy saving of 7%. However, user comfort does not understand this type of problem. As can be seen in Section 3, buildings with nZEB criteria make it possible to maintain an adequate degree of comfort for a longer period of time, with reduced energy consumption, being prepared for this type of decisions as well as for climate change variations.

5. Conclusions

Nearly Zero Energy Buildings are proving to be one of the measures with the greatest impact on the reduction of greenhouse gas emissions, as can be seen in the significant reduction of their consumption. For this reason, their introduction in the building sector is being promoted through mandatory regulations, as is the case of Spanish technical building code. There is a multitude of research that analyzes this type of building in terms of energy and even user comfort, although there are no studies that carry out both analyses simultaneously and, above all, that take into account the variations that climate change may entail in the future, as highlighted by Picard et al.: “Building performance and solar energy system simulations are clearly undertaken with standardized weather files, which do not generally take climate change into account.” [22].
This study analyzes all these aspects simultaneously in order to serve designers, architects, engineers, etc. as a useful tool to show users and investors that the benefits of this type of buildings are not only at the energy level but also at the comfort level, both if we take into account the current weather and the possible consequences of climate change. Often the interventions to be carried out to achieve this type of building have a long payback period if they are analyzed taking into account only energy savings, which sometimes prevents certain types of investments.
The main conclusions of the results obtained are described below:
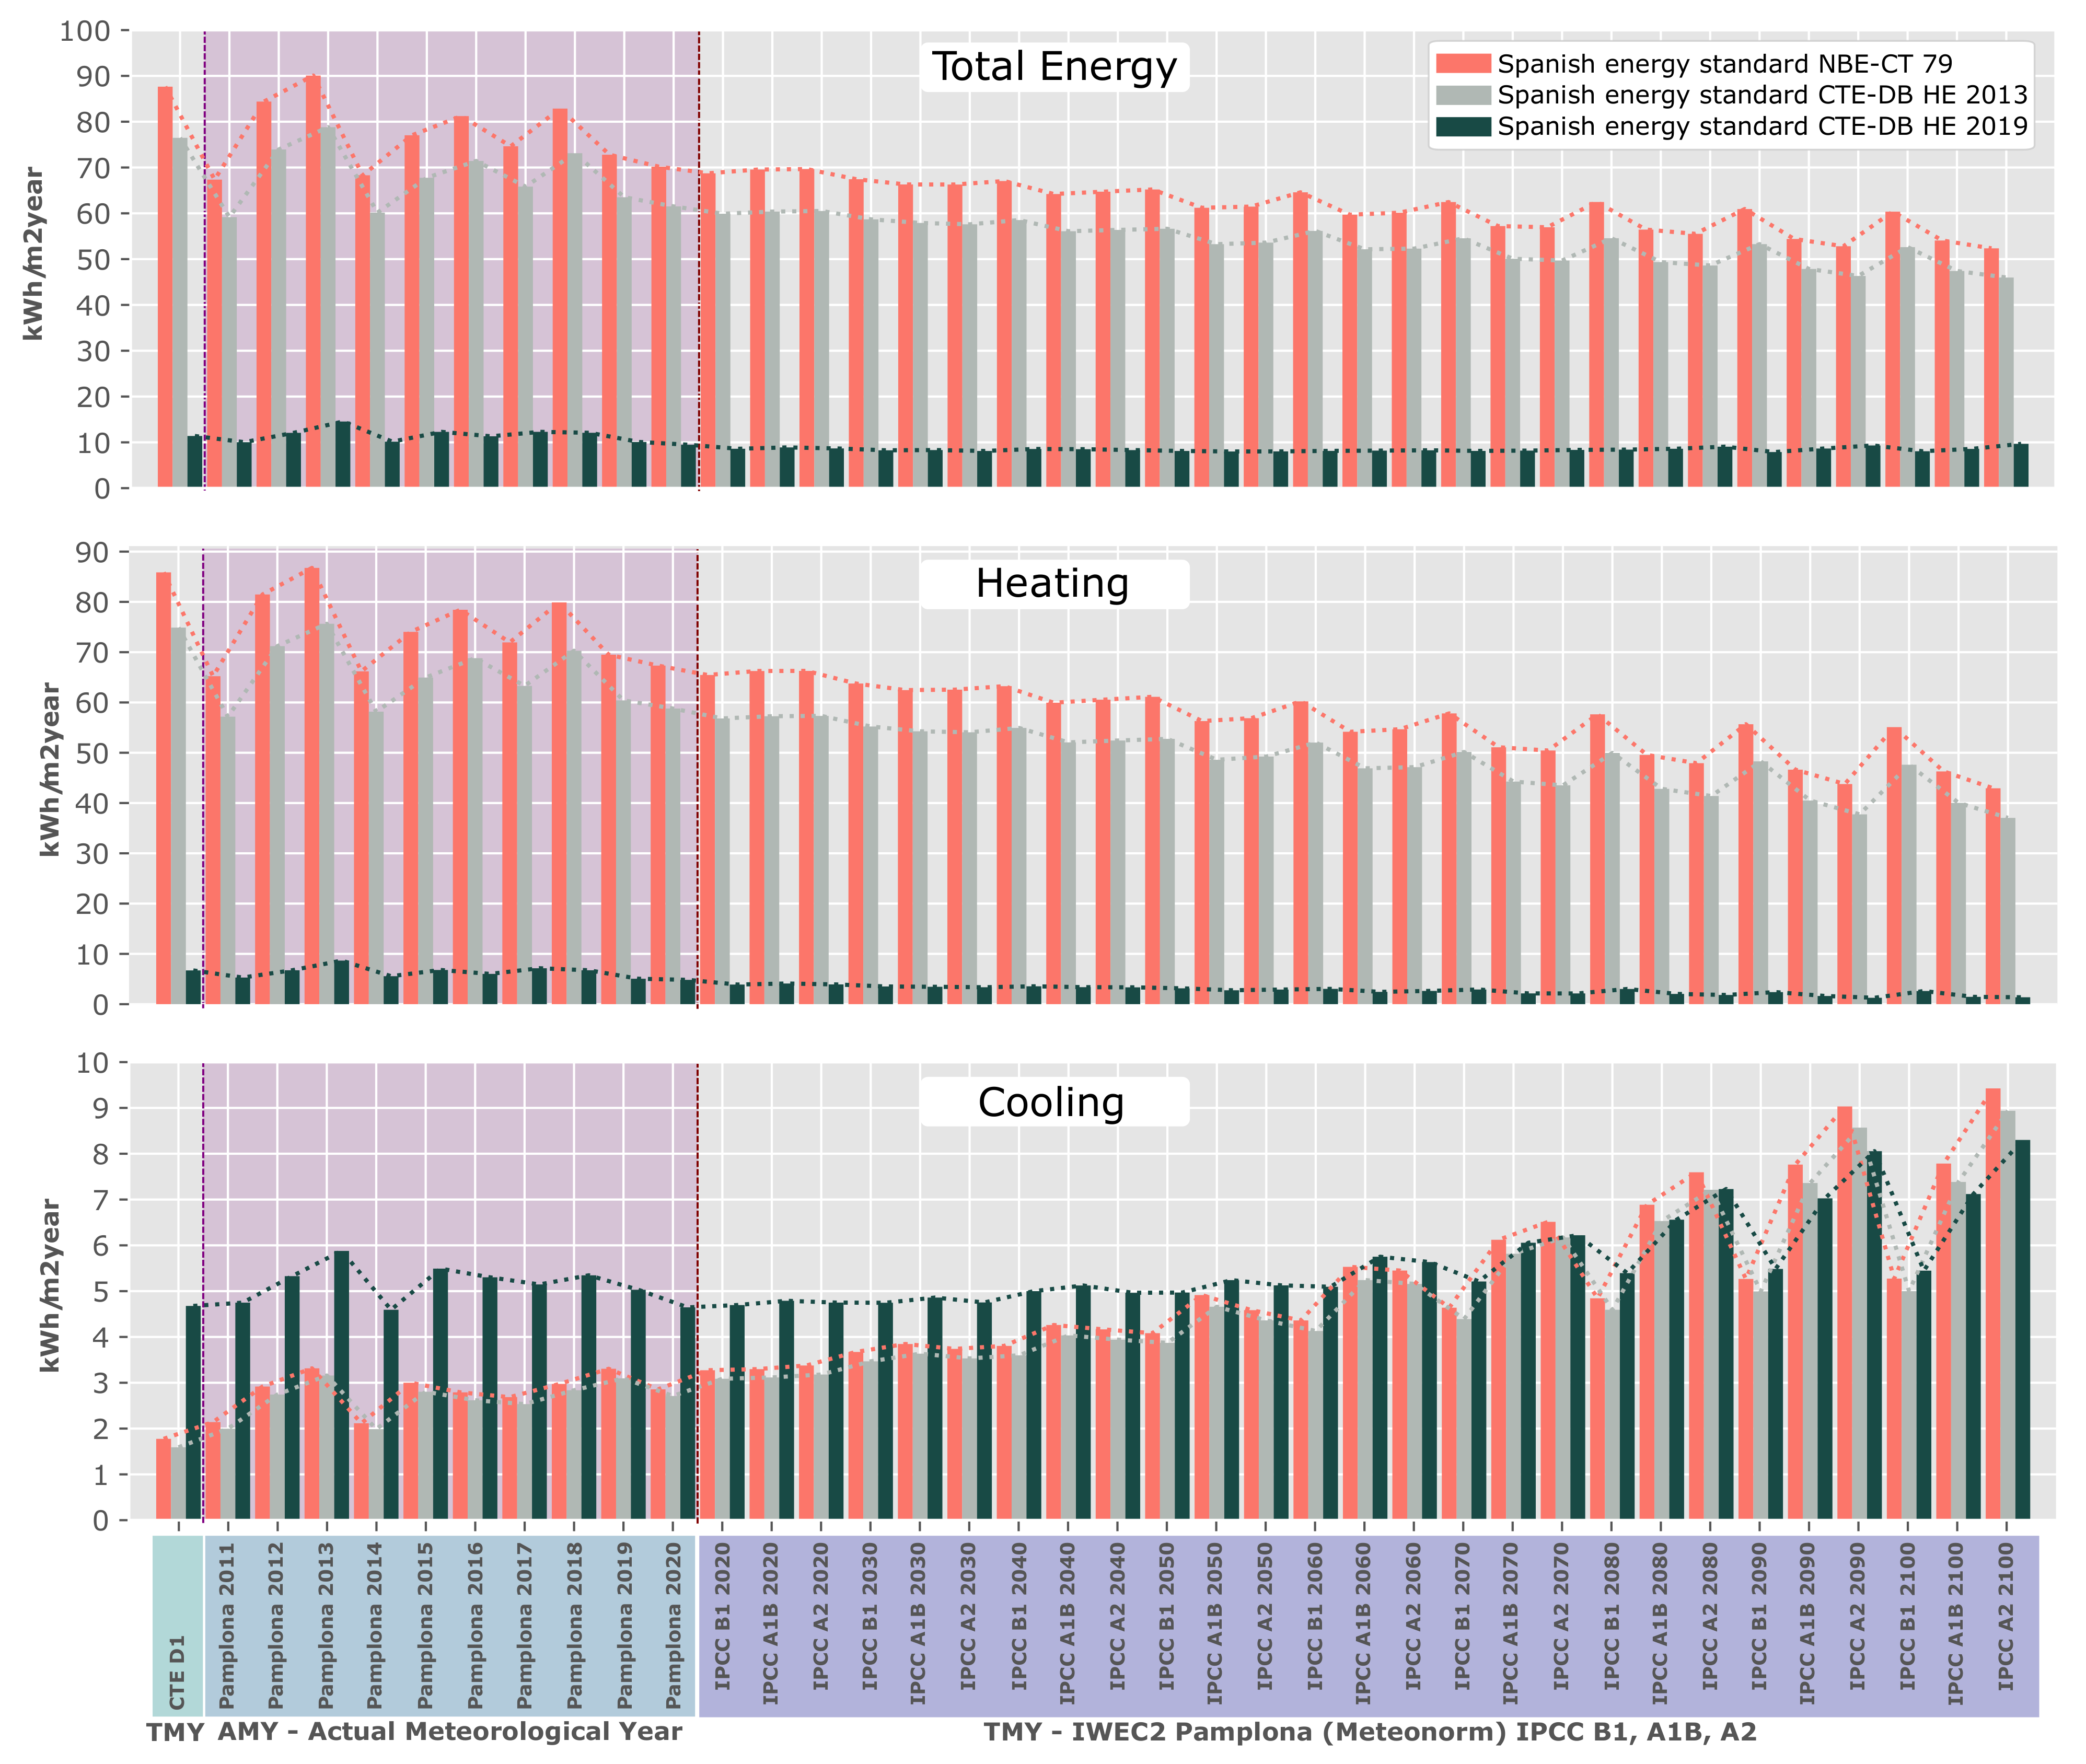
  • Energy savings of the different Spanish energy standards. There is a big difference between housing built according to Spanish standards NBE-CT-79 and CTE-HE 2013, versus the new construction criteria of the technical building code CTE-HE 2019 (an average of 84.36%), which considers these buildings nZEB buildings;
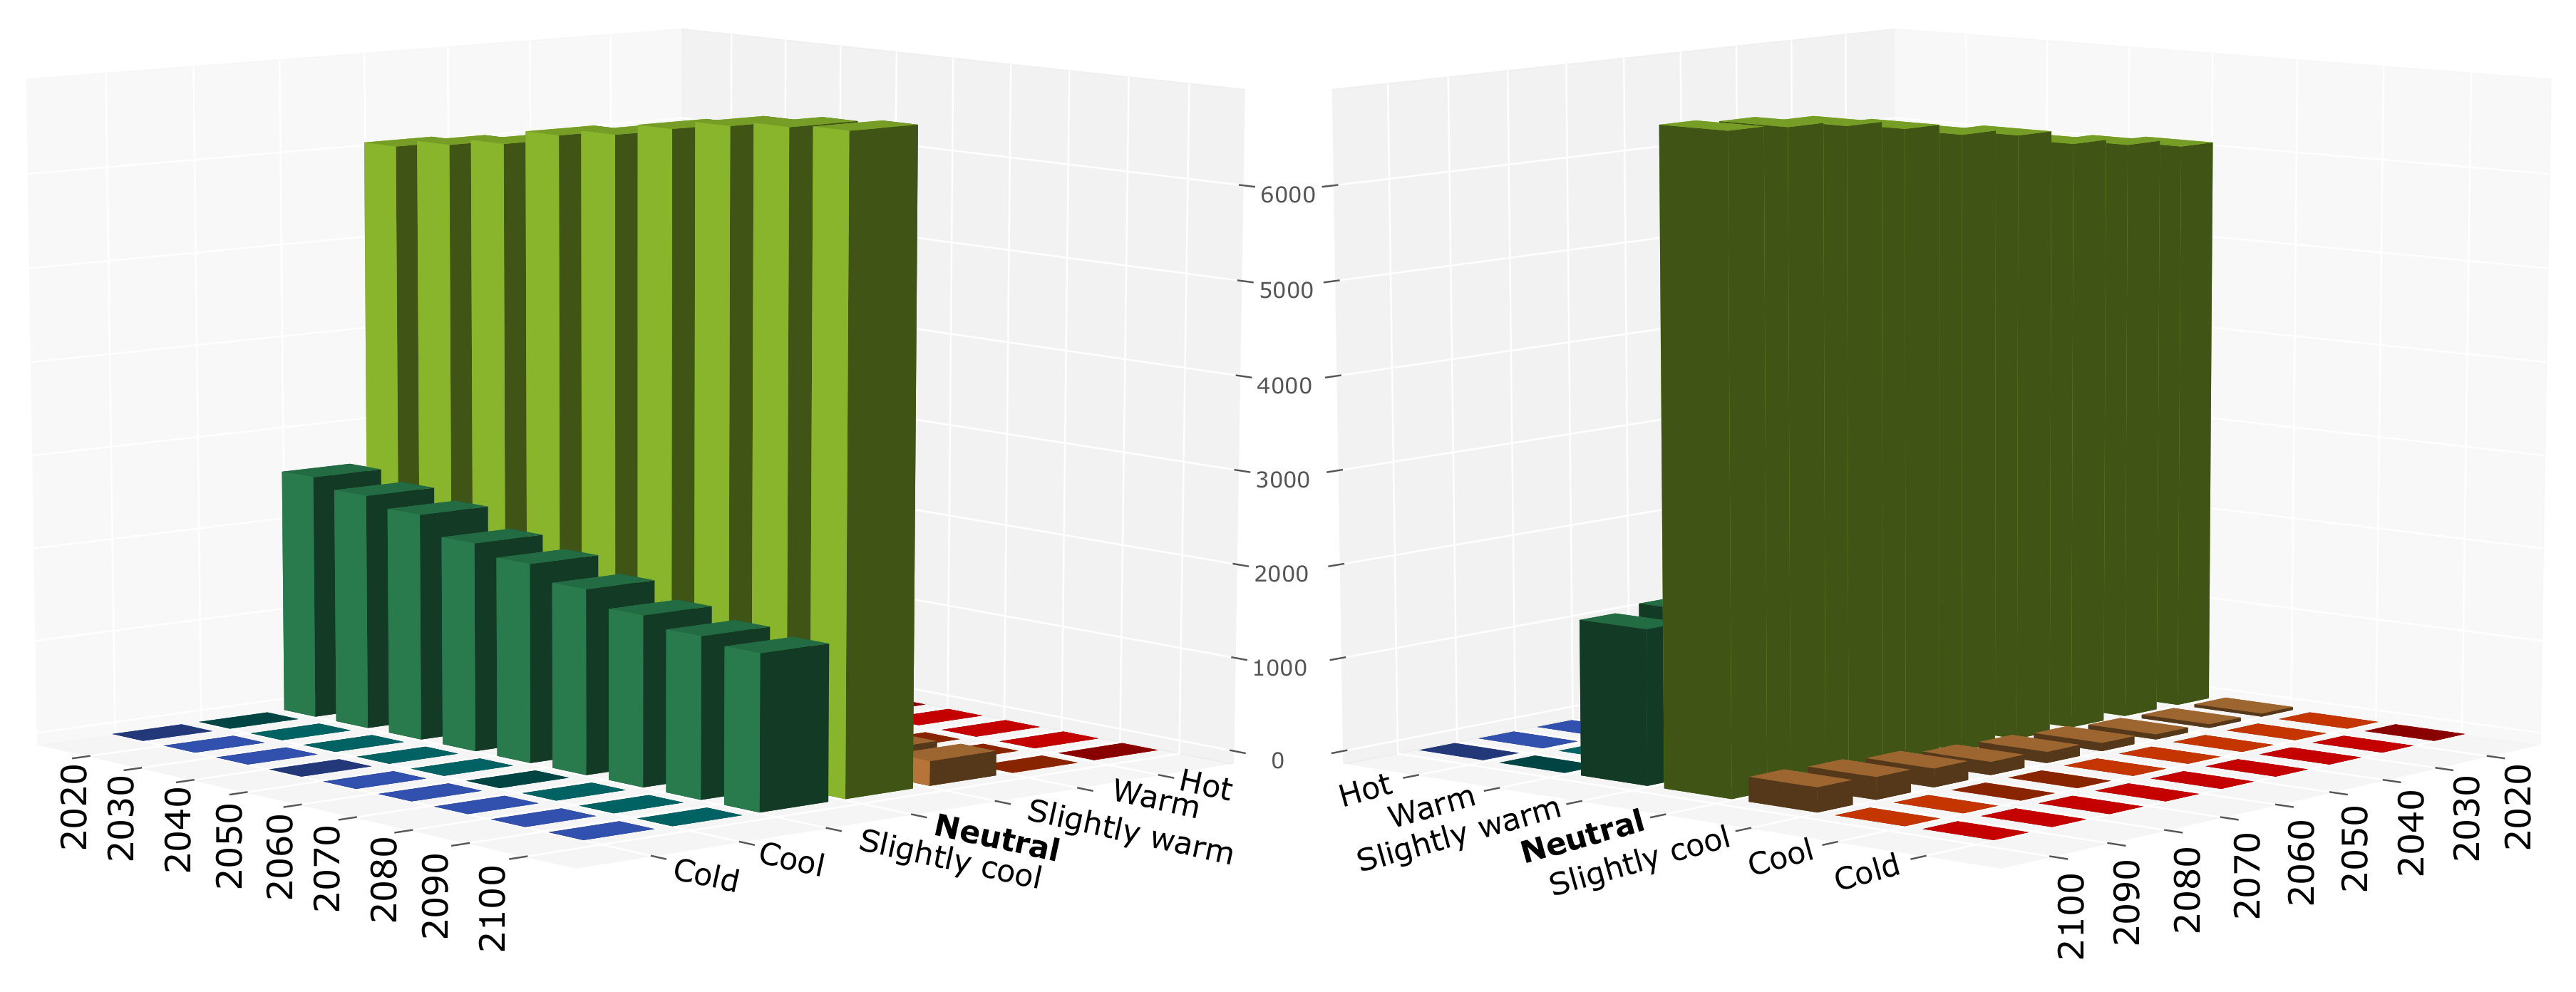
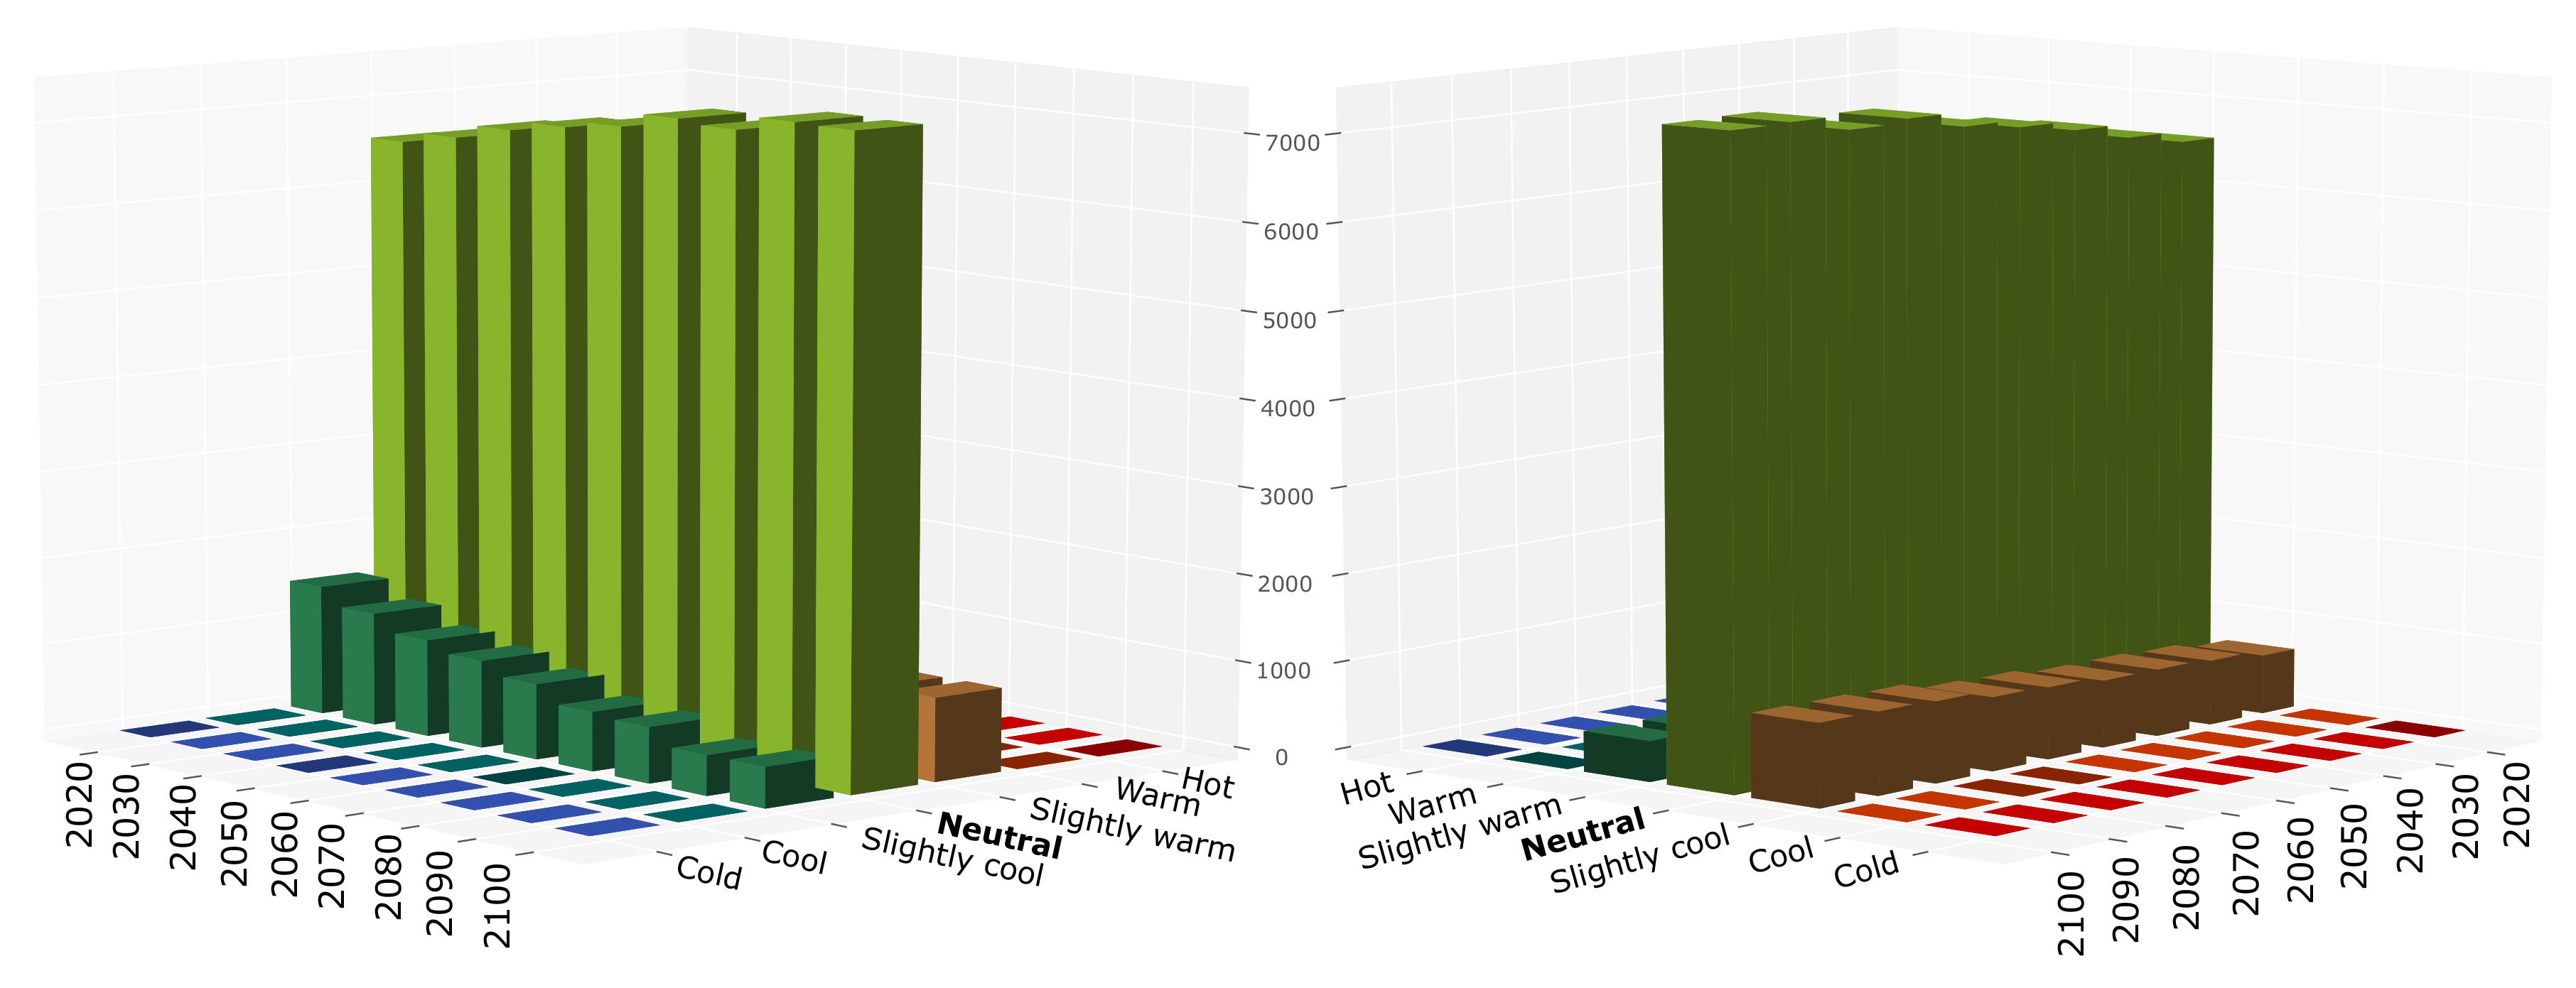
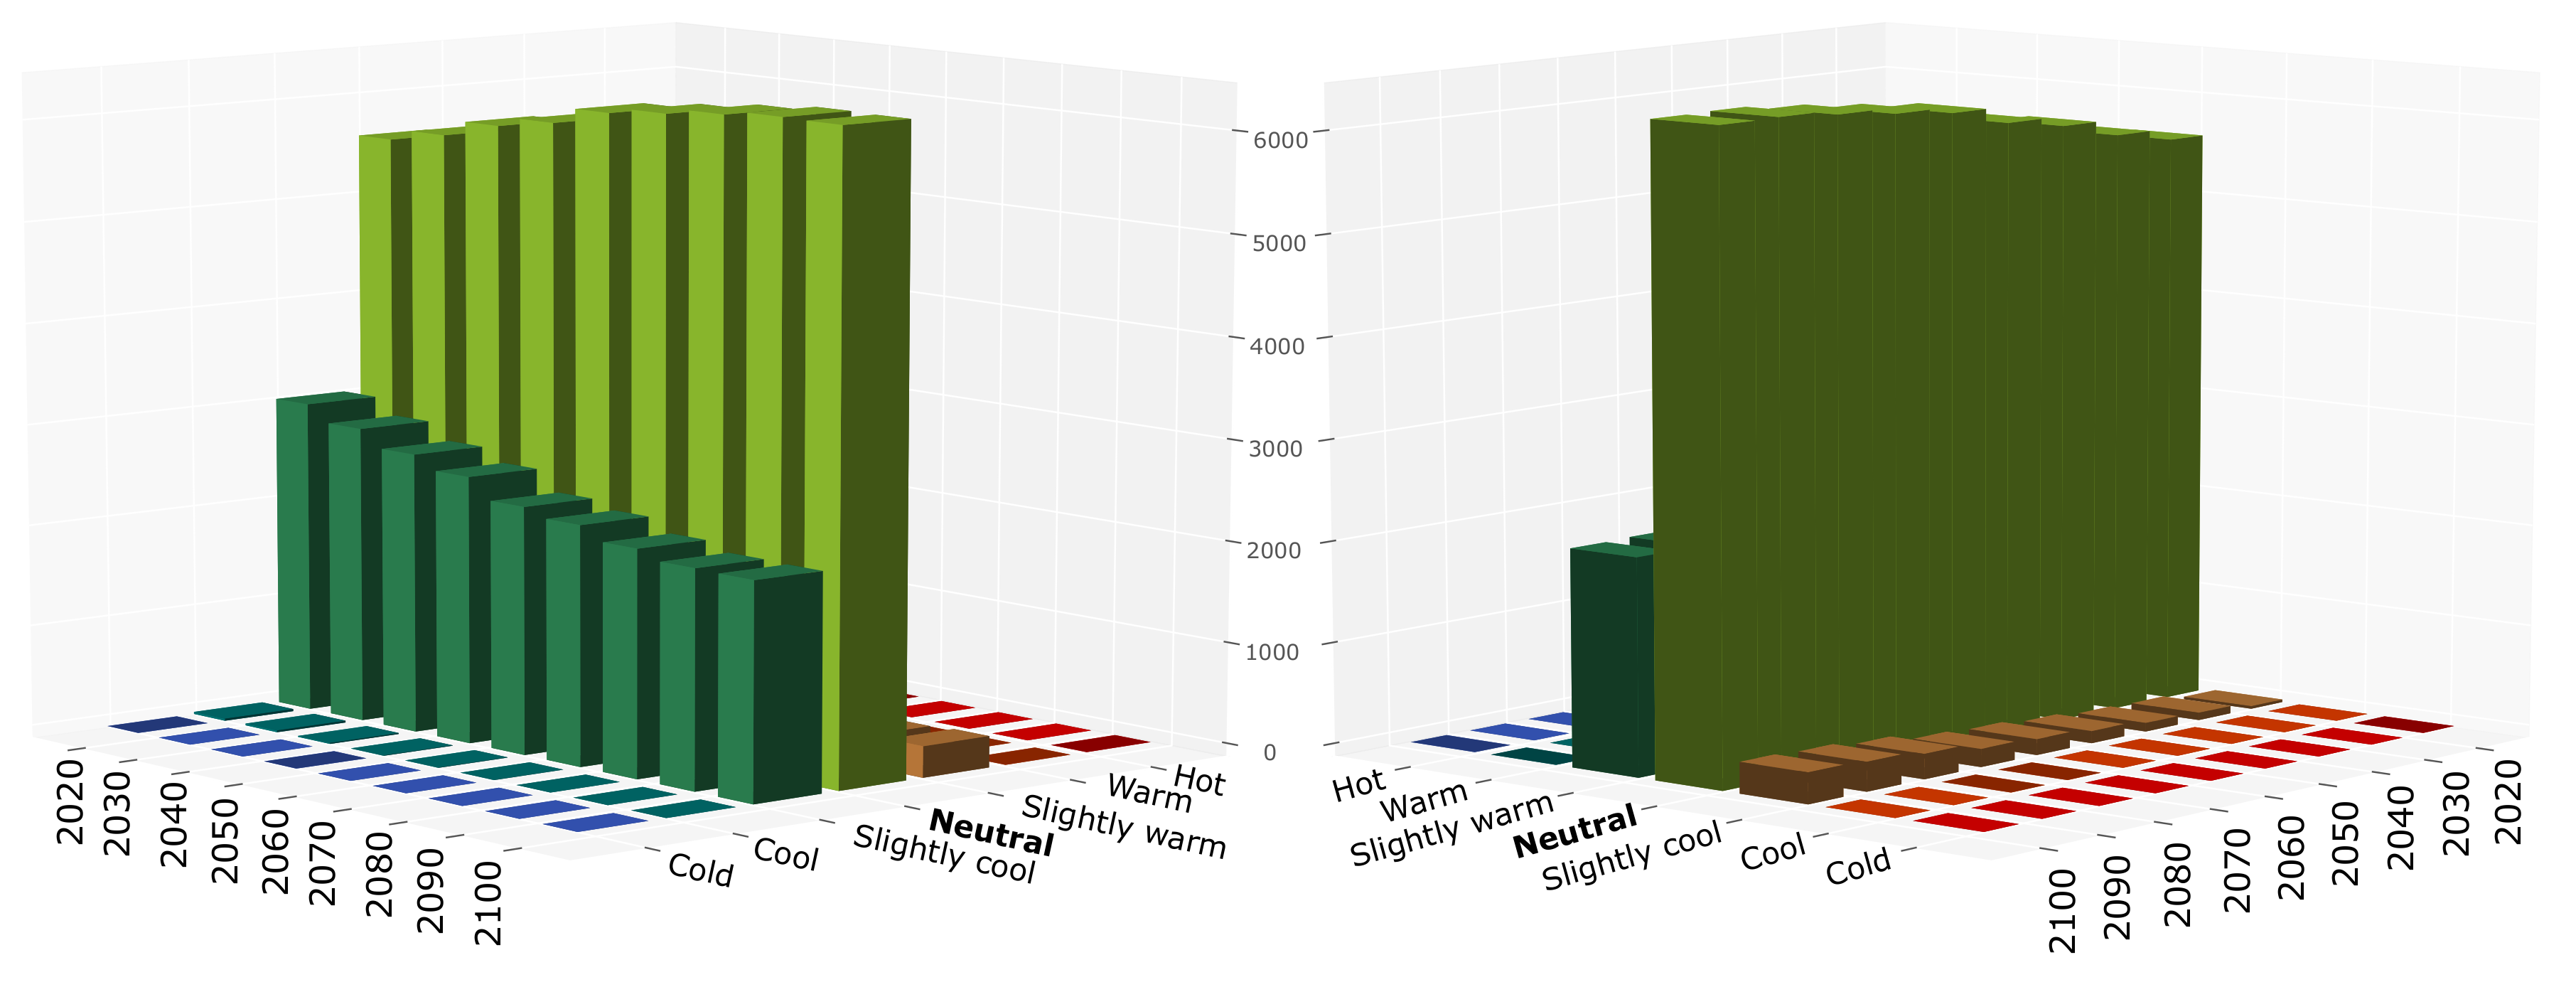
  • Energy savings of nZEB buildings in relation to climate change. The study carried out with current (2011 to 2020) and future (2020 to 2100) weather series shows that these buildings are optimally adapted to both the meteorological oscillations of recent years and the severity of the climate change scenarios defined by the IPCC;
  • Adjustment of Spanish regulations to the nZEB criteria. The reduction of the thermal transmittance of the envelopes, the increase in the performance of HVAC systems and the control of air exchange thanks to the reduction of infiltrations and the use of mechanical ventilation with heat recovery, have proven to be effective measures for obtaining nearly Zero-Energy Buildings (nZEB);
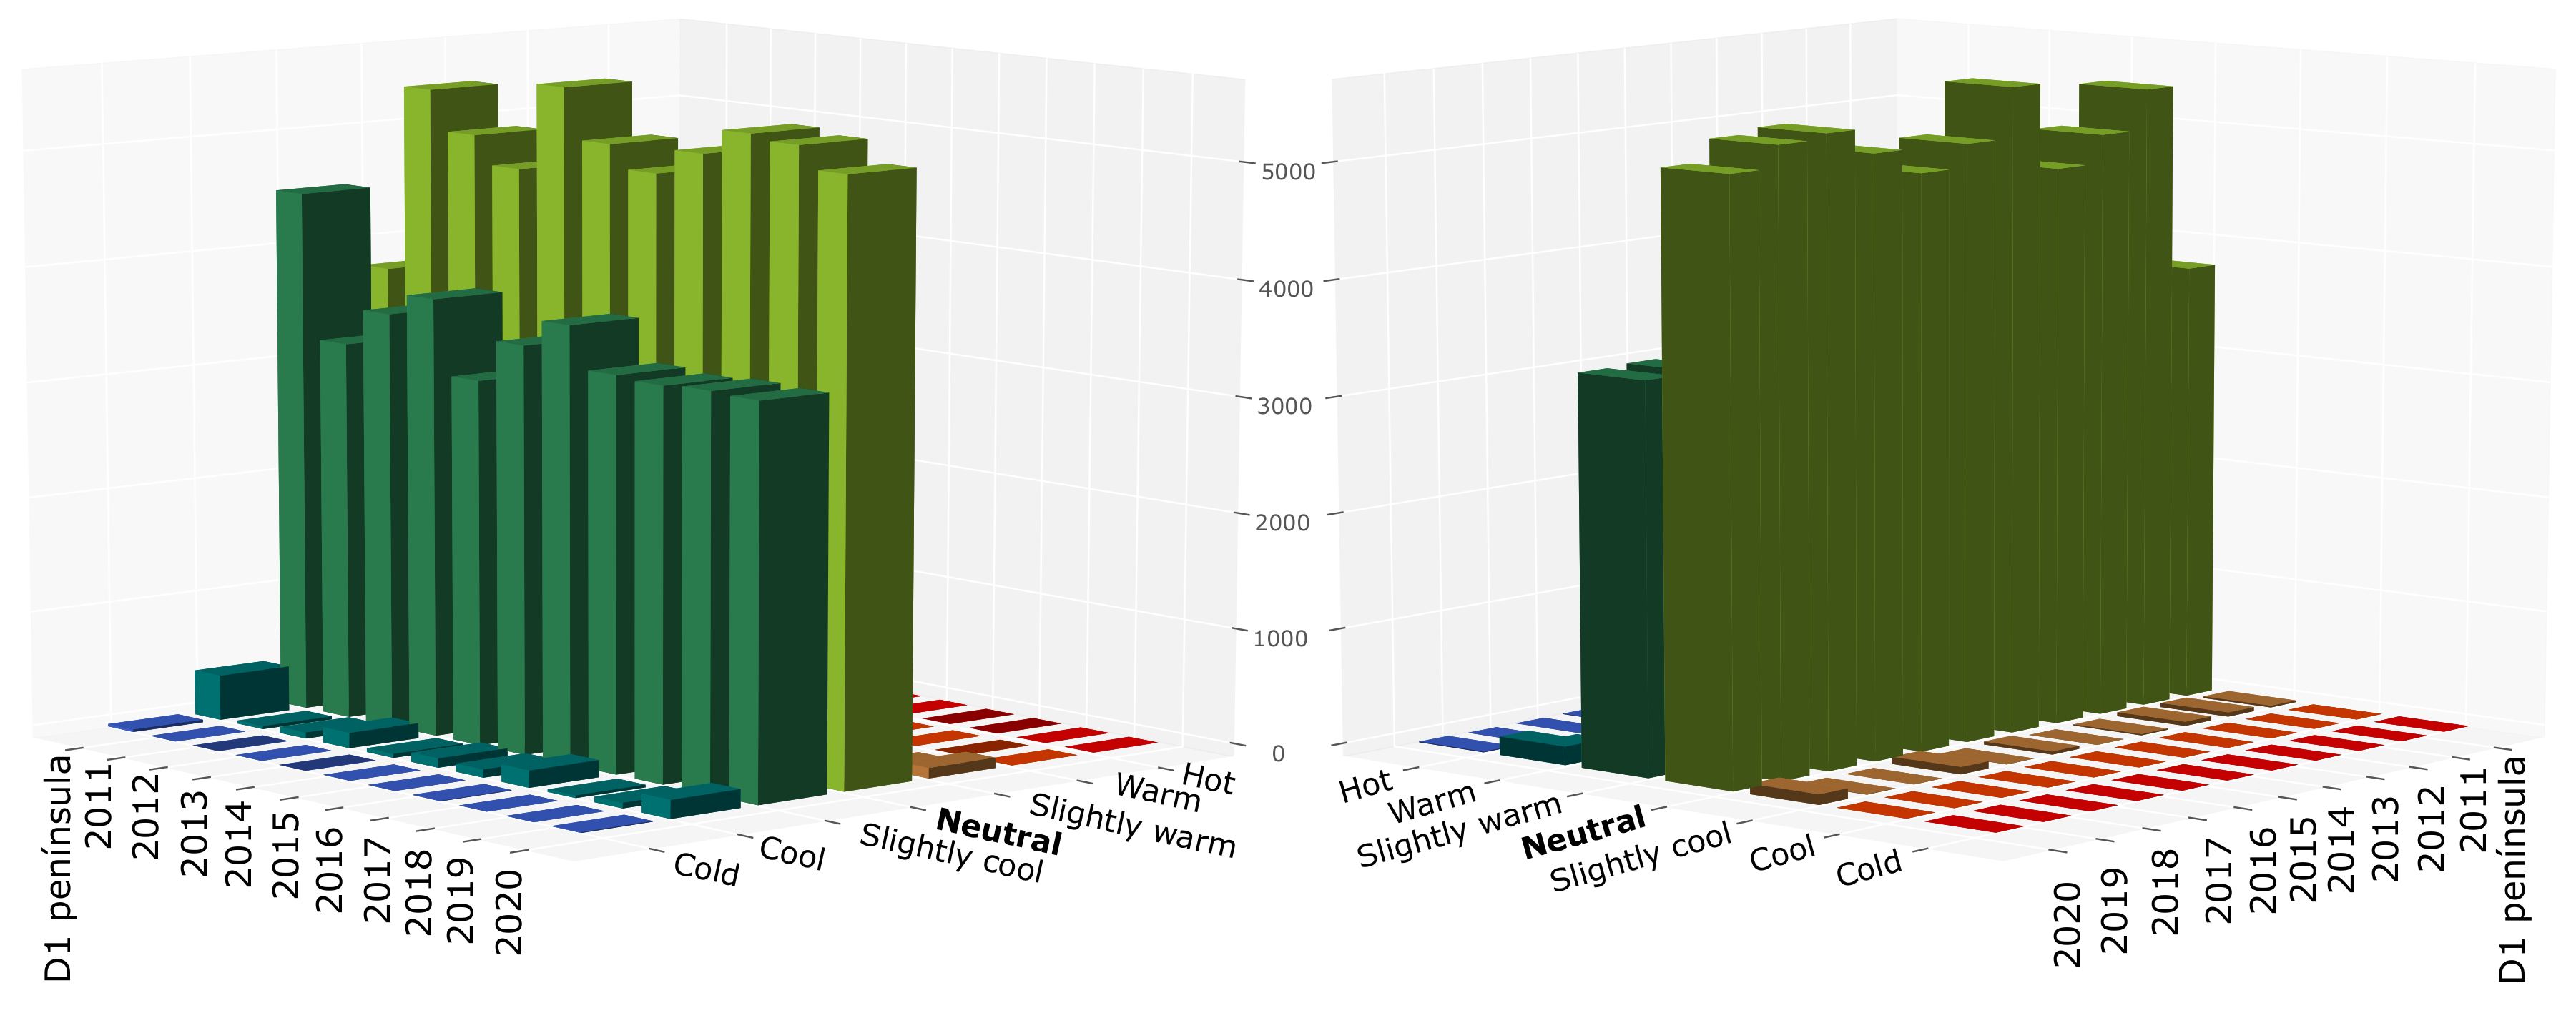
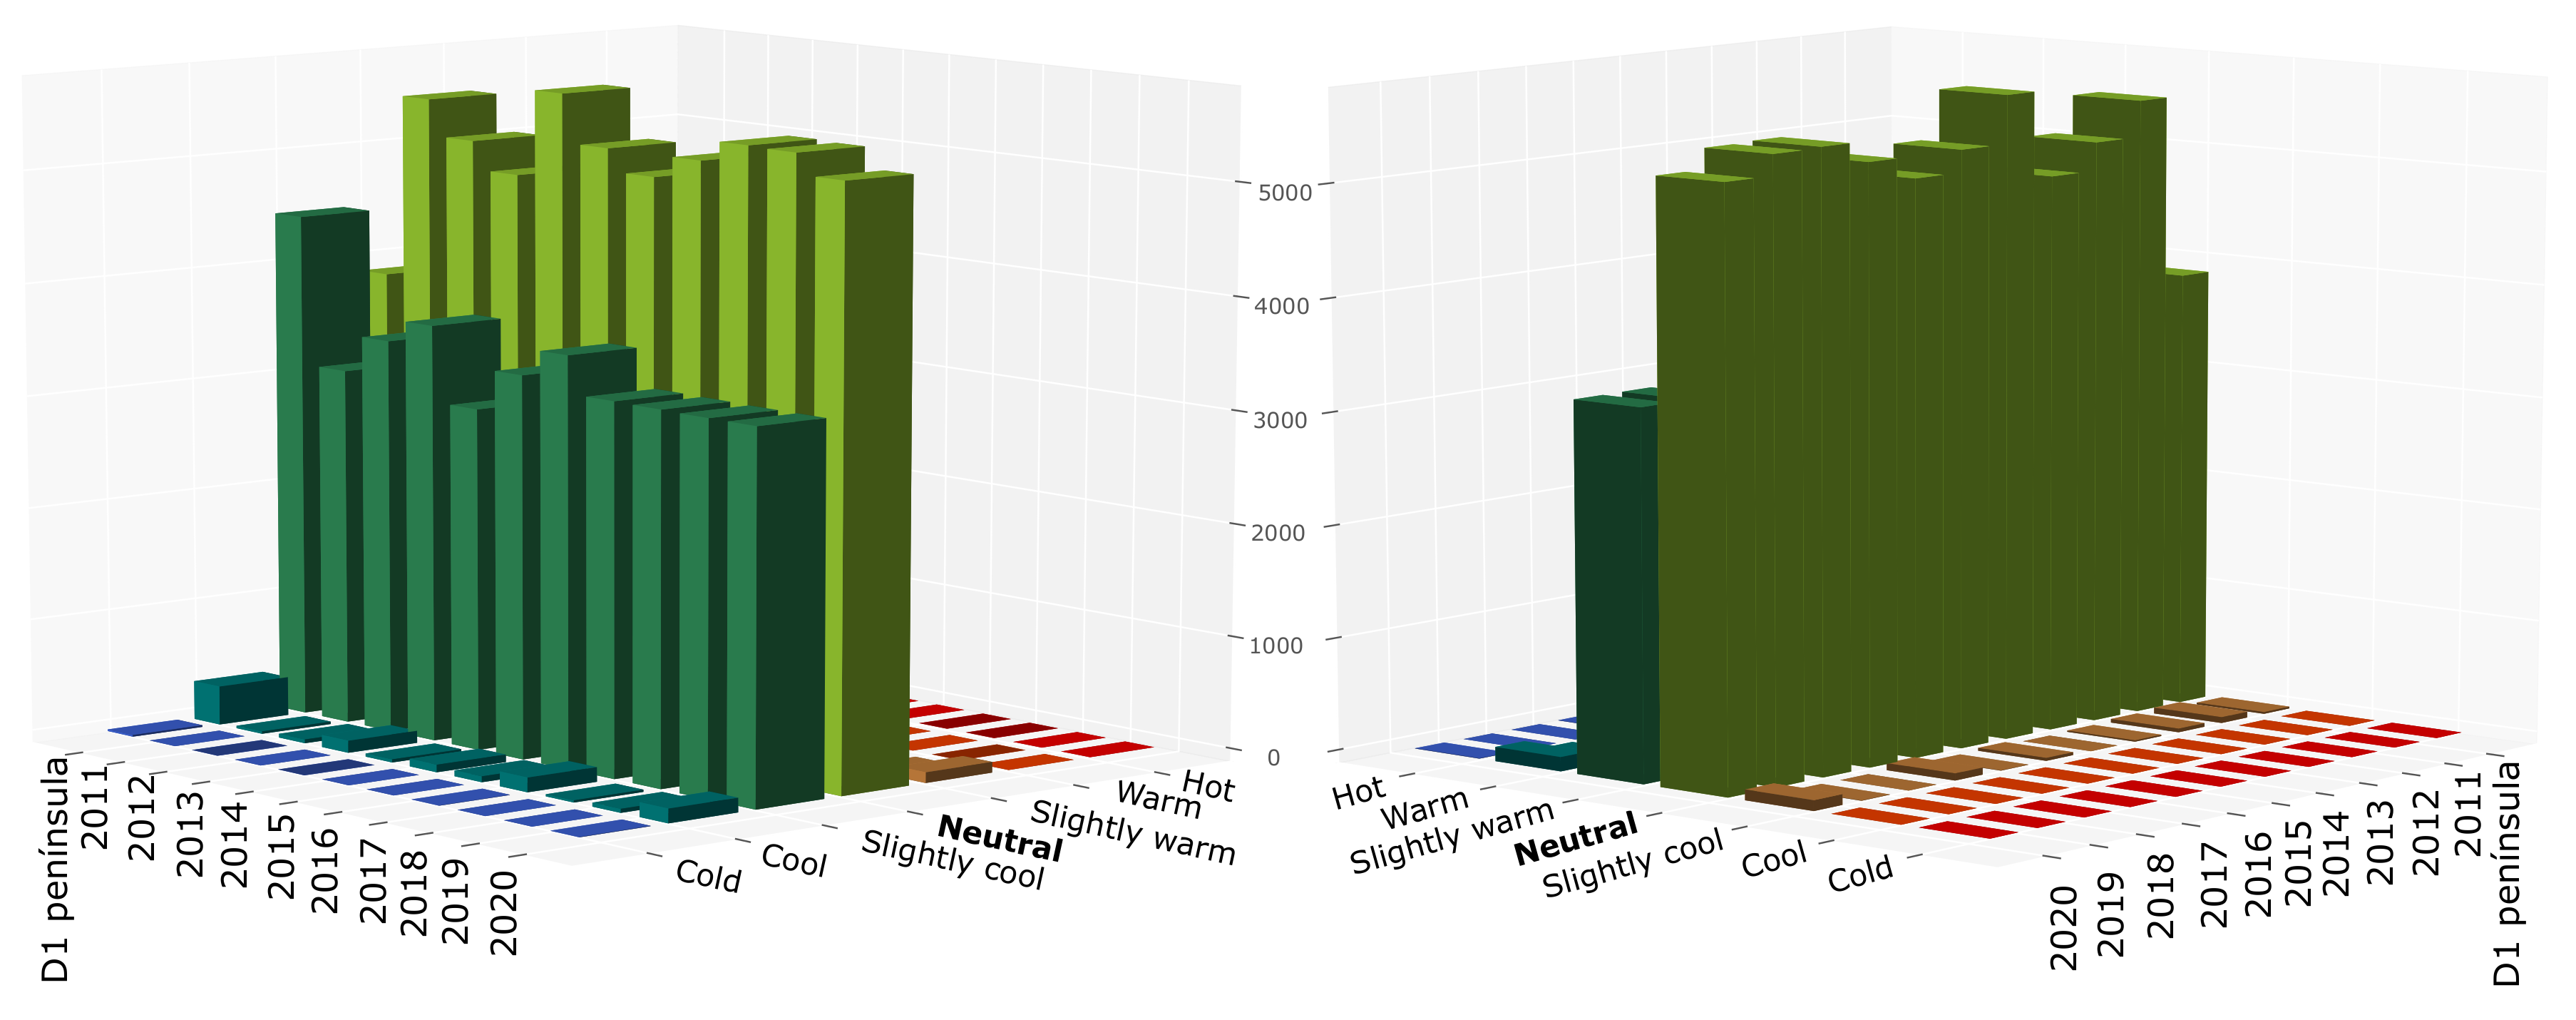
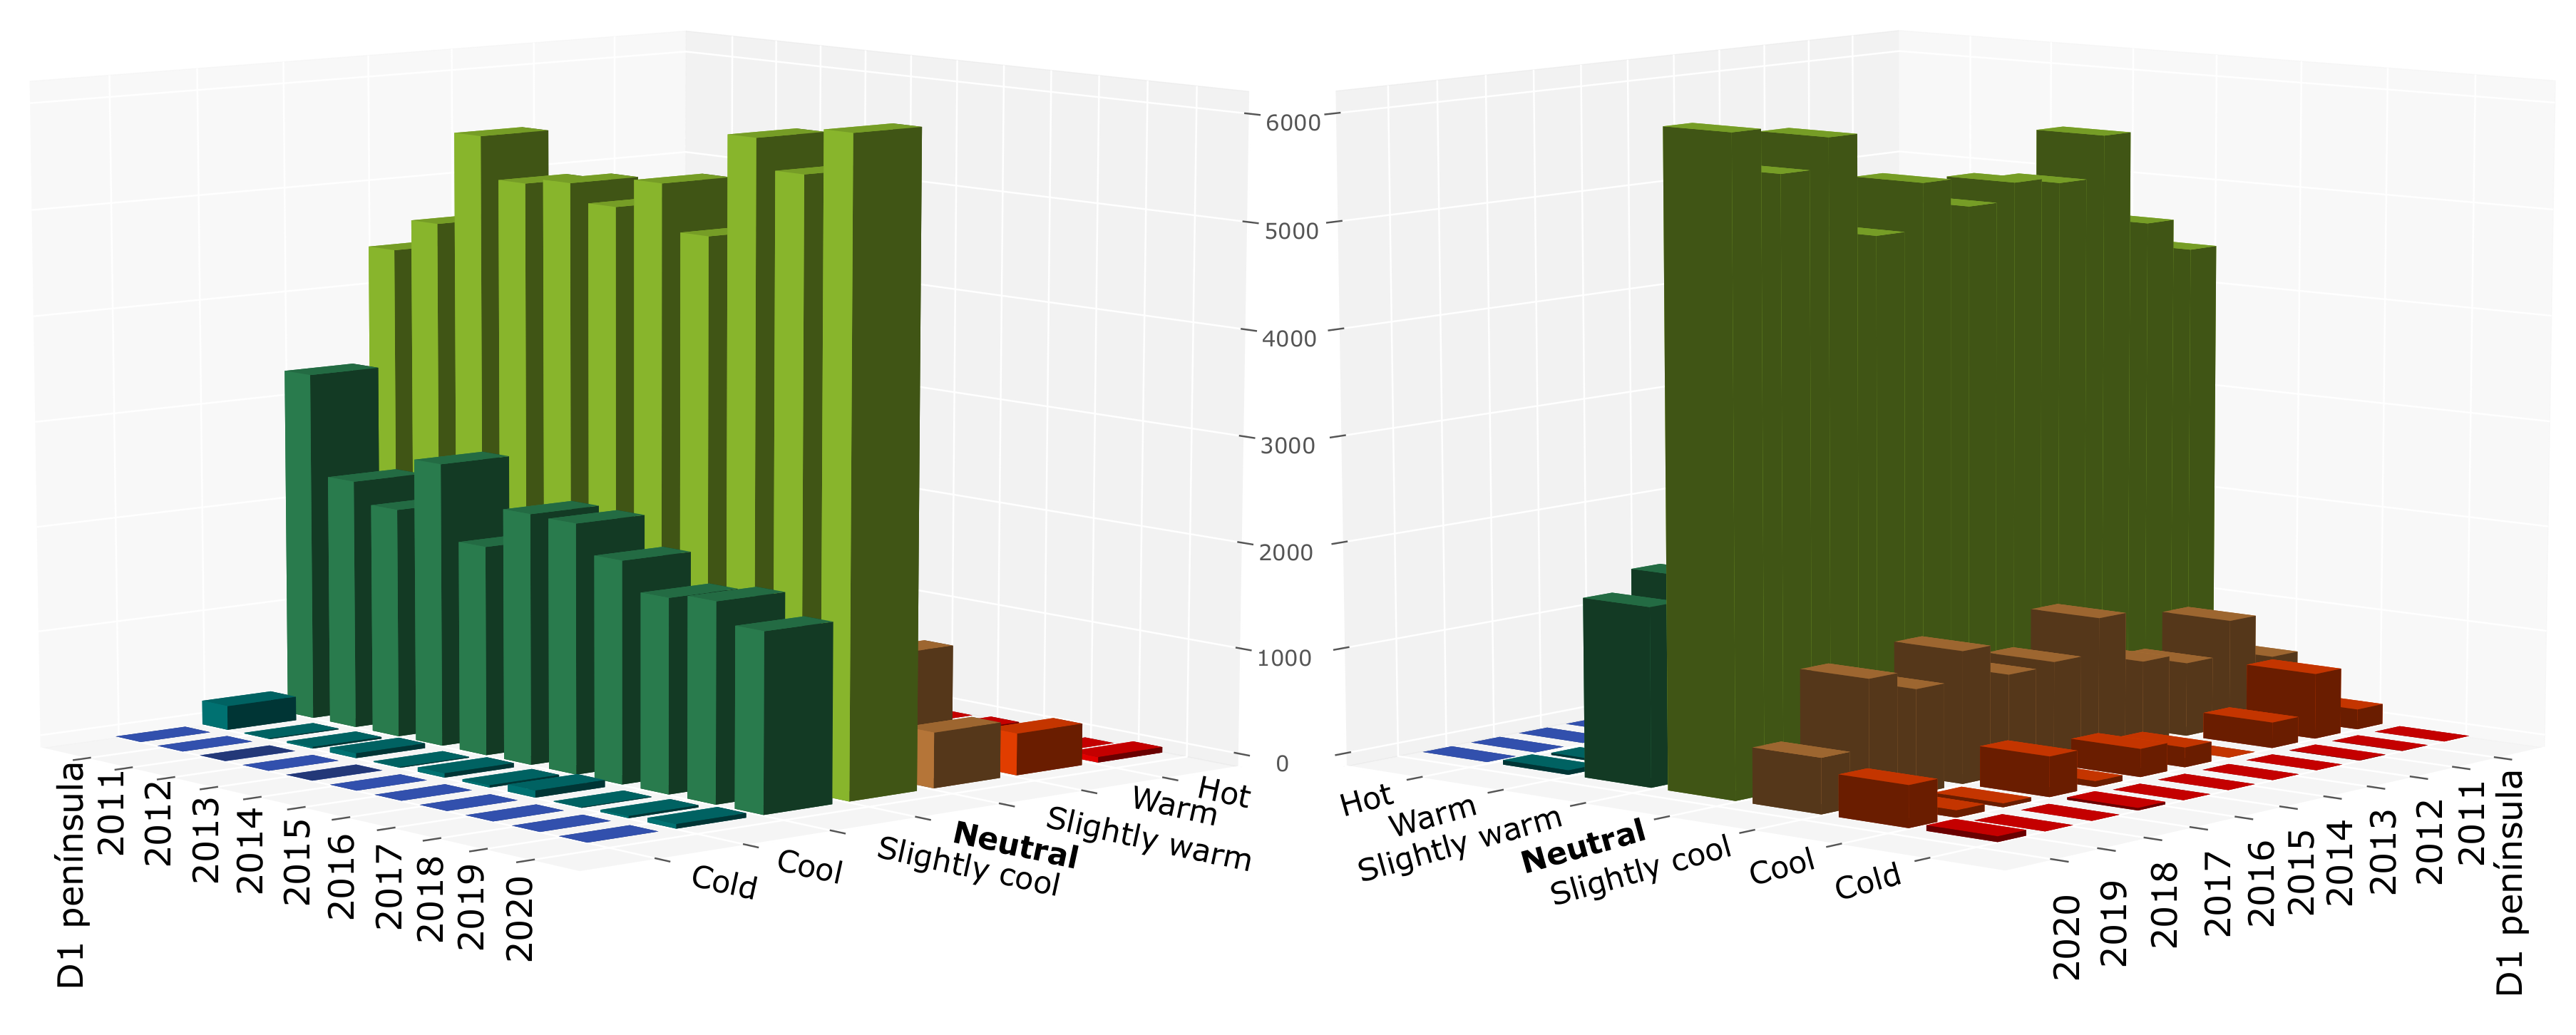
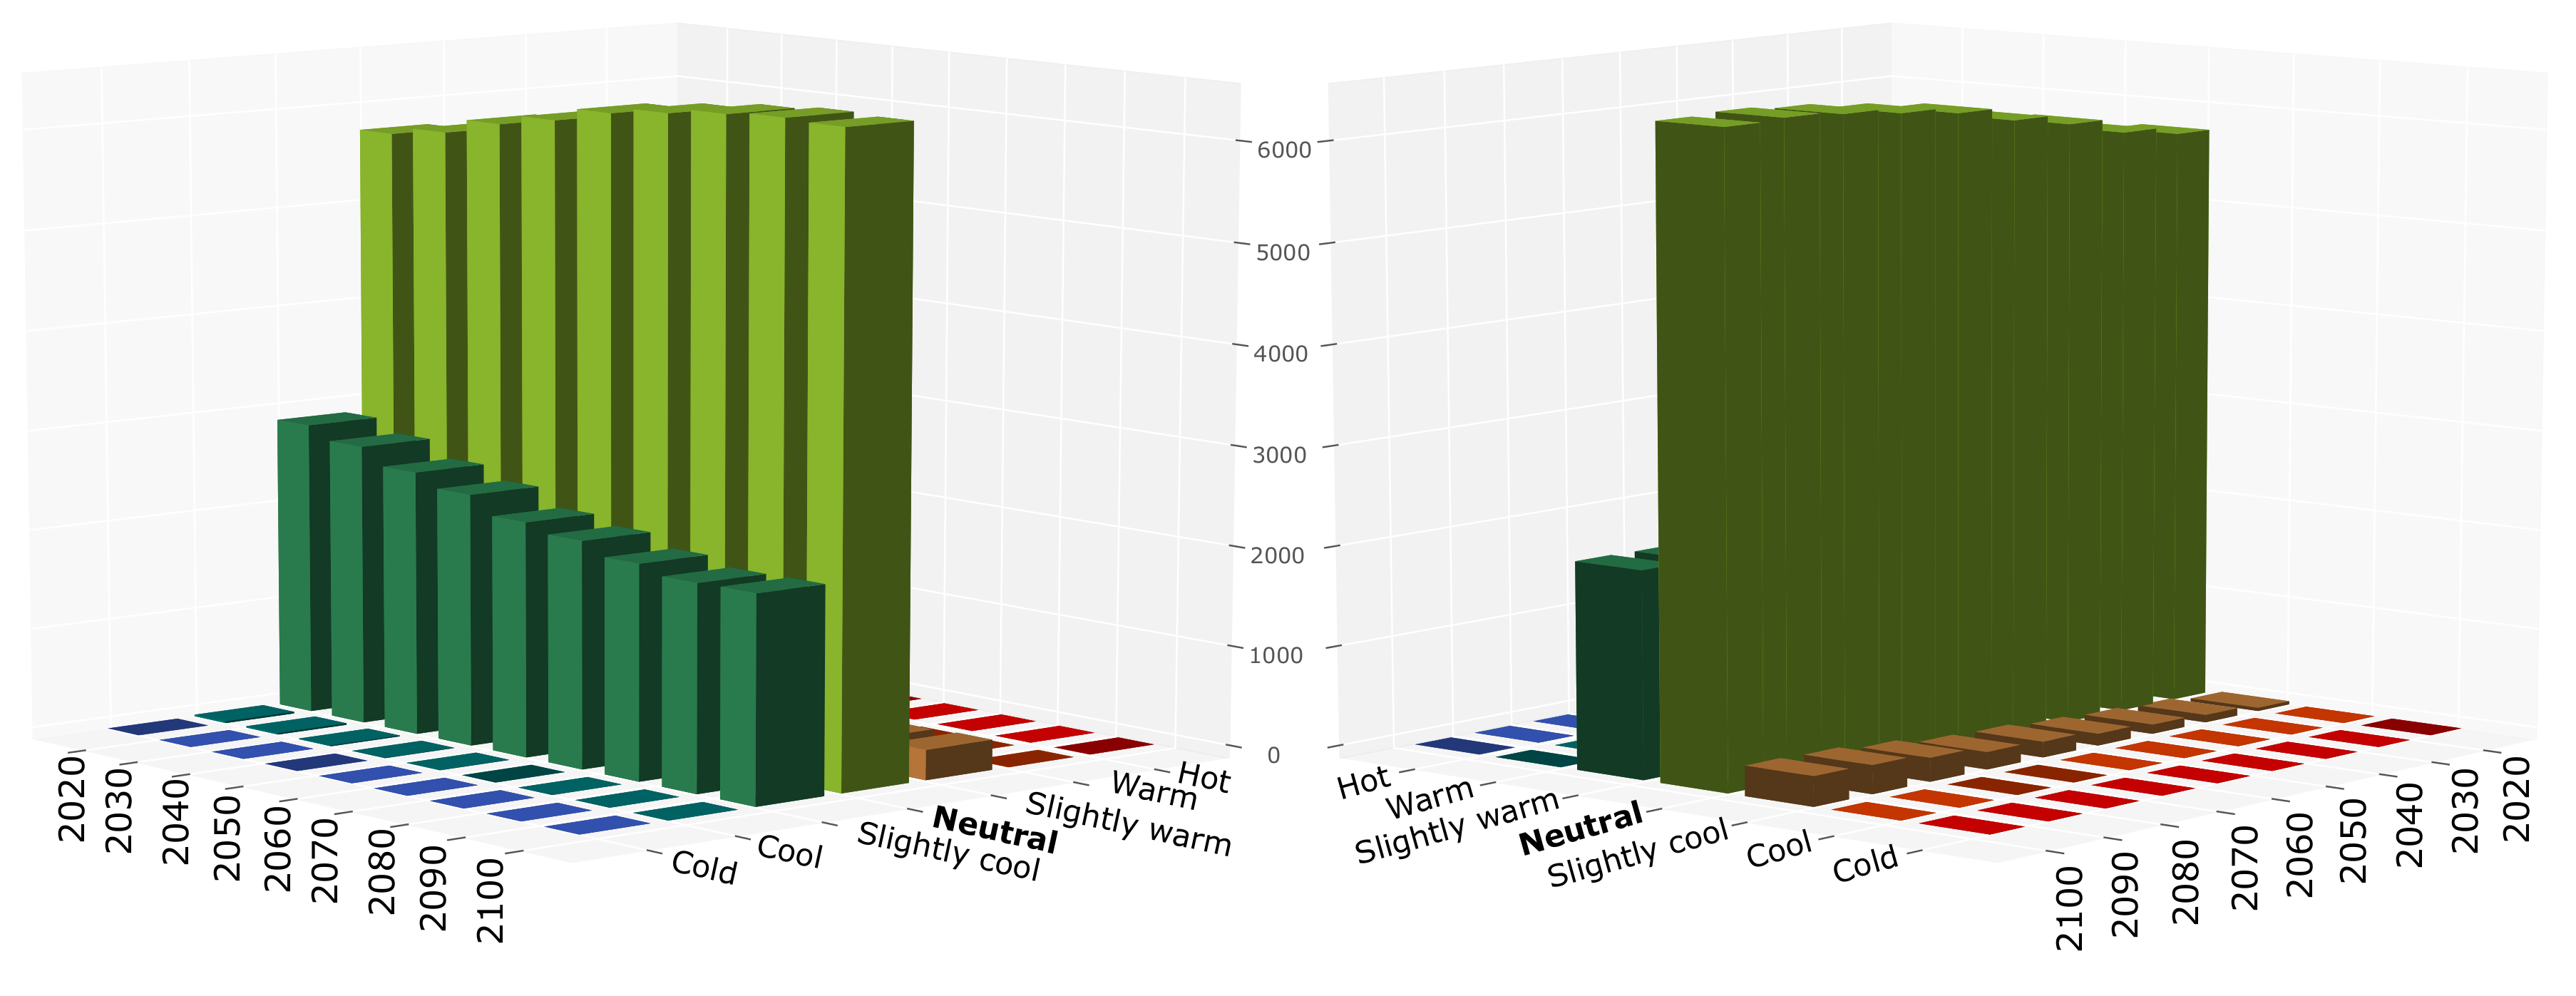
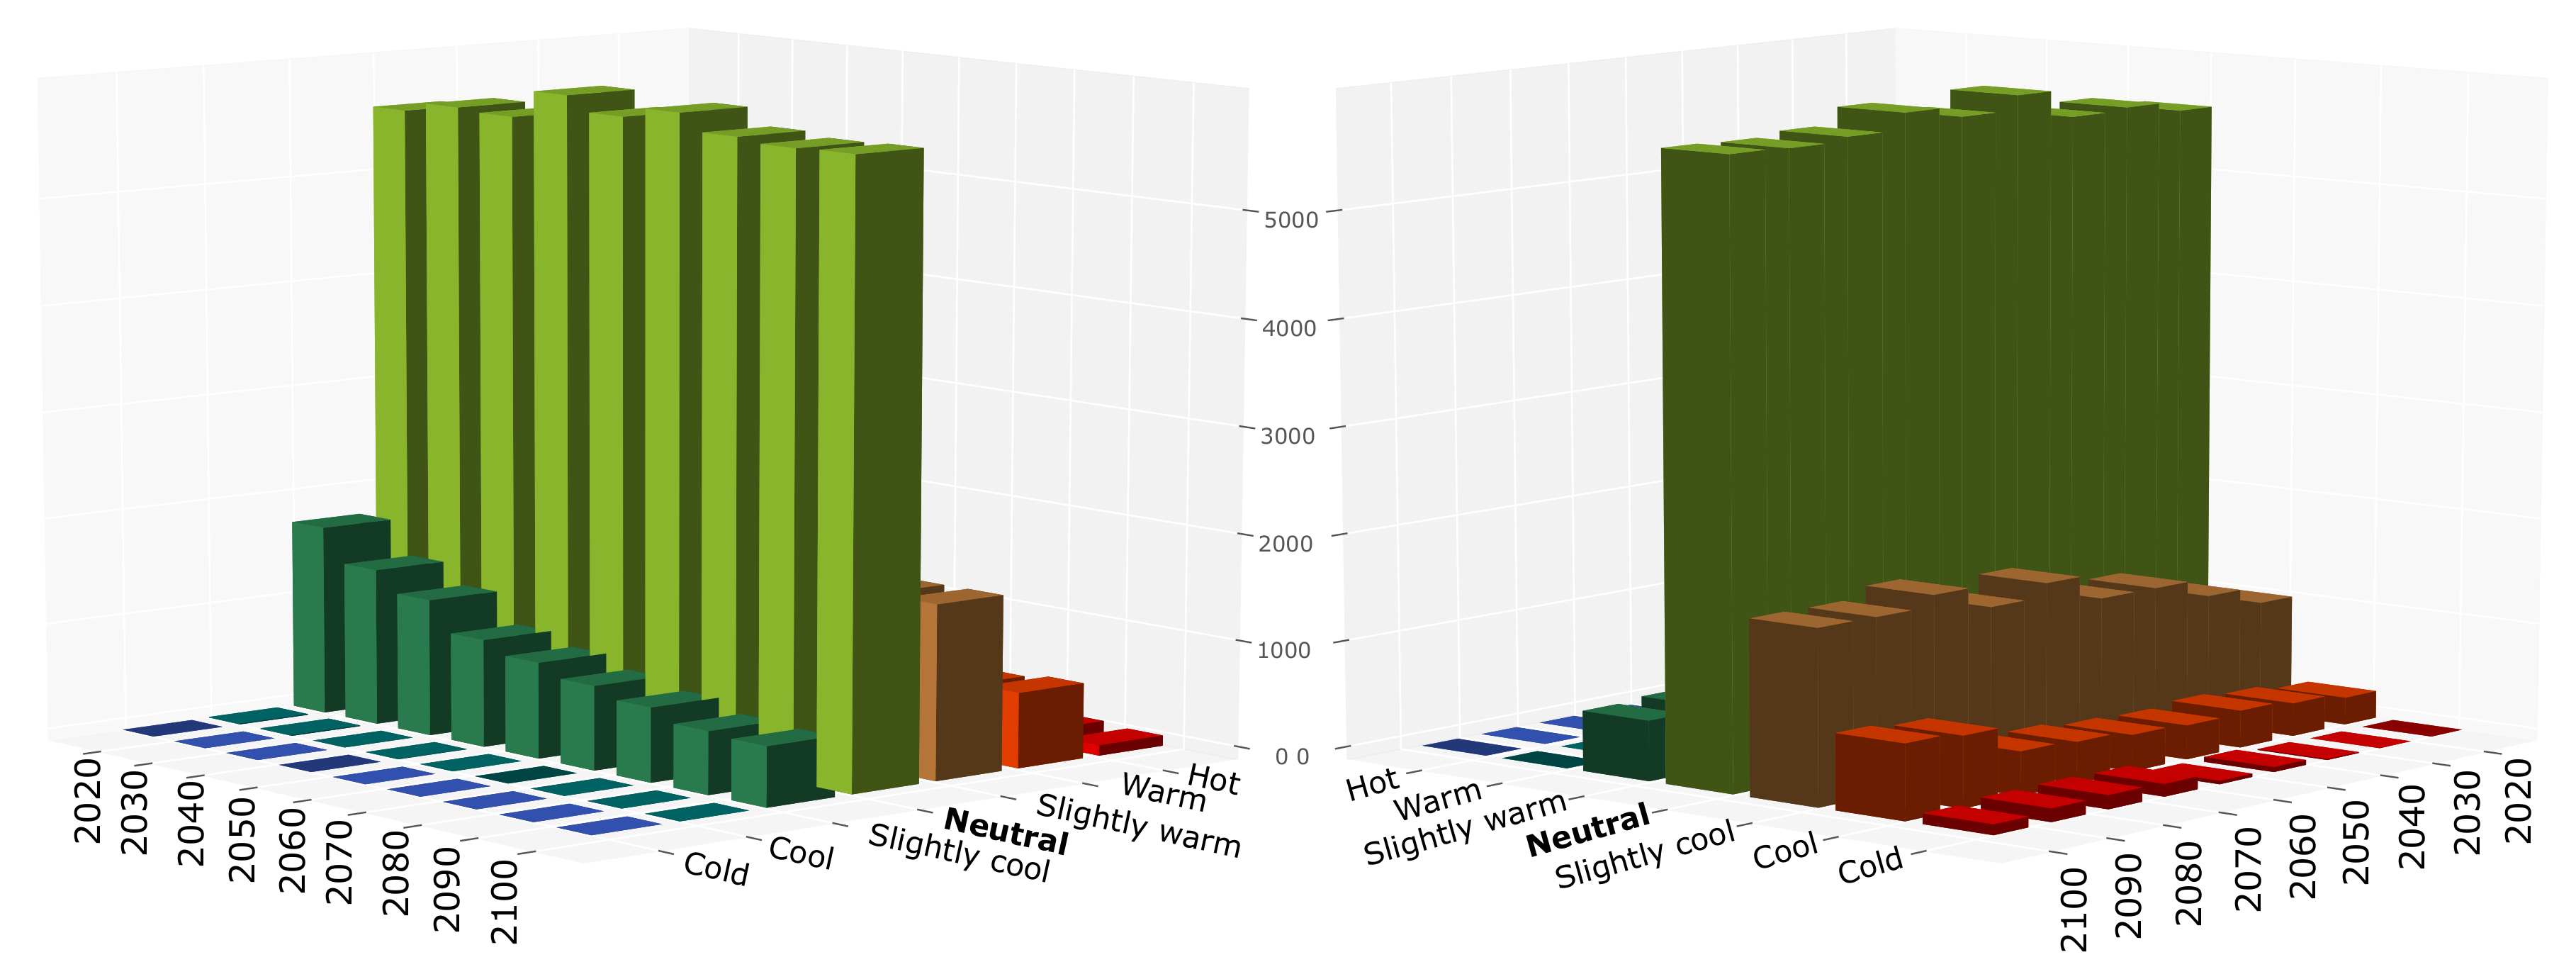
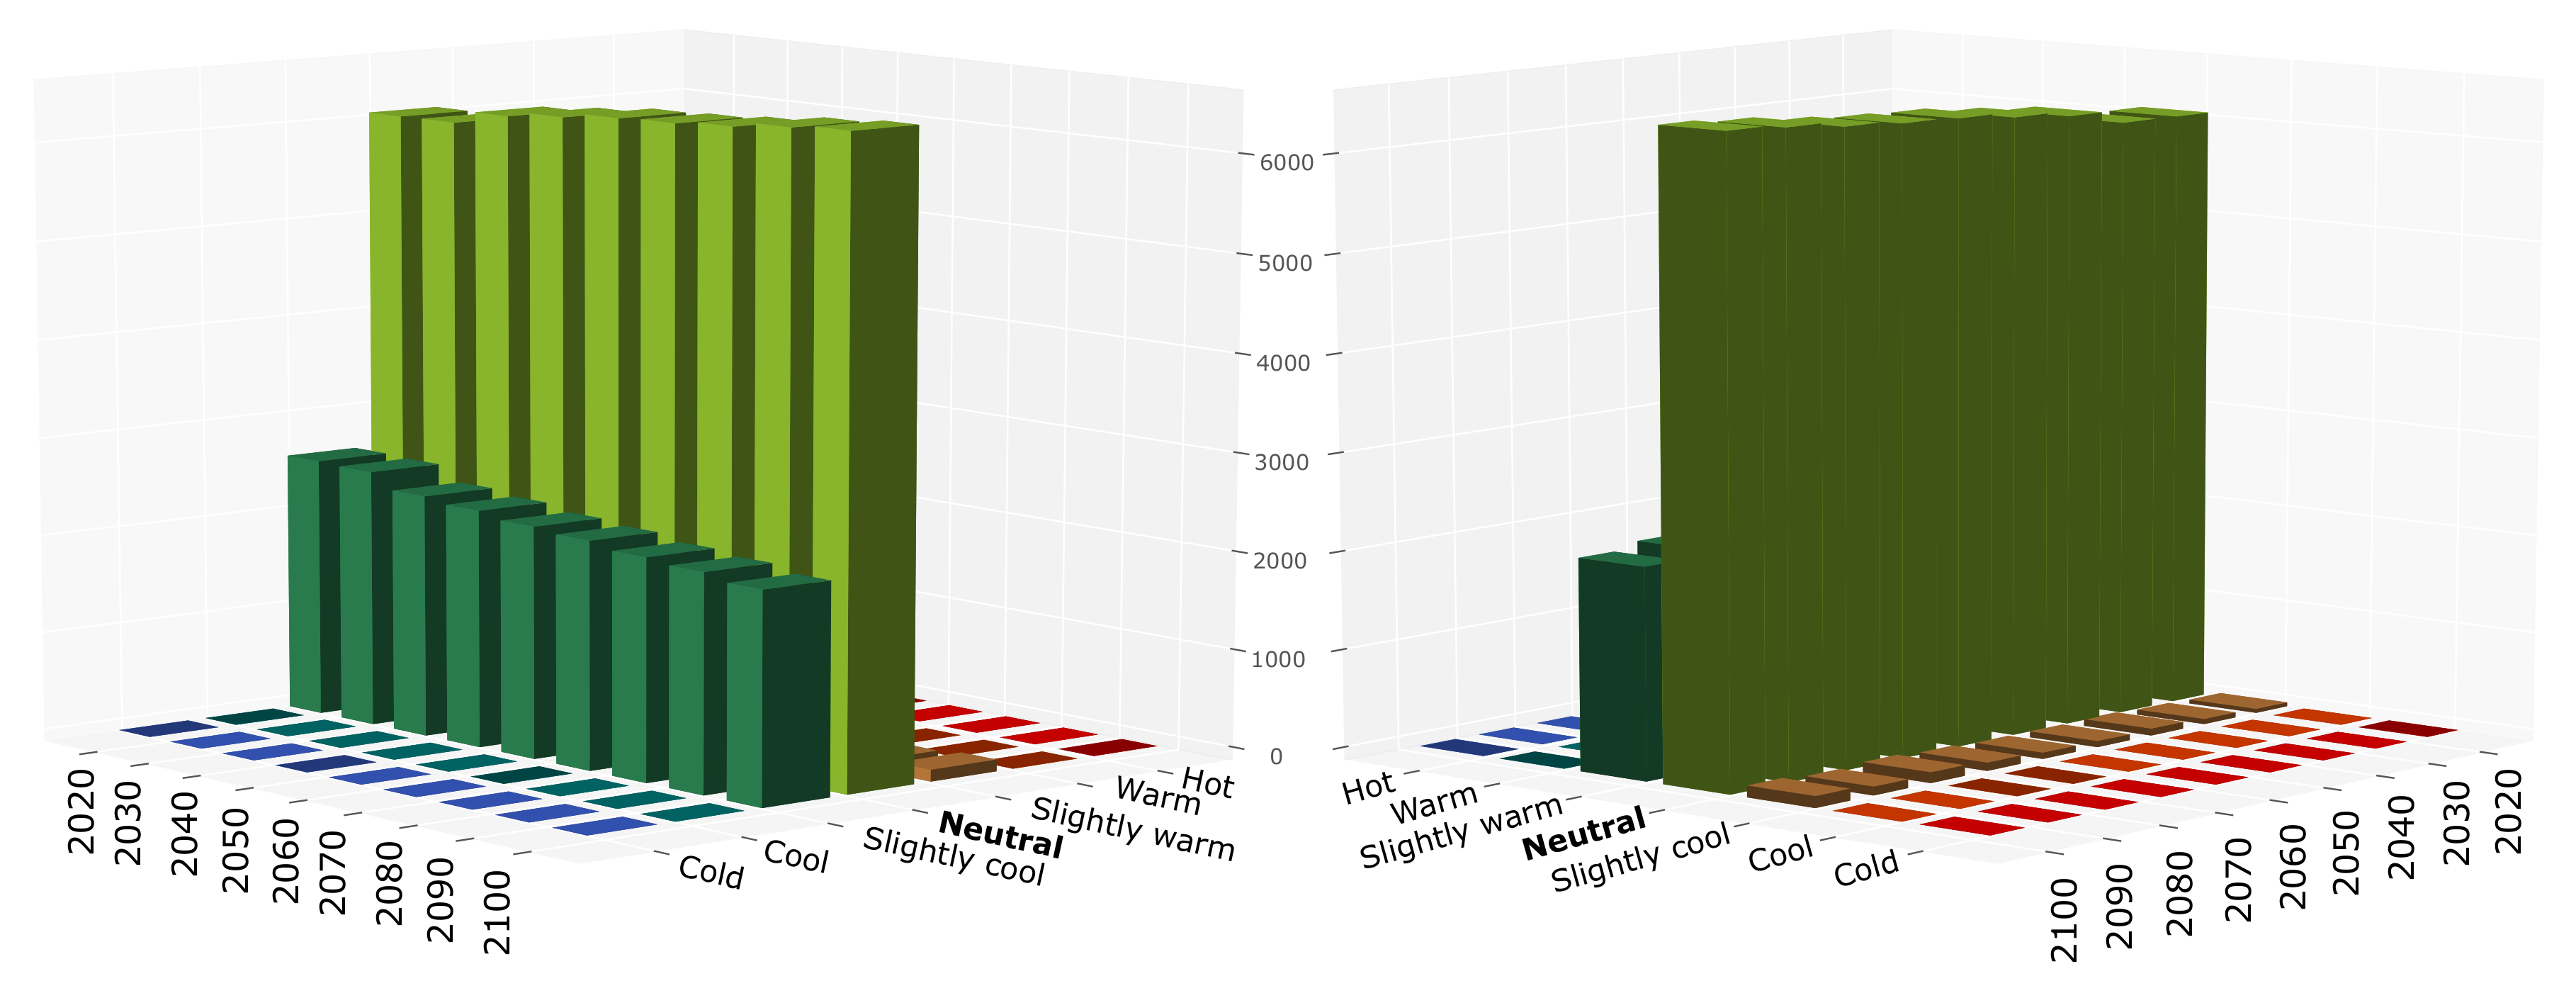
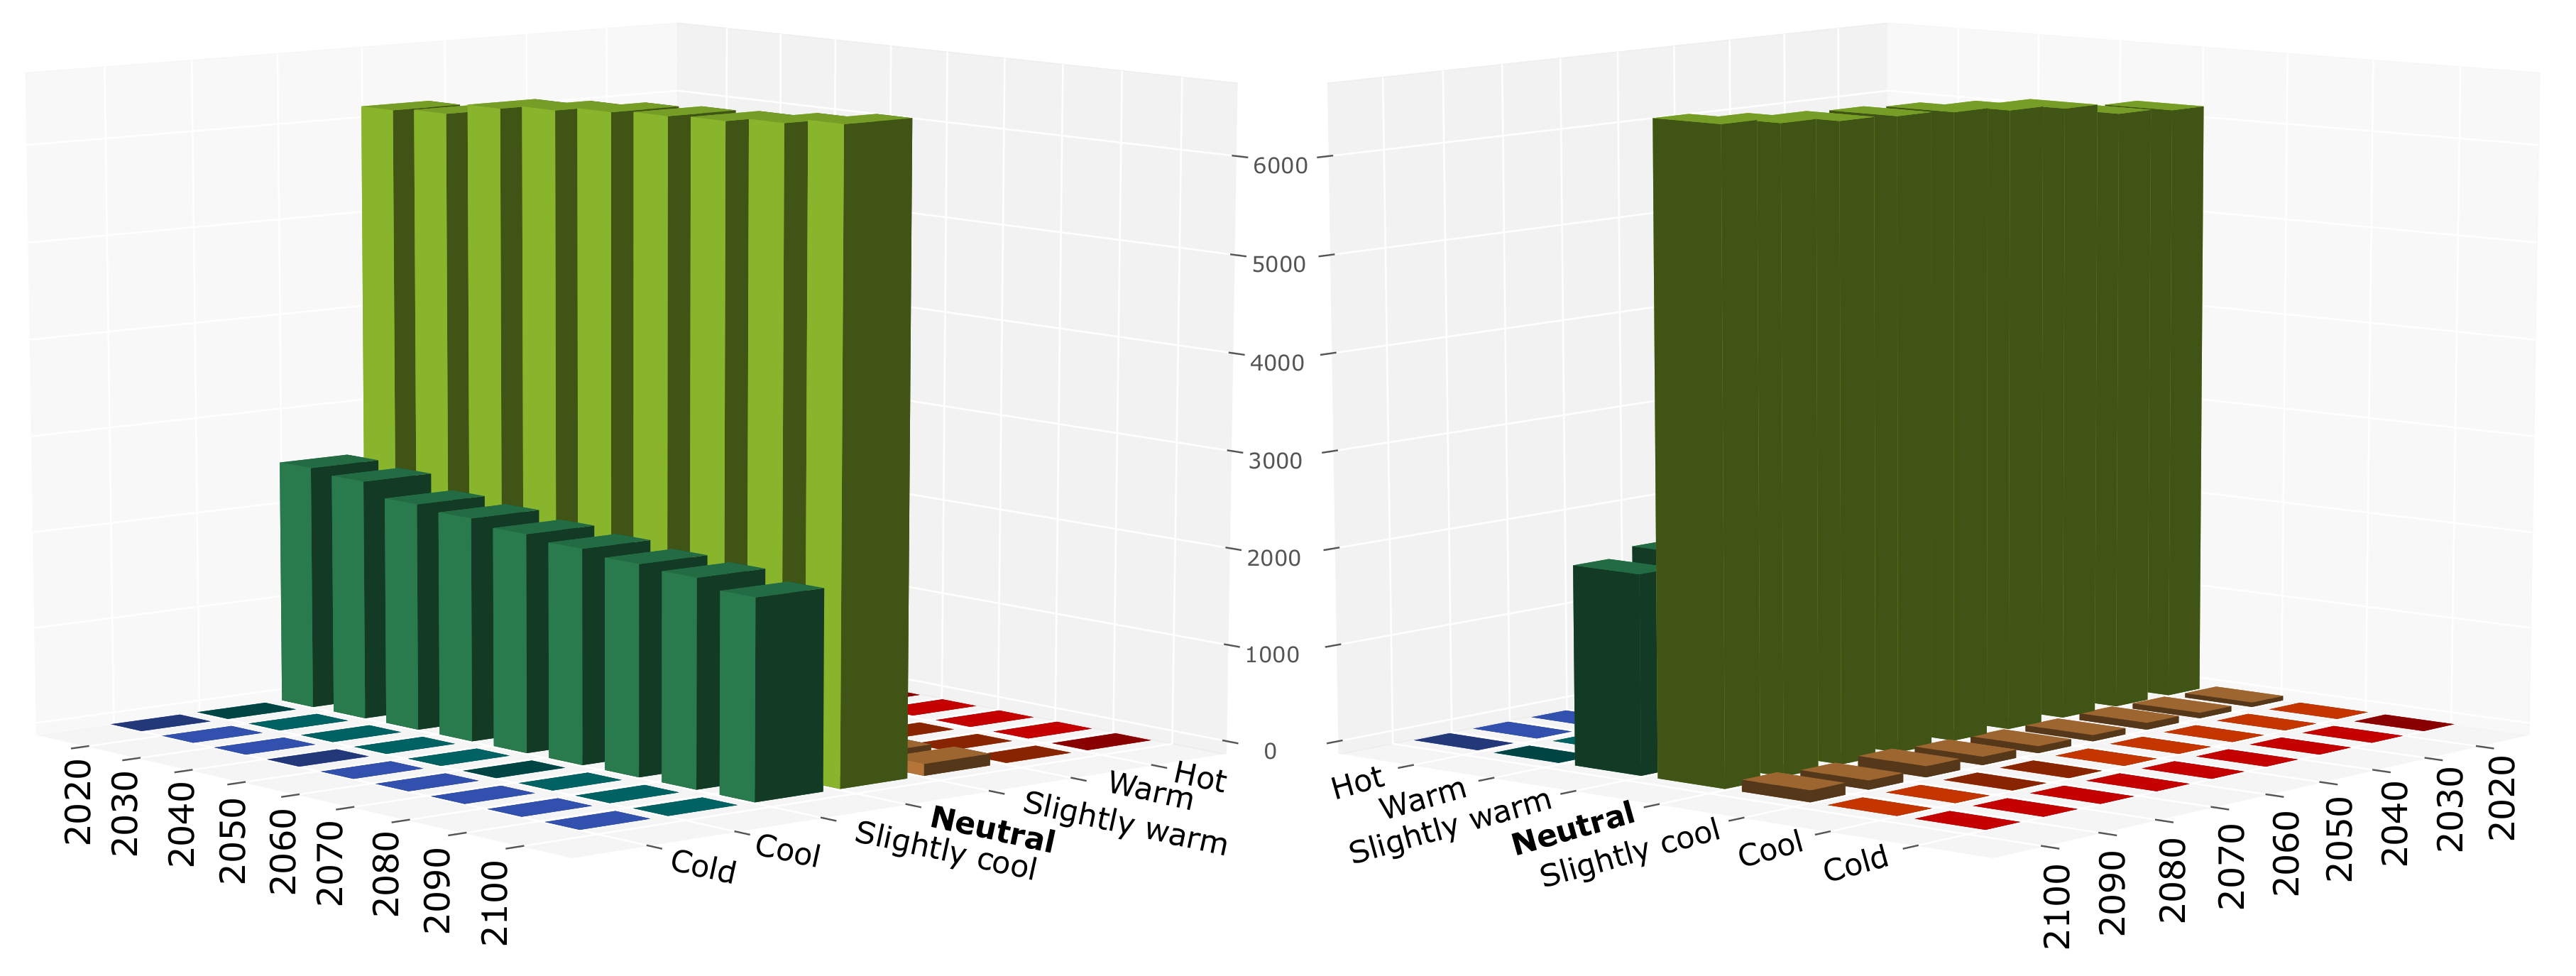
  • Comfort performance of nZEB buildings in the face of climate change. It is also observed that this type of building is not only robust in energy terms, but when analyzing user comfort, its performance is significantly superior by homogenizing and balancing the distribution of thermal sensations in the spaces. This reduces the number of hours with thermal sensations according to Fanger of “slightly cool”, increasing the number of hours in both “slightly warm” and “neutral”. This is due to the greater insulation and airtightness of the spaces in this type of building, which makes the decrease or increase in temperatures when the air conditioning systems are turned off more homogeneous and well-balanced, thus increasing the comfort time of the users.
In summary, nZEB buildings are a safe bet to reduce greenhouse gas emissions while maintaining adequate comfort conditions and being able to adapt to climate oscillations, both current and those predicted in climate change scenarios.

6. Future Works

The comfort analysis used in this study is based on the steady state model or the heat balance, and does not take into account the adaptive comfort due to its dependence on the outside temperature. However, in a future study, both criteria will be analyzed simultaneously, since the adaptive model allows the identification of which times of the year are more critical, being able to subsequently measure comfort using the temperature-based psychophysical Fanger scale. The objective will be to evaluate whether the measures taken to obtain user comfort are cost-effective. Design decisions for the improvement of buildings to ensure adequate comfort conditions throughout the year often involve oversizing the facilities to respond to these critical moments. The quantification and evaluation of these periods in terms of comfort will make it possible to optimize the design and use of facilities subject to slight user discomfort.

Author Contributions

Conceptualization, methodology and validation, G.R.R. and A.O.d.O.; software, data curation, visualization and writing—original draft preparation, G.R.R.; writing—review and editing, G.R.R. and A.O.d.O. All authors have read and agreed to the published version of the manuscript.

Funding

This research received no external funding.

Institutional Review Board Statement

Not applicable.

Informed Consent Statement

Not applicable.

Conflicts of Interest

The authors declare no conflict of interest.

Appendix A. Comfort Analysis (IPCC Weathers)

Figure A1Figure A6 correspond to the user comfort results according to Fanger of the three models (NBE-CT-79, CTE-DB HE 2013 and CTE-DB HE 2019) under the different climate change scenarios established by the IPCC. Figure A1Figure A3 corresponds to scenario A1B and Figure A4Figure A6 to scenario B1. How to interpret each of these graphs is explained in the Section 3.
Figure A1. Comfort results taking into account the NBE CTE-79 standard and the Pamplona weather file generated with Meteonorm based on the IPCC scenario (1AB).
Buildings 12 01755 g0a1
Figure A2. Comfort results taking into account the CTE-2013 standard and the Pamplona weather file generated with Meteonorm based on the IPCC scenario (1AB).
Buildings 12 01755 g0a2
Figure A3. Comfort results taking into account the CTE-2019 standard and the Pamplona weather file generated with Meteonorm based on the IPCC scenario (1AB).
Buildings 12 01755 g0a3
Figure A4. Comfort results taking into account the NBE CTE-79 standard and the Pamplona weather file generated with Meteonorm based on the IPCC scenario (B1).
Buildings 12 01755 g0a4
Figure A5. Comfort results taking into account the CTE-2013 standard and the Pamplona weather file generated with Meteonorm based on the IPCC scenario (B1).
Buildings 12 01755 g0a5
Figure A6. Comfort results taking into account the CTE-2019 standard and the Pamplona weather file generated with Meteonorm based on the IPCC scenario (B1).
Buildings 12 01755 g0a6

References

  1. European Commision. Climate Action, Climate Change, Consequences. Available online: https://ec.europa.eu/clima/climate-change/consequences-climate-change_en (accessed on 26 July 2022).
  2. Paris Agreement on Climate Change. Available online: https://www.consilium.europa.eu/en/policies/climate-change/paris-agreement/ (accessed on 26 July 2022).
  3. The United Nations Secretariat. United Nations Framework Convention on Climate Change. In Proceedings of the Conference of the Parties on Its Twenty-First Session, Paris, France, 30 November–13 December 2015. [Google Scholar]
  4. A European Green Deal, Striving to be the First Climate-Neutral Continent. Available online: https://ec.europa.eu/info/strategy/priorities-2019-2024/european-green-deal_en#documents (accessed on 26 July 2022).
  5. European Commission. Directive 2002/91/EC of the European Parliament and of the Council of 16 December 2002 on the energy performance of buildings. Off. J. Eur. Union 2002, 1, 65–71. [Google Scholar]
  6. European Commission. Directive 2010/31/EU of the European Parliament and of the Council of 19 May 2010 on the energy performance of buildings (recast). Off. J. Eur. Union 2010, 53, 13–35. [Google Scholar]
  7. European Commission. Directive 2018/844 of the European Parliament and of the Council of 30 May 2018 Amending Directive 2010/31/EU on the Energy Performance of Buildings and Directive 2012/27/EU on Energy Efficiency. Available online: https://eur-lex.europa.eu/legal-content/EN/TXT/?uri=uriserv%3AOJ.L_.2018.156.01.0075.01.ENG (accessed on 22 September 2022).
  8. European Commission. Proposal for a Directive of the European Parliament and of the Council on the Energy Performance of Buildings (recast). Available online: https://eur-lex.europa.eu/legal-content/EN/TXT/?uri=celex%3A52021PC0802 (accessed on 22 September 2022).
  9. Erhorn-Kluttig, H.; Erhorn, H. National applications of the NZEB Definition—The Complete Overview. In Concerted Action Energy Performance of Buildings; Fraunhofer Institute for Building Physics: Stuttgart, Germany, 2018. [Google Scholar]
  10. BPIE. Nearly Zero Energy Buildings Definitions Across Europe; BPIE: Brussels, Belgium, 2015. [Google Scholar]
  11. Affordable Zero Energy Building-H2020 project. Definition of Indicators and Assessment Methods for Cost Effective nZEB and Energy+ Buildings. Available online: https://ec.europa.eu/research/participants/documents/downloadPublic?documentIds=080166e5c58728f7&appId=PPGMS (accessed on 7 July 2022).
  12. Hasan, A.; Mohamed, A.; Mohamed, H. Net-and nearly-zero energy buildings: A review of the definitions and case studies. In Proceedings of the Sixth International Conference on Heating, Cooling and Air Conditioning, Tehran, Iran, 26 May 2015. [Google Scholar]
  13. Causone, F.; Tatti, A.; Pietrobon, M.; Zanghirella, F.; Pagliano, L. Yearly operational performance of a nZEB in the Mediterranean climate. Energy Build. 2019, 198, 243–260. [Google Scholar] [CrossRef] [Green Version]
  14. De Gobierno, P. Real Decreto 2429/1979, de 6 de julio, por el que se aprueba la norma básica de edificación NBE-CT-79, sobre condiciones térmicas en los edificios. Boletín Of. del Estado 1979, 253, 24524–24550. [Google Scholar]
  15. CTE Código Técnico de la edificación. Documento Básico de Ahorro de Energía; Spanish technical building code; Government of Spain: Madrid, Spain, 2006. [Google Scholar]
  16. CTE Código Técnico de la edificación. Documento Básico de Ahorro de Energía; Spanish technical building code; Government of Spain: Madrid, Spain, 2017. [Google Scholar]
  17. CTE Código Técnico de la edificación. Documento Básico de Ahorro de Energía; Spanish technical building code; Government of Spain: Madrid, Spain, 2019. [Google Scholar]
  18. Cerezo-Narváez, A.; Piñero-Vilela, J.M.; Ángel Rodríguez-Jara, E.; Otero-Mateo, M.; Pastor-Fernández, A.; Ballesteros-Pérez, P. Energy, emissions and economic impact of the new nZEB regulatory framework on residential buildings renovation: Case study in southern Spain. J. Build. Eng. 2021, 42, 103054. [Google Scholar] [CrossRef]
  19. Javier García-Ballano, C.; Ruiz-Varona, A.; Monné Bailo, C.; Cabello Matud, C. Monitoring of housing blocks in Zaragoza (Spain) to validate the energy savings calculation method for the renovation of nZEB dwellings. Energy Build. 2022, 256, 111737. [Google Scholar] [CrossRef]
  20. Al Dakheel, J.; Del Pero, C.; Aste, N.; Leonforte, F. Smart buildings features and key performance indicators: A review. Sustain. Cities Soc. 2020, 61, 102328. [Google Scholar] [CrossRef]
  21. Aste, N.; Adhikari, R.; Buzzetti, M.; Del Pero, C.; Huerto-Cardenas, H.; Leonforte, F.; Miglioli, A. nZEB: Bridging the gap between design forecast and actual performance data. Energy Built Environ. 2022, 3, 16–29. [Google Scholar] [CrossRef]
  22. Picard, T.; Hong, T.; Luo, N.; Lee, S.H.; Sun, K. Robustness of energy performance of Zero-Net-Energy (ZNE) homes. Energy Build. 2020, 224, 110251. [Google Scholar] [CrossRef]
  23. Nik, V.M.; Coccolo, S.; Kämpf, J.; Scartezzini, J.L. Investigating the importance of future climate typology on estimating the energy performance of buildings in the EPFL campus. Energy Procedia 2017, 122, 1087–1092. [Google Scholar] [CrossRef]
  24. D’Agostino, D.; Parker, D.; Epifani, I.; Crawley, D.; Lawrie, L. How will future climate impact the design and performance of nearly zero energy buildings (NZEBs)? Energy 2022, 240, 122479. [Google Scholar] [CrossRef]
  25. Ascione, F.; De Masi, R.F.; Gigante, A.; Vanoli, G.P. Resilience to the climate change of nearly zero energy-building designed according to the EPBD recast: Monitoring, calibrated energy models and perspective simulations of a Mediterranean nZEB living lab. Energy Build. 2022, 262, 112004. [Google Scholar] [CrossRef]
  26. Dartevelle, O.; van Moeseke, G.; Mlecnik, E.; Altomonte, S. Long-term evaluation of residential summer thermal comfort: Measured vs. perceived thermal conditions in nZEB houses in Wallonia. Build. Environ. 2021, 190, 107531. [Google Scholar] [CrossRef]
  27. Attia, S.; Kurnitski, J.; Kosiński, P.; Borodiņecs, A.; Deme Belafi, Z.; István, K.; Krstić, H.; Moldovan, M.; Visa, I.; Mihailov, N.; et al. Overview and future challenges of nearly zero-energy building (nZEB) design in Eastern Europe. Energy Build. 2022, 267, 112165. [Google Scholar] [CrossRef]
  28. Yang, L.; Yan, H.; Lam, J.C. Thermal comfort and building energy consumption implications—A review. Appl. Energy 2014, 115, 164–173. [Google Scholar] [CrossRef]
  29. Van Hoof, J. Forty years of Fanger’s model of thermal comfort: Comfort for all? Indoor Air 2008, 18, 182–201. [Google Scholar] [CrossRef] [PubMed]
  30. Fanger, P.O. Assessment of man’s thermal comfort in practice. Occup. Environ. Med. 1973, 30, 313–324. [Google Scholar] [CrossRef] [PubMed] [Green Version]
  31. UNE-EN ISO 7730: 2006; Ergonomics of the Thermal Environment–Analytical Determination and Interpretation of Thermal Comfort Using Calculation of the PMV and PPD Indices and Local Thermal Comfort Criteria. International Organization for Standardization: Geneva, Switzerland, 2006.
  32. ASHRAE. ASHRAE 55: 1992 Thermal Environmental Conditions for Human Occupancy; ASHRAE Standard: Atlanta, GA, USA, 1992. [Google Scholar]
  33. ASHRAE. ASHRAE 55: 2010 Thermal Environmental Conditions for Human Occupancy; ASHRAE Standard: Atlanta, GA, USA, 2010. [Google Scholar]
  34. ASHRAE. ASHRAE 55: 2020 Thermal Environmental Conditions for Human Occupancy; ASHRAE Standard: Atlanta, GA, USA, 2020. [Google Scholar]
  35. UNE-EN 16798-1:2020; Energy Performance of Buildings-Ventilation for Buildings-Part 1: Indoor Environmental Input Parameters for Design and Assessment of Energy Performance of Buildings Addressing Indoor Air Quality, Thermal Environment, Lighting and Acoustics-Module M1-6. International Organization for Standardization: Geneva, Switzerland, 2020.
  36. UNE-EN 15251:2008; Indoor Environmental Input Parameters for Design and Assessment of Energy Performance of Buildings Addressing Indoor Air Quality, Thermal Environment, Lighting and Acoustics. International Organization for Standardization: Geneva, Switzerland, 2008.
  37. Crawley, D.B.; Lawrie, L.K.; Winkelmann, F.C.; Buhl, W.; Huang, Y.; Pedersen, C.O.; Strand, R.K.; Liesen, R.J.; Fisher, D.E.; Witte, M.J.; et al. EnergyPlus: Creating a new-generation building energy simulation program. Energy Build. 2001, 33, 319–331. [Google Scholar] [CrossRef]
  38. Nguyen, A.T.; Reiter, S.; Rigo, P. A review on simulation-based optimization methods applied to building performance analysis. Appl. Energy 2014, 113, 1043–1058. [Google Scholar] [CrossRef]
  39. Henninger, R.H.; Witte, M.J. EnergyPlus Testing with ANSI/ASHRAE Standard 140-2001 (BESTEST); US Department of Energy: Washington, DC, USA, 2004. [Google Scholar]
  40. Henninger, R.H.; Witte, M.J.; Crawley, D.B. Analytical and comparative testing of EnergyPlus using IEA HVAC BESTEST E100–E200 test suite. Energy Build. 2004, 36, 855–863. [Google Scholar] [CrossRef]
  41. Building Energy Simulation Test-Generation Simulation and Reporting (BESTEST-GSR). Available online: https://github.com/NREL/BESTEST-GSR (accessed on 22 September 2022).
  42. OpenStudio Whole Building Energy Modeling using EnergyPlus and Advanced Daylight Analysis Using RADIANCE. Available online: https://openstudio.net/ (accessed on 22 September 2022).
  43. Guglielmetti, R.; Macumber, D.; Long, N. OpenStudio: An Open Source Integrated Analysis Platform; Technical Report; National Renewable Energy Lab.(NREL): Golden, CO, USA, 2011. [Google Scholar]
  44. SG SAVE: Verificación del CTE-HE con EnergyPlus. Available online: http://www.efinovatic.es/energyPlus/ (accessed on 22 September 2022).
  45. CTE Código Técnico de la edificación. Documento Básico de Ahorro de Energía; Spanish technical building code; Government of Spain: Madrid, Spain, 2013. [Google Scholar]
  46. IPCC, A. The Intergovernmental Panel on Climate Change (IPCC); World Meteorological Organization, IPCC Secr. 2022. Available online: https://www.ipcc.ch/ (accessed on 22 September 2022).
  47. IPCC. Summary for Policymakers: H.-O. Pörtner, D.C. Roberts, E.S. Poloczanska, K. Mintenbeck, M. Tignor, A. Alegría, M. Craig, S. Langsdorf, S. Löschke, V. Möller, A. Okem (Eds.); IPCC Sixth Assessment Report; IPCC: Geneva, Switzerland, 2022. [Google Scholar]
  48. Bhandari, M.; Shrestha, S.; New, J. Evaluation of weather datasets for building energy simulation. Energy Build. 2012, 49, 109–118. [Google Scholar] [CrossRef]
  49. Henze, G.P.; Pfafferott, J.; Herkel, S.; Felsmann, C. Impact of adaptive comfort criteria and heat waves on optimal building thermal mass control. Energy Build. 2007, 39, 221–235. [Google Scholar] [CrossRef]
  50. Meteonavarra: Meteorology and Climatology of Navarra, Pamplona. Available online: http://meteo.navarra.es/estaciones/estacion.cfm?IDestacion=455 (accessed on 7 October 2022).
  51. AEMET Agencia Estatal de Meteorología. Listado de provincias afectadas por las Olas de calor registradas desde 1975. 2021. Available online: https://www.aemet.es/documentos/es/conocermas/recursos_en_linea/publicaciones_y_estudios/estudios/Olas_calor/RelacionProvincias2021.pdf (accessed on 22 September 2022).
  52. AEMET Agencia Estatal de Meteorología. Listado de Provincias Afectadas por las Olas de frío Registradas Desde 1975; AEMET Agencia Estatal de Meteorología: Madrid, Spain, 2021. [Google Scholar]
  53. Moazami, A.; Nik, V.M.; Carlucci, S.; Geving, S. Impacts of future weather data typology on building energy performance—Investigating long-term patterns of climate change and extreme weather conditions. Appl. Energy 2019, 238, 696–720. [Google Scholar] [CrossRef]
  54. Jentsch, M.F.; Bahaj, A.S.; James, P.A. Climate change future proofing of buildings—Generation and assessment of building simulation weather files. Energy Build. 2008, 40, 2148–2168. [Google Scholar] [CrossRef]
  55. Dickinson, R.; Brannon, B. Generating future weather files for resilience. In Proceedings of the International Conference on Passive and Low Energy Architecture, Los Angeles, CA, USA, 11–13 July 2016; pp. 11–13. [Google Scholar]
  56. Remund, J.; Kunz, S. Meteonorm, Version 7. Meteotest. 2020. Available online: www.meteotest.com (accessed on 22 September 2022).
  57. Remund, J.; Müller, S.; Schilter, C.; Rihm, B. The use of Meteonorm weather generator for climate change studies. In Proceedings of the 10th EMS Annual Meeting, Zürich, Switzerland, 13–17 September 2010; p. EMS2010-417. [Google Scholar]
  58. Belcher, S.E.; Hacker, J.N.; Powell, D.S. Constructing design weather data for future climates. Build. Serv. Eng. Res. Technol. 2005, 26, 49–61. [Google Scholar] [CrossRef]
  59. Pachauri, R.K.; Reisinger, A. Climate Change 2007. Synthesis Report. Contribution of Working Groups I, II and III to the Fourth Assessment Report; Intergovernmental Panel on Climate Change: Geneva Switzerland, 2008. [Google Scholar]
  60. Del Estado, J. Real Decreto-ley 14/2022, de 1 de Agosto, de Medidas de Sostenibilidad Económica en el Ámbito del Transporte, en Materia de Becas y Ayudas al Estudio, Así Como de Medidas de Ahorro, Eficiencia Energética y de Reducción de la Dependencia Energética del Gas Natural; Government of Spain: Madrid, Spain, 2022. [Google Scholar]
Figure 1. Scheme of the analysis method used.
Buildings 12 01755 g001
Figure 2. Semi-detached house under study. Real image and OpenStudio representation.
Buildings 12 01755 g002
Figure 3. Energy consumption [Total, Heating, Cooling] taking into account, typical meteorological year, actual meteorological year and future weather scenarios (IPCC).
Buildings 12 01755 g003
Figure 4. Comfort results taking into account the NBE CTE-79 standard and the Pamplona actual meteorological years (AMY).
Buildings 12 01755 g004
Figure 5. Comfort results taking into account the CTE-2013 standard and the Pamplona actual meteorological years (AMY).
Buildings 12 01755 g005
Figure 6. Comfort results taking into account the CTE-2019 standard and the Pamplona actual meteorological years (AMY).
Buildings 12 01755 g006
Figure 7. Comfort results taking into account the NBE CTE-79 standard and the Pamplona weather file generated with Meteonorm based on the IPCC scenario (A2).
Buildings 12 01755 g007
Figure 8. Comfort results taking into account the CTE-2013 standard and the Pamplona weather file generated with Meteonorm based on the IPCC scenario (A2).
Buildings 12 01755 g008
Figure 9. Comfort results taking into account the CTE-2019 standard and the Pamplona weather file generated with Meteonorm based on the IPCC scenario (A2).
Buildings 12 01755 g009
Table 2. General characteristics of the Building Energy Models according to the different Spanish technical building codes.
NBE-CT-79CTE-DB-HE 2013CTE-DB-HE 2019
Building Envelope
Façade: U value [W/m 2 K]0.3250.2290.127
Roof: U value [W/m 2 K]0.4280.3560.202
Slabs-on-grade foundations: U value [W/m 2 K]3.5790.6810.514
Windows: U-Factor [W/m 2 K]2.32.31.1
Frame and divider: Frame conductance [W/m 2 K]441.8
Windows permeability (m 3 /h · m 2 )50279
Building systems
HVAC systems-Heating: Performance [%]0.850.850.98
DHW Boiler: Performance [%]0.850.850.98
Exterior air changes [Ventilation and infiltrations]
Natural ventilation [ a c h ]0.710.710.32
Mechanical ventilation with heat recovery
(performance 0.76–0.8%) [ a c h ]
000.63
Infiltrations [ a c h ]0.60.50.21
Renewable energies
Solar collectors contribution [%]--76.7
Publisher’s Note: MDPI stays neutral with regard to jurisdictional claims in published maps and institutional affiliations.

