Article

Dynamic Characteristic and Decoupling Relationship of Energy Consumption on China’s Construction Industry

1
State Key Laboratory of Green Building in Western China, Xi’an University of Architecture and Technology, Xi’an 710055, China
2
College of Architecture, Xi’an University of Architecture and Technology, Xi’an 710055, China
3
School of Architecture and Urban Planning, Shenzhen University, Shenzhen 518060, China
4
College of Urban and Environmental Sciences, Northwest University, Xi’an 710127, China
*
Authors to whom correspondence should be addressed.
Buildings 2022, 12(10), 1745; https://doi.org/10.3390/buildings12101745
Submission received: 9 September 2022 / Revised: 11 October 2022 / Accepted: 18 October 2022 / Published: 19 October 2022
(This article belongs to the Special Issue Building Energy and Sustainability)

Abstract

:
(1) Background: The decoupling of energy consumption from economic growth in the construction industry is crucial to the sustainable development of the global construction industry. The existing studies focus on the advancements in energy efficiency by designers for building monoliths or construction techniques, involving no exploration of energy efficiency management from a regional perspective, which is unfavorable for the formulation of energy efficiency policies and systematic control of the construction industry by local governments. (2) Methods: From the perspective of regional management, this paper constructs an integrated analysis and application framework of “spatio-temporal characteristics + matching evaluation + policy design” based on the decoupling model and GIS tools. It studies the spatio-temporal characteristics of energy consumption in the construction industry in 30 provinces of China from 2010 to 2019, and its decoupling relationship with the economic development of the construction industry, and proposes an optimal zoning and recommendations for energy consumption in the construction industry, providing a reference for energy conservation management in the construction industry in China. (3) Results: First, the change of energy consumption amount (ECA) in the construction industry in the provinces was dominated by ascent, while the energy consumption intensity (ECI) predominantly decreased, and most provinces are still in a period of growth or plateau in energy consumption. Second, ECA and ECI had prominent spatial heterogeneity and aggregation. High-energy-consuming regions are concentrated along the coast and along the Yangtze River, while low-energy-consuming regions are mainly clustered in remote areas, such as the northeast, northwest, and southwest of China. Energy consumption shows a clear north-south difference in intensity, with high-intensity regions clustered in the north compared to low-intensity regions in the south. Third, most of the provinces were in strong negative decoupling, expansive coupling, and weak decoupling, and better decoupling regions were mainly gathered in south and central China. Nearly one half of these provinces showed decoupling degradation and only a few achieved evolution, with evolutionary regions clustered mainly in central and southern China. The northeast and northwest were the key problem areas of energy-saving transformation in China’s construction industry. (4) Conclusion: The 30 provinces were divided into three types: leader, intermediate, and laggard, and the development goals and suggestions on low energy consumption in the construction industry for three zones were put forward, significantly improving the precision of policy design and implementation. The study in this paper expands the research perspective on energy saving management in the construction industry and provides a methodology and basis for developing energy efficiency policies and plans for the construction industry in China and similar developing countries.

1. Introduction

1.1. Background

The building industry is a large energy consumption and carbon emission sector across the world, with energy consumption accounting for about 36% and carbon emissions accounting for 37% [1] of the global total, respectively. Its low-energy development directly determines whether global energy-saving and emission reduction targets can be achieved. The building industry involves a very complicated industrial line, which can be classified into building materials production, construction, building operation, and building demolition, according to their operation stages [2]. The energy consumption patterns and energy saving points of the industrial system at different stages are different [3], so it is urgent and important to carry out segmentation studies on them. The construction industry is a key part of the building industry; construction energy consumption shares approximately 6% of global building energy consumption and 2% of total global energy consumption [1], which is equivalent to the total energy consumption of some countries in a year, such as the UK, Turkey, or Indonesia [4]. However, the construction economy accounts for about 11% of global GDP and creates 7% [5] of jobs worldwide. Promoting the development of decoupling construction energy consumption from construction economic growth is key to achieving the task of energy conservation and emission reduction in the construction industry, and even global sustainable development goals.
As the world’s largest developing country, China accounts for 29.33% of global construction energy consumption and 26.18% [6,7] of global construction carbon emissions, while its construction market accounts for 23% [8] of global construction market share. The decoupling of energy consumption from economic performance of the construction industry in China is crucial to the energy-saving and sustainable development of the global construction industry, and has a far-reaching influence on China’s commitment to achieve “carbon emission peak by 2030 and carbon neutrality by 2060” [9,10]. In fact, the Chinese government has proposed green construction as the future direction of the construction industry [11], and documents such as “14th Five-Year” Construction Industry Development Plan and “14th Five-year” Building Energy Saving and Green Building Development Plan have also made energy saving in the construction industry an important goal. However, given the development differences among provinces in China, a one-size-fits-all policy may not be effective for all regions, and it is necessary to conduct in-depth analysis of the energy consumption characteristics of the construction industry in different provinces of China, so as to make appropriate optimization recommendations according to local conditions.
To this end, this paper analyzes the trend of energy consumption in China’s construction industry in time and space dimensions, and identifies the decoupling relationship between energy consumption in the construction industry and economic growth in the construction industry, and its evolution characteristics. Thus, it provides a reference for the Chinese government to formulate and adjust the construction industry energy saving plan, strengthens the reliability of the construction industry energy saving policies and management measures, promotes the low energy consumption transformation of the Chinese construction industry, and helps to achieve the global energy saving and emission reduction goals.

1.2. Literature Review

1.2.1. Building Energy Consumption

Energy consumption in the building industry has been a hot topic for academic research, and the studies available have explored in depth the full-cycle energy consumption of buildings, the energy consumption of building operation, and the management of building energy saving, with a few providing an analysis of the spatial effects of building energy consumption. For example, for the full-cycle energy consumption of buildings, Huo, Zhang, Xu, Liu, and Berardi et al. estimated the full-cycle energy consumption of the building industry in China, the United States, the European Union, and other BRICS countries, based on statistical data [2,12,13,14,15]. Luo, Li, Zhan, and Ma calculated the full-cycle energy consumption of residential buildings and office buildings based on statistical and measured data [16,17,18,19]. In the study of energy consumption in building operation, Guo and Wei measured the energy consumption of Chinese buildings in the operation phase based on statistical data and survey data [20,21]. Jing, Shi, Ji, Felimban, Olu-Ajayi, Alam, Sekki, Roy, Deng, Gu, and Lin measured the energy consumption of the operations of shopping malls, office buildings, hospitals, residential buildings, as well as educational buildings, dormitory buildings, factory buildings, and transportation buildings based on measured data and algorithmic models [22,23,24,25,26,27,28,29,30,31,32]. In the field of building energy management, Webb, Heydari, Alajmi, Anwar, Maiolo, Troup, Amirkhani, Chi, and Mohammadi studied the effects of bionic facades, window configurations, shading installations, passive measures, green roofs, window-to-wall ratios, low-e window films, building orientation, and vernacular climatic strategies on building energy consumption, and put forward optimization recommendations based on measured data and algorithmic models [33,34,35,36,37,38,39,40,41]. Sheng, Charles, Hoseinzadeh, Shehadi, and D’Agostino discussed energy-saving transformation measures for different regions and building types [42,43,44,45,46]. In the study of the spatial effect of building energy consumption, according to Hong and Huang, building energy consumption in China and the United States shows significant spatial heterogeneity [47,48]; and according to Fonseca, Song, and Howard, building energy consumption in Harbin in China, Zug in Switzerland, and New York City, NY, USA, exhibited significant spatial aggregation [49,50,51].
However, the established results neglect specialized studies on energy consumption in the construction industry during the construction phase, and although a small number of studies have analyzed energy saving technologies adopted in the construction process, there is no research in regional scale from the perspective of spatial management. For example, Gavali proposed that the use of alkali-activated bricks may effectively reduce the cooling load of buildings in India [52]; Yin proposed that prefabricated straw bale construction can effectively reduce the heating and cooling load of buildings in northern China [53]; Lotfabadi proposed that traditional construction techniques can significantly improve the thermal comfort of buildings in hot and humid regions [54]; Reider proposed that fiber-reinforced polymer buildings have better thermal resistance than concrete buildings [55]; Veliborka proposed that Trombe wall construction may effectively reduce the energy consumed for heating of buildings in Serbia [56]; Ivanović-Šekularac proposed that the application of wood to modern Serbian buildings improves energy efficiency [57]; and Miller discussed the energy consumption of concrete buildings with different design parameters and gave suggestions for optimization [58]. Hamdaoui, Macias, Heravi, and Devi also measured the energy consumption of different construction scenarios, construction methods, earthworks, and construction lifts, and made appropriate suggestions on energy saving [59,60,61,62].

1.2.2. Energy Decoupling Analysis

The decoupling model is an effective tool to study the coupling state of economic development with resource consumption, greenhouse gas emissions, and land use [63]. In recent years, studying the decoupling relationship of energy consumption from economic growth has become an emerging field. For example, Wu pointed out that the decoupling index of energy consumption and economic growth in developed countries remains stable, and tends to be close to absolute decoupling, while the decoupling index in developing countries fluctuates in a relative decoupling range [64]. Wang stated that among the top five energy-consuming economies in the world, Japan has achieved the best decoupling between energy consumption and economic growth, followed by the United States [65]. Chen noted that only 18 of 89 countries worldwide have seen a strong decoupling of energy consumption from growth in the agricultural economy [66]. Zhang and Song pointed out that energy consumption and economic growth in China showed weak decoupling, expansive coupling, strong decoupling, and expansive negative decoupling [67,68]. Shi further noted that decoupling in northern, northeast, and eastern China is at a high level [69], and Wei also pointed out that decoupling is better in developed regions of China, but worse in most of the central and western areas [70]. Meng stated that China’s energy consumption shows strong negative decoupling from industrial output; i.e., decreasing energy consumption will cause increasing industrial added value [71]. Zhou noted that China’s construction energy consumption shows weak decoupling from construction output, meaning that China’s construction industry is no longer growing at the cost of faster energy consumption [72]. Zhang pointed out that China’s regional energy consumption for heating in the building sector shows weak decoupling from GDP; in other words, that economic growth no longer leads to significant increases in energy consumption for heating [73]. Zhang pointed out that the decoupling index between energy consumption and per capita income of urban and rural residents in Shandong, China, is decreasing, indicating that the dependence of energy consumption of urban and rural residents on residents’ income is decreasing [74]. Román-Collado stated that the decoupling of energy consumption from GDP in Colombia is poor, and that government policies to promote decoupling between the two have not worked well [75].
Overall, the studies available have discussed the decoupling of energy consumption from GDP, agricultural output, industrial output, construction output, and residential income using a decoupling model. These findings play an irreplaceable reference role for relevant countries and regions in forming energy-saving policies. However, the studies available have not paid sufficient attention to the construction industry, and have not discussed the decoupling relationship between energy consumption and the construction economy growth, with especially insufficient focus on how the effects in regional scale compromise the precision of the formulation of energy saving policies in the construction industry. Therefore, this paper uses a decoupling model to analyze the decoupling state between energy consumption and economic growth of the construction industry at the provincial scale, trying to demonstrate the evolution trend of the uncoupling relationship between the two.

1.3. Aim and Question

Based on a regional management perspective, by leveraging the decoupling model and GIS software, this article studies the characteristics of energy consumption in the construction industry in 30 provinces of China from 2010 to 2019. It explores the spatio-temporal changes of energy consumption amount (ECA) and energy consumption intensity (ECI) in the construction industry in the provinces, and analyzes the evolution pattern of the decoupling relationship between energy consumption and economic benefits of the construction industry in the provinces; attempting to propose differentiated policy recommendations for the energy saving development of the construction industry in each province. This paper expands the research perspective of the construction industry, and the integrated technical framework of “spatio-temporal characteristics + matching evaluation + policy design” also provides a new method for the research of energy consumption in the construction industry. Additionally, the findings of this paper also provide a reference for provincial governments to set energy efficiency mandates for the construction industry, helping to transform construction to a low-carbon energy industry in China and other similar countries.
This paper focuses on the following questions. (1) What are the temporal and spatial characteristics of ECA and ECI in China’s provincial construction industry? (2) What are their uncoupling states between construction energy consumption, total output value, added value, and total profit of the construction industry in China’s provinces? (3) What are evolution trends in the decoupling status between energy consumption in the construction industry and the construction economy growth in China’s provinces, and how should they be addressed in policy design?

2. Materials and Methods

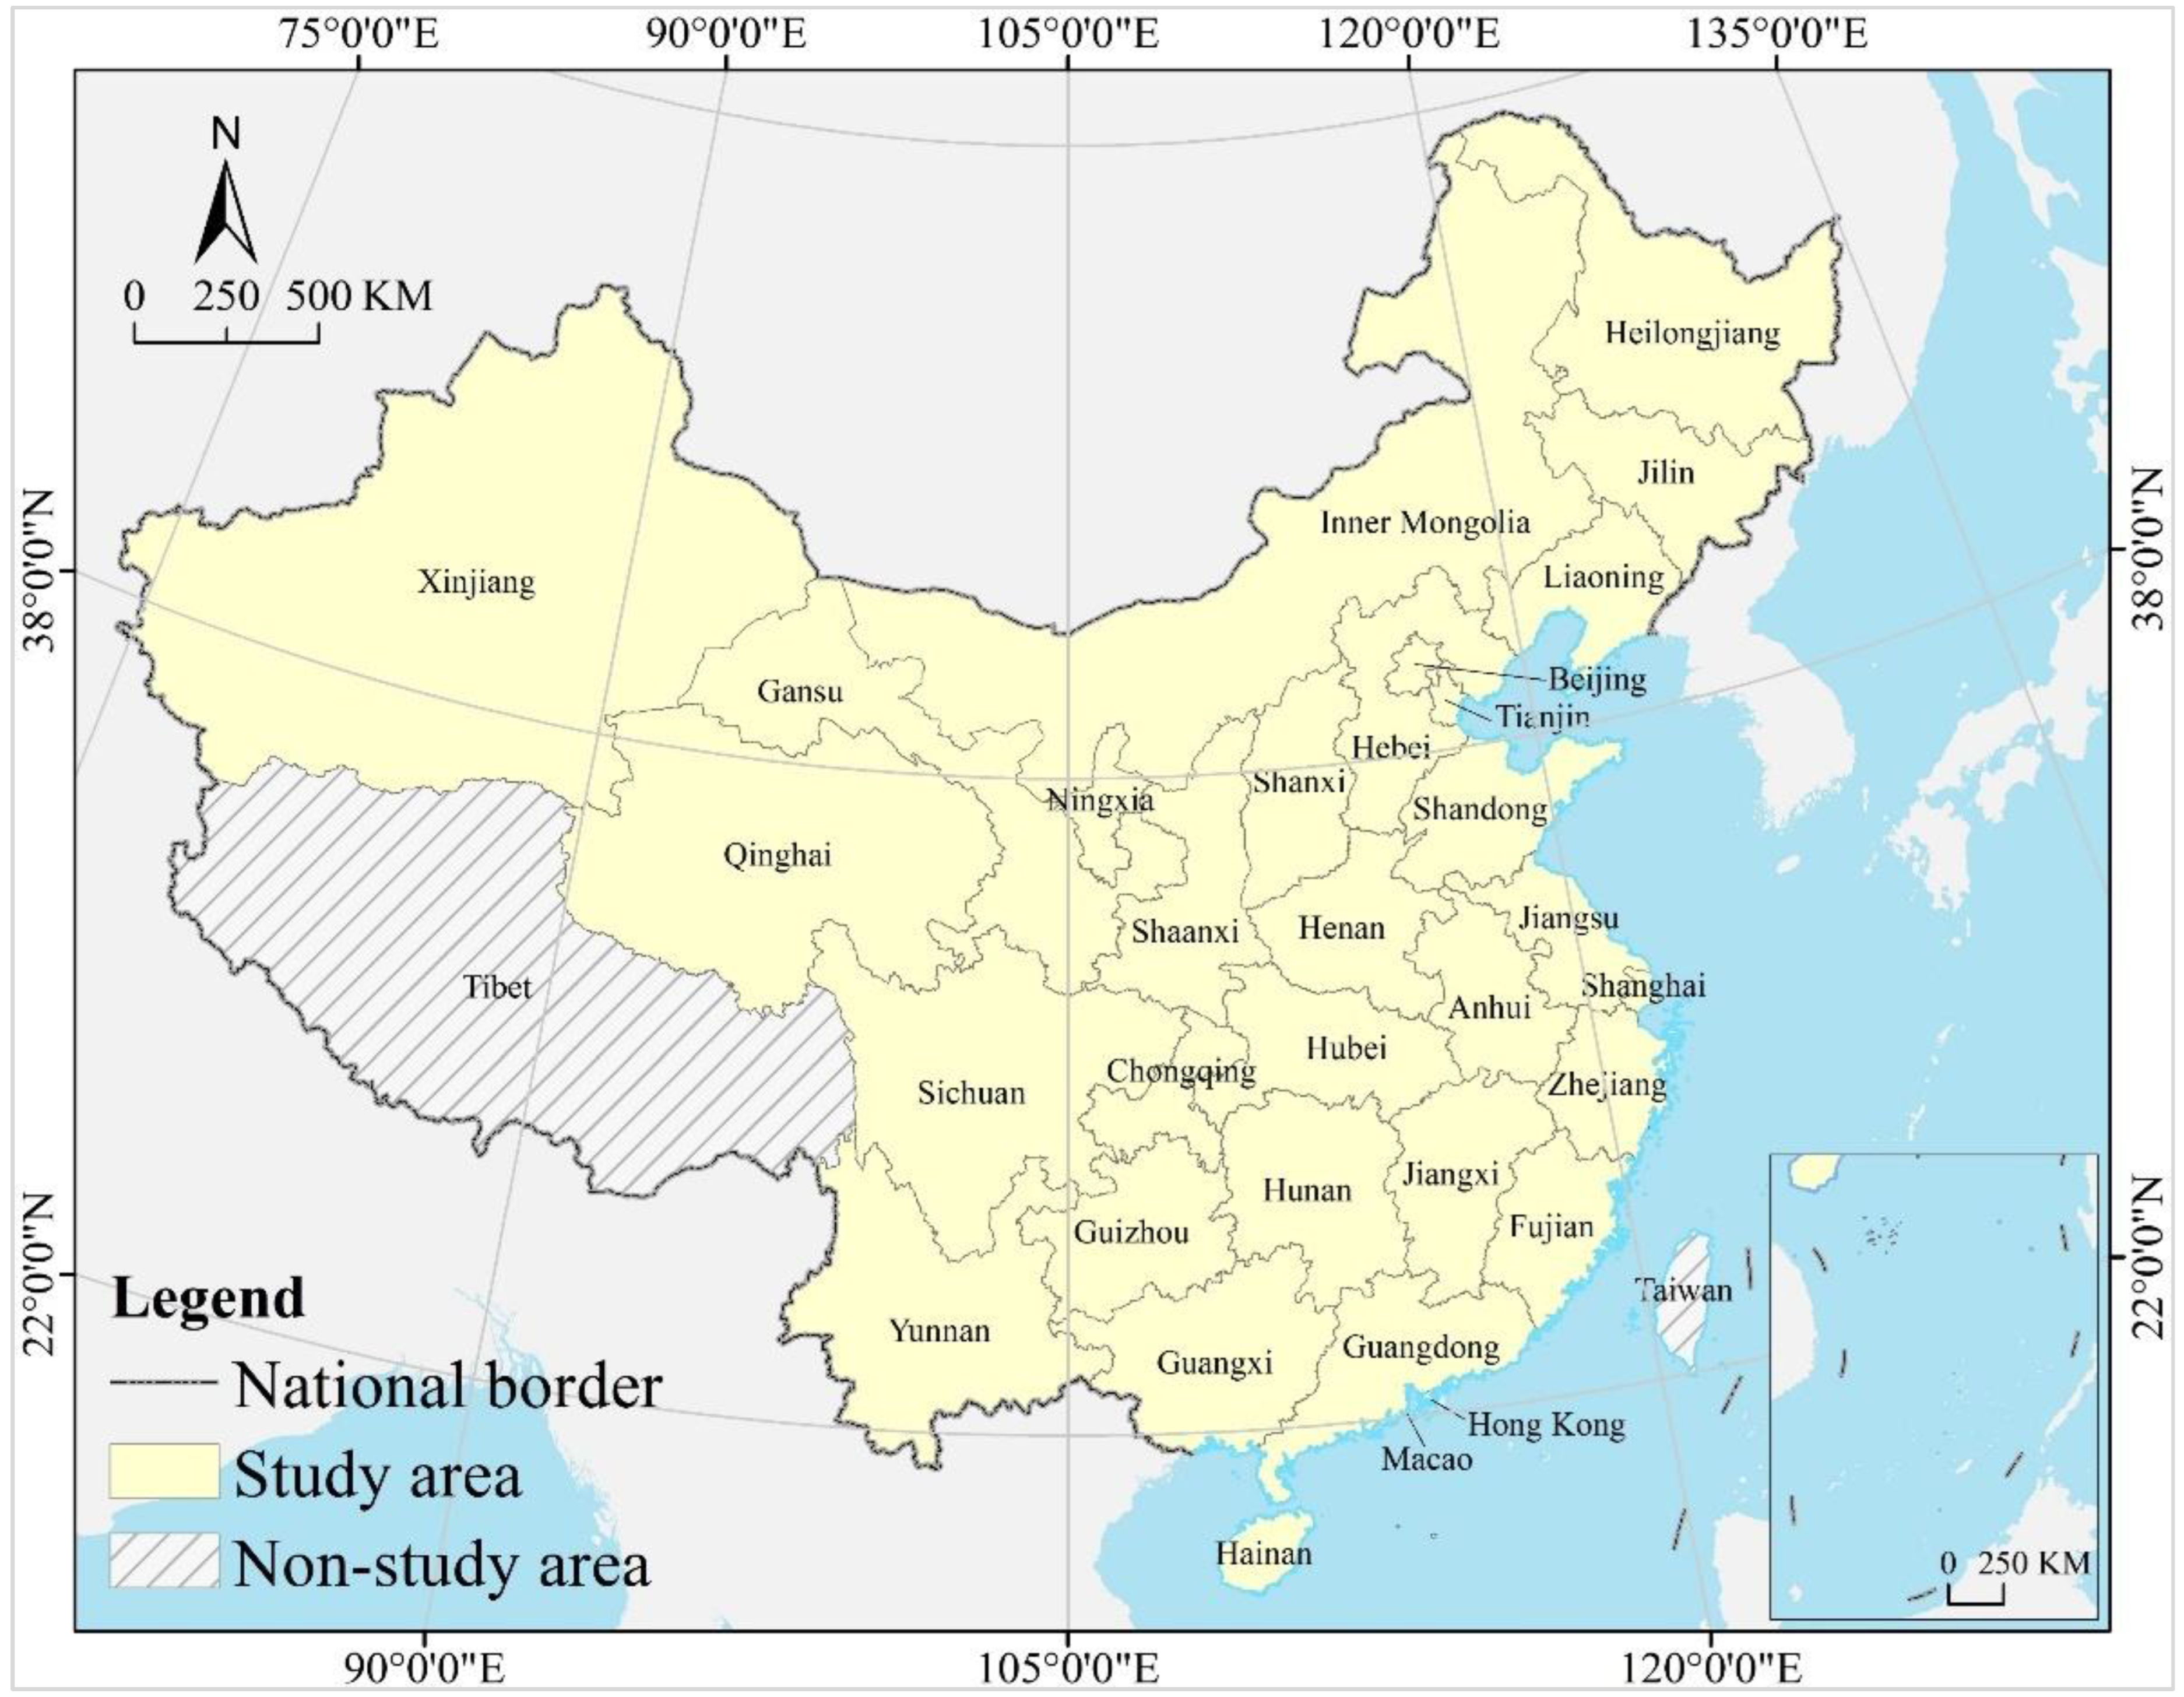
2.1. Research Area: China

The 30 provinces (autonomous regions and municipalities) in mainland China are set as the study area. Tibet, Hong Kong, Macau, and Taiwan were excluded because of serious missing data and inconsistent statistics (Figure 1). The energy consumption in China’s construction industry grew slowly over the decade, from 48,101,621 tons in 2010 to 64,008,448 tons in 2019, an increase of 33.07%, and except for a negative growth in 2013. The growth of energy consumption dropped from a high rate to a low rate, from 29.83% in 2010 to −2.42% in 2013, and then remained stable in a range of 0.81–5.23% (Figure 2). The economic output of China’s construction industry grew steadily over the decade, with total output value, added value, and total profit increasing from 9603, 2675, and 341 billion yuan in 2010 to 24,844, 7069, and 828 billion yuan in 2019, respectively. The construction economy growth also declined from a high rate to a low rate, with growth rates of gross output value, added value, and total profit falling from 25.03%, 19.41%, and 25.39% in 2010 to 2.29%, 5.62%, and 0.69% in 2015, and then fluctuating in the three ranges of 5.55–10.53%, 6.06–13.90%, and 3.82–8.29%, respectively (Figure 3). It can be seen that energy consumption showed a trend of decoupling from the economic output in the construction industry in China over the decade.

2.2. Research Methods

2.2.1. Coefficient of Variation

Coefficient of variation (CV) is a ratio of the standard deviation to the mean of a set of data, which can reflect the relative dispersion of a set of data [76]. This paper uses CV to evaluate the degree of overall differentiation on ECA and ECI in the provinces of China. The calculation is as follows:
CV = 1 y ¯ i = 1 n ( y i y ¯ ) 2 n
where, CV is the coefficient of variation; y i is the value of ECA and ECI for each province; i = 1, 2, 3,…, n, and n is the total number of provinces, which is 30 in this paper; and y ¯ is the average of ECA and ECI values for each province. CV is a relative value and has no real meaning. A smaller CV corresponds to a smaller overall differentiation degree of ECA and ECI for the provinces in China, and vice versa. Based on the study by Zhao and Li [77,78], dispersion can be classified into three grades by the value of CV in a sample data: weak dispersion with a value of 0.00–0.15, reflecting a low degree of differentiation in ECA and ECI across provinces; medium dispersion with a value of 0.16–0.35, reflecting a medium degree of differentiation in ECA and ECI; and strong dispersion with a value of 0.36 or greater, reflecting a high degree of differentiation in ECA and ECI.

2.2.2. Hot Spot Analysis

Hot spot analysis, also known as Getis-Ord G i * tool, can be employed to calculate the G i * -statistic of each element attribute value in the dataset by constructing a spatial weight matrix, and then determine the degree of aggregation of high or low value elements and their locations by comparing the G i * -statistic [79,80]. It is used in this paper to reflect the aggregation characteristics of ECA and ECI in the provinces of China. It is calculated as follows:
G i * = j = 1 n w i , j x j x ¯ j = 1 n w i , j s n j = 1 n w i , j 2 ( j = 1 n w i , j ) 2 n 1 , x ¯ = j = 1 n x j n ,       s = j = 1 n x j 2 n ( x ¯ ) 2
where, G i * is G i * -statistic; x j is the value of ECA and ECI for each province; x ¯ is the average of ECA and ECI values for each province; s is the standard deviation of ECA and ECI for each province; with i,j = 1, 2, 3,…, n, and n is the number of provinces, which is 30 here; w i , j is the spatial weight between provinces i and j; and the spatial weights of many provinces constitute a spatial weight matrix. A significantly positive G i * with a larger value indicates more pronounced aggregation of high values of ECA and ECI in the provinces of China, which is called a hot spot; while a significantly negative G i * with a smaller value indicates more pronounced aggregation of low values of ECA and ECI in the provinces of China, which is called a cold spot. Additionally, according to Zhao [81], the aggregation characteristics of ECA and ECI can be further classified into hot spot, sub-hot spot, sub-cold spot, and cold spot by grading G i * -statistic based on the natural break method.

2.2.3. Decoupling Model

The term decoupling originates from physics and refers to the fact that two or more factors that are in a responsive relationship are no longer correlated [82]. The OECD, of which the full name is the Organization for Economic Cooperation and Development, firstly introduced the decoupling concept in the field of environmental protection in 2002, arguing that uncoupling is the breaking of the association between economy performance and environment stress; that is, the two objects do not have synchronous change relationship. The OECD proposed the calculation formula of the decoupling model, and three decoupling types were designed, which were absolute decoupling, relative decoupling, and non-decoupling [83]. Subsequently, Tapio adapted the decoupling model using elasticity coefficients in 2005, which solves the difficulties of the OECD decoupling model in selecting the base period and is not subject to conditions of different magnitudes among indicators [84]. The Tapio decoupling model also divides the decoupling relationship into eight types, which enriches the model details [85]. The current methods to determine the correlation state of two elements include the decoupling model, the coupling model, and the mismatch index. The coupling model and the mismatch index are static indicators, while the decoupling model is a dynamic indicator and it can better reflect the evolution trend of the relationship between the two elements, which is favorable for improvement and implementation of policy recommendations [86,87], and it has turned into an important analysis tool in sustainable development. The Tapio decoupling model is used in this paper to analyze the relationship between energy consumption and economic output in the construction industry, and to measure whether there is a synchronous or asynchronous change relationship between the two. It is calculated as follows:
z = Δ x Δ y ,   Δ x = c w i + n c w i n ,   Δ y = c f i + n c f i n
where, z is the decoupling index; Δ x and Δ y are the average annual growth rates of energy consumption and economic output of the construction industry for each province of China, respectively; c w i and c w i + n are the annual values of energy consumption for each province of China in years i and i + n ; c f i and c f i + n are the annual values of economic output for each province of China in years i and i + n ; i is the base period year; and n represents the study period. This paper establishes the time period from 2010 to 2019 as the study period, subdivided into two stages, from 2010 to 2014 and 2015 to 2019, designating 5 years for each; i.e., n = 5 . According to the positive and negative characteristics of Δ x and Δ y , Tapio divides the decoupling status into three main categories and eight sub-categories (Table 1) by the thresholds of 0.8 and 1.2 for z [88]. Decoupling index can be found in the Appendix A.

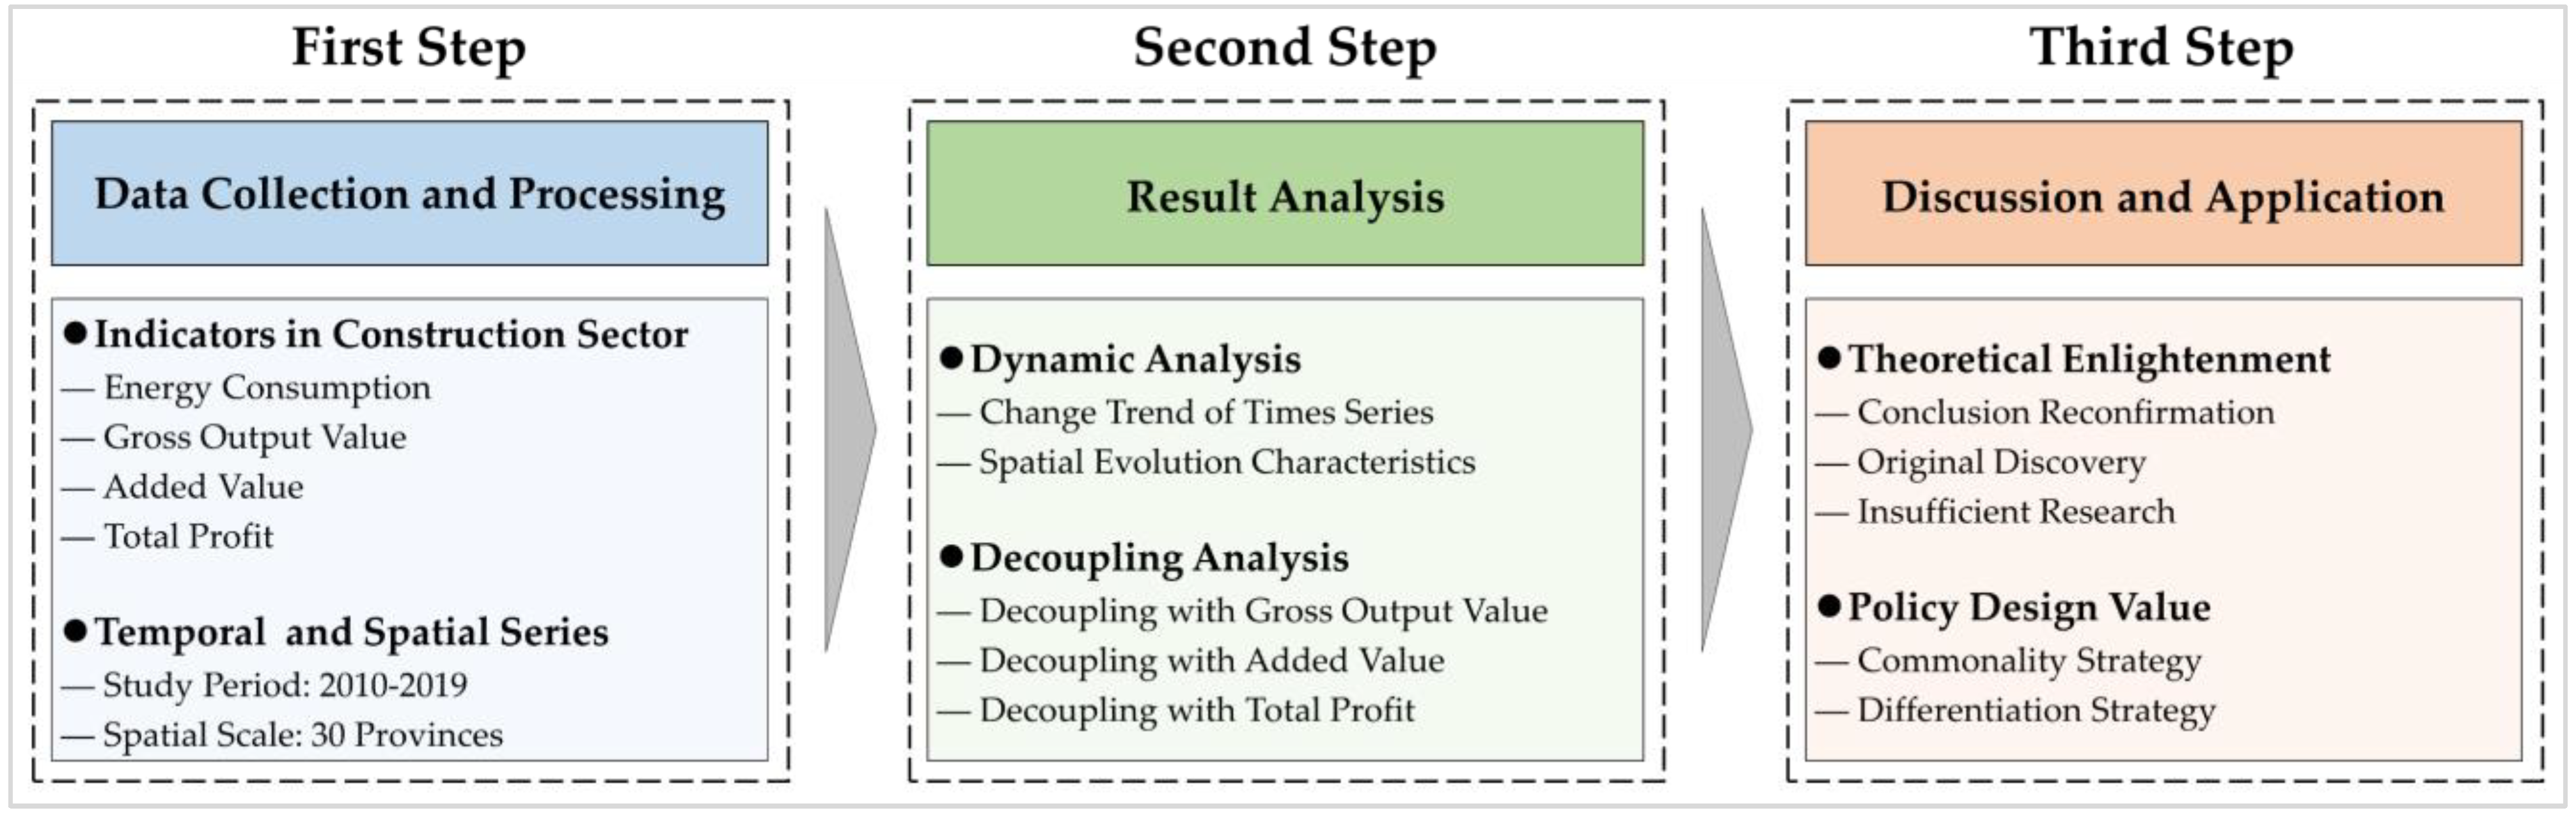
2.3. Research Steps and Data Source

The research in this paper includes three steps. Step one is data collection and processing. It specifically involves collecting and collating statistical data for 30 of China’s provinces during the period from 2010 to 2019 for four indices, including construction energy consumption, total output value, added value, and total profit in the construction industry. Step two is to analyze the results. We first analyze the past and present trends of ECA and ECI in the construction industry of each province using a time-series approach. Then, we study the spatial evolution patterns of ECA and ECI in the construction industry of each province based on the clustering tool and hot spot tool of GIS. Finally, we analyze the decoupling relationship between energy consumption and construction economic development by three variables, which are total output value, added value, and total profit. Step three is to discuss and apply the results. We compare this paper’s main results with existing findings to rediscover both its originalities and its deficiencies. Additionally, we further propose differentiated coping strategies for the energy saving development of the construction industry of each province by absorbing the main issues and viewpoints identified from the results (Figure 4).
The energy consumption in the construction industry in this paper refers to that directly by builders during the construction work, with the total amount of energy consumption in the construction industry set as energy consumption amount (ECA), and the energy consumption amount per ten thousand RMB output value in the construction industry set as energy consumption intensity (ECI). In addition, total output value, added value, and total profit refer to the economic output in monetary terms, created by enterprises engaged in the construction of buildings and structures and the installation of equipment. Gross output value represents the total output of construction activities; added value represents the new value created and added by construction activities; and total profit represents the operating performance of construction enterprises. These three are important indices by which to measure the economic development of China’s construction industry, and have often been used in existing studies [63,84,89].
The data used in this paper comes from the China Energy Statistical Yearbook and the China Statistical Yearbook and the China Statistical Yearbook on Construction, and a small amount of missing data is obtained by the method of trend extrapolation, with the source websites presented in the data availability statement below. Since the energy in the construction industry covered by the China Energy Statistics Yearbook includes a variety of types, which include oil, coal, heat, gas, electricity, etc., it needs to be converted to standard coal to facilitate comparison. In this paper, we refer to the standard coal converting coefficients in the Chinese national standard General Rules for Calculation of the Comprehensive Energy Consumption (GB/T 2589–2020) for energy consumption conversion. This paper focuses on the study period from 2010 to 2019, when decoupling of energy consumption in the construction industry from the construction economy growth began to emerge in China with prominent typicality. The time period spans ten years, and the two stages are basically in agreement with the two Five-Year Plans of China (12th and 13th), with a relatively smooth policy environment in each stage, making the study findings more convincing.

3. Results

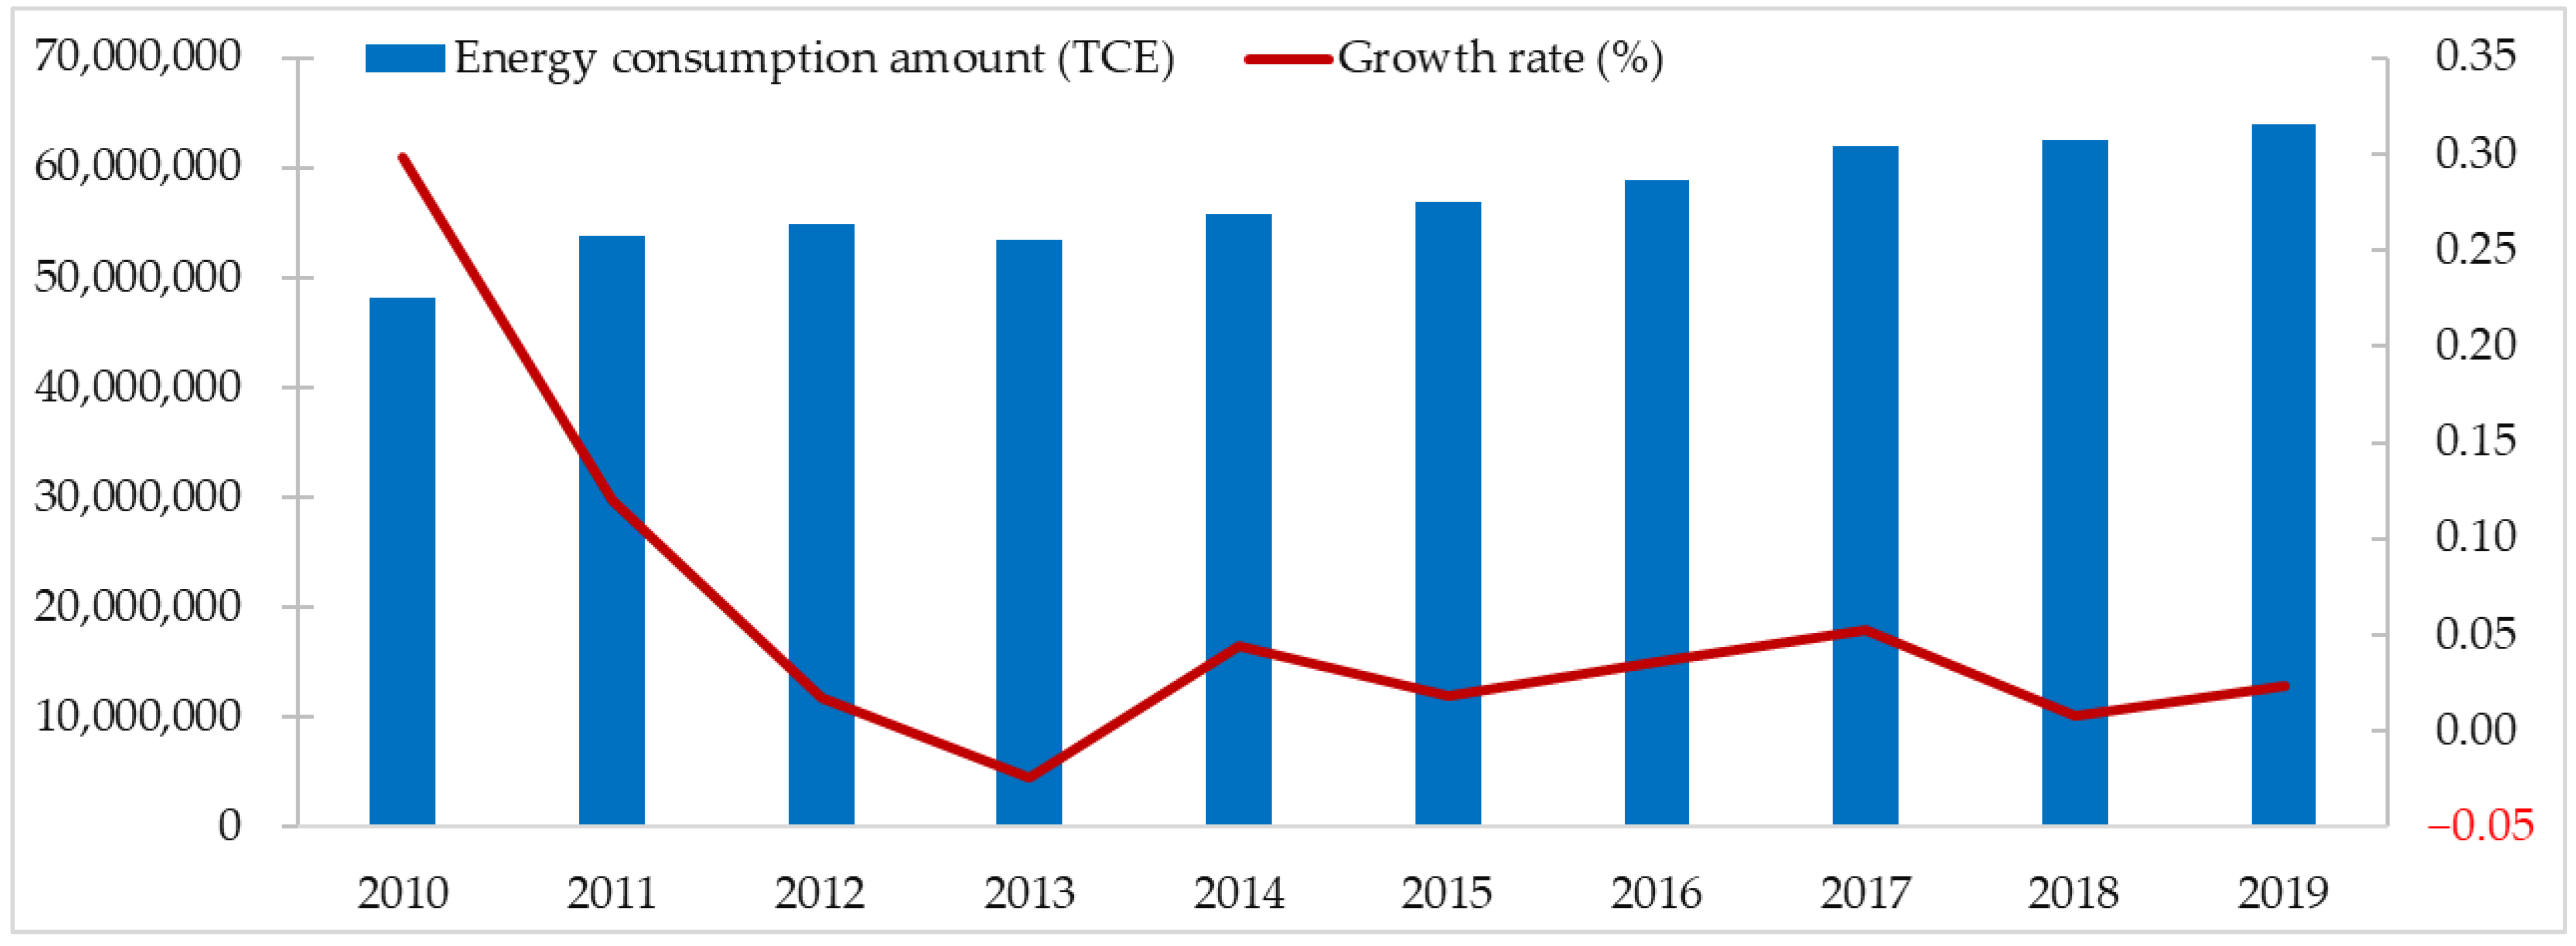
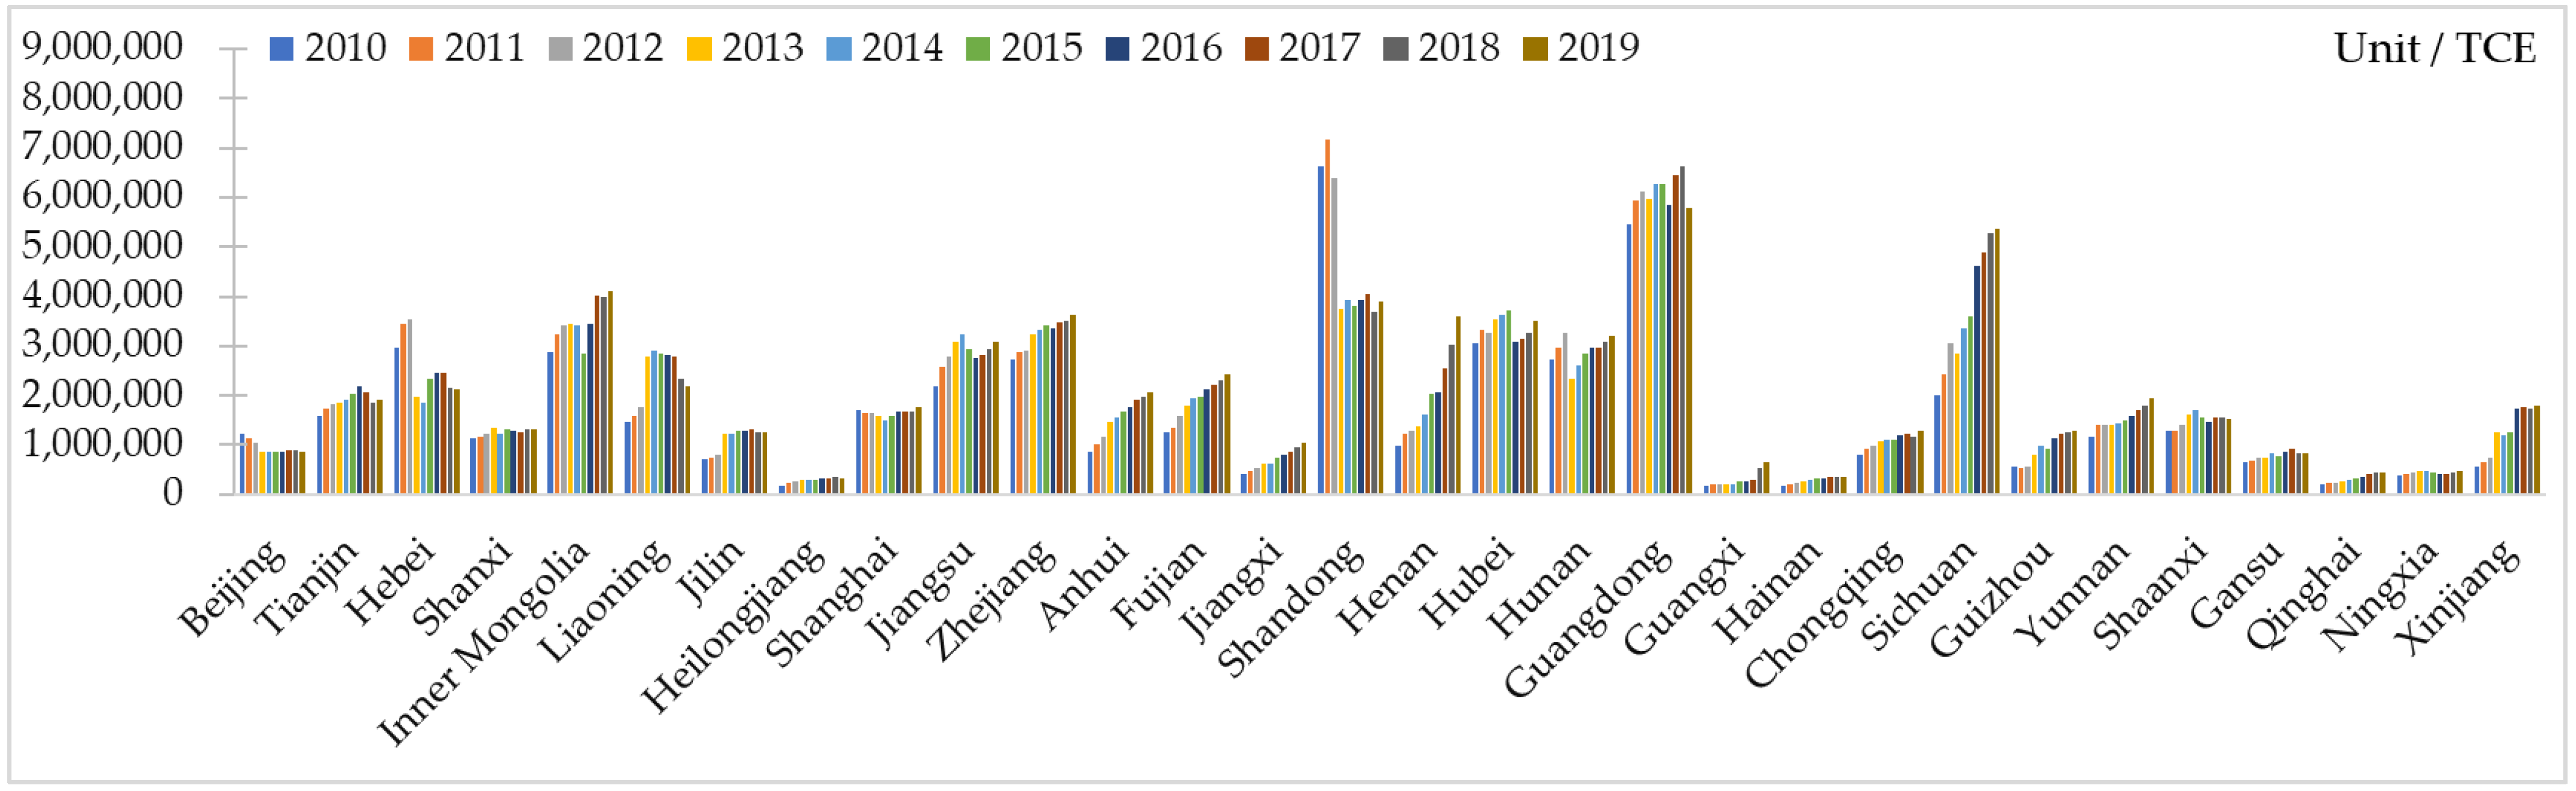
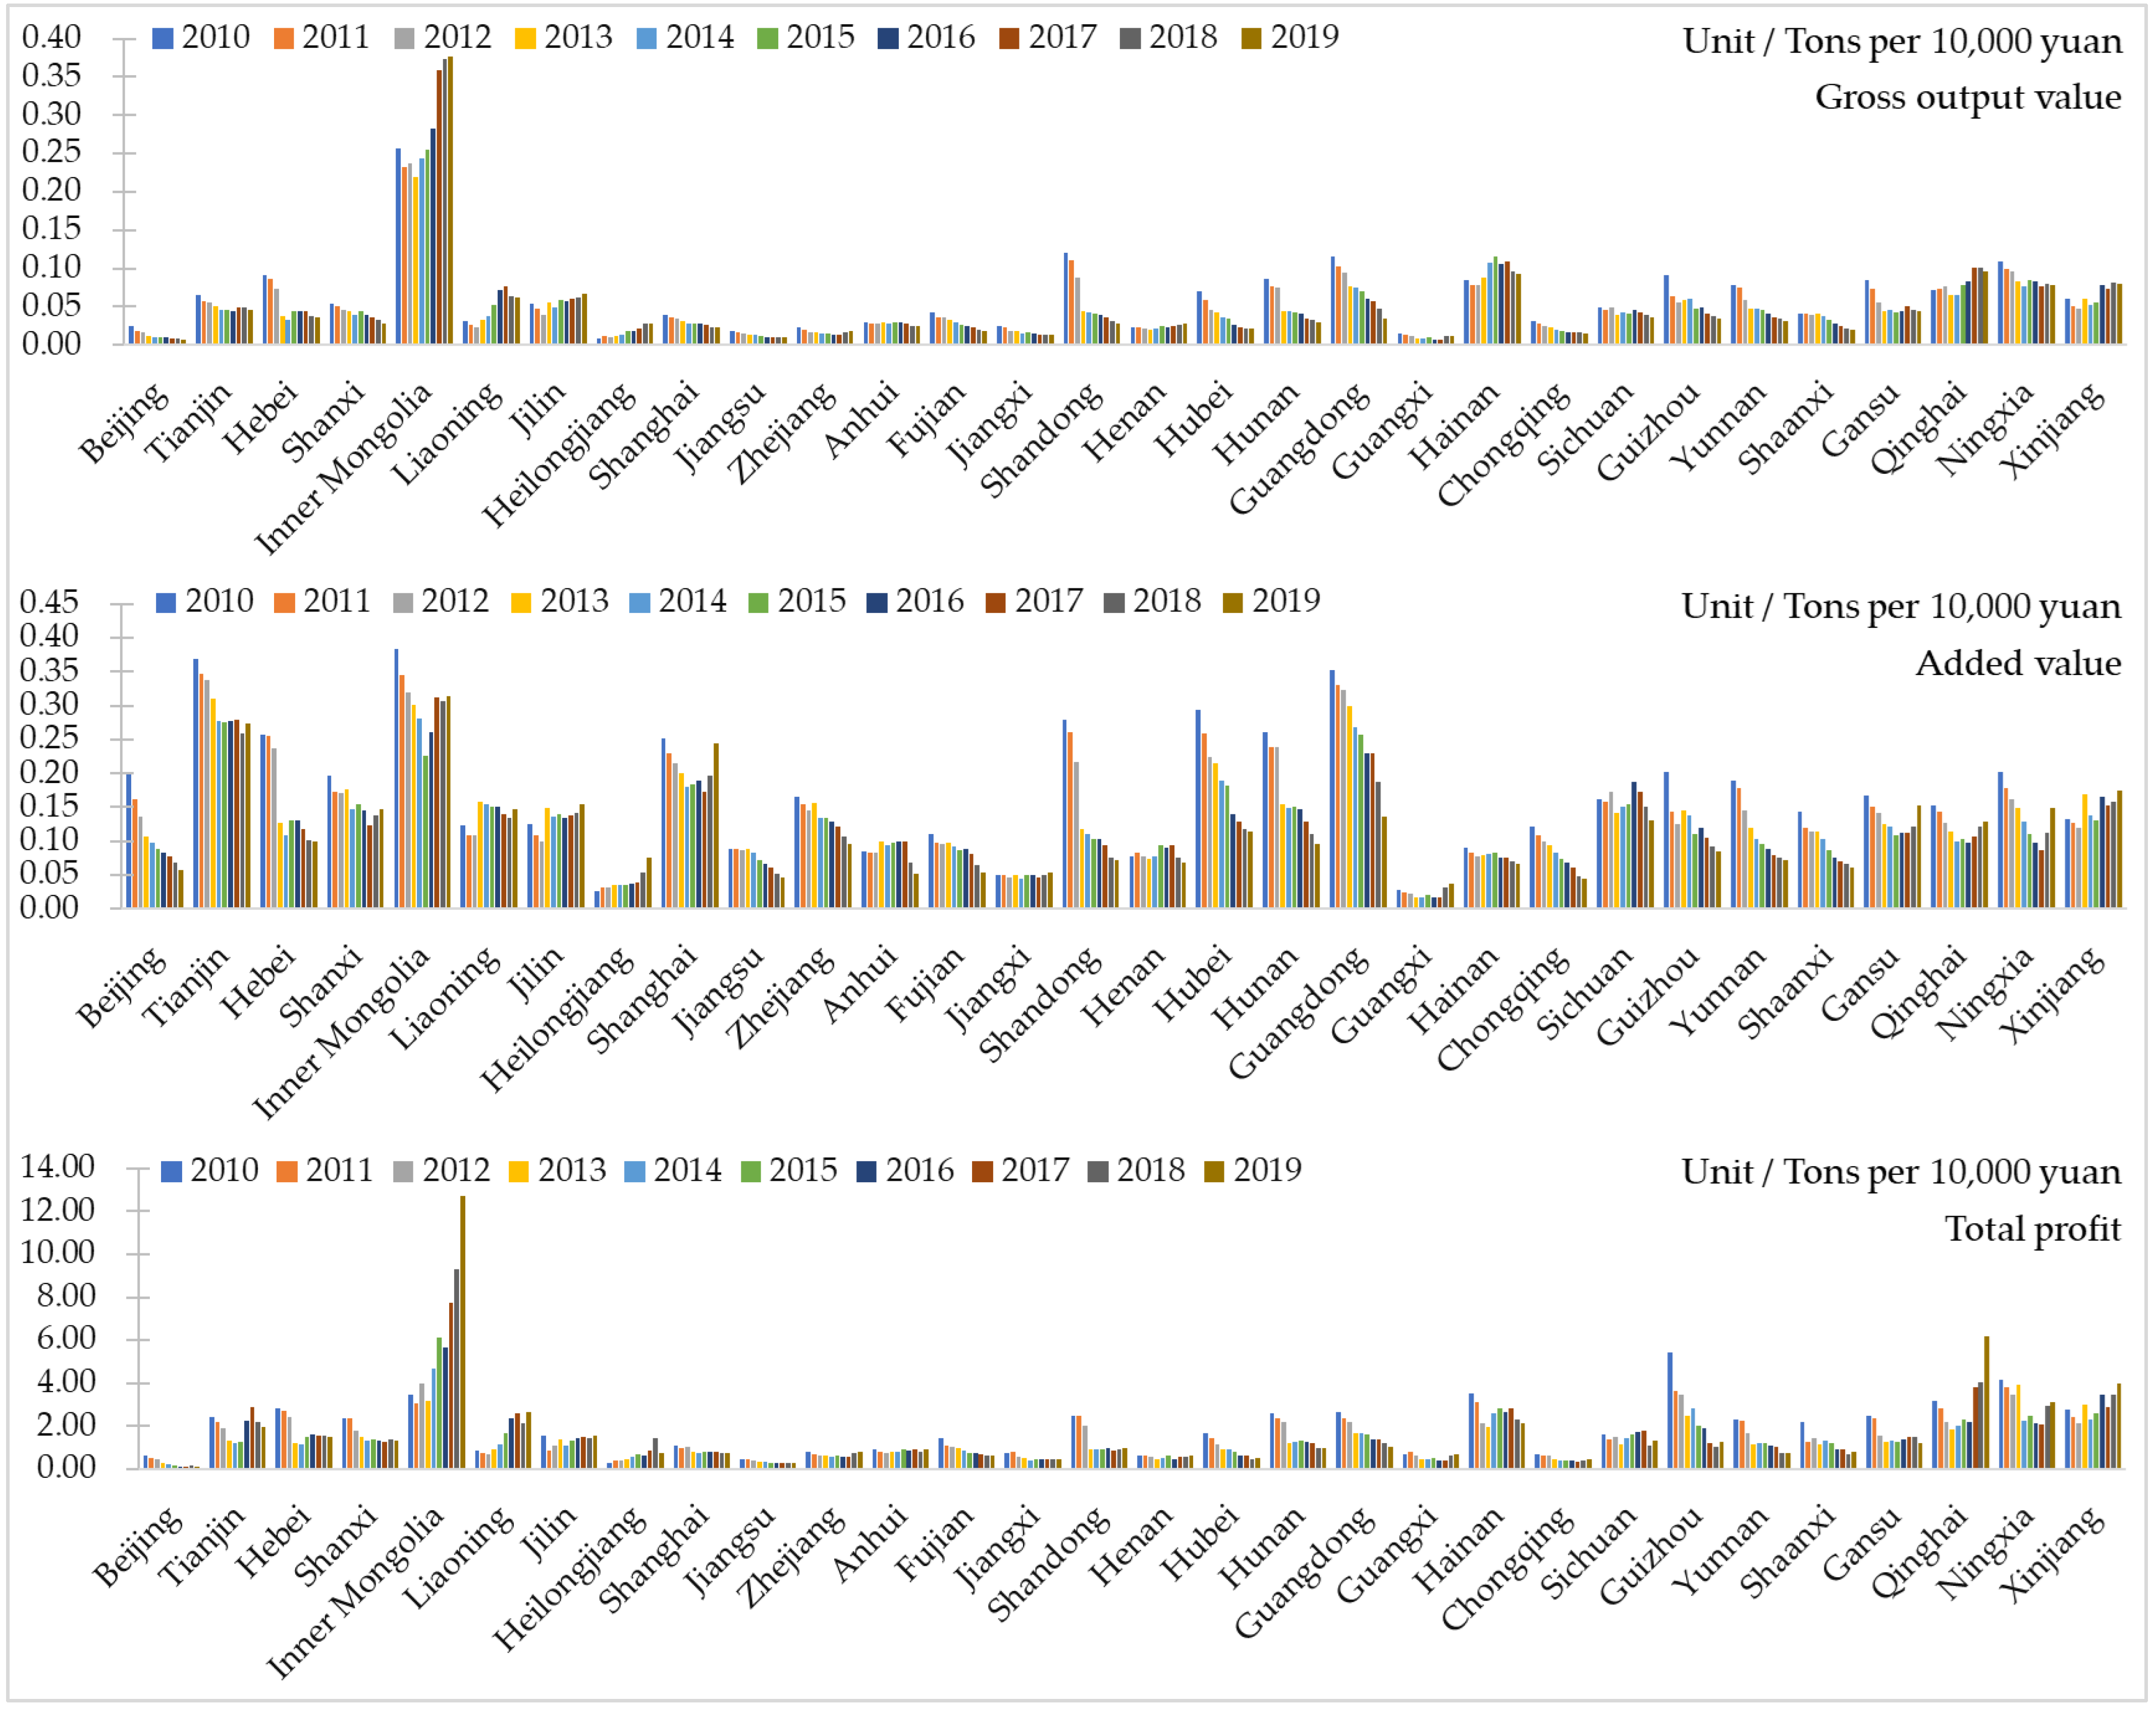
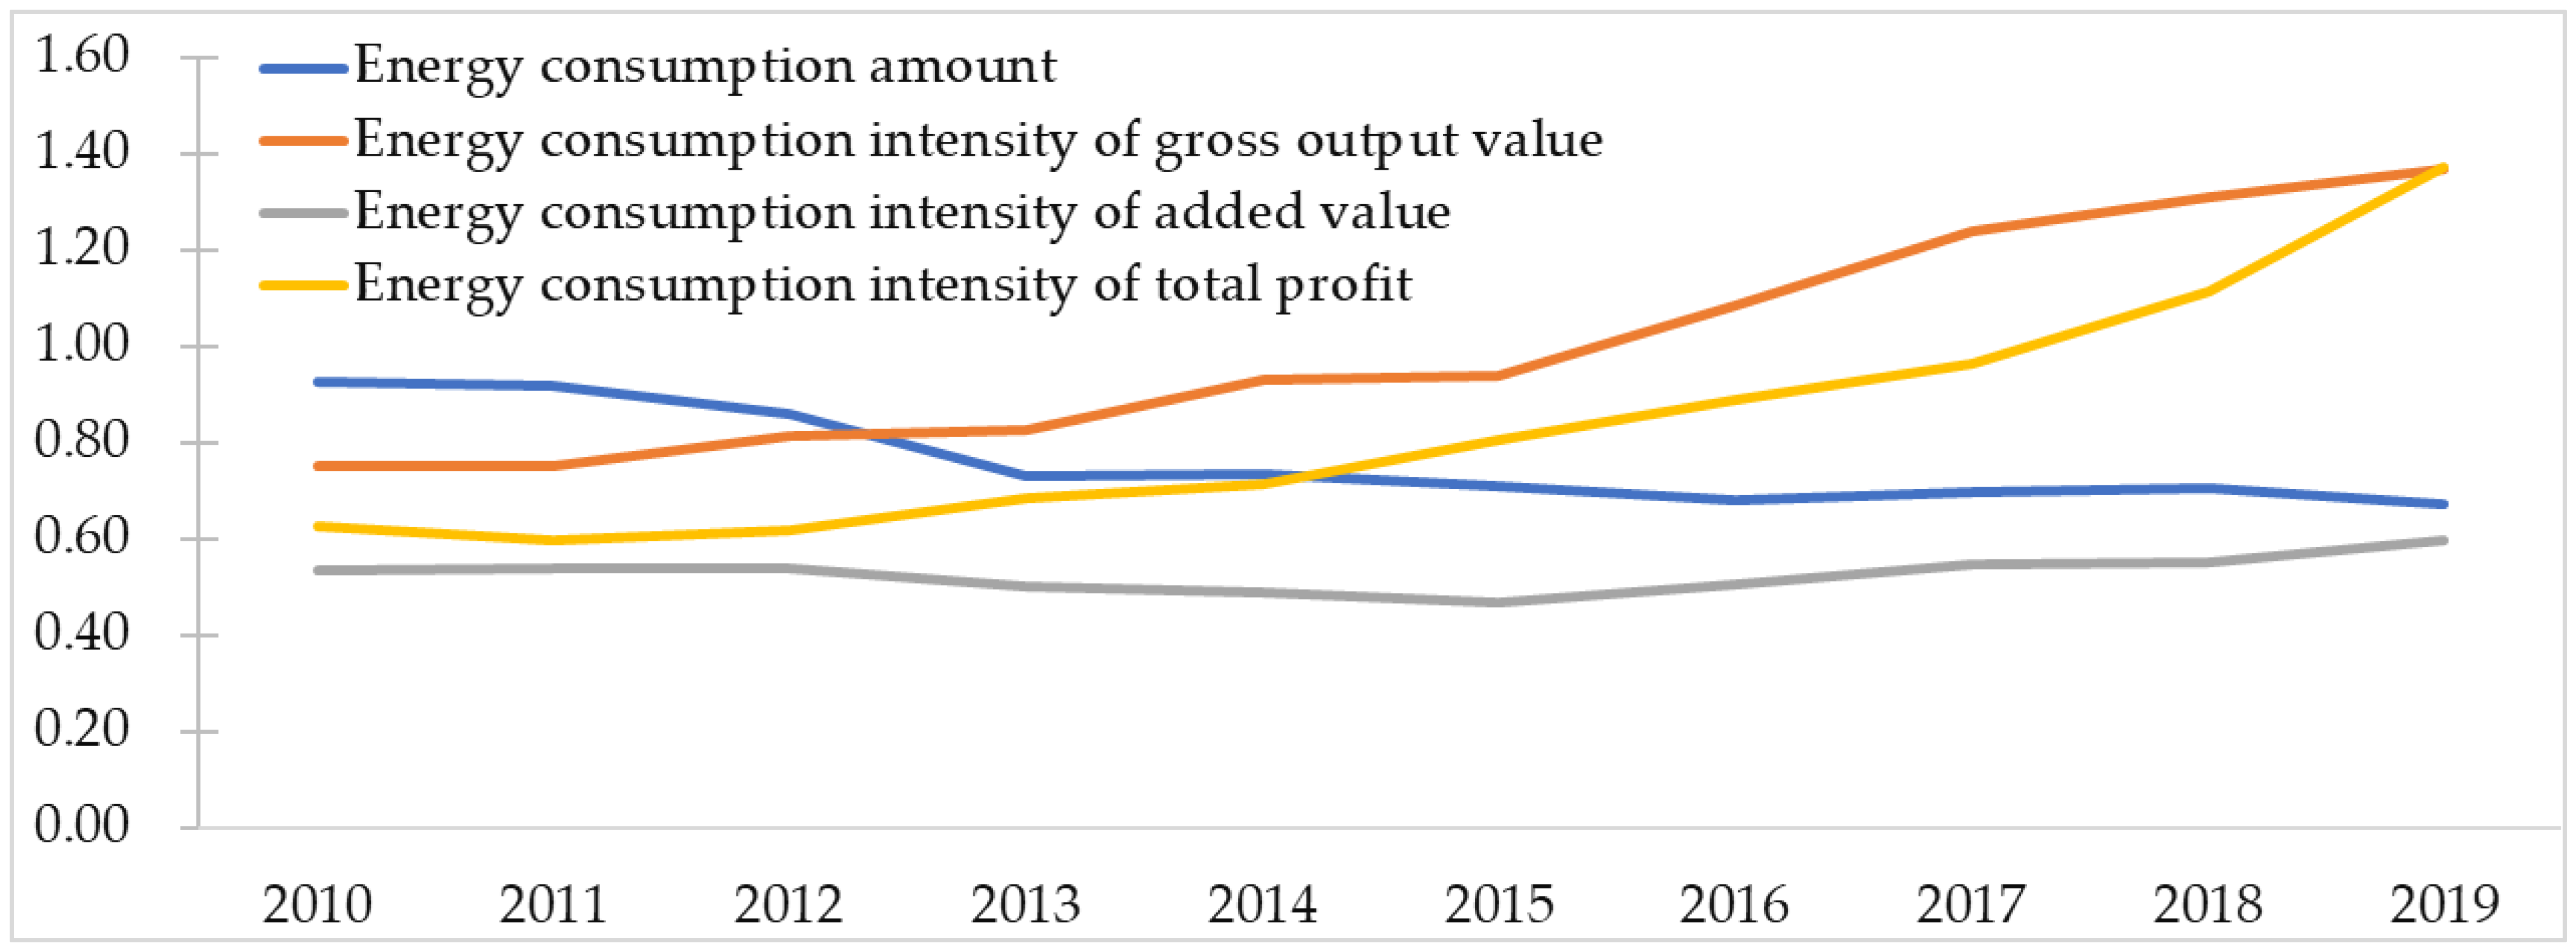
3.1. Temporal Characteristic of Energy Consumption

3.1.1. Temporal Trend of ECA

From 2010 to 2019, ECA in the construction industry in China’s provinces presented changes in upward, “U”-shaped, “inverted U”-shaped, and fluctuating forms, with the upward form dominating (Figure 5). There were 15 provinces with changes in the upward form, including Shanxi, Inner Mongolia, Heilongjiang, Zhejiang, Anhui, Fujian, Jiangxi, Henan, Guangxi, Chongqing, Sichuan, Guizhou, Yunnan, Qinghai, and Xinjiang. Henan and Sichuan showed growth in a “J” shape at a fast rate, while Shanxi, Heilongjiang, Chongqing, and Qinghai grew at a slow rate. Shanghai and Beijing showed changes in a “U” shape. Shanghai saw a steady decline in ECA from 2010 to 2014 and then a steady rebound from 2015 to 2019, while Beijing saw a steady decline in ECA from 2010 to 2013, a slow increase from 2014 to 2018, and a slight decrease in 2019. There are six provinces in the “inverted U” shape, including Tianjin, Liaoning, Jilin, Hainan, Shaanxi, and Gansu. Tianjin and Shaanxi saw a low value followed by some rebound. Seven provinces experienced fluctuating changes, including Hebei, Jiangsu, Shandong, Hubei, Hunan, Guangdong, and Ningxia. Hebei and Shandong showed a sharp decrease in ECA in 2013, followed by a peak in Hebei in 2017, and then a continuous decrease, while Shandong fluctuated steadily and Jiangsu, Hubei, Hunan, and Ningxia showed “N” shaped fluctuations with a peak and a low value, followed by a resumption of growth.
Energy peaking refers to the process in which total energy consumption reaches a very high point, and then goes through a platform period into a sustained decline; it is the historical turning point of energy consumption from growth to decline. Referring to concepts in the field of carbon emission, this paper determines that the energy consumption in the construction industry, after peaking, has reached the peak when it keeps declining for three consecutive years or longer, and that it has entered the energy consumption plateau when it remains relatively stable for three consecutive years or longer [84]. Today, 13.33% of the provinces have reached the peak of energy consumption in the construction industry, namely Tianjin, Liaoning, Heilongjiang, and Shaanxi, and 30.00% are in the plateau of energy consumption, namely Beijing, Shanxi, Jilin, Shanghai, Shandong, Hainan, Chongqing, Gansu, and Ningxia, while the rest, 56.67%, are in the growth phase.

3.1.2. Temporal Trend of ECI

From 2010 to 2019, ECI in the construction industry showed changes in downward, upward, “U”-shaped, and “inverted U”-shaped forms, and is dominated by the downward form (Figure 6). In terms of the gross output value, ECI in the construction industry in 17 provinces continued to decline, while that of Heilongjiang kept rising. Tianjin, Inner Mongolia, Jilin, Zhejiang, Henan, Guangxi, Qinghai, and Xinjiang showed “U”-shaped changes, while Liaoning, Anhui, Hainan, and Sichuan showed “inverted U”-shaped changes. As for the added value, ECI in the construction industry in 16 provinces continued to decline, with a continuous rise seen in Heilongjiang; “U”-shaped changes in Inner Mongolia, Jilin, Shanghai, Jiangxi, Guangxi, Gansu, Qinghai, Ningxia, and Xinjiang; and “inverted U”-shaped changes in Liaoning, Anhui, Henan, and Sichuan. From the perspective of total profit, ECI in the construction industry in 15 provinces showed a continuous decline, while Inner Mongolia and Liaoning saw a continuous rise; Tianjin, Hebei, Jilin, Zhejiang, Anhui, Henan, Guangxi, Qinghai, Ningxia, and Xinjiang saw “U”-shaped changes; and Heilongjiang, Hainan, and Sichuan saw “inverted U”-shaped changes.
Provinces with upward and “U”-shaped changes were facing more serious problems of high energy consumption in the construction industry. The high energy consumption in the construction industry was increasingly prominent as a whole in nine provinces, such as Heilongjiang, Tianjin, Inner Mongolia, Jilin, Zhejiang, and Henan; the added value of energy consumption in the construction industry in ten provinces, such as Jiangxi, Qinghai, Shanghai, Heilongjiang, Guangxi and Xinjiang decreased; and the net profit of energy consumption of construction enterprises in twelve provinces, such as Inner Mongolia, Liaoning, Tianjin, Hebei, Jilin, and Zhejiang declined.

3.2. Spatial Characteristic of Energy Consumption

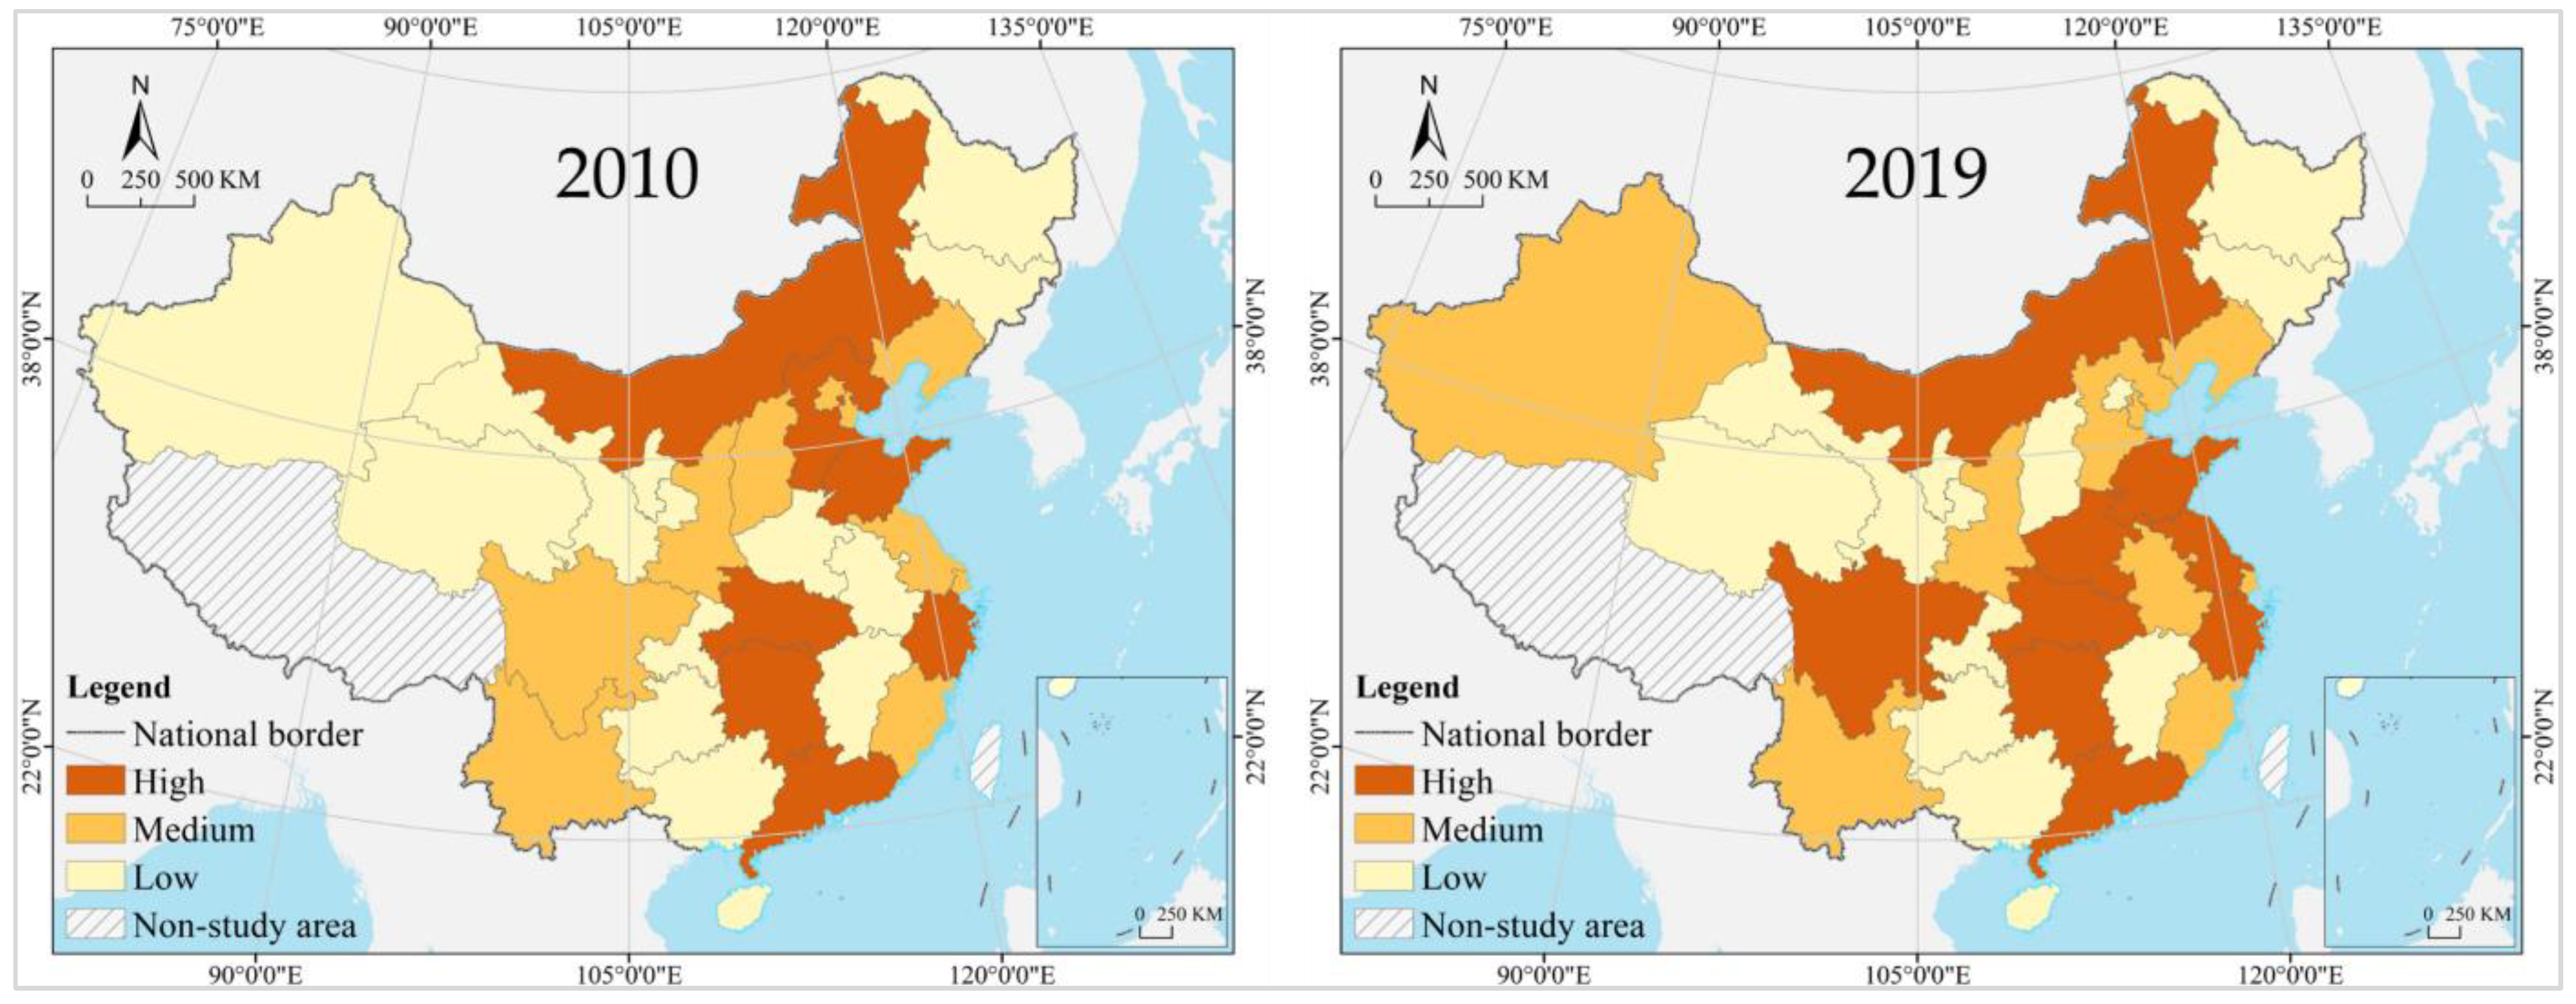
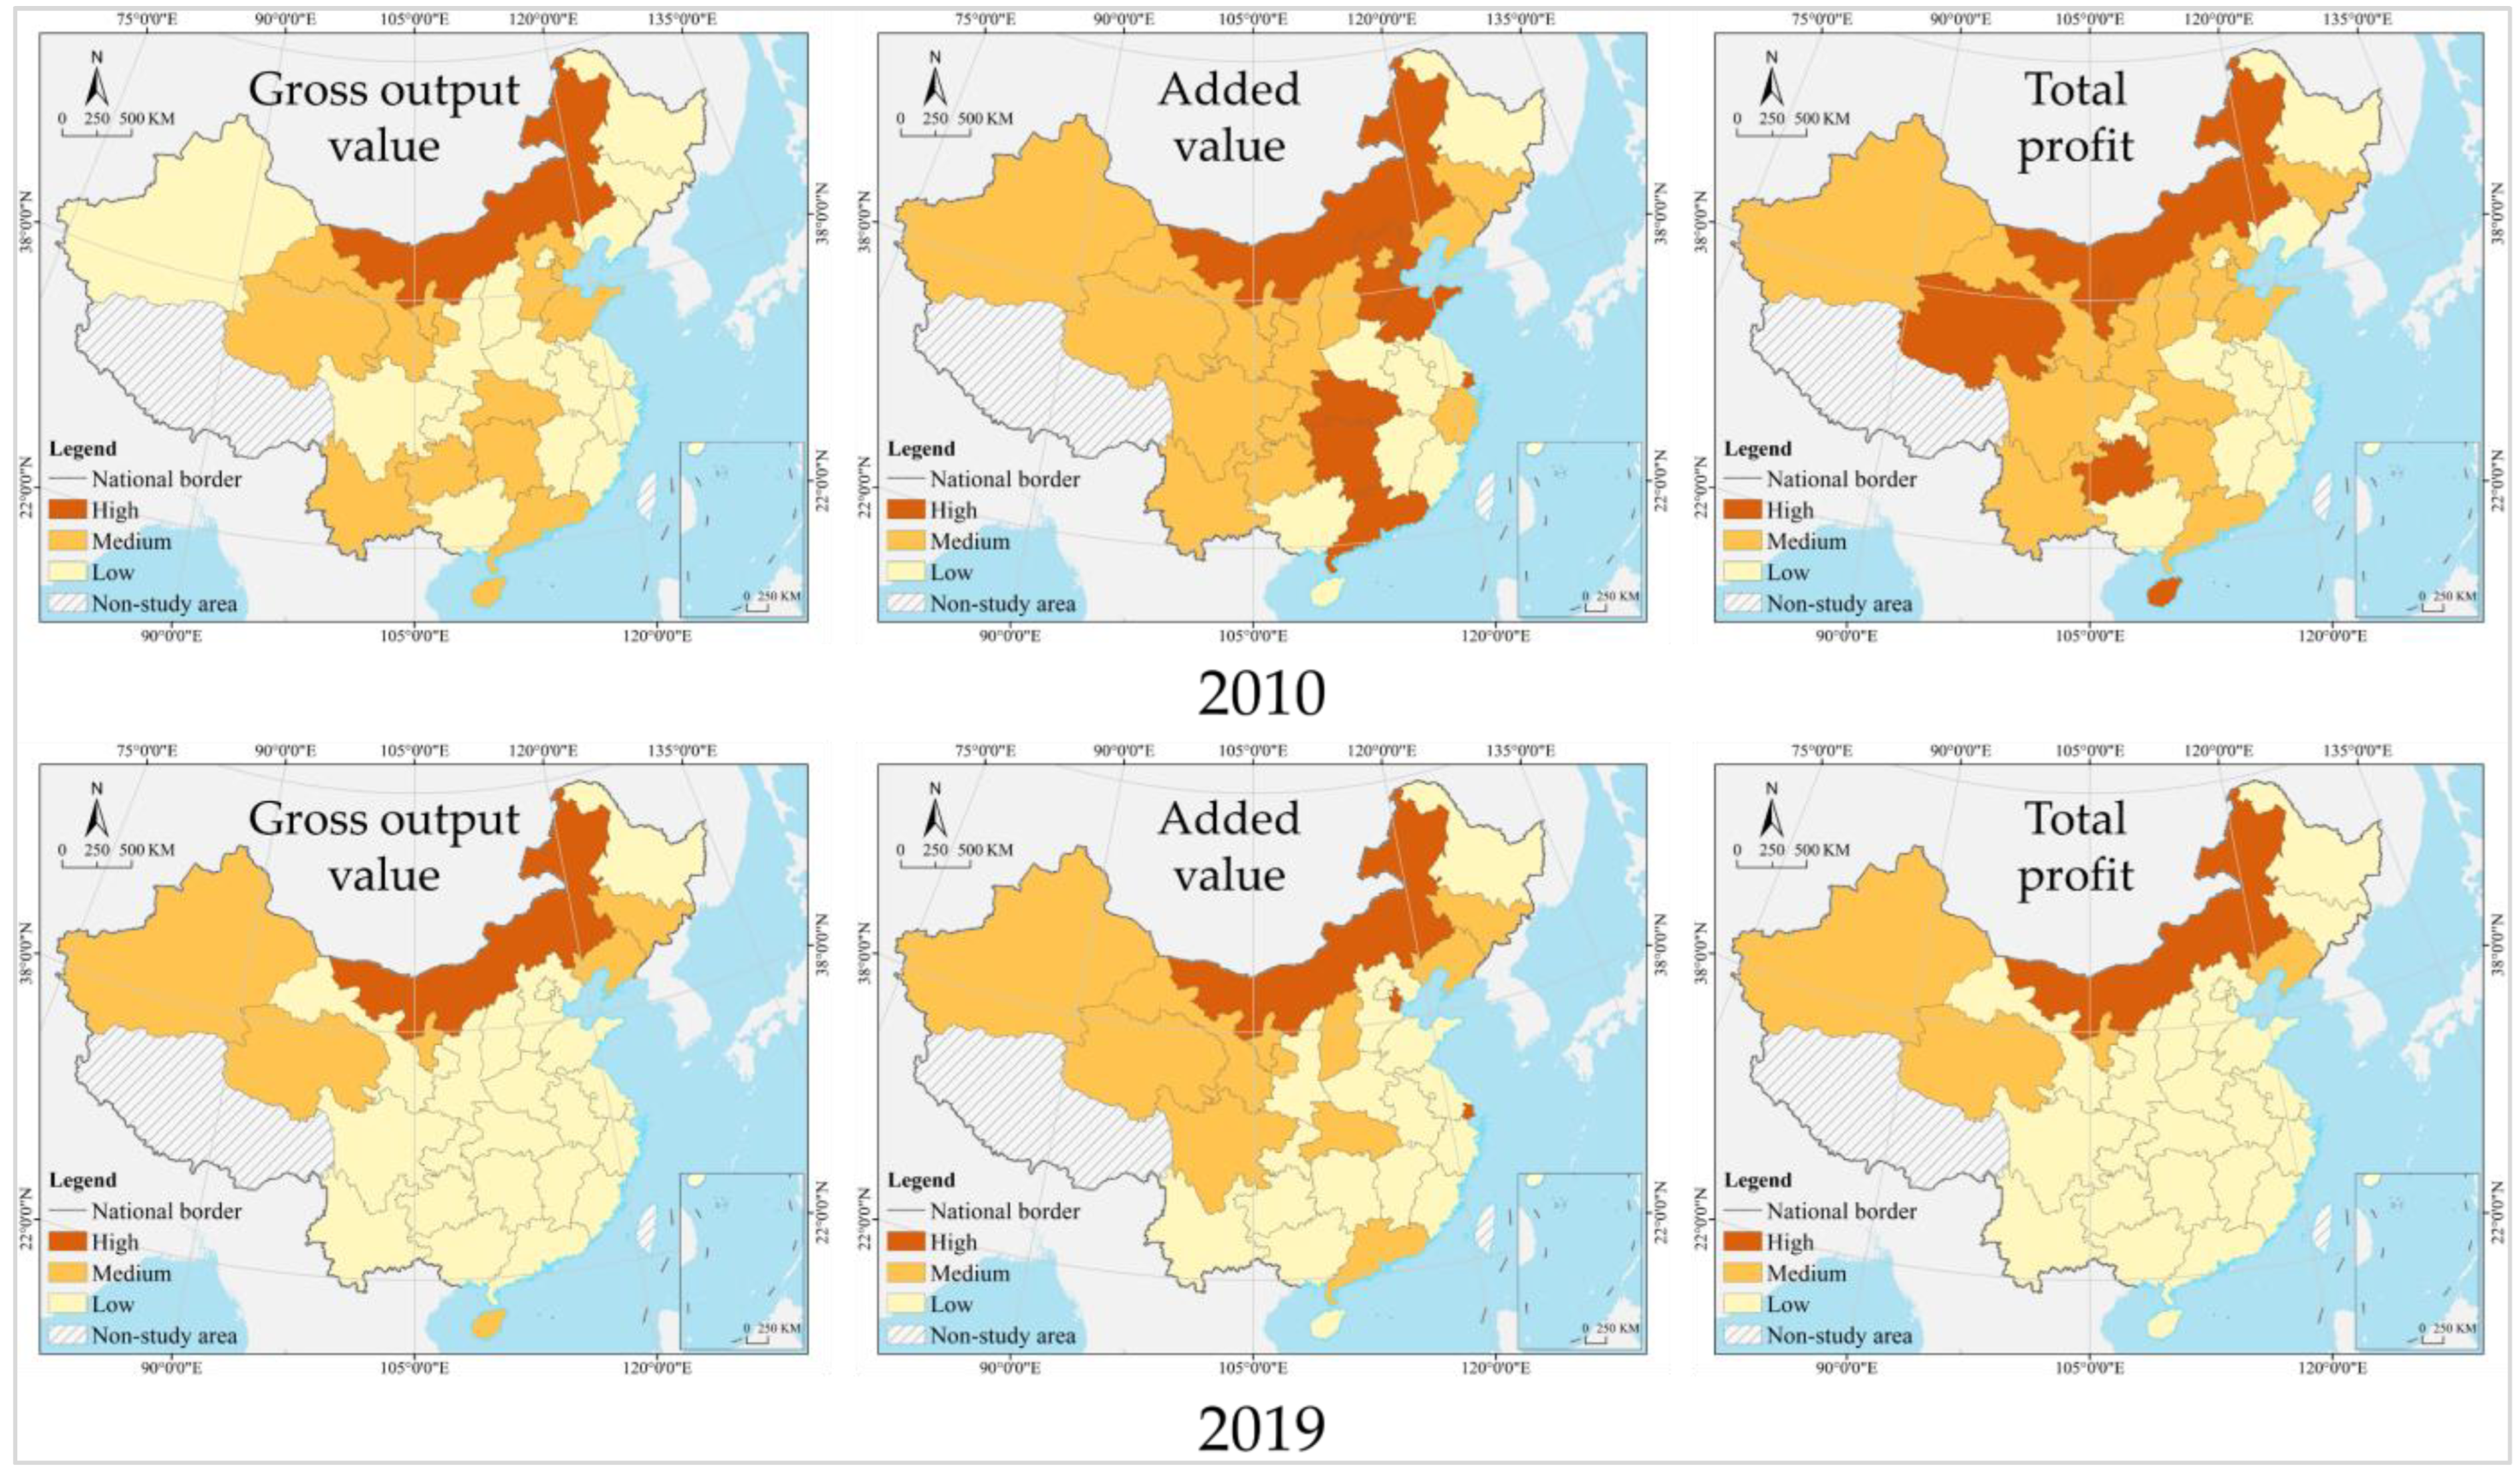
3.2.1. Spatial Heterogeneity Analysis

The differences in ECA and ECI in the construction industry in China were significant across provinces, with the spatial heterogeneity of ECI of gross output value and total profit outstanding, while that of ECA and added value decreased. From 2010 to 2019, the coefficient of variation of ECA decreased from 0.93 to 0.67, the ECI of gross output value increased from 0.75 to 1.37, the ECI of added value increased from 0.54 to 0.60, and the ECI of total profit increased from 0.63 to 1.37. The coefficients of variation of ECA and ECI were generally greater than 0.47, indicating a strong dispersion with pronounced growth and reduction trends (Figure 7).

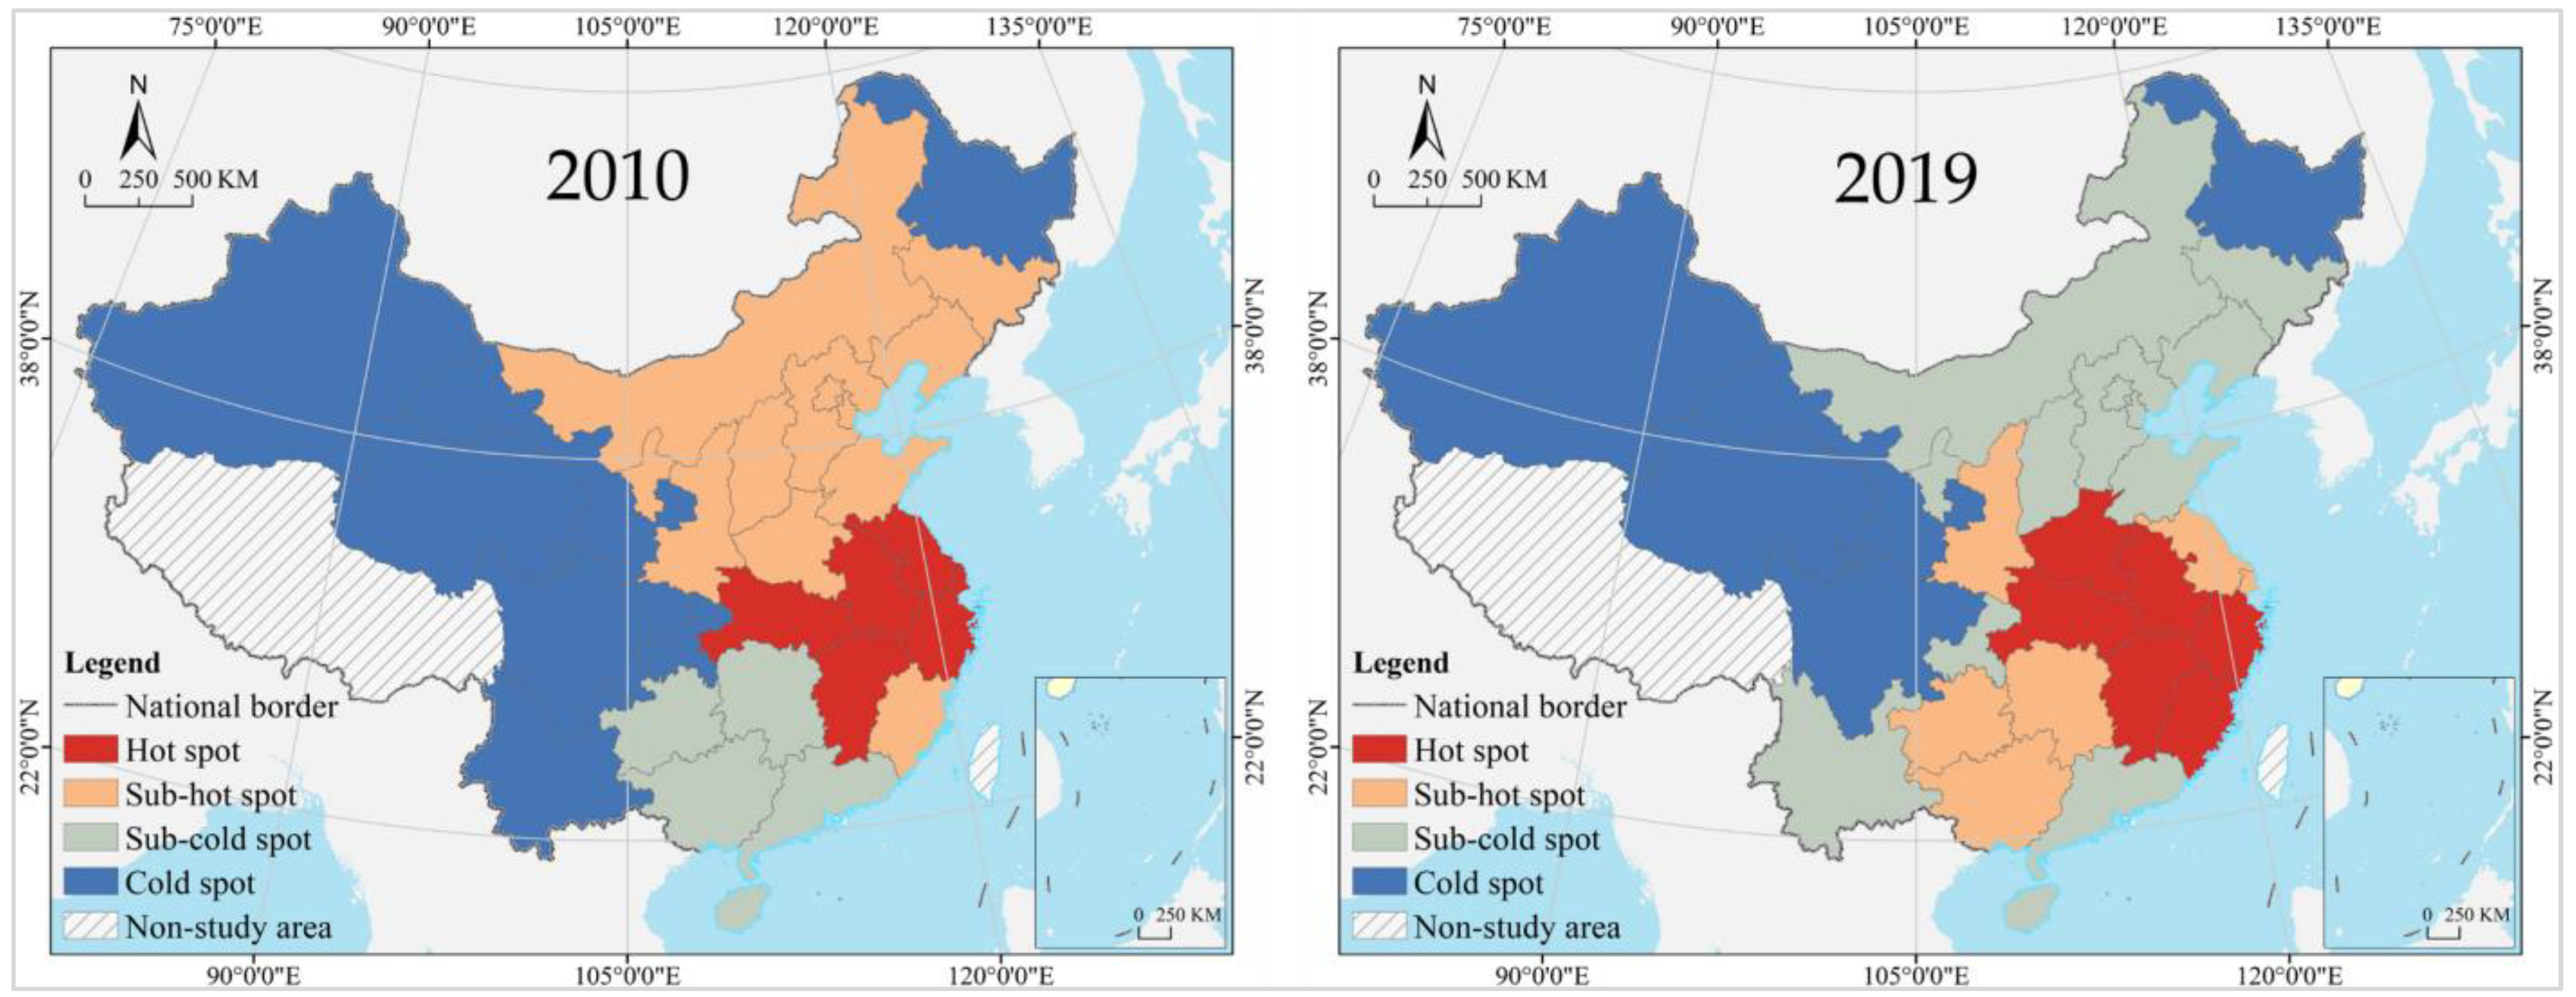
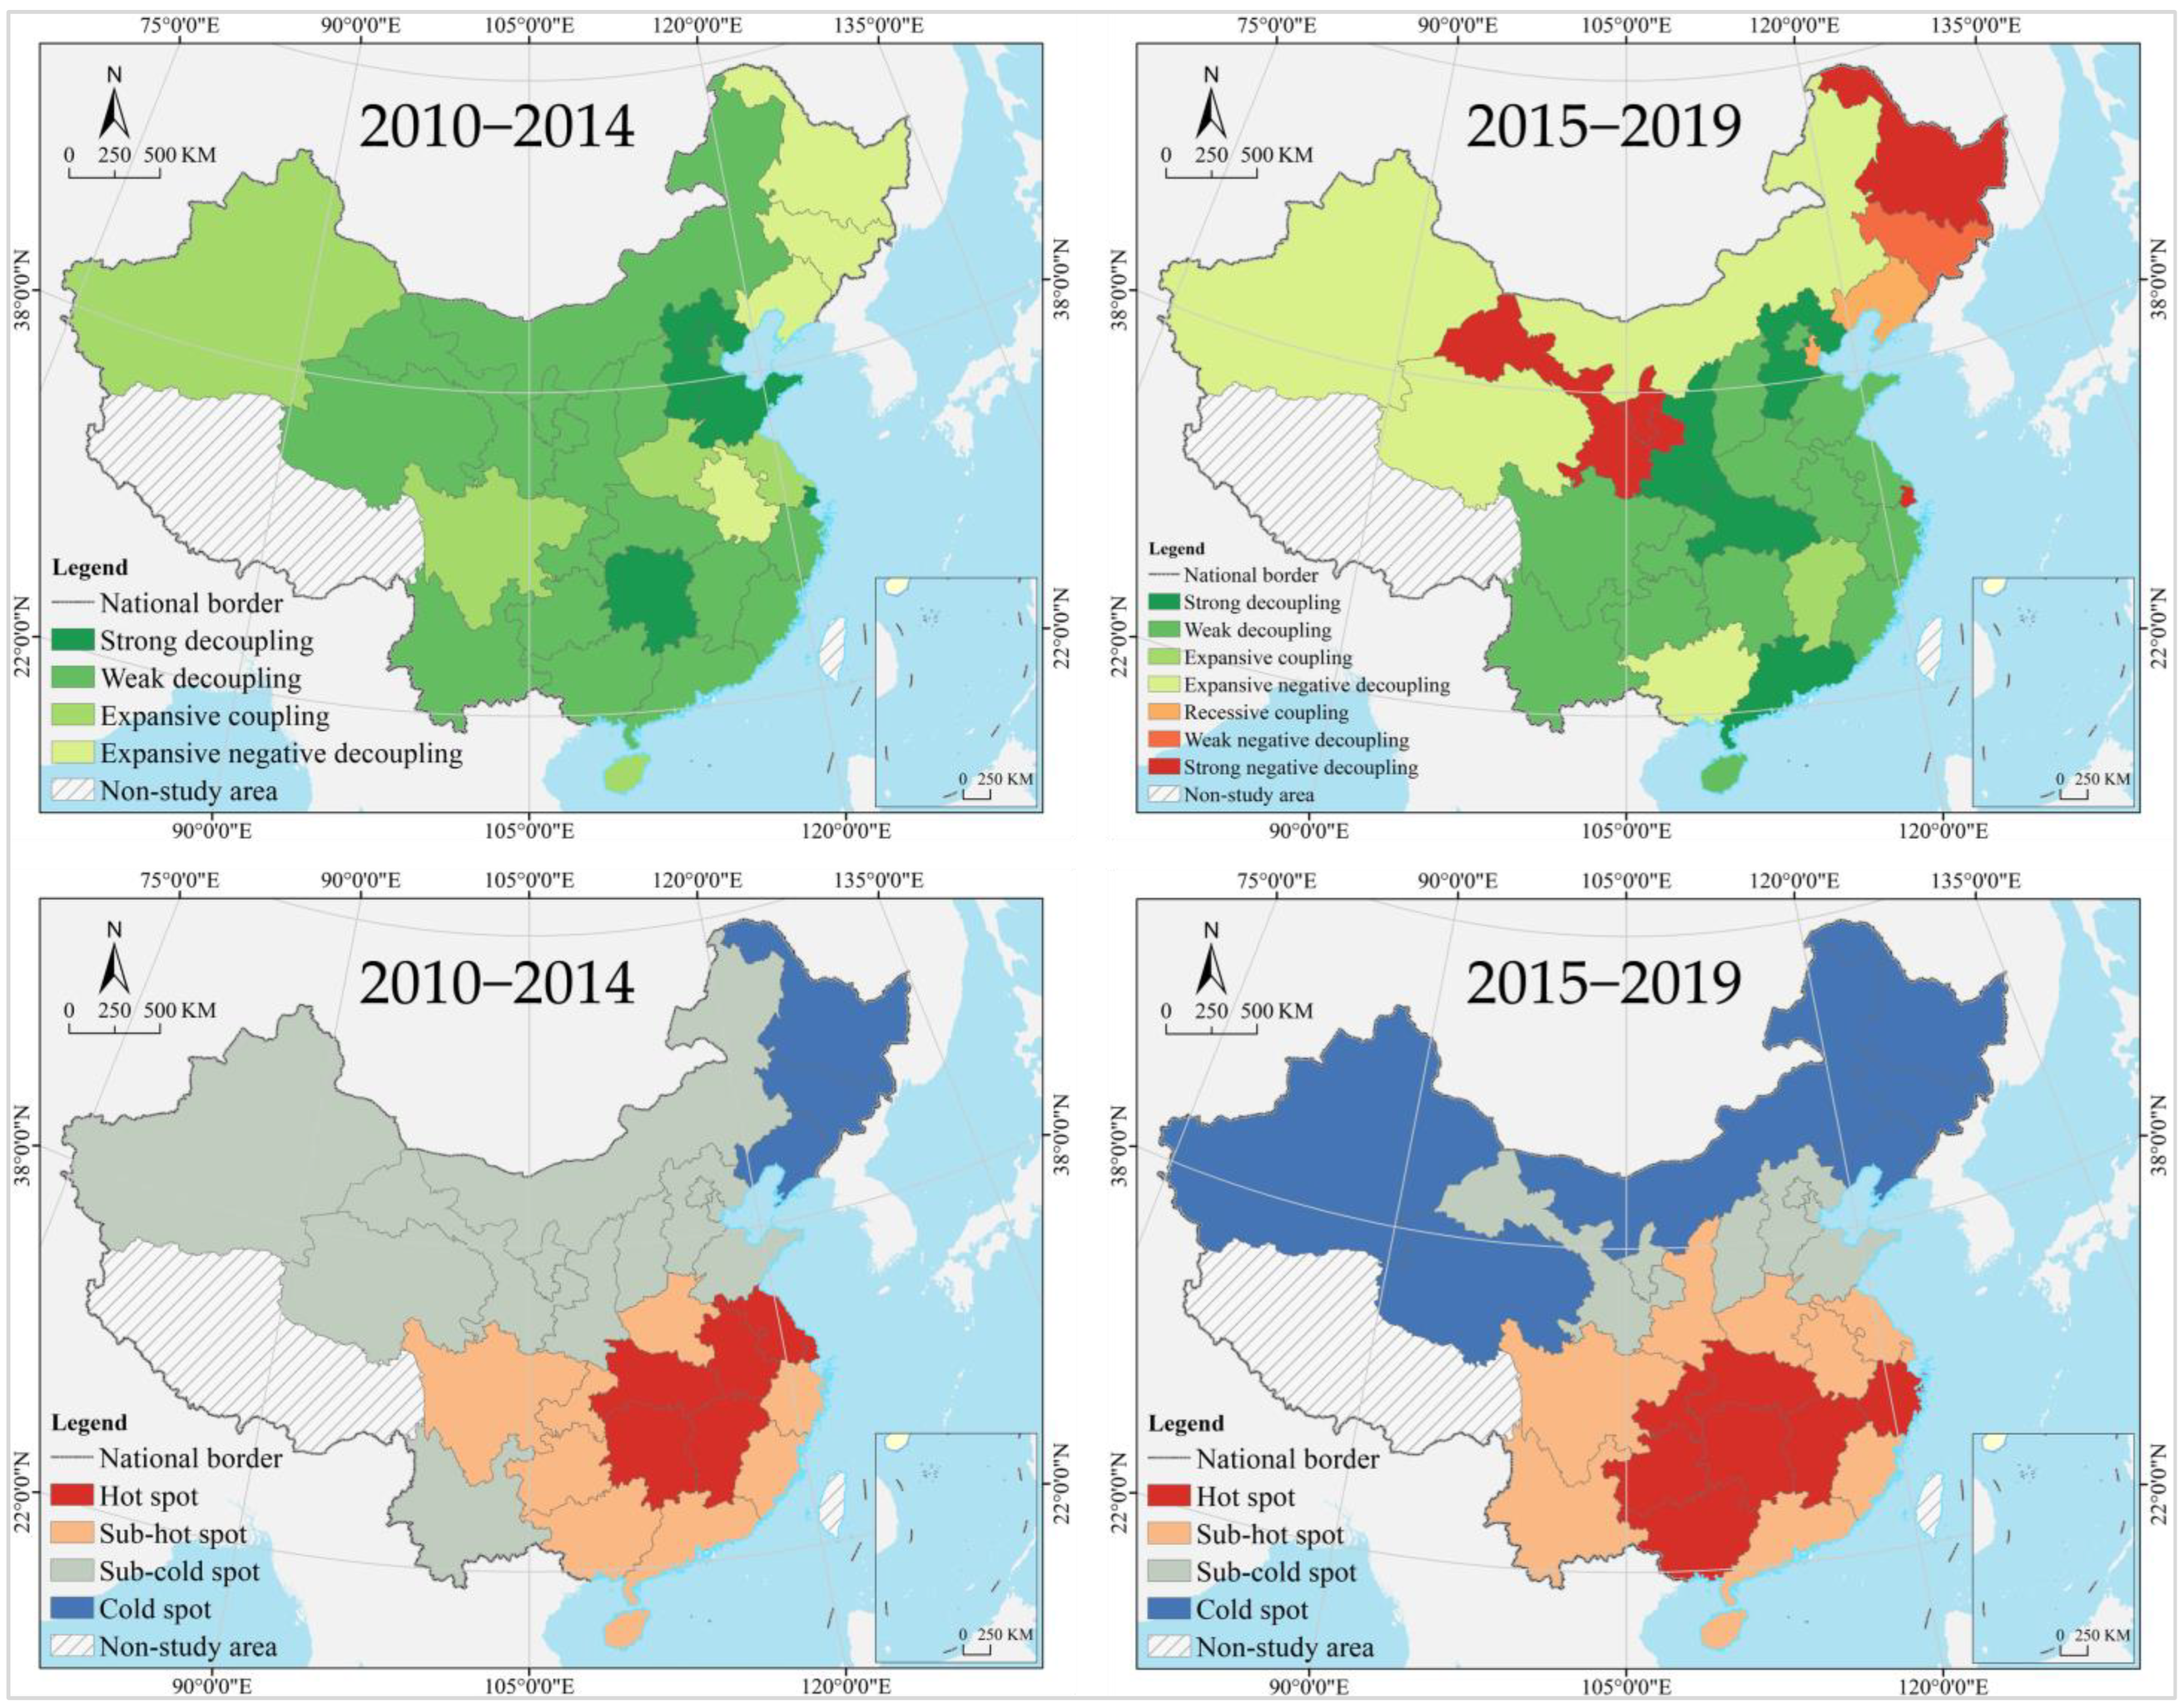
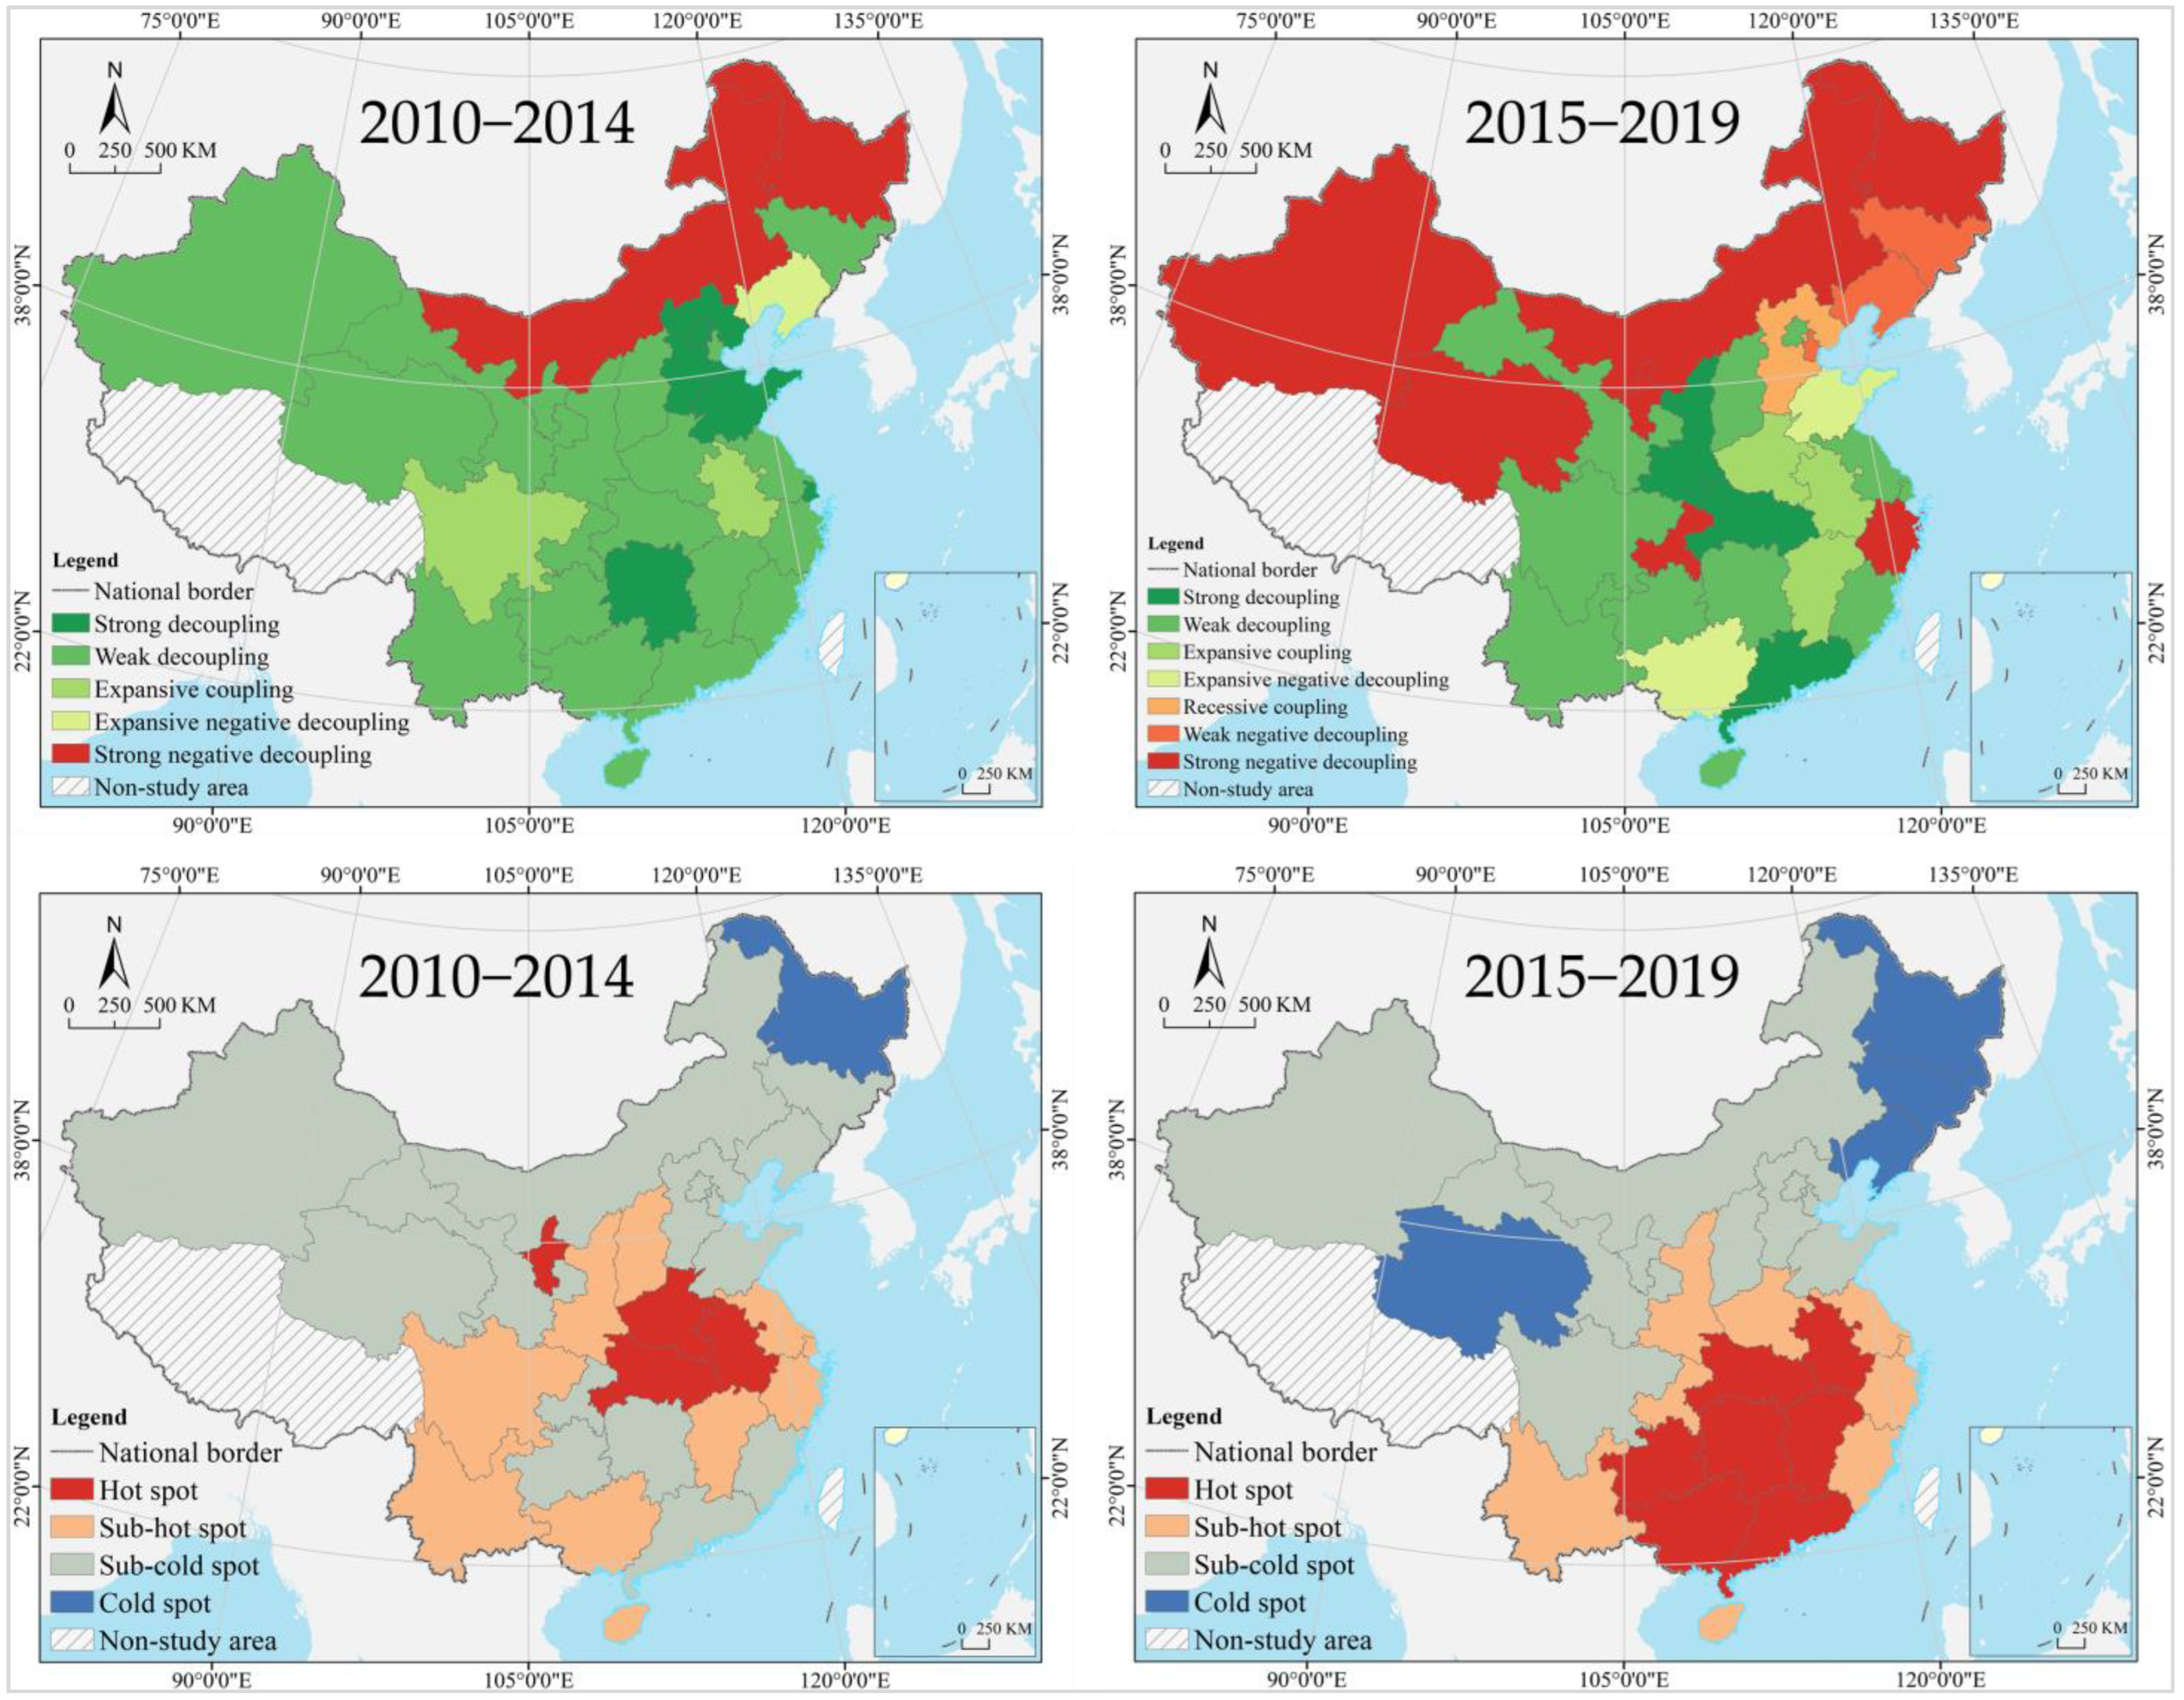
3.2.2. Spatial Cluster Analysis

We classified ECA and ECI of 30 provinces in China into three types of high, medium, and low levels based on the natural break method (Figure 8). The regions with high ECA values gradually increased, the regions with medium values relatively shrank, and the regions with low values remained stable. The regions with high and medium values were mainly distributed in northern, central, southwest, and eastern China, and further expanded to the west. In 2010, high regions consisted of seven provinces, including Inner Mongolia, Shandong, Guangdong, and Hubei, distributed in northern, central, and eastern China; medium regions consisted of eleven provinces, including Liaoning, Beijing, Sichuan, and Shaanxi, distributed in central, southwest, and eastern China; there were twelve provinces in the low regions including Heilongjiang, Anhui, Guizhou, and Gansu, distributed in northeast, northwest, central, and southwest China. In 2019, high regions increased to nine provinces, including Inner Mongolia, Shandong, Henan, and Sichuan, distributed in northern, central, western, and eastern China; medium regions decreased to nine provinces, including Liaoning, Anhui, Xinjiang, and Yunnan, distributed in southwest, eastern, northwest China and Bohai Rim; low regions remained the same and consisted of twelve provinces, including Heilongjiang, Shanxi, Guizhou, and Gansu, distributed in northeast, northwest, southwest, and central China.
The regions with high and medium ECI values relatively shrank, while the regions with low values increased. The regions with high and medium values were mainly distributed in northern, central, northwest, and southwest China, and further shrank to the north. As for the cross-output value, in 2010, high regions included Inner Mongolia only, distributed in northern China; medium regions consisted of twelve provinces, including Gansu, Guizhou, Hubei, and Guangdong, distributed in southwest, central, northwest China and Bohai Rim; low regions consisted of seventeen provinces, including Heilongjiang, Shanxi, Sichuan, and Zhejiang, distributed in northeast, central, western, and eastern China. In 2019, high regions remained the same and consisted of Inner Mongolia only; medium regions decreased to six provinces, including Jilin, Ningxia, Xinjiang, and Hainan, distributed in northeast and northwest China, and in southern coastal regions; low regions increased to twenty-three provinces, distributed in most areas of China.
In 2010, the high regions for added value consisted of seven provinces, including Inner Mongolia, Hebei, Hubei, and Guangdong, distributed in northern and central China, Bohai Rim, and a few eastern areas; medium regions consisted of fifteen provinces, scattered across China; there were eight provinces in the low regions including Heilongjiang, Anhui, Zhejiang, and Hainan, distributed in northeast and central China, and a few coastal areas. In 2019, high regions decreased to three provinces, including Inner Mongolia, Tianjin, and Shanghai, distributed in northern China, except for two municipalities directly under the central government; medium regions decreased to ten provinces, including Jilin, Xinjiang, Hubei, and Guangdong, distributed in northeast, northwest, and central China, and southern coastal regions; while low regions increased to seventeen provinces, distributed across the country, except in northwest China.
In 2010, high regions for total profit consisted of four provinces: Inner Mongolia, Qinghai, Guizhou, and Hainan, distributed in northern, northwest, and southwest China, and south coastal areas; medium regions consisted of fourteen provinces, scattered across China; there were twelve provinces in low regions including Heilong, Henan, Guangxi, and Fujian, distributed in northeast, central, and eastern China. In 2019, high regions decreased to only Inner Mongolia; medium regions decreased to four provinces: Liaoning, Ningxia, Qinghai, and Xinjiang, distributed in northeast and northwest China; while low regions increased to twenty-five provinces, distributed in most areas of China (Figure 9).

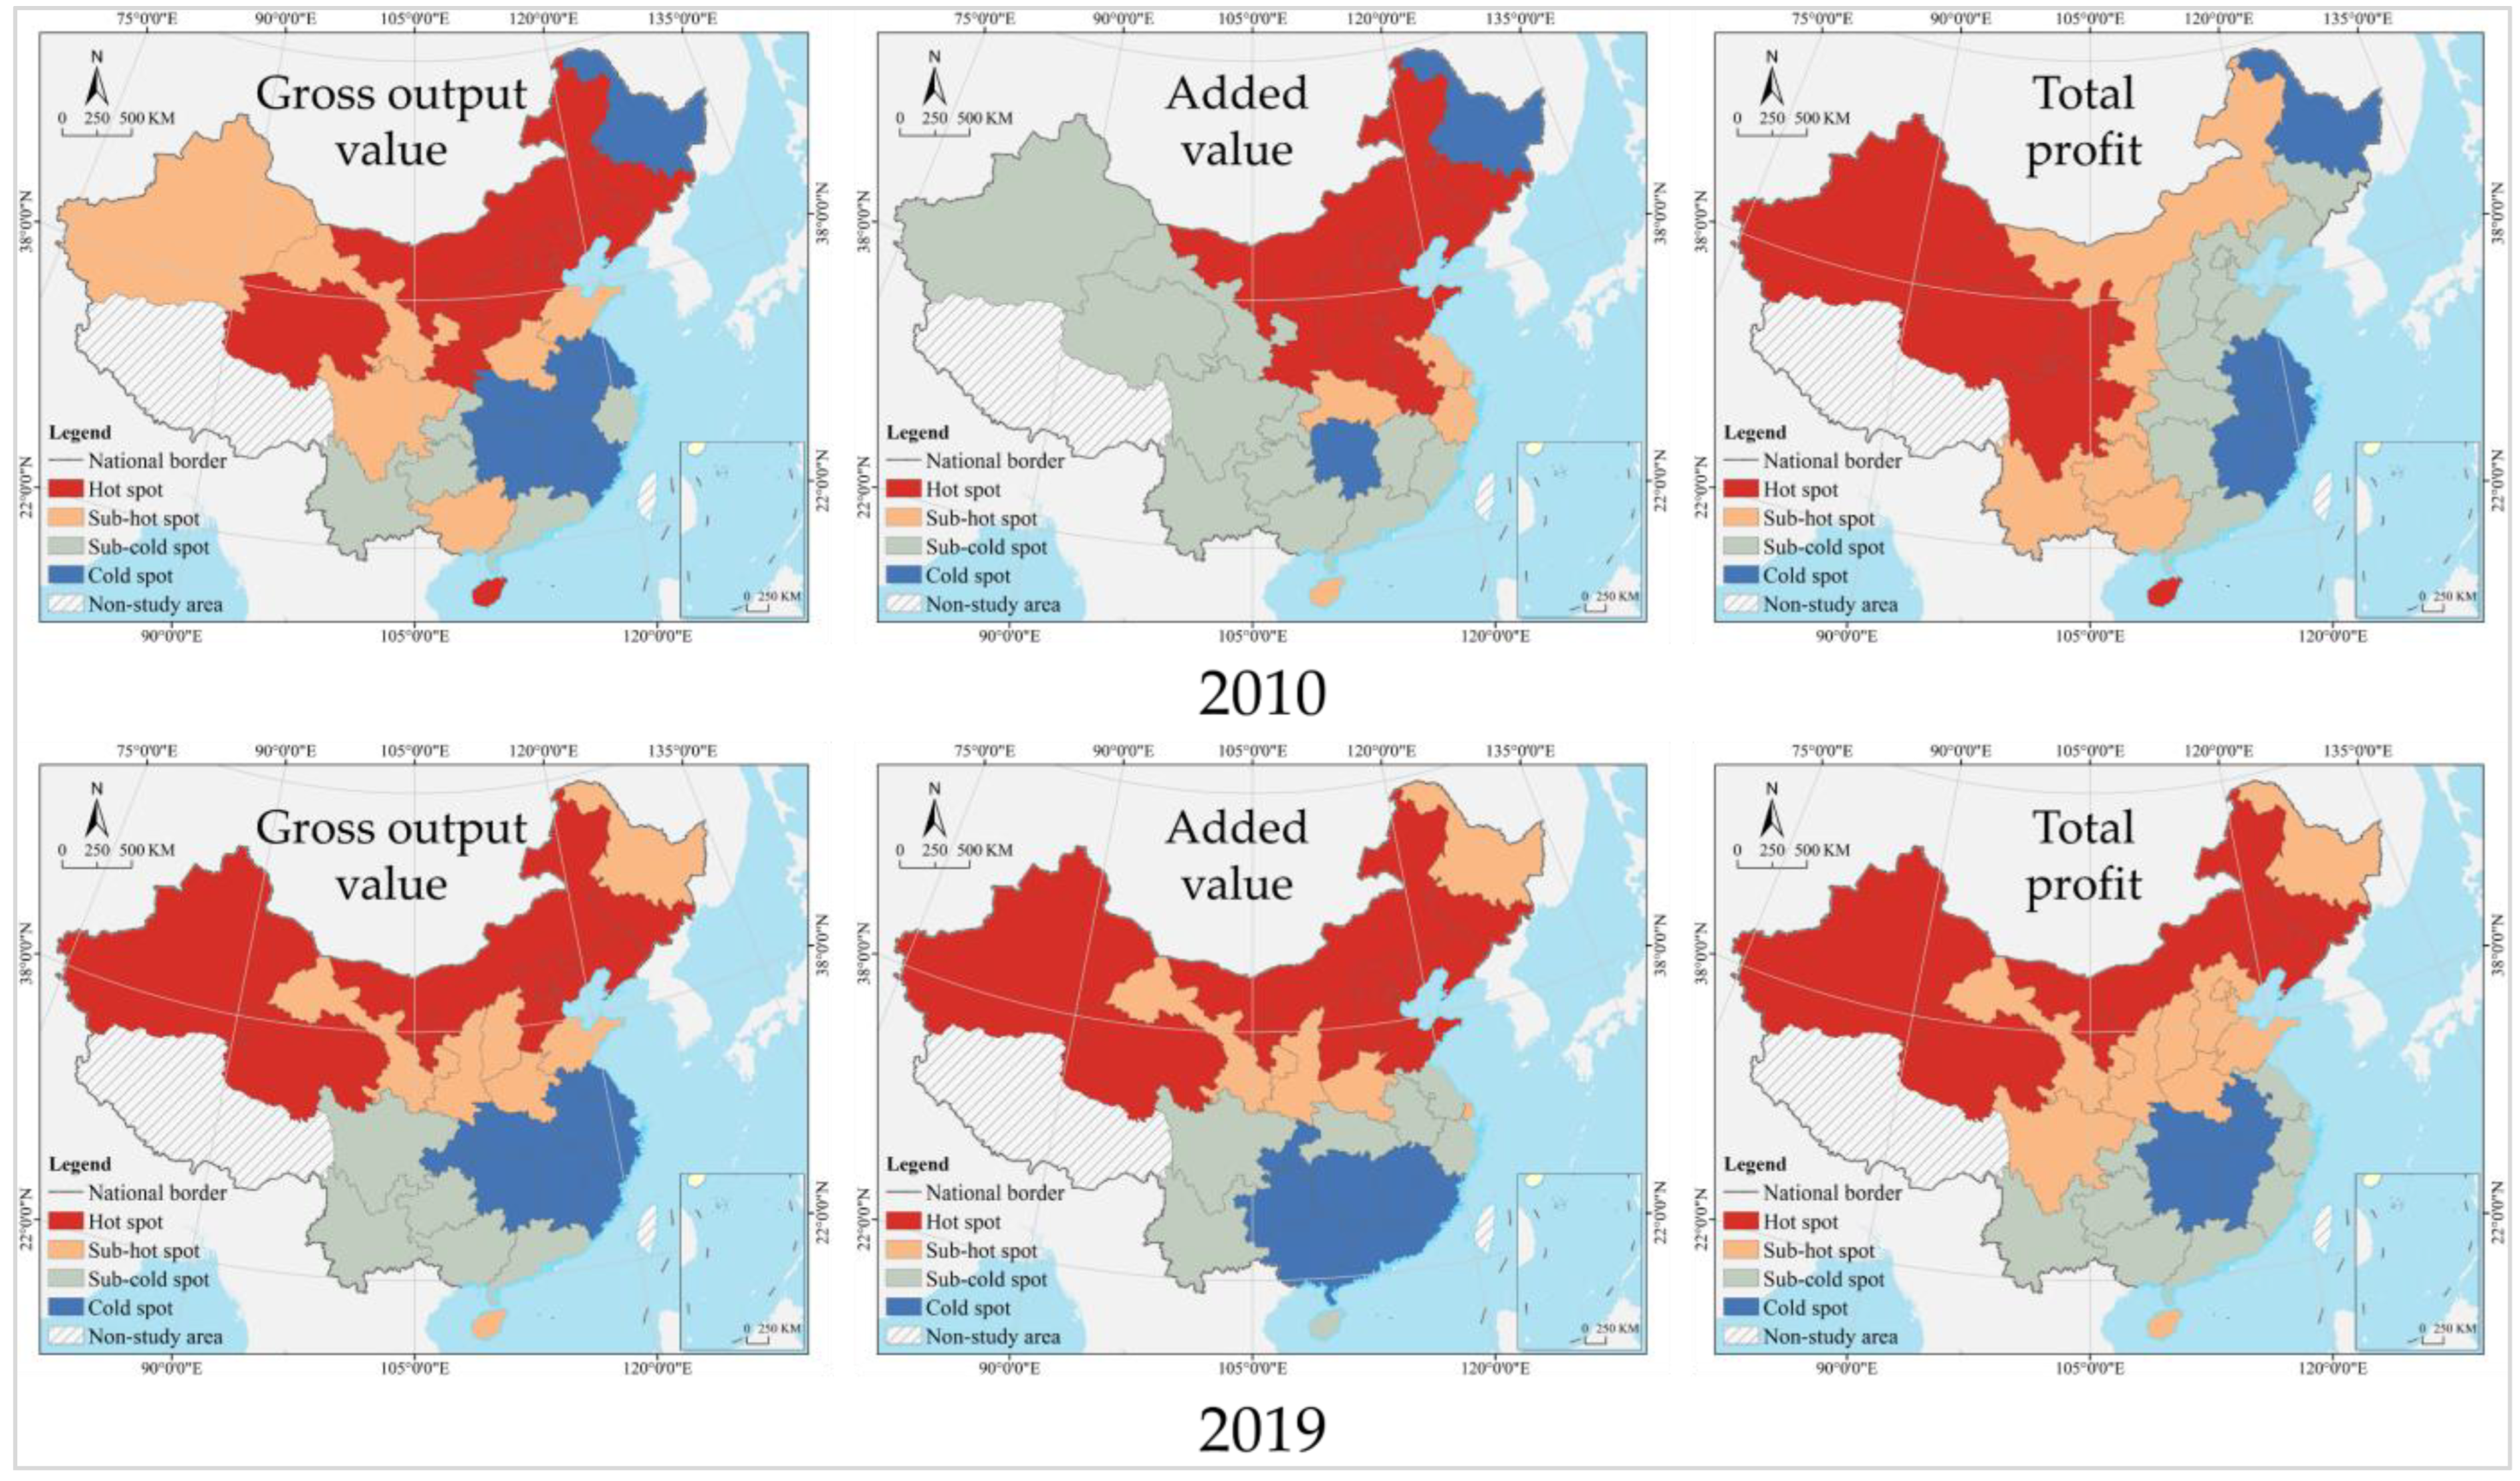
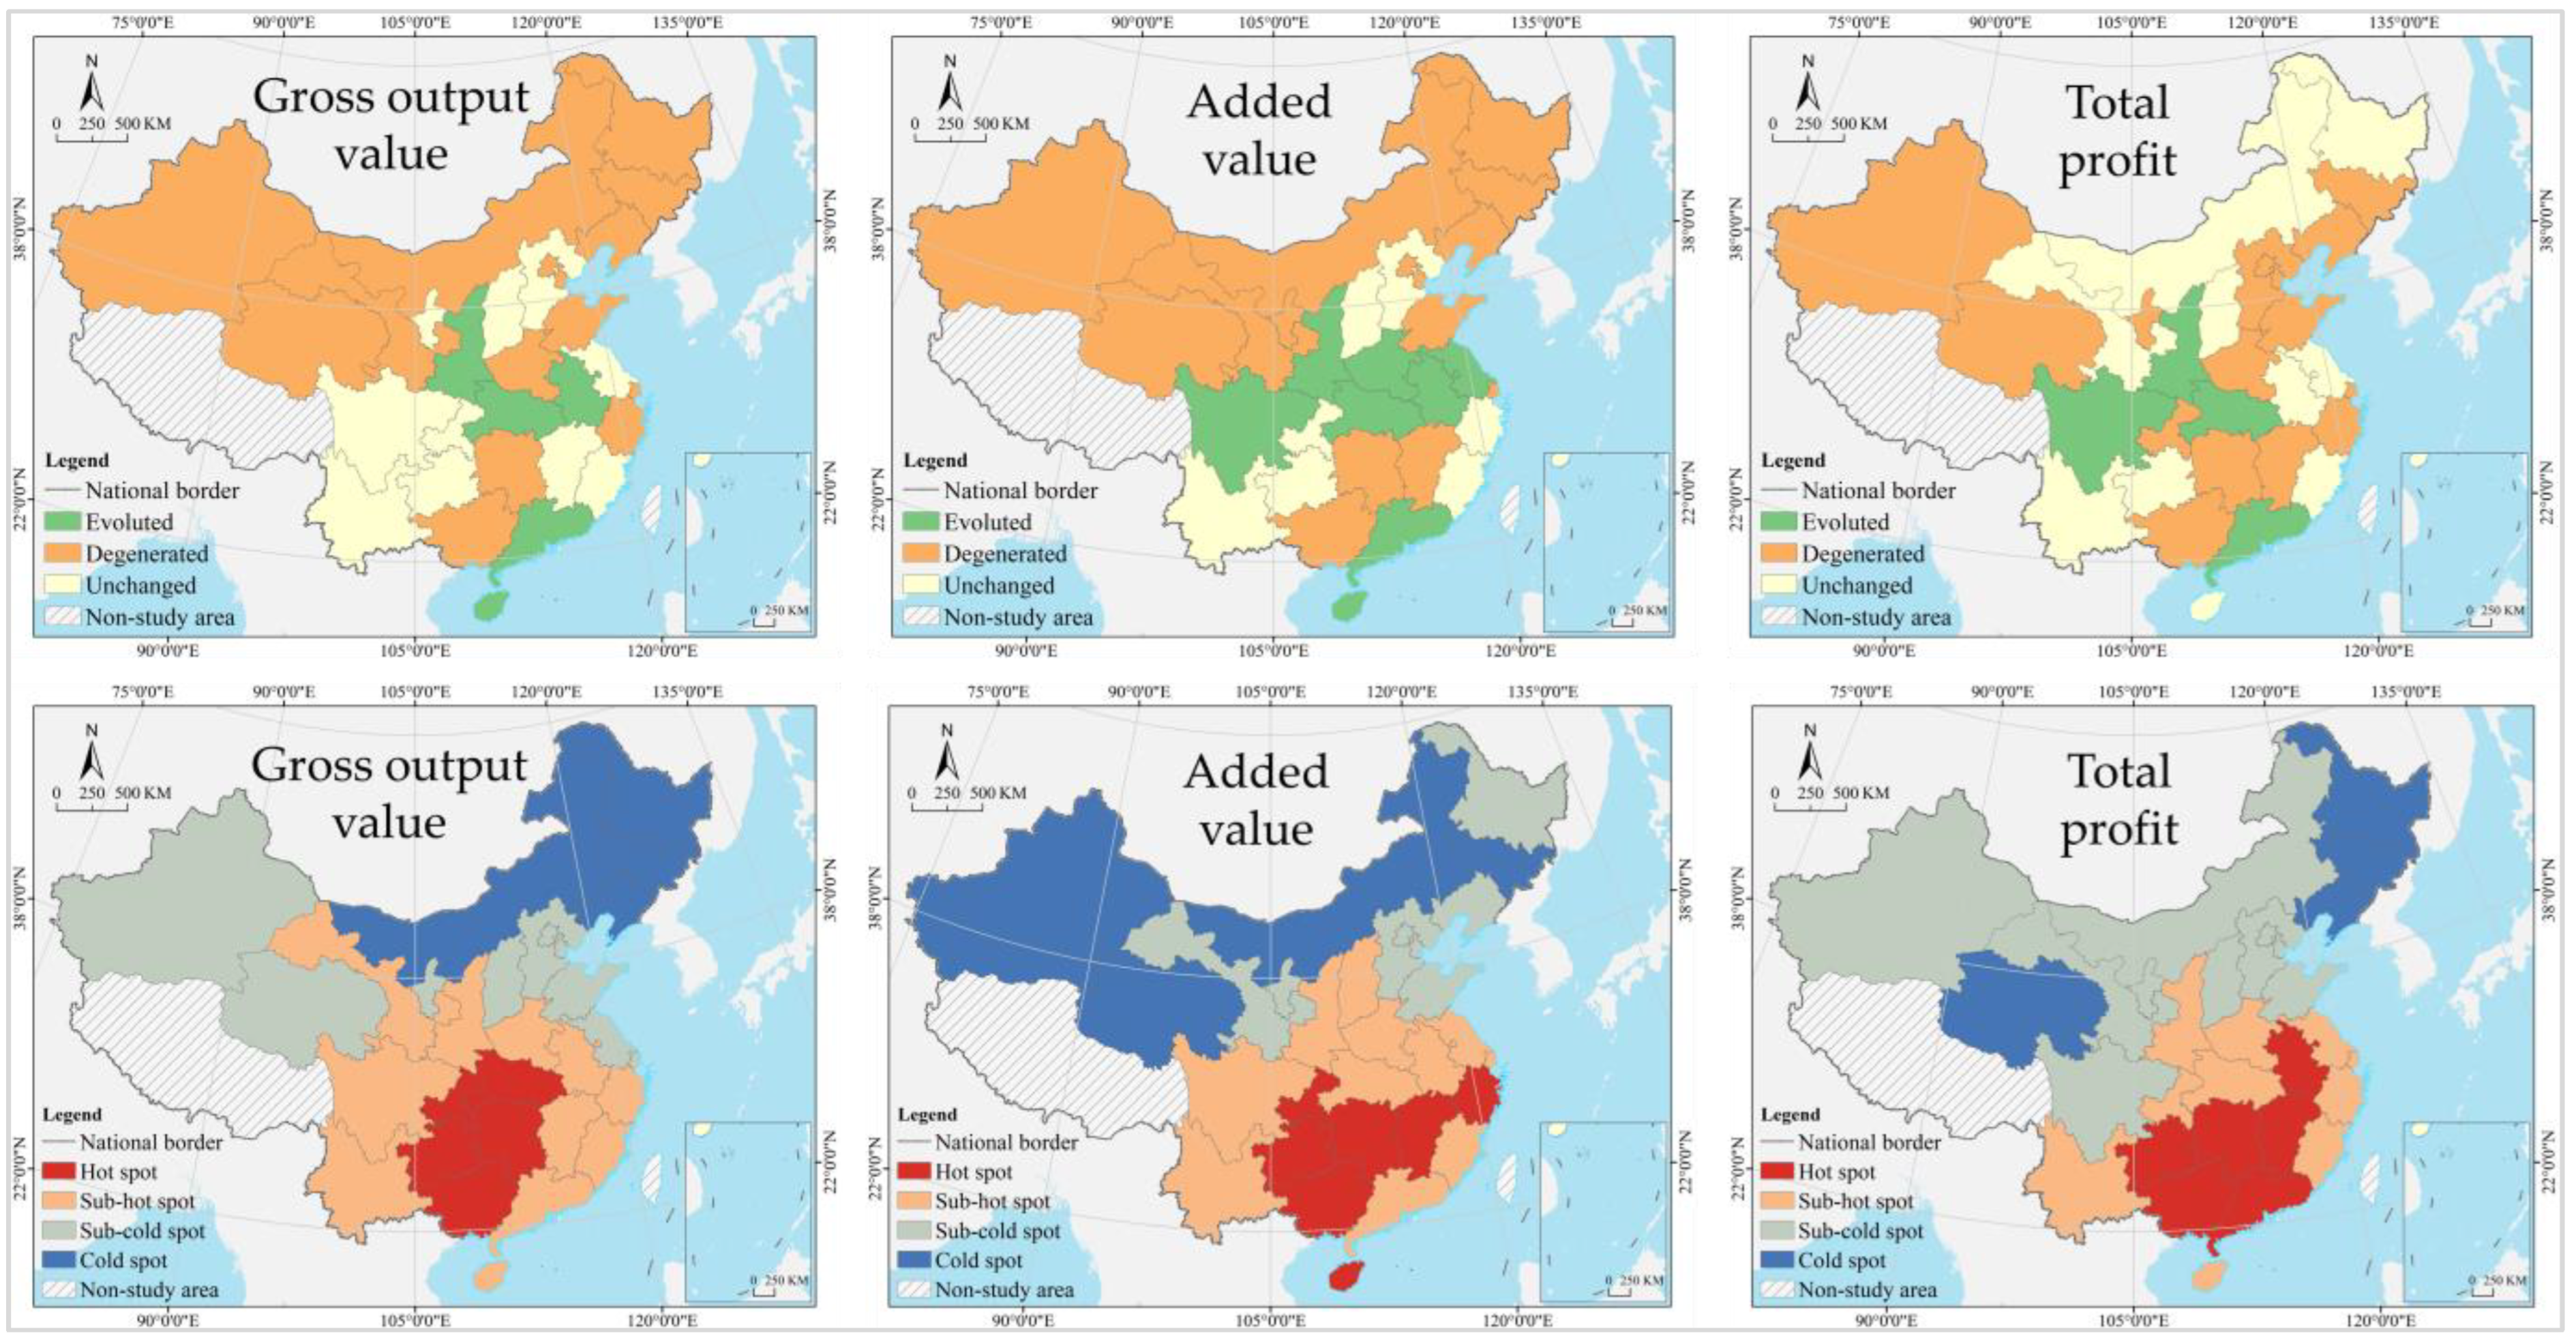
3.2.3. Spatial Aggregation Analysis

We classified G i * values of ECA and ECI of 30 provinces in China into four types: hot spot, sub-hot spot, sub-cold spot, and cold spot by the natural breakpoint method (Figure 10). Hot spots of ECA remained stable in number, while sub-hot spots and cold spots shrank, and sub-cold spots expanded. Hot spots and sub-hot spots showed a trend of gathering from the middle and lower reaches of Yangtze River, northern, and central China to the middle and lower reaches of Yangtze River and southwest China. From 2010 to 2019, hot spots remained stable in six provinces, with spatial location expanding from the middle and lower reaches of Yangtze River to Fujian and Henan; sub-hot spots decreased from twelve to six provinces, with spatial distribution shifting from northern to southwest China; sub-cold spots increased from five to thirteen provinces, with spatial distribution further spreading from southwest to northern China and coastal areas; cold spots decreased from seven to five provinces, with spatial distribution mainly in northeast, northwest, and southwest China.
Hot spots of ECI remained stable in number, while sub-hot spots and cold spots relatively expanded, and sub-cold spots slightly shrank. Hot spots and sub-hot spots were mainly distributed in northern, northeast, northwest, and southwest China, and spread further to the northwest. From the perspective of gross output value, from 2010 to 2019, hot spots decreased from eleven provinces to nine provinces, with spatial distribution spreading further to the northwest from the north, northeast, and northwest China and southern coastal areas; sub-hot spots increased from five provinces to seven provinces, clustered from northwest, central, and southwest China, and a few eastern areas to central and northeast China in spatial distribution; sub-cold spots remained stable in five provinces, mainly clustered in southwest China and southern coastal areas in spatial distribution; cold spots changed from eight provinces to nine provinces, further clustered from northeast, central, and east China to central and east China in spatial distribution.
For the added value, hot spots remained stable in eleven provinces, with spatial distribution further spreading to the northwest from northern and central China and Bohai Rim; sub-hot spots remained stable in five provinces, with spatial distribution shifting from central and eastern China and southern coastal areas to the northeast, northwest, and a few eastern areas; sub-cold spots decreased from twelve to seven provinces, with spatial distribution shifting to southwest, eastern, and central China from the northwest, southwest, and southeast; cold spots increased from two to seven provinces, with spatial distribution shifting from northeast and central China to central China and southern coastal clusters.
Hot spots for total profit remained stable in six provinces, with spatial distribution shifting from the northwest, southwest, and southern coastal areas to northeast, northern, and northwest China; sub-hot spots increased from six to eleven provinces, with spatial distribution shifting from the north and southwest to northeast, northwest, and central China, and southern coastal areas; sub-cold spots decreased from eleven to nine provinces, with spatial distribution shifting from northeast and central China, Bohai Rim and southern coastal areas to the southwest, eastern, and southern coastal areas; cold spots decreased from seven to four provinces, clustered from northeast, central, and eastern China to central China in spatial distribution (Figure 11).

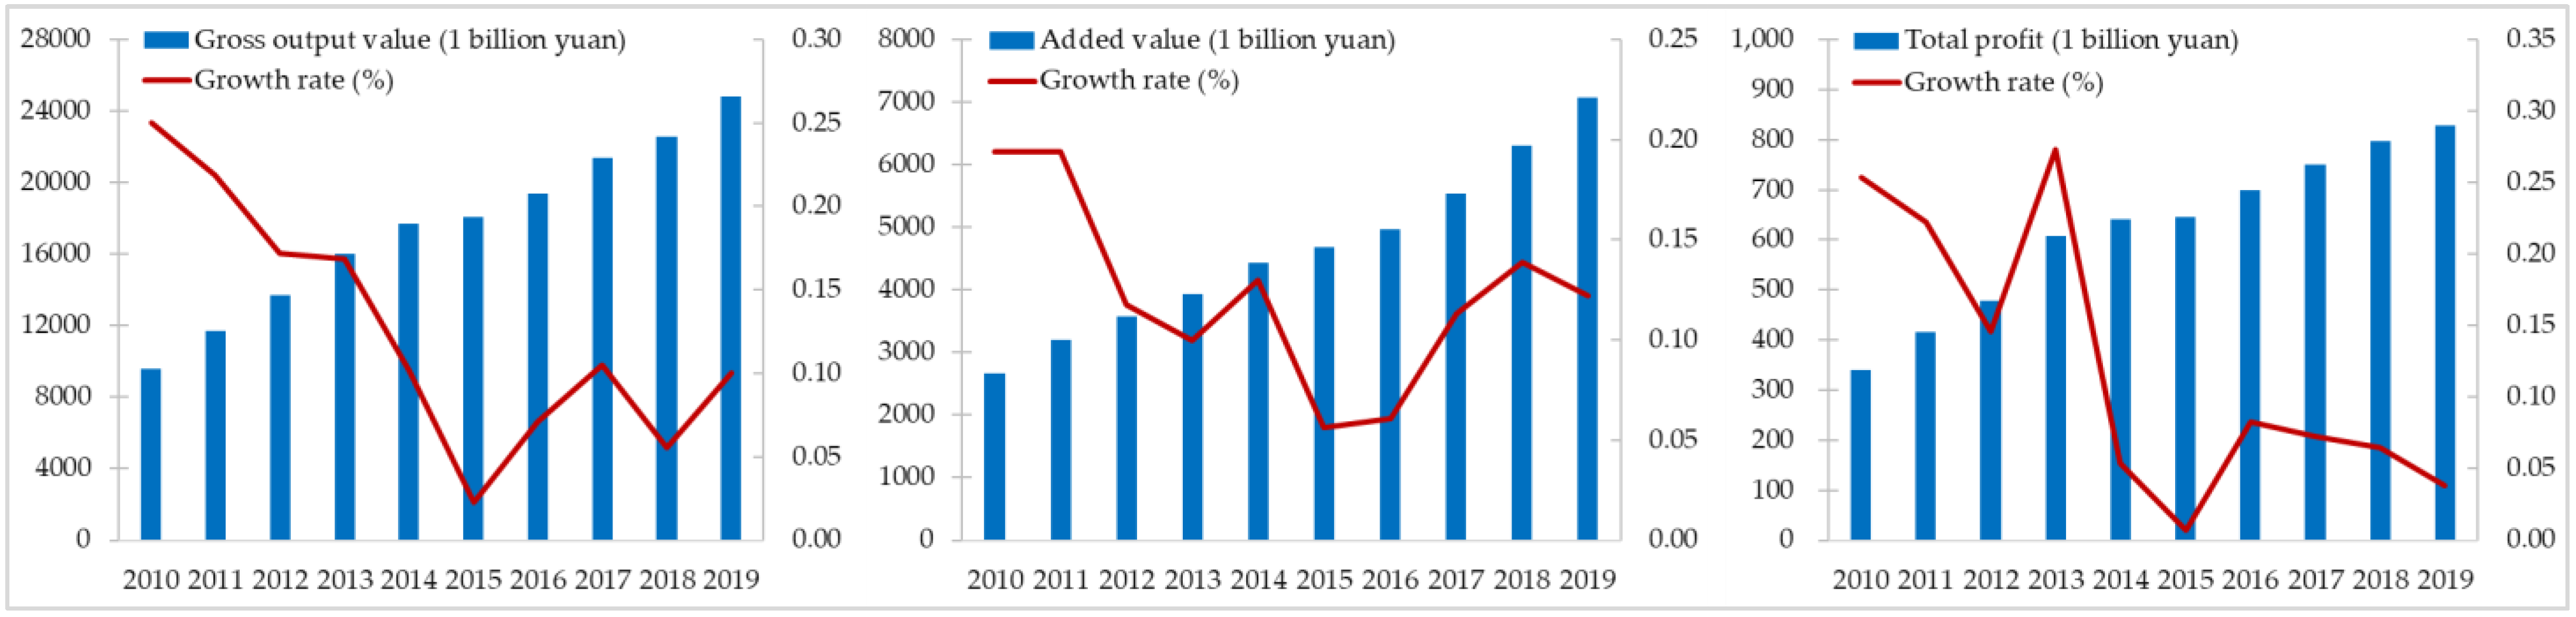
3.3. Decoupling Relationship Analysis

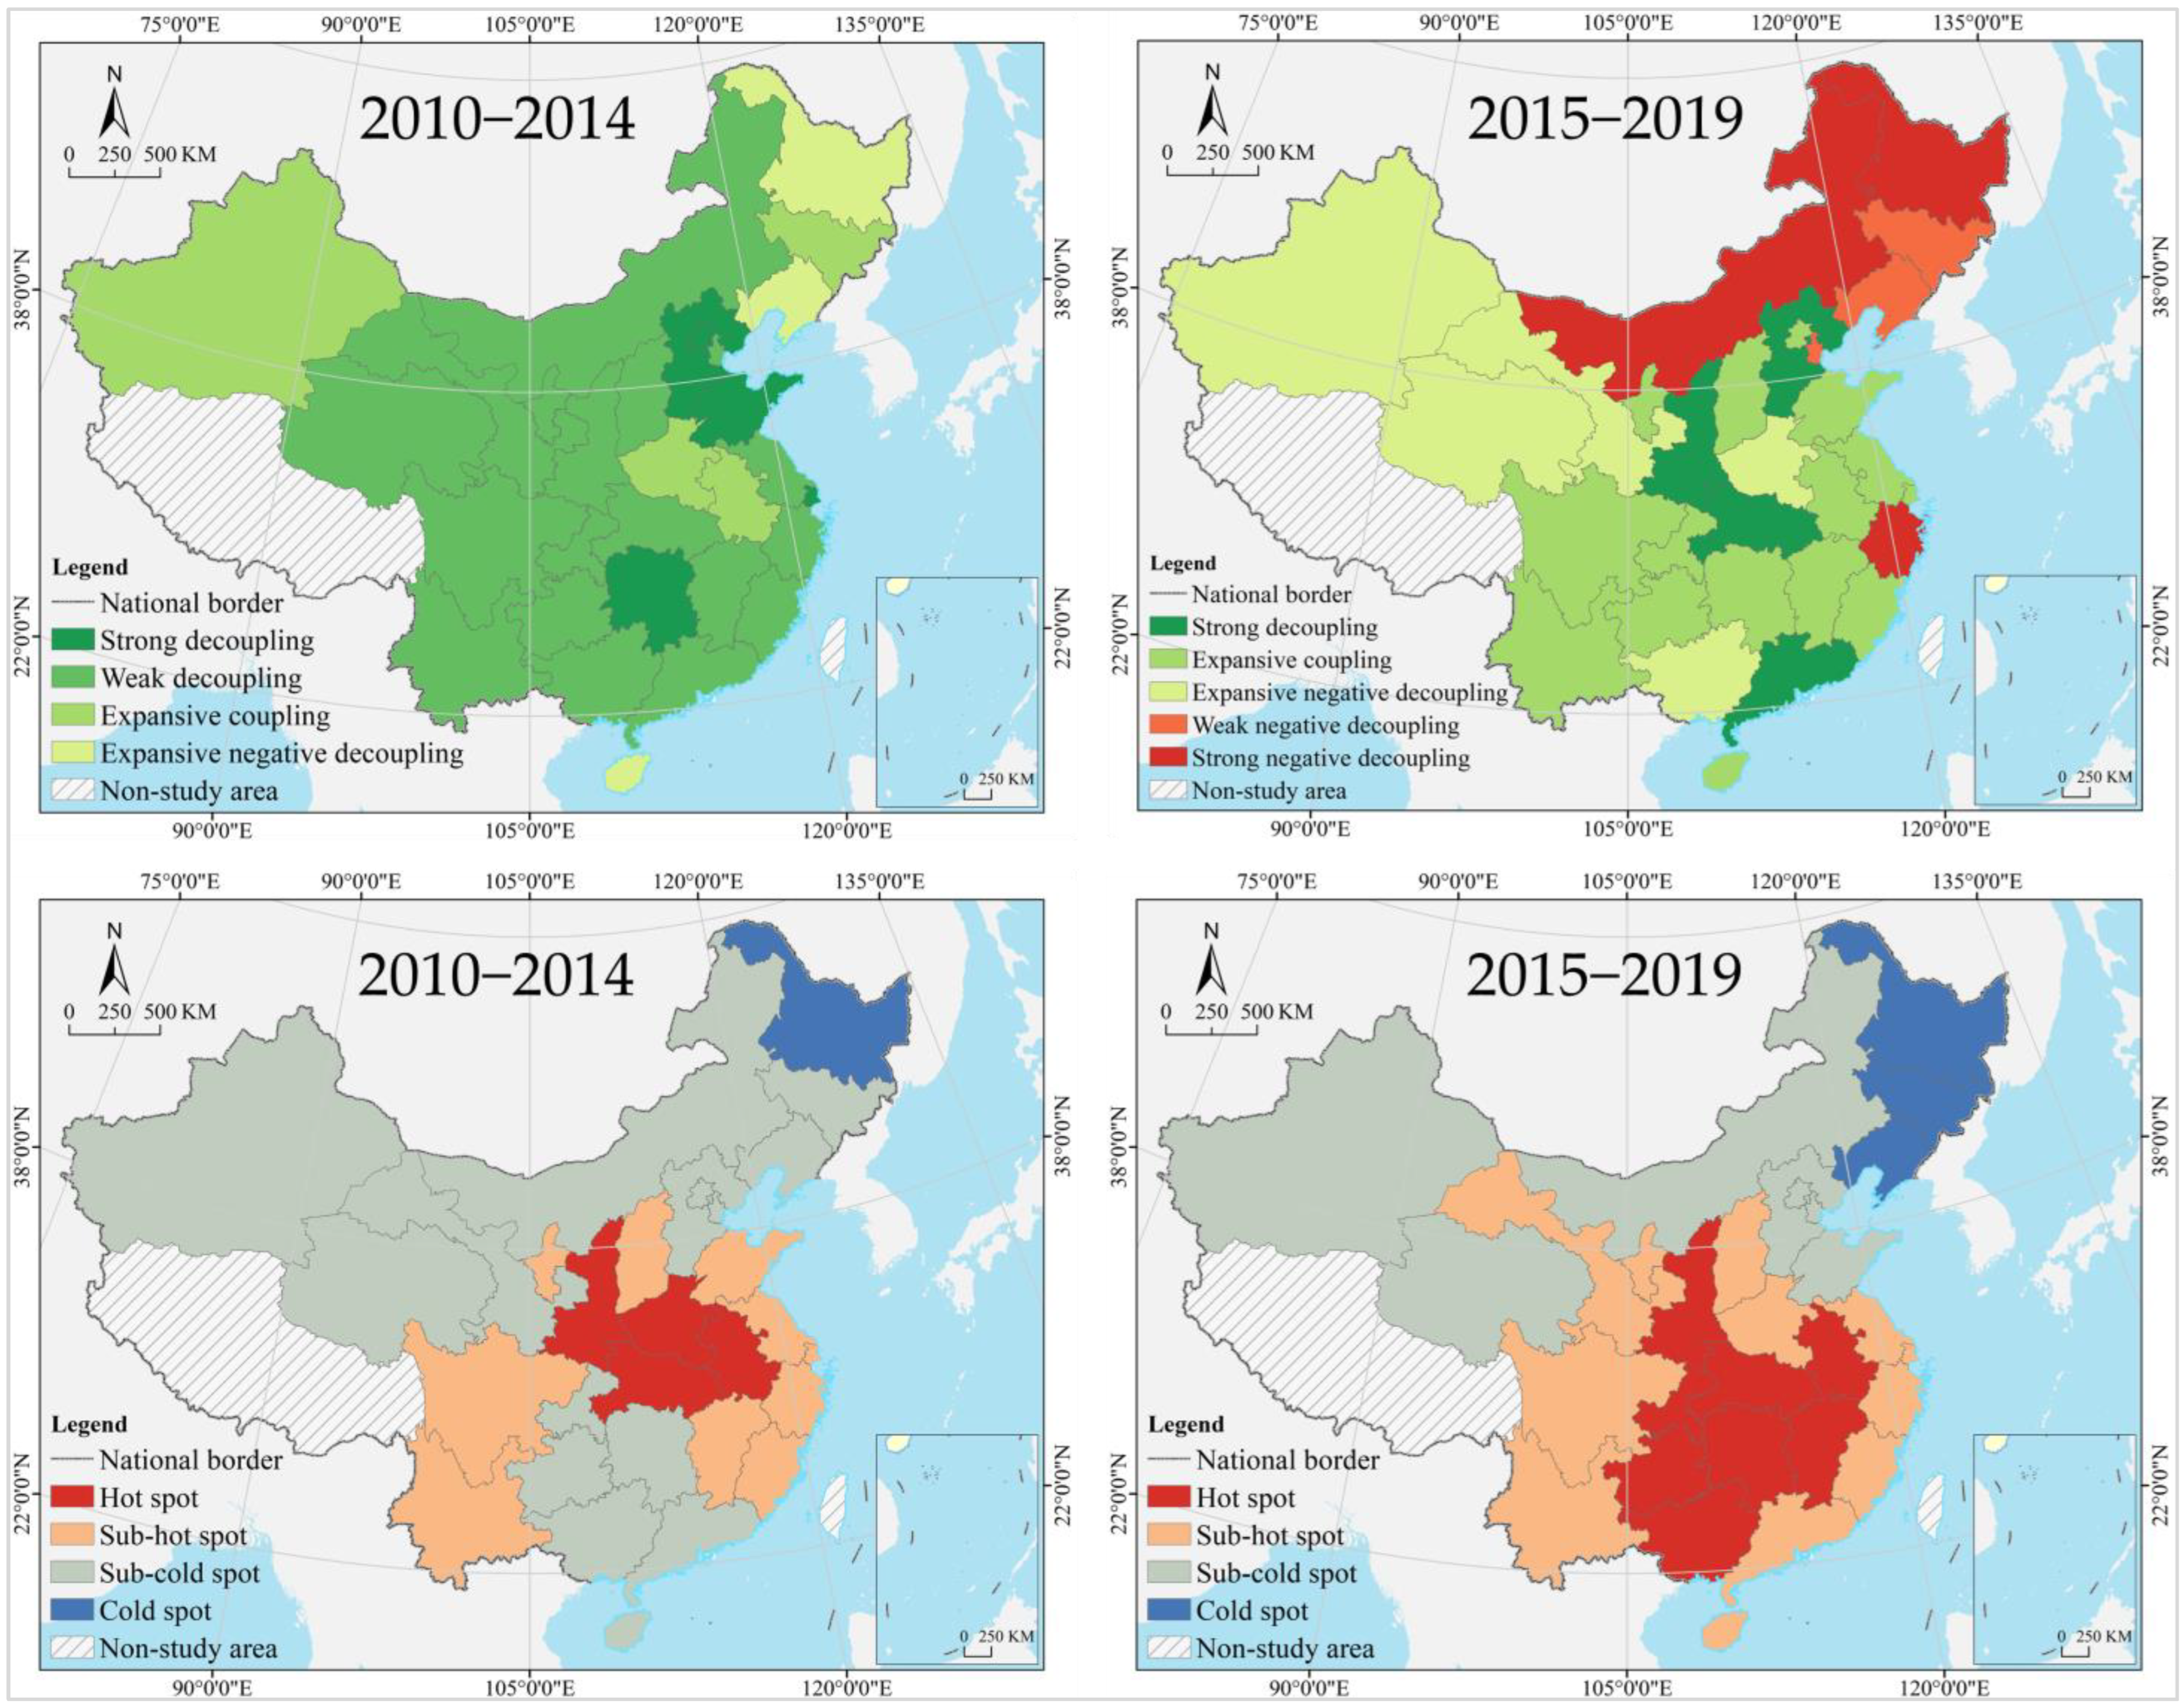
3.3.1. Decoupling Types in Two Periods

The study period is divided into two time periods, from 2010 to 2014 and 2015 to 2019, to further facilitate analysis of the stage characteristics of energy consumption and economic performance of the construction industry. For gross output value, in the period from 2010 to 2014, there were four types of decoupling of total output value: expansive negative decoupling, expansive coupling, strong, and weak decoupling, accounting for 16.67%, 60.00%, 13.33%, and 10.00%, respectively. From 2015 to 2019, there were five types of decoupling: strong decoupling, expansive coupling, expansive negative decoupling, weak negative decoupling, and strong negative decoupling, accounting for 13.33%, 50.00%, 16.67%, 10.00%, and 10.00%, respectively. Hebei was the best status province, which remained in strong decoupling in a long time; three provinces degenerated to strong negative decoupling, they were Zhejiang, Inner Mongolia, and Heilongjiang; three provinces degenerated to weak negative decoupling, in a bad state, they were Jilin, Liaoning, and Tianjin.
From 2010 to 2014, strong decoupling was found in Bohai Rim, central China and a few eastern areas, while weak decoupling was scattered in most provinces of China; hot spots and sub-cold spots with decoupling of cross output value were mainly clustered in central, eastern, and southwest China. From 2015 to 2019, provinces which belonged to strong decoupling states were distributed in central China, Bohai Rim, and southern coastal areas, while those which belonged to strong negative decoupling and weak negative decoupling were distributed in northern, eastern, and northeast China; hot spots and sub-hot spots were mainly clustered in central and southern China, and a few northwestern areas (Figure 12).
For added value, from 2010 to 2014, there were four types of added value decoupling: expansive coupling, expansive negative decoupling, strong, and weak decoupling, accounting for 16.67%, 53.33%, 16.67%, and 13.33%, respectively. From 2015 to 2019, there were seven types of decoupling: strong decoupling, weak decoupling, expansive coupling, expansive negative decoupling, recessive coupling, weak negative decoupling, and strong negative decoupling, accounting for 13. 33%, 46.67%, 3.33%, 13.33%, 6.67%, 3.33%, and 13.33%, respectively. Hebei was the best status province, which remained in strong decoupling for a long time; Heilongjiang, Gansu, Ningxia, and Shanghai degraded to strong negative decoupling; and Jilin degenerated to weak negative decoupling, in a bad state.
From 2010 to 2014, provinces in strong decoupling were distributed in Bohai Rim, central China, and a few eastern areas, while those in weak decoupling were in clusters in northern and southern China; hot spots and sub-cold spots of added value decoupling were mainly clustered in central, eastern, and southwest China, and southern coastal areas. From 2015 to 2019, Bohai Rim, central China, and southern coastal areas were main gathering locations for strong decoupling provinces; central, eastern, and southwest China were main gathering areas for weak decoupling provinces; northeast and northwest China and a few eastern areas were main gathering locations for strong and weak negative decoupling, with hot spots and sub-hot spots mainly clustered in central and southern China (Figure 13).
For total profit, from 2010 to 2014, five types of total profit decoupling relationships emerged: expansive negative decoupling, strong negative decoupling, weak decoupling, strong decoupling, and expansive coupling, accounting for 16.67%, 66.67%, 6.67%, 3.33%, and 6.67%, respectively. From 2015 to 2019, there were seven types of decoupling: weak negative decoupling, strong negative decoupling, weak decoupling, expansive coupling, strong decoupling, expansive negative decoupling, and recessive coupling, accounting for 10.00%, 36.67%, 10.00%, 6.67%, 3.33%, 10.00%, and 23.33%, respectively. Shaanxi, Hubei, and Guangdong evolved to strong decoupling, and belonged to best status provinces; Heilongjiang and Inner Mongolia remained in strong negative decoupling for long periods; Xinjiang, Qinghai, Xinjiang, Qinghai, Ningxia, Chongqing, and Zhejiang degenerated to strong negative decoupling; Jilin, Liaoning, and Tianjin degenerated to weak negative decoupling, in a bad state.
From 2010 to 2014, provinces in strong decoupling were distributed in Bohai Rim, central China and a few eastern areas, while those in weak decoupling were scattered in most areas of China, and those belonged to strong negative decoupling were distributed in northern and northeast China, with hot spots and sub-hot spots of total profit decoupling mainly clustered in the Yangtze River basin and towards the south. From 2015 to 2019, strong decoupling was found in central China and southern coastal areas, while the regions in weak decoupling shrank to central, southwest, and eastern China; strong and weak negative decoupling was found in northern, northeast, northwest, and southwest China and a few eastern areas. The hot spots and sub-hot spots were mainly clustered in central and southern China (Figure 14).

3.3.2. Decoupling Change Types

The changes in the type of decoupling between energy consumption and economic performance of the construction industry are compared for the two time periods, from 2010 to 2014 and 2015 to 2019, to further define the change pattern. For gross output value, there were five provinces in evolved regions, distributed in central China and southern coastal areas; fifteen provinces in degenerated regions, distributed in northern, central, northeast, northwest, and eastern China; and ten provinces in unchanged regions, distributed in Bohai Rim, central, southwest, and southeast China. The hot spots and sub-hot spots of gross output value decoupling changes were also mainly clustered in central and southern China, and a few northwestern areas.
For added value, there were eight provinces in evolved regions, distributed in the Yangtze River basin and southern coastal areas; fifteen provinces in degenerated regions, distributed in northeast, northwest, and central China; and seven provinces in unchanged regions, distributed in Bohai Rim, southwest, and southeast China. The hot spots and sub-hot spots of added value decoupling changes were mainly clustered in central and south China.
For total profit, evolved regions consisted of four provinces, distributed in central and western China and southern coastal areas; degenerated regions consisted of sixteen provinces, distributed in northeast, northwest, central, and eastern China; unchanged regions consisted of ten provinces, distributed in northern, southwest, and eastern China. The hot spots and sub-hot spots of total profit decoupling changes were also mainly concentrated in central and southern China (Figure 15).

4. Discussions

4.1. Theoretical Insights

4.1.1. Temporal Trends in Construction Energy Consumption

Although the change of energy consumption in the construction industry in the provinces of China shows a diversified trend, the steady growth of total energy consumption is still dominant, with a gradual decrease in its intensity, and most provinces are still in the plateau or growth period of energy consumption. In the studies available, Lai, Hong, Duan, and Hou stated that energy consumption in China’s construction industry is on the rise, but its intensity of energy consumption per unit of construction area keeps dropping [47,90,91,92], which is generally consistent with the view of this paper. Guo said that energy consumption in China’s construction industry will peak around 2020 to 2035 [93], while Xu argued that it will peak around 2050 [13]. This paper does not make any predictions about China’ future construction energy consumption, but it finds that some provinces have already achieved peak energy consumption. It is obvious that the state and trend of energy consumption in the construction industry greatly varies between different provinces, which also reminds local governments of the need to implement differentiated energy efficiency management policies. In addition, the same pattern of growth in energy consumption in the construction industry is observed in other countries. According to Štreimikienė, Hassan, and Salam, Lithuania, Malaysia, India, Pakistan, and Bangladesh all have growing total energy consumption and decreasing energy intensity in the construction industry, but their energy structure and energy-saving points greatly vary [94,95,96].

4.1.2. Spatial Effects of Construction Energy Consumption

The total energy consumption and energy consumption intensity of China’s construction industry show obvious east-west and north-south differences between provinces, evidently characterized by spatial heterogeneity and aggregation. In an existing study, Duan stated that energy consumption in the construction industry is greater in the northern and eastern regions of China than that in the northwest and southwest regions [91]. Hong stated that the energy consumption of China’s construction industry shows obvious spatial autocorrelation, with high value regions clustered in the eastern coastal and central areas, and low value regions clustered in the west [47]. Liu pointed out that the energy consumption of China’s construction industry is high in the east and low in the west, with obvious differentiation between the two levels [97]. The views in this paper are generally consistent with their findings. It reminds local governments that it is necessary to take full account of spatial differences in energy consumption in the construction industry, and to carry out zoning controls for energy efficiency. The spatial differentiation of energy consumption in the construction industry also exists in other countries. For example, Zhong stated that the energy consumption intensity per unit area of residential buildings is decreasing in high-income and upper-middle-income countries, while that of commercial buildings is increasing in upper-middle-income and lower-middle-income countries [98]. Berardi noted that energy consumption in the construction industry is significantly greater in the Nordic countries than in central and southern Europe [15]. Huang pointed out that there are obvious differences in energy consumption in the U.S. construction industry, with high value regions clustered in the southeast and low value regions in the northeast [48]. Krarti pointed out that there is a huge difference in energy consumption in the construction industry between different countries in the Arab region, with a 90-fold difference between the highest and the lowest levels [99], but there are significant differences in their formation mechanisms and impeding factors due to different national conditions [100,101,102].

4.1.3. Decoupling Characteristics of Construction Energy Consumption

From static features, the decoupling between energy consumption and economic growth in the construction industry is dominated by weak decoupling, expansive coupling, and strong negative decoupling. However, the former keeps declining in proportion, while the latter two continue to rise. The decoupling types showed obvious aggregation in space, indicating that the association between construction energy consumption and construction economy growth remained close in most provinces, and the dependence on energy in the construction industry was prominent and showed some lock-in effect. From dynamic features, the two study stages saw a gradual increase in decoupling types in each province, with nearly half of the provinces experiencing a degradation of the decoupling type and only a few achieving evolutions, changes in the decoupling types showed significant aggregation in geographical distribution, indicating that the decoupling status of construction energy consumption with construction economy development is deteriorating and the decoupling relationship is becoming increasingly complex, and there is also a certain lock-in effect in the changing regions, which brings certain difficulty to the development in energy-saving policies in the construction sector. In an existing study, Zhou pointed out that energy consumption and the economic growth of the construction industry in China mainly showed a weak decoupling from 2000 to 2015 [72], different from the views of this paper. This is mainly due to the differences in research time and research methods, besides Zhou’s neglect of the decoupling characteristics at the provincial scale of the study, which is instead further extended in this paper. Notably, the northeast and northwest regions have long been in or gradually degraded to strong negative decoupling, growing into critical constraint regions that shackle the energy saving development of the construction sector in China.

4.2. Policy Enlightenment

The GE matrix is a classification tool developed on the basis of the BCG matrix, which forms nine divisions by grading “high—medium—low” in both vertical and horizontal dimensions, and then proposes different optimization strategies for each division [103]. We reshape the GE matrix in this paper for classifying the energy consumption characteristics in the construction industry in the provinces of China, and three types of provinces are determined, which are no energy peak, platform period, and energy peak, with the energy peak state as the horizontal coordinate. With the ECA data from 2015 to 2019 as the vertical coordinate, ECA of the provinces is divided into three categories, which are high level, medium level, and low level, and the plural or worst type of decoupling of total output value, added value, and total profit from 2015 to 2019 is used as the final result of energy consumption decoupling in each province. Based on the three indices of ECA, peak state, and decoupling type of the construction industry, this paper constructs a zoning matrix for energy consumption optimization of the construction industry in China’s provinces, and further proposes a differentiated policy design (Figure 16).

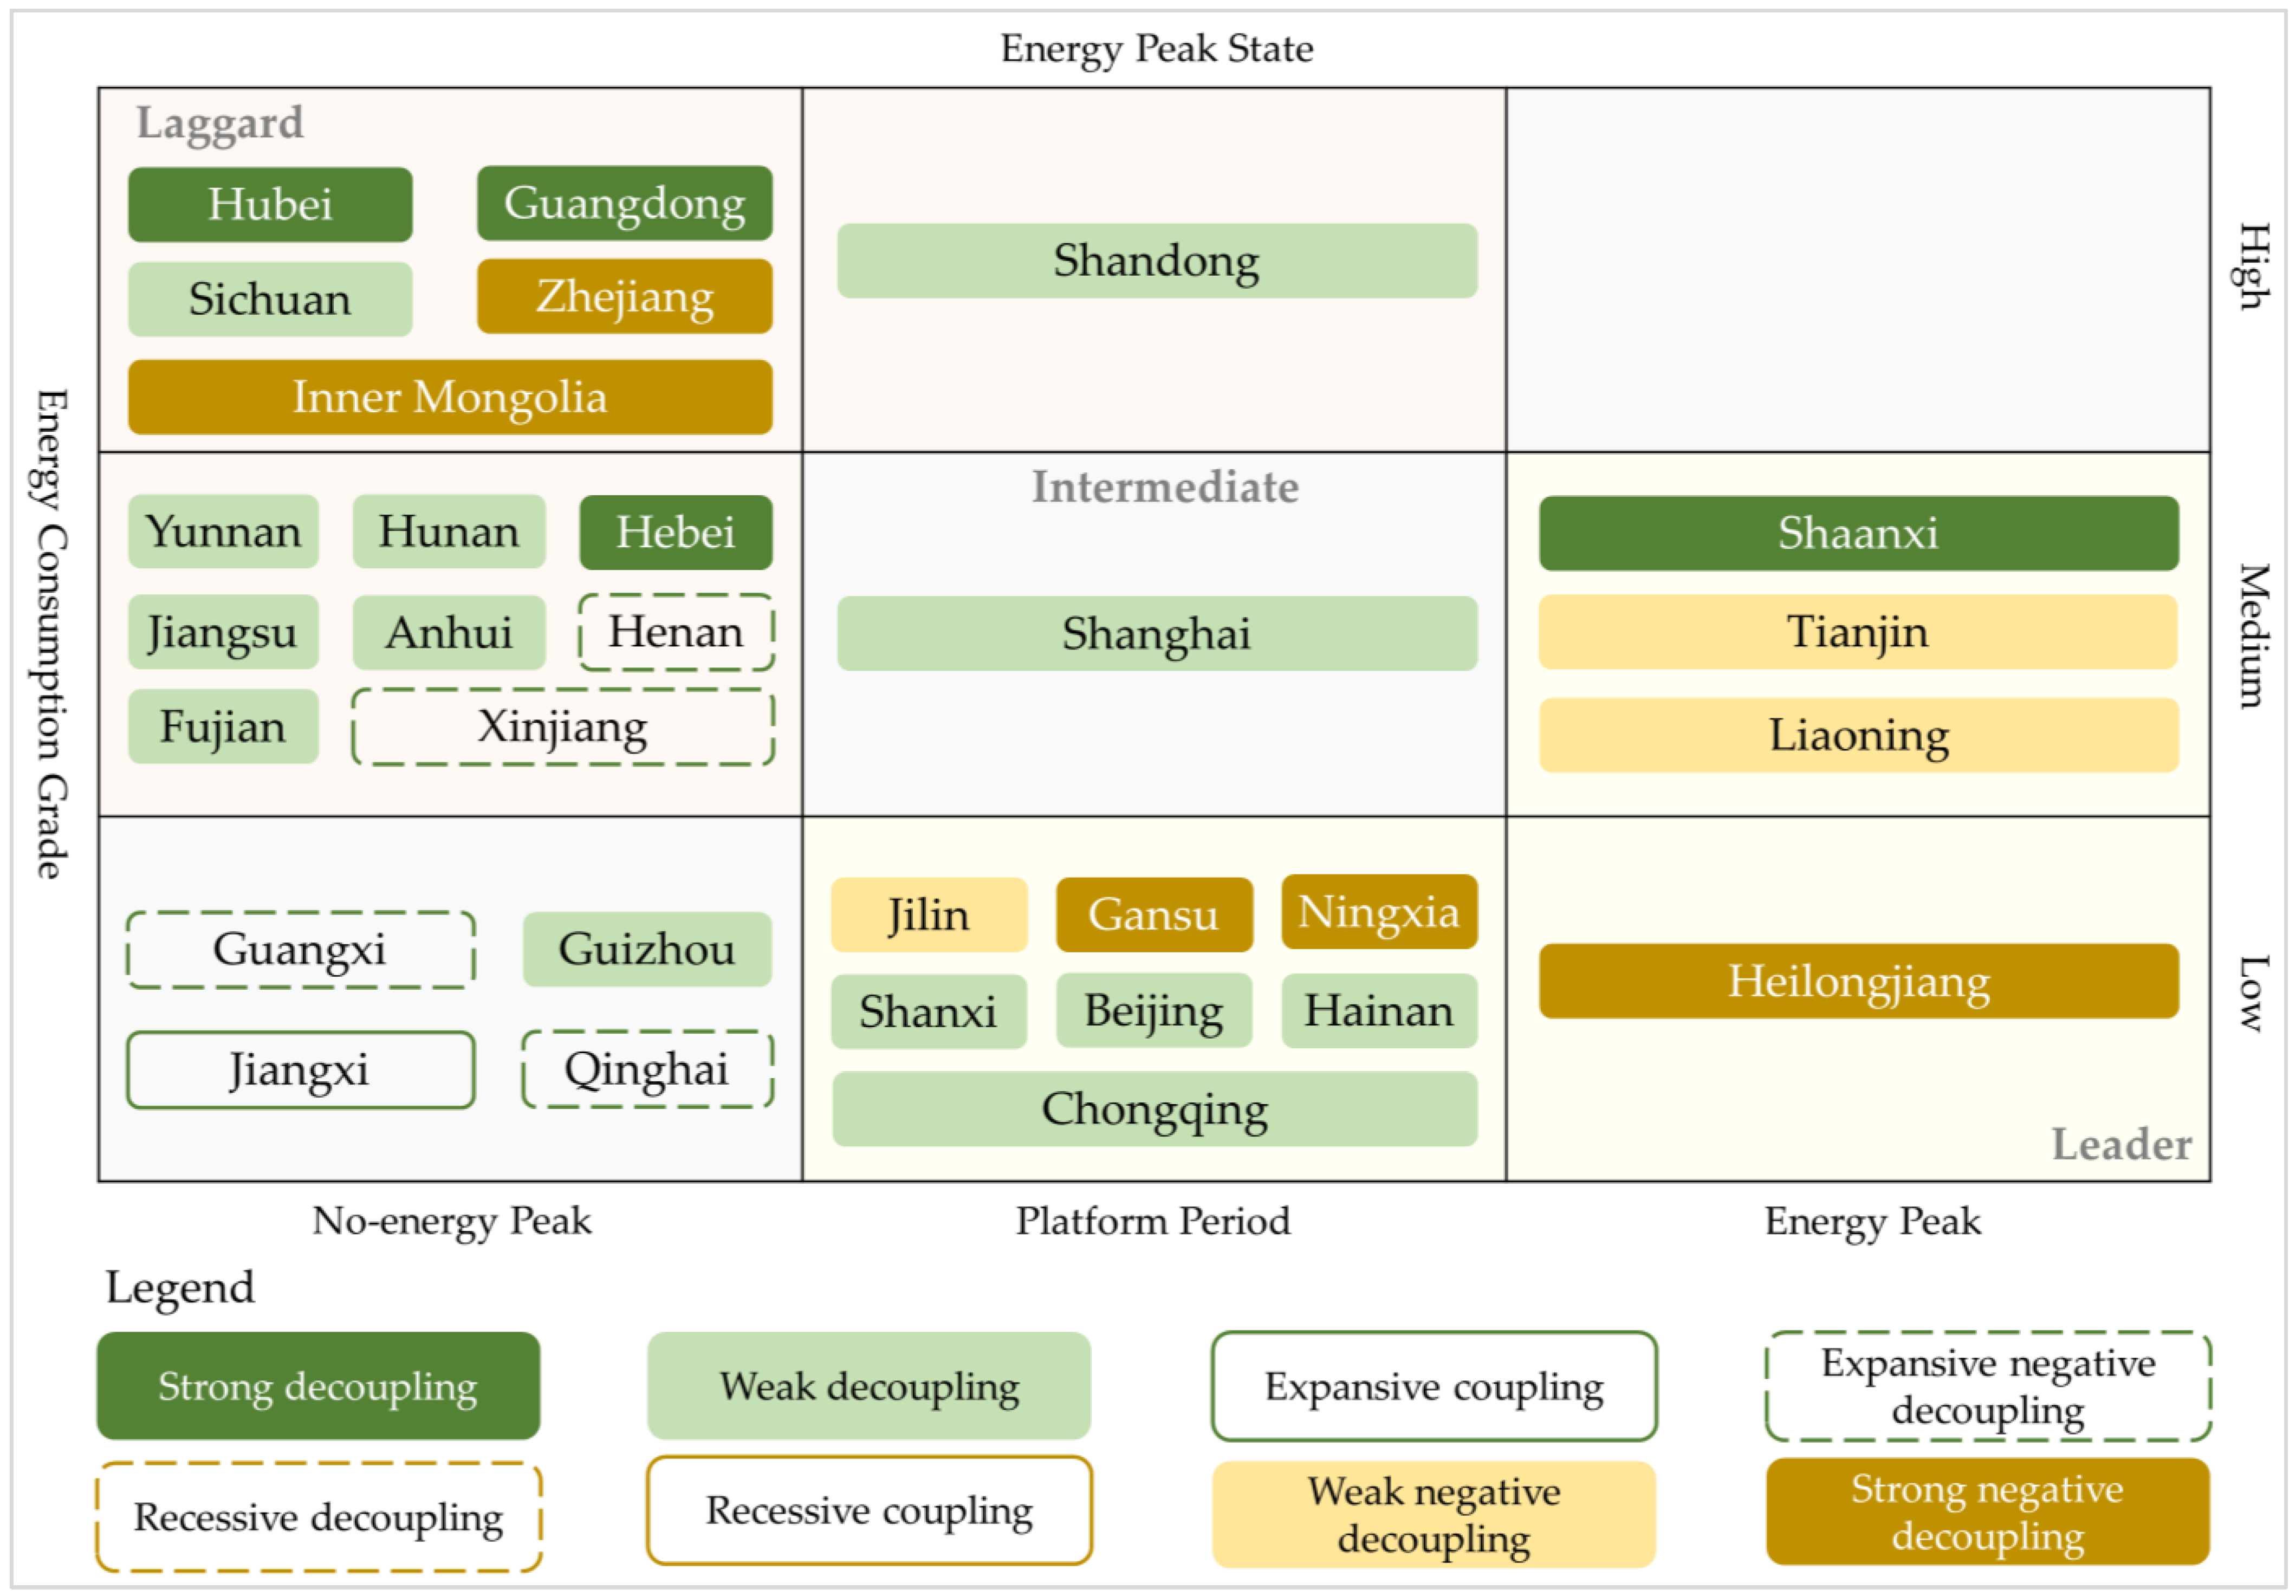
4.2.1. Policy Suggestion in Leader Zoning

There are eleven provinces at the forefront of the country in terms of low energy consumption levels in the construction industry, with energy consumption at medium or low level, mostly at the peak state or entering the plateau state, becoming leaders in the development and spatial governance of the construction industry. Shaanxi is in strong decoupling and it should steadily implement the current energy policy for the construction industry and play a leading role in developing construction energy-saving standards. Shanxi, Beijing, Hainan, and Chongqing are in weak decoupling, and most of them are in the accelerated urbanization period. They should push the transformation of electrification, intelligence, and assembly technology in the construction industry [104], encourage the use of green building materials, and drive the decoupling of energy consumption in the construction industry from the construction economy growth. Heilongjiang, Gansu, and Ningxia are in strong negative decoupling, while Tianjin, Liaoning, and Jilin are in weak negative decoupling. Most of these provinces are underdeveloped or declining regions, and they should take advantage of the development opportunities of northeast revitalization and western development, introduce advanced green construction technology, and improve the overall construction level of construction enterprises [105]. In addition, it is recommended that the eleven provinces make good use of the construction industry recovery window after COVID-19 to refine the workflow of construction enterprises and widely popularize green construction techniques [106], while encouraging enterprises to use more clean energy by promoting energy restructuring in the construction industry [107].

4.2.2. Policy Suggestion in Intermediate Zoning

The low energy consumption in the construction industry in five provinces is at the middle level of the country. Most of them are at a low level of energy consumption and are in the period of energy consumption growth, so they should strengthen the policy guidance for the development of low energy consumption in the construction industry. Shanghai and Guizhou are in weak decoupling, and Shanghai is a highly urbanized region. They should promote the application of green construction technology in building renewal, complete the energy consumption supervision system of construction enterprises, emphasize the design of building energy consumption limits, and guide or force construction enterprises to improve energy efficiency by means of rewards and punishments [108]. With an urbanization rate of only 54.33%, Guizhou has great potential for construction economy development. It should strengthen the formulation of a timetable and roadmap for energy peaking, with a focus on cultivating a number of leading assembly-type construction enterprises, and then encourage large-sized enterprises to boost small-sized ones to urge the low-energy transformation in the construction sector. Jiangxi is in expansive coupling, while Guangxi and Qinghai are in expansive negative decoupling. Given that industrialization and urbanization remain the focus of development, these provinces should promote the industrialization and intelligence of the construction industry, tackle problems in key technologies, such as green building materials and assembly-type construction [109,110], and promote the development of the construction industry in clusters. Additionally, it is recommended that these five provinces give full play to the role of industry associations, construction enterprises, and individuals to set up local green construction associations, and to give the associations more industry management functions, while developing banking, financial, and talent incentives to boost the motivation of enterprises and individuals to participate in green construction [111].

4.2.3. Policy Suggestions in Laggard Zoning

The low energy consumption in the construction industry in fourteen provinces is relatively lagging behind, and their energy consumption is at a medium or high level. Most provinces are still in a period of growth in energy consumption, and they must undertake systematic and thematic design of low energy policies for the construction industry. Hubei, Guangdong and Hebei are in strong decoupling, while Sichuan, Yunnan, Hunan, Jiangsu, Anhui, Shandong, and Fujian are in weak decoupling. Due to their large and still growing energy consumption, these provinces should focus on improving construction technology [112] to improve the efficiency of energy use. Zhejiang and Inner Mongolia are in strong negative decoupling, while Henan and Xinjiang are in weak negative decoupling. Due to their high and rapidly growing energy consumption, these provinces are faced with an arduous task of energy saving, and they should develop action plans and establish accountability targets for energy saving in the construction industry [113], to push the transformation of low energy consumption to serve as an enabler for high-quality development and modernization. It is suggested that the fourteen provinces set the “14th Five-Year Plan” and the “15th Five-Year Plan” as the periods for the hard part of energy peaking in the construction industry, focus on improving the energy efficiency of new buildings, promote the development of building industrialization, improve the assembly level, promote the application of green building materials and the application of renewable energy in buildings, and carrying out green construction [114,115], and evaluate and release the progress of energy peaking in the construction industry of each province every year.

5. Conclusions

The building industry is a key sector contributing to global energy consumption and carbon emissions, as well as an important national economic sector. Driving the decoupling of energy consumption from economic growth in the building industry is critical to achieving global energy conservation and emission reduction mandates, as well as sustainable development goals. In this context, it is urgent and necessary to carry out a segmentation study on the industry-wide energy consumption, and this paper focuses on the decoupling of energy consumption from the economic development in the construction industry. With a huge scale of energy consumption in the construction industry, China has a large share of the global construction market, and the decoupling of its energy consumption from the economic performance in the construction industry is the key to the global construction industry’s energy-saving transition, and will give a strong boost to the early achievement of China’s carbon emission peak and carbon neutrality commitments. We have empirically investigated the spatio-temporal characteristics of energy consumption in the construction industry and its relationship with construction economy growth in 30 Chinese provinces from 2010 to 2019, using a decoupling tool and GIS software in this paper. The conclusions are:
(1) Changes in energy consumption in the construction industry showed an increasingly complex trend. Four patterns of change emerged in both total energy consumption and energy consumption intensity, with the former dominated by a rise while the latter by a decline. Most provinces were still in the energy consumption plateau or growth period, except for only 13.33% that saw the energy consumption peak in the construction industry. The state and changing trends of energy consumption in the construction industry varied greatly between provinces, making it necessary to introduce differentiated management policies.
(2) Energy consumption in the construction industry was characterized by prominent spatial heterogeneity and aggregation. Regions with high energy consumption were mainly distributed along the coast and along the Yangtze River, while regions with low energy consumption were mainly clustered in remote regions such as northeast, northwest, and southwest China. Energy consumption showed a clear north-south difference in intensity, with high-intensity regions clustered in the north, compared to low-intensity regions in the south. Due to obvious spatial differences and aggregation of energy consumption in the construction industry in different provinces, management of them by zones should be adopted.
(3) Undecoupled provinces accounted for a large proportion, and they showed an obvious spatial lock-in effect. Most of the provinces were in weak decoupling, expansive coupling, and strong negative decoupling. The former kept declining in proportion, while the latter two continued to rise. The better decoupled areas were clustered in the south of the Yangtze River. Nearly half of the provinces showed degradation of decoupling types, and only a few provinces experienced evolution, which were also clustered in the south of the Yangtze River. The northeast and northwest regions of China have been in or gradually degraded to strong negative decoupling for a long period, becoming a key problem area that shackles the energy saving development in China’s construction industry.
(4) By integrating energy consumption, peak status, and decoupling type, 30 provinces have been divided into three policy zones, which are leader zone, intermediate zone, and laggard zone, and proposed corresponding low energy development goals and recommendations for the construction industry.
Theoretically, this paper expands the research perspective on energy efficiency in the construction industry, from technicians to managers, from single building management to regional management, and from construction techniques to energy saving policies. Based on the decoupling model and GIS tools, this paper constructs a technical framework of “spatio-temporal characteristics + matching evaluation + policy design” to effectively describe the dynamic relationship between energy consumption and economy growth in the construction industry, and to accurately determine whether construction energy saving development is reasonable, providing a suitable tool for decision-makers, researchers, and the general public to analyze the low-energy transformation and development patterns of the construction industry. In practice, green construction is the future direction of China’s construction industry [11], and energy saving is an important part of green construction. The findings of this paper provide an auxiliary role for local governments to develop regional construction industry energy efficiency plans and policies. In addition, a large number of developing countries are experiencing rapid urbanization, such as India, Pakistan, Brazil, Iran, Egypt, Vietnam, Turkey, and Malaysia [116], and their energy saving paths in the construction industry have far-reaching implications for the transformation of energy saving and carbon emission reduction of global construction. This paper’s methods and findings can also act as references for the construction energy efficiency management in these countries.
It should be noted that energy consumption in the construction industry is a result of the long-term development of the regional construction industry and is influenced by many factors, such as local resource conditions, stage of development, construction mode, and the level of innovation. The decoupling model provides a concise visualization of the intensity of energy consumption in the construction industry, but it conveys a mixed message that hardly reflects the dominant factors affecting the decoupling relationship. The driving factors and its mechanisms are not discussed in this paper, which influence the evolution of construction energy consumption and its decoupling relationship, because of insufficient data and restricted length. In addition, COVID-19 has had a large impact on the global construction industry since its outbreak in 2019, and this paper only provides a brief analysis on how the Chinese construction industry takes advantage of the recovery window after COVID-19 to transform construction into an energy-saving industry, without discussing specific initiatives in depth. These are the two shortcomings of this paper, and we will complete the relevant study on them in subsequent research. We call for more scholars to conduct case and empirical studies to provide a basis for the government’s decision to develop a timeline and roadmap for the development of energy efficiency in the construction industry.

Author Contributions

Conceptualization, C.C. and S.Z.; methodology, K.Z.; software, X.C.; validation, K.Z., X.C. and S.Z.; formal analysis, K.Z. and X.C.; investigation, S.Z.; resources, C.C. and Z.L.; data curation, K.Z. and X.C.; writing—original draft preparation, C.C.; writing—review and editing, C.C.; visualization, K.Z.; supervision, S.Z.; project administration, C.C. and Z.L.; funding acquisition, C.C. and Z.L.. All authors have read and agreed to the published version of the manuscript.

Funding

This research is financially supported by the Independent Research and Development Project of State Key Laboratory of Green Building in Western China (No. LSZZ202213) and the New Urbanization Found of the Research Institute of New Urbanization and Human Settlement in Shaanxi Province (No. 2022SCHZ07).

Data Availability Statement

Most of this paper’s data are acquired from different statistical yearbooks of China, readers can access them through the website of https://data.stats.gov.cn/index.htm (accessed on 12 February 2022).

Conflicts of Interest

The authors declare no conflict of interest.

Appendix A

Table A1. Growth rate on construction energy consumption and construction economy and decoupling index between the two from 2010 to 2014.
IDNameGrowth RateDecoupling Index
Energy ConsumptionGross Output ValueAdded ValueTotal ProfitGross Output ValueAdded ValueTotal Profit
1Beijing−0.070.100.170.08−0.69−0.39−0.87
2Tianjin0.040.110.190.100.330.200.38
3Hebei−0.090.120.090.08−0.77−0.98−1.12
4Shanxi0.010.080.140.070.180.100.18
5Inner Mongolia0.030.05−0.020.100.77−1.440.34
6Liaoning0.150.110.080.101.361.871.55
7Jilin0.110.130.190.090.830.581.22
8Heilongjiang0.130.04−0.020.073.29−6.321.81
9Shanghai−0.030.050.050.04−0.53−0.58−0.66
10Jiangsu0.080.150.150.100.560.560.86
11Zhejiang0.040.140.110.090.310.400.49
12Anhui0.120.140.150.100.890.851.27
13Fujian0.090.180.220.130.520.430.70
14Jiangxi0.080.200.230.110.420.360.75
15Shandong−0.100.110.100.08−0.89−1.01−1.20
16Henan0.110.120.150.100.860.721.04
17Hubei0.040.180.170.130.190.210.27
18Hunan−0.010.140.150.11−0.06−0.05−0.07
19Guangdong0.030.120.130.090.230.220.33
20Guangxi0.040.160.140.140.260.290.29
21Hainan0.120.070.190.141.770.620.83
22Chongqing0.070.170.180.150.400.370.44
23Sichuan0.110.140.130.120.770.840.88
24Guizhou0.120.210.270.200.550.430.57
25Yunnan0.040.150.190.180.280.220.24
26Shaanxi0.060.080.170.130.730.350.46
27Gansu0.050.190.200.120.260.260.42
28Qinghai0.070.090.170.160.770.410.43
29Ningxia0.050.130.190.150.390.270.34
30Xinjiang0.160.190.200.150.820.801.04
Table A2. Growth rate on construction energy consumption and construction economy and decoupling index between the two from 2015 to 2019.
IDNameGrowth RateDecoupling Index
Energy ConsumptionGross Output ValueAdded ValueTotal ProfitGross Output ValueAdded ValueTotal Profit
1Beijing0.010.070.110.090.070.050.05
2Tianjin−0.01−0.02−0.09−0.010.760.151.07
3Hebei−0.020.02−0.020.04−0.821.14−0.49
4Shanxi0.000.100.010.010.020.120.15
5Inner Mongolia0.07−0.01−0.070.01−11.07−1.0511.55
6Liaoning−0.05−0.08−0.13−0.050.630.381.09
7Jilin−0.01−0.03−0.04−0.030.230.220.30
8Heilongjiang0.01−0.07−0.01−0.13−0.11−0.56−0.06
9Shanghai0.020.070.04−0.030.320.48−0.61
10Jiangsu0.010.060.050.100.140.180.08
11Zhejiang0.01−0.03−0.030.08−0.36−0.330.14
12Anhui0.040.080.040.180.520.980.24
13Fujian0.040.120.080.150.360.510.28
14Jiangxi0.070.120.070.060.590.931.17
15Shandong0.010.090.000.080.061.970.06
16Henan0.120.100.120.201.271.030.62
17Hubei−0.010.100.070.09−0.12−0.17−0.14
18Hunan0.020.100.080.120.240.290.20
19Guangdong−0.020.130.080.12−0.12−0.19−0.13
20Guangxi0.190.130.140.061.501.423.23
21Hainan0.010.060.070.060.200.160.19
22Chongqing0.030.060.000.130.47−10.440.20
23Sichuan0.080.110.130.120.770.670.69
24Guizhou0.070.140.180.130.520.390.56
25Yunnan0.050.130.160.110.400.340.48
26Shaanxi0.000.110.080.07−0.05−0.06−0.07
27Gansu0.010.010.03−0.052.040.54−0.27
28Qinghai0.060.02−0.130.022.71−0.503.68
29Ningxia0.010.03−0.03−0.050.41−0.36−0.25
30Xinjiang0.080.00−0.010.0238.57−6.514.83

References

  1. United Nations Environment Programme (UNEP). 2021 Global Status Report for Buildings and Construction: Towards a Zero-Emissions, Efficient and Resilient Buildings and Construction Sector; UNEP: Nairobi, Kenya, 2021. [Google Scholar]
  2. Huo, T.; Ren, H.; Zhang, X.; Cai, W.; Feng, W.; Zhou, N.; Wang, X. China’s energy consumption in the building sector: A statistical yearbook-energy balance sheet based splitting method. J. Clean. Prod. 2018, 185, 665–679. [Google Scholar] [CrossRef]
  3. Li, Z.; Song, Y. Energy consumption linkages of the Chinese construction sector. Energies 2022, 15, 1761. [Google Scholar] [CrossRef]
  4. BP P.L.C. BP Statistical Review of World Energy 2021; BP: London, UK, 2021. [Google Scholar]
  5. United Nations Environment Programme (UNEP). 2020 Global Status Report for Buildings and Construction: Towards a Zero-Emissions, Efficient and Resilient Buildings and Construction Sector; UNEP: Nairobi, Kenya, 2020. [Google Scholar]
  6. International Energy Agency (IEA). Building Energy Use in China: Transforming Construction and Influencing Consumption to 2050; IEA: Paris, France, 2015. [Google Scholar]
  7. China Association of Building Energy Efficiency (CABEE). China Building Energy Consumption Research Report (2021); CABEE: Beijing, China, 2021. [Google Scholar]
  8. Global Construction Perspectives (GCP); Oxford Economics (OE). Global Construction 2030: A Global Forecast for the Construction Industry to 2030; GCP; OE: London, UK, 2015. [Google Scholar]
  9. Huo, T.; Cao, R.; Xia, N.; Hu, X.; Cai, W.; Liu, B. Spatial correlation network structure of China’s building carbon emissions and its driving factors: A social network analysis method. J. Environ. Manag. 2022, 320, 115808. [Google Scholar] [CrossRef] [PubMed]
  10. Huo, T.; Ma, Y.; Yu, T.; Cai, W.; Liu, B.; Ren, H. Decoupling and decomposition analysis of residential building carbon emissions from residential income: Evidence from the provincial level in China. Environ. Impact Assess. Rev. 2021, 86, 106487. [Google Scholar] [CrossRef]
  11. Chen, J.; Ma, H. Green Building and Green Construction; Wuhan University of Technology Press: Wuhan, China, 2020. [Google Scholar]
  12. Zhang, Y.; He, C.; Tang, B.; Wei, Y. China’s energy consumption in the building sector: A life cycle approach. Energy Build. 2015, 94, 240–251. [Google Scholar] [CrossRef]
  13. Xu, G.; Wang, W. China’s energy consumption in construction and building sectors: An outlook to 2100. Energy 2020, 195, 117045. [Google Scholar] [CrossRef]
  14. Liu, Q.; Huang, J.; Ni, T.; Chen, L. Measurement of China’s building energy consumption from the perspective of a comprehensive modified life cycle assessment statistics method. Sustainability 2022, 14, 4587. [Google Scholar] [CrossRef]
  15. Berardi, U. A cross-country comparison of the building energy consumptions and their trends. Resour. Conserv. Recycl. 2017, 123, 230–241. [Google Scholar] [CrossRef]
  16. Luo, Z.; Lu, Y.; Cang, Y.; Yang, L. Study on dual-objective optimization method of life cycle energy consumption and economy of office building based on HypE genetic algorithm. Energy Build. 2022, 256, 111749. [Google Scholar] [CrossRef]
  17. Li, G.; Kou, C.; Wang, H. Estimating city-level energy consumption of residential buildings: A life-cycle dynamic simulation model. J. Environ. Manag. 2019, 240, 451–462. [Google Scholar] [CrossRef]
  18. Zhan, J.; Liu, W.; Wu, F.; Li, Z.; Wang, C. Life cycle energy consumption and greenhouse gas emissions of urban residential buildings in Guangzhou city. J. Clean. Prod. 2018, 194, 318–326. [Google Scholar] [CrossRef]
  19. Ma, J.; Du, G.; Zhang, Z.; Wang, P.; Xie, B. Life cycle analysis of energy consumption and CO2 emissions from a typical large office building in Tianjin, China. Build. Environ. 2017, 117, 36–48. [Google Scholar] [CrossRef]
  20. Guo, Y. Revisiting the building energy consumption in China: Insights from a large-scale national survey. Energy Sustain. Dev. 2022, 68, 76–93. [Google Scholar] [CrossRef]
  21. Wei, W.; He, L. China building energy consumption: Definitions and measures from an operational perspective. Energies 2017, 10, 582. [Google Scholar] [CrossRef] [Green Version]
  22. Jing, W.; Zhen, M.; Guan, H.; Luo, W.; Liu, X. A prediction model for building energy consumption in a shopping mall based on Chaos theory. Energy Rep. 2022, 8, 5305–5312. [Google Scholar] [CrossRef]
  23. Shi, G.; Liu, D.; Wei, Q. Energy consumption prediction of office buildings based on echo state networks. Neurocomputing 2016, 216, 478–488. [Google Scholar] [CrossRef]
  24. Ji, R.; Qu, S. Investigation and evaluation of energy consumption performance for hospital buildings in China. Sustainability 2019, 11, 1724. [Google Scholar] [CrossRef] [Green Version]
  25. Felimban, A.; Prieto, A.; Knaack, U.; Klein, T.; Qaffas, Y. Assessment of current energy consumption in residential buildings in Jeddah, Saudi Arabia. Buildings 2019, 9, 163. [Google Scholar] [CrossRef] [Green Version]
  26. Olu-Ajayi, R.; Alaka, H.; Sulaimon, I.; Sunmola, F.; Ajayi, S. Building energy consumption prediction for residential buildings using deep learning and other machine learning techniques. J. Build. Eng. 2022, 45, 103406. [Google Scholar] [CrossRef]
  27. Alam, M.; Devjani, M.R. Analyzing energy consumption patterns of an educational building through data mining. J. Build. Eng. 2021, 44, 103385. [Google Scholar] [CrossRef]
  28. Sekki, T.; Airaksinen, M.; Saari, A. Measured energy consumption of educational buildings in a Finnish city. Energy Build. 2015, 87, 105–115. [Google Scholar] [CrossRef]
  29. Deng, Y.; Gou, Z.; Gui, X.; Cheng, B. Energy consumption characteristics and influential use behaviors in university dormitory buildings in China’s hot summer-cold winter climate region. J. Build. Eng. 2021, 33, 101870. [Google Scholar] [CrossRef]
  30. Mathews, R.A.; Prasanna, V.R.; Shanmugapriya, T. Simulation and analysis of a factory building’s energy consumption using eQuest software. Chem. Eng. Technol. 2021, 44, 928–933. [Google Scholar] [CrossRef]
  31. Gu, X.; Xie, J.; Luo, Z.; Liu, J. Analysis to energy consumption characteristics and influencing factors of terminal building based on airport operating data. Sustain. Energy Technol. Assess. 2021, 44, 101034. [Google Scholar] [CrossRef]
  32. Lin, L.; Liu, X.; Zhang, T.; Liu, X. Energy consumption index and evaluation method of public traffic buildings in China. Sustain. Cities Soc. 2020, 57, 102132. [Google Scholar] [CrossRef]
  33. Webb, M. Biomimetic building facades demonstrate potential to reduce energy consumption for different building typologies in different climate zones. Clean Technol. Environ. Policy 2021, 24, 493–518. [Google Scholar] [CrossRef]
  34. Heydari, A.; Sadati, S.E.; Gharib, M.R. Effects of different window configurations on energy consumption in building: Optimization and economic analysis. J. Build. Eng. 2021, 35, 102099. [Google Scholar] [CrossRef]
  35. Alajmi, A.F.; Aba-Alkhail, F.; Alanzi, A. Determining the optimum fixed solar-shading device for minimizing the energy consumption of a side-lit office building in a hot climate. J. Eng. Res. 2021, 9, 320–335. [Google Scholar] [CrossRef]
  36. Anwar, M.W.; Ali, Z.; Javed, A.; Din, E.U.; Sajid, M. Analysis of the effect of passive measures on the energy consumption and zero-energy prospects of residential buildings in Pakistan. Build. Simul. 2021, 14, 1325–1342. [Google Scholar] [CrossRef]
  37. Maiolo, M.; Pirouz, B.; Bruno, R.; Palermo, S.A.; Arcuri, N.; Piro, P. The role of the extensive green roofs on decreasing building energy consumption in the mediterranean climate. Sustainability 2020, 12, 359. [Google Scholar] [CrossRef]
  38. Troup, L.; Phillips, R.; Eckelman, M.J.; Fannon, D. Effect of window-to-wall ratio on measured energy consumption in US office buildings. Energy Build. 2019, 203, 109434. [Google Scholar] [CrossRef]
  39. Amirkhani, S.; Bahadori-Jahromi, A.; Mylona, A.; Godfrey, P.; Cook, D. Impact of Low-E window films on energy consumption and CO2 emissions of an existing UK botel building. Sustainability 2019, 11, 4265. [Google Scholar] [CrossRef] [Green Version]
  40. Chi, F.; Zhang, J.; Li, G.; Zhu, Z.; Bart, D. An investigation of the impact of building azimuth on energy consumption in sizhai traditional dwellings. Energy 2019, 180, 594–614. [Google Scholar] [CrossRef]
  41. Mohammadi, A.; Saghafi, M.R.; Tahbaz, M.; Nasrollahi, F. Effects of vernacular climatic strategies (VCS) on energy consumption in common residential buildings in southern Iran: The case study of bushehr city. Sustainability 2017, 9, 1950. [Google Scholar] [CrossRef] [Green Version]
  42. Sheng, W.; Kan, X.; Wen, B.; Zhang, L. Design matters: New insights on optimizing energy consumption for residential buildings. Energy Build. 2021, 242, 110976. [Google Scholar] [CrossRef]
  43. Charles, A.; Maref, W.; Ouellet-Plamondon, C.M. Case study of the upgrade of an existing office building for low energy consumption and low carbon emissions. Energy Build. 2019, 183, 151–160. [Google Scholar] [CrossRef]
  44. Siamak, H.; Mohammad Hadi, Z.; Atoosa, S.; Ali, J.C. Analysis of energy consumption improvements of a zero-energy building in a humid mountainous area. J. Renew. Sustain. Energy 2019, 11, 015103. [Google Scholar] [CrossRef]
  45. Shehadi, M. Energy consumption optimization measures for buildings in the midwest regions of USA. Buildings 2018, 8, 170. [Google Scholar] [CrossRef] [Green Version]
  46. D’Agostino, D.; Cuniberti, B.; Bertoldi, P. Energy consumption and efficiency technology measures in European non-residential buildings. Energy Build. 2017, 153, 72–86. [Google Scholar] [CrossRef]
  47. Jingke, H.; Chenyu, W.; Chang-Richards, A.; Jingxiao, Z.; Qiping, S.; Bei, Q. A spatiotemporal analysis of energy use pathways in the construction industry: A study of China. Energy 2022, 239, 122084. [Google Scholar] [CrossRef]
  48. Huang, J.; Gurney, K.R. The variation of climate change impact on building energy consumption to building type and spatiotemporal scale. Energy 2016, 111, 137–153. [Google Scholar] [CrossRef] [Green Version]
  49. Fonseca, J.A.; Schlueter, A. Integrated model for characterization of spatiotemporal building energy consumption patterns in neighborhoods and city districts. Appl. Energy 2015, 142, 247–265. [Google Scholar] [CrossRef]
  50. Song, S.; Leng, H.; Xu, H.; Guo, R.; Zhao, Y. Impact of urban morphology and climate on heating energy consumption of buildings in severe cold regions. Int. J. Environ. Res. Public Health 2020, 17, 8354. [Google Scholar] [CrossRef] [PubMed]
  51. Howard, B.; Parshall, L.; Thompson, J.; Hammer, S.; Dickinson, J.; Modi, V. Spatial distribution of urban building energy consumption by end use. Energy Build. 2012, 45, 141–151. [Google Scholar] [CrossRef]
  52. Gavali, H.R.; Ralegaonkar, R.V. Evaluation of developed alkali-activated bricks for energy-efficient building construction. Proc. Inst. Civ. Eng. Energy 2020, 173, 177–183. [Google Scholar] [CrossRef]
  53. Yin, X.; Dong, Q.; Zhou, S.; Yu, J.; Huang, L.; Sun, C. Energy-saving potential of applying prefabricated straw bale construction (PSBC) in domestic buildings in northern China. Sustainability 2020, 12, 3464. [Google Scholar] [CrossRef] [Green Version]
  54. Pooya, L.; Polat, H. A comparative study of traditional and contemporary building envelope construction techniques in terms of thermal comfort and energy efficiency in hot and humid climates. Sustainability 2019, 11, 3582. [Google Scholar] [CrossRef] [Green Version]
  55. Reider, R.; Meir, I.A. Comparing the energy implications of FRP and concrete residential construction in a hot arid climate. Energy Build. 2019, 186, 98–107. [Google Scholar] [CrossRef]
  56. Bogdanovic, V.; Ranđelović, D.; Vasov, M.; Ignjatovic, M.; Stevanovic, J. Improving thermal stability and reduction of energy consumption by implementing Trombe Wall construction in the process of building design: The Serbia region. Therm. Sci. 2018, 2018, 167. [Google Scholar] [CrossRef] [Green Version]
  57. Ivanović-Šekularac, J.; Čikić-Tovarović, J.; Šekularac, N. Application of wood as an element of façade cladding in construction and reconstruction of architectural objects to improve their energy efficiency. Energy Build. 2016, 115, 85–93. [Google Scholar] [CrossRef]
  58. Miller, D.; Doh, J.H.; Mulvey, M. Concrete slab comparison and embodied energy optimisation for alternate design and construction techniques. Constr. Build. Mater. 2015, 80, 329–338. [Google Scholar] [CrossRef] [Green Version]
  59. Hamdaoui, S.; Mahdaoui, M.; Allouhi, A.; Alaiji, R.E.; Kousksou, T.; El Bouardi, A. Energy demand and environmental impact of various construction scenarios of an office building in Morocco. J. Clean. Prod. 2018, 188, 113–124. [Google Scholar] [CrossRef]
  60. Macias, J.; Iturburu, L.; Rodriguez, C.; Agdas, D.; Boero, A.; Soriano, G. Embodied and operational energy assessment of different construction methods employed on social interest dwellings in Ecuador. Energy Build. 2017, 151, 107–120. [Google Scholar] [CrossRef]
  61. Heravi, G.; Qaemi, M. Energy performance of buildings: The evaluation of design and construction measures concerning building energy efficiency in Iran. Energy Build. 2014, 75, 456–464. [Google Scholar] [CrossRef]
  62. Devi, L.P.; Palaniappan, S. A study on energy use for excavation and transport of soil during building construction. J. Clean. Prod. 2017, 164, 543–556. [Google Scholar] [CrossRef]
  63. Wang, H.; Xia, S.; Zhang, Q.; Zhang, P. Has China’s construction waste change been decoupled from economic growth? Buildings 2022, 12, 147. [Google Scholar] [CrossRef]
  64. Wu, Y.; Zhu, Q.; Zhu, B. Comparisons of decoupling trends of global economic growth and energy consumption between developed and developing countries. Energy Policy 2018, 116, 30–38. [Google Scholar] [CrossRef]
  65. Wang, F.; Zhang, Z. Decoupling economic growth from energy consumption in top five energy consumer economies: A technological and urbanization perspective. J. Clean. Prod. 2022, 357, 131890. [Google Scholar] [CrossRef]
  66. Chen, X.; Shuai, C.; Zhang, Y.; Wu, Y. Decomposition of energy consumption and its decoupling with economic growth in the global agricultural industry. Environ. Impact Assess. Rev. 2020, 81, 106364. [Google Scholar] [CrossRef]
  67. Zhang, M.; Song, Y.; Su, B.; Sun, X. Decomposing the decoupling indicator between the economic growth and energy consumption in China. Energy Effic. 2015, 8, 1231–1239. [Google Scholar] [CrossRef]
  68. Song, Y.; Zhang, M. Using a new decoupling indicator (ZM decoupling indicator) to study the relationship between the economic growth and energy consumption in China. Nat. Hazards 2017, 88, 1013–1022. [Google Scholar] [CrossRef]
  69. Shi, L.; Vause, J.; Li, Q.; Tang, L.; Zhao, J. Decoupling analysis of energy consumption and economic development in China. Energy Sources Part B Econ. Plan. Policy 2016, 11, 788–792. [Google Scholar] [CrossRef]
  70. Wei, W.; Cai, W.; Guo, Y.; Bai, C.; Yang, L. Decoupling relationship between energy consumption and economic growth in China’s provinces from the perspective of resource security. Resour. Policy 2020, 68, 101693. [Google Scholar] [CrossRef]
  71. Meng, M.; Fu, Y.; Wang, X. Decoupling, decomposition and forecasting analysis of China’s fossil energy consumption from industrial output. J. Clean. Prod. 2018, 177, 752–759. [Google Scholar] [CrossRef]
  72. Zhou, D.; Zhang, L.; Zha, D.; Wu, F.; Wang, Q. Decoupling and decomposing analysis of construction industry’s energy consumption in China. Nat. Hazards 2019, 95, 39–53. [Google Scholar] [CrossRef]
  73. Zhang, L.; Ma, X.; Wang, Y.; Song, R.; Li, J.; Yuan, W.; Zhang, S. The increasing district heating energy consumption of the building sector in China: Decomposition and decoupling analysis. J. Clean. Prod. 2020, 271, 122696. [Google Scholar] [CrossRef]
  74. Zhang, M.; Bai, C. Exploring the influencing factors and decoupling state of residential energy consumption in Shandong. J. Clean. Prod. 2018, 194, 253–262. [Google Scholar] [CrossRef]
  75. Román-Collado, R.; Cansino, J.M.; Botia, C. How far is Colombia from decoupling? Two-level decomposition analysis of energy consumption changes. Energy 2018, 148, 687–700. [Google Scholar] [CrossRef]
  76. Zhang, P.; Li, W.; Zhao, K.; Zhao, S. Spatial pattern and driving mechanism of urban–rural income gap in Gansu province of China. Land 2021, 10, 1002. [Google Scholar] [CrossRef]
  77. Zhao, S.; Zhao, K.; Zhang, P. Spatial inequality in China’s housing market and the driving mechanism. Land 2021, 10, 841. [Google Scholar] [CrossRef]
  78. Li, W.; Zhang, P.; Zhao, K.; Zhao, S. The geographical distribution and influencing factors of COVID-19 in China. Trop. Med. Infect. Dis. 2022, 7, 45. [Google Scholar] [CrossRef] [PubMed]
  79. Ord, J.K.; Getis, A. Local spatial autocorrelation statistics: Distributional issues and an application. Geogr. Anal. 1995, 27, 286–306. [Google Scholar] [CrossRef]
  80. Getis, A.; Ord, J.K. The analysis of spatial association by use of distance statistics. Geogr. Anal. 1992, 24, 189–206. [Google Scholar] [CrossRef]
  81. Zhao, S.; Zhao, K.; Yan, Y.; Zhu, K.; Guan, C. Spatio-temporal evolution characteristics and influencing factors of urban service-industry land in China. Land 2022, 11, 13. [Google Scholar] [CrossRef]
  82. Li, M.; Hao, J.; Chen, L.; Gu, T.; Guan, Q.; Chen, A. Decoupling of urban and rural construction land and population change in China at the prefectural level. Resour. Sci. 2019, 41, 1897–1910. [Google Scholar] [CrossRef]
  83. Organization for Economic Cooperation and Development (OECD). Indicators to Measure Decoupling of Environmental Pressure and Economic Growth; OECD: Paris, France, 2002. [Google Scholar]
  84. Zhang, P.; Hu, J.; Zhao, K.; Chen, H.; Zhao, S.; Li, W. Dynamics and decoupling analysis of carbon emissions from construction industry in China. Buildings 2022, 12, 257. [Google Scholar] [CrossRef]
  85. Tapio, P. Towards a theory of decoupling: Degrees of decoupling in the EU and the case of road traffic in Finland between 1970 and 2001. Transp. Policy 2005, 12, 137–151. [Google Scholar] [CrossRef] [Green Version]
  86. Vaden, T.; Lahde, V.; Majava, A.; Jarvensivu, P.; Toivanen, T.; Hakala, E.; Eronen, J.T. Decoupling for ecological sustainability: A categorisation and review of research literature. Environ. Sci. Policy 2020, 112, 236–244. [Google Scholar] [CrossRef]
  87. Peng, H.; Guo, L.; Zhang, J.; Zhong, S.; Yu, H.; Yan, Y. Research progress and implication of the relationship between regional economic growth and resource-environmental pressure. Resour. Sci. 2020, 42, 593–606. [Google Scholar] [CrossRef]
  88. Song, Y.; Sun, J.; Zhang, M.; Su, B. Using the Tapio-Z decoupling model to evaluate the decoupling status of China’s CO2 emissions at provincial level and its dynamic trend. Struct. Chang. Econ. Dyn. 2020, 52, 120–129. [Google Scholar] [CrossRef]
  89. Wen, Q.; Chen, Y.; Hong, J.; Chen, Y.; Ni, D.; Shen, Q. Spillover effect of technological innovation on CO2 emissions in China’s construction industry. Build. Environ. 2020, 171, 106653. [Google Scholar] [CrossRef]
  90. Hou, L. Research on the Chinese architecture energy resource consumption. Huazhong Archit. 2015, 33, 94–100. [Google Scholar] [CrossRef]
  91. Duan, H.; Chen, S.; Liu, Y.; Zhang, S.; Wang, X.; Wang, S.; Song, J. Characteristics of reginal energy consumption of China’s construction industry from the perspective of life cycle. China Popul. Resour. Environ. 2020, 30, 57–65. [Google Scholar] [CrossRef]
  92. Lai, X.; Lu, C.; Liu, J. A synthesized factor analysis on energy consumption, economy growth, and carbon emission of construction industry in China. Environ. Sci. Pollut. Res. Int. 2019, 26, 13896–13905. [Google Scholar] [CrossRef]
  93. Guo, S.; Yan, D.; Hu, S.; Zhang, Y. Modelling building energy consumption in China under different future scenarios. Energy 2021, 214, 119063. [Google Scholar] [CrossRef]
  94. Hassan, J.S.; Zin, R.M.; Abd Majid, M.Z.; Balubaid, S.; Hainin, M.R. Building energy consumption in Malaysia: An overview. J. Teknol. 2014, 70, 33–38. [Google Scholar] [CrossRef] [Green Version]
  95. Salam, R.A.; Amber, K.P.; Ratyal, N.I.; Alam, M.; Akram, N.; Gómez Muñoz, C.Q.; García Márquez, F.P. An overview on energy and development of energy integration in major south Asian countries: The building sector. Energies 2020, 13, 5776. [Google Scholar] [CrossRef]
  96. Štreimikienė, D. Residential energy consumption trends, main drivers and policies in Lithuania. Renew. Sustain. Energy Rev. 2014, 35, 285–293. [Google Scholar] [CrossRef]
  97. Liu, X.; Hu, S.; Li, L. Temporal and spatial changes of building energy comsumption in China’s provinces and analysis of its influencing factors. Math. Pract. Theory 2020, 50, 74–85. [Google Scholar]
  98. Zhong, X.; Hu, M.; Deetman, S.; Rodrigues, J.F.D.; Lin, H.; Tukker, A.; Behrens, P. The evolution and future perspectives of energy intensity in the global building sector 1971–2060. J. Clean. Prod. 2021, 305, 127098. [Google Scholar] [CrossRef]
  99. Krarti, M. Evaluation of energy efficiency potential for the building sector in the Arab region. Energies 2019, 12, 4279. [Google Scholar] [CrossRef]
  100. Blomqvist, S.; Ödlund, L.; Rohdin, P. Understanding energy efficiency decisions in the building sector: A survey of barriers and drivers in Sweden. Clean. Eng. Technol. 2022, 9, 100527. [Google Scholar] [CrossRef]
  101. Du, P.; Zheng, L.; Xie, B.; Mahalingam, A. Barriers to the adoption of energy-saving technologies in the building sector: A survey study of Jing-Jin-Tang, China. Energy Policy 2014, 75, 206–216. [Google Scholar] [CrossRef]
  102. Wang, T.; Li, X.; Liao, P.; Fang, D. Building energy efficiency for public hospitals and healthcare facilities in China: Barriers and drivers. Energy 2016, 103, 588–597. [Google Scholar] [CrossRef]
  103. Shen, L.; Zhou, J.; Skitmore, M.; Xia, B. Application of a hybrid Entropy–McKinsey matrix method in evaluating sustainable urbanization: A China case study. Cities 2015, 42, 186–194. [Google Scholar] [CrossRef] [Green Version]
  104. Wang, Q.; Shen, C.; Guo, Z. Quantitative research of energy consumption in prefabricated construction phase. Constr. Econ. 2021, 42, 105–112. [Google Scholar] [CrossRef]
  105. Lam, P.T.I.; Chan, E.H.W.; Poon, C.S.; Chau, C.K.; Chun, K.P. Factors affecting the implementation of green specifications in construction. J. Environ. Manag. 2010, 91, 654–661. [Google Scholar] [CrossRef]
  106. Alsharef, A.; Banerjee, S.; Uddin, S.M.J.; Albert, A.; Jaselskis, E. Early Impacts of the COVID-19 Pandemic on the United States Construction Industry. Int. J. Environ. Res. Public Health 2021, 18, 1559. [Google Scholar] [CrossRef]
  107. Hoang, A.T.; Sandro, N.; Olcer, A.I.; Ong, H.C.; Chen, W.H.; Chong, C.T.; Thomas, S.; Bandh, S.A.; Nguyen, X.P. Impacts of COVID-19 pandemic on the global energy system and the shift progress to renewable energy: Opportunities, challenges, and policy implications. Energy Policy 2021, 154, 112322. [Google Scholar] [CrossRef]
  108. Casals, X.G. Analysis of building energy regulation and certification in Europe: Their role, limitations and differences. Energy Build. 2006, 38, 381–392. [Google Scholar] [CrossRef]
  109. Jang, H.; Choi, S.; Kim, W.; Chang, C. Strategic selection of green construction products. KSCE J. Civ. Eng. 2012, 16, 1115–1122. [Google Scholar] [CrossRef]
  110. Wang, Y.; Chong, D.; Liu, X. Evaluating the critical barriers to green construction technologies adoption in China. Sustainability 2021, 13, 6510. [Google Scholar] [CrossRef]
  111. Xiao, X. State and development strategy for green construction. Constr. Technol. 2018, 47, 1–4, 40. [Google Scholar] [CrossRef]
  112. Lu, C.; Wu, J.; Wang, M.; Li, X.; Liu, B.; Liang, C.; Hu, X. Improvement of core competitiveness of Chinese construction enterprises against the background of high-quality development. Strateg. Study CAE 2021, 23, 79–86. [Google Scholar] [CrossRef]
  113. Wu, Y.; Hou, J.; Xu, K.; Li, Y. Study on improvement system of building energy efficiency of China. Build. Sci. 2015, 31, 1–14. [Google Scholar] [CrossRef]
  114. Zhang, K.; Lu, Y.; Lu, H. Countermeasures for high quality development of green buildings in China under the background of “double carbon” goal. Constr. Econ. 2022, 43, 14–20. [Google Scholar] [CrossRef]
  115. Zhang, Y.; Kang, J.; Jin, H. A Review of green building development in China from the perspective of energy saving. Energies 2018, 11, 334. [Google Scholar] [CrossRef]
  116. Department of Economic and Social Affairs of United Nations (DESA). World Urbanization Prospects 2018; DESA: New York, NY, USA, 2019. [Google Scholar]
Figure 1. Research area.
Buildings 12 01745 g001
Figure 2. Yearly change and growth rate of ECA on construction industry in China from 2010 to 2019. TCE is a unit of energy measurement which means tons of standard coal equivalent.
Buildings 12 01745 g002
Figure 3. Annual change of economic output and growth rate on construction industry in China from 2010 to 2019.
Buildings 12 01745 g003
Figure 4. Research steps.
Buildings 12 01745 g004
Figure 5. Temporal change characteristic of ECA on construction industry from 2010 to 2019.
Buildings 12 01745 g005
Figure 6. Temporal change characteristic of ECI on construction industry from 2010 to 2019.
Buildings 12 01745 g006
Figure 7. CV trend of ECA and ECI on construction industry from 2010 to 2019. CV is a relative value and is dimensionless.
Buildings 12 01745 g007
Figure 8. Spatial cluster of ECA in 2010 and 2019.
Buildings 12 01745 g008
Figure 9. Spatial cluster of ECI in 2010 and 2019.
Buildings 12 01745 g009
Figure 10. Spatial hot and cold spots of ECA in 2010 and 2019.
Buildings 12 01745 g010
Figure 11. Spatial hot and cold spots of ECI in 2010 and 2019.
Buildings 12 01745 g011
Figure 12. Spatial distribution and gathering characteristics of decoupling types between ECA and gross output value.
Buildings 12 01745 g012
Figure 13. Spatial distribution and gathering characteristics of decoupling types between ECA and added value.
Buildings 12 01745 g013
Figure 14. Spatial distribution and gathering characteristics of decoupling types between ECA and total profit.
Buildings 12 01745 g014
Figure 15. Spatial distribution and gathering characteristics of decoupling change types.
Buildings 12 01745 g015
Figure 16. Optimized policy zoning of energy consumption on China’s construction industry.
Buildings 12 01745 g016
Table 1. Decoupling types and indicator value.
Decoupling Type Δ x Δ y z Situation
DecouplingStrong<0>0<0Best status, enjoying economy growing with reduced energy consumption
Weak>0>0[0, 0.8)Second best status, with economy growing faster than the energy consumption growing
Recessive<0<0(1.2, +∞)Negative growing, with economic slowdown slower than energy consumption reduction
CouplingExpansive>0>0[0.8, 1.2]Economic development and energy consumption grow in tandem
Recessive<0<0[0.8, 1.2]Economic development and energy consumption decline in tandem
Negative DecouplingStrong>0<0< 0Worst, experiencing economic recession with increased energy consumption
Weak<0<0[0, 0.8)Second worst, with economic slowdown faster than energy consumption reduction
Expansive>0>0(1.2, +∞)Economic growth is slower than energy consumption growth
Publisher’s Note: MDPI stays neutral with regard to jurisdictional claims in published maps and institutional affiliations.

