
A Literature Survey of Local Climate Zone Classification: Status, Application, and Prospect
Abstract
:1. Introduction
- –
- Summarize the last ten years of LCZ-related literature for summary analysis.
- –
- Analyze the main LCZ application themes.
- –
- Forecast the future LCZ research directions.
2. Review Methods
2.1. Article Screening
- The query process, yielding many results for two databases: 170 articles from the WoS core collection and 94 articles from Elsevier, resulting in a total of 264 articles.
- Screening alignment of the papers from the two databases, removing duplicates for further analysis, resulting in a total of 202 papers.
- Filtering both databases to identify articles within the scope of this review. Filtering the types of articles, limiting the search to research and review articles only, while excluding social material, meeting, and comment, etc. After filtering, 195 articles were obtained.
- Screening titles/abstracts/methods to identify studies that only mentioned LCZ and did not actually apply it.
- Finally, 190 related articles on LCZ were obtained.

2.2. LCZ Overall Visualization Analysis
- Keyword co-occurrence of the authors in the articles selected using WoS and Elsevier.
- The most common sources of LCZ-related papers and the citation links between them are from WoS and Elsevier.
- Top reference sources for LCZ-related papers and reference links in WoS and Elsevier.
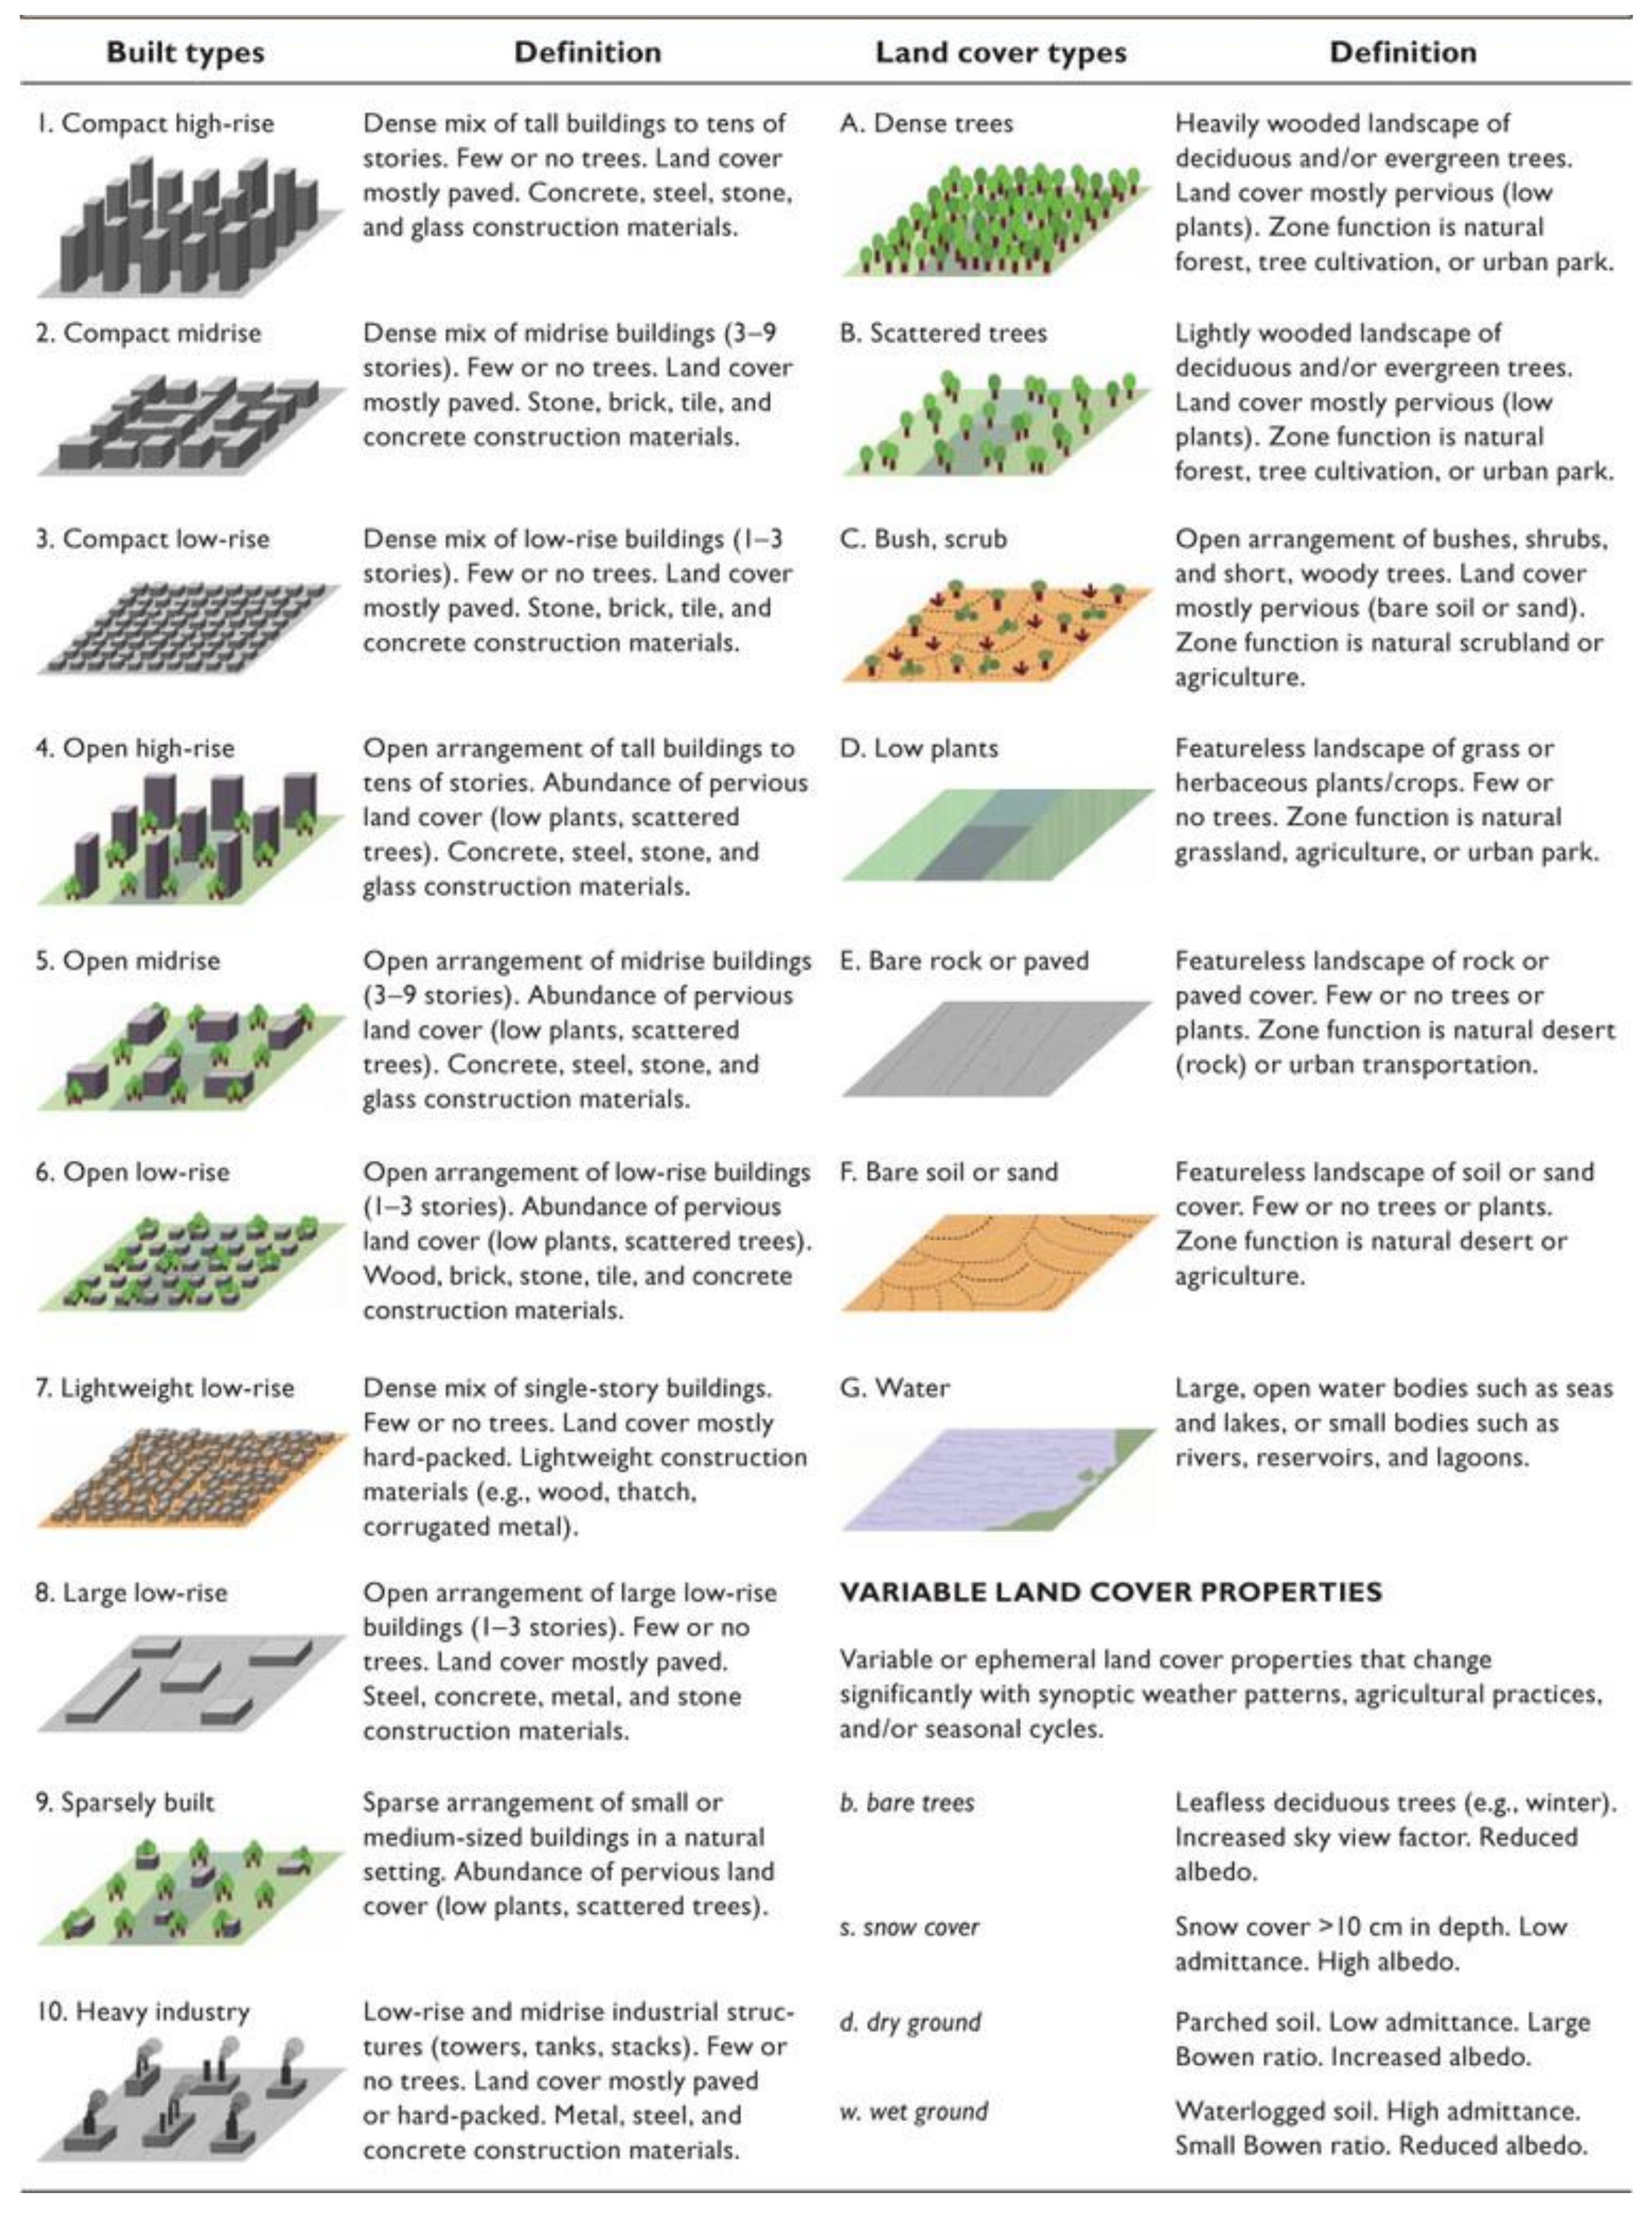
2.3. LCZ Study Classification
3. Results
3.1. Descriptive Analysis
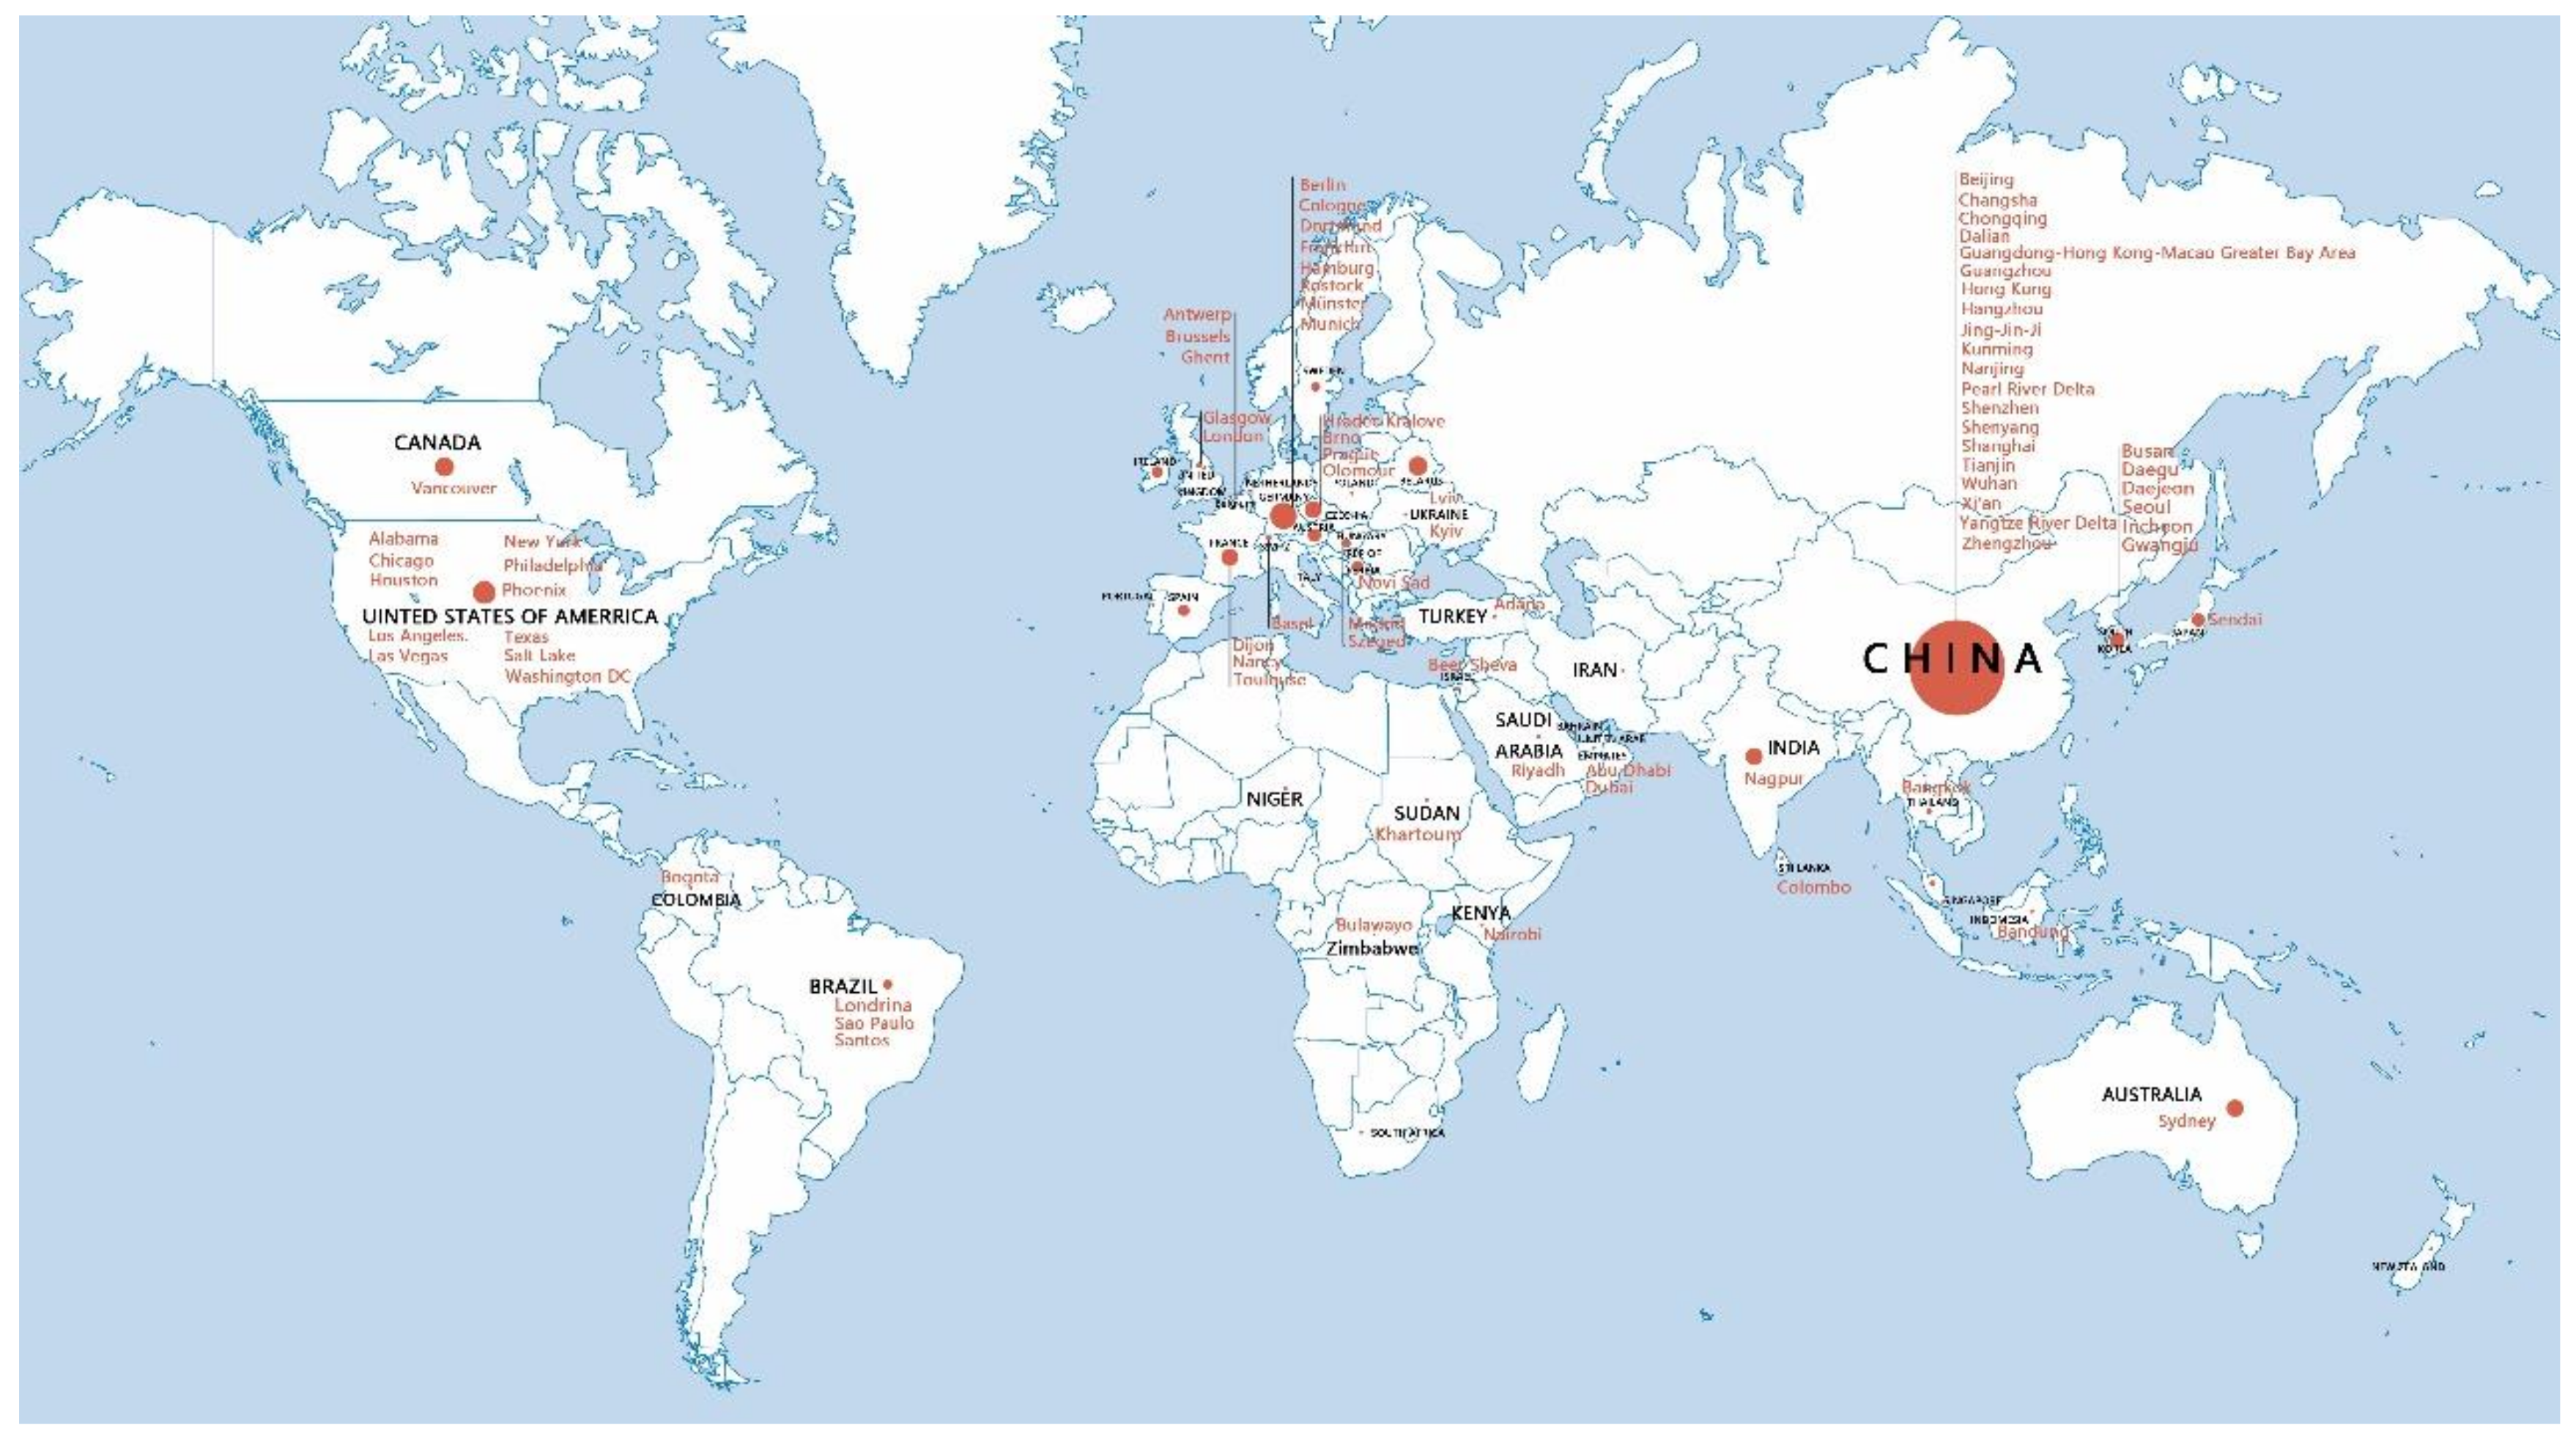
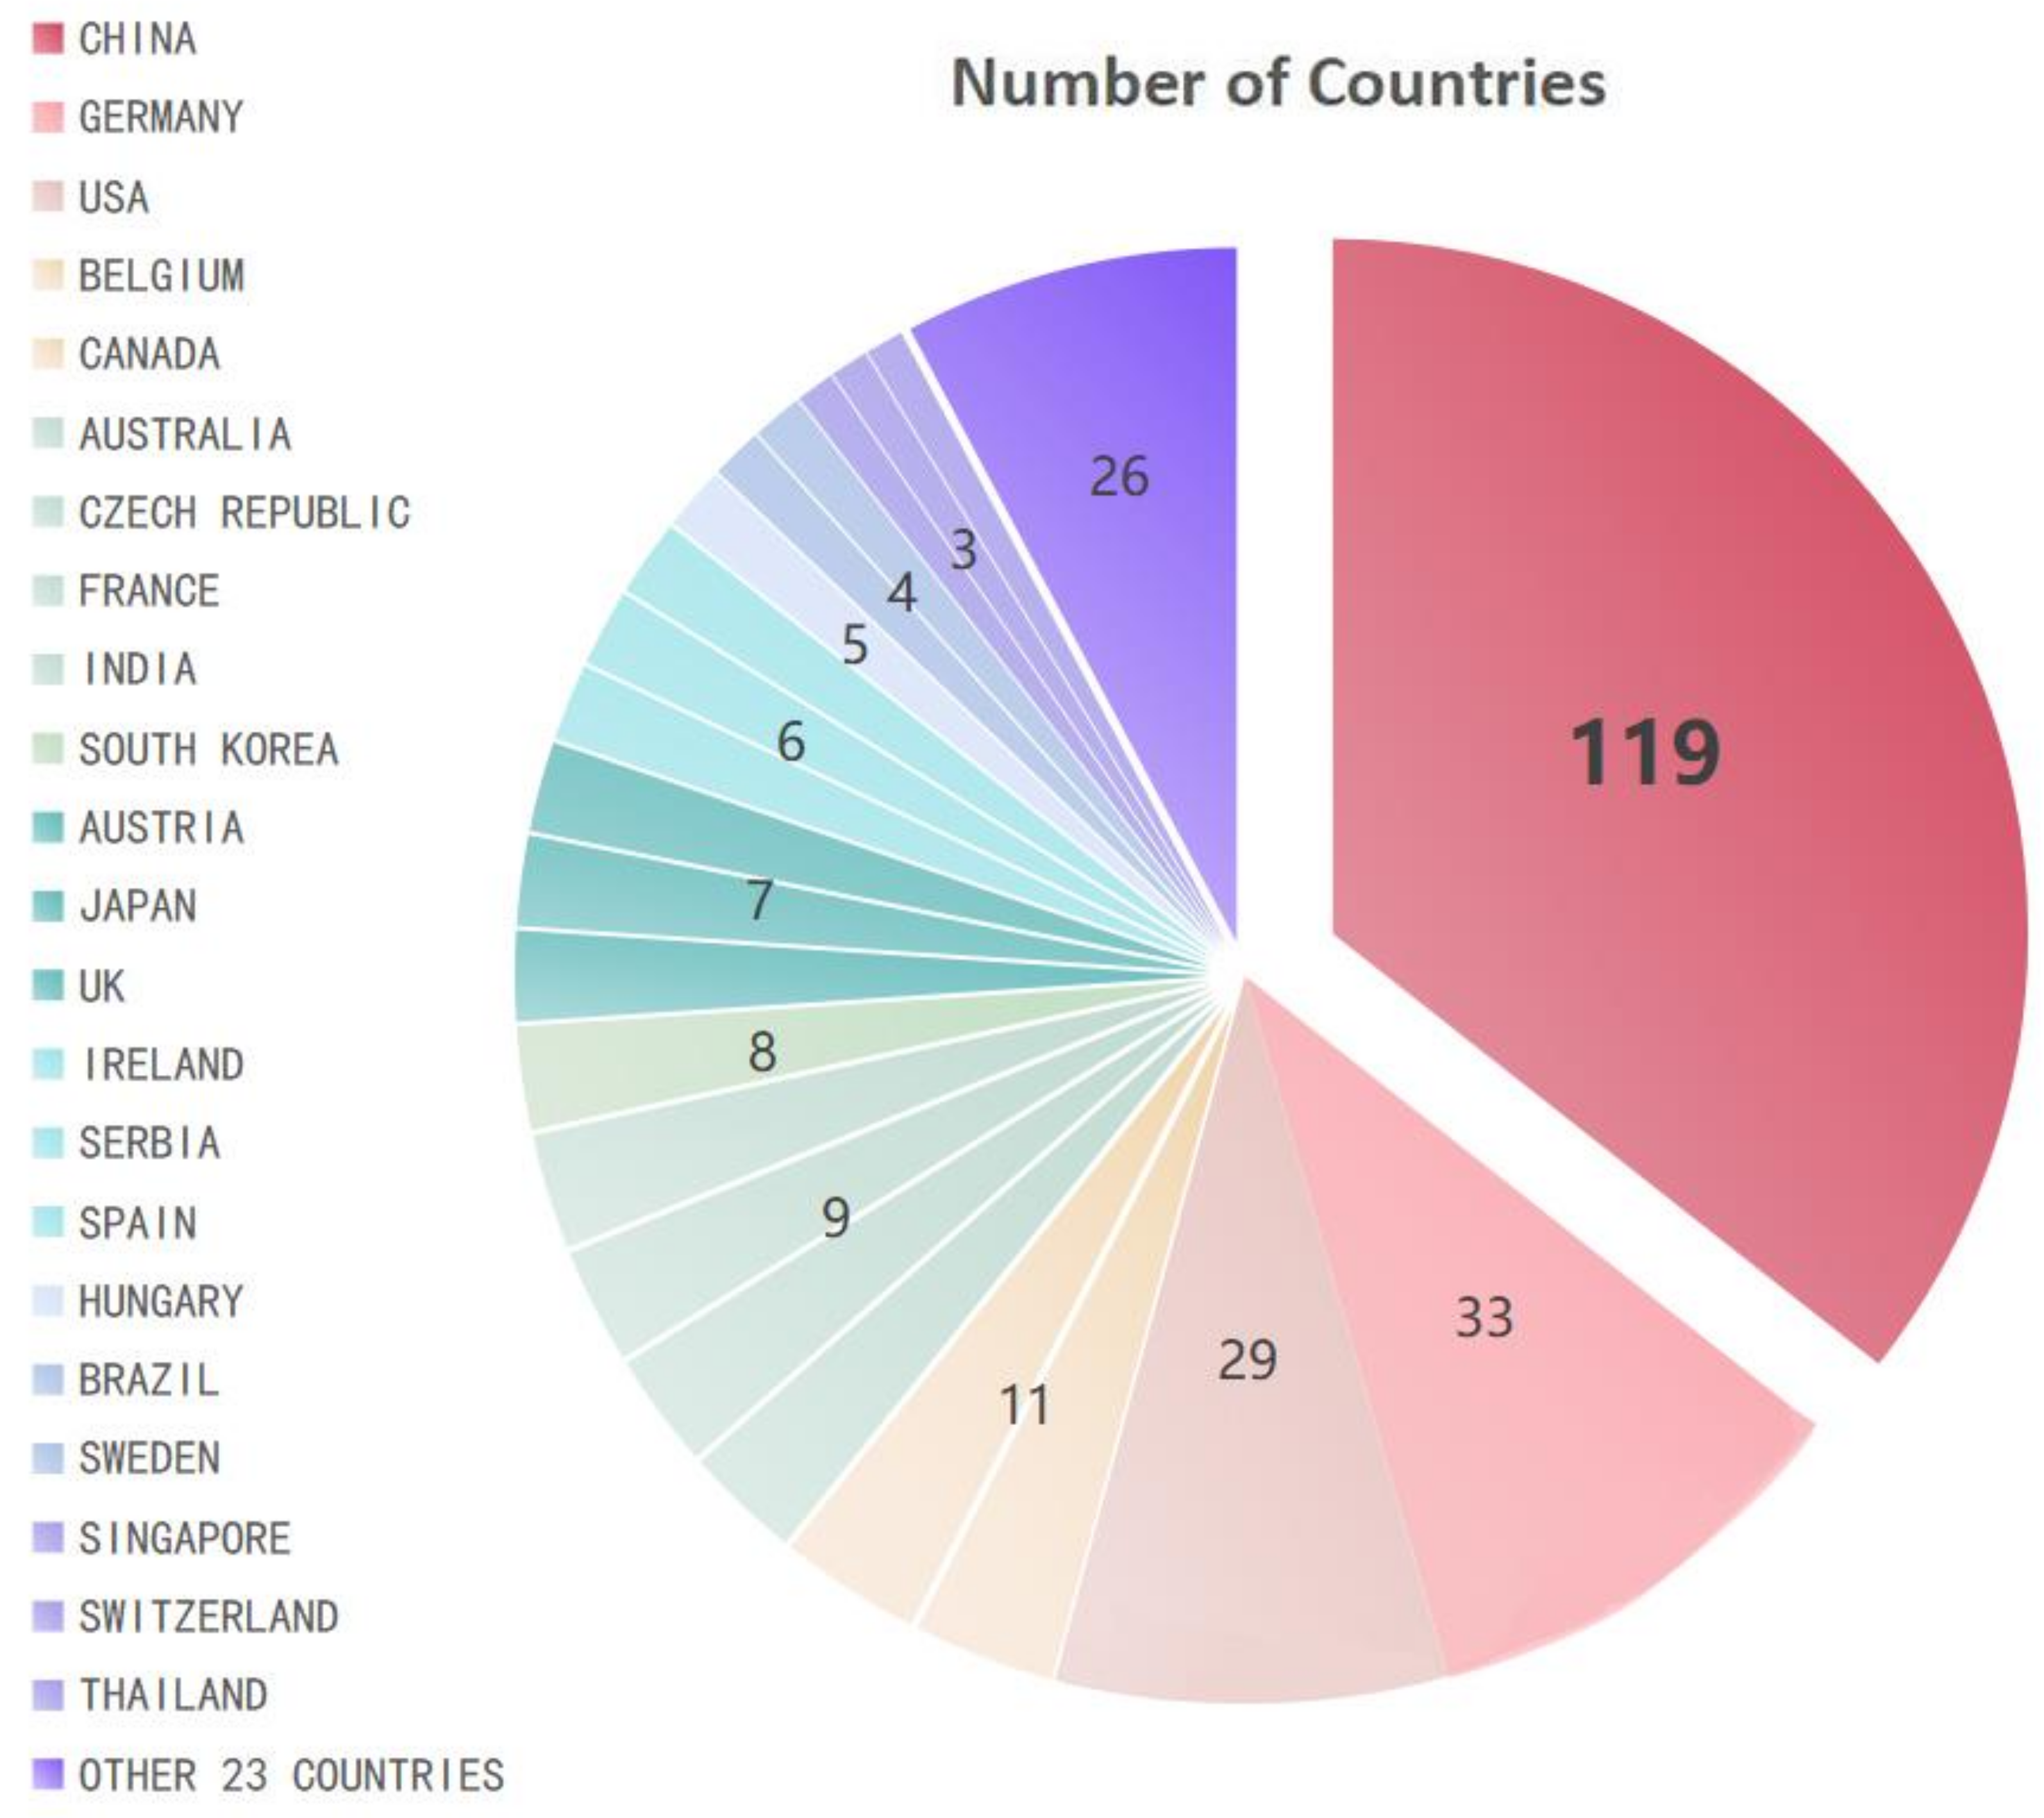
3.1.1. Geographical Patterns
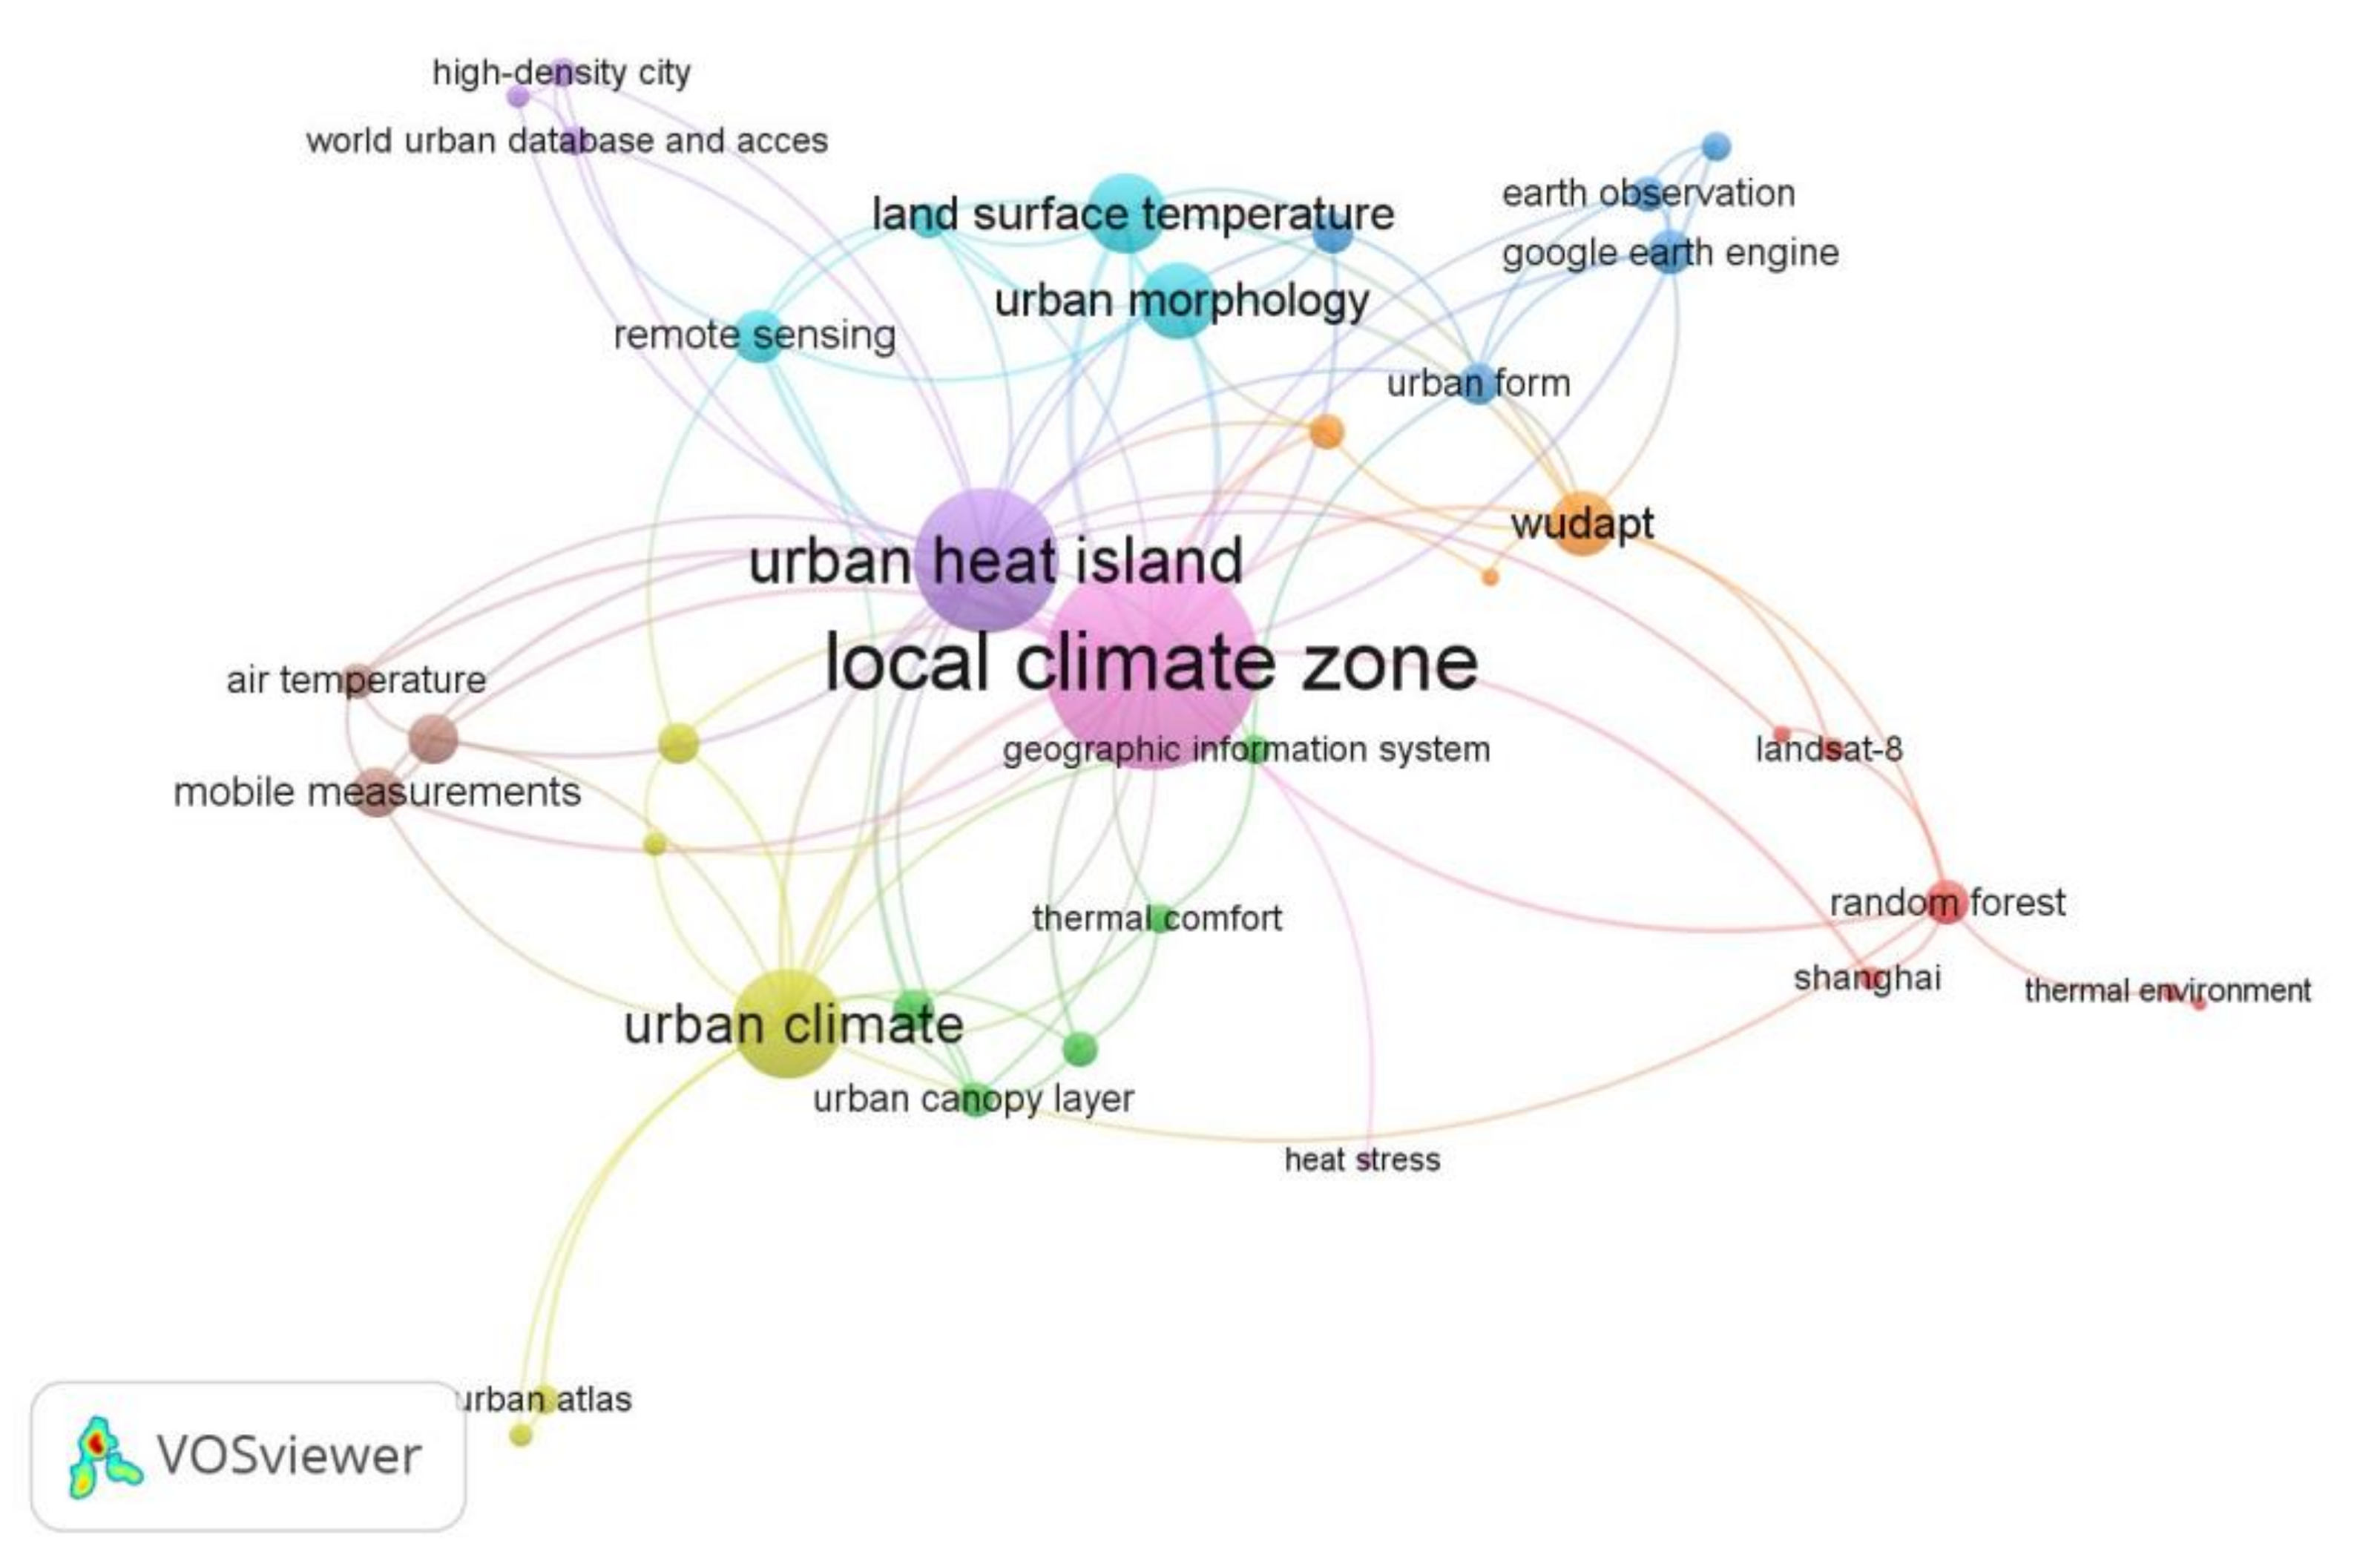
3.1.2. Keywords
3.1.3. Annual Distribution
3.1.4. Contributing Journals
3.1.5. Article Citation Frequency
3.2. LCZ Mapping
3.2.1. Simple Division of City Types Using the LCZ Classification
3.2.2. Optimizing LCZ Classification
3.3. Measurement Methods
3.3.1. Fixed-Point Observations
3.3.2. Mobile Measurements
3.3.3. Urban Climate Models
3.4. Thermal Environment
3.4.1. Urban Heat Islands (UHIs)
3.4.2. Land Surface Temperature (LST)
3.5. Outdoor Thermal Comfort
3.6. Urban Planning and the Urban Environment
3.6.1. Urban Planning
3.6.2. Urban Environments
3.6.3. Others
4. Challenges and Future Direction
5. Conclusions
Author Contributions
Funding
Conflicts of Interest
Abbreviations
| CIMO | Committee of instruments and methods of observation |
| CNN | Convolutional neural network |
| CWS | Citizen weather stations |
| CWTS | The Centre for Science and Technology Studies |
| DSM | Digital surface model |
| EO | Earth observation |
| EE | Google Earth Engine |
| GIS | Geographic information system |
| HMS | Hungarian Meteorological Service |
| LCZ | Local climate zone |
| LST | Land surface temperature |
| MTL | Multi-task learning |
| MTSV | Mean thermal sensation votes |
| nDSM | normalized digital surface model |
| OTC | Outdoor thermal comfort |
| OSM | Open Street Map |
| PET | Physiological equivalent temperature |
| PMV | Predicted mean vote |
| PRISMA | Preferred reporting items for systematic reviews and meta-analyses |
| PM2.5 | Particulate matter <2.5 µm in aerodynamic diameter |
| RPM | Respiratory particulate matter |
| RS | Remote sensing |
| RHMZ | Republic hydrometeorological service of Serbia |
| SUEWS | Surface urban energy and water balance model |
| SAR | Synthetic aperture radar |
| SAGA | System for automated geoscientific analyses |
| SCSF | Spatial-contextual information-based self-training classification framework |
| SVF | Sky view factor |
| SOLWEIG | Long-wave environmental irradiance geometry |
| SUHI | Surface urban heat island |
| Tmrt | Mean radiant temperature |
| TCI | Thermal comfort indicators |
| TLCZ | Temperature of LCZ |
| UHI | Urban heat island |
| UTCI | Universal thermal climate index |
| UCL | Urban canopy layer |
| UDC | Urban energy balance calculation model |
| UHII | Urban heat island intensity |
| WUDAPT | Word Urban Database and Access Portal Tools |
| WoS | Web of Science |
| WRF | Weather research and forecasting model |
References
- Taha, H. Urban climates and heat islands: Albedo, evapotranspiration, and anthropogenic heat. Energy Build. 1997, 25, 99–103. [Google Scholar] [CrossRef] [Green Version]
- Zhao, L.; Lee, X.; Smith, R.B.; Oleson, K. Strong contributions of local background climate to urban heat islands. Nature 2014, 511, 216–219. [Google Scholar] [CrossRef] [PubMed]
- Ruiz, M.A.; Correa, E.N. Adaptive model for outdoor thermal comfort assessment in an Oasis city of arid climate. Build. Environ. 2015, 85, 40–51. [Google Scholar] [CrossRef]
- Memon, R.A.; Leung, D.Y.; Chunho, L. A review on the generation, determination and mitigation of urban heat island. J. Environ. Sci. 2008, 20, 120–128. [Google Scholar] [CrossRef]
- Santamouris, M. Cooling the cities—A review of reflective and green roof mitigation technologies to fight heat island and improve comfort in urban environments. Sol. Energy 2014, 103, 682–703. [Google Scholar] [CrossRef]
- Li, J.; Song, C.; Cao, L.; Zhu, F.; Meng, X.; Wu, J. Impacts of landscape structure on surface urban heat islands: A case study of Shanghai, China. Remote Sens. Environ. 2011, 115, 3249–3263. [Google Scholar] [CrossRef]
- Estoque, R.C.; Murayama, Y.; Myint, S.W. Effects of landscape composition and pattern on land surface temperature: An urban heat island study in the megacities of Southeast Asia. Sci. Total Environ. 2017, 577, 349–359. [Google Scholar] [CrossRef]
- Yang, J.; Jin, S.; Xiao, X.; Jin, C.; Xia, J.C.; Li, X.; Wang, S. Local climate zone ventilation and urban land surface temperatures: Towards a performance-based and wind-sensitive planning proposal in megacities. Sust. Cities Soc. 2019, 47, 101487. [Google Scholar] [CrossRef]
- Middel, A.; Häb, K.; Brazel, A.J.; Martin, C.A.; Guhathakurta, S. Impact of urban form and design on mid-afternoon microclimate in Phoenix Local Climate Zones. Landsc. Urban Plan. 2014, 122, 16–28. [Google Scholar] [CrossRef]
- Stewart, I.D.; Oke, T.R.; Krayenhoff, E.S. Evaluation of the ‘local climate zone’ scheme using temperature observations and model simulations. Int. J. Climatol. 2014, 34, 1062–1080. [Google Scholar] [CrossRef]
- Stewart, I.D.; Oke, T.R. Local Climate Zones for Urban Temperature Studies. Bull. Amer. Meteorol. Soc. 2012, 93, 1879–1900. [Google Scholar] [CrossRef]
- Bechtel, B.; Demuzere, M.; Mills, G.; Zhan, W.; Sismanidis, P.; Small, C.; Voogt, J. SUHI analysis using Local Climate Zones—A comparison of 50 cities. Urban Clim. 2019, 28, 100451. [Google Scholar] [CrossRef]
- Liberati, A.; Altman, D.G.; Tetzlaff, J.; Mulrow, C.; Gøtzsche, P.C.; Ioannidis, J.P.A.; Clarke, M.; Devereaux, P.J.; Kleijnen, J.; Moher, D. The PRISMA statement for reporting systematic reviews and meta-analyses of studies that evaluate health care interventions: Explanation and elaboration. J. Clin. Epidemiol. 2009, 62, e1–e34. [Google Scholar] [CrossRef] [Green Version]
- Armstrong, R.; Hall, B.J.; Doyle, J.; Waters, E. ‘Scoping the scope’ of a cochrane review. J. Public Health 2011, 33, 147–150. [Google Scholar] [CrossRef]
- Eldesoky, A.H.M.; Gil, J.; Pont, M.B. The suitability of the urban local climate zone classification scheme for surface temperature studies in distinct macroclimate regions. Urban Clim. 2021, 37, 100823. [Google Scholar] [CrossRef]
- Lehnert, M.; Savić, S.; Milošević, D.; Dunjić, J.; Geletič, J. Mapping Local Climate Zones and Their Applications in European Urban Environments: A Systematic Literature Review and Future Development Trends. Isprs Int. J. Geo-Inf. 2021, 10, 260. [Google Scholar] [CrossRef]
- Bechtel, B.; Alexander, P.; Böhner, J.; Ching, J.; Conrad, O.; Feddema, J.; Mills, G.; See, L.; Stewart, I. Mapping Local Climate Zones for a Worldwide Database of the Form and Function of Cities. Isprs Int. J. Geo-Inf. 2015, 4, 199–219. [Google Scholar] [CrossRef] [Green Version]
- Leconte, F.; Bouyer, J.; Claverie, R.; Pétrissans, M. Using Local Climate Zone scheme for UHI assessment: Evaluation of the method using mobile measurements. Build. Environ. 2015, 83, 39–49. [Google Scholar] [CrossRef]
- Bechtel, B.; Daneke, C. Classification of Local Climate Zones Based on Multiple Earth Observation Data. IEEE J. Sel. Top. Appl. Earth Observ. Remote Sens. 2012, 5, 1191–1202. [Google Scholar] [CrossRef]
- Lelovics, E.; Unger, J.; Gál, T.; Gál, C.V. Designation of an urban monitoring network based on Local Climate Zone mapping and temperature pattern modelling. Clim. Res. 2014, 60, 51–62. [Google Scholar] [CrossRef]
- Skarbit, N.; Stewart, I.D.; Unger, J.; Gál, T. Employing an urban meteorological network to monitor air temperature conditions in the ‘local climate zones’ of Szeged, Hungary. Int. J. Climatol. 2017, 37, 582–596. [Google Scholar] [CrossRef] [Green Version]
- Geletič, J.; Lehnert, M.; Dobrovolný, P. Land Surface Temperature Differences within Local Climate Zones, Based on Two Central European Cities. Remote Sens. 2016, 8, 788. [Google Scholar] [CrossRef] [Green Version]
- Zheng, Y.; Ren, C.; Xu, Y.; Wang, R.; Ho, J.; Lau, K.; Ng, E. GIS-based mapping of Local Climate Zone in the high-density city of Hong Kong. Urban Clim. 2018, 24, 419–448. [Google Scholar] [CrossRef]
- Mushore, T.D.; Dube, T.; Manjowe, M.; Gumindoga, W.; Chemura, A.; Rousta, I.; Odindi, J.; Mutanga, O. Remotely sensed retrieval of Local Climate Zones and their linkages to land surface temperature in Harare metropolitan city, Zimbabwe. Urban Clim. 2019, 27, 259–271. [Google Scholar] [CrossRef]
- Zhou, X.; Okaze, T.; Ren, C.; Cai, M.; Ishida, Y.; Mochida, A. Mapping local climate zones for a Japanese large city by an extended workflow of WUDAPT Level 0 method. Urban Clim. 2020, 33, 100660. [Google Scholar] [CrossRef]
- Mouzourides, P.; Eleftheriou, A.; Kyprianou, A.; Ching, J.; Neophytou, M.K.A. Linking local-climate-zones mapping to multi-resolution-analysis to deduce associative relations at intra-urban scales through an example of Metropolitan London. Urban Clim. 2019, 30, 100505. [Google Scholar] [CrossRef]
- Danylo, O.; See, L.; Bechtel, B.; Schepaschenko, D.; Fritz, S. Contributing to WUDAPT: A Local Climate Zone Classification of Two Cities in Ukraine. IEEE J. Sel. Top. Appl. Earth Observ. Remote Sens. 2016, 9, 1841–1853. [Google Scholar] [CrossRef] [Green Version]
- Brousse, O.; Martilli, A.; Foley, M.; Mills, G.; Bechtel, B. WUDAPT, an efficient land use producing data tool for mesoscale models? Integration of urban LCZ in WRF over Madrid. Urban Clim. 2016, 17, 116–134. [Google Scholar] [CrossRef]
- Beck, C.; Straub, A.; Breitner, S.; Cyrys, J.; Philipp, A.; Rathmann, J.; Schneider, A.; Wolf, K.; Jacobeit, J. Air temperature characteristics of local climate zones in the Augsburg urban area (Bavaria, southern Germany) under varying synoptic conditions. Urban Clim. 2018, 25, 152–166. [Google Scholar] [CrossRef]
- Demuzere, M.; Bechtel, B.; Middel, A.; Mills, G. Mapping Europe into local climate zones. PLoS ONE 2019, 14, e214474. [Google Scholar] [CrossRef]
- Ren, C.; Cai, M.; Li, X.; Zhang, L.; Wang, R.; Xu, Y.; Ng, E. Assessment of Local Climate Zone Classification Maps of Cities in China and Feasible Refinements. Sci. Rep. 2019, 9, 18848. [Google Scholar] [CrossRef] [PubMed] [Green Version]
- Wang, R.; Ren, C.; Xu, Y.; Lau, K.K.; Shi, Y. Mapping the local climate zones of urban areas by GIS-based and WUDAPT methods: A case study of Hong Kong. Urban Clim. 2018, 24, 567–576. [Google Scholar] [CrossRef]
- Unger, J.; Lelovics, E.; Gál, T. Local Climate Zone mapping using GIS methods in Szeged. Hung. Geogr. Bull. 2014, 63, 29–41. [Google Scholar] [CrossRef] [Green Version]
- Geletič, J.; Lehnert, M. GIS-based delineation of local climate zones: The case of medium-sized Central European cities. Morav. Geogr. Rep. 2016, 24, 2–12. [Google Scholar] [CrossRef] [Green Version]
- Qiu, C.; Liebel, L.; Hughes, L.H.; Schmitt, M.; Korner, M.; Zhu, X.X. Multitask Learning for Human Settlement Extent Regression and Local Climate Zone Classification. IEEE Geosci. Remote Sens. Lett. 2022, 19, 3037246. [Google Scholar] [CrossRef]
- Ma, L.; Zhu, X.; Qiu, C.; Blaschke, T.; Li, M. Advances of Local Climate Zone Mapping and Its Practice Using Object-Based Image Analysis. Atmosphere 2021, 12, 1146. [Google Scholar] [CrossRef]
- Zhou, Y.; Wei, T.; Zhu, X.; Collin, M. A Parcel-Based Deep-Learning Classification to Map Local Climate Zones From Sentinel-2 Images. IEEE J. Sel. Top. Appl. Earth Observ. Remote Sens. 2021, 14, 4194–4204. [Google Scholar] [CrossRef]
- Chang, Y.; Xiao, J.; Li, X.; Middel, A.; Zhang, Y.; Gu, Z.; Wu, Y.; He, S. Exploring diurnal thermal variations in urban local climate zones with ECOSTRESS land surface temperature data. Remote Sens. Environ. 2021, 263, 112544. [Google Scholar] [CrossRef]
- Hu, J.; Ghamisi, P.; Zhu, X. Feature Extraction and Selection of Sentinel-1 Dual-Pol Data for Global-Scale Local Climate Zone Classification. Isprs Int. J. Geo-Inf. 2018, 7, 379. [Google Scholar] [CrossRef] [Green Version]
- Yoo, C.; Lee, Y.; Cho, D.; Im, J.; Han, D. Improving Local Climate Zone Classification Using Incomplete Building Data and Sentinel 2 Images Based on Convolutional Neural Networks. Remote Sens. 2020, 12, 3552. [Google Scholar] [CrossRef]
- Fan, H.; Zipf, A.; Fu, Q.; Neis, P. Quality assessment for building footprints data on OpenStreetMap. Int. J. Geogr. Inf.Sci. IJGIS 2014, 28, 700–719. [Google Scholar] [CrossRef]
- Fonte, C.C.; Lopes, P.; See, L.; Bechtel, B. Using OpenStreetMap (OSM) to enhance the classification of local climate zones in the framework of WUDAPT. Urban Clim. 2019, 28, 100456. [Google Scholar] [CrossRef]
- Chen, F.; Tsou, J.Y. DRSNet: Novel architecture for small patch and low-resolution remote sensing image scene classification. Int. J. Appl. Earth Obs. Geoinf. 2021, 104, 102577. [Google Scholar] [CrossRef]
- Zhang, G.; Ghamisi, P.; Zhu, X.X. Fusion of Heterogeneous Earth Observation Data for the Classification of Local Climate Zones. IEEE Trans. Geosci. Remote Sensing 2019, 57, 7623–7642. [Google Scholar] [CrossRef]
- Yoo, C.; Han, D.; Im, J.; Bechtel, B. Comparison between convolutional neural networks and random forest for local climate zone classification in mega urban areas using Landsat images. Isprs J. Photogramm. Remote Sens. 2019, 157, 155–170. [Google Scholar] [CrossRef]
- Rosentreter, J.; Hagensieker, R.; Waske, B. Towards large-scale mapping of local climate zones using multitemporal Sentinel 2 data and convolutional neural networks. Remote Sens. Environ. 2020, 237, 111472. [Google Scholar] [CrossRef]
- Cai, M.; Ren, C.; Xu, Y.; Lau, K.K.; Wang, R. Investigating the relationship between local climate zone and land surface temperature using an improved WUDAPT methodology—A case study of Yangtze River Delta, China. Urban Clim. 2018, 24, 485–502. [Google Scholar] [CrossRef]
- Cai, M.; Ren, C.; Xu, Y.; Dai, W.; Wang, X.M. Local Climate Zone Study for Sustainable Megacities Development by Using Improved WUDAPT Methodology—A Case Study in Guangzhou. Procedia Environ. Sci. 2016, 36, 82–89. [Google Scholar] [CrossRef] [Green Version]
- Perera, N.G.R.; Emmanuel, R. A “Local Climate Zone” based approach to urban planning in Colombo, Sri Lanka. Urban Clim. 2018, 23, 188–203. [Google Scholar] [CrossRef] [Green Version]
- Kotharkar, R.; Bagade, A. Local Climate Zone classification for Indian cities: A case study of Nagpur. Urban Clim. 2018, 24, 369–392. [Google Scholar] [CrossRef]
- Hidalgo, J.; Dumas, G.; Masson, V.; Petit, G.; Bechtel, B.; Bocher, E.; Foley, M.; Schoetter, R.; Mills, G. Comparison between local climate zones maps derived from administrative datasets and satellite observations. Urban Clim. 2019, 27, 64–89. [Google Scholar] [CrossRef] [Green Version]
- Demuzere, M.; Bechtel, B.; Mills, G. Global transferability of local climate zone models. Urban Clim. 2019, 27, 46–63. [Google Scholar] [CrossRef]
- Rodler, A.; Leduc, T. Local climate zone approach on local and micro scales: Dividing the urban open space. Urban Clim. 2019, 28, 100457. [Google Scholar] [CrossRef]
- Jin, L.; Pan, X.; Liu, L.; Liu, L.; Liu, J.; Gao, Y. Block-based local climate zone approach to urban climate maps using the UDC model. Build. Environ. 2020, 186, 107334. [Google Scholar] [CrossRef]
- Demuzere, M.; Kittner, J.; Bechtel, B. LCZ Generator: A Web Application to Create Local Climate Zone Maps. Front. Environ. Sci. 2021, 9, 637455. [Google Scholar] [CrossRef]
- Verdonck, M.; Okujeni, A.; van der Linden, S.; Demuzere, M.; De Wulf, R.; Van Coillie, F. Influence of neighbourhood information on ‘Local Climate Zone’ mapping in heterogeneous cities. Int. J. Appl. Earth Obs. Geoinf. 2017, 62, 102–113. [Google Scholar] [CrossRef]
- Quan, S.J.; Dutt, F.; Woodworth, E.; Yamagata, Y.; Yang, P.P. Local Climate Zone Mapping for Energy Resilience: A Fine-grained and 3D Approach. Energy Procedia 2017, 105, 3777–3783. [Google Scholar] [CrossRef]
- Hammerberg, K.; Brousse, O.; Martilli, A.; Mahdavi, A. Implications of employing detailed urban canopy parameters for mesoscale climate modelling: A comparison between WUDAPT and GIS databases over Vienna, Austria. Int. J. Climatol. 2018, 38, e1241–e1257. [Google Scholar] [CrossRef] [Green Version]
- Zhao, N.; Ma, A.; Zhong, Y.; Zhao, J.; Cao, L. Self-Training Classification Framework with Spatial-Contextual Information for Local Climate Zones. Remote Sens. 2019, 11, 2828. [Google Scholar] [CrossRef] [Green Version]
- He, S.; Zhang, Y.; Gu, Z.; Su, J. Local climate zone classification with different source data in Xi’an, China. Indoor Built Environ. 2018, 28, 1190–1199. [Google Scholar] [CrossRef]
- Bechtel, B.; See, L.; Mills, G.; Foley, M. Classification of Local Climate Zones Using SAR and Multispectral Data in an Arid Environment. IEEE J. Sel. Top. Appl. Earth Observ. Remote Sens. 2016, 9, 3097–3105. [Google Scholar] [CrossRef]
- Xu, Y.; Ren, C.; Cai, M.; Edward, N.Y.Y.; Wu, T. Classification of Local Climate Zones Using ASTER and Landsat Data for High-Density Cities. IEEE J. Sel. Top. Appl. Earth Observ. Remote Sens. 2017, 10, 3397–3405. [Google Scholar] [CrossRef]
- Kim, M.; Jeong, D.; Kim, Y. Local climate zone classification using a multi-scale, multi-level attention network. Isprs J. Photogramm. Remote Sens. 2021, 181, 345–366. [Google Scholar] [CrossRef]
- Quan, J. Enhanced geographic information system-based mapping of local climate zones in Beijing, China. Sci. China Technol. Sci. 2019, 62, 2243–2260. [Google Scholar] [CrossRef]
- Yu, Y.; Li, J.; Yuan, Q.; Shi, Q.; Shen, H.; Zhang, L. Coupling Dual Graph Convolution Network and Residual Network for Local Climate Zone Mapping. IEEE J. Sel. Top. Appl. Earth Observ. Remote Sens. 2022, 15, 1221–1234. [Google Scholar] [CrossRef]
- Shi, L.; Ling, F. Local Climate Zone Mapping Using Multi-Source Free Available Datasets on Google Earth Engine Platform. Land 2021, 10, 454. [Google Scholar] [CrossRef]
- Simanjuntak, R.M.; Kuffer, M.; Reckien, D. Object-based image analysis to map local climate zones: The case of Bandung, Indonesia. Appl. Geogr. 2019, 106, 108–121. [Google Scholar] [CrossRef]
- Wicki, A.; Parlow, E. Attribution of local climate zones using a multitemporal land use/land cover classification scheme. J. Appl. Remote Sens. 2017, 11, 26001. [Google Scholar] [CrossRef] [Green Version]
- Bartesaghi Koc, C.; Osmond, P.; Peters, A.; Irger, M. Understanding Land Surface Temperature Differences of Local Climate Zones Based on Airborne Remote Sensing Data. IEEE J. Sel. Top. Appl. Earth Observ. Remote Sens. 2018, 11, 2724–2730. [Google Scholar] [CrossRef]
- Xu, C.; Hystad, P.; Chen, R.; Van Den Hoek, J.; Hutchinson, R.A.; Hankey, S.; Kennedy, R. Application of training data affects success in broad-scale local climate zone mapping. Int. J. Appl. Earth Obs. Geoinf. 2021, 103, 102482. [Google Scholar] [CrossRef]
- Zhou, L.; Shao, Z.; Wang, S.; Huang, X. Deep learning-based local climate zone classification using Sentinel-1 SAR and Sentinel-2 multispectral imagery. Geo-Spat. Inf. Sci. 2022, 25, 383–398. [Google Scholar] [CrossRef]
- La, Y.; Bagan, H.; Yamagata, Y. Urban land cover mapping under the Local Climate Zone scheme using Sentinel-2 and PALSAR-2 data. Urban Clim. 2020, 33, 100661. [Google Scholar] [CrossRef]
- Yang, X.; Yao, L.; Jin, T.; Peng, L.L.H.; Jiang, Z.; Hu, Z.; Ye, Y. Assessing the thermal behavior of different local climate zones in the Nanjing metropolis, China. Build. Environ. 2018, 137, 171–184. [Google Scholar] [CrossRef]
- Yang, X.; Peng, L.L.H.; Chen, Y.; Yao, L.; Wang, Q. Air humidity characteristics of local climate zones: A three-year observational study in Nanjing. Build. Environ. 2020, 171, 106661. [Google Scholar] [CrossRef]
- Anjos, M.; Targino, A.C.; Krecl, P.; Oukawa, G.Y.; Braga, R.F. Analysis of the urban heat island under different synoptic patterns using local climate zones. Build. Environ. 2020, 185, 107268. [Google Scholar] [CrossRef]
- Núñez-Peiró, M.; Sánchez-Guevara Sánchez, C.; Neila González, F.J. Hourly evolution of intra-urban temperature variability across the local climate zones. The case of Madrid. Urban Clim. 2021, 39, 100921. [Google Scholar] [CrossRef]
- Dunjić, J.; Milošević, D.; Kojić, M.; Savić, S.; Lužanin, Z.; Aećerov, I.; Arsenović, D. Air Humidity Characteristics in “Local Climate Zones” of Novi Sad (Serbia) Based on Long-Term Data. Isprs Int. J. Geo-Inf. 2021, 10, 810. [Google Scholar] [CrossRef]
- Fenner, D.; Meier, F.; Bechtel, B.; Otto, M.; Scherer, D. Intra and inter ‘local climate zone’ variability of air temperature as observed by crowdsourced citizen weather stations in Berlin, Germany. Meteorol. Z. 2017, 26, 525–547. [Google Scholar] [CrossRef]
- Peters, J.; Van Poppel, M.; Theunis, J. Air quality mapping in urban environments using mobile measurements. Sens. A Chang. World 2012, 2012, 1–9. [Google Scholar]
- Leconte, F.; Bouyer, J.; Claverie, R. Nocturnal cooling in Local Climate Zone: Statistical approach using mobile measurements. Urban Clim. 2020, 33, 100629. [Google Scholar] [CrossRef]
- Wang, Z.; Xing, W.; Huang, Y.; Xie, T. Studying the Urban Heat Island Usinga Local Climate Zone Scheme. Pol. J. Environ. Stud. 2016, 25, 2609–2616. [Google Scholar] [CrossRef]
- Emery, J.; Pohl, B.; Crétat, J.; Richard, Y.; Pergaud, J.; Rega, M.; Zito, S.; Dudek, J.; Vairet, T.; Joly, D.; et al. How local climate zones influence urban air temperature: Measurements by bicycle in Dijon, France. Urban Clim. 2021, 40, 101017. [Google Scholar] [CrossRef]
- Shi, Y.; Lau, K.K.; Ren, C.; Ng, E. Evaluating the local climate zone classification in high-density heterogeneous urban environment using mobile measurement. Urban Clim. 2018, 25, 167–186. [Google Scholar] [CrossRef]
- Alexander, P.J.; Mills, G.; Fealy, R. Using LCZ data to run an urban energy balance model. Urban Clim. 2015, 13, 14–37. [Google Scholar] [CrossRef] [Green Version]
- Liu, L.; Liu, J.; Jin, L.; Liu, L.; Gao, Y.; Pan, X. Climate-conscious spatial morphology optimization strategy using a method combining local climate zone parameterization concept and urban canopy layer model. Build. Environ. 2020, 185, 107301. [Google Scholar] [CrossRef]
- Richard, Y.; Emery, J.; Dudek, J.; Pergaud, J.; Chateau-Smith, C.; Zito, S.; Rega, M.; Vairet, T.; Castel, T.; Thévenin, T.; et al. How relevant are local climate zones and urban climate zones for urban climate research? Dijon (France) as a case study. Urban Clim. 2018, 26, 258–274. [Google Scholar] [CrossRef] [Green Version]
- Mughal, M.O.; Li, X.X.; Yin, T.; Martilli, A.; Brousse, O.; Dissegna, M.A.; Norford, L.K. High-Resolution, Multilayer Modeling of Singapore’s Urban Climate Incorporating Local Climate Zones. Journal of Geophysical Research: Atmospheres 2019, 124, 7764–7785. [Google Scholar] [CrossRef]
- Mu, Q.; Miao, S.; Wang, Y.; Li, Y.; He, X.; Yan, C. Evaluation of employing local climate zone classification for mesoscale modelling over Beijing metropolitan area. Meteorol. Atmos. Phys. 2020, 132, 315–326. [Google Scholar] [CrossRef]
- Mughal, M.O.; Li, X.; Norford, L.K. Urban heat island mitigation in Singapore: Evaluation using WRF/multilayer urban canopy model and local climate zones. Urban Clim. 2020, 34, 100714. [Google Scholar] [CrossRef]
- Yi, C.; Kwon, H.; Yang, H. Spatial temperature differences in local climate zones of Seoul metropolitan area during a heatwave. Urban Clim. 2022, 41, 101012. [Google Scholar] [CrossRef]
- Aminipouri, M.; Rayner, D.; Lindberg, F.; Thorsson, S.; Knudby, A.J.; Zickfeld, K.; Middel, A.; Krayenhoff, E.S. Urban tree planting to maintain outdoor thermal comfort under climate change: The case of Vancouver’s local climate zones. Build. Environ. 2019, 158, 226–236. [Google Scholar] [CrossRef]
- Aminipouri, M.; Knudby, A.J.; Krayenhoff, E.S.; Zickfeld, K.; Middel, A. Modelling the impact of increased street tree cover on mean radiant temperature across Vancouver’s local climate zones. Urban For. Urban Green. 2019, 39, 9–17. [Google Scholar] [CrossRef]
- Pereira, C.T.; Masiero, É.; Bourscheidt, V. Socio-spatial inequality and its relationship to thermal (dis)comfort in two major Local Climate Zones in a tropical coastal city. Int. J. Biometeorol. 2021, 65, 1177–1187. [Google Scholar] [CrossRef] [PubMed]
- Geletič, J.; Lehnert, M.; Dobrovolný, P.; Žuvela-Aloise, M. Spatial modelling of summer climate indices based on local climate zones: Expected changes in the future climate of Brno, Czech Republic. Clim. Chang. 2019, 152, 487–502. [Google Scholar] [CrossRef]
- Geletič, J.; Lehnert, M.; Savić, S.; Milošević, D. Modelled spatiotemporal variability of outdoor thermal comfort in local climate zones of the city of Brno, Czech Republic. Sci. Total Environ. 2018, 624, 385–395. [Google Scholar] [CrossRef]
- Du, P.; Chen, J.; Bai, X.; Han, W. Understanding the seasonal variations of land surface temperature in Nanjing urban area based on local climate zone. Urban Clim. 2020, 33, 100657. [Google Scholar] [CrossRef]
- Pellegatti Franco, D.M.; Andrade, M.D.F.; Ynoue, R.Y.; Ching, J. Effect of Local Climate Zone (LCZ) classification on ozone chemical transport model simulations in Sao Paulo, Brazil. Urban Clim. 2019, 27, 293–313. [Google Scholar] [CrossRef]
- Daramola, M.T.; Balogun, I.A. Local climate zone classification of surface energy flux distribution within an urban area of a hot-humid tropical city. Urban Clim. 2019, 29, 100504. [Google Scholar] [CrossRef]
- Verdonck, M.; Demuzere, M.; Hooyberghs, H.; Beck, C.; Cyrys, J.; Schneider, A.; Dewulf, R.; Van Coillie, F. The potential of local climate zones maps as a heat stress assessment tool, supported by simulated air temperature data. Landsc. Urban Plan. 2018, 178, 183–197. [Google Scholar] [CrossRef]
- Arnfield, A.J. Two decades of urban climate research: A review of turbulence, exchanges of energy and water, and the urban heat island. Int. J. Climatol. 2003, 23, 1–26. [Google Scholar] [CrossRef]
- Li, X.; Zhou, Y.; Asrar, G.R.; Imhoff, M.; Li, X. The surface urban heat island response to urban expansion: A panel analysis for the conterminous United States. Sci. Total Environ. 2017, 605–606, 426–435. [Google Scholar] [CrossRef]
- Zhou, X.; Okaze, T.; Ren, C.; Cai, M.; Ishida, Y.; Watanabe, H.; Mochida, A. Evaluation of urban heat islands using local climate zones and the influence of sea-land breeze. Sust. Cities Soc. 2020, 55, 102060. [Google Scholar] [CrossRef]
- Alexander, P.; Mills, G. Local Climate Classification and Dublin’s Urban Heat Island. Atmosphere 2014, 5, 755–774. [Google Scholar] [CrossRef] [Green Version]
- Zhou, L.; Yuan, B.; Hu, F.; Wei, C.; Dang, X.; Sun, D. Understanding the effects of 2D/3D urban morphology on land surface temperature based on local climate zones. Build. Environ. 2022, 208, 108578. [Google Scholar] [CrossRef]
- Li, N.; Yang, J.; Qiao, Z.; Wang, Y.; Miao, S. Urban Thermal Characteristics of Local Climate Zones and Their Mitigation Measures across Cities in Different Climate Zones of China. Remote Sens. 2021, 13, 1468. [Google Scholar] [CrossRef]
- Středová, H.; Chuchma, F.; Rožnovský, J.; Středa, T. Local Climate Zones, Land Surface Temperature and Air Temperature Interactions: Case Study of Hradec Králové, the Czech Republic. Isprs Int. J. Geo-Inf. 2021, 10, 704. [Google Scholar] [CrossRef]
- Xu, M.; Hong, B.; Jiang, R.; An, L.; Zhang, T. Outdoor thermal comfort of shaded spaces in an urban park in the cold region of China. Build. Environ. 2019, 155, 408–420. [Google Scholar] [CrossRef]
- Mi, J.; Hong, B.; Zhang, T.; Huang, B.; Niu, J. Outdoor thermal benchmarks and their application to climate–responsive designs of residential open spaces in a cold region of China. Build. Environ. 2020, 169, 106592. [Google Scholar] [CrossRef]
- An, L.; Hong, B.; Cui, X.; Geng, Y.; Ma, X. Outdoor thermal comfort during winter in China’s cold regions: A comparative study. Sci. Total Environ. 2021, 768, 144464. [Google Scholar] [CrossRef]
- Niu, J.; Hong, B.; Geng, Y.; Mi, J.; He, J. Summertime physiological and thermal responses among activity levels in campus outdoor spaces in a humid subtropical city. Sci. Total Environ. 2020, 728, 138757. [Google Scholar] [CrossRef]
- Ma, X.; Tian, Y.; Du, M.; Hong, B.; Lin, B. How to design comfortable open spaces for the elderly? Implications of their thermal perceptions in an urban park. Sci. Total Environ. 2021, 768, 144985. [Google Scholar] [CrossRef]
- Huang, B.; Hong, B.; Tian, Y.; Yuan, T.; Su, M. Outdoor thermal benchmarks and thermal safety for children: A study in China’s cold region. Sci. Total Environ. 2021, 787, 147603. [Google Scholar] [CrossRef]
- Tian, Y.; Hong, B.; Zhang, Z.; Wu, S.; Yuan, T. Factors influencing resident and tourist outdoor thermal comfort: A comparative study in China’s cold region. Sci. Total Environ. 2022, 808, 152079. [Google Scholar] [CrossRef]
- He, X.; An, L.; Hong, B.; Huang, B.; Cui, X. Cross-cultural differences in thermal comfort in campus open spaces: A longitudinal field survey in China’s cold region. Build. Environ. 2020, 172, 106739. [Google Scholar] [CrossRef]
- Zhang, T.; Hong, B.; Su, X.; Li, Y.; Song, L. Effects of tree seasonal characteristics on thermal-visual perception and thermal comfort. Build. Environ. 2022, 212, 108793. [Google Scholar] [CrossRef]
- Zhang, T.; Su, M.; Hong, B.; Wang, C.; Li, K. Interaction of emotional regulation and outdoor thermal perception: A pilot study in a cold region of China. Build. Environ. 2021, 198, 107870. [Google Scholar] [CrossRef]
- Geng, Y.; Hong, B.; Du, M.; Yuan, T.; Wang, Y. Combined effects of visual-acoustic-thermal comfort in campus open spaces: A pilot study in China’s cold region. Build. Environ. 2022, 209, 108658. [Google Scholar] [CrossRef]
- Villadiego, K.; Velay-Dabat, M.A. Outdoor thermal comfort in a hot and humid climate of Colombia: A field study in Barranquilla. Build. Environ. 2014, 75, 142–152. [Google Scholar] [CrossRef]
- Lau, K.K.; Chung, S.C.; Ren, C. Outdoor thermal comfort in different urban settings of sub-tropical high-density cities: An approach of adopting local climate zone (LCZ) classification. Build. Environ. 2019, 154, 227–238. [Google Scholar] [CrossRef]
- Salal Rajan, E.H.; Amirtham, L.R. Impact of building regulations on the perceived outdoor thermal comfort in the mixed-use neighbourhood of Chennai. Front. Archit. Res. 2021, 10, 148–163. [Google Scholar] [CrossRef]
- Ren, J.; Yang, J.; Zhang, Y.; Xiao, X.; Xia, J.C.; Li, X.; Wang, S. Exploring thermal comfort of urban buildings based on local climate zones. J. Clean Prod. 2022, 340, 130744. [Google Scholar] [CrossRef]
- Liu, L.; Lin, Y.; Xiao, Y.; Xue, P.; Shi, L.; Chen, X.; Liu, J. Quantitative effects of urban spatial characteristics on outdoor thermal comfort based on the LCZ scheme. Build. Environ. 2018, 143, 443–460. [Google Scholar] [CrossRef]
- Unger, J.; Skarbit, N.; Gál, T. Evaluation of outdoor human thermal sensation of local climate zones based on long-term database. Int. J. Biometeorol. 2018, 62, 183–193. [Google Scholar] [CrossRef]
- Wu, J.; Liu, C.; Wang, H. Analysis of Spatio-temporal patterns and related factors of thermal comfort in subtropical coastal cities based on local climate zones. Build. Environ. 2022, 207, 108568. [Google Scholar] [CrossRef]
- Xu, L.; Cui, S.; Tang, J.; Nguyen, M.; Liu, J.; Zhao, Y. Assessing the adaptive capacity of urban form to climate stress: A case study on an urban heat island. Environ. Res. Lett. 2019, 14, 44013. [Google Scholar] [CrossRef]
- Ng, E.; Ren, C. China’s adaptation to climate & urban climatic changes: A critical review. Urban Clim. 2018, 23, 352–372. [Google Scholar] [CrossRef]
- Vandamme, S.; Demuzere, M.; Verdonck, M.; Zhang, Z.; Coillie, F.V. Revealing Kunming’s (China) Historical Urban Planning Policies Through Local Climate Zones. Remote Sens. 2019, 11, 1731. [Google Scholar] [CrossRef] [Green Version]
- Chen, X.; Xu, Y.; Yang, J.; Wu, Z.; Zhu, H. Remote sensing of urban thermal environments within local climate zones: A case study of two high-density subtropical Chinese cities. Urban Clim. 2020, 31, 100568. [Google Scholar] [CrossRef]
- Kotharkar, R.; Bagade, A. Evaluating urban heat island in the critical local climate zones of an Indian city. Landsc. Urban Plan. 2018, 169, 92–104. [Google Scholar] [CrossRef]
- Hoon Leh, O.L.; Ahmad, S.; Aiyub, K.; Mohd Jani, Y. Urban air environmental health indicators: A preliminary set for city of kuala lumpur. Plan. Malays. J. 2016, 9. [Google Scholar] [CrossRef] [Green Version]
- Ziaul, S.; Pal, S. Analyzing control of respiratory particulate matter on Land Surface Temperature in local climatic zones of English Bazar Municipality and Surroundings. Urban Clim. 2018, 24, 34–50. [Google Scholar] [CrossRef]
- Shi, Y.; Ren, C.; Lau, K.K.; Ng, E. Investigating the influence of urban land use and landscape pattern on PM2.5 spatial variation using mobile monitoring and WUDAPT. Landsc. Urban Plan. 2019, 189, 15–26. [Google Scholar] [CrossRef]
- Wu, Y.; Sharifi, A.; Yang, P.; Borjigin, H.; Murakami, D.; Yamagata, Y. Mapping building carbon emissions within local climate zones in Shanghai. Energy Procedia 2018, 152, 815–822. [Google Scholar] [CrossRef]
- Brousse, O.; Georganos, S.; Demuzere, M.; Vanhuysse, S.; Wouters, H.; Wolff, E.; Linard, C.; van Lipzig, N.P.M.; Dujardin, S. Using Local Climate Zones in Sub-Saharan Africa to tackle urban health issues. Urban Clim. 2019, 27, 227–242. [Google Scholar] [CrossRef] [Green Version]
- Brousse, O.; Georganos, S.; Demuzere, M.; Dujardin, S.; Lennert, M.; Linard, C.; Snow, R.W.; Thiery, W.; van Lipzig, N. Can we use local climate zones for predicting malaria prevalence across sub-Saharan African cities? Environ. Res. Lett. 2020, 15, 124051. [Google Scholar] [CrossRef]
- Zhao, Z.; Shen, L.; Li, L.; Wang, H.; He, B. Local Climate Zone Classification Scheme Can Also Indicate Local-Scale Urban Ventilation Performance: An Evidence-Based Study. Atmosphere 2020, 11, 776. [Google Scholar] [CrossRef]
- Kotharkar, R.; Ghosh, A.; Kapoor, S.; Reddy, D.G.K. Approach to local climate zone based energy consumption assessment in an Indian city. Energy Build. 2022, 259, 111835. [Google Scholar] [CrossRef]
- Yang, X.; Yao, L.; Peng, L.L.H.; Jiang, Z.; Jin, T.; Zhao, L. Evaluation of a diagnostic equation for the daily maximum urban heat island intensity and its application to building energy simulations. Energy Build. 2019, 193, 160–173. [Google Scholar] [CrossRef]


| Journal | Number | |
|---|---|---|
| 1 | Urban Climate | 43 |
| 2 | Building and Environment | 22 |
| 3 | Remote Sensing | 16 |
| 4 | IEEE Journal of Selected Topics in Applied Earth Observations and Remote Sensing | 10 |
| 5 | Sustainable Cities and Society | 9 |
| 6 | Sustainability | 7 |
| 7 | ISPRS Journal of Photogrammetry and Remote Sensing | 6 |
| 8 | International Journal of Applied Earth Observation and Geoinformation | 5 |
| 9 | Atmosphere | 5 |
| 10 | ISPRS International Journal of Geo Information | 3 |
| 11 | Climate Research | 3 |
| 12 | International Journal of Biometeorology | 3 |
| 13 | International Journal of Climatology | 3 |
| 14 | Journal of Geophysical Research Atmospheres | 3 |
| 15 | Landscape and Urban Planning | 3 |
| Title | Number | |
|---|---|---|
| 1 | Local climate zones for urban temperature studies [11] | 1441 |
| 2 | Impact of urban form and design on mid-afternoon microclimate in Phoenix Local Climate Zones [9] | 308 |
| 3 | Mapping local climate zones for a worldwide database of the form and function of cities [17] | 268 |
| 4 | Evaluation of the ‘local climate zone’ scheme using temperature observations and model simulations [10] | 265 |
| 5 | Using Local Climate Zone scheme for UHI assessment: Evaluation of the method using mobile measurements [18] | 133 |
| 6 | Classification of local climate zones based on multiple Earth observation data [19] | 127 |
| 7 | Local Climate Zone ventilation and urban land surface temperatures: Towards a performance-based and wind-sensitive planning proposal in megacities [8] | 122 |
| 8 | Design of an urban monitoring network based on Local Climate Zone mapping and temperature pattern modelling [20] | 91 |
| 9 | Employing an urban meteorological network to monitor air temperature conditions in the ‘local climate zones’ of Szeged, Hungary [21] | 83 |
| 10 | Land surface temperature differences within local climate zones, based on two central European cities [22] | 75 |
| Method | Articles | Study Site | LCZ Types |
|---|---|---|---|
| WUDAPT | [26] | London, England | All types |
| [25] | Sendai, Japan | LCZ 2, 24, 3, 42, 5, 6-10, A, B, D-G | |
| [27] | Kyiv and Lviv, Ukraine | All types | |
| [28] | Madrid, Spain | All types | |
| [29] | Bavaria, Germany | LCZ 2, 5, 6, 8, A, B, D, G, E | |
| [30] | 15 European cities | All types | |
| [31] | 20 individual cities and three major economic regions in China | All types | |
| GIS-based and WUDAPT | [32] | Hong Kong, China | All types |
| GIS-based | [23] | Hong Kong, China | LCZ 1-6, 9, A, C, D-G, W |
| [20] | Szeged, Hungary | LCZ 2, 3, 5, 6, 8, 9 | |
| [33] | Szeged, Hungary | Six built LCZ types | |
| [34] | Brno, Hradec Králové, and Olomouc, Czech Republic | LCZ 1-6, 8-10, A-G | |
| Earth observation (EO) datasets and classifiers seemed | [19] | Hamburg, Germany | All types |
| Sentinel-2 data | [35] | 13 cities across the world | All types |
| [36] | Munich and Berlin, Germany | All types | |
| [37] | Shenzhen, China | All types | |
| ECOSTRESS data | [38] | Xi’an, China | LCZ 1-6, B |
| Sentinel-1 Dual-Pol data | [39] | 29 cities across the world | All types |
| Method | Articles | Study Site | Improved |
|---|---|---|---|
| WUDAPT | [30] | 24 cities in Europe | Presents two strategies to expand LCZ coverage rapidly |
| [35] | 13 cities around the world | Proposes a multi-task learning (MTL) framework and develops an end-to-end convolutional neural network (CNN) | |
| [42] | Hamburg, Germany | WUDAPT + OpenStreetMap (OSM) | |
| [52] | 15 cities that cross a series of climates | Google Earth Engine (EE) is a viable alternative approach compared to WUDAPT method | |
| [53] | New York, USA Nantes, France | The Delaunay triangulation versus a skeletonization | |
| [54] | Guangzhou, China | A block-based LCZs classification | |
| [55] | St. Petersburg, Russia Bamako, Mali Havana, Cuba | Simplified WUDAPT (the LCZ Generator described here further simplifies this process) | |
| [56] | Three cities in Belgium: Antwerp, Brussels, and Ghent | Due to the high degree of heterogeneity, neighborhood information on the LCZ mapping overcomes the difficulties of the WUDAPT community | |
| [57] | Manhattan, New York, USA; Atlanta, USA; Tokyo, Japan; | A fine-grained and 3D approach | |
| [58] | Vienna, Austria | GIS-based and WUDAPT | |
| [59] | Berlin, Germany; São Paulo, Brazil; Paris, France | A self-training classification framework (SCSF) based on spatial context information is proposed to address the lack of a unified framework for classification and spatial smoothing | |
| [60] | Xi’an, China | This method couples the World Urban Database and Access Portal Tools method | |
| [61] | Khartoum, Sudan | The methodology uses synthetic aperture radar (SAR) data | |
| [62] | Guangzhou and Wuhan, China | Combining Landsat and ASTER data to improve the LCZ mapping results | |
| Others | [40] | Berlin, Germany; Seoul, South Korea | Provides novel methods using S2 images and incomplete building data based on a CNN classifier to classify LCZ |
| [44] | 11 cities around the world | This paper uses OpenStreetMap (OSM) data and multi-temporal, multispectral satellite images for the classification of LCZs | |
| [46] | Eight German cities | Proposes a workflow to generate LCZs using multi-temporal Sentinel-2 (S2) composites and supervised CNNs | |
| [48] | Guangzhou, China | Simplified LCZ method | |
| [49] | Colombo, Sri Lanka | Simplified LCZ method | |
| [50] | Nagpur, India | “Reduction-based GIS method” and “algorithm-based remote sensing” approach | |
| [51] | Nantes, Toulouse, and Paris, France | This paper uses GIS using administrative and 2.5 D building databases to generate the LCZs | |
| [53] | New York, USA; Nantes, France | Tries to translate this classification to a fine-grained level of detail | |
| [63] | Busan, Daegu, Daejeon, Gwangju, Incheon, and Seoul, South Korea | The study uses a multi-scale, multi-level attention network (MSMLA-Net) for LCZ classification | |
| [64] | Beijing, China | This paper proposes an enhanced GIS-based workflow to enable the hierarchical classification of LCZs with fewer indicators, but higher accuracies | |
| [65] | Wuhan, China | This paper combines neural networks and two graph convolutional networks (GCNs) into and directly using original image-generated LCZs | |
| [66] | Wuhan, China | This paper uses multi-source-generated LCZs | |
| [67] | Bandung, Indonesia | The result shows that the object-based image analysis (OBIA) provides higher accuracy in LCZ | |
| [68] | Basel, Switzerland | A method is proposed to bridge the gap between the classical land use/land cover (LULC) classification and the LCZ scheme | |
| [69] | Sydney, Australia | Examines the quality of the classification by analyzing the LST variability between LCZs using high-resolution airborne remote sensing data | |
| [70] | Eight metropolitan areas in the USA | Random forests and ResNets are applied for LCZ classification | |
| [71] | Beijing, Tianjin, and Wuhan, China | Uses freely available Sentinel-1 SAR and Sentinel-2 multispectral imagery to generated LCZs | |
| [72] | Shanghai, China | Provides a promising option for LCZ mapping |
| City | Articles | Mobile Measurements | Equipment |
|---|---|---|---|
| Nancy (France) | [18] | Instrumented vehicle | PT100 probe |
| Nancy (France) | [80] | Instrumented vehicle | PT100 probe |
| Chongqing (China) | [81] | / | / |
| Dijon (Eastern France) | [82] | Cargo bike | HOBO U23 v2 sensor located in an M-RSA solar radiation shield and attached to a data logger |
| Hong Kong (China) | [83] | Light-colored Toyota bB mini MPV vehicle | TESTO™ 480 Thermometers Garmin™ GPS Map 62 s Handheld Navigator Wide-angle video camera |
| Models | Number of Studies | Articles |
|---|---|---|
| Weather Research and Forecasting Model (WRF) | 4 | [86,87,88,89] |
| Solar and LongWave Environmental Irradiance Geometry-model (SOLWEIG) | 4 | [90,91,92,93] |
| MUKLIMO | 2 | [94,95] |
| Three-dimensional Microclimate Model | 1 | [9] |
| Urban energy Balance Calculation Model (UDC model) | 1 | [54] |
| SUEWS | 1 | [84]. |
| Urban Canopy Layer (UCL) Model | 1 | [85] |
| Digital Surface Model (DSM) and normalized Digital Surface Model (nDSM) | 1 | [96] |
| Ozone Chemical Transport Model | 1 | [97] |
| Surface Energy Balance over Land (SEBAL) model | 1 | [98] |
| UrbClim model | 1 | [99] |
| Method | Articles | Type | City, Country | LCZ Types | Thermal Comfort Index |
|---|---|---|---|---|---|
| Simulation | [91] | SOLWEIG | Vancouver, Canada | 6 LCZs | Tmrt |
| [93] | LongWave Environmental Irradiance Geometry (SOLWEIG) | Brazil | LCZ 1 and 3 | Mean Radiant Temperature (Tmrt) | |
| [95] | MUKLIMO_3 urban climate model | Brno, Czech Republic | LCZ 2-10, A-E, G | HUMIDEX | |
| [120] | ENVI-met | Chennai, India | LCZ 2. 3. 5. 6 | Physiological Equivalent Temperature (PET) | |
| [121] | ENVI-met | Zhengzhou, China | All types | Predicted Mean Vote (PMV) | |
| [124] | BioKlima 2.6 model | Shenzhen, China | 11 LCZ samples | Universal Thermal Climate Index (UTCI) | |
| Questionnaire | [118] | Seven-point ASHRAE scale | Barranquilla, Colombia | 5 LCZs | Mean Thermal Sensation Votes (MTSV) |
| [119] | Seven-point ASHRAE scale | Hong Kong, China | LCZ 1-6, LCZ D, E | PET | |
| [122] | Seven-point ASHRAE scale | Shenzhen, China | 9 LCZs | PET, OUT-SET* and UTCI | |
| Weather station | [123] | Hungarian Meteorological Service (HMS) | Szeged, Hungary | 6 LCZs | PET |
Publisher’s Note: MDPI stays neutral with regard to jurisdictional claims in published maps and institutional affiliations. |
© 2022 by the authors. Licensee MDPI, Basel, Switzerland. This article is an open access article distributed under the terms and conditions of the Creative Commons Attribution (CC BY) license (https://creativecommons.org/licenses/by/4.0/).
Share and Cite
Feng, W.; Liu, J. A Literature Survey of Local Climate Zone Classification: Status, Application, and Prospect. Buildings 2022, 12, 1693. https://doi.org/10.3390/buildings12101693
Feng W, Liu J. A Literature Survey of Local Climate Zone Classification: Status, Application, and Prospect. Buildings. 2022; 12(10):1693. https://doi.org/10.3390/buildings12101693
Chicago/Turabian StyleFeng, Wenyun, and Jianjun Liu. 2022. "A Literature Survey of Local Climate Zone Classification: Status, Application, and Prospect" Buildings 12, no. 10: 1693. https://doi.org/10.3390/buildings12101693