Article

Mechanical Property Model of Q620 High-Strength Steel with Corrosion Effects

1
School of Civil Engineering, Chongqing University, Chongqing 400045, China
2
School of Management Science and Real Estate, Chongqing University, Chongqing 400045, China
*
Author to whom correspondence should be addressed.
Buildings 2022, 12(10), 1651; https://doi.org/10.3390/buildings12101651
Submission received: 31 August 2022 / Revised: 20 September 2022 / Accepted: 22 September 2022 / Published: 11 October 2022
(This article belongs to the Special Issue Recent Advances in Constructional Steel Research)

Abstract

:
High-strength steel (HSS) is widely used in engineering structures, due to its superior material performance, but corrosion tends to occur in steel structures with time. The corrosion effects on mechanical performance of Q620 HSS were investigated experimentally. The electrochemical accelerated corrosion test was conducted to generate corroded Q620 HSS specimens (ρ = 0~60%). With increases in the corrosion degree, corrosion performance became more and more non-uniform. The tensile coupon test was conducted to clarify mechanical properties of corroded Q620 HSS specimens. With increases in corrosion degree, fy, fu, εu and E decreased, correspondingly. The effect of corrosion on εy could be ignored. With the deepening of corrosion, the necking of Q620 HSS specimens was weakened, which reduced their ductility. The simplified constitutive model consisting of nominal yield point (εy, fy) and ultimate point (εu, fu) was proposed to quantify the mechanical properties of Q620 HSS with different corrosion degrees. After the numerical fitting, relationships between the corrosion degree and mechanical properties were clarified. Based on the results of numerical fitting, mechanical properties of corroded Q620 HSS specimens were worse than those of specimens with idealized uniform corrosion. The adverse effect of corrosion on εuc was more obvious than that on strength properties. Comparison among different mild steels and HSSs was performed. Different indexes were chosen to clarify corrosion effects on the ductility of corroded Q620 HSS specimens. This study considers and discusses the research on corrosion rates, the relationships between service time, service environment, corrosion form and strength properties of Q620 HSS.

1. Introduction

With progress in the processing technology of steel, the structural steel with excellent mechanical properties, such as high strength, high toughness and good weldability, is produced [1,2]. For the high-strength steel (HSS), the yield and ultimate strength are better than those of mild steel [3]. For the elastic modulus, there is barely a difference between HSS and mild steel [4,5]. For mild steel, it should be noted that there is an obvious yield plateau in the stress–strain curve. However, no yield plateau is recognized in the stress–strain curve of the HSS. Furthermore, compared with mild steel, HSS performs a poorer ductile property. Even though there are some disadvantages with HSS, the wide application of HSS has been seen in the structures recently, because of its superior material performance [4,5,6,7]. The HSS has become one of the research hotspots in engineering, and much research has been conducted to investigate the resistant property of HSS components, such as beams, columns and plate girders [5,8,9,10].
For steel structures, the corrosion issue is hard to avoid during their service life [11]. In the corrosive environment such as the marine and coastal environment, the corrosion issue is prone to occur in steel components because of the high humidity and chloride [12,13,14,15,16,17]. Some high–performance reinforcing and structural steels were suggested to reduce adverse effects from corrosion [18,19,20]. However, the price of these high–performance reinforcing and structural steels was relatively high [21]. No practical design method was proposed, and these issues limited its engineering application. A paint coating is commonly used to prevent the steel component from corrosive factors [22,23,24]. However, after a period of service, the paint coating usually fails because of aging and spalling. After that, serious corrosion issues occur in steel structures, which reduce the mechanical properties of the structural steel [25]. For the steel component, the effective cross-sectional area will be reduced because of the corrosion issue. The resistant property of the component is weakened, correspondingly [26,27,28]. Besides this, corrosion results in a stress concentration, which reduces ductility of the steel component. Furthermore, the failure characteristics of the component with the corrosion issue might be different from those of the component without the corrosion issue [29,30,31]. Blikharskyy et al. [32] studied the fatigue properties of rebars with corrosion experimentally, which indicated that the corrosion had significant effects on the fatigue damage. Lipiński performed an experiment on 1.0721 steel corroded in in 20% NaCl [33]. Taylor et al. introduced the [34] corrosion mechanisms and models.
Based on the above statement, the adverse effect of the corrosion issue on engineering structures should not be ignored. Many researchers have conducted investigations on the adverse effect of the corrosion issue on the resistance of steel components [35,36,37]. The decreases in resistant properties were quantified through the experiment, numerical simulation and theoretical analysis. However, existing studies were mostly based on mild steel components [26,27,38,39,40,41]. The investigation of the adverse effect of the corrosion issue on HSS is relatively limited [42]. It should be noted that compared with that of the stainless steel and weathering steel, the corrosion resistant property of HSS is comparatively low [11,43,44]. Considering that the ductility of the HSS is poorer than that of mild steel, the negative effect of the corrosion issue on HSS mechanical properties might be more significant than that on mild steel mechanical properties. Furthermore, because of the higher strength properties, the use of the HSS usually results in reduction in the cross-sectional area of the component. The corrosion rate is quantified through the corrosion depth per unit time. Therefore, with the same corrosion depth, the effect of corrosion on the HSS component is more serious than that on a mild steel component, when the service time is the same. In this regard, when the service time is the same, corrosion effect on the component with thin-walled steel plate is more severe than that on the component with normal thickness steel plate. The effect of corrosion on mechanical properties of structural steel is important to clarify the effect of corrosion on resistance of the steel component. Hence, it is meaningful to study the mechanical performance of the corroded HSS through the tensile coupon test.
The Q620 HSS developed in the Chinese market was selected to perform the experimental research on mechanical properties of corroded HSS. The electrochemical accelerated corrosion test was the most commonly used method to obtain the corroded test specimens [30,42,44,45,46], and it was also selected for this study. Then, the tensile coupon test was performed to investigate the adverse effects of corrosion on mechanical properties of the Q620 HSS. Based on the test results, a simplified constitutive model was proposed, which quantified the relationship between corrosion degree and mechanical properties. To clarify the mechanical performance of corroded Q620 HSS comprehensively, the comparison among mild steels and HSSs was conducted. Different indexes were introduced to clarify the influence of corrosion on ductility of the Q620 HSS. Considering the investigations on corrosion rate, the relationships between service time, service environment, corrosion form and strength properties of Q620 HSS were discussed.

2. Materials and Methods
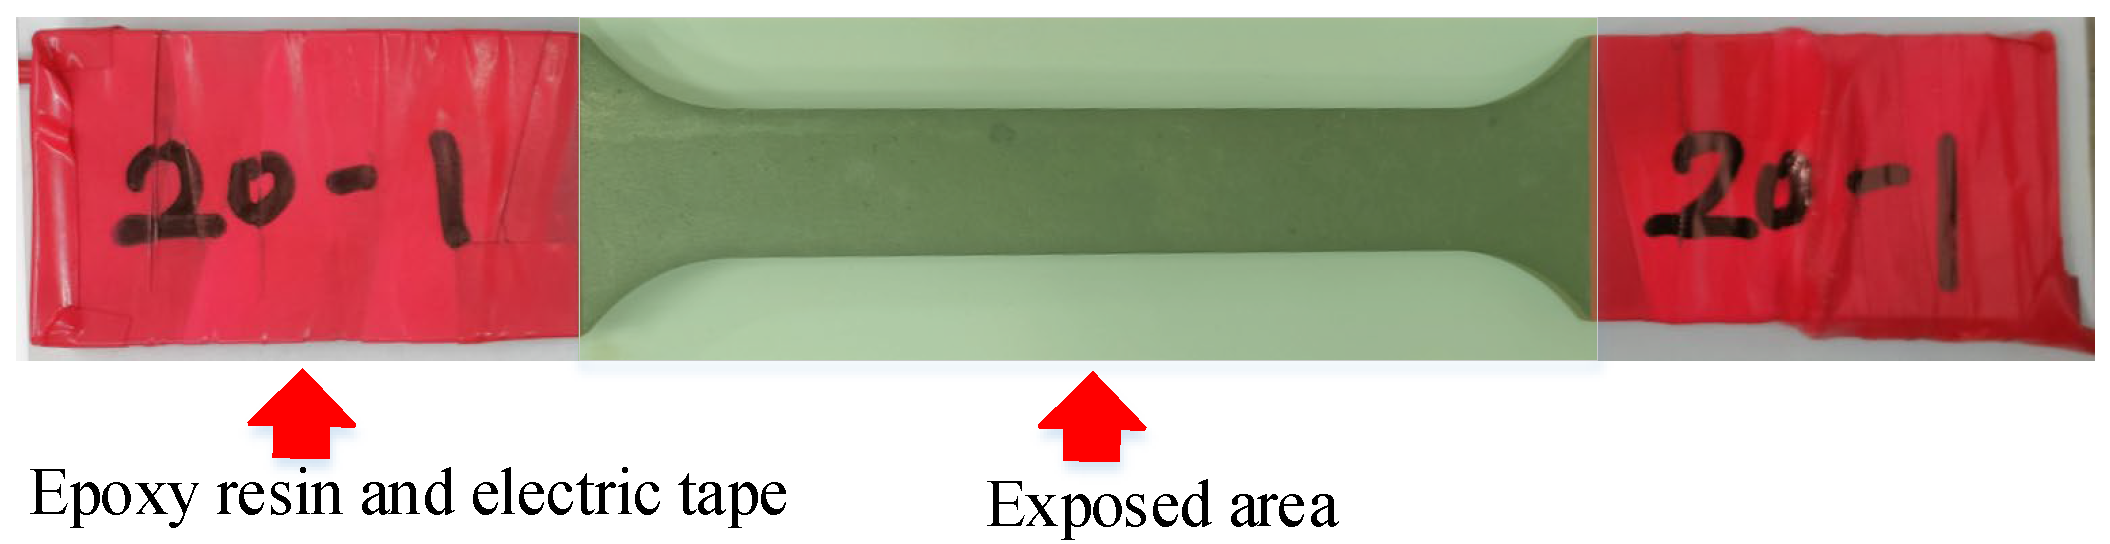
2.1. Test Specimen

The Q620 HSS has been widely used in the engineering structures, whose nominal yield strength should not be less than 620 MPa. The chemical composition of the Q620 HSS was listed in Table 1. Based on requirements in GB/T 228.1-2010 [47], the geometrical dimensions of the tensile coupon test specimen were determined (see Figure 1). Q620 HSS specimens were cut in the longitudinal direction of a Q620 HSS sheet of 5 mm thickness. The electrochemical accelerated corrosion test was conducted to have corroded Q620 HSS specimens. To avoid the corrosion in the ends of the Q620 HSS specimen, the epoxy resin and electric tape were used to separate the ends of the specimen from electrolyte solution (see Figure 2). To quantify corrosion degree, the mass loss ratio ρ = (m0mc)/me0 was selected, where the m0 denoted the original mass of the Q620 HSS specimen without corrosion, the mc denoted the mass of the corroded Q620 HSS specimen and the me0 denoted the original mass of the exposed area. Before the electrochemical accelerated corrosion test, each Q620 HSS specimen was treated to remove the mill scale and corrosion product on the surface. Then, the original mass of each Q620 HSS specimen was obtained through an electronic balance with an accuracy of 0.1 g. For the existing studies [42,48], the mass loss ratio of the corroded specimens was comparatively low (20%). With increases in corrosion degree, the corrosion weakening effect might become more and more non-uniform, which resulted in the more significant effect on the mechanical properties of structural steel. Therefore, it is meaningful and necessary to investigate the mechanical properties of HSS with large corrosion degrees. In this section, Q620 HSS specimens with comparatively large corrosion degrees (30~60%) were considered in the experimental investigation to fill the gap of existing researches. Q620 HSS specimens with ρ = 0%, 5%, 10%, 15%, 20%, 25%, 30%, 40%, 50% and 60% were included in this experiment. Considering the uncertainty of corrosion test, three test specimens were prepared for each predetermined corrosion degree.

2.2. Electrochemical Accelerated Corrosion Test Procedure

After the preparation of Q620 HSS specimens, the accelerated corrosion test setup was built up (Figure 3). The conductor was used to complete the circuit. Test specimens and carbon plate were linked to the positive and negative terminals of the external power supply, separately. To build the current loop, the NaCl solution with 5% mass fraction was selected, whose pH was 7.2. Test specimens and carbon plates were placed in the tank filled with the 5% NaCl solution. It is worth noting that the electrochemical accelerated corrosion test was selected by many researchers [42,44,49]. The direct electric current was impressed on Q620 HSS specimens to accelerate the corrosion. The duration of the electrochemical accelerated corrosion test was calculated through the Faraday’s law (see Equation (1)), where ∆m denoted the mass loss of the corrosion, M denoted the molar mass of the iron (i.e., 56 g/mol), T denoted the duration time of the corrosion test, z denoted the valency of the iron element (i.e., 2) and F denoted the Faraday constant (i.e., 96,500 C/mol). The I denoted magnitude of the electric current determined by the Equation (2), where i denoted the current density and S denoted the exposed surface area of the Q620 HSS specimen. When the above corrosion test was over, the electricity supply was cut off and test specimens were removed from the tank. Before the tensile coupon test, specimens were cleaned based on requirements in the code [50], as shown in Figure 4.
Δ m = M I T / z F
I = i · S

2.3. Tensile Coupon Test Procedure

After the electrochemical accelerated corrosion test, the tensile coupon test was conducted to investigate the mechanical properties of corroded Q620 HSS specimens, as shown in Figure 5. The MTS 809 testing system was used to perform the tensile coupon test, which was produced by MTS Systems Corporation (Eden Prairie, MN, USA) in 02/2018. A total amount of 30 Q620 HSS specimens were tested in this study. It should be noted that the tensile coupon test was conducted based on the relevant regulations in the GB/T 228.1-2010 [47]. The monotonic load was applied on Q620 HSS specimens until the failure. The extensometer was selected to measure the displacement of the Q620 HSS specimen during the tensile test, whose gauge distance was 100 mm. The loading was controlled by the displacement, whose rate was 1 mm/min. During the tensile coupon test, the load vs. displacement curve from the extensometer was recorded by the control system.

3. Results

3.1. Corrosion Test Result

After the above corrosion test and the cleaning treatment, the mass of each corroded Q620 HSS specimen was obtained through the aforementioned electronic balance. After that, corrosion degrees of test specimens were obtained (see Table 2). There were some errors between the real corrosion degree and the predetermined corrosion degree. The above errors might be caused by uncertainties of the electrochemical accelerated corrosion test. The errors were comparatively small compared with the predetermined corrosion degree. Therefore, the electrochemical accelerated corrosion test conducted in this study could be used to obtain corroded Q620 HSS specimens effectively. The corrosion performances of test specimens were recorded (see Figure 6). When the corrosion degree was comparatively low (5~20%), the reductions caused by corrosion kept almost the same along the length, which indicated that the corrosion was relatively uniform. No clear weak area was observed in the middle portion of Q620 HSS specimens. However, with increases in corrosion degree, the reductions caused by corrosion became more and more non-uniform, correspondingly.

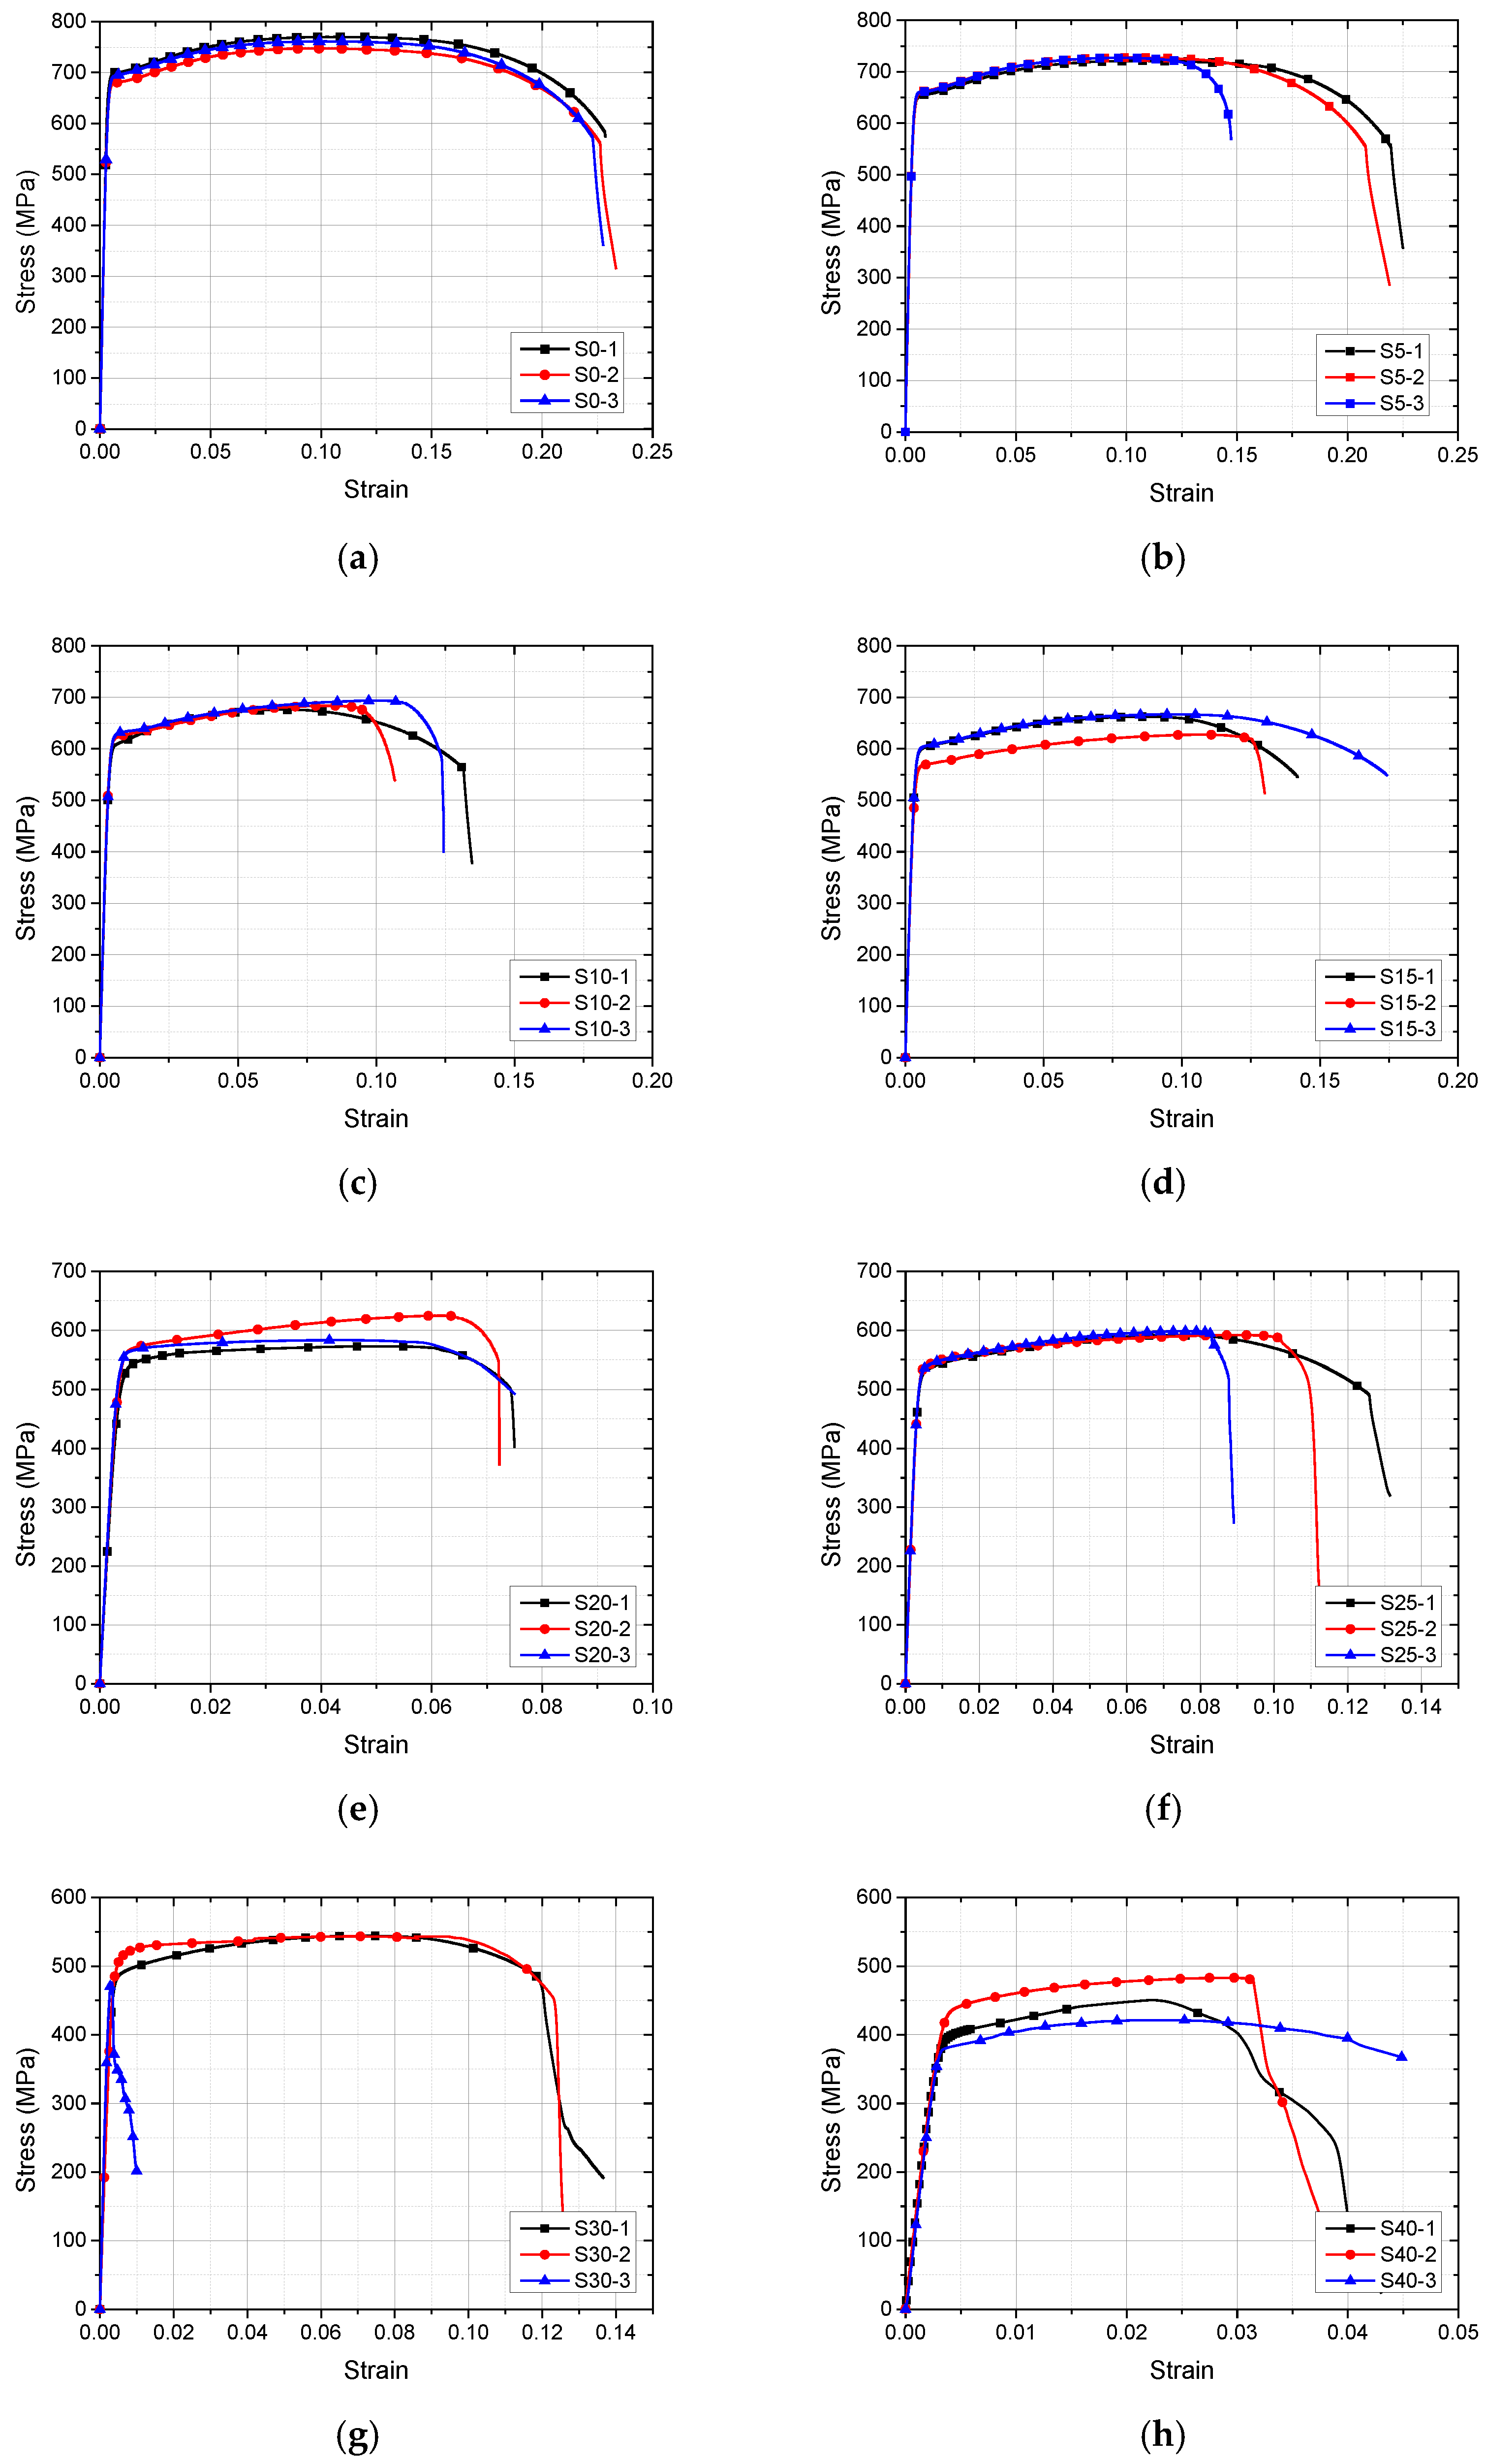
3.2. Stress–Strain Property

The stress–strain properties of Q620 HSS specimens with different corrosion degrees were discussed in this section. After the above tensile test, the load L and displacement D results of the Q620 HSS specimens with different corrosion degrees were obtained. The cross area of the Q620 HSS specimen without corrosion, A0, was selected to calculate the nominal stress σ through σ = L/A0. Considering that the gauge distance of the extensometer is 100 mm, the nominal strain ε was calculated through ε = D/100. Therefore, stress–strain curves of corroded Q620 HSS specimens were introduced in Figure 7. Based on test results of specimens without corrosion, there was no yield plateau in the stress–strain curve. After the elastic segment, the stress–strain curve entered the strain-hardening segment directly. Considering the comparison shown in Figure 8, it is clear to see that with the increase in ρ, strength and ductile properties of Q620 HSS were weakened, gradually. To investigate the strength property of corroded Q620 HSS accurately, the yield and ultimate strength were selected. Considering the feature of the stress–strain curve of Q690 HSS, it should be noted that stress corresponding to the 0.2% residual strain was considered to be the yield strength fy and the corresponding strain was considered to be the yield strain εy. The above definition of mechanical properties of materials without a yield plateau was accepted by many researchers [51,52,53]. The effective cross area Ae was determined by Ae = A0/(1 − ρ). The effective yield strength fye and effective ultimate strength fue were calculated, correspondingly. The test results of nominal yield strength fy, nominal ultimate strength fu, effective yield strength fye, and effective ultimate strength fue are shown in Table 2 and Figure 9. It should be noted that the tensile coupon test of the S30-3 Q690 HSS specimen failed, because the non-uniform corrosion was concentrated in the area outside the middle portion of the specimen. When the corrosion degree was comparatively low (0~40%), the fye and fue remained almost unchanged. When the corrosion degree was larger than 40%, clear decreases in the fye and fue were observed, which might be caused by the inhomogeneity of the corrosion. The fy and fu were negatively related to corrosion degree, as shown in Figure 8 and Figure 9. There were clear differences between effective and nominal strength properties. The elastic modulus E was negatively related to the corrosion degree. The ultimate strain, εu, decreased with the increase in corrosion degree. Therefore, the corrosion had an adverse effect on the ductile property of Q620 HSS specimens. Furthermore, effects of corrosion on dimensionless stress and strain properties are shown in Figure 10, where the dimensionless property was the ratio between the stress (strain) property with corrosion to the mean value of stress (strain) property without corrosion. Results showed that with an increment in corrosion, the dimensionless ratios of fy, fu and εu decreased significantly. The effects of corrosion on dimensionless ratio of εy could be ignored.

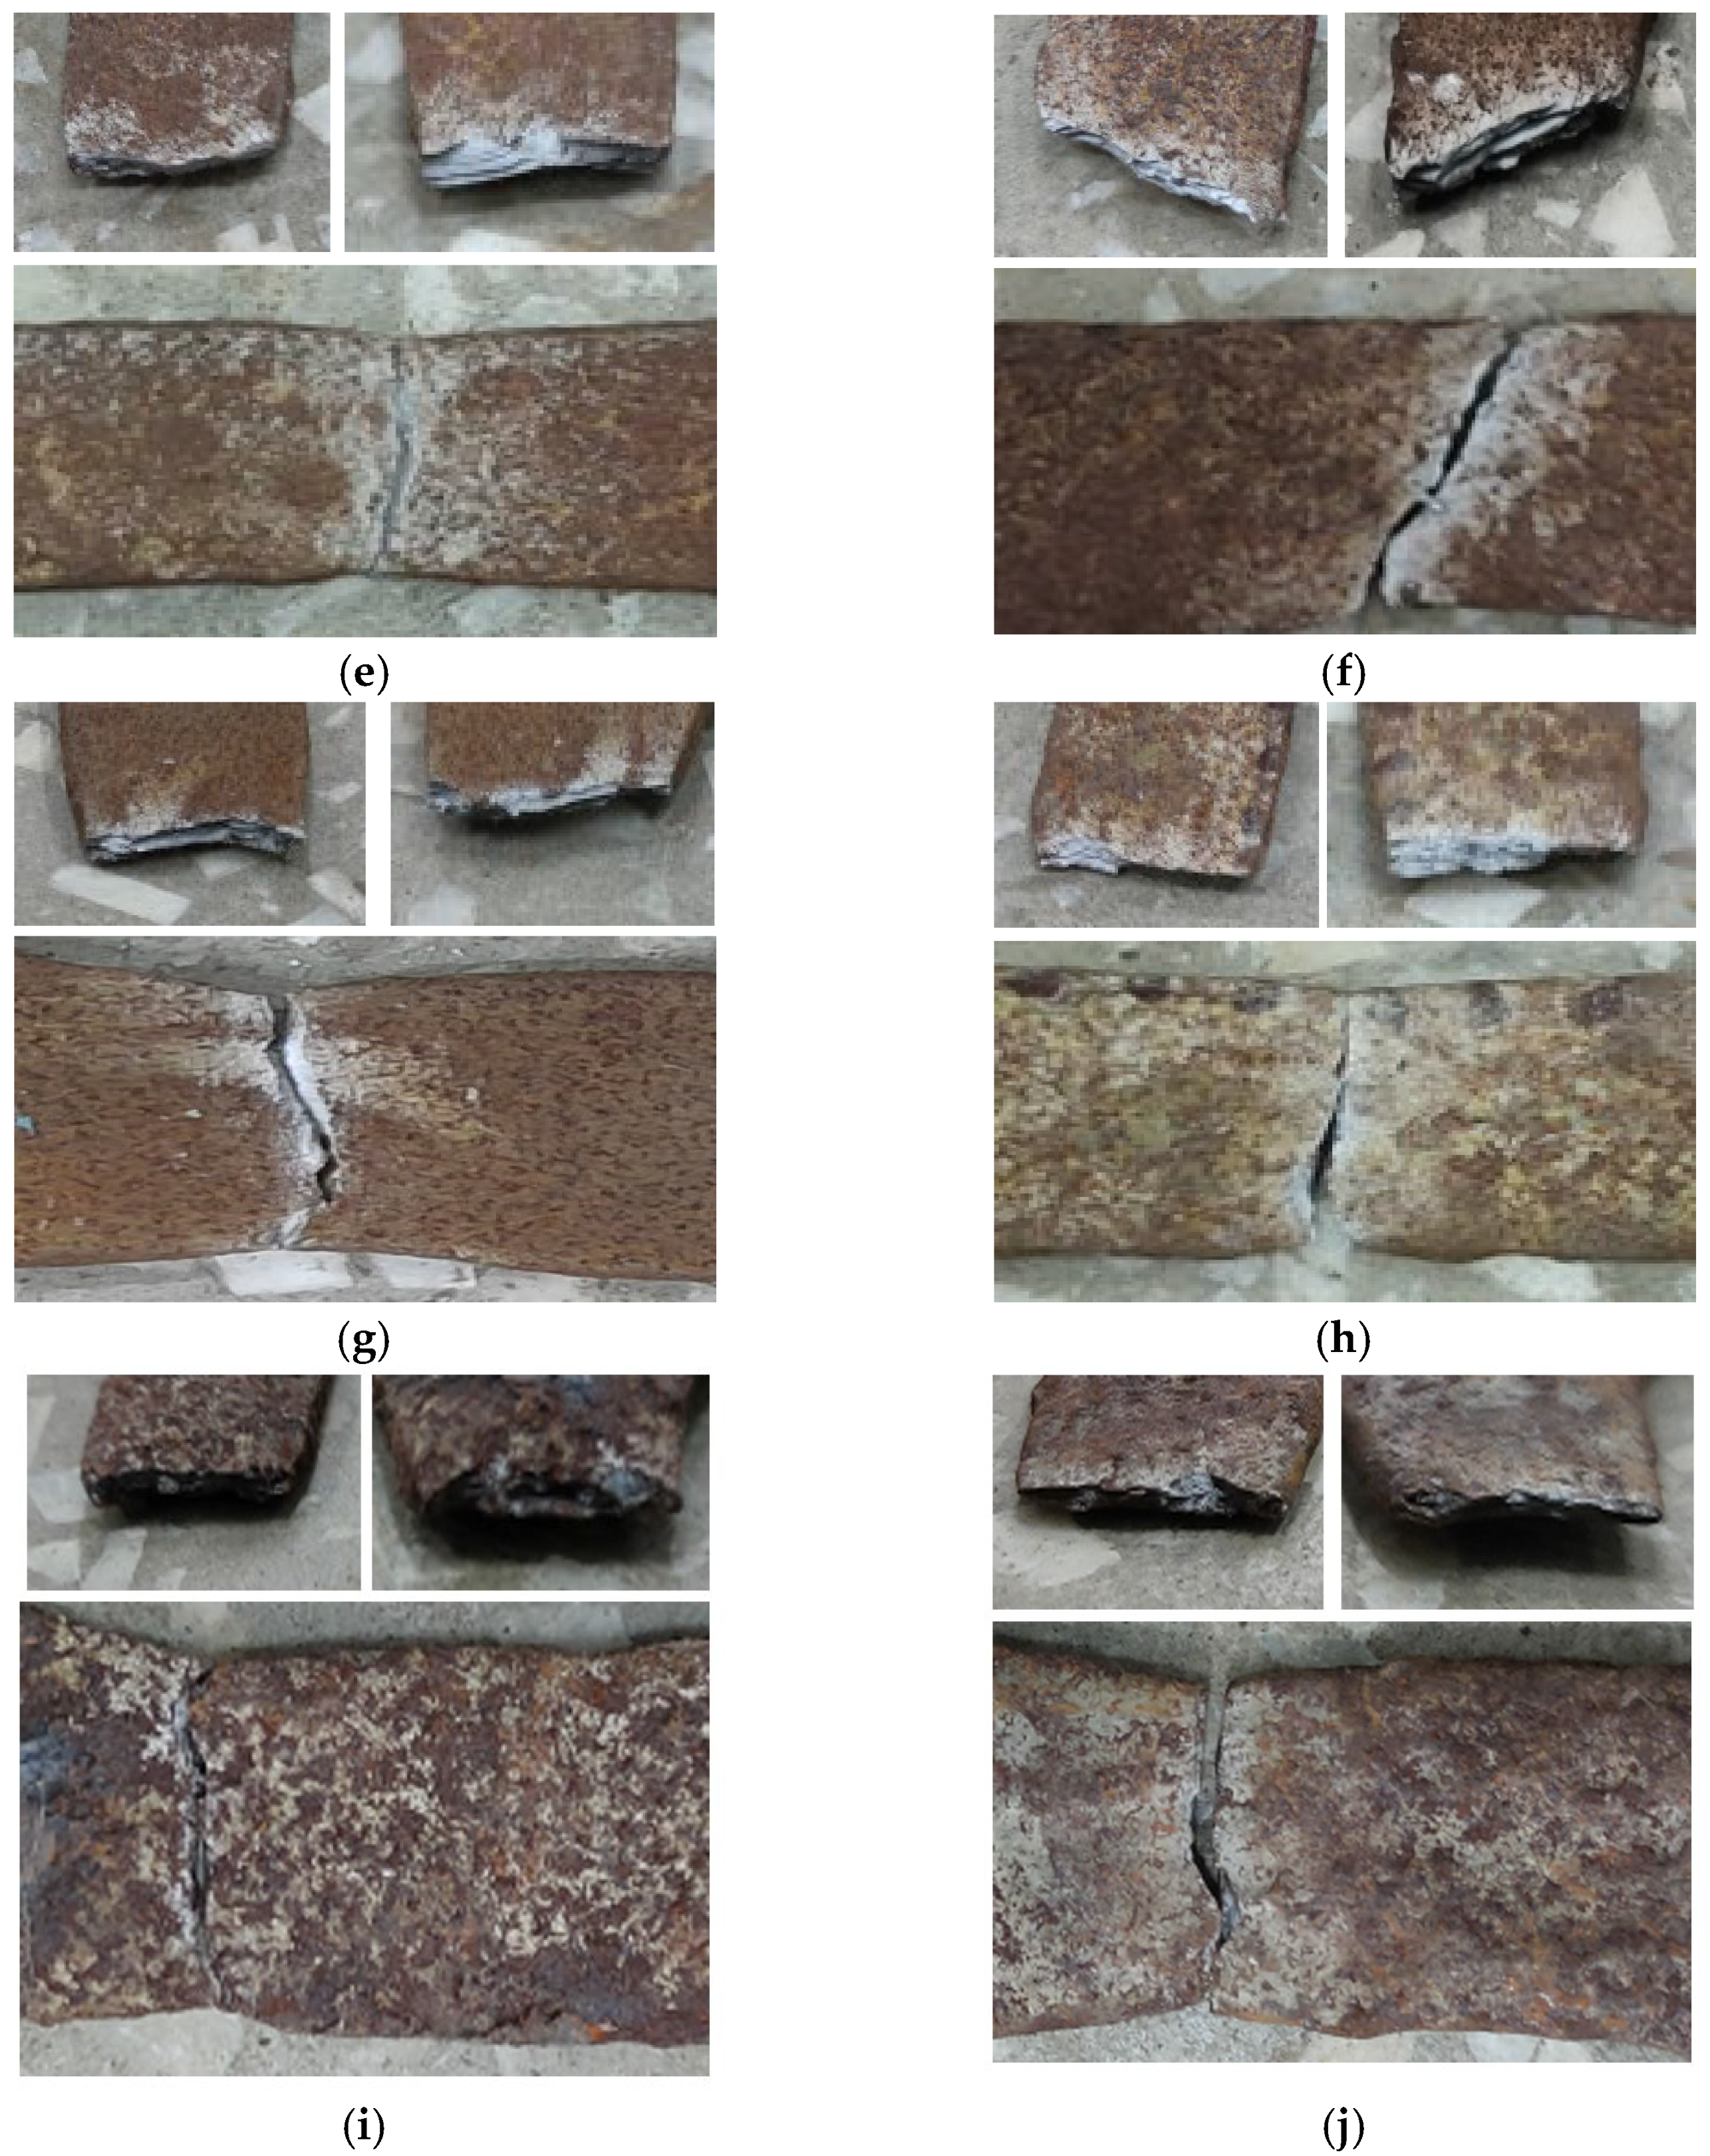
3.3. Failure Performance

After the above tensile test, failure performances of specimens with different corrosion degrees were obtained, as shown in Figure 11. For the Q620 HSS specimen without corrosion, the obvious necking occurred in the fracture section, which indicated a ductile failure. With development in corrosion degree, the necking was weakened gradually. The reason might be that with increases in the corrosion degree, the weakening effect caused by corrosion got more and more non-uniform. The plastic deformation was confined to the weak area in the middle portion. The stress concentration resulted in the earlier fracture, which was caused by the non-uniform corrosion. Therefore, the corrosion had an adverse effect on the ductile properties of Q620 HSS specimens, which agreed with test results introduced in Section 3.2. Based on the aforementioned discussion, the similar phenomenon might be observed in the steel component, where plastic deformation was confined to the weak area caused by the non-uniform corrosion, which resulted in a significant decrease in the ductile property. This research was focused on the mechanical properties of Q620 HSS with corrosion. It is helpful to clarify the microstructures of the fractures, which was desirable for study in future research.

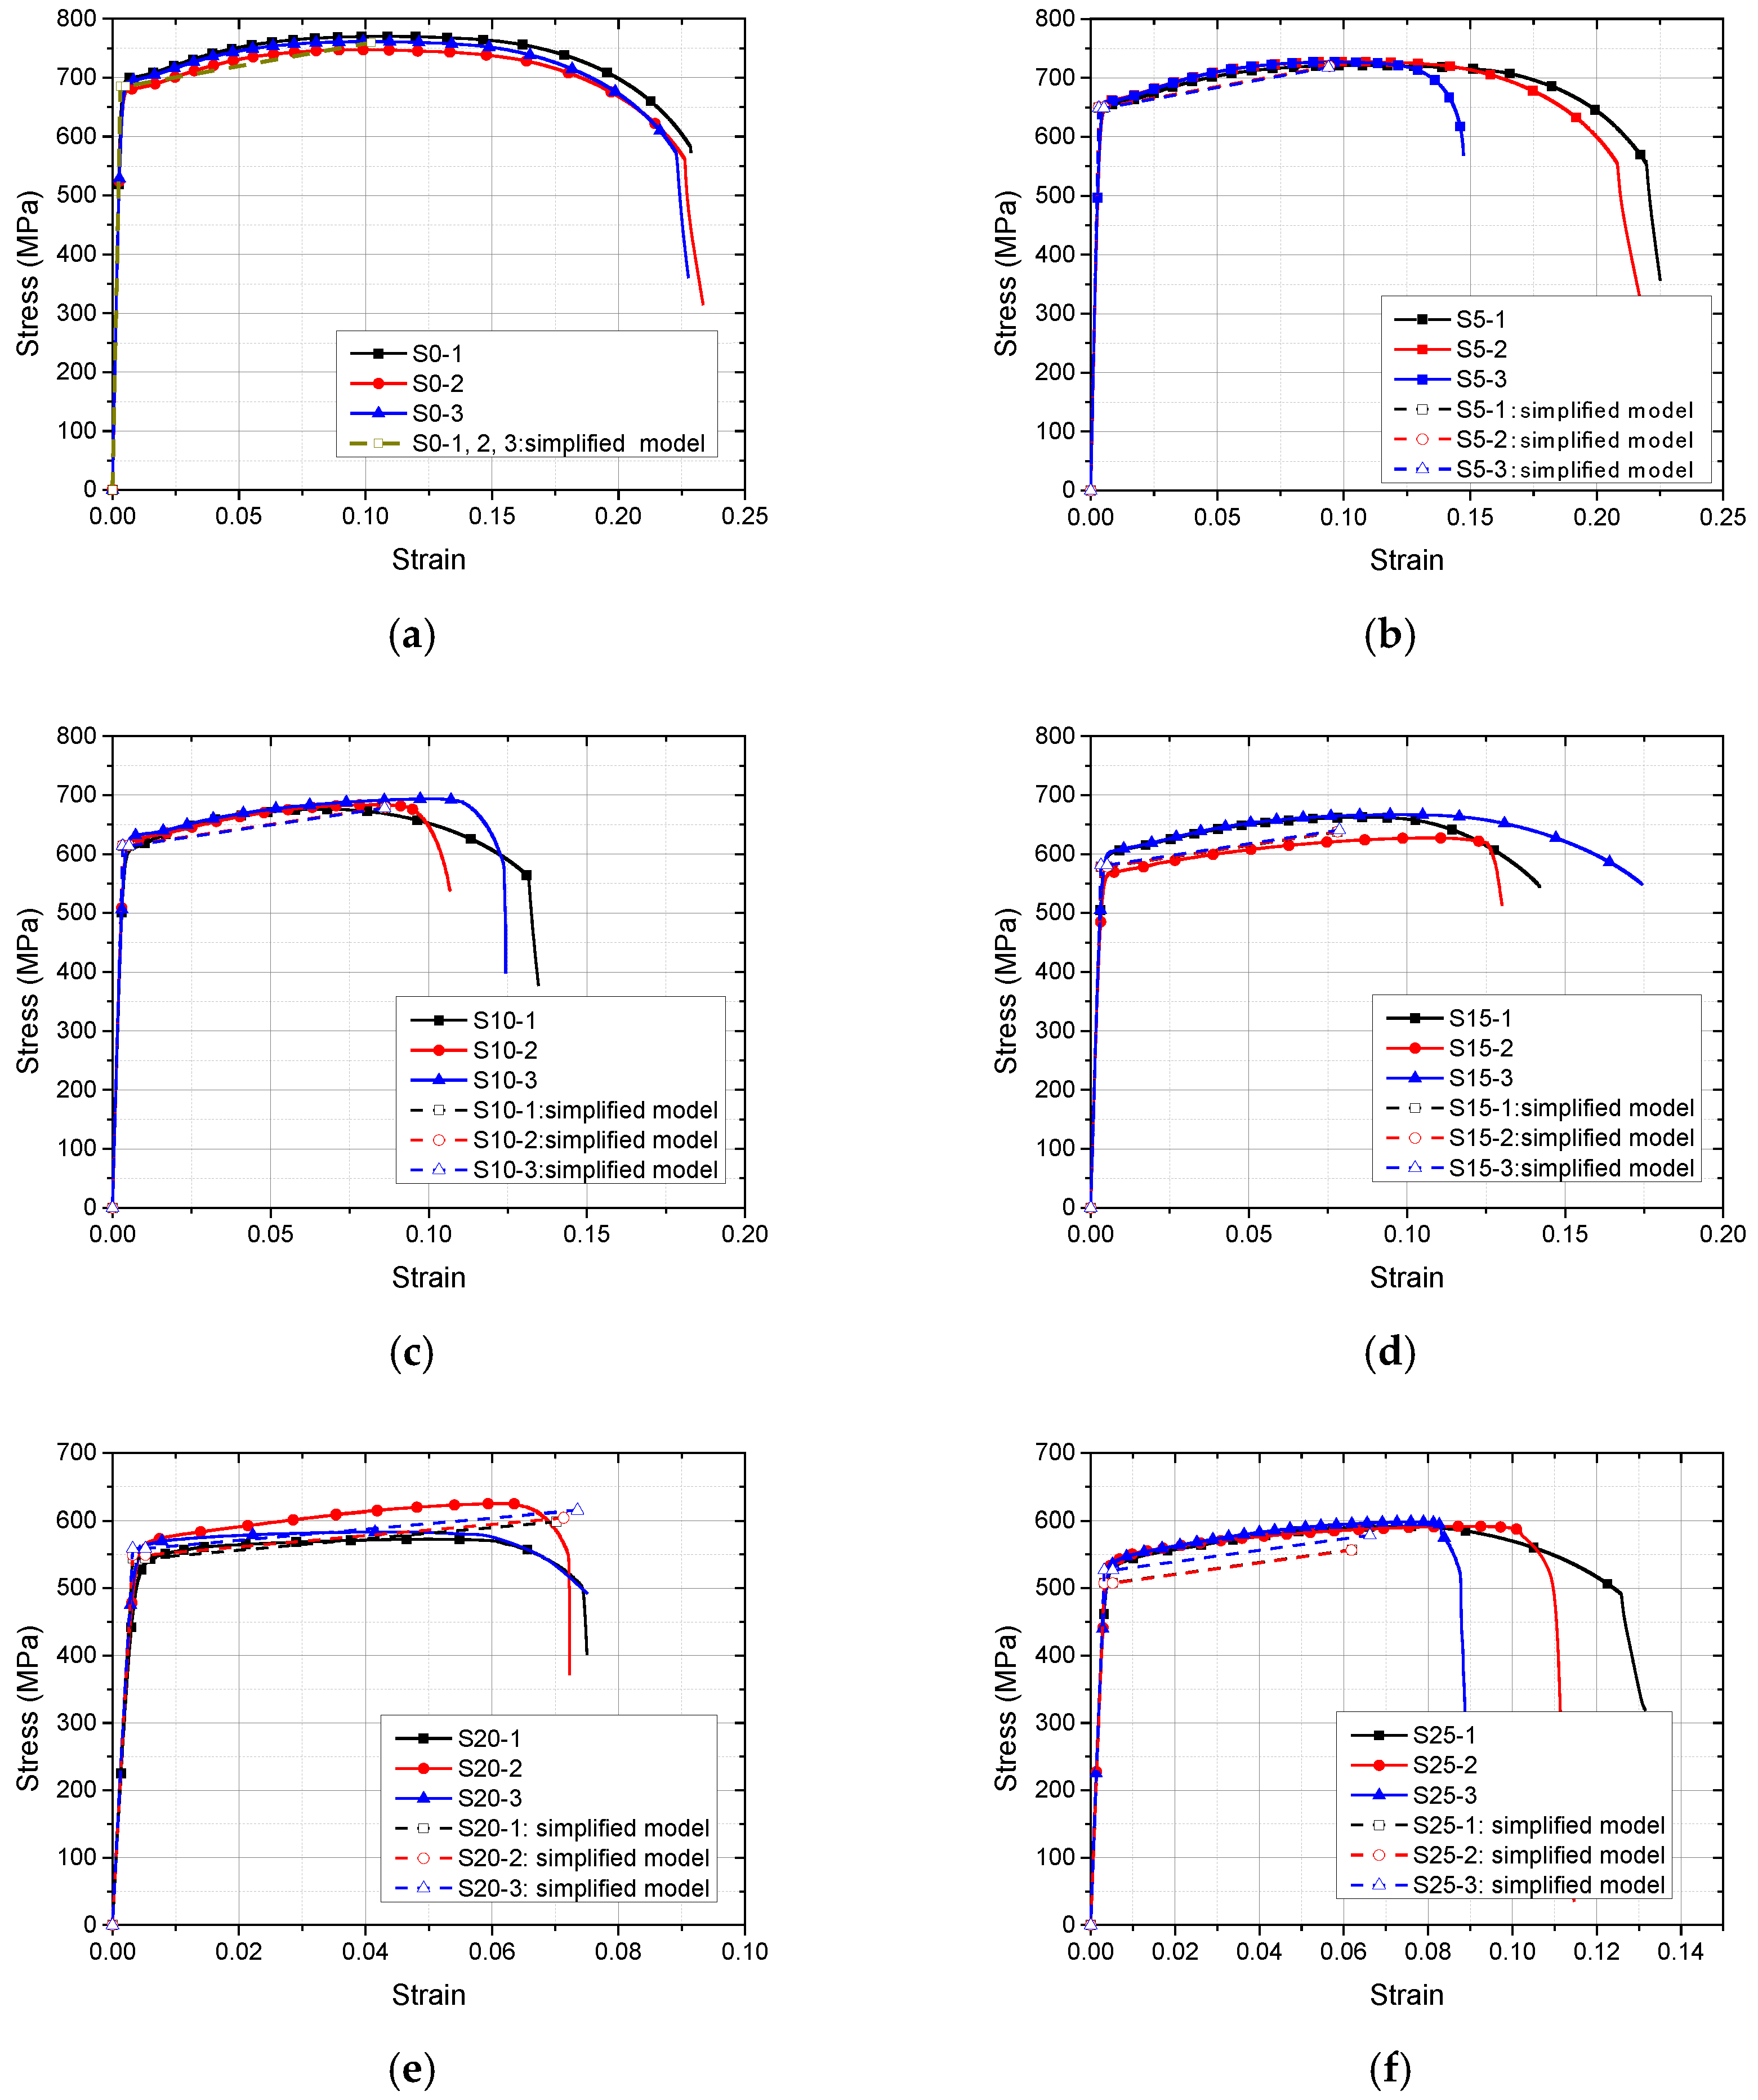
3.4. Simplified Constitutive Model

3.4.1. Relationship between Corrosion Degree and Characteristic Point

Based on the test results introduced in Section 3.2, features of stress–strain curves of corroded Q620 HSS specimens were obtained. Considering the above features of stress–strain curves, the simplified constitutive model was selected to quantify mechanical properties of corroded Q620 HSS specimens (see Figure 12). The simplified constitutive model consisted of two characteristic points, which were the nominal yield point (εy, fy) and the ultimate point (εu, fu). The mathematical expression of the above simplified constitutive model was shown as Equation (3). Considering the investigation conducted in Section 3.2, the aforementioned characteristic points were influenced by the corrosion degree. The numerical fitting was conducted to clarify relations between corrosion degree and mechanical properties. Based on the test results introduced in Table 2, the linear model was selected to describe the effect of corrosion on mechanical properties. After the numerical fitting, Equations (4)–(7) were proposed to quantify the aforementioned relationships. The fyc, fuc, εuc, Ec denoted the nominal yield strength, nominal ultimate strength, ultimate strain and elastic modulus of Q620 HSS specimens with different corrosion degrees, respectively. The fy0, fuo, εu0, E0 denote the average value of the nominal yield strength, nominal ultimate strength, ultimate strain and elastic modulus of Q620 HSS specimens without corrosion, respectively. The comparisons between the results from Equations (4)–(7) and tensile tests were conducted, as shown in Figure 12, Figure 13, Figure 14, Figure 15, Figure 16 and Figure 17. The Equations Equations (4)–(7) obtained from the numerical fitting built into the fyc, fuc, εuc and Ec well with R-square = 0.997, 0.980, 0.846 and 0.993, respectively. The test results of εu showed a greater discreteness than those of the fy and fu. With the increase in corrosion degree, the fyc, fuc, εuc, Ec decreased, correspondingly. The degradation coefficients of fyc and fuc were 1.028 and 1.059, respectively. The degradation coefficient of the idealized uniform corrosion was 1. Therefore, the adverse effect of the non-uniform corrosion in this study was greater than that of the idealized uniform corrosion. Considering that degradation coefficients 1.566 > 1.059 > 1.028, the adverse effect of corrosion on εuc was more obvious than that on strength properties. Based on the test results, the average value of εyc was 0.0052 and standard deviation was 0.000104, where εyc denoted the yield strain of the Q620 HSS specimens with different corrosion degrees. The effect of corrosion on εyc of Q620 HSS specimens with different corrosion degrees could be ignored, as shown in Figure 17 Considering the physical significance, the εuc should not be less than εyc. Therefore, the Equation (6) was only suitable for Q620 HSS where the corrosion degree was less than 60.61%.
σ = E ε , 0 ε ε y 0.002 f y , ε y 0.002 < ε ε y f y + f u f y ε ε y ε u ε y , ε y < ε ε u
f y c = 1 1.028 ρ f y 0
f u c = 1 1.059 ρ f u 0
ε u c = 1 1.566 ρ ε u 0
E c = 1 1.041 ρ E 0
The comparison between results from the Equations (3)–(7) and test results was conducted to clarify the accuracy of the simplified constitutive model proposed in this study (see Figure 18). When the corrosion degree was comparatively low, the simplified constitutive model proposed in this study could be used to predict the mechanical properties of corroded Q620 HSS accurately, especially for the elastic segment. With increases in the corrosion degree, the corrosion became more and more non-uniform. The accuracy of the simplified constitutive model reduced, correspondingly. It is worth noting that the degree of corrosion occuring in steel structures usually increased with time. Most of corrosion issues were detected when the corrosion degree was comparatively low. Therefore, the simplified constitutive model proposed in this study was useful for the evaluation of existing steel structures with corrosion issues.
According to GB/T 1591-2018 [54], the fy and fu of the Q620 HSS should not be less than 620 and 710 MPa, respectively. Based on the Equations (4) and (5) proposed in this section, the corresponding corrosion degrees were determined for the Q620 HSS investigated in this study. The corrosion degree corresponding to fyc = 620 MPa and fuc = 710 MPa were 9.27% and 6.17%, respectively, as shown in Figure 13 and Figure 14. Therefore, to address requirements in GB/T 1591-2018 [54], the corrosion degrees of the Q620 HSS investigated in the research should be controlled within 6.17%.

3.4.2. Comparison with Other Test Results

Based on the investigation conducted in this study, corrosion effects on the mechanical performance of Q620 HSS were clarified through corrosion factors νy, νu and νE, as shown in Equations (8)–(10). A comparison of Q235 mild steel and Q460, Q550 and Q620 HSSs was conducted, as shown in Table 3. For studies conducted in references [55,56,57], all experiments were focused on Q235 mild steel, and the test results indicated that corrosion factors were influenced by the corrosion method. Q235 mild steel specimens corroded in neutral and acid salt spray produced different corrosion factors. For tests in reference [58] and the present study, Q460, Q550 and Q620 HSSs were treated through the electrochemical accelerated corrosion test. The νy and νu of Q460 HSS was larger than that of Q550 HSS and smaller than that of Q620 HSS. The νE of Q550 HSS was larger than that of Q620 HSS and smaller than that of Q460 HSS. Based on the above comparison, the effects of corrosion on the mechanical properties of Q235 mild steel, Q460, Q550 and Q620 HSSs were different from each other. The effect of corrosion on the mechanical properties of mild steels and HSSs produced a noteworthy uncertainty. The effect of steel strength on corrosion factors was not clear. To determine the corrosion effect on the performance of structural steels and predict the resistance of steel structures during the service life accurately, more corrosion tests should be encouraged.
f y c = 1 ν y ρ f y 0
f u c = 1 ν u ρ f u 0
E c = 1 ν E ρ E 0

3.5. fu/fy and εuy

The indexes fy/fu and εuy were selected in this study to quantify the ductile property of the corroded Q620 HSS. Based on the test results, the average value of the index fy/fu was 1.09 and standard deviation was 0.0281, as shown in Figure 19. Therefore, the effect of corrosion on the index fy/fu was weak and could be ignored. With increases in corrosion degree, the ξ = εuy decreased, correspondingly, as shown in Figure 20. After a numerical fitting, Equation (11) was suggested to determine the corrosion effect on the ξc, where ξc denoted the εucyc and ξ0 denoted εu0y0. Based on the comparison between the results of Equation (11) and the test, the Equation (11) fitted into the ξ well with R-square = 0.851. The index ξc was related to a clear physical significance. Therefore, the index ξc should not be less than 1. Hence, the proposed Equation (11) was suitable for the Q620 HSS, whose corrosion degree was less than 60.24%.
ξ c = 1 1.576 ρ ξ 0

3.6. Energy Indexes

For the indexes fy/fu and εuy, they focused on either strength or strain properties. To clarify the corrosion effect on both the strength and strain properties, the energy absorption κ and the degree between total energy density and elastic energy density ψ were selected in this section [59]. The energy absorption κ denoted the sum of the area under the nominal stress–strain curve. Considering the test results introduced in Section 3.2, the κ was calculated through the Equation (12). The ψ was obtained through Equation (13). After the calculation, the test results indicated that with the increment in corrosion degree, the κ and ψ decreased, correspondingly, as shown in Figure 21 and Figure 22. Therefore, the corrosion had an adverse effect on the ductile property of Q620 HSS. Based on the distribution of the scatter, the polynomial was selected to conduct the numerical fitting. After the numerical fitting, Equations (14) and (15) were suggested to determine the corrosion effect on the indexes κc and ψc, where κc and ψc denoted the energy absorption and the degree between total energy density and elastic energy density of the Q620 HSS specimens with different corrosion degrees, respectively. It is clear that Equations (14) and (15) fitted into the κc and ψc very well with R-square = 0.901 and 0.852, respectively. Considering that indexes κc and ψc were related to the clear physical significances, they should not be less than 0 and 1, respectively. Hence, the proposed Equations (14) and (15) were suitable for the Q620 HSS, whose corrosion degree was less than 60.25% and 59.88%, respectively.
κ = 0 ε u σ d ε
ψ = 1 + 1 + f u / f y ε u / ε y 1
κ c = 117.7 ρ 2 198.9 ρ + 77.11
ψ c = 1 0.81 ρ 2 75.71 ρ + 42.46

3.7. Forecast of Mechanical Properties

Based on the above investigation, the relations between corrosion degree and mechanical performance of Q620 HSS were established. To perform the reliable resistance analysis of HSS structures during the service life, the relation between corrosion degree and rate was meaningful and necessary. The corrosion rate of structural steel was influenced by many factors, such as the service environment, material type and stress condition. In this study, the experimental investigations conducted in references [35,60,61] were selected. In reference [60], test results of low-alloy steels on 1st, 2nd, 4th, 8th and 16th year were introduced (see Figure 23). The predictive Equation (16) was proposed to fit the above test results, where R denoted the average corrosion rate (μm/a), the t denoted the exposure time (year), and the A and B were parameters obtained from test results in [60]. For the JY235(RE) in reference [60], the parameters A and B were calculated to be 44.12 and −0.7841, respectively. The comparisons between test results and results from Equation (16) were shown in Figure 23, which indicated that the proposed equation could be used to predict the test results of the corrosion rate accurately. The structural steel was homogeneous. The density of structural steel was believed to be independent of the dimensions of structural steel. Therefore, the average thickness loss ratio was equal to the mass loss ratio. When considering the relationship between erosion factors and the surface of steel plate, there were single and double side corrosion forms, as shown in Figure 24. Based on Equations (4), (5) and (16), the relationships between exposure time and strength properties of Q620 HSS with 5 mm thickness were calculated, as shown in Figure 25. In the early stage of service time, the corrosion rate was comparatively high, which meant that the slope of the remaining strength curves decreased, with increases in service time. The reductions in strength properties of Q620 HSS with double side corrosion were more severe than those of Q620 HSS with single side corrosion. In Beijing, for Q620 HSS with 5 mm thickness and single side corrosion, the fy and fu could meet the requirements in GB/T 1591-2018 [54], when the service time was less than 50 years. For Q620 HSS with 5 mm thickness and double side corrosion, considering the requirements of fy and fu in GB/T 1591-2018, the limitations of the service time were 25 and 9 years, respectively. When the service time was 50 years, the reduction ratios of fy and fu of the Q620 HSS with 5 mm thickness and double side corrosion were 0.94 and 0.87, respectively.
To investigate the effects of the service environment, the relationship between corrosion penetration and exposure time in references [35,61] were selected. The corrosion penetration was determined through Equation (17), where the C denoted the average corrosion penetration (μm), the t denoted the exposure time (year), and the φ and ζ were parameters obtained from experimental results. Different environments were included, such as rural, urban and marine environments. In reference [35], the φ of carbon steel in the rural, urban and marine environments were 34.0, 80.2 and 70.6, respectively. The ζ of carbon steel in the rural, urban and marine environments were 0.650, 0.593 and 0.789, respectively. The above values of the φ and ζ were also used in this study. The relations between corrosion penetration and exposure time were obtained, as shown in Figure 26. Based on Equations (4), (5) and (17), relationships between the remaining strength properties and the service time of Q620 HSS with 5 mm thickness were obtained, as shown in Figure 27 and Figure 28. The adverse effects of double side corrosion on remaining strength properties of Q620 HSS were more obvious than those of single side corrosion. The decreases in strength properties of Q620 HSS serving in a marine environment were much more severe than those of Q620 HSSs serving in rural and urban environments. Without corrosion prevention, neither fy and fu of Q620 HSS with 5 mm thickness and double side corrosion could meet the requirements in GB/T 1591-2018 during the service time of 50 years, as shown in Figure 27 and Figure 28. For Q620 HSS with 5 mm thickness and single (double) side corrosion, when the service time was 50 years, the remaining ratios of fy in rural, urban and marine environments were 0.91 (0.82), 0.83 (0.67) and 0.68 (0.36), respectively. For Q620 HSS with 5 mm thickness and single (double) side corrosion, when the service time was 50 years, the remaining ratios of fu in rural, urban and marine environments were 0.91 (0.82), 0.83 (0.65) and 0.67 (0.34), respectively.
R = A t B
C = φ t ζ .

4. Conclusions

In this study, the mechanical performance of corroded Q620 HSS was investigated experimentally, which was useful to determine the resistance of HSS structures during the service time. The main contributions of this research include the following:
  • The electrochemical accelerated corrosion test was conducted in the study to obtain Q620 HSS specimens with different corrosion degrees (ρ = 0%, 5%, 10%, 15%, 20%, 25%, 30%, 40%, 50% and 60%). When the corrosion degree was comparatively low (5~20%), reductions in the width and thickness kept almost the same along the length, which indicated that the corrosion was approximately uniform. When the corrosion degree was comparatively large (25~60%), the corrosion became more and more non-uniform. The weak area occurred in the middle portion of the specimen, which had an adverse effect on ductility of Q620 HSS;
  • The tensile coupon test was conducted to study the mechanical performance of corroded Q620 HSS specimens. After considering the test results, there was no clear yield plateau in the stress–strain curves of corroded Q620 HSS specimens. With the increment in corrosion degree, the fy, fu, εu and E decreased, correspondingly. The effect of corrosion on the εy could be ignored;
  • After the tensile coupon test, failure performances of corroded Q620 HSS specimens were obtained. For the Q620 HSS specimen without corrosion, the obvious necking occurred in the fracture area, which indicated a ductile failure. With the increment in corrosion degree, the necking was weakened. With the non-uniform corrosion, plastic deformation was confined to the weak area in the middle portion, which reduced the ductile property of Q620 HSS specimens with different corrosion degrees. The stress concentration caused by the non-uniform corrosion resulted in the earlier fracture;
  • The simplified constitutive model consisting of the nominal yield point (εy, fy) and the ultimate point (εu, fu) was proposed to quantify mechanical performance of corroded Q620 HSS. After numerical fitting, the relationships between corrosion degree and mechanical properties were clarified through Equations (4)–(7). The degradation coefficients of fy and fu are 1.028 and 1.059, respectively. Considering that the degradation coefficient of the idealized uniform corrosion was 1, the adverse effect of the non-uniform corrosion in this study was larger than that of the idealized uniform corrosion. Because the degradation coefficients 1.566 > 1.059 > 1.028, the corrosion effect on εuc was more severe than that on fyc and fuc. A comparison in mechanical properties among mild steels and HSSs with different corrosion methods was conducted, where it transpired that the effects of corrosion on the mechanical properties of Q235 mild steel, Q460, Q550 and Q620 HSSs were different from each other;
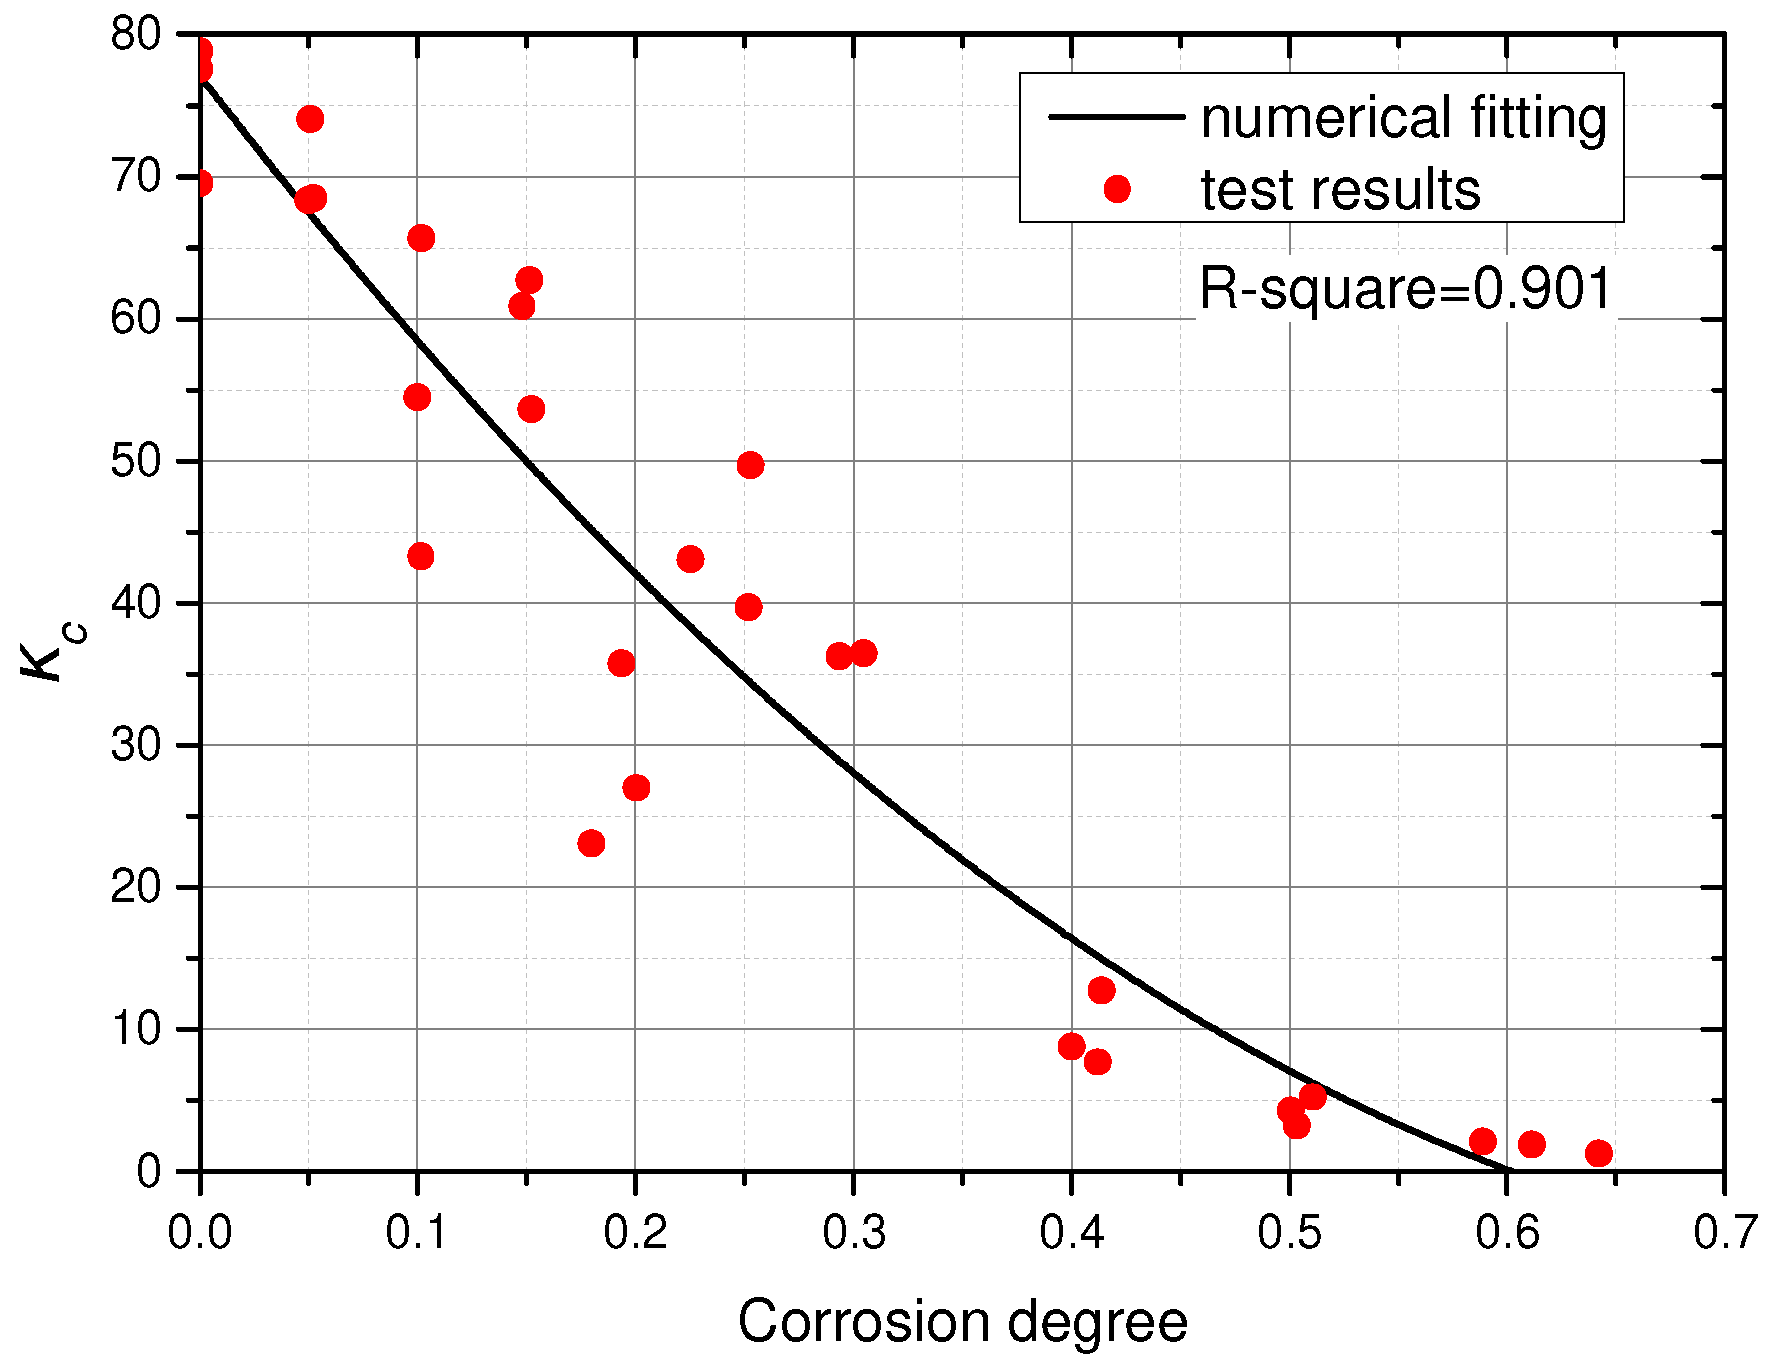
  • Indexes fy/fu, εuy, κ and ψ were selected to clarify the effects of corrosion on the ductile property of Q620 HSS with different corrosion degrees. Based on the test results, the effect of corrosion on the index fy/fu was weak and could be ignored. With increments in corrosion degree, the εuy, κ and ψ decreased, correspondingly. The corrosion had an adverse effect on the ductile property of Q620 HSS. After numerical fitting, Equations (11), (14) and (15) were suggested to clarify the corrosion effect on the indexes εuy, κc and ψc;
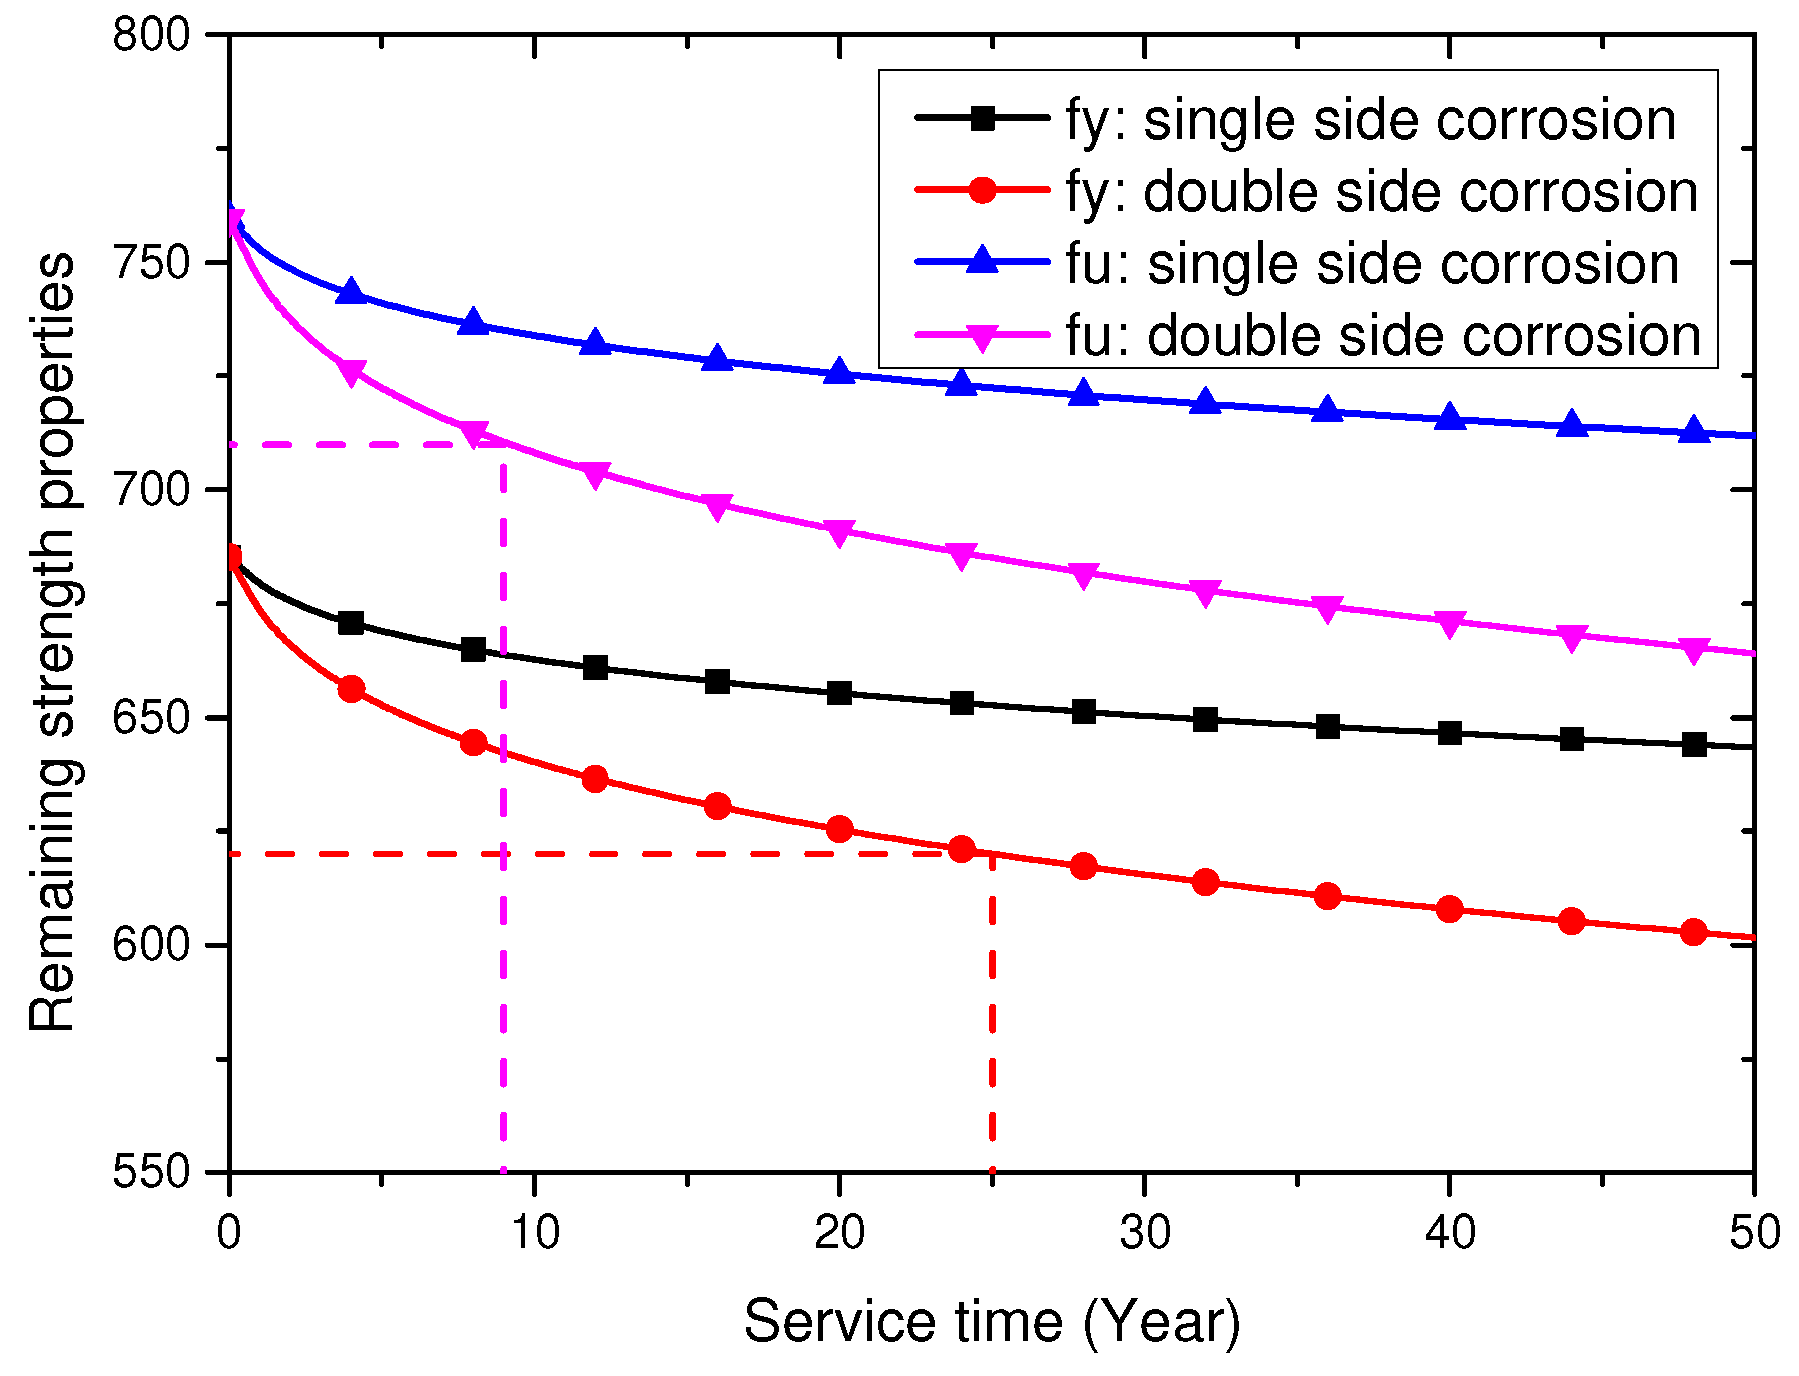
  • Combining with investigations on corrosion rates, the relationship between service time, service environment, corrosion form and strength properties of Q620 HSS with five thickness were discussed. Based on the test results of corrosion rates for structural steel in Beijing, the service life of Q620 HSS was discussed. The decreases in strength properties of Q620 HSS serving in a marine environment were much more severe than those of Q620 HSSs serving in rural and urban environments.

Author Contributions

Conceptualization, X.X. and N.W.; Data curation, F.W. and S.L.; Formal analysis, S.L.; Funding acquisition, J.H. and N.W.; Investigation, X.X.; Methodology, F.W.; Project administration, J.H. and N.W.; Software, S.L.; Supervision, X.X. and N.W.; Visualization, F.W.; Writing—original draft, X.X.; Writing—review and editing, J.H. and N.W. All authors have read and agreed to the published version of the manuscript.

Funding

National Natural Science Foundation of China (52108115); Special Funding for Research Projects of Postdoctoral Researchers in Chongqing (XmT20200011).

Institutional Review Board Statement

Not applicable.

Informed Consent Statement

Not applicable.

Data Availability Statement

Not applicable.

Conflicts of Interest

The authors declare no conflict of interest.

References

  1. Hua, J.; Yang, Z.; Zhou, F.; Hai, L.; Wang, N.; Wang, F. Effects of exposure temperature on low–cycle fatigue properties of Q690 high–strength steel. J. Constr. Steel Res. 2022, 190, 107159. [Google Scholar] [CrossRef]
  2. Hua, J.; Wang, F.; Xue, X.; Ding, Z.; Sun, Y.; Xiao, L. Ultra-low cycle fatigue performance of Q690 high-strength steel after exposure to elevated temperatures. J. Build. Eng. 2022, 57, 104832. [Google Scholar] [CrossRef]
  3. Hua, J.; Xue, X.; Huang, Q.; Shi, Y.; Deng, W. Post-fire performance of high-strength steel plate girders developing post-buckling capacity. J. Build. Eng. 2022, 52, 104442. [Google Scholar] [CrossRef]
  4. Xiao, Y.; Xue, X.Y.; Sun, F.F.; Li, G.Q. Intermediate transverse stiffener requirements of high-strength steel plate girders considering postbuckling capacity. Eng. Struct. 2019, 196, 109289. [Google Scholar] [CrossRef]
  5. Xiao, Y.; Xue, X.Y.; Sun, F.F.; Li, G.Q. Postbuckling shear capacity of high-strength steel plate girders. J. Constr. Steel Res. 2018, 150, 475–490. [Google Scholar] [CrossRef]
  6. Wang, W.; Liu, T.; Liu, J. Experimental study on post-fire mechanical properties of high strength Q460 steel. J. Constr. Steel Res. 2015, 114, 100–109. [Google Scholar] [CrossRef]
  7. Sun, F.F.; Xue, X.Y.; Xiao, Y.; Le, Y.M.; Li, G.Q. Effect of welding and complex loads on the high-strength steel T-stub connection. J. Constr. Steel Res. 2018, 150, 76–86. [Google Scholar] [CrossRef]
  8. Wang, W.; Li, G.Q.; Ge, Y. Residual Stress Study on Welded Section of High Strength Q460 Steel after Fire Exposure. Adv. Steel Constr. 2015, 11, 150–164. [Google Scholar] [CrossRef]
  9. Wang, Y.-B.; Lyu, Y.-F.; Li, G.-Q.; Liew, J.R. Behavior of single bolt bearing on high strength steel plate. J. Constr. Steel Res. 2017, 137, 19–30. [Google Scholar] [CrossRef]
  10. Ban, H.; Shi, G.; Shi, Y.; Bradford, M.A. Experimental investigation of the overall buckling behaviour of 960MPa high strength steel columns. J. Constr. Steel Res. 2013, 88, 256–266. [Google Scholar] [CrossRef]
  11. Zhao, Z.; Zhang, H.; Xian, L.; Liu, H. Tensile strength of Q345 steel with random pitting corrosion based on numerical analysis. Thin-Walled Struct. 2020, 148, 106579. [Google Scholar] [CrossRef]
  12. Wang, F.; Hua, J.; Xue, X.; Wang, N.; Yao, Y. Effects of Polyoxymethylene Fiber on Mechanical Properties of Seawater Sea-Sand Concrete with Different Ages. Polymers 2022, 14, 3472. [Google Scholar] [CrossRef] [PubMed]
  13. Hua, J.; Wang, F.; Xue, X.; Fan, H.; Yan, W. Fatigue properties of bimetallic steel bar: An experimental and numerical study. Eng. Fail. Anal. 2022, 136, 106212. [Google Scholar] [CrossRef]
  14. Hua, J.; Yang, Z.; Xue, X.; Huang, L.; Wang, N.; Chen, Z. Bond properties of bimetallic steel bar in seawater sea-sand concrete at different ages. Constr. Build. Mater. 2022, 323, 126539. [Google Scholar] [CrossRef]
  15. Hua, J.; Fan, H.; Xue, X.; Wang, F.; Chen, Z.; Huang, L.; Wang, N. Tensile and low-cycle fatigue performance of bimetallic steel bars with corrosion. J. Build. Eng. 2021, 43, 103188. [Google Scholar] [CrossRef]
  16. Hua, J.; Wang, F.; Wang, N.; Huang, L.; Hai, L.; Li, Y.; Zhu, X.; Xue, X. Experimental and numerical investigations on corroded stainless-clad bimetallic steel bar with artificial damage. J. Build. Eng. 2021, 44, 102779. [Google Scholar] [CrossRef]
  17. Wang, F.; Hua, J.; Xue, X.; Ding, Z.; Lyu, Y.; Liu, Q. Low-cycle fatigue performance of bimetallic steel bar considering the effect of inelastic buckling. Constr. Build. Mater. 2022, 351, 128787. [Google Scholar] [CrossRef]
  18. Hua, J.; Wang, F.; Xue, X.; Ding, Z.; Chen, Z. Residual monotonic mechanical properties of bimetallic steel bar with fatigue damage. J. Build. Eng. 2022, 55, 104703. [Google Scholar] [CrossRef]
  19. Hua, J.; Yang, Z.; Wang, F.; Xue, X.; Wang, N.; Huang, L. Relation between the Metallographic Structure and Mechanical Properties of a Bimetallic Steel Bar after Fire. J. Mater. Civ. Eng. 2022, 34, 04022193. [Google Scholar] [CrossRef]
  20. Hua, J.; Wang, F.; Xue, X. Study on fatigue properties of post-fire bimetallic steel bar with different cooling methods. Structures 2022, 40, 633–645. [Google Scholar] [CrossRef]
  21. Shi, Y.; Luo, Z.; Zhou, X.; Xue, X.; Xiang, Y. Post-fire performance of bonding interface in explosion-welded stainless-clad bimetallic steel. J. Constr. Steel Res. 2022, 193, 107285. [Google Scholar] [CrossRef]
  22. Hua, J.; Wang, F.; Xiang, Y.; Yang, Z.; Xue, X.; Huang, L.; Wang, N. Mechanical properties of stainless-clad bimetallic steel bars exposed to elevated temperatures. Fire Saf. J. 2022, 127, 103521. [Google Scholar] [CrossRef]
  23. Hua, J.; Fan, H.; Yan, W.; Wang, N.; Xue, X.; Huang, L. Seismic resistance of the corroded bimetallic steel bar under different strain amplitudes. Constr. Build. Mater. 2021, 319, 126088. [Google Scholar] [CrossRef]
  24. Hua, J.; Wang, F.; Yang, Z.; Xue, X.; Huang, L.; Chen, Z. Low-cycle fatigue properties of bimetallic steel bars after exposure to elevated temperature. J. Constr. Steel Res. 2021, 187, 106959. [Google Scholar] [CrossRef]
  25. Shi, Y.; Luo, Z.; Zhou, X.; Xue, X.; Li, J. Post-fire mechanical properties of titanium–clad bimetallic steel in different cooling approaches. J. Constr. Steel Res. 2022, 191, 107169. [Google Scholar] [CrossRef]
  26. Nakai, T.; Matsushita, H.; Yamamoto, N. Effect of pitting corrosion on strength of web plates subjected to patch loading. Thin-Walled Struct. 2006, 44, 10–19. [Google Scholar] [CrossRef]
  27. Ahn, J.-H.; Cheung, J.-H.; Lee, W.-H.; Oh, H.; Kim, I.-T. Shear buckling experiments of web panel with pitting and through-thickness corrosion damage. J. Constr. Steel Res. 2015, 115, 290–302. [Google Scholar] [CrossRef]
  28. Wen, Z.; Wei, X.; Xiao, L.; He, K. Experimental evaluation of the shear buckling behaviors of corrugated webs with artificial corrosion pits. Thin-Walled Struct. 2019, 141, 251–259. [Google Scholar] [CrossRef]
  29. Saad-Eldeen, S.; Garbatov, Y.; Soares, C.G. Effect of corrosion severity on the ultimate strength of a steel box girder. Eng. Struct. 2013, 49, 560–571. [Google Scholar] [CrossRef]
  30. Yao, Y.; Yang, Y.; He, Z.; Wang, Y. Experimental study on generalized constitutive model of hull structural plate with multi-parameter pitting corrosion. Ocean Eng. 2018, 170, 407–415. [Google Scholar] [CrossRef]
  31. Ahn, J.-H.; Kainuma, S.; Kim, I.-T. Shear failure behaviors of a web panel with local corrosion depending on web boundary conditions. Thin-Walled Struct. 2013, 73, 302–317. [Google Scholar] [CrossRef]
  32. Blikharskyy, Y.; Selejdak, J.; Kopiika, N. Corrosion Fatigue Damages of Rebars under Loading in Time. Materials 2021, 14, 3416. [Google Scholar] [CrossRef] [PubMed]
  33. Lipiński, T. Roughness of 1.0721 steel after corrosion tests in 20% NaCl. Prod. Eng. Arch. 2017, 15, 27–30. [Google Scholar] [CrossRef]
  34. Taylor, C.D.; Gale, J.D.; Strehblow, H.H.; Philippe, M. An Introduction to Corrosion Mechanisms and Models; Wiley: New York, NY, USA, 2015; pp. 1–34. [Google Scholar] [CrossRef]
  35. Sharifi, Y.; Paik, J.K. Ultimate strength reliability analysis of corroded steel-box girder bridges. Thin-Walled Struct. 2011, 49, 157–166. [Google Scholar] [CrossRef]
  36. Wang, R.; Shenoi, R.A.; Sobey, A. Ultimate strength assessment of plated steel structures with random pitting corrosion damage. J. Constr. Steel Res. 2018, 143, 331–342. [Google Scholar] [CrossRef] [Green Version]
  37. Rahgozar, R. Remaining capacity assessment of corrosion damaged beams using minimum curves. J. Constr. Steel Res. 2009, 65, 299–307. [Google Scholar] [CrossRef]
  38. Saad-Eldeen, S.; Garbatov, Y.; Parunov, J.; Kodvanj, J.; Saad-Eldeen, S.; Soares, C.G. Experimental assessment of tensile strength of corroded steel specimens subjected to sandblast and sandpaper cleaning. Mar. Struct. 2016, 49, 18–30. [Google Scholar] [CrossRef]
  39. Nakai, T.; Matsushita, H.; Yamamoto, N. Effect of pitting corrosion on the ultimate strength of steel plates subjected to in-plane compression and bending. J. Mar. Sci. Technol. 2006, 11, 52–64. [Google Scholar] [CrossRef]
  40. Ok, D.; Pu, Y.; Incecik, A. Computation of ultimate strength of locally corroded unstiffened plates under uniaxial compression. Mar. Struct. 2007, 20, 100–114. [Google Scholar] [CrossRef]
  41. Zhao, Z.; Zhang, N.; Wu, J.; Gao, Y.; Sun, Q. Shear capacity of steel plates with random local corrosion. Constr. Build. Mater. 2020, 239, 117816. [Google Scholar] [CrossRef]
  42. Xiao, L.; Peng, J.; Zhang, J.; Ma, Y.; Cai, C. Comparative assessment of mechanical properties of HPS between electrochemical corrosion and spray corrosion. Constr. Build. Mater. 2020, 237, 117735. [Google Scholar] [CrossRef]
  43. Xue, X.Y.; Zhou, X.; Shi, Y.; Xiang, Y. Ultimate shear resistance of S600E high-strength stainless steel plate girders. J. Constr. Steel Res. 2021, 179, 106535. [Google Scholar] [CrossRef]
  44. Hua, J.; Wang, F.; Huang, L.; Wang, N.; Xue, X. Experimental study on mechanical properties of corroded stainless-clad bimetallic steel bars. Constr. Build. Mater. 2021, 287, 123019. [Google Scholar] [CrossRef]
  45. Wu, X.; Ye, D.; Li, H.; Yu, H. Corrosion characteristics of S23043 duplex stainless steel bars. Constr. Build. Mater. 2018, 178, 135–143. [Google Scholar] [CrossRef]
  46. Lee, H.-S.; Cho, Y.-S. Evaluation of the mechanical properties of steel reinforcement embedded in concrete specimen as a function of the degree of reinforcement corrosion. Int. J. Fract. 2009, 157, 81–88. [Google Scholar] [CrossRef]
  47. GB/T 228-2010; Metallic Materials—Tensile Testing—Part 1:Method of Test at Room Temperature. China Standard Press: Beijing, China, 2010. (In Chinese)
  48. Xiao, L.F.; Peng, J.X.; Zhang, J.R.; Cai, C.S. Mechanical properties of corroded high performance steel specimens based on 3d scanning. Adv. Steel Constr. 2019, 15, 129–136. [Google Scholar] [CrossRef] [Green Version]
  49. Gathimba, N.; Kitane, Y. Effect of surface roughness on tensile ductility of artificially corroded steel plates. J. Constr. Steel Res. 2021, 176, 106392. [Google Scholar] [CrossRef]
  50. GB/T 16545-2015; Corrosion of Metals and Alloys—Removal of Corrosion Products from Corrosion Test Specimens. China Standard Press: Beijing, China, 2015. (In Chinese)
  51. Zhou, X.; Xue, X.; Shi, Y.; Xu, J. Post-fire mechanical properties of Q620 high-strength steel with different cooling methods. J. Constr. Steel Res. 2021, 180, 106608. [Google Scholar] [CrossRef]
  52. Zhang, C.; Wang, R.; Song, G. Post-fire mechanical properties of Q460 and Q690 high strength steels after fire-fighting foam cooling. Thin-Walled Struct. 2020, 156, 106983. [Google Scholar] [CrossRef]
  53. Amraei, M.; Skriko, T.; Björk, T.; Zhao, X.-L. Plastic strain characteristics of butt-welded ultra-high strength steel (UHSS). Thin-Walled Struct. 2016, 109, 227–241. [Google Scholar] [CrossRef]
  54. GB/T 1591-2018; High Strength Low Alloy Structural Steels. China Standard Press: Beijing, China, 2018. (In Chinese)
  55. Weizhou, S.; Lewei, T.; Yiyi, C.; Zigang, L.; Kai, S. Experimental study on influence of corrosion on behavior of steel material and steel beams. J. Build. Struct. 2012, 33, 53–60. (In Chinese) [Google Scholar]
  56. Yang, C. The Seismic Performance and Vulnerability Research of Corroded Steel Frame Structure in Acidic Air Environment; Xi’an University of Architecture and Technology: Xi’An, China, 2015. (In Chinese) [Google Scholar]
  57. Zheng, S.; Zhang, X.; Wang, X.; Cheng, Y.; Sun, L. Experimental research on seismic behaviors of multi-aged steel frame columns in the offshore atmospheric environment, Tumu Gongcheng Xuebao/China. Civ. Eng. J. 2016, 49, 69–77. (In Chinese) [Google Scholar] [CrossRef]
  58. Zhang, W. Experimental Study on Influence of Corrosion on Static and Fatigue Performance of High Performance Steel Specimens; Changsha University of Science and Technology: Changsha, China, 2017. (In Chinese) [Google Scholar]
  59. Tang, F.; Lin, Z.; Chen, G.; Yi, W. Three-dimensional corrosion pit measurement and statistical mechanical degradation analysis of deformed steel bars subjected to accelerated corrosion. Constr. Build. Mater. 2014, 70, 104–117. [Google Scholar] [CrossRef]
  60. Paik, J.K.; Kim, S.K.; Lee, S.K. Probabilistic corrosion rate estimation model for longitudinal strength members of bulk carriers. Ocean Eng. 1998, 25, 837–860. [Google Scholar] [CrossRef]
  61. Zhi, Y.; Yang, T.; Fu, D. An improved deep forest model for forecast the outdoor atmospheric corrosion rate of low-alloy steels. J. Mater. Sci. Technol. 2020, 49, 202–210. [Google Scholar] [CrossRef]
Figure 1. Details of test specimen.
Buildings 12 01651 g001
Figure 2. Q620 HSS specimen with treatment in the ends.
Buildings 12 01651 g002
Figure 3. Electrochemical accelerated corrosion test setup.
Buildings 12 01651 g003
Figure 4. Corroded Q620 HSS specimen.
Buildings 12 01651 g004
Figure 5. Tensile test equipment.
Buildings 12 01651 g005
Figure 6. Performance of corroded Q620 HSS specimens: (a) ρ = 0%; (b) ρ = 5.07%; (c) ρ = 10.01%; (d) ρ = 14.79%; (e) ρ = 19.34%; (f) ρ = 25.26%; (g) ρ = 30.47%; (h) ρ = 41.37%; (i) ρ = 50.08%; (j) ρ = 61.12%.
Buildings 12 01651 g006
Figure 7. Test results of corroded specimens: stress–strain curve: (a) ρ = 0%; (b) ρ = 5%; (c) ρ = 10%; (d) ρ = 15%; (e) ρ = 20%; (f) ρ = 25%; (g) ρ = 30%; (h) ρ = 40%; (i) ρ = 50%; (j) ρ = 60%.
Buildings 12 01651 g007aBuildings 12 01651 g007b
Figure 8. Comparison between Q620 HSS specimens with different corrosion degrees.
Buildings 12 01651 g008
Figure 9. Strength properties of Q620 HSS specimens.
Buildings 12 01651 g009
Figure 10. Effects of corrosion on dimensionless stress and strain properties of Q620 HSS.
Buildings 12 01651 g010
Figure 11. Failure performance of corroded Q620 HSS specimens: (a) ρ = 0%; (b) ρ = 5.07%; (c) ρ = 10.15%; (d) ρ = 14.79%; (e) ρ = 19.34%; (f) ρ = 22.52%; (g) ρ = 30.47%; (h) ρ = 41.37%; (i) ρ = 50.08%; (j) ρ = 64.21%.
Buildings 12 01651 g011aBuildings 12 01651 g011b
Figure 12. Simplified constitutive model for Q620 HSS.
Buildings 12 01651 g012
Figure 13. Relationship between corrosion degree and fyc.
Buildings 12 01651 g013
Figure 14. Relationship between corrosion degree and fuc.
Buildings 12 01651 g014
Figure 15. Relationship between corrosion degree and εuc.
Buildings 12 01651 g015
Figure 16. Relationship between corrosion degree and Ec.
Buildings 12 01651 g016
Figure 17. Relationship between corrosion degree and εyc.
Buildings 12 01651 g017
Figure 18. Comparison between simplified constitutive model and test results: (a) ρ = 0%; (b) ρ = 5%; (c) ρ = 10%; (d) ρ = 15%; (e) ρ = 20%; (f) ρ = 25%; (g) ρ = 30%; (h) ρ = 40%; (i) ρ = 50%; (j) ρ = 60%.
Buildings 12 01651 g018aBuildings 12 01651 g018b
Figure 19. Relationship between corrosion degree and fy/fu.
Buildings 12 01651 g019
Figure 20. Relationship between corrosion degree and ξc.
Buildings 12 01651 g020
Figure 21. Relationship between corrosion degree and κc.
Buildings 12 01651 g021
Figure 22. Relationship between corrosion degree and ψc.
Buildings 12 01651 g022
Figure 23. Corrosion rates of low-alloy steels in reference [60].
Buildings 12 01651 g023
Figure 24. Corrosion forms: (a) single side; (b) double side.
Buildings 12 01651 g024
Figure 25. Remaining strength properties vs. service time of Q620 HSS with 5 mm thickness.
Buildings 12 01651 g025
Figure 26. Test results of corrosion penetration in [35].
Buildings 12 01651 g026
Figure 27. Remaining fy vs. service time of Q620 HSS with 5 mm thickness.
Buildings 12 01651 g027
Figure 28. Remaining fu vs. service time of Q620 HSS with 5 mm thickness.
Buildings 12 01651 g028
Table 1. Element composition information for Q620 HSS.
ElementTiCSiMnNbPSVNiCrCuMoB
wt.%0.090.070.101.710.0030.0120.0010.0010.020.020.020.0012
Table 2. Corrosion degrees and mechanical properties of Q620 HSS specimens.
Numberρ (%)E (MPa)fy (MPa)fu (MPa)fye (MPa)fue (MPa)εyεufu/fyεuy
S0-10216,347694.21770.08694.21770.080.00520.10751.1120.67
S0-20216,162675.61747.59675.61747.590.00520.09791.1118.98
S0-30216,188686.13761.31686.13761.310.00520.10161.1119.61
S5-15.07202,088646.86721.23681.41759.740.00520.10791.1120.83
S5-24.97200,110651.09727.56685.14765.610.00520.09911.1218.95
S5-35.21202,952654.12726.94690.07766.890.00520.09931.1119.17
S10-110.15192,322605.42676.10673.82752.470.00520.06811.1213.12
S10-210.01192,381618.72683.55687.54759.590.00520.08431.1016.09
S10-310.16193,571622.60693.71693.01772.160.00520.09991.1119.13
S15-115.21184,316596.52662.22703.53781.010.00530.08571.1116.29
S15-215.13183,518562.66627.36662.96739.200.00510.10551.1120.80
S15-314.79183,089598.13666.81701.94782.550.00520.09631.1118.44
S20-120.06173,076535.76572.74670.20716.460.00510.04971.079.77
S20-219.34172,918565.80624.87701.47774.690.00530.06121.1011.61
S20-317.96173,131563.81583.28687.24710.970.00520.04171.037.97
S25-125.18162,940530.91591.78709.59790.940.00530.07141.1113.54
S25-225.26162,613538.74591.74720.83791.730.00530.08821.1016.58
S25-322.52162,154536.65598.36692.64772.270.00530.07631.1114.37
S30-129.35151,442486.58544.20688.71770.270.00520.07071.1213.61
S30-230.47151,352509.12543.39732.23781.520.00540.07011.0713.05
S30-330.56151,526--------
S40-140.01129,415405.05451.14675.20752.020.00510.02211.114.31
S40-241.37129,422444.45483.14758.05824.060.00540.02891.095.35
S40-341.21129,562385.68421.26655.92716.420.00510.02051.094.01
S50-150.34103,777296.91312.04597.89628.350.00490.01221.052.50
S50-250.08105,616323.58351.53648.20704.190.00510.01461.092.88
S50-351.0691,625299.03315.49611.01644.650.00530.01531.062.90
S60-164.2173,025234.82240.99656.11673.340.00530.00711.031.34
S60-258.8874,779249.62261.20607.05635.210.00530.01011.051.91
S60-361.1276,374241.92254.79622.22655.320.00520.00941.051.80
Note: S30-2 denotes that the predetermined corrosion degree was 30% and series number was 2.
Table 3. Comparison among mild steels and HSSs.
StudyTypeAccelerated Corrosion TestνyνuνE
Present studyQ620 HSSelectrochemically1.0281.0591.041
Zhang [58]Q460 HSSelectrochemically0.9251.0501.216
Zhang [58]Q550 HSSelectrochemically0.8320.8121.196
Shi et al. [55]Q235 mild steelneutral salt spray0.98520.9732-
Cheng [56]Q235 mild steelacid salt spray0.8020.9550.836
Zheng et al. [57]Q235 mild steelneutral salt spray0.96840.94380.8913
Publisher’s Note: MDPI stays neutral with regard to jurisdictional claims in published maps and institutional affiliations.

