Article

Experimental and Numerical Study on the Flexural Behavior of Cold-Formed Steel Multi-Limb Built-Up Section Beams

1
College of Civil Engineering, Hunan University, Changsha 410082, China
2
Key Laboratory for Damage Diagnosis of Engineering Structures of Hunan Province, Hunan University, Changsha 410082, China
3
Computational Marine Hydrodynamics Lab (CMHL), School of Naval Architecture, Ocean and Civil Engineering, Shanghai Jiao Tong University, Shanghai 200240, China
*
Author to whom correspondence should be addressed.
Buildings 2022, 12(10), 1639; https://doi.org/10.3390/buildings12101639
Submission received: 15 September 2022 / Revised: 6 October 2022 / Accepted: 7 October 2022 / Published: 9 October 2022

Abstract

:
Cold-formed steel (CFS) is a typical green building material with the merits of being low-cost, lightweight, high-strength, and recyclable. CFS built-up section beams are widely used in CFS frames owing to their outstanding mechanical properties. However, a simplified and accurate method for calculating the flexural moment capacity of multi-limb built-up beams is missing in specifications. In this study, the flexural behaviors of CFS four-limb built-up beams with closed and open sections are investigated via experiments and finite element (FE) modeling. Firstly, the flexural moment capacities and failure modes of the beams are obtained by four-point bending experiments. The ultimate load capacity of the new open section beam is found to be higher than that of the closed section beam, and the failure mode is local buckling of the web and upper flange. Then, the FE models validated by the tests are developed to conduct an extensive parametric study. Numerical results show that the flexural moment capacity increases with the thickness and web depth. Finally, a simplified calculation method for the flexural moment capacities of the closed and open section beams is proposed by considering the reduction factor of gross section modulus of the built-up section.

1. Introduction

CFS structures have several merits, such as resistance to corrosion, high strength-to-weight ratio, and efficient construction. In recent years, the research and application of CFS structures have been promoted from low-rise to multi-story buildings. For multi-story buildings constructed with CFS, built-up section members are frequently adopted to avoid structural failures associated with large axial or bending loads. Currently, several types of CFS built-up members assembled by multiple C- or U-shaped channels have been used in the housing system. With the increase of cold-formed steel floors, multi-limb composite section members with higher load capacity will be considered. However, the procedures for calculating the load capacity of CFS multi-limb built-up members are not available in some specifications, e.g., Chinese specification (GB50018-2002) [1] and North American specification AISI-S100 [2], and thus specific research on this topic is required.
Many studies on the flexural behavior of CFS double-limb built-up beams have been conducted in recent years. Wang and Young [3] carried out experiments and numerical simulations on two types of CFS double-limb built-up beams with different screw spacings. For CFS double-limb built-up closed beams, the design formula is usually conservative. Abbasi et al. [4] presented and verified a new and practical compound strip method (CSM) for CFS built-up sections which was applied to the stability analysis. Yao and Zhou [5] proposed the direct strength method (DSM) and effective width method (EWM) to predict the flexural moment capacity of CFS I-beams based on the results of experiments and parametric analysis. Selvaraj and Madhavan [6] experimentally and numerically investigated the CFS back-to-back connected section beams and found that the flexural moment capacity of these beams predicted using the DSM is conservative. Manikandan et al. [7] studied the flexural behavior of stiffened CFS beams with upright, inclined, and complex edge stiffeners.
Ferdous et al. [8] investigated the flexural and shear behavior of the Layered Sandwich Beam (LSB). It was found that the shear and flexural strengths of the vertical LSB and horizontal LSB were significantly higher compared to single-sandwich beams. Al-Rubaye et al. [9] investigated the flexural performance of concrete one-way slabs reinforced with GFRP bars. Based on the aforementioned research, it was discovered that the suggested design guidelines for CFS beams in the current AISI specification may be conservative, and a new design equation may be needed. To this end, Yao and Zhou [10] carried out an experimental study and a numerical analysis on the flexural behavior of CFS built-up beams with I-sections and box sections under flexural moments. They proposed a simplified calculation method to predict the flexural moment capacities of CFS built-up beams with I-sections and box sections.
Studies relating to multi-limb built-up CFS beams have also been reported. Numerical research on the CFS beams with four types of cross-sections was conducted by Ghannam [11] based on the experimental study conducted by Laim et al. [12]. It was found that both the DSM and EWM would predict conservative results of the flexural moment capacities for the CFS built-up beams. Deepak and Shanthi [13] presented a parametric study on the CFS Hybrid Double-I-Box Beams. A new simplified design formula was proposed to predict the lateral-torsional buckling moment capacity of the beams. Currently, there are two main design methods, i.e., DSM and EWM, to predict the flexural moment capacity of the CFS multi-limb built-up section beams. However, both methods are conservative or hard to operate [1,2,3,6,7,11], especially for the design of multi-limb built-up section beams. Therefore, it is necessary to develop a simplified and accurate method for predicting the flexural moment capacity of CFS multi-limb built-up section beams.
In this study, a new CFS four-limb built-up section is proposed, with a focus on the flexural behavior of CFS four-limb built-up section beams. First, the flexural moment capacities and failure modes of two types of CFS four-limb built-up section beams are investigated via experiments. Then, FE models are built and validated using the test results. The FE models are used to study the effects of length-to-height ratio (L0/Hc), section height-to-width ratio (Hc/Bc), and flange width-to-thickness ratio (B0/ta) on the flexural moment capacities of the beams. Finally, a simplified calculation method for the flexural moment capacities of CFS four-limb built-up section beams is proposed based on the experimental and numerical data.

2. Experimental Tests
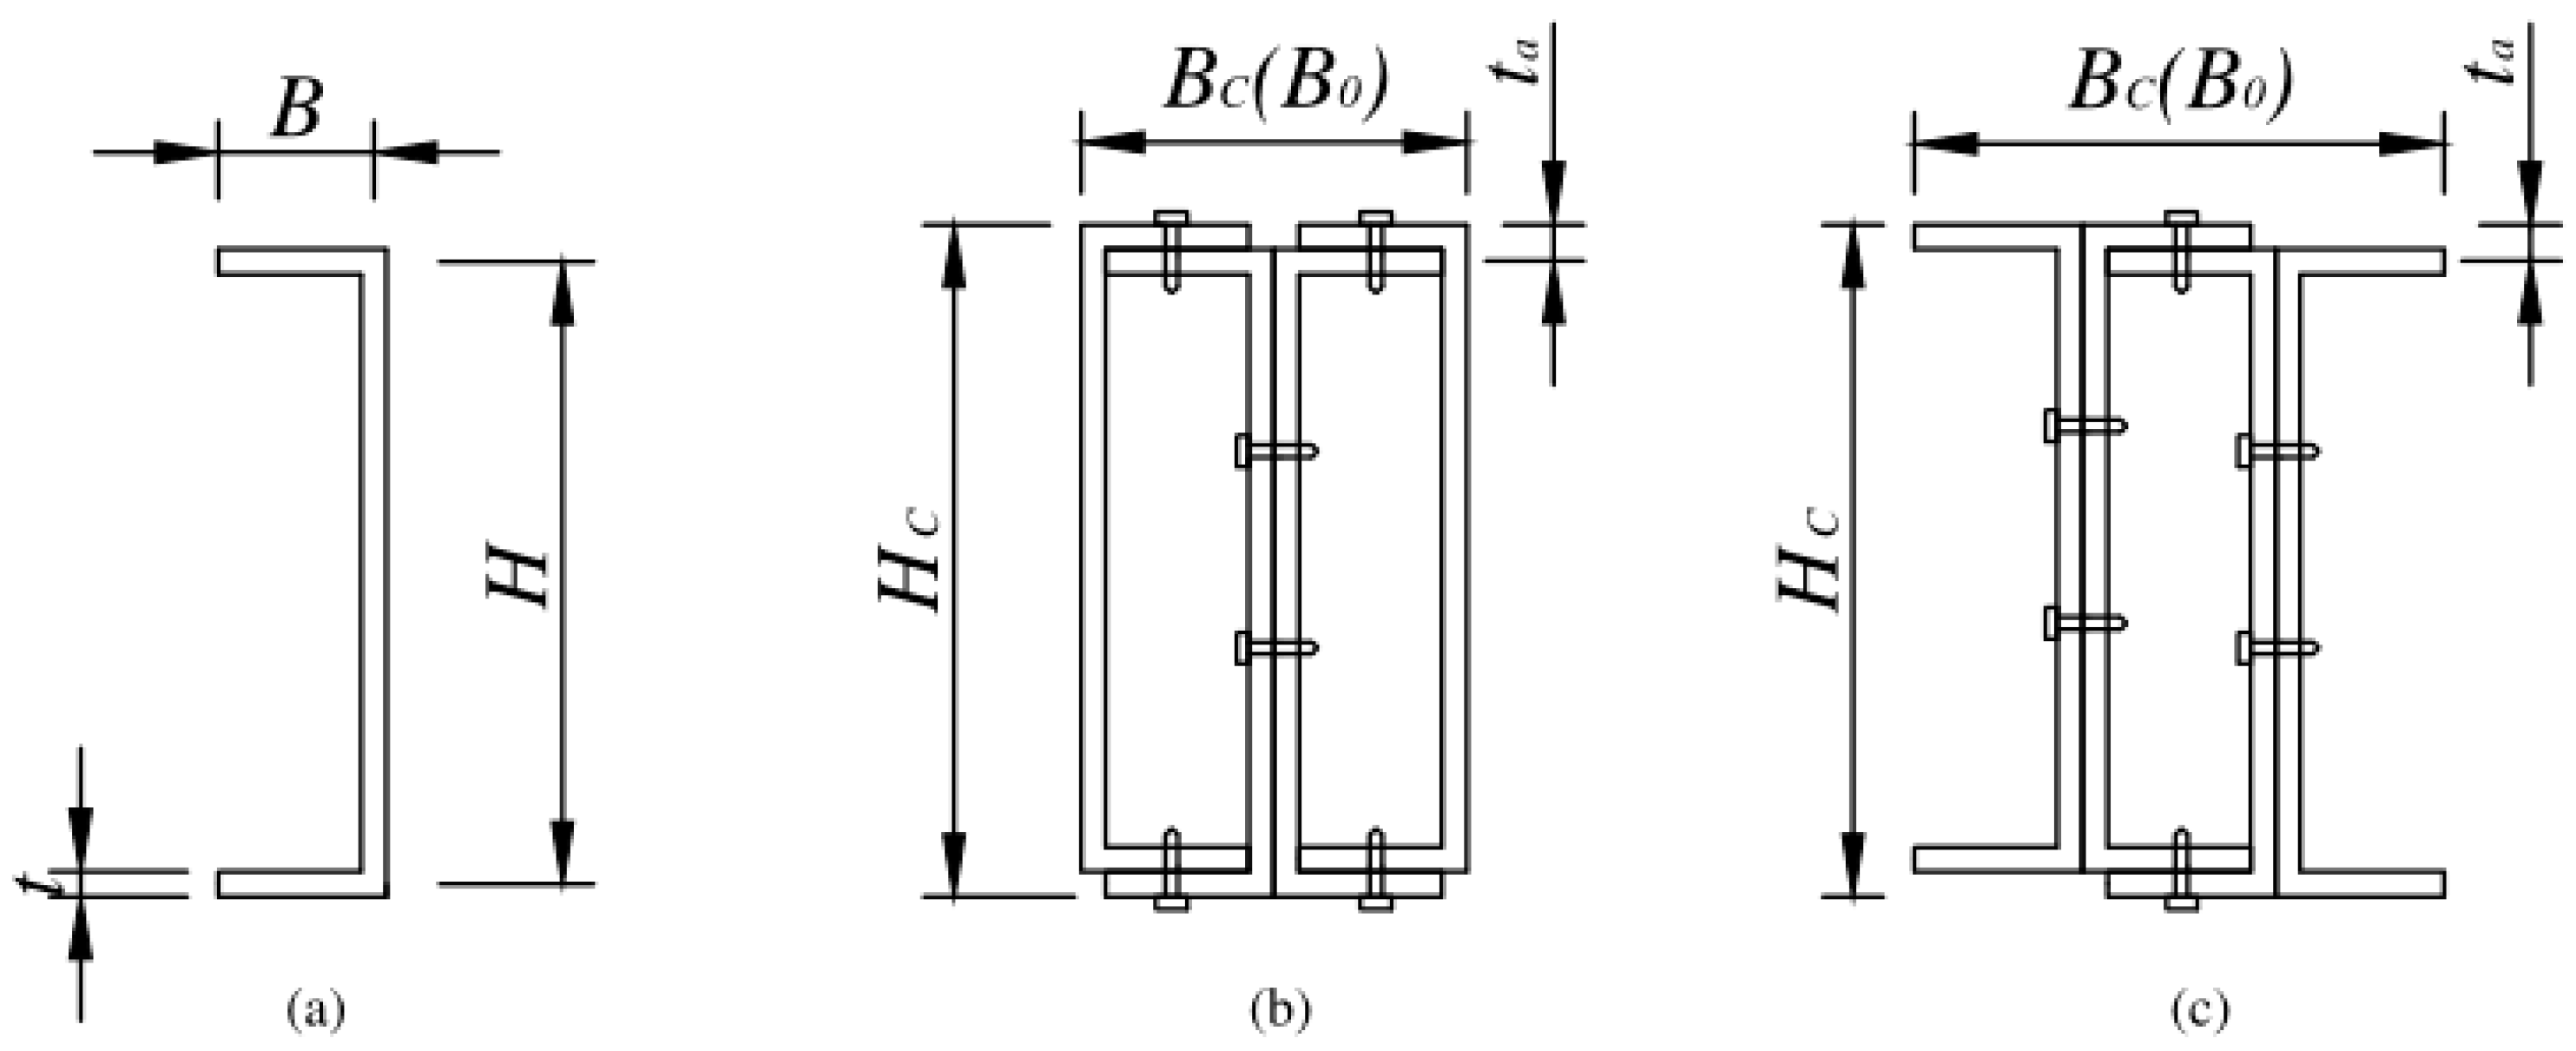
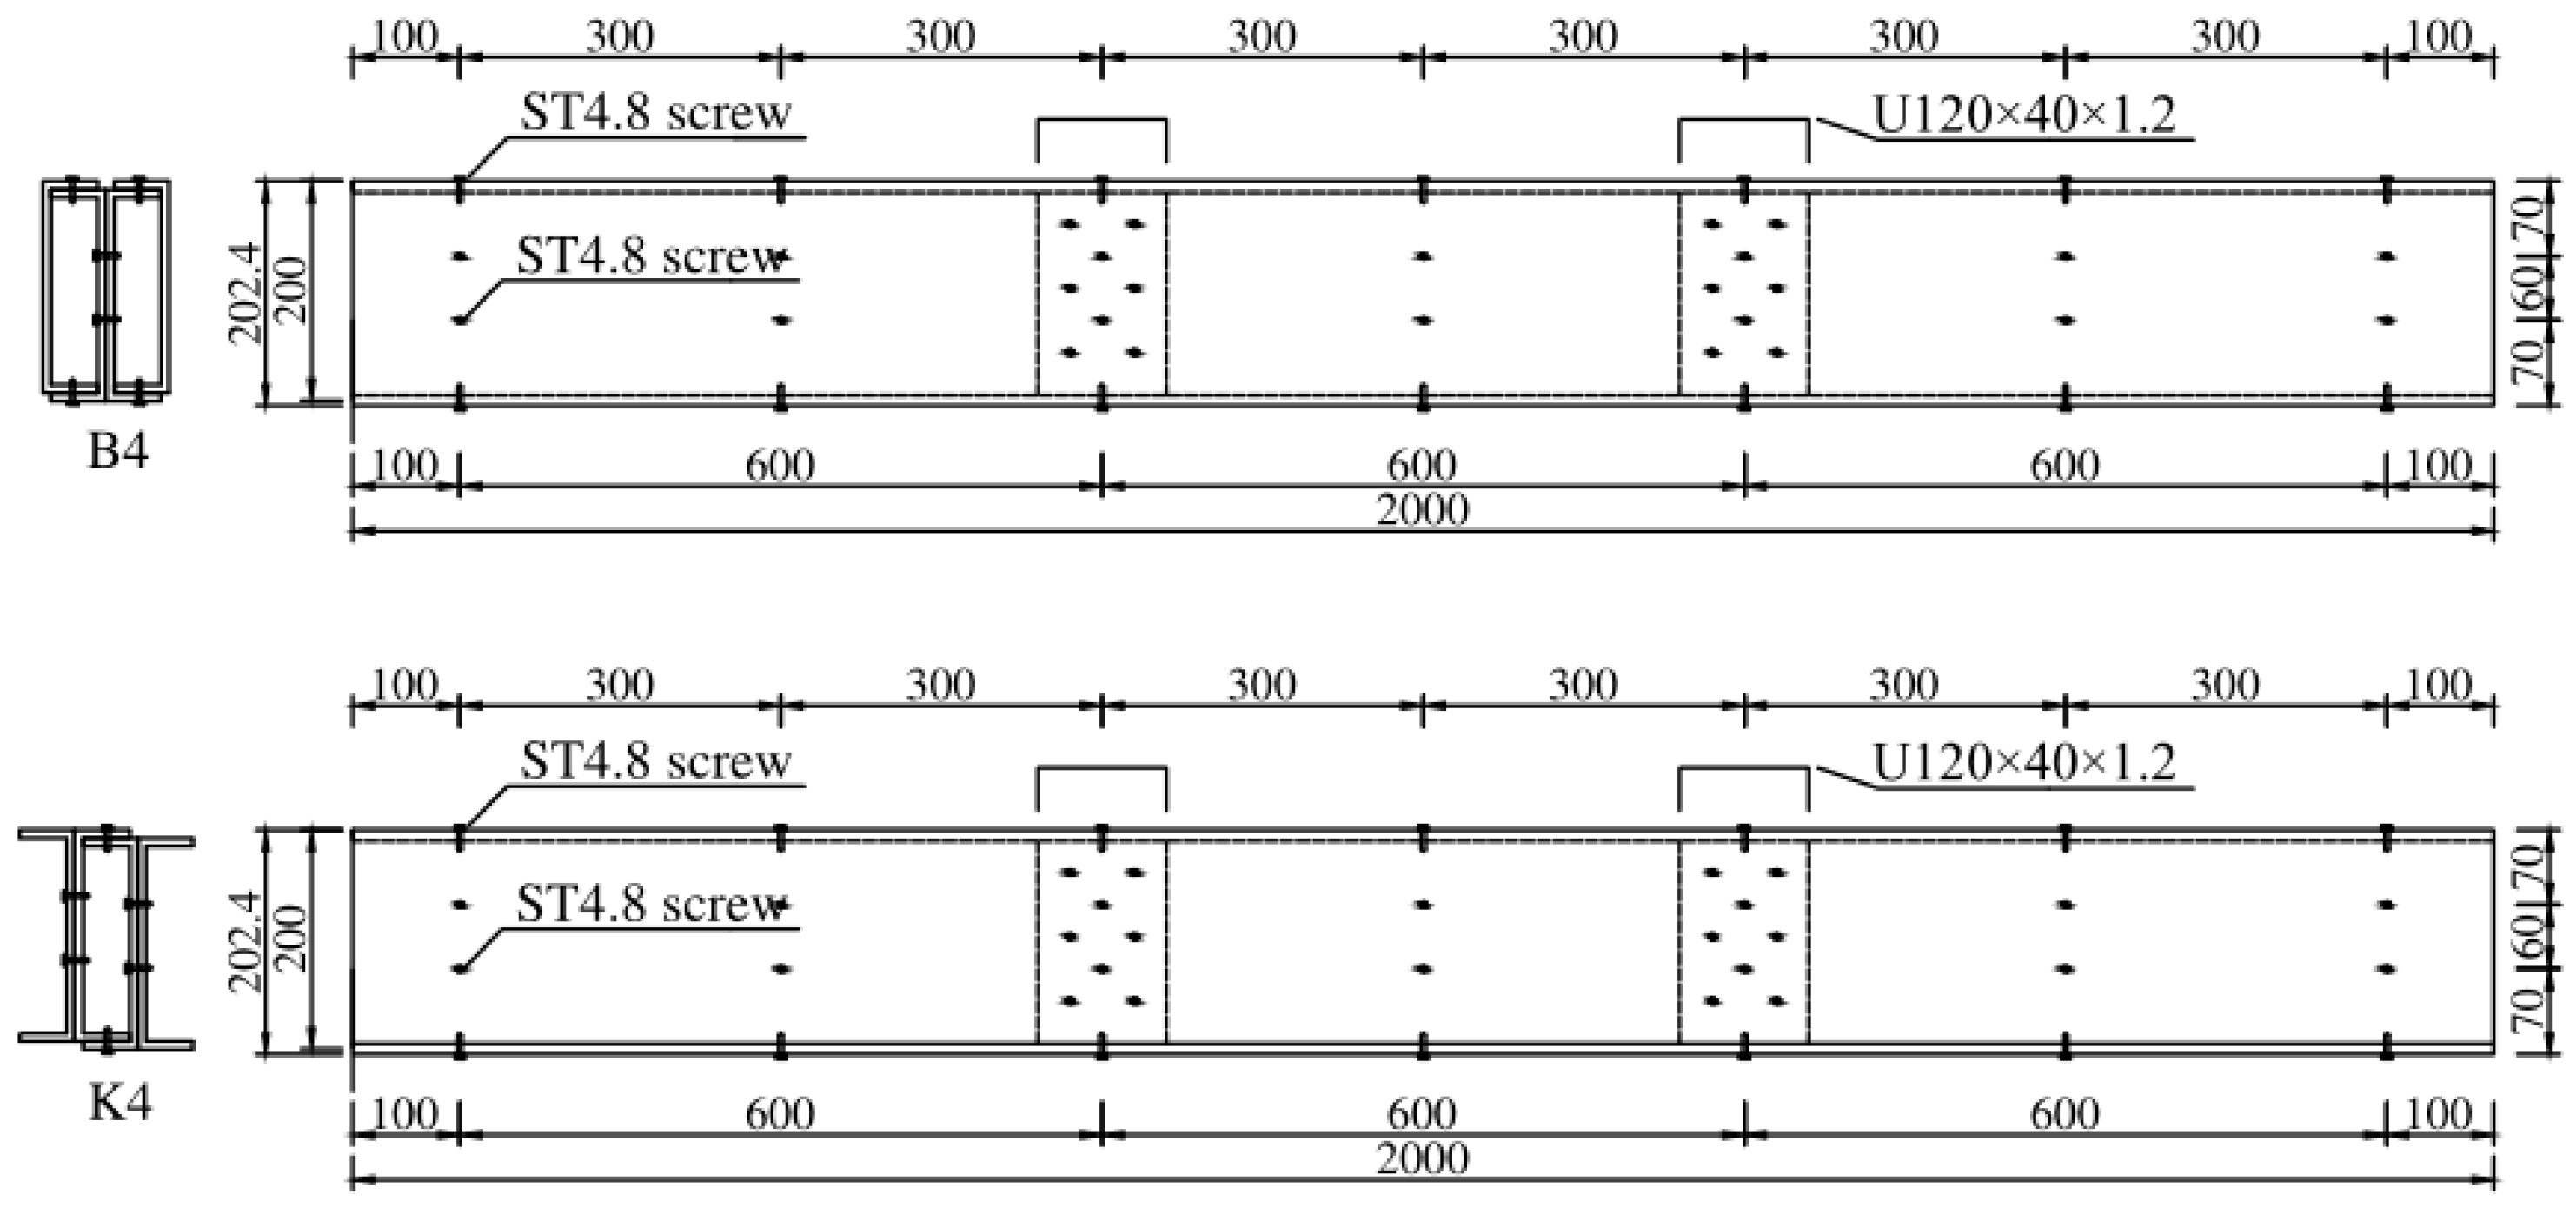
2.1. Test Specimens

The schematic of the tested four-limb built-up sections with closed and open configurations is shown in Figure 1b,c. The four-limb built-up beams with closed and open sections are abbreviated as B4 and K4, respectively. Each specimen is constructed by connecting four U-shaped CFS members (Figure 1a) with the same dimensions using self-tapping screws. For all members, the nominal thickness (t) is 1.2 mm; the nominal flange width (B) is 50 mm, the nominal web depth (H) is 200 mm; the length (L) is 2000 mm. The steel strength grade is Q235. The nominal diameter of screw is 4.8 mm and the screw spacing is adopted as 300 mm [11,14]. The nominal cross-sectional dimensions of B4 and K4 beams are shown in Table 1, and the geometric details of the specimens are presented in Figure 2.

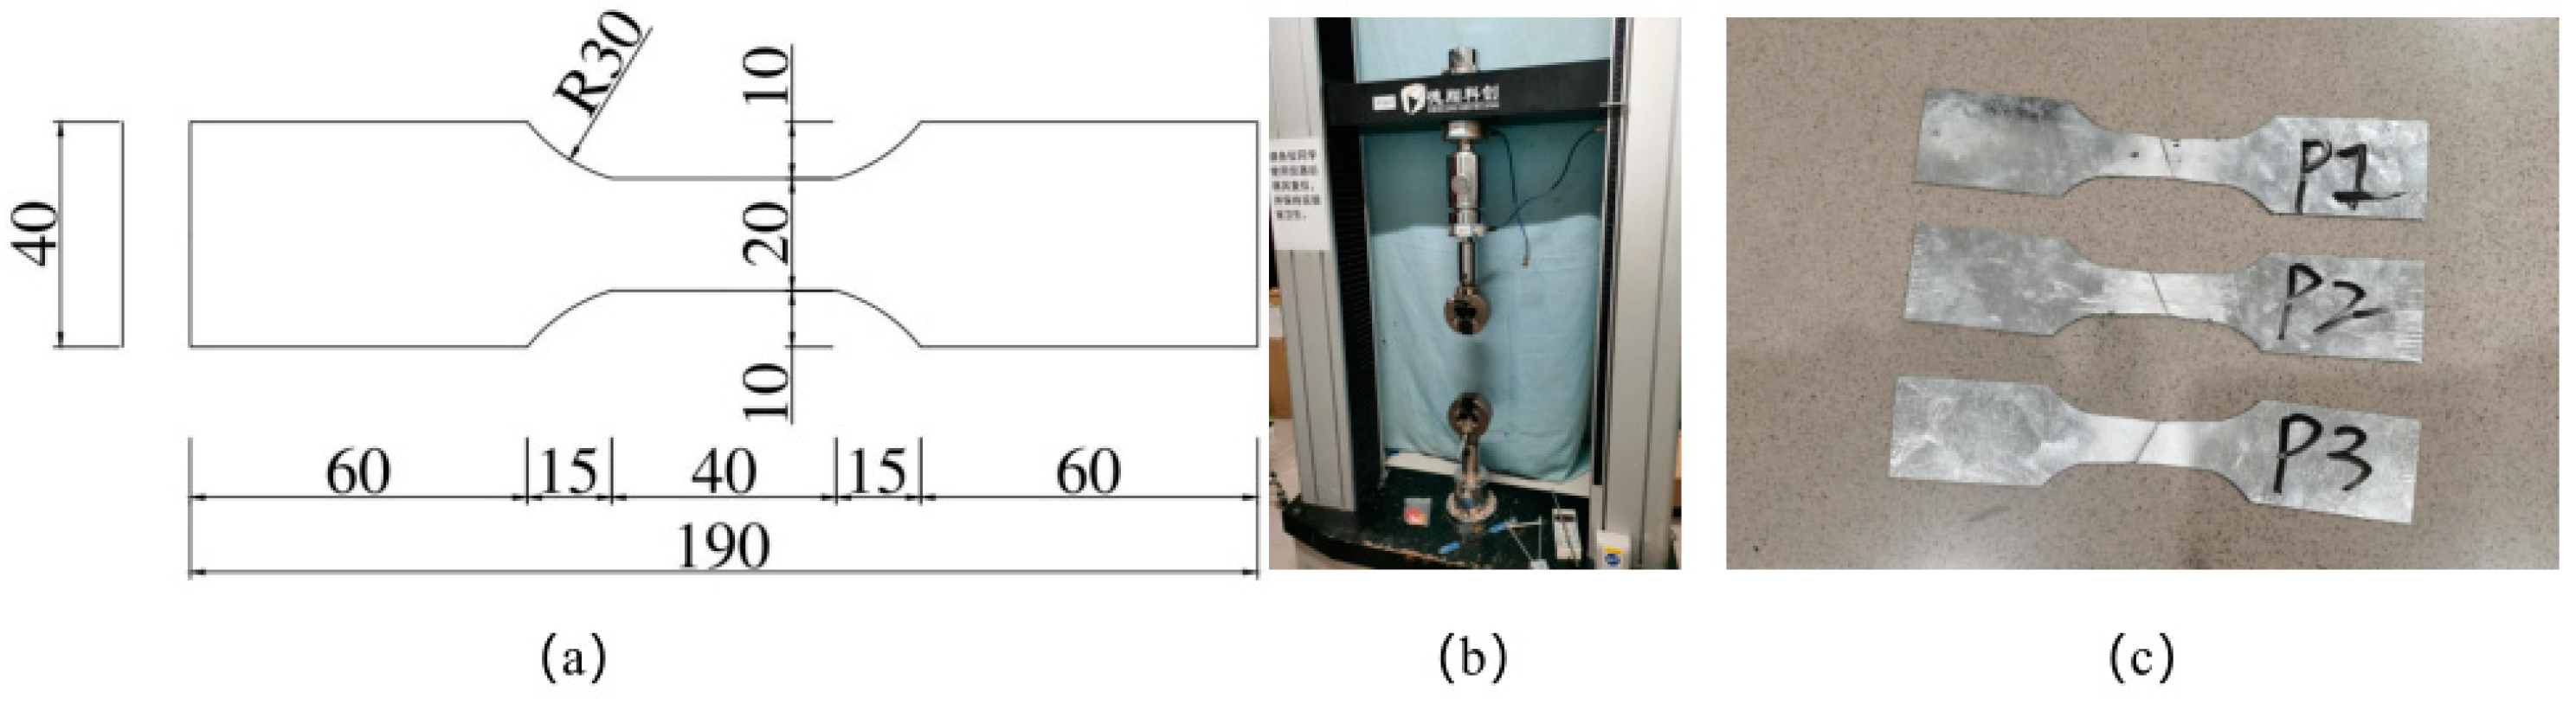
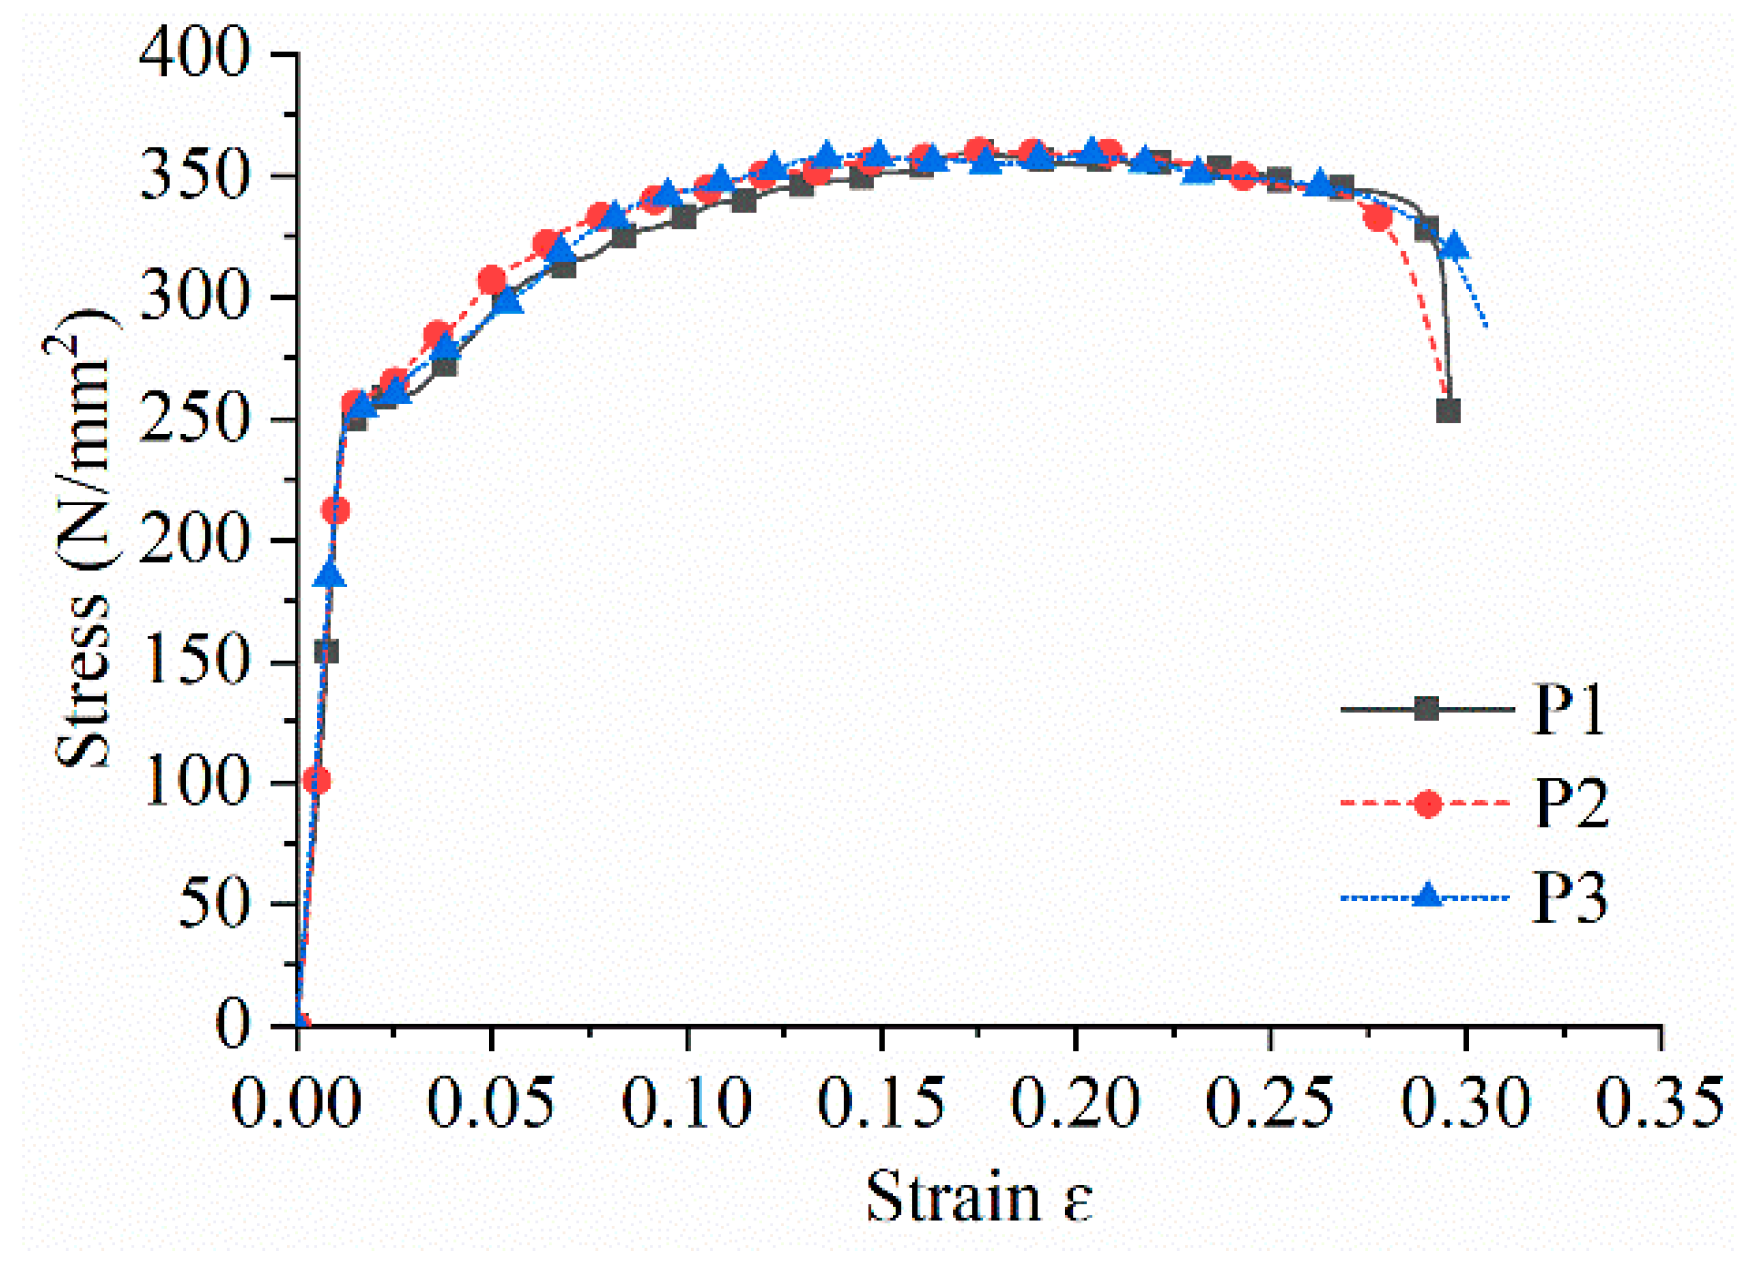
2.2. Material Testing

Tensile coupon tests are performed to determine the material properties of the steel. Three tensile coupons, obtained from the CFS plates in the longitudinal direction by wire cutting process, are used in the tests. The dimensions of the tensile coupons are determined according to the Tensile Testing specification [15] and are shown in Figure 3a. The tensile tests are carried out using a universal testing machine at a constant displacement rate of 0.5 mm/min, as recommended by Huang and Young [16]. During the test, the tensile stress and tensile strain are recorded by the universal testing machine and extensometers, respectively. Figure 4 shows the typical stress–strain curves of the tensile coupons with a thickness of 1.2 mm. The material properties obtained from the tensile coupon tests are summarized in Table 2.

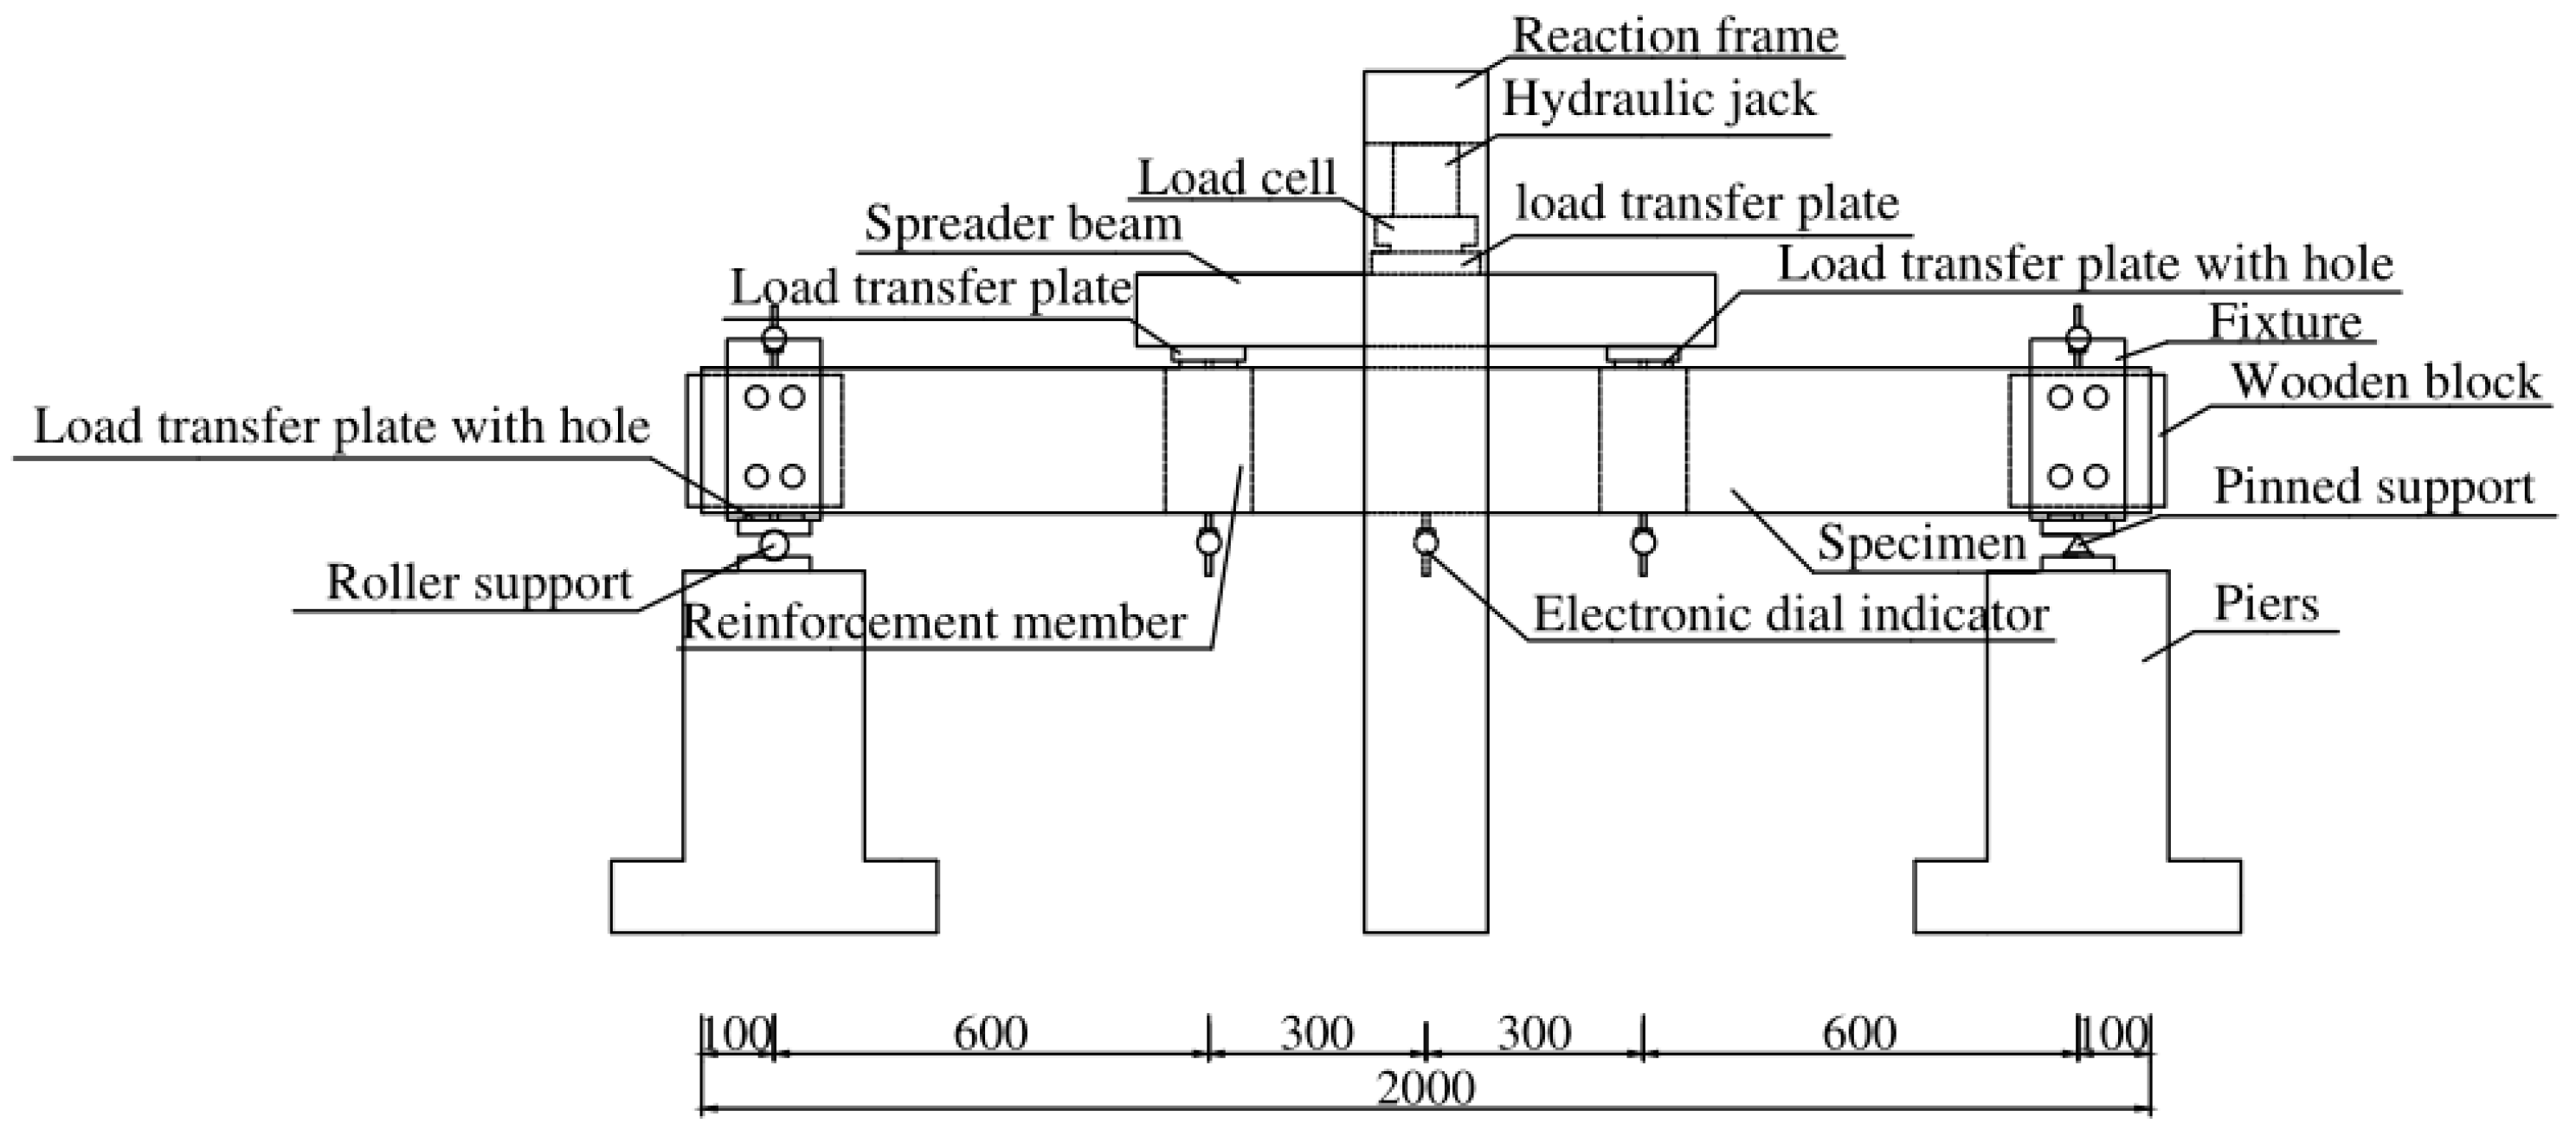
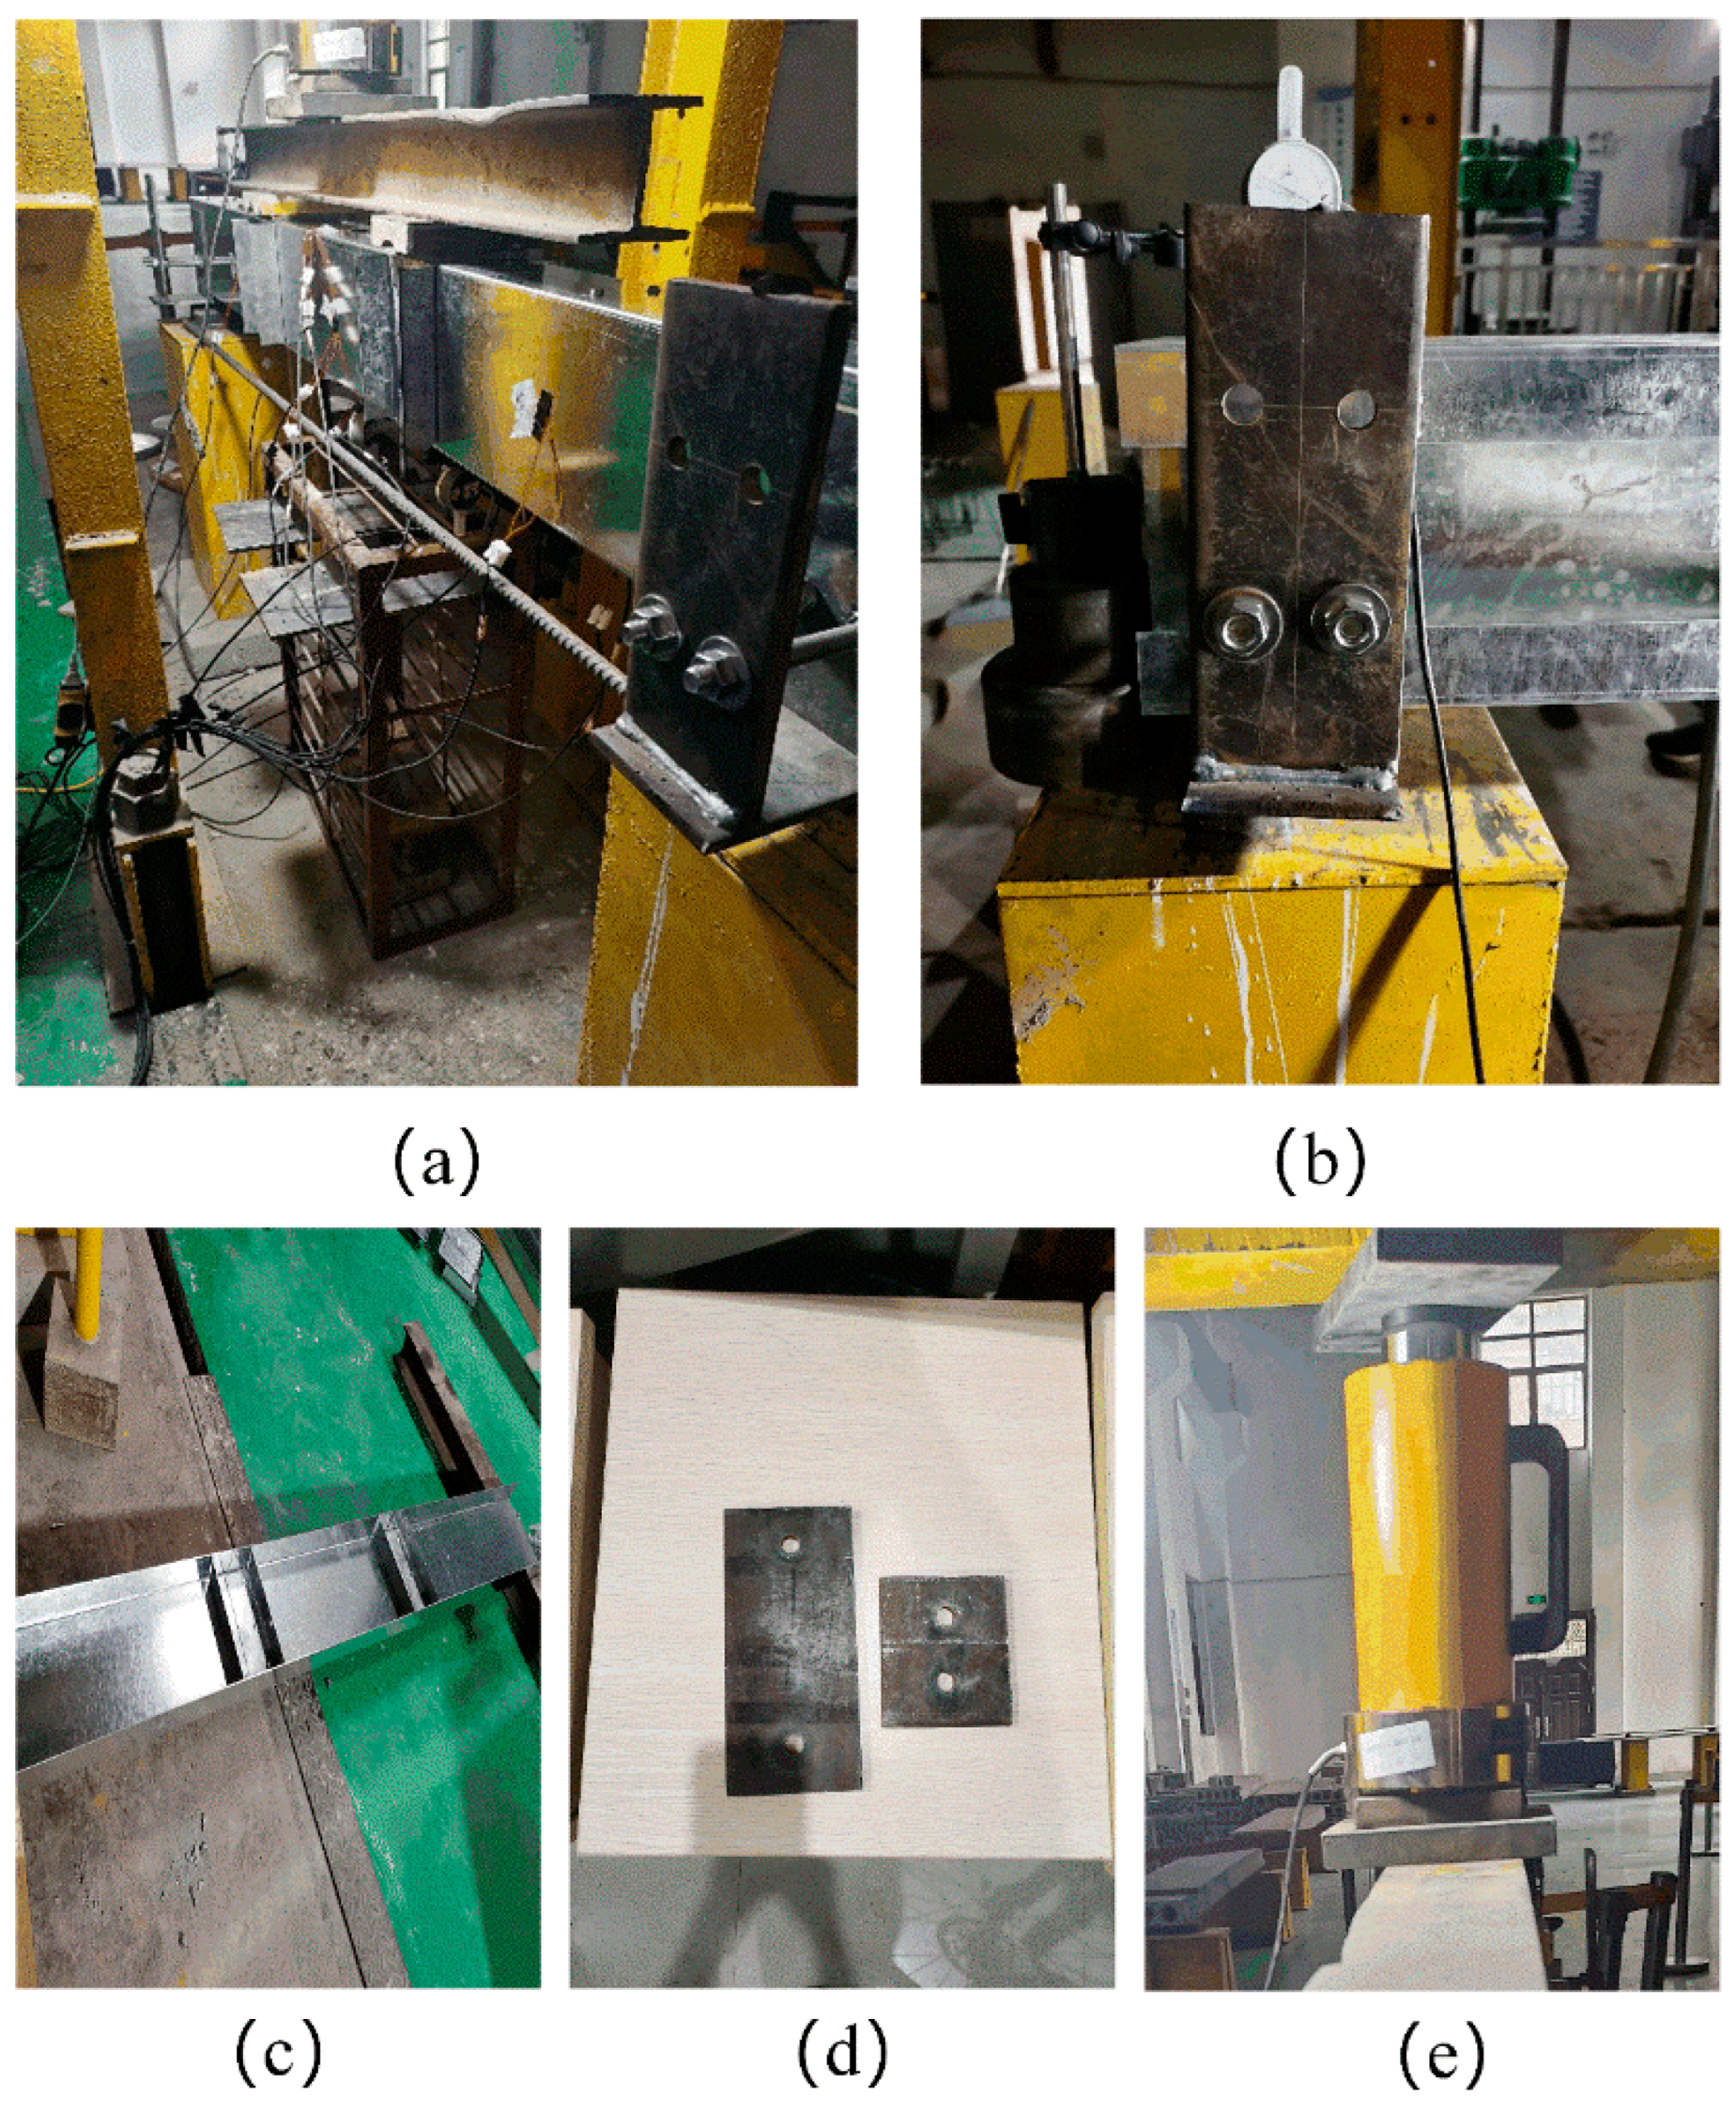
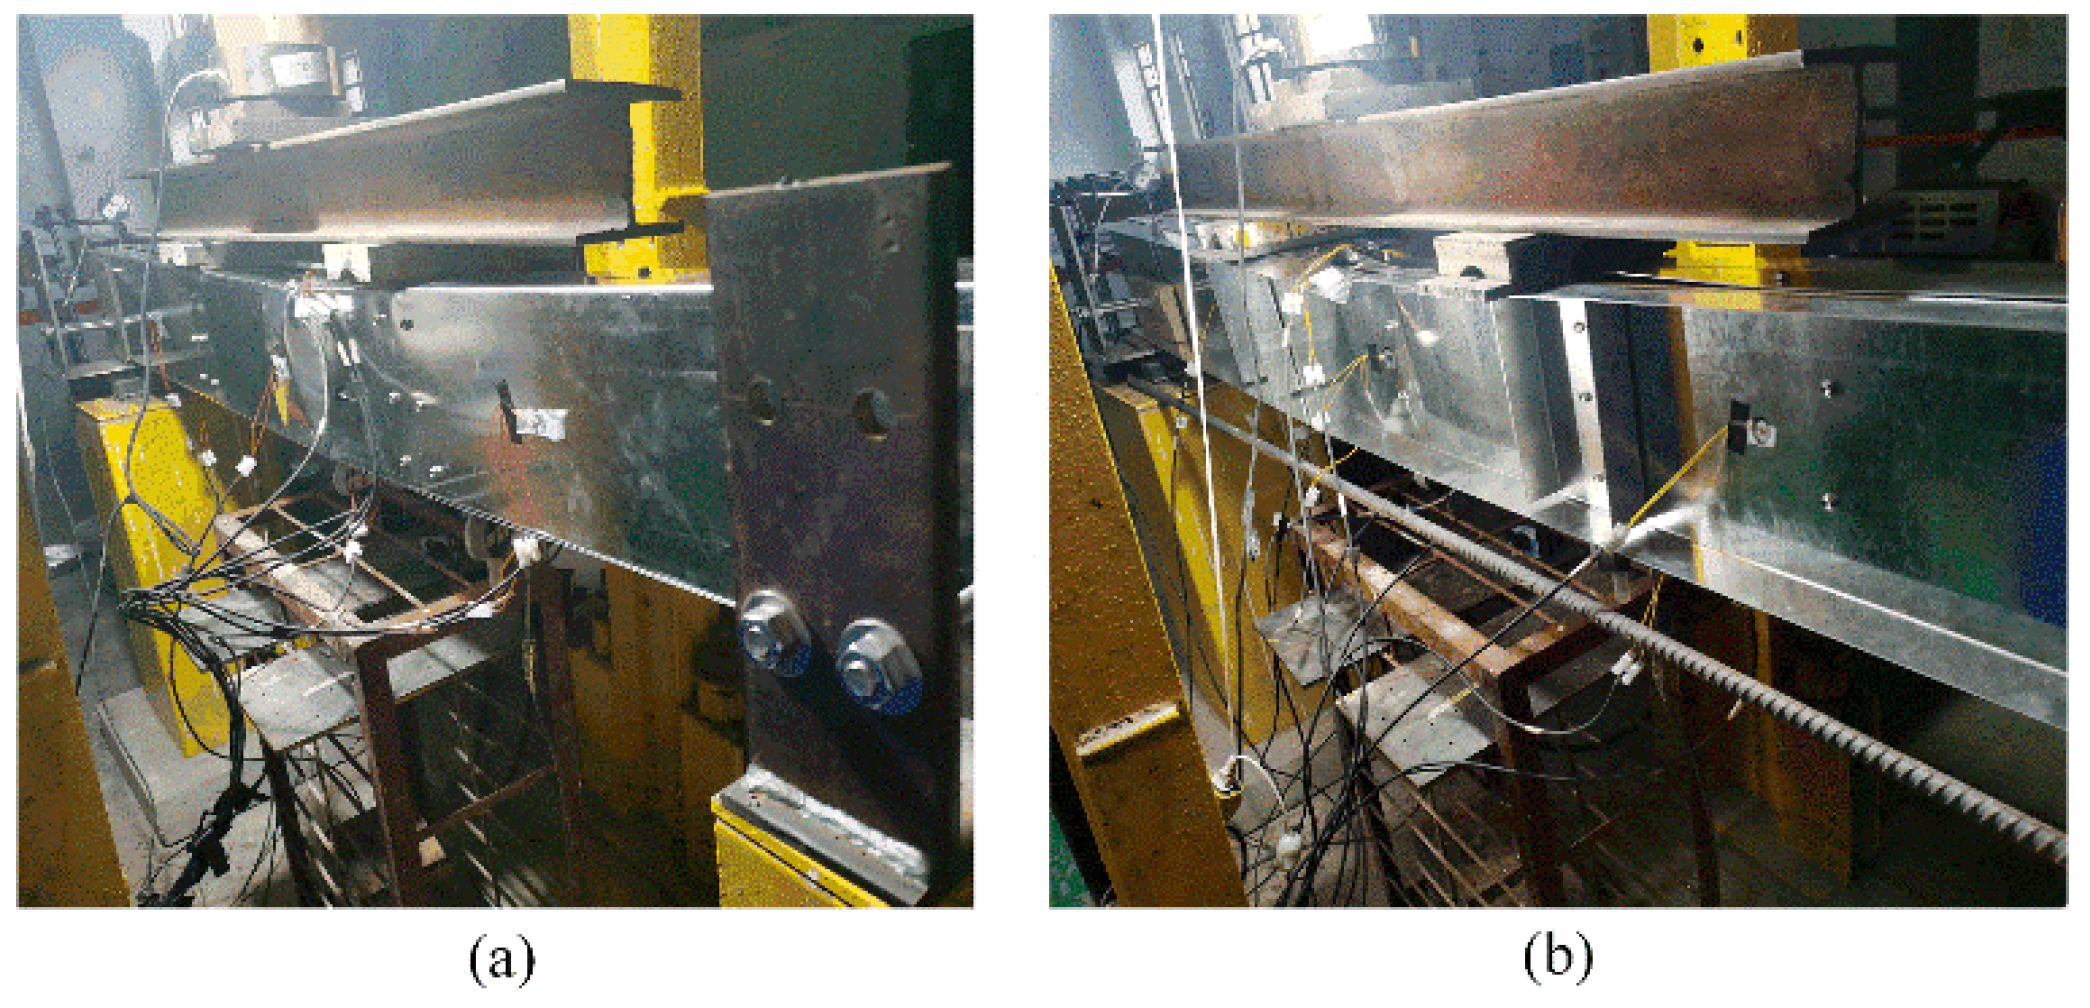
2.3. Test Set-Up and Loading

In the present study, four-point bending tests [12,17] are carried out to get the ultimate load capacities and failure modes of the built-up section beams, as illustrated in Figure 5. The test setup of the B4 beam is shown in Figure 6a. As seen in the figure, the beams are mounted on a roller contact nest at one end and pinned support at the other end. The lengths of the B4 and K4 beams are both 2000 mm. The lengths for the two shear spans and the moment span (one-third of the beam span) are 600 mm. To prevent lateral instability, fixtures (Figure 6b) are attached at the support positions of specimens. In addition, the reinforcement components (Figure 6c) are added on the beam webs at the loading points of specimens to avoid punching shear failure of the beam webs there. The dimensions of the reinforcement components (CFS) are U120 × 40 × 1.2 (mm). Note that the length of the web clear height is slightly bigger than the reinforcement components (CFS) to avoid the components touching the flange during the test. The cross-sections of the specimens at the support positions are filled with 200-mm long wooden blocks to avoid web buckling at the support positions. To prevent stress concentration at nail caps, load transfer plates with holes (Figure 6d) are used at the loading and support points.
The loads are applied by the hydraulic jack (Figure 6e) using the manual loading method. The hydraulic jack has a maximum load capacity of 200 kN. A load cell with a capacity of 300 kN is installed under the hydraulic jack to monitor the loads. The loading rate is controlled during the test such that it will slow down when the flexural deformations of the specimen cross-section occur or the load value reaches 80% of the estimated ultimate load capacity. It should be noted that the hydraulic jack stops loading when the load value reduces to about 80% of the ultimate load capacity. During the test, the acquisition system is used to collect the data of electronic dial indicators and the load cell.

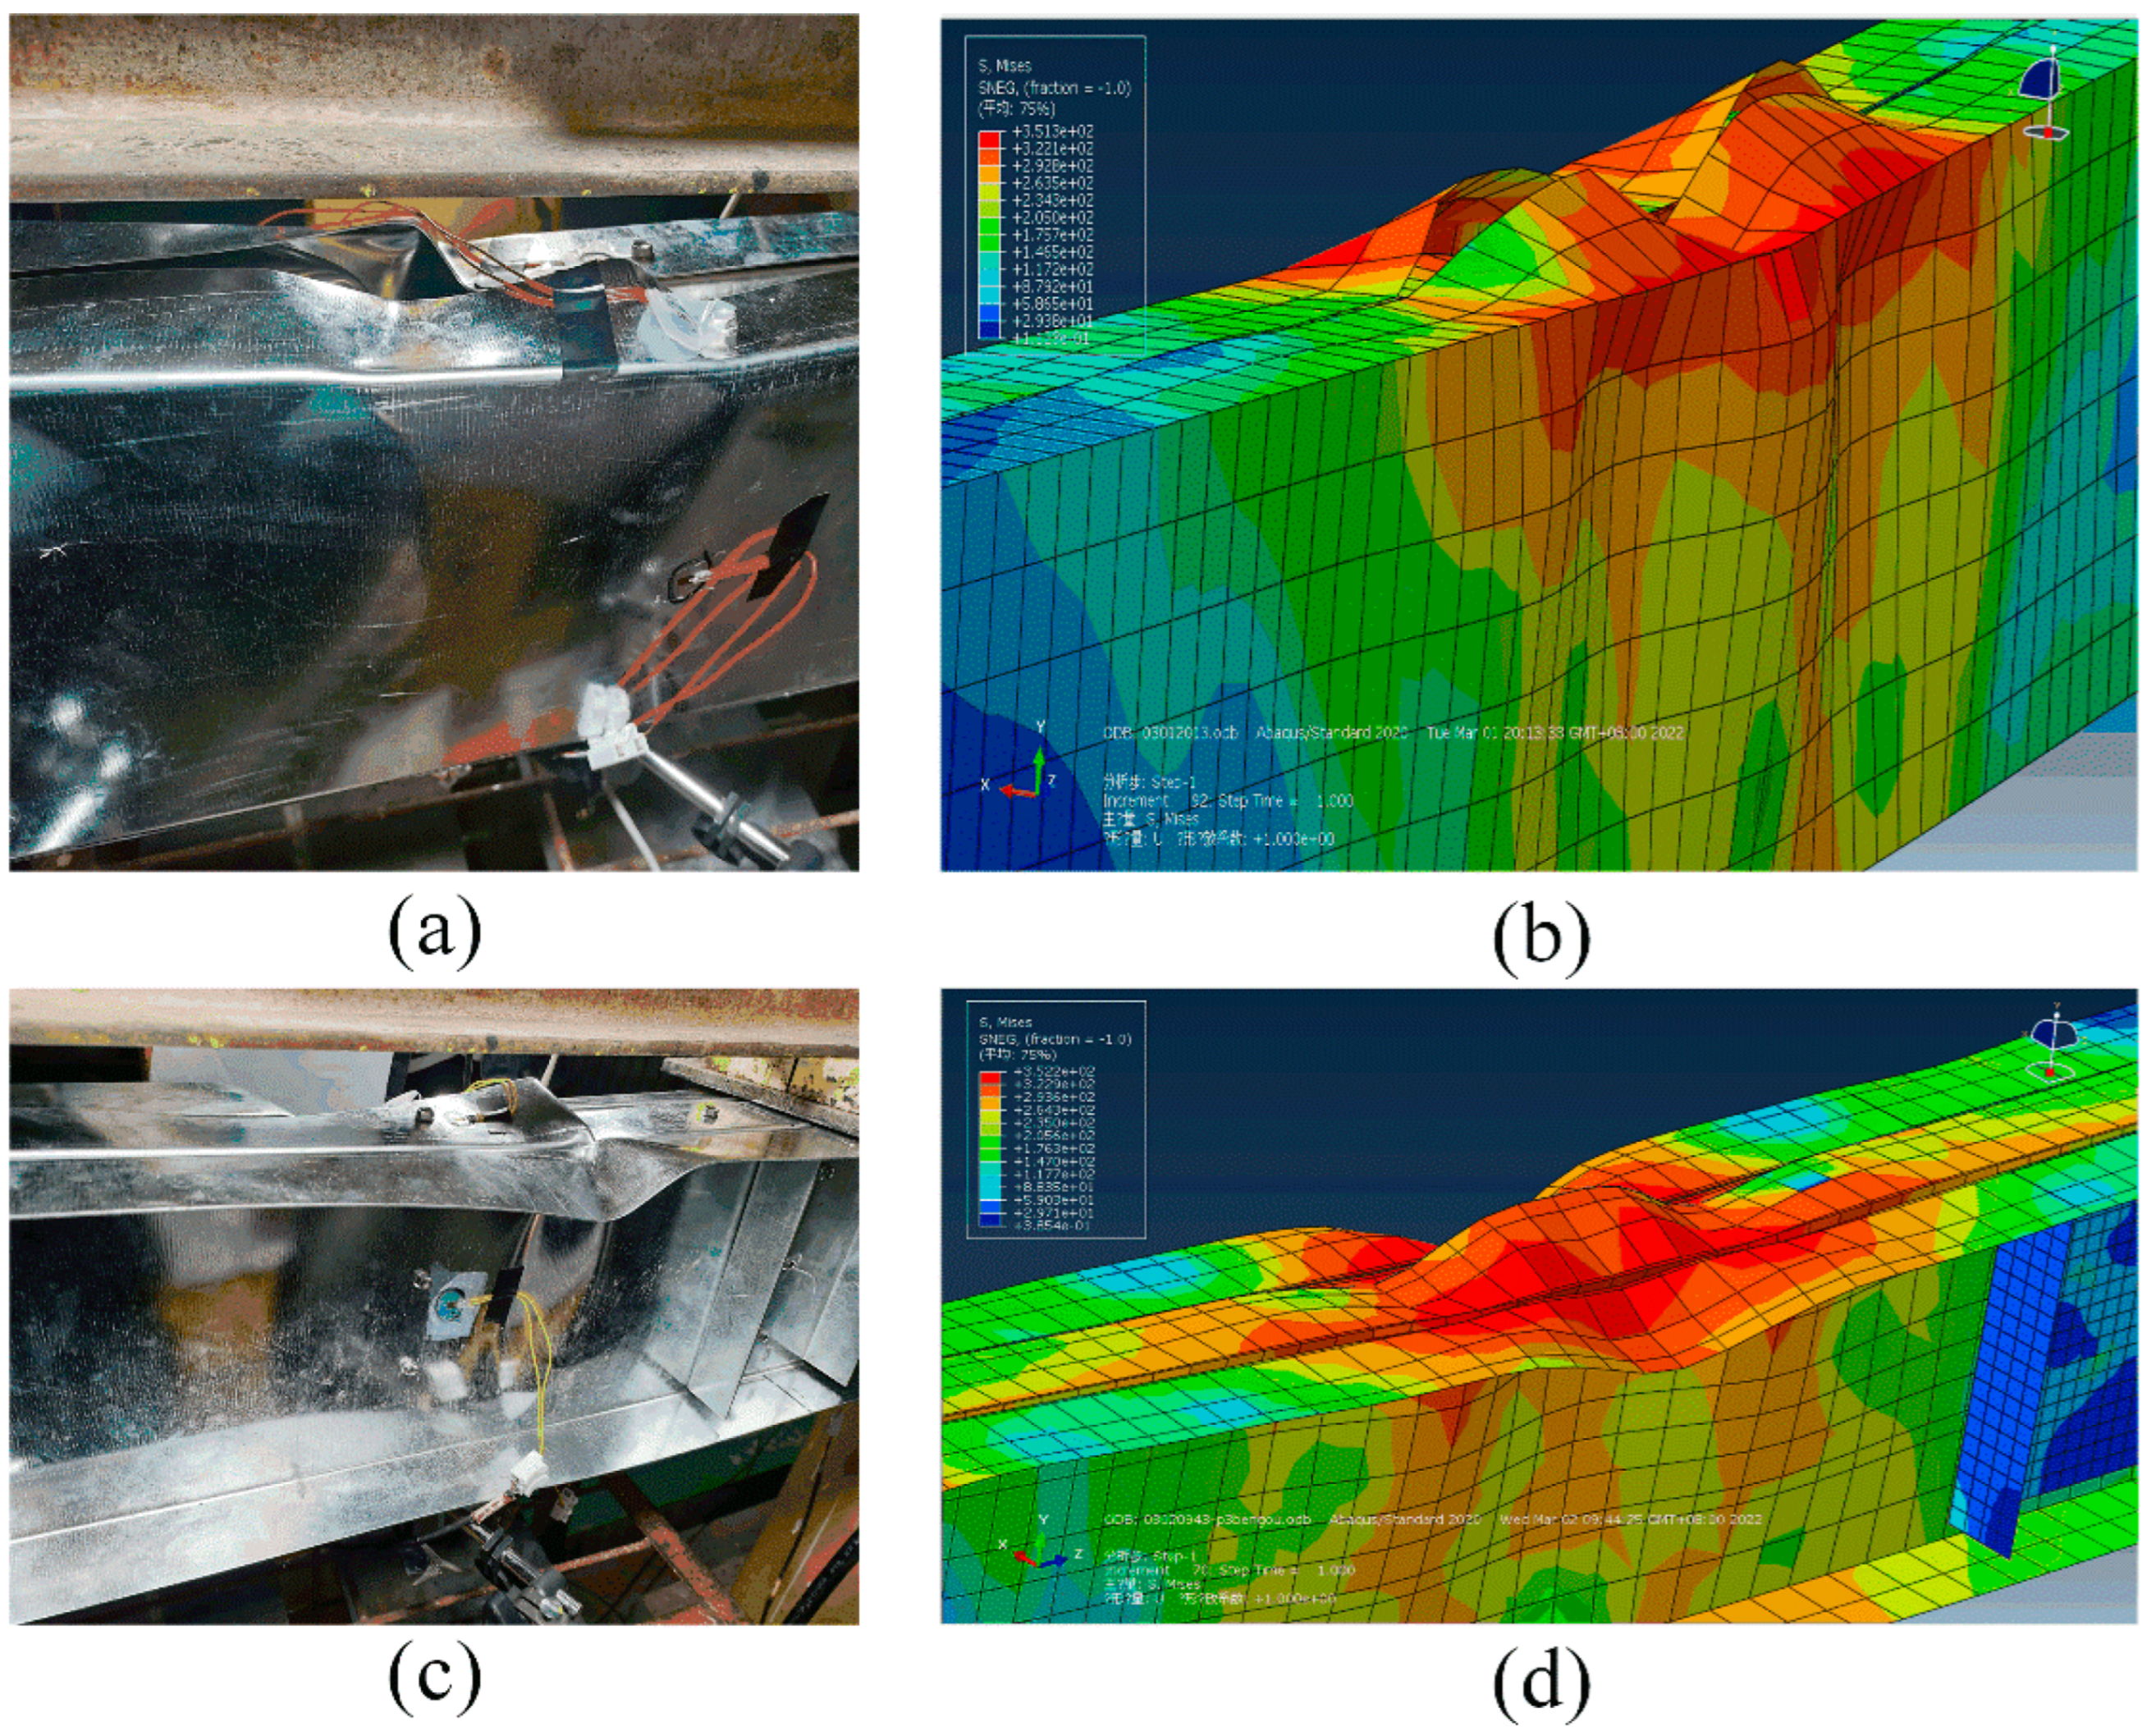
2.4. Test Results and Discussion

Figure 7 shows the failure modes of B4 and K4 beams. It is seen that the main deformation region is located in the pure bending segment and there is almost no deformation of the specimens at the loading and support points due to the supporting role of the reinforcement components and the filled wooden blocks. In addition, no lateral-torsional buckling occurs in these specimens, and no slippage or large deformations of the screws are observed. Close views of the failure modes and deformations of the B4 and K4 beams at the mid-span are depicted in Figure 8a,c, respectively. Some folds emerge on the upper flange and many bulges occur on the web for the beams, indicating that local buckling is the main failure mode. It is observed that both beams undergo a large deformation in the web first, and when the web bulges, the adjacent upper flanges are pulled to delay buckling until they both flex simultaneously, causing buckling failure of the beam. The upper flange deformations of the B4 beam are smaller than those of the K4 beam, which is due to the smaller width-to-thickness ratio of the upper flange of the B4 beam (41.7) than that of the K4 beam (93.8). Moreover, it is observed that the web deformations of the B4 beam are larger than those of the K4 beam. The main reason is that the webs of the K4 beam are all connected back-to-back and have a lower depth-to-thickness ratio (83.3) than the value for the webs of the B4 beam (166.7).
Figure 9 shows the mid-span load-vertical displacement curves for the two tested beams (B4 and K4). As shown in the figure, the two beams are in the elastic stage before the load value reaches 80% of the ultimate load capacity. In this elastic stage, the curves of the two beams in Figure 9 almost coincide, indicating that the stiffness of these two beams is close to each other. It can also be found from Figure 9 that in the plastic stage, the deflections of the B4 and K4 beams increase rapidly with the increase of the applied load, and the applied load sharply decays without a plastic plateau after reaching the ultimate load. Table 3 shows the ultimate loads of the beams. It can be seen that the ultimate load capacity of the K4 beam is 15% higher than that of the B4 beam. This is because the ratio B0/ta for the web of the B4 beam (166.7) is larger than that of the K4 beam (83.3), which causes the B4 beam to be more prone to local buckling.

3. Finite Element Modeling and Parametric Study

3.1. General

For the numerical analysis, the FE method is utilized due to its accuracy, computational efficiency, and economics. As the complex interactive buckling modes associated with CFS beams can be reproduced well in FE modeling, this numerical approach is well-suited for the present research purpose. In this study, the software ABAQUS [18] is used to implement the FE study.

3.2. Element Type and Mesh

The CFS four-limb built-up section beams and their reinforcement components are modeled by a linear four-noded quadrilateral thick (S4R) shell element according to the dimensions presented in Table 1 and Figure 2. The S4R shell element has six degrees of freedom per node. Since the thickness of the load transfer plates at the loading and support points are 10 mm and their deformation is not observed during the tests, the C3D8R solid element is chosen to simulate load transfer plates. This type of element contains three degrees of freedom, corresponding to X, Y, and Z translations. To balance the computation efficiency and the simulation accuracy, a sensitivity analysis of the mesh size is performed. It is found that the optimal mesh size for modeling the two tested beams and their reinforcement components is 20 mm × 20 mm, and that for the load transfer plates the optimal size is 30 mm × 30 mm, as shown in Figure 10.

3.3. Material Properties and Contact Properties

The Poisson’s ratio is adopted as 0.3 and the other values of material parameters used in the FE models are obtained from the results collected from the tensile coupon tests. The von Mises yielding criterion was chosen as the failure criterion of the FE models [17]. Since the deformation of the load transfer plates is found to be small, Young’s modulus of the load transfer plates is set as ten times that of the U-shaped steel beams to ensure that the load transfer plates are always in an elastic stage. In this study, residual stresses and cold-work due to forming are ignored [19,20].
The flexural moment capacity and failure modes of the CFS beams are the main goals of the numerical analysis. Since the deformation of the screws is small, the screws are not physically modeled [3]. The node pairs of the screws are connected using the tie constraint. All contact pairs are defined as surface interactions using face-to-face discretization. In the contact properties, the normal behavior is defined as “hard contact” [21]. The tangential behavior is defined as frictionless, and the tangential behavior of the contact between the U-shaped CFS beams and the load transfer plates is defined as the penalty method with the friction coefficient set to 0.2 [22]. The separation between the contact pairs is allowed under tension. Considering the element type, the tolerance between the contact surfaces is the thickness of the U-shaped steel. The tolerance between the U-shaped CFS and the load transfer plates is 0.5 times the thickness of the U-shaped steel.

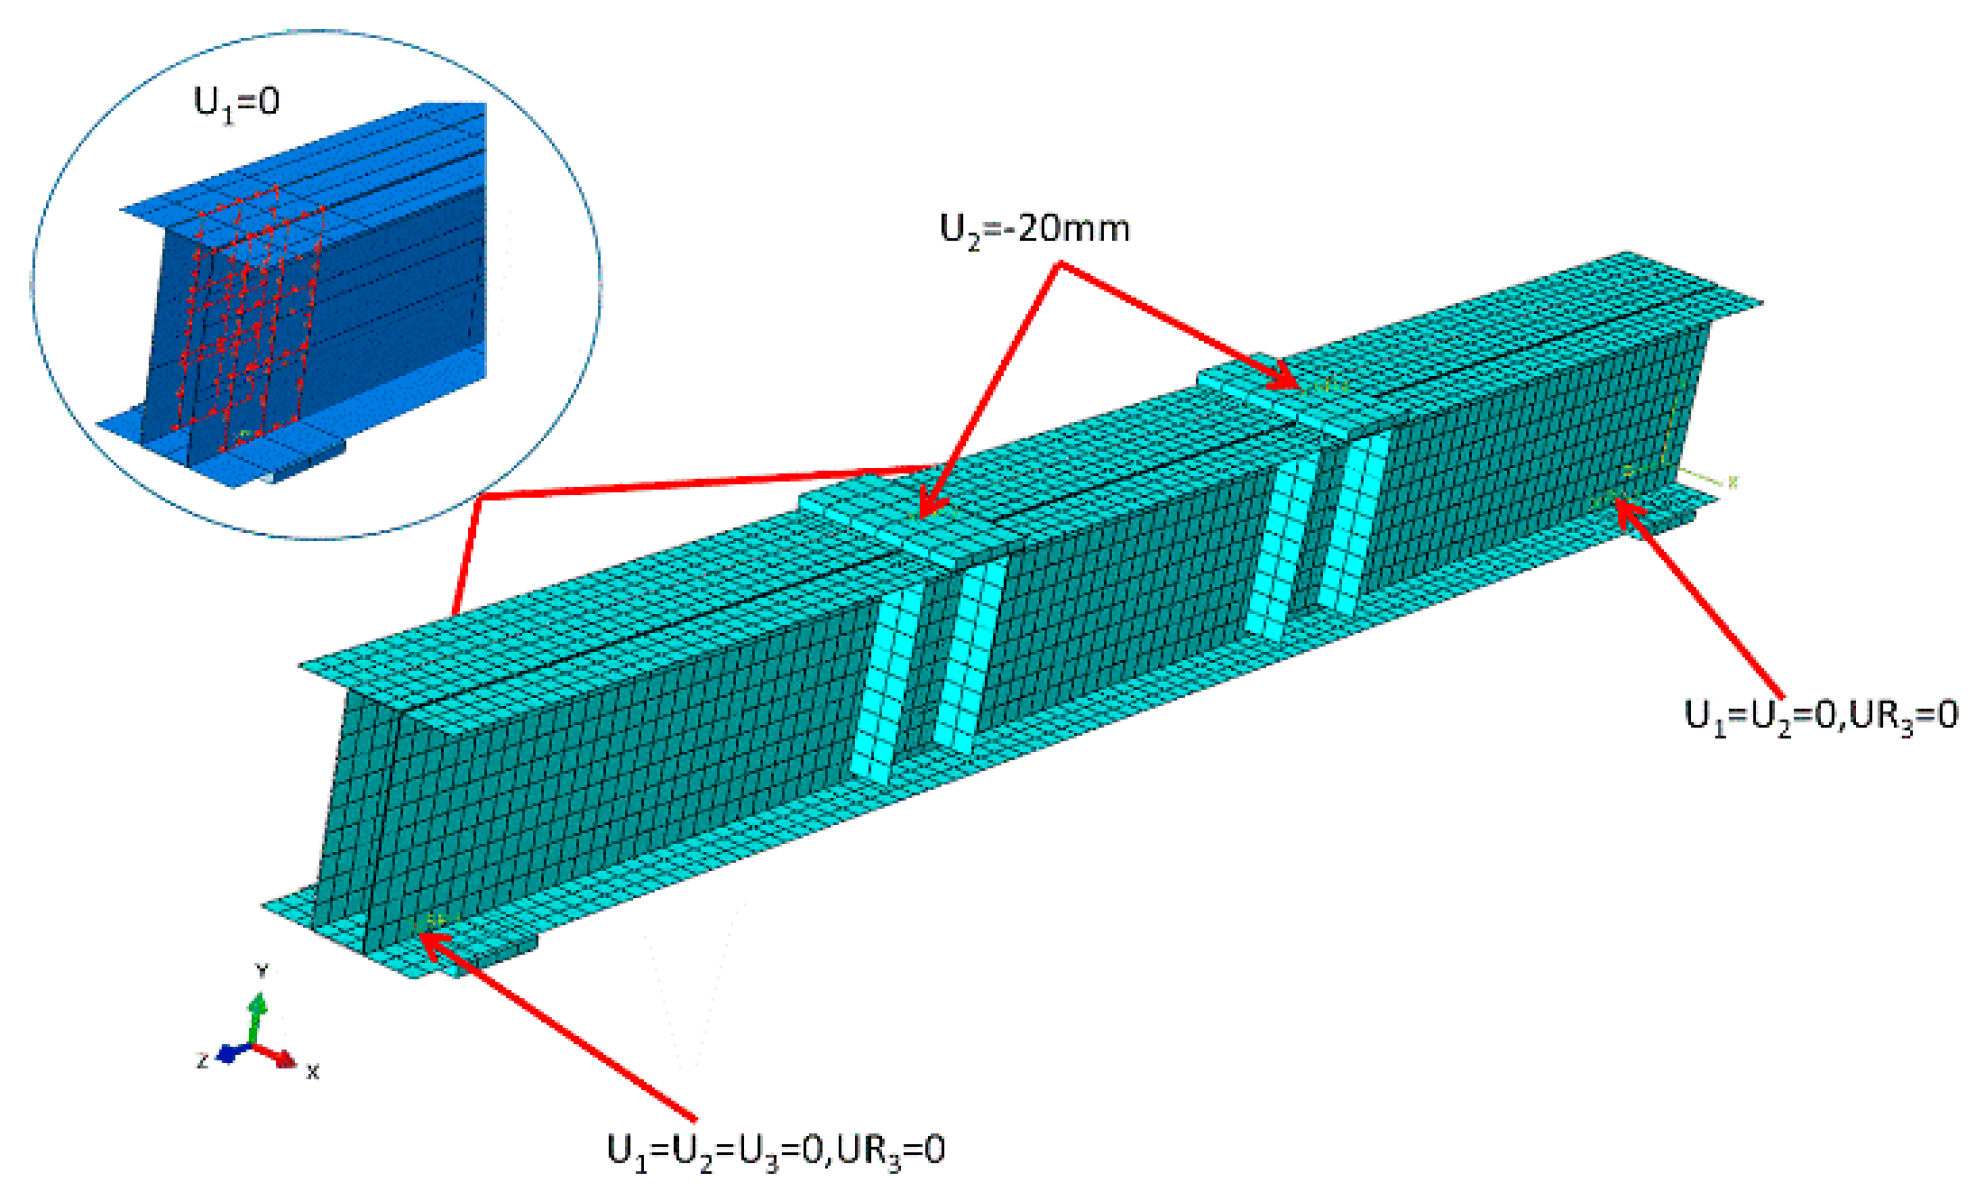
3.4. Boundary Conditions and Loading

To mimic the actual test, the boundary conditions and loads of specimens are applied to the load transfer plates connected to the specimens. The outer surface of the load transfer plate is coupled to the center by setting a reference point, to which the loads are applied. As shown in Figure 10, simple support conditions were simulated by setting U1 = U2 = U3 = 0, UR3 = 0 at one end of the beam and U1 = U2 = 0, UR3 = 0 at the other end of the beam, where 1, 2, and 3 represent the X, Y, and Z directions, respectively, and R3 denotes the direction of rotation around the Z axis.
To simulate the loading process, the displacement load of U2 = −20 mm is applied at the reference points of the middle two load transfer plates. Here, the minus sign means the opposite direction to the axis. The roles of the fixture and the wooden block at the support position are simulated by setting the lateral displacement of the web near the support as 0 (U1 = 0) in the FE models.

3.5. Initial Geometric Imperfections and Analysis Methods

The FE analysis may overestimate the ultimate load capacity when the local imperfections are ignored [23]. The magnitudes of the local and global imperfections for the beams are conservatively chosen as 0.5t and L/1000, respectively [24,25]. Note that t and L denote the thickness and length of the U-shaped steel, respectively.
To introduce initial imperfections in the non-linear analysis, the FE model is analyzed in two separate steps. The first analysis step includes a buckling analysis (eigenvalue analysis) on the perfect specimen to obtain the buckling modes (eigen-modes). Local and global imperfections are reintroduced into the FE models by superimposing the eigenmodes from the buckling analysis. In the second analysis step, a static Riks analysis is conducted to obtain the flexural capacities and failure modes. In total, the maximum number of incremental steps is set to 1000, and the initial arc length increment is set to one with an estimated total arc length of one.

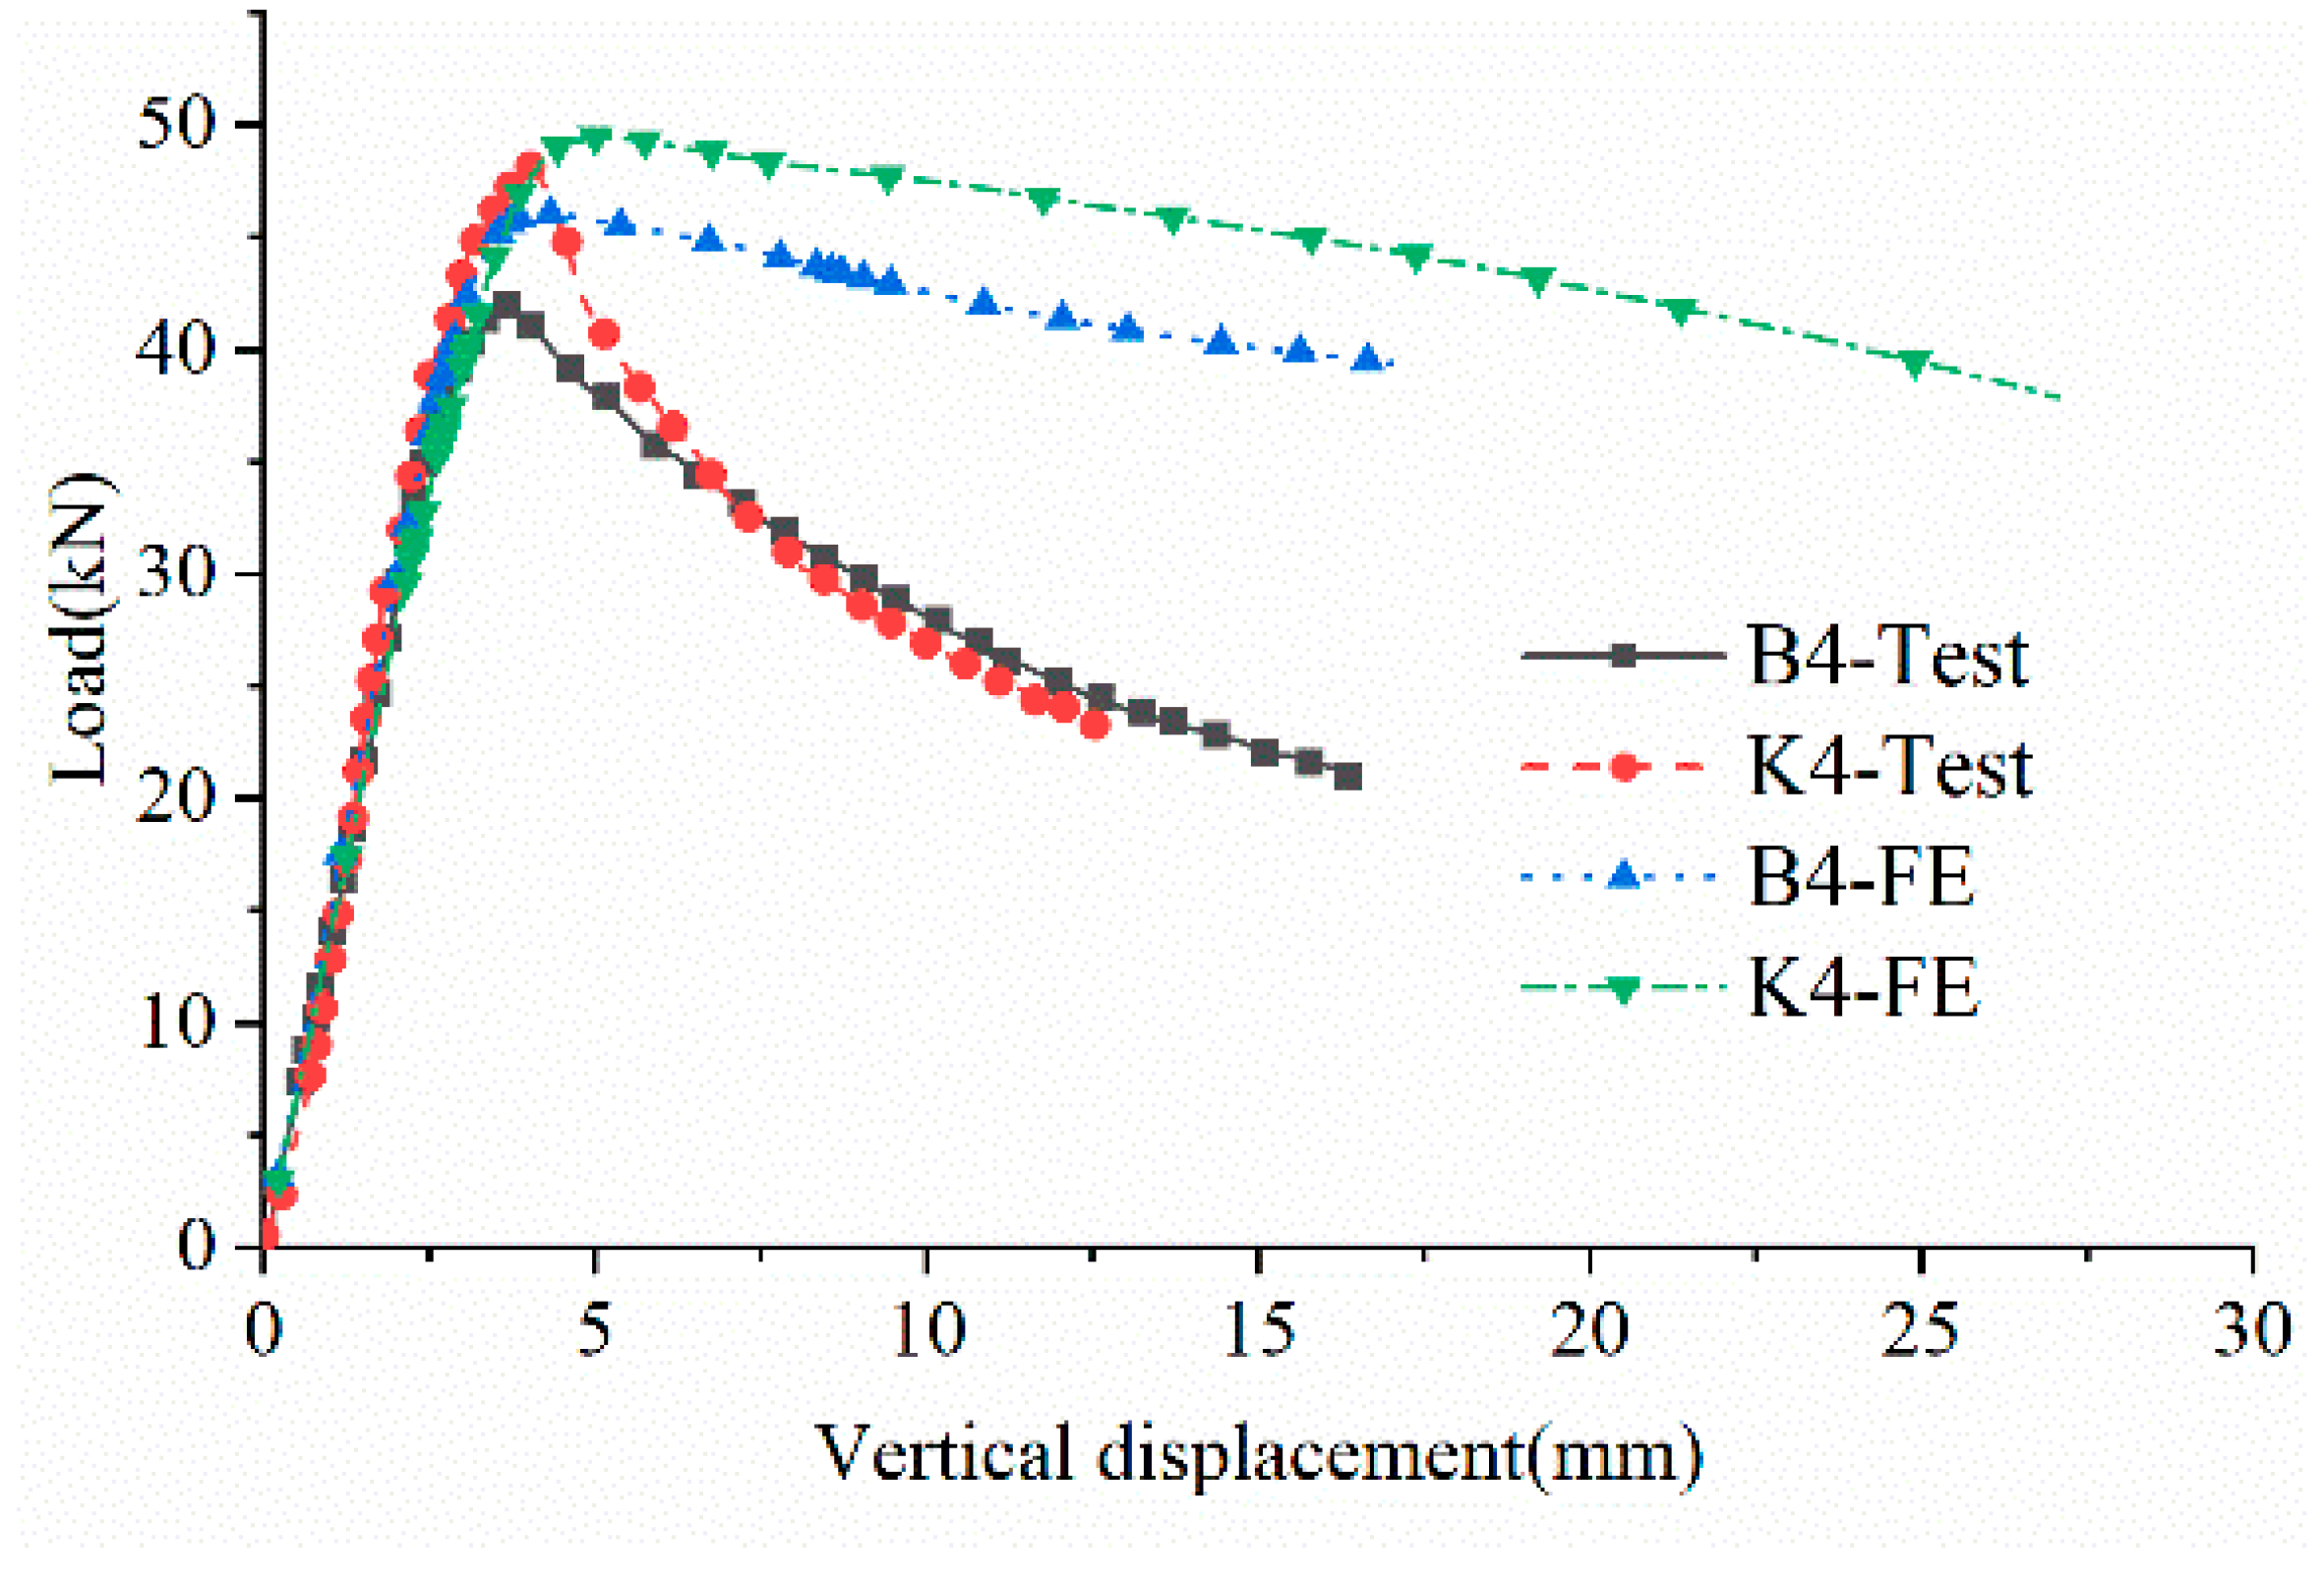
3.6. Verification of FE Models

To verify the FE analysis, the FE results of the built-up beams are compared with the experimental results. As shown in Figure 8, the failure modes obtained from both the experiment beams and the FE models are local buckling of mid-span webs and upper flanges. It is the same case for deformations. The comparison of the load–vertical displacement curves is shown in Figure 9. It can be found that the results of FE analysis agree well with the experiments in the early elastic stage. Table 3 provides a comparison of the ultimate load capacity between the B4 and K4 beams. The ratios of the ultimate load capacity obtained from tests to that from the FE models of the B4 and K4 beams are 0.91 and 0.97, respectively.
The comparisons above show that the experimental and FE results are in good agreement in both the failure mode and the ultimate load capacity. Therefore, the FE models can be further used for conducting the parametric analysis.

3.7. Parametric Study

To investigate the effects of the L0/Hc ratio, Hc/Bc ratio, and B0/ta ratio on the flexural moment capacity of the B4 and K4 beams, an extensive parametric study is carried out for the B4 and K4 beams. A total of 224 models are developed for both B4 and K4 beams. For the first 64 models of B4 beams, the parameters of the flange width (50 mm), length (1400–3200 mm), web depth (180–240 mm), and thickness (1.2–2.1 mm) are considered. For the last 48 models, the flange width (40–70 mm), length (1400–3200 mm), web depth (200 mm), and thickness (1.2-mm) are considered. The selection of parameters for K4 beams is the same as that for B4 beams. These dimensions are adopted according to the GB 50018–2002 [1] and AISI S100-16 [2], and all related slenderness ratios are also in accordance with the specification. The screw spacing is adopted as 300 mm.
L0/Hc ratio, Hc/Bc ratio, and B0/ta ratio are defined as follows: L0 is the calculation length, Hc is the section height, Bc is the section width, B0 is the width of the beam flange, and ta is the average thickness of the flange.
It is observed that all FE models fail with local buckling modes within the moment span. The calculated flexural moment capacities for those beams with different parameters are summarized in Table 4 and Table 5. Several phenomena can be observed as follows.
  • The flexural moment capacities of K4 beams generally exceed those of B4 beams. The main reason is that the web depth-to-thickness ratios of the B4 beams are higher than those of the K4 beams.
  • The flexural moment capacity is almost unchanged with the increase of the length of the U-shaped CFS (1400–3200 mm). The reason may be that the failure mode is hardly affected by the length.
  • The Hc/Bc ratio increases with the increase of the web depth (180–240 mm). However, the tendency is reversed for the length-to-height ratio.
  • The B0/ta ratio increases with the increase of the flange width (40–70 mm). For B4 beams, there are no apparent trends between the flexural moment capacities and the B0/ta ratio. The reason may be that the B4 beams generally fail at the web rather than the flange. For K4 beams, the flexural moment capacity increases with the increase of the B0/ta ratio.
  • The B0/ta ratio decreases with the increase of the thickness (1.2–2.1 mm). The flexural moment capacity increases significantly with the increase of the thickness. This phenomenon is mainly because of the significant increase of the effective bending moment modulus.

4. Simplified Calculation Method

As stated earlier, the flexural moment capacity for CFS built-up section beams is conservatively evaluated by DSM and EWM. DSM is based on a single member or a built-up section formed by two members in back-to-back contact, while EWM is hard to operate [1,3,6,7,11]. Therefore, it is necessary to develop a simplified and accurate method for predicting the flexural moment capacity. Considering the reduction factor of the gross section modulus of the built-up section, Yao and Zhou [10] proposed a simplified calculation method to predict the flexural moment capacities of the CFS I-section and box section beams. Based on this method, a simplified calculation method was proposed in this section to predict the flexural moment capacities of the B4 and K4 section beams.

4.1. Derivation of the Simplified Calculation Method

The gross section flexural moment capacity My can be determined by the gross section modulus W as the following:
M y = W × f y
The equivalent section modulus We is determined by
W e = M u f y
where Mu is the flexural moment capacity.
Therefore, the reduction factor of the gross section modulus k can be obtained as
k = W e W = W e × f y W × f y = M u M y
Combining Equations (2) and (3), flexural moment capacity Mu can be formulated by
M u = M e × f y = k × W × f y

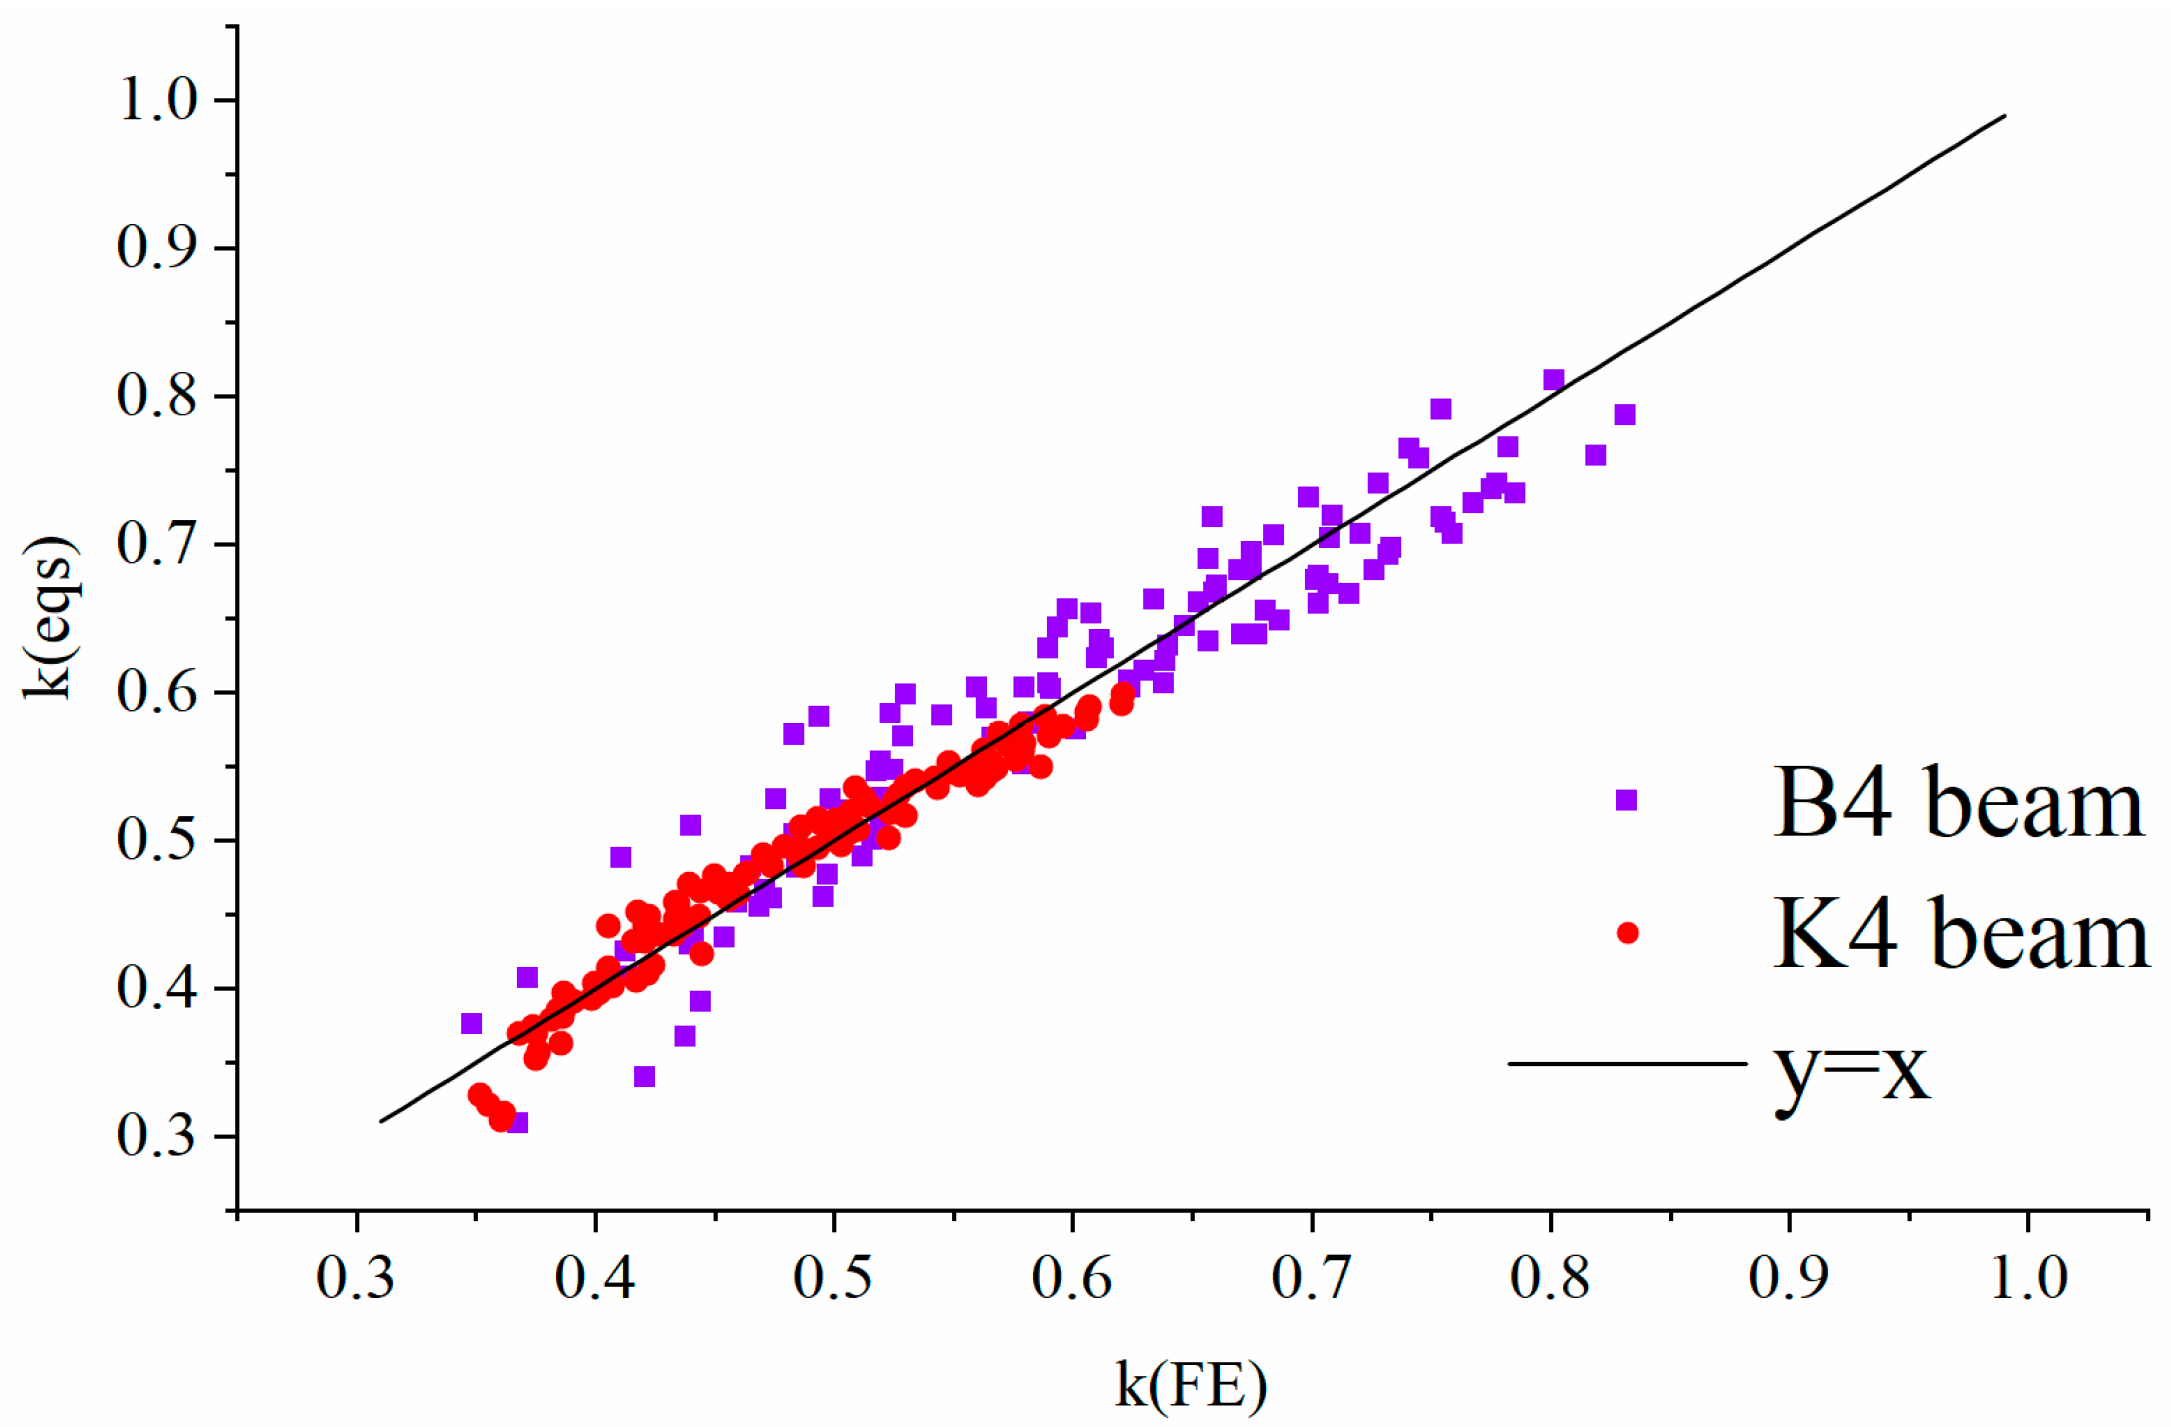
4.2. Regression Analysis of k Values

The k values for B4 beams and K4 beams are listed in Table 4 and Table 5. Considering the square roots of the parameters L0/Hc, Hc/Bc, and B0/ta, these k values are analyzed by using the regression analysis method. Then, Equations (5) and (6) for B4 and K4 beams, respectively, can be derived.
For B4 beams:
k = 1.55 + 0.06 L 0 / H C 0.19 H C / B C 0.15 B 0 / t a
The limitations for Equation (5) are as follows. (1) The range of L0/Hc is 5 to 16.7; (2) The range of Hc/Bc is 1.3 to 3; (3) The range of B0/ta is 19.0 to 58.3; (4) The range of screw spacing is 150 to 600 mm [3] and in accordance with AISI S100-16 [2].
For K4 beams:
k = 1.41 0.01 L 0 / H C 0.25 H C / B C 0.07 B 0 / t a
The limitations for Equation (6) are as follows. (1) The range of L0/Hc is 5 to 16.7; (2) The range of Hc/Bc is 0.86 to 2; (3) The range of B0/ta is 42.9 to 131.3; (4) The range of screw spacing is 150 to 600 mm [3] and in accordance with AISI S100-16 [2].
The values for the correlation coefficient square for B4 and K4 beams are 0.9094 and 0.9478, respectively. Figure 11 gives the comparison for k between the predicted values using Equations (5) and (6) and those computed through FE models. It can be seen that the predictions using Equations (5) and (6) are in good agreement with the FE results, indicating the effectiveness and rationality of Equations (5) and (6).
Substituting Equations (5) and (6) into Equation (4), the formulas of the flexural moment capacities for the four-limb built-up beams are readily found.
For B4 beams:
M y = k × W × f y = ( 1.55 + 0.06 L 0 / H C 0.19 H C / B C 0.15 B 0 / t a ) × W × f y
For K4 beams:
M y = k × W × f y = ( 1.41 0.01 L 0 / H C 0.25 H C / B C 0.07 B 0 / t a ) × W × f y

5. Conclusions

In this study, a new CFS four-limb built-up section is proposed. The flexural moment capacities and failure modes of two types of four-limb built-up CFS section beams were investigated by both experiments and FE methods. The parametric analysis was carried out based on the validated FE model, and a simplified calculation method was proposed to predict the flexural moment capacities of CFS four-limb built-up closed and open section beams, namely B4 and K4 beams. The following conclusions are drawn from this study:
  • The failure modes of the beams with B4 and K4 sections were local buckling at the web and the upper flange.
  • Generally, the ultimate load capacities of K4 beams are higher than those of B4 beams.
  • For both B4 and K4 beams, the flexural moment capacity increases with the increase of the section height and thickness. However, with the increase of the flange width-to-thickness ratio, the flexural moment capacity of K4 beams increases but the flexural moment capacity of B4 beams shows no significant changes.
  • A simplified method was proposed to predict the flexural moment capacities of closed and open section CFS beams. The new CFS four-limb built-up beam and simplified formulas can provide a reference for the design of multi-story buildings.

Author Contributions

Conceptualization, F.D., Y.H., L.D. and W.Z.; funding acquisition, L.D.; methodology, F.D., Y.H. and L.D.; software, F.D. and Y.H.; validation, F.D. and Y.H.; formal analysis, F.D.; investigation, F.D. and Y.H.; resources, Y.H. and L.D.; data curation, F.D. and Y.H.; writing—original draft preparation, F.D.; writing—review and editing, Y.H., L.D. and W.Z. All authors have read and agreed to the published version of the manuscript.

Funding

This research was funded by “The Changsha Excellent Innovative Youth Training Program, grant number kq1802001” and “The Science and Technology Innovation Plan Project of Hunan Province, grant number 2018NK2053”.

Institutional Review Board Statement

Not applicable.

Informed Consent Statement

Not applicable.

Data Availability Statement

Not applicable.

Conflicts of Interest

The authors declare no conflict of interest.

References

  1. Chinese Standard GB50018-2002; Technical Code of Cold-Formed Thin-Wall Steel Structures. General Administration of Quality Supervision Inspection and Quarantine: Beijing, China, 2002.
  2. AISI-S100; North American Specification for the Design of Cold-Formed Steel Structural Members. American Iron, and Steel Institute: Washington, DC, USA, 2016.
  3. Wang, L.; Young, B. Behaviour and design of cold-formed steel built-up section beams with different screw arrangements. Thin. Wall Struct. 2018, 131, 16–32. [Google Scholar] [CrossRef]
  4. Abbasi, M.; Khezri, M.; Rasmussen, K.; Schafer, B.W.J.T.-W.S. Elastic buckling analysis of cold-formed steel built-up sections with discrete fasteners using the compound strip method. Thin. Wall Struct. 2018, 124, 58–71. [Google Scholar] [CrossRef]
  5. Zhou, X.; Shi, Y. Flexural strength evaluation for cold-formed steel lip-reinforced built-up I-beams. Adv. Struct. Eng. 2011, 14, 597–611. [Google Scholar] [CrossRef]
  6. Selvaraj, S.; Madhavan, M. Design of cold-formed steel back-to-back connected built-up beams. J. Constr. Steel. Res. 2021, 181, 106623. [Google Scholar] [CrossRef]
  7. Manikandan, P.; Sukumar, S.; Balaji, T.U. Effective shaping of cold-formed thin-walled built-up beams in pure bending. Arab. J. Sci. Eng. 2014, 39, 6043–6054. [Google Scholar] [CrossRef]
  8. Ferdous, W.; Manalo, A.; Aravinthan, T.; Fam, A. Flexural and shear behaviour of layered sandwich beams. Constr. Build. Mater. 2018, 173, 429–442. [Google Scholar] [CrossRef]
  9. Ai-Rubaye, M.; Manalo, A.; Alajarmeh, O.; Ferdous, W.; Lokuge, W.; Benmokrane, B.; Edoo, A. Flexural behaviour of concrete slabs reinforced with GFRP bars and hollow composite reinforcing systems. Compos. Struct. 2020, 236, 1118360. [Google Scholar] [CrossRef] [Green Version]
  10. Yao, X.; Zhou, X.; Shi, Y.; Guan, Y.; Zou, Y. Simplified calculation method for flexural moment capacity of cold-formed steel built-up section beams. Adv. Struct. Eng. 2020, 23, 3153–3167. [Google Scholar] [CrossRef]
  11. Ghannam, M. Bending Moment capacity of cold-formed steel built-up beams. Int. J. Steel. Struct. 2019, 19, 660–671. [Google Scholar] [CrossRef]
  12. Laim, L.; Rodrigues, J.P.C.; Silva, L.S.D. Experimental and numerical analysis on the structural behaviour of cold-formed steel beams. Thin. Wall Struct. 2013, 72, 1–13. [Google Scholar] [CrossRef]
  13. Deepak, M.S.; Shanthi, V.M. Lateral-torsional buckling capacity of Hybrid Double-I-Box Beams: A numerical approach. Adv. Struct. Eng. 2019, 22, 641–655. [Google Scholar] [CrossRef]
  14. Meza, F.J.; Becque, J.; Hajirasouliha, I. Experimental study of cold-Formed steel built-up beams. J. Struct. Eng. 2020, 146, 04020126. [Google Scholar] [CrossRef]
  15. Chinese Standard GB/T228. 1-2010; Metallic Materials—Tensile Testing—Part 1: Method of Test at Room Temperature. China Standard Press: Beijing, China, 2011.
  16. Huang, Y.; Young, B. The art of coupon tests. J. Constr. Steel. Res. 2014, 96, 159–175. [Google Scholar] [CrossRef] [Green Version]
  17. Roy, K.; Lau, H.H.; Ting, T.; Chen, B.; Lim, J. Flexural behaviour of back-to-back built-up cold-formed steel channel beams: Experiments and finite element modelling. Structures 2021, 29, 235–253. [Google Scholar] [CrossRef]
  18. Abaqus/CAE User’s Guide, Ver. 6.9; Dassault Systemes Simulia Corp.: Providence, RI, USA, 2009.
  19. Keerthan, P.; Mahendran, M. New design rules for the shear strength of LiteSteel beams. J. Constr. Steel. Res. 2011, 67, 1050–1063. [Google Scholar] [CrossRef] [Green Version]
  20. Shuang, N.; Rasmussen, K.; Feng, F. Distortional–global interaction buckling of stainless steel C-beams: Part II—Numerical study and design. J. Constr. Steel. Res. 2014, 96, 40–53. [Google Scholar]
  21. Anbarasu, M. Simulation of flexural behaviour and design of cold-formed steel closed built-up beams composed of two sigma sections for local buckling. Eng. Struct. 2019, 191, 549–562. [Google Scholar] [CrossRef]
  22. EN 1993-1-8:2005; Euro Code 3: Design of steel structures—Part 1–8: Design of joints. European Committee for Standardization (CEN): Brussels, Belgium, 2005.
  23. Gendy, B.L.; Hanna, M.T. Effect of geometric imperfections on the ultimate moment capacity of cold-formed sigma-shape sections. HBRC J. 2017, 13, 163–170. [Google Scholar] [CrossRef] [Green Version]
  24. Wang, L.; Young, B. Beam tests of cold-formed steel built-up sections with web perforations. J. Constr. Steel. Res. 2015, 115, 18–33. [Google Scholar] [CrossRef]
  25. Liu, J.L.; Lue, D.M.; Lin, C.H. Investigation on slenderness ratios of built-up compression members. J. Constr. Steel. Res. 2009, 65, 237–248. [Google Scholar] [CrossRef]
Figure 1. Schematic of members and specimens. (a) U-shaped CFS; (b) B4 cross section; (c) K4 cross section (Unit: mm).
Buildings 12 01639 g001
Figure 2. Dimensions of B4 and K4 beams (Unit: mm).
Buildings 12 01639 g002
Figure 3. Tensile coupon tests. (a) Nominal dimensions of the tensile coupons (mm); (b) Universal testing machine; (c) Fractured tensile coupons.
Buildings 12 01639 g003
Figure 4. Typical stress–strain curves of the tensile coupons with a thickness of 1.2 mm.
Buildings 12 01639 g004
Figure 5. Schematic view of the experimental setup for the four-point bending tests (Unit: mm).
Buildings 12 01639 g005
Figure 6. Test setup for B4 beam. (a) Overall view; (b) Fixture; (c) Reinforcement components; (d) Load transfer plates with holes; (e) Hydraulic jack and load cell.
Buildings 12 01639 g006
Figure 7. Failure modes. (a) B4 Beam; (b) K4 Beam.
Buildings 12 01639 g007
Figure 8. Comparison of experimental and FE analysis results. (a) B4 beam in the experiment test; (b) B4 beam in the FE analysis; (c) K4 beam in the experiment test; (d) K4 beam in the FE analysis.
Buildings 12 01639 g008
Figure 9. Load–vertical displacement curves.
Buildings 12 01639 g009
Figure 10. FE model of K4 beam.
Buildings 12 01639 g010
Figure 11. Comparison of the value of k calculated by Equations (5) and (6) and obtained from FE models.
Buildings 12 01639 g011
Table 1. Nominal dimensions of beam specimens.
SpecimenCross-Sectional FormDimension
(mm)
L
(mm)
H
(mm)
B
(mm)
ta *
(mm)
Screw Spacing
(mm)
1B44U200 × 50 × 1.220002001002.4300
2K44U200 × 50 × 1.220002001501.6300
* ta is the average thickness of section flanges.
Table 2. Material properties of tensile coupons.
CouponE (GPa)σ0.2 (MPa)σu (MPa)εf (%)
P1204.31248.71359.8528.00
P2206.56249.93360.1125.90
P3207.93252.76358.8425.40
Mean206.27 250.47 359.60 26.40
COV0.0089 0.0083 0.0019 0.0521
Table 3. Comparison of the ultimate load capacity of the CFS beams.
SectionFT (kN)FFE (kN)FT/FFE
B441.94 46.11 0.91
K448.19 49.49 0.97
Table 4. Summary of the flexural moment capacities for B4 beams.
M (kN·m)t (mm)
1.21.51.82.1
B (mm)H (mm)L (mm)MFEMWkMFEMWkMFEMWkMFEMWk
501801400 11.31 23.99 0.47 16.93 29.88 0.57 23.11 35.72 0.65 29.39 41.52 0.71
2000 12.38 23.99 0.52 18.66 29.88 0.62 25.12 35.72 0.70 32.21 41.52 0.78
2600 12.49 23.99 0.52 19.12 29.88 0.64 25.74 35.72 0.72 32.48 41.52 0.78
3200 12.47 23.99 0.52 17.86 29.88 0.60 24.97 35.72 0.70 31.34 41.52 0.75
2001400 12.18 27.81 0.44 18.20 34.65 0.53 25.28 41.44 0.61 32.54 48.19 0.68
2000 13.83 27.81 0.50 20.15 34.65 0.58 28.21 41.44 0.68 36.45 48.19 0.76
2600 13.92 27.81 0.50 22.12 34.65 0.64 30.10 41.44 0.73 37.49 48.19 0.78
3200 13.87 27.81 0.50 21.24 34.65 0.61 28.36 41.44 0.68 35.72 48.19 0.74
2201400 13.16 31.86 0.41 18.90 39.70 0.48 26.61 47.49 0.56 35.04 55.24 0.63
2000 14.95 31.86 0.47 22.36 39.70 0.56 31.20 47.49 0.66 40.46 55.24 0.73
2600 15.44 31.86 0.48 19.61 39.70 0.49 33.39 47.49 0.70 41.67 55.24 0.75
3200 15.41 31.86 0.48 23.41 39.70 0.59 31.82 47.49 0.67 40.24 55.24 0.73
2401400 13.45 36.13 0.37 19.83 45.03 0.44 28.23 53.89 0.52 37.23 62.69 0.59
2000 15.96 36.13 0.44 24.47 45.03 0.54 33.96 53.89 0.63 44.34 62.69 0.71
2600 17.14 36.13 0.47 26.06 45.03 0.58 36.17 53.89 0.67 45.97 62.69 0.73
3200 16.82 36.13 0.47 24.58 45.03 0.55 35.17 53.89 0.65 44.45 62.69 0.71
40200140012.33 24.48 0.50 19.02 30.49 0.62 25.61 36.47 0.70 32.57 42.40 0.77
200013.73 24.48 0.56 20.66 30.49 0.68 27.69 36.47 0.76 34.75 42.40 0.82
260014.72 24.48 0.60 21.83 30.49 0.72 28.64 36.47 0.79 35.26 42.40 0.83
320012.98 24.48 0.53 20.04 30.49 0.66 27.17 36.47 0.75 34.01 42.40 0.80
50140012.18 27.81 0.44 18.20 34.65 0.53 25.28 41.44 0.61 32.54 48.19 0.68
200013.83 27.81 0.50 20.15 34.65 0.58 28.21 41.44 0.68 36.45 48.19 0.76
260013.92 27.81 0.50 22.12 34.65 0.64 30.10 41.44 0.73 37.49 48.19 0.78
320013.87 27.81 0.50 21.24 34.65 0.61 28.36 41.44 0.68 35.72 48.19 0.74
60140012.21 31.15 0.39 19.07 38.81 0.49 25.29 46.41 0.54 33.00 53.97 0.61
200013.74 31.15 0.44 19.51 38.81 0.50 26.91 46.41 0.58 35.57 53.97 0.66
260014.15 31.15 0.45 20.10 38.81 0.52 27.38 46.41 0.59 36.42 53.97 0.67
320014.32 31.15 0.46 20.53 38.81 0.53 28.21 46.41 0.61 35.56 53.97 0.66
70140012.68 34.49 0.37 18.90 42.96 0.44 25.88 51.38 0.50 33.71 59.75 0.56
200014.52 34.49 0.42 21.31 42.96 0.50 29.76 51.38 0.58 38.16 59.75 0.64
260015.11 34.49 0.44 22.01 42.96 0.51 30.16 51.38 0.59 41.03 59.75 0.69
320015.33 34.49 0.44 22.34 42.96 0.52 30.38 51.38 0.59 39.45 59.75 0.66
Notes: L, H, B, and t are the dimensions of U-shaped CFS, MFE is the result of FE, MW is the calculation result of gross section modulus, fy = 235 MPa, and k is the ratio of MFE to MW.
Table 5. Summary of the flexural moment capacities for K4 beams.
M (kN·m)t (mm)
1.21.51.82.1
B (mm)H (mm)L (mm)MFEMWkMFEMWkMFEMWkMFEMWk
501801400 14.25 32.06 0.44 19.69 39.95 0.49 27.14 47.79 0.57 33.73 55.58 0.61
2000 13.59 32.06 0.42 19.40 39.95 0.49 25.91 47.79 0.54 32.69 55.58 0.59
2600 13.52 32.06 0.42 18.91 39.95 0.47 25.32 47.79 0.53 32.13 55.58 0.58
3200 13.37 32.06 0.42 18.52 39.95 0.46 25.16 47.79 0.53 31.61 55.58 0.57
2001400 15.05 37.16 0.41 22.55 46.31 0.49 30.11 55.42 0.54 38.39 64.47 0.60
2000 14.85 37.16 0.40 20.82 46.31 0.45 28.40 55.42 0.51 38.05 64.47 0.59
2600 14.94 37.16 0.40 20.34 46.31 0.44 28.51 55.42 0.51 37.35 64.47 0.58
3200 14.80 37.16 0.40 20.55 46.31 0.44 29.01 55.42 0.52 37.31 64.47 0.58
2201400 16.46 42.55 0.39 24.13 53.05 0.45 33.34 63.50 0.53 42.30 73.89 0.57
2000 16.63 42.55 0.39 24.39 53.05 0.46 33.64 63.50 0.53 42.71 73.89 0.58
2600 16.45 42.55 0.39 22.99 53.05 0.43 31.64 63.50 0.50 41.74 73.89 0.56
3200 16.43 42.55 0.39 23.05 53.05 0.43 31.61 63.50 0.50 41.30 73.89 0.56
2401400 18.53 48.25 0.38 26.15 60.17 0.43 35.61 72.03 0.49 47.44 83.83 0.57
2000 18.39 48.25 0.38 25.13 60.17 0.42 36.46 72.03 0.51 47.43 83.83 0.57
2600 18.04 48.25 0.37 26.07 60.17 0.43 36.13 72.03 0.50 47.17 83.83 0.56
3200 17.75 48.25 0.37 24.38 60.17 0.41 34.48 72.03 0.48 46.93 83.83 0.56
402001400 13.81 32.70 0.42 20.40 40.76 0.50 27.43 48.77 0.56 35.23 56.73 0.62
2000 13.75 32.70 0.42 20.78 40.76 0.51 28.09 48.77 0.58 35.19 56.73 0.62
2600 13.94 32.70 0.43 21.30 40.76 0.52 28.61 48.77 0.59 34.35 56.73 0.61
3200 13.75 32.70 0.42 20.50 40.76 0.50 26.94 48.77 0.55 34.37 56.73 0.61
501400 15.05 37.16 0.41 22.55 46.31 0.49 30.11 55.42 0.54 38.39 64.47 0.60
2000 14.85 37.16 0.40 20.82 46.31 0.45 28.40 55.42 0.51 38.05 64.47 0.59
2600 14.94 37.16 0.40 20.34 46.31 0.44 28.51 55.42 0.51 37.35 64.47 0.58
3200 14.80 37.16 0.40 20.55 46.31 0.44 29.01 55.42 0.52 37.31 64.47 0.58
601400 15.60 41.62 0.37 22.98 51.87 0.44 31.04 62.07 0.50 39.54 72.20 0.55
2000 16.04 41.62 0.39 22.62 51.87 0.44 30.97 62.07 0.50 39.54 72.20 0.55
2600 15.66 41.62 0.38 22.46 51.87 0.43 30.17 62.07 0.49 38.53 72.20 0.53
3200 15.61 41.62 0.38 21.56 51.87 0.42 29.19 62.07 0.47 36.73 72.20 0.51
701400 16.21 46.08 0.35 23.29 57.43 0.41 31.77 68.72 0.46 41.99 79.94 0.53
2000 16.37 46.08 0.36 23.29 57.43 0.41 31.31 68.72 0.46 40.55 79.94 0.51
2600 16.66 46.08 0.36 23.37 57.43 0.41 31.01 68.72 0.45 39.41 79.94 0.49
3200 16.61 46.08 0.36 23.03 57.43 0.40 31.29 68.72 0.46 38.84 79.94 0.49
Notes: L, H, B, and t are the dimensions of U-shaped CFS, MFE is the result of FE, MW is the calculation result of gross section modulus, fy = 235 MPa, and k is the ratio of MFE to MW.
Publisher’s Note: MDPI stays neutral with regard to jurisdictional claims in published maps and institutional affiliations.

