
The Study of Architectural Geometry and Shape in the Energy Balance of Glazed Roofs
 ,
,  and
and
Abstract
:1. Introduction
1.1. Background
1.2. Literature Review
1.3. Research Objectives
2. Methodology
2.1. Classification of Typical Design Forms of Roofs
2.2. Modeling
2.3. Climate Data
2.4. Daylighting Performance Simulation
2.5. Energy Performance Simulation
- The lighting power density of the building was set to 9 W/m2. When the indoor natural illuminance was lower than 300 lux, the lighting control system would automatically initiate artificial lighting;
- The COP of the cooling system was specified as 3.5;
- The per capita area of the room was set to 8 m2 per person;
- The equipment load per area was set to 8 W/m2;
- The HVAC temperature set point was 26 °C.
3. Results and Discussion
3.1. Useful Daylight Illuminance Performance
3.2. Year-Round Energy Performance
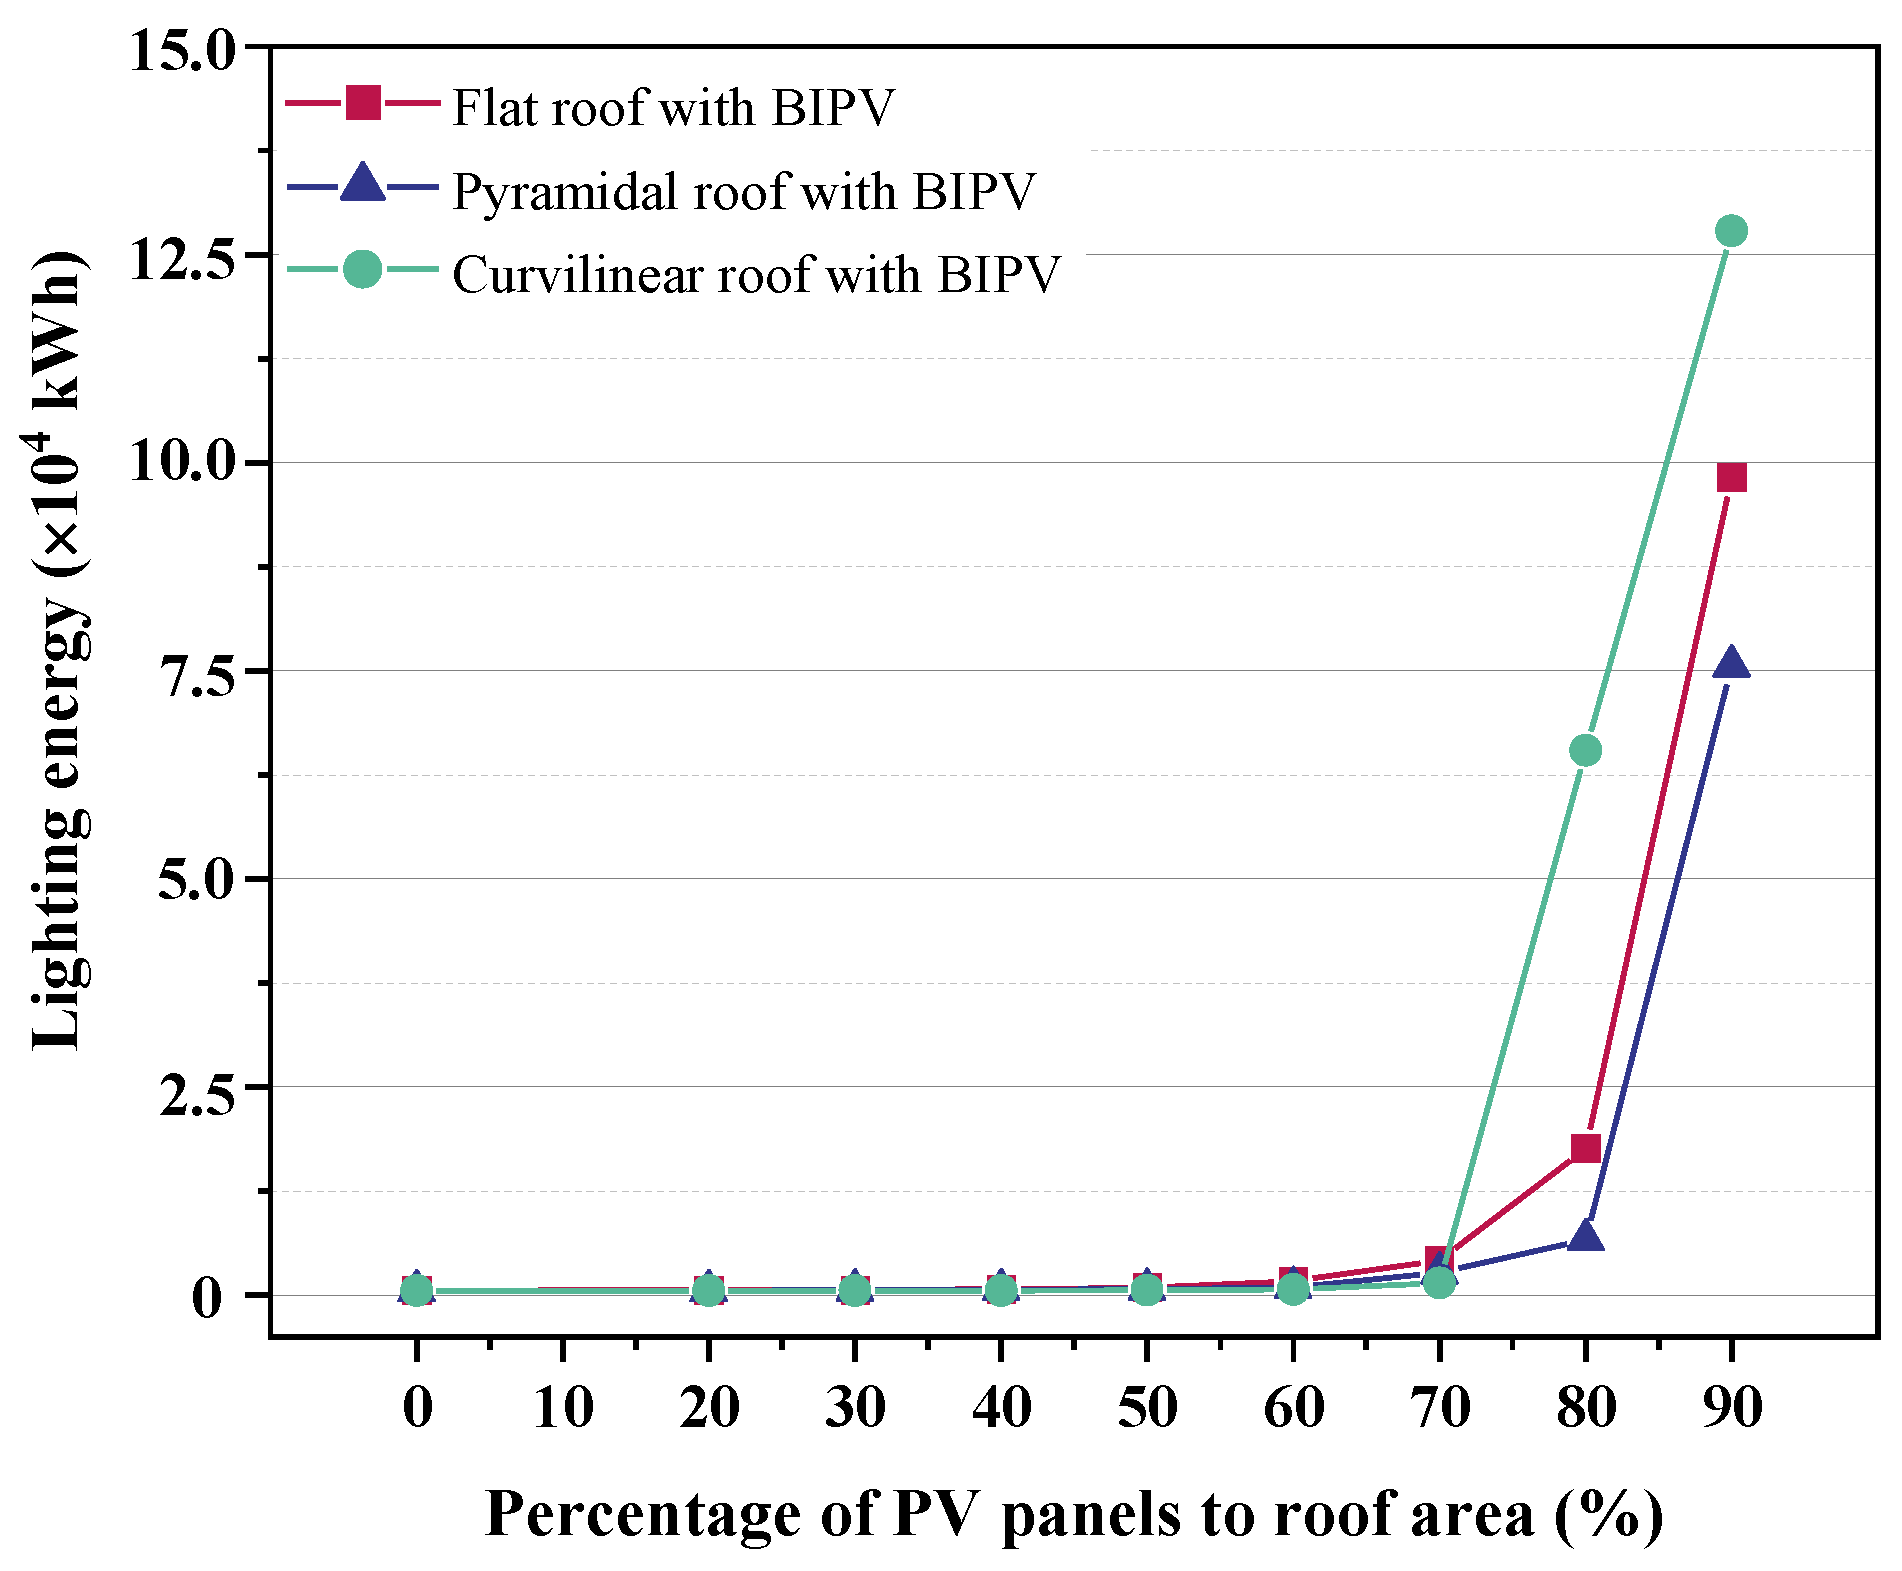
3.2.1. Lighting Energy Consumption
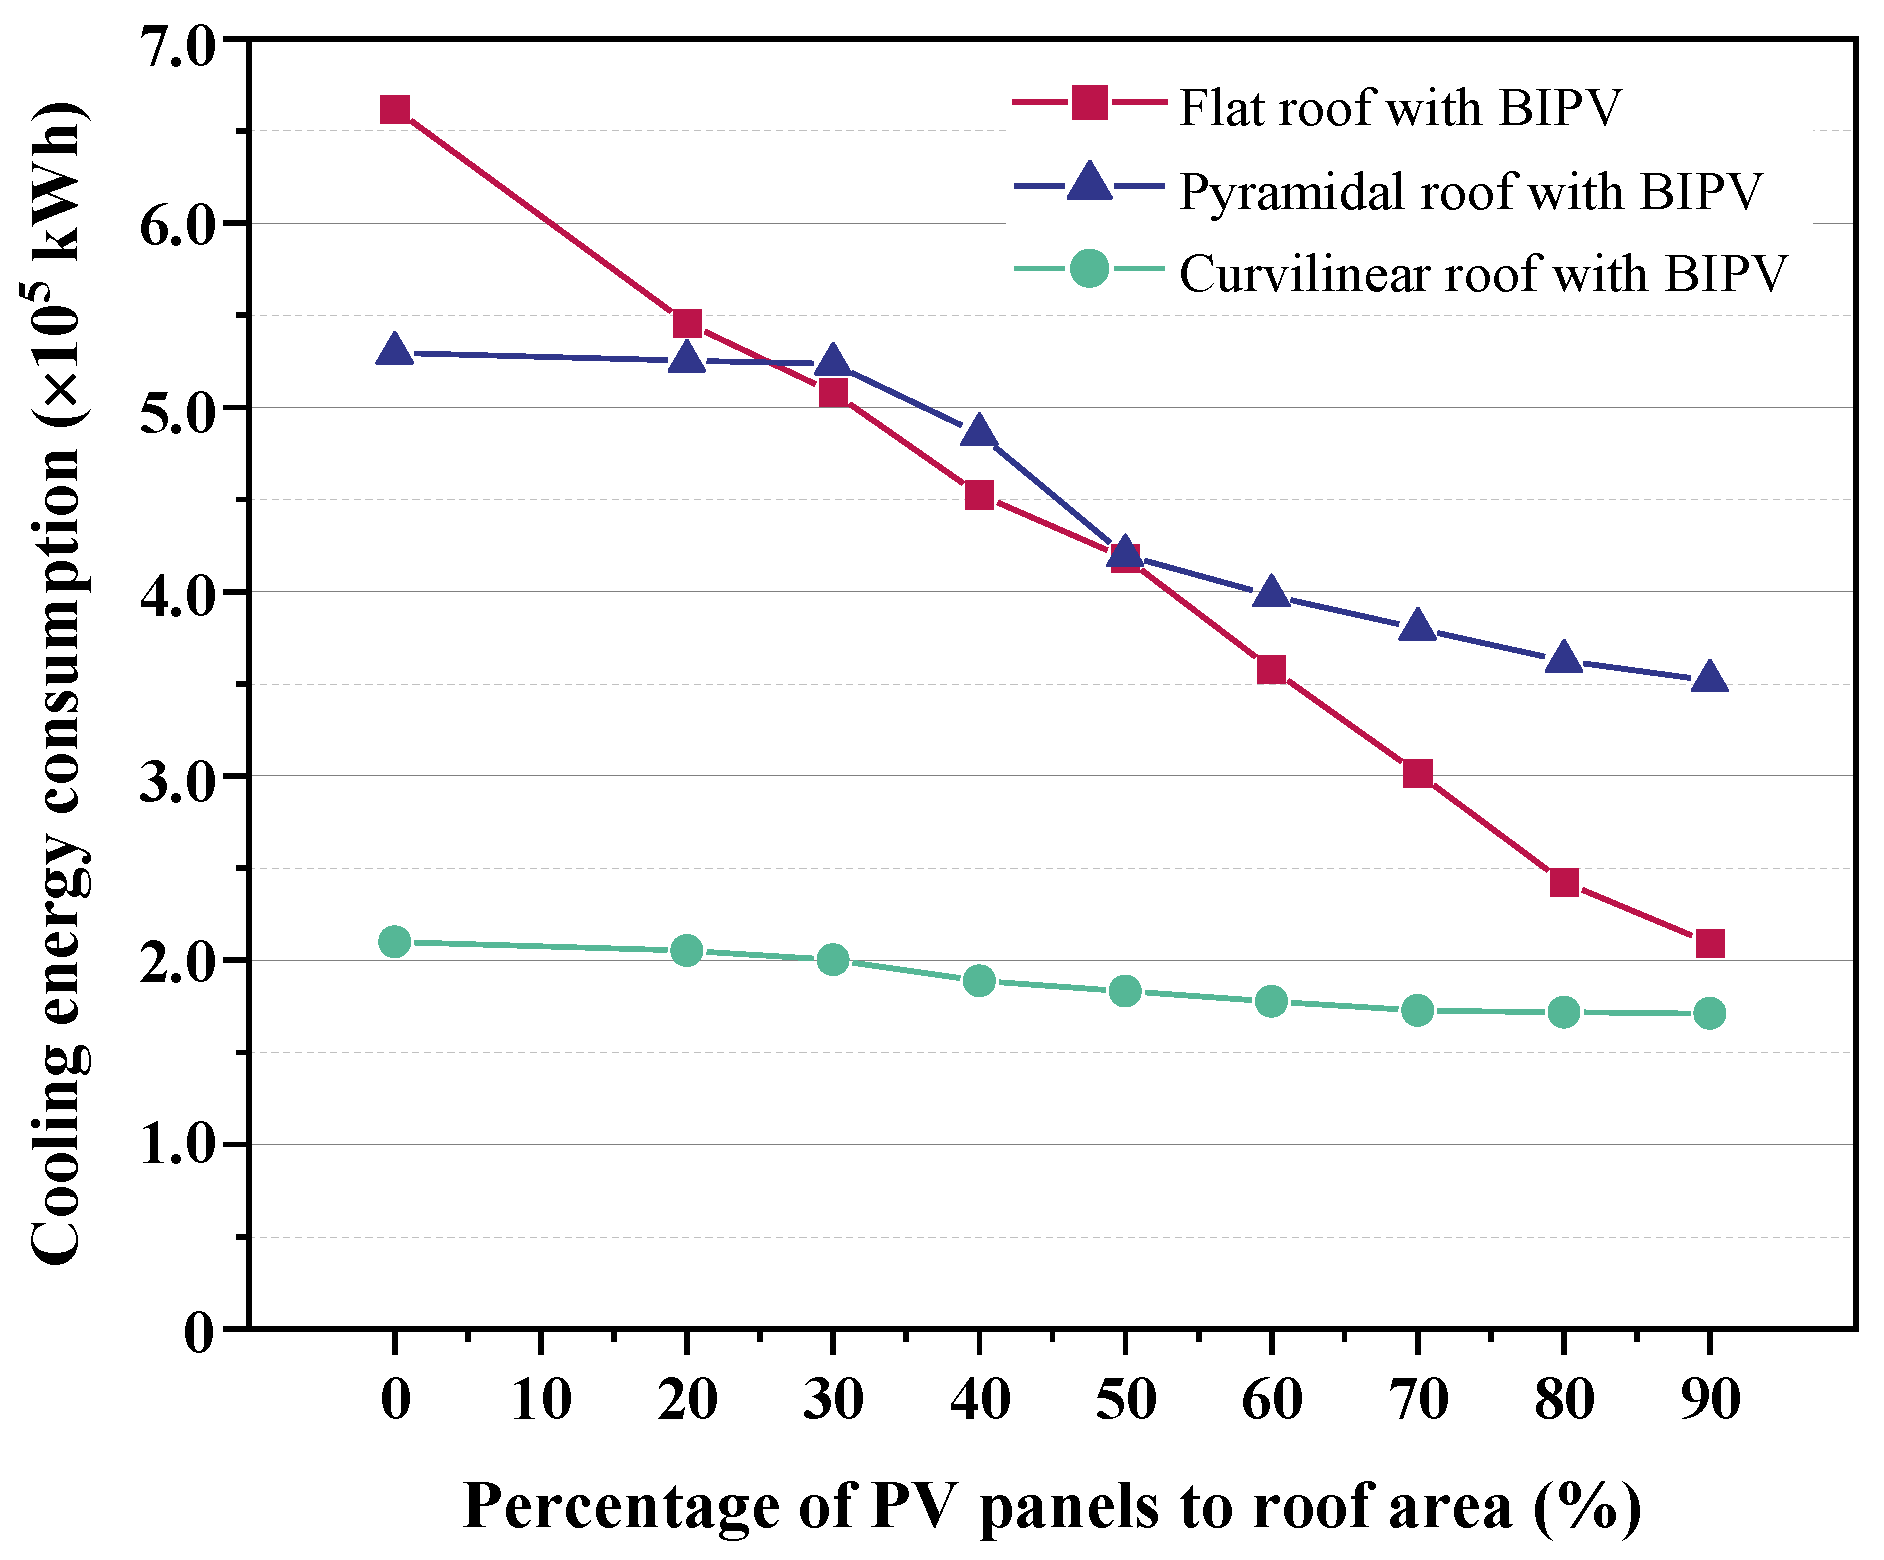
3.2.2. Cooling Energy Consumption
3.2.3. PV Panel Power Generation
3.3. Energy Balance
3.4. Economic Analysis
4. Conclusions
Author Contributions
Funding
Data Availability Statement
Acknowledgments
Conflicts of Interest
Appendix A

| Roof Geometry | Project | Quantity | |
|---|---|---|---|
| Flat |  | The Shenzhen Reform Exhibition Hall Source: Sou Fujimoto Architects | 5 |
 | The Guoshen Museum (Tentative Name) Source: Architectural Design Research Institute of SCUT Ltd. | ||
 | The Shenzhen Natural History Museum Source: Shenzhen Municipal Public Works Department | ||
 | The Shenzhen Art Museum Source: KSP Jürgen Engel Architekten International GmbH | ||
 | The Shenzhen Institute of Innovation and Design Source: Shenzhen Municipal Public Works Department | ||
| Pyramidal |  | The Shenzhen Financial and Cultural Center Source: Shenzhen Municipal Public Works Department | 1 |
| Curvilinear |  | The Shenzhen Opera House Source: Ateliers Jean Nouvel | 6 |
 | The Shenzhen Science and Technology Museum Source: Zaha Hadid Architects | ||
 | The Shenzhen Creative Design Museum Source: MAD and Proloog | ||
 | The Shenzhen Ocean Museum Source: SANAA | ||
 | The Shenzhen International Performing Arts Center Source: Ennead Architects | ||
 | The Shenzhen Conservatory of Music Source: Shenzhen Municipal Public Works Department |
References
- Anderson, C.R. Primitive shelter. Ekistics 1962, 13, 276–281. [Google Scholar]
- Amos, R. House Form and Culture; Pearson: Englewood Cliffs, NJ, USA, 1969. [Google Scholar]
- Çiftçi, Y. Çemka Höyük, Late Epipaleolithic and PPNA Phase Housing Architecture: Chronological and Typological Change. Near East. Archaeol. 2022, 85, 12–22. [Google Scholar] [CrossRef]
- Smith, P.F. Architecture in a Climate of Change; Routledge: London, UK, 2006. [Google Scholar]
- Akther, M.; He, J.; Chu, A.; Huang, J.; Van Duin, B. A review of green roof applications for managing urban stormwater in different climatic zones. Sustainability 2018, 10, 2864. [Google Scholar] [CrossRef]
- Besir, A.B.; Cuce, E. Green roofs and facades: A comprehensive review. Renew. Sustain. Energy Rev. 2018, 82, 915–939. [Google Scholar] [CrossRef]
- Commission, E.E. Nature-Based Solutions and Re-Naturing Cities, Final Report of the Horizon 2020 Expert Group on Nature-Based Solutions and Re-Naturing Cities; European Union: Brussels, Belgium, 2015. [Google Scholar]
- Langergraber, G.; Pucher, B.; Simperler, L.; Kisser, J.; Katsou, E.; Buehler, D.; Mateo, M.C.G.; Atanasova, N. Implementing nature-based solutions for creating a resourceful circular city. Blue-Green Syst. 2020, 2, 173–185. [Google Scholar] [CrossRef]
- Galantucci, R.A.; Fatiguso, F. Advanced damage detection techniques in historical buildings using digital photogrammetry and 3D surface anlysis. J. Cult. Herit. 2019, 36, 51–62. [Google Scholar] [CrossRef]
- Craveiroa, F.; Duartec, J.P.; Bartoloa, H.; Bartolod, P.J. Additive manufacturing as an enabling technology for digital construction: A perspective on Construction 4.0. Automat. Constr. 2019, 103, 251–267. [Google Scholar] [CrossRef]
- Esra Aydoğan, M. From “Advertising Architecture” to “Media Façade”: Communication through Digital Display Skin. In Proceedings of the ICAUD–International Conference on Architecture and Urban Design, Tirana, Albania, 19–21 April 2012. [Google Scholar]
- Arch. Sir Peter COOK–Founder of Crab Studio–UK. Available online: https://share-architects.com/arch-sir-peter-cook-founder-of-crab-studio-uk/ (accessed on 10 September 2022).
- Quan, Z.X. One Night for Ice Cube. Available online: http://finance.sina.com.cn/jjxw/2022-02-22/doc-imcwipih4722544.shtml (accessed on 10 September 2022).
- GB 55015-2021; General Specification for Building Energy Conservation and Renewable Energy. Chinese standard. ICESUN VACUUM GLASS Ltd.: Beijing, China, 2021.
- Global S&T Development Trend Analysis Platform of Resources and Environment, Five States Updated or Adopted New Clean Energy Standards in 2021. Available online: http://resp.llas.ac.cn/C666/handle/2XK7JSWQ/345611 (accessed on 1 February 2021).
- Shouse, K.C. U.S. Climate Change Policy; Congressional Research Service (CRS): Washington, DC, USA, 2021. [Google Scholar]
- Fortune. Solar PV Market and Regional Forecast, 2021–2028; Fortune Business Insights: Pune, India, 2020. [Google Scholar]
- Luo, Z.; He, J.; Hu, S. Driving force model to evaluate China’s photovoltaic industry: Historical and future trends. J. Clean. Prod. 2021, 311, 127637. [Google Scholar] [CrossRef]
- Sun, H.; Heng, C.K.; Reindl, T.; Lau, S.S.Y. Visual impact assessment of coloured Building-integrated photovoltaics on retrofitted building facades using saliency mapping. Sol. Energy 2021, 228, 643–658. [Google Scholar] [CrossRef]
- Bednar, N.; Caviasca, A.; Sevela, P.; Severino, N.; Adamovic, N. Modelling of flexible thin-film modules for building and product integrated photovoltaics. Sol. Energy Mater. Sol. Cells 2018, 181, 38–45. [Google Scholar] [CrossRef]
- Corrao, R.; Milia, G.; Morini, M.; Pastore, L.; Tutone, C. Benefits of a translucent building envelope made of DSC-integrated glass blocks. In Proceedings of the Advanced Building Skins, Bern, Switzerland, 3–4 November 2015; pp. 18–27. [Google Scholar]
- King, A. Lightweight, Bendy, Cheaper—The Promise of Organic Solar Panels. Available online: https://ec.europa.eu/research-and-innovation/en/horizon-magazine/lightweight-bendy-cheaper-promise-organic-solar-panels (accessed on 10 September 2022).
- ISE Fraunhofer Institute for Solar Energy Systems. Flexible, Organic Solar Cell Modul. Available online: https://www.ise.fraunhofer.de/en/business-areas/photovoltaics/perovskite-and-organic-photovoltaics/organic-solar-cells-and-modules.html (accessed on 10 September 2022).
- Green, M.; Dunlop, E.; Hohl-Ebinger, J.; Yoshita, M.; Kopidakis, N.; Hao, X. Solar cell efficiency tables (version 57). Prog. Photovolt. Res. Appl. 2021, 29, 3–15. [Google Scholar] [CrossRef]
- Forward. In Report of Prospects and Industry Chain Investment Opportunities Analysis on China Culture Industry (2022–2027); FORWARD Business Information Co., Ltd.: Shenzhen, China, 2022.
- Niu, S.; Shen, Z.; Lau, S.S.; Yan, Z.; Hu, A. Knowledge evolution in transit-oriented development: A comparative bibliometric analysis of International versus Chinese publications. URBAN DESIGN Int. 2021, 27, 97–114. [Google Scholar] [CrossRef]
- Tomasz, K. World expositions and building skins: Energy-efficiency concepts and aesthetics. In Proceedings of the 12th Conference on Advanced Building Skins, Bern, Switzerland, 2–3 October 2017. [Google Scholar]
- Saretta, E.; Caputo, P.; Frontini, F. A review study about energy renovation of building facades with BIPV in urban environment. Sustain. Cities Soc. 2019, 44, 343–355. [Google Scholar]
- Boesiger, M.; Couty, P.; Bacher, J.P. Market potential and acceptance of building integrated PV (BIPV) solutions—A practical approach. In Proceedings of the 12th Conference on Advanced Building Skins, Bern, Switzerland, 2–3 October 2017. [Google Scholar]
- Ghani, F.; Duke, M.; Carson, J.K. Estimation of photovoltaic conversion efficiency of a building integrated photovoltaic/thermal (BIPV/T) collector array using an artificial neural network. Sol. Energy 2012, 86, 3378–3387. [Google Scholar] [CrossRef]
- Li, S.; Karava, P.; Currie, S.; Lin, W.E.; Savory, E. Energy modeling of photovoltaic thermal systems with corrugated unglazed transpired solar collectors–Part 1: Model development and validation. Sol. Energy 2014, 102, 282–296. [Google Scholar]
- Li, S.; Karava, P. Energy modeling of photovoltaic thermal systems with corrugated unglazed transpired solar collectors–Part 2: Performance analysis. Sol. Energy 2014, 102, 297–307. [Google Scholar]
- Pacheco-Torres, R.; López-Alonso, M.; Martínez, G.; Ordóñez, J. Efficient design of residential buildings geometry to optimize photovoltaic energy generation and energy demand in a warm Mediterranean climate. Energy Effic. 2015, 8, 65–84. [Google Scholar] [CrossRef]
- Savvides, A.; Vassiliades, C. Designing urban building blocks around solar planning principles. WIT Trans. Ecol. Environ. 2017, 226, 679–690. [Google Scholar]
- Walker, L.; Hofer, J.; Schlueter, A. High-resolution, parametric BIPV and electrical systems modeling and design. Appl. Energy 2019, 238, 164–179. [Google Scholar] [CrossRef]
- Arnaout, M.A.; Go, Y.I.; Saqaff, A. Pilot study on building-integrated PV: Technical assessment and economic analysis. Int. J. Energy Res. 2020, 44, 9538–9559. [Google Scholar] [CrossRef]
- Paydar, M.A. Optimum design of building integrated PV module as a movable shading device. Sustain. Cities Soc. 2020, 62, 102368. [Google Scholar]
- Yin, Y.; Chen, W.; Hu, J.; Zhao, B.; Huang, X. Photothermal-structural-fluid behaviors of PV-ETFE cushion roof in summer: Numerical analysis using three-dimensional multiphysics model. Energy Build. 2020, 228, 110448. [Google Scholar] [CrossRef]
- Kaplanis, S.; Kaplani, E.; Kaldellis, J. PV temperature and performance prediction in free-standing, BIPV and BAPV incorporating the effect of temperature and inclination on the heat transfer coefficients and the impact of wind, efficiency and ageing. Renew. Energy 2022, 181, 235–249. [Google Scholar] [CrossRef]
- Zomer, C.; Custódio, I.; Goulart, S.; Mantelli, S.; Martins, G.; Campos, R.; Pinto, G.; Rüther, R. Energy balance and performance assessment of PV systems installed at a positive-energy building (PEB) solar energy research centre. Sol. Energy 2020, 212, 258–274. [Google Scholar] [CrossRef]
- Juricic, S.; Goffart, J.; Rouchier, S.; Foucquier, A.; Cellier, N.; Fraisse, G. Influence of natural weather variability on the thermal characterisation of a building envelope. Appl. Energy 2021, 288, 116582. [Google Scholar]
- Thiers, S.; Peuportier, B. Energy and environmental assessment of two high energy performance residential buildings. Build. Environ. 2012, 51, 276–284. [Google Scholar]
- Mandalaki, M.; Tsoutsos, T.; Papamanolis, N. Integrated PV in shading systems for Mediterranean countries: Balance between energy production and visual comfort. Energy Build. 2014, 77, 445–456. [Google Scholar]
- D’Agostino, D.; Minelli, F.; D’Urso, M.; Minichiello, F. Fixed and tracking PV systems for Net Zero Energy Buildings: Comparison between yearly and monthly energy balance. Renew. Energy 2022, 195, 809–824. [Google Scholar] [CrossRef]
- Miyazaki, T.; Akisawa, A.; Kashiwagi, T. Energy savings of office buildings by the use of semi-transparent solar cells for windows. Renew. Energy 2005, 30, 281–304. [Google Scholar] [CrossRef]
- Fung, T.Y.; Yang, H. Study on thermal performance of semi-transparent building-integrated photovoltaic glazings. Energy Build. 2008, 40, 341–350. [Google Scholar]
- Radhi, H. Energy analysis of façade-integrated photovoltaic systems applied to UAE commercial buildings. Sol. Energy 2010, 84, 2009–2021. [Google Scholar] [CrossRef]
- Ng, P.K.; Mithraratne, N.; Kua, H.W. Energy analysis of semi-transparent BIPV in Singapore buildings. Energy Build. 2013, 66, 274–281. [Google Scholar] [CrossRef]
- Xu, S.; Liao, W.; Huang, J.; Kang, J. Optimal PV cell coverage ratio for semi-transparent photovoltaics on office building façades in central China. Energy Build. 2014, 77, 130–138. [Google Scholar] [CrossRef]
- Kapsis, K.; Athienitis, A.K. A study of the potential benefits of semi-transparent photovoltaics in commercial buildings. Sol. Energy 2015, 115, 120–132. [Google Scholar] [CrossRef]
- Sreenath, S.; Sudhakar, K.; Yusop, A. Solar PV in the airport environment: A review of glare assessment approaches & metrics. Sol. Energy 2021, 216, 439–451. [Google Scholar]
- Florides, G.A.; Tassou, S.A.; Kalogirou, S.A.; Wrobel, L. Measures used to lower building energy consumption and their cost effectiveness. Appl. Energy 2002, 73, 299–328. [Google Scholar] [CrossRef]
- Lg.com. Solar/NeON® 2/NeON® 2 60 Cell/ LG365N1C-A6. Available online: https://www.lg.com/us/business/neon-2/lg-lg365n1c-a6 (accessed on 10 September 2022).
- Xie, H.; Zhang, Y.; Chen, Y.; Peng, Q.; Liao, Z.; Zhu, J. A case study of development and utilization of urban underground space in Shenzhen and the Guangdong-Hong Kong-Macao Greater Bay Area. Tunn. Undergr. Space Technol. 2021, 107, 103651. [Google Scholar] [CrossRef]
- National Development and Reform Commission of China. China’s Intended Nationally Determined Contribution Document. 2015. Available online: https://www4.unfccc.int/sites/submissions/INDC/Published%20Documents/China/1/China’s%20INDC%20-%20on%2030%20June%202015.pdf (accessed on 10 September 2022).
- Gou, Z.; Lau, S.S.-Y.; Chen, F. Subjective and objective evaluation of the thermal environment in a three-star green office building in China. Indoor Built Environ. 2012, 21, 412–422. [Google Scholar] [CrossRef]
- Chi, D.A.; Moreno, D.; Navarro, J. Correlating daylight availability metric with lighting, heating and cooling energy consumptions. Build. Environ. 2018, 132, 170–180. [Google Scholar] [CrossRef]
- Vine, E.; Lee, E.; Clear, R.; DiBartolomeo, D.; Selkowitz, S. Office worker response to an automated venetian blind and electric lighting system: A pilot study. Energy Build. 1998, 28, 205–218. [Google Scholar] [CrossRef]
- Hong, X.; Shi, F.; Wang, S.; Yang, X.; Yang, Y. Multi-objective optimization of thermochromic glazing based on daylight and energy performance evaluation. Build. Simul. 2021, 14, 1685–1695. [Google Scholar] [CrossRef]
- United Nations Climate Change. Grid-Connected Electricity Generation from Renewable Sources. Version 20.0. Available online: https://cdm.unfccc.int/methodologies/DB/XP2LKUSA61DKUQC0PIWPGWDN8ED5PG (accessed on 10 September 2022).
- Ministry of Ecology and Environment of China. Baseline Emission Factors of China’s Regional Power Grids for Emission Reduction Projects in 2019. Available online: https://www.mee.gov.cn/ywgz/ydqhbh/wsqtkz/202012/t20201229_815386.shtml (accessed on 10 September 2022).
- Chegari, B.; Tabaa, M.; Moutaouakkil, F.; Simeu, E.; Medromi, H. Local energy self-sufficiency for passive buildings: Case study of a typical Moroccan building. J. Build. Eng. 2020, 29, 101164. [Google Scholar] [CrossRef]
- ISO E.52016-1; Energy Performance of Buildings-Energy Needs for Heating and Cooling, Internal Temperatures and Sensible and Latent Heat Loads-Part 1: Calculation Procedures. International Organization for Standardization: Geneva, Switzerland, 2017.
- He, X.L. Simulation of the Influence of Solar Roof on Urban Thermal Environment and Energy Supply and Demand. Master’s Thesis, Nanjing University of Information Science and Technology, Nanjing, China, 2020. [Google Scholar]
- Yan, J.; Yang, Y.; Elia Campana, P.; He, J. City-level analysis of subsidy-free solar photovoltaic electricity price, profits and grid parity in China. Nat. Energy 2019, 4, 709–717. [Google Scholar] [CrossRef]
- National Energy Administration of China. Notice of the National Development and Reform Commission, the Ministry of Finance and the National Energy Administration on Matters Related To Photovoltaic Power Generation in 2018. Available online: https://www.ndrc.gov.cn/xxgk/zcfb/tz/201806/t20180601_962736.html?code=&state=123 (accessed on 10 September 2022).


| No. | Technologies or Products | Example | Efficiency |
|---|---|---|---|
| 1 | Organic PV (OPV) |  (Source: left = ARMOR/GerArchitektur [22]; right = Fraunhofer Institute for Solar Energy Systems ISE [23]) | 15.2% [24] |
| 2 | Flexible solar PV (Perovskite) |  (Source: Iaremenko, iStock, and Getty Images [22]) | 21.6% [24] |
| 3 | Colorful PV (dye-sensitized solar cell) |  (Source: left = Iaremenko, iStock, and Getty Images [22]; right = Solar Energy Research Institute of Singapore (SERIES)) | 11.9% [24] |
| Author(s) | Study Area | Research Focuses | Findings |
|---|---|---|---|
| Ghani, F., Duke, M., and Carson, J. K. (2012) | N.A. | Estimation of BIPV conversion efficiency | In this paper, the authors proposed an artificial neural network that can be used to calculate the power generation of photovoltaic arrays of specified shapes. By simulating the photovoltaic power generation of each scenario, the optimal configuration can be selected [30]. |
| Li, S. et al. (2014) | USA | Performance analysis of BIPV/T systems with corrugated unglazed transpired solar collectors (UTCs) | This study investigated the optimal geometry of UTC with photovoltaic panels. The results of the study found that wavelength and PV panel height had the greatest impact on UTC with PV panels [31,32]. |
| Pacheco-Torres, R. et al.(2015) | Spain | The relationship between building morphology, energy efficiency, and generation capacity of PV panels | This study analyzed three residential building types: single-family detached, semi-detached, and multi-dwelling houses. The results indicated that the single-family detached dwelling model is less energy efficient. For multiple dwellings, the optimal building height can be obtained according to the building area to reduce building energy consumption [33]. |
| Savvides, A. and Vassiliades, C. (2017) | Cyprus | Optimal building geometry with higher solar radiation | The results of the study show that massing configurations in which the south-facing roofs and façades of the community plan contain more building volume and can absorb more solar radiation [34]. |
| Walker, L., Hofer, J., and Schlueter, A. (2019) | Switzerland | BIPV modeling and optimization simulation methods | The results demonstrate that by using genetic algorithms, BIPV layouts and morphologies can be simulated and optimized in urban environments to minimize power losses in BIPV networks with various modules [35]. |
| Arnaout, M. A., Go, Y. I., and Saqaff, A. (2020) | Malaysia | Technical assessment and economic analysis of BIPV | Eight proposed configurations of roof systems for Heriot-Watt University Malaysia were compared from energy and economic perspectives. Results show that systems using CdTe thin film modules provide the highest energy potential [36]. |
| Paydar, M. A. (2020) | Iran | Optimal design of BIPV as movable sunshade device | The results show that the movable BIPV shading system has a significant effect on the reduction of the annual heat load of a building, which can be reduced by up to 20%. However, the change in the tilt angle of the BIPV panel has little effect on the power generation, and the annual power generation of the movable BIPV is only 2% higher than that of the fixed type [37]. |
| Yin, Y. et al. (2020) | N.A. | PV conversion efficiency for ethylene-tetrafluoroethylene (ETFE) cushion roofs | This study presented a 3D numerical model that elucidates the coupling relationship between heat, interior air, and the ETFE roof structure, thereby proposing potential solutions to dissipate excess heat to optimize future designs [38]. |
| Kaplanis, S., Kaplani, E., and Kaldellis, J. K. (2022) | Greece | PV temperature and performance | This study presented a model for predicting PV temperature and performance, including predicting the effects of ambient temperature and dip angle on PV heat transfer coefficient, efficiency, and aging [39]. |
| Representative Case | Normalization Process |
|---|---|
 |  |
| The Shenzhen Reform and Opening Up Exhibition Hall (Source: Sou Fujimoto Architects and Donghua Chen Studio) | Flat roof Height: 50 m; roof area: 10,000 m2 |
 |  |
| The Shenzhen Financial and Cultural Center (Source: China Southwest Architectural Design and Research Institute and Swooding Architects) | Pyramidal roof Height: 50 m (25 + 25); roof Area: 11,180 m2 |
 |  |
| The Shenzhen Ocean Museum (Source: SANAA) | Curvilinear roof Height: 50 m (25 + 25); roof area: 13,172 m2 |
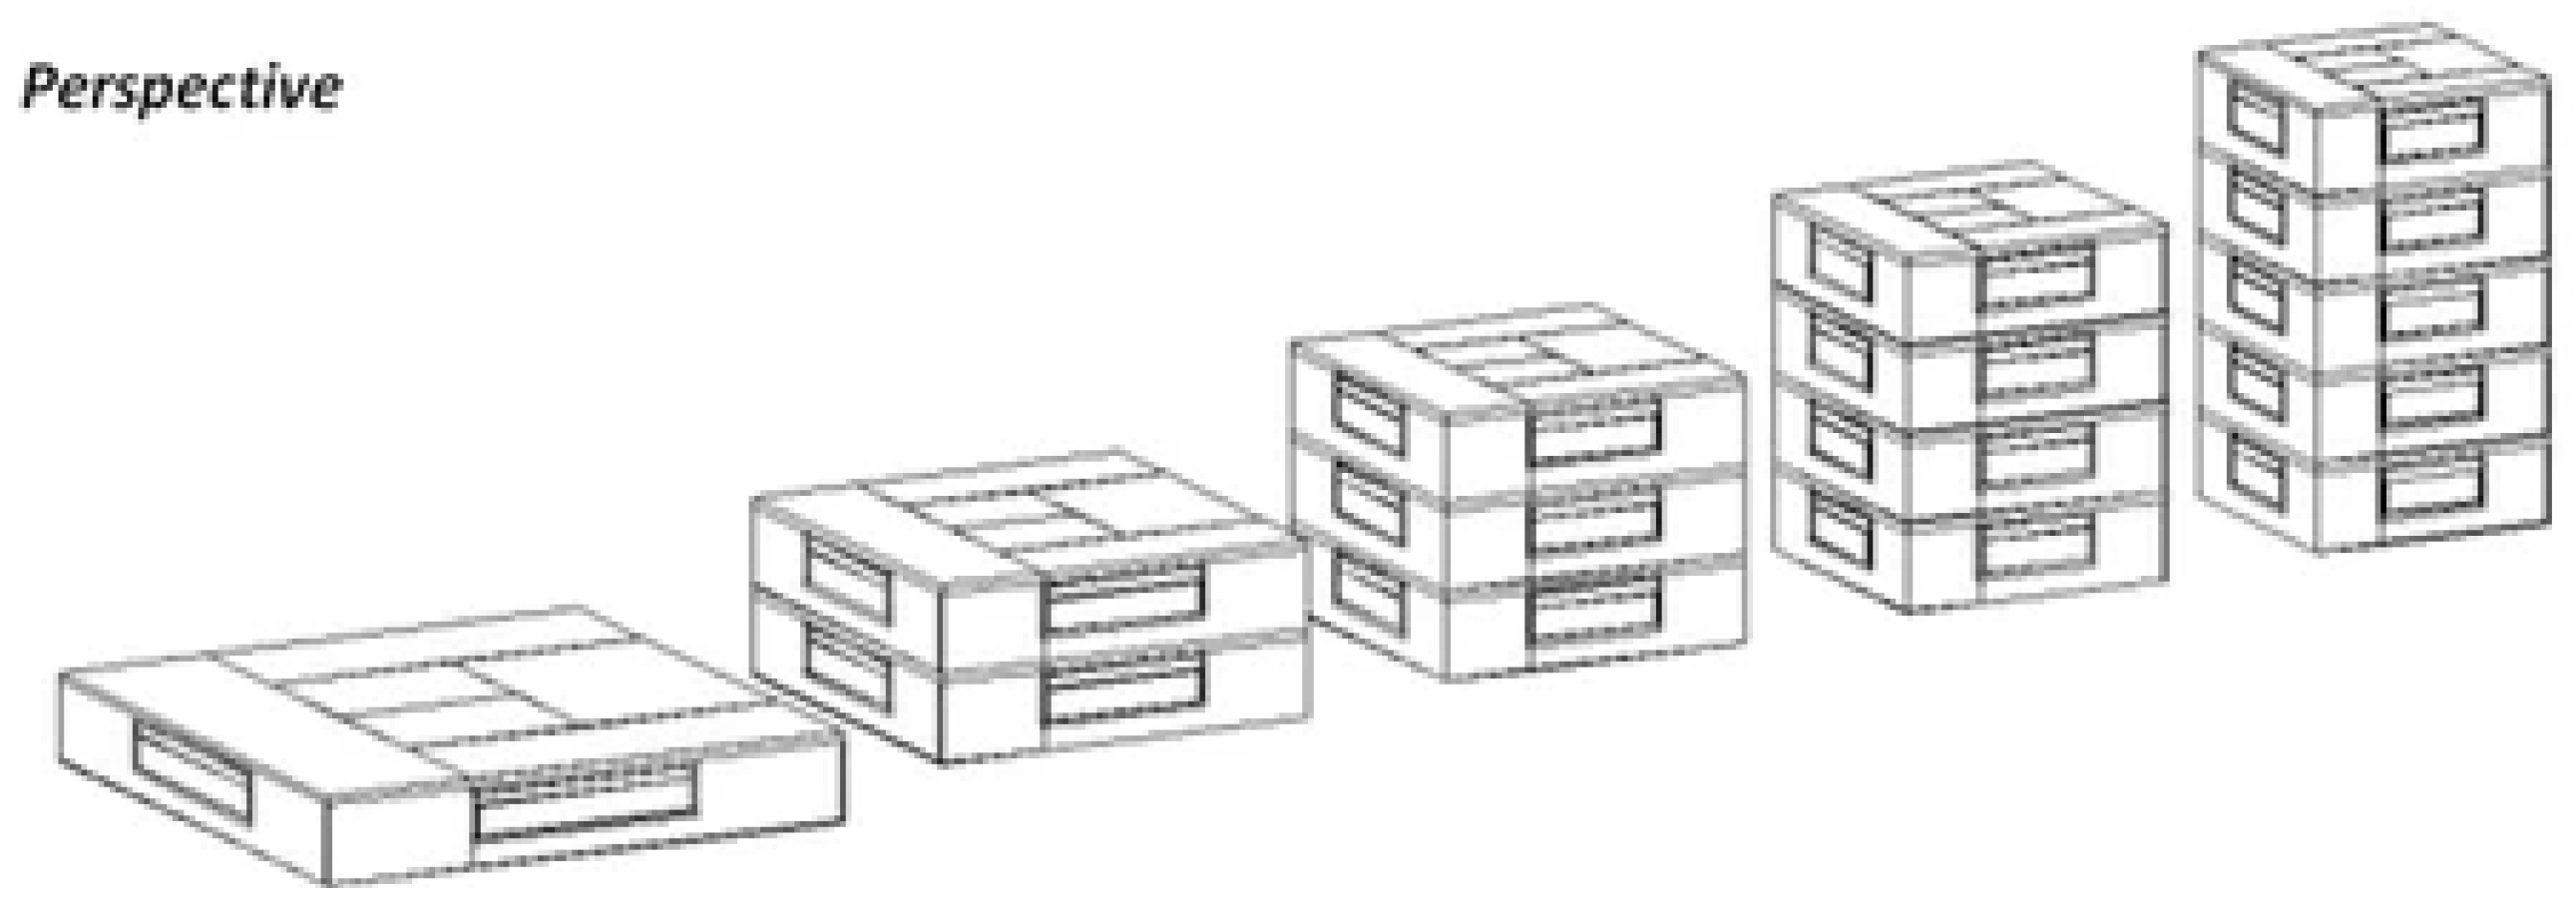
| Roof Type (Front View) | Percentage of PV Panels to Roof Area | ||||||||
|---|---|---|---|---|---|---|---|---|---|
| 0% | 20% | 30% | 40% | 50% | 60% | 70% | 80% | 90% | |
Flat roof |  | ||||||||
Pyramidal roof |  | ||||||||
Curvilinear roof |  | ||||||||
| Input | Description/Value |
|---|---|
| Mount type (configuration) | Close (flush) roof mount (PV array mounted parallel and relatively close to the plane of the roof (between 5 cm)) |
| Width (cm) | 4 cm |
| Module efficiency (%) | 20% |
| Peak power (Pmax) | 273 W |
| Temperature coefficient (percentage/deg. Celsius) | −0.5%/°C |
| Module active area percent (%) | 100% |
| Building Parameter | Unit | Value |
|---|---|---|
| Roof glazing type | mm | Double glazing (6, 12, and 6 mm) |
| Roof U-value | W/(m2·K) | 1.8 |
| Visible transmittance | - | 0.8 |
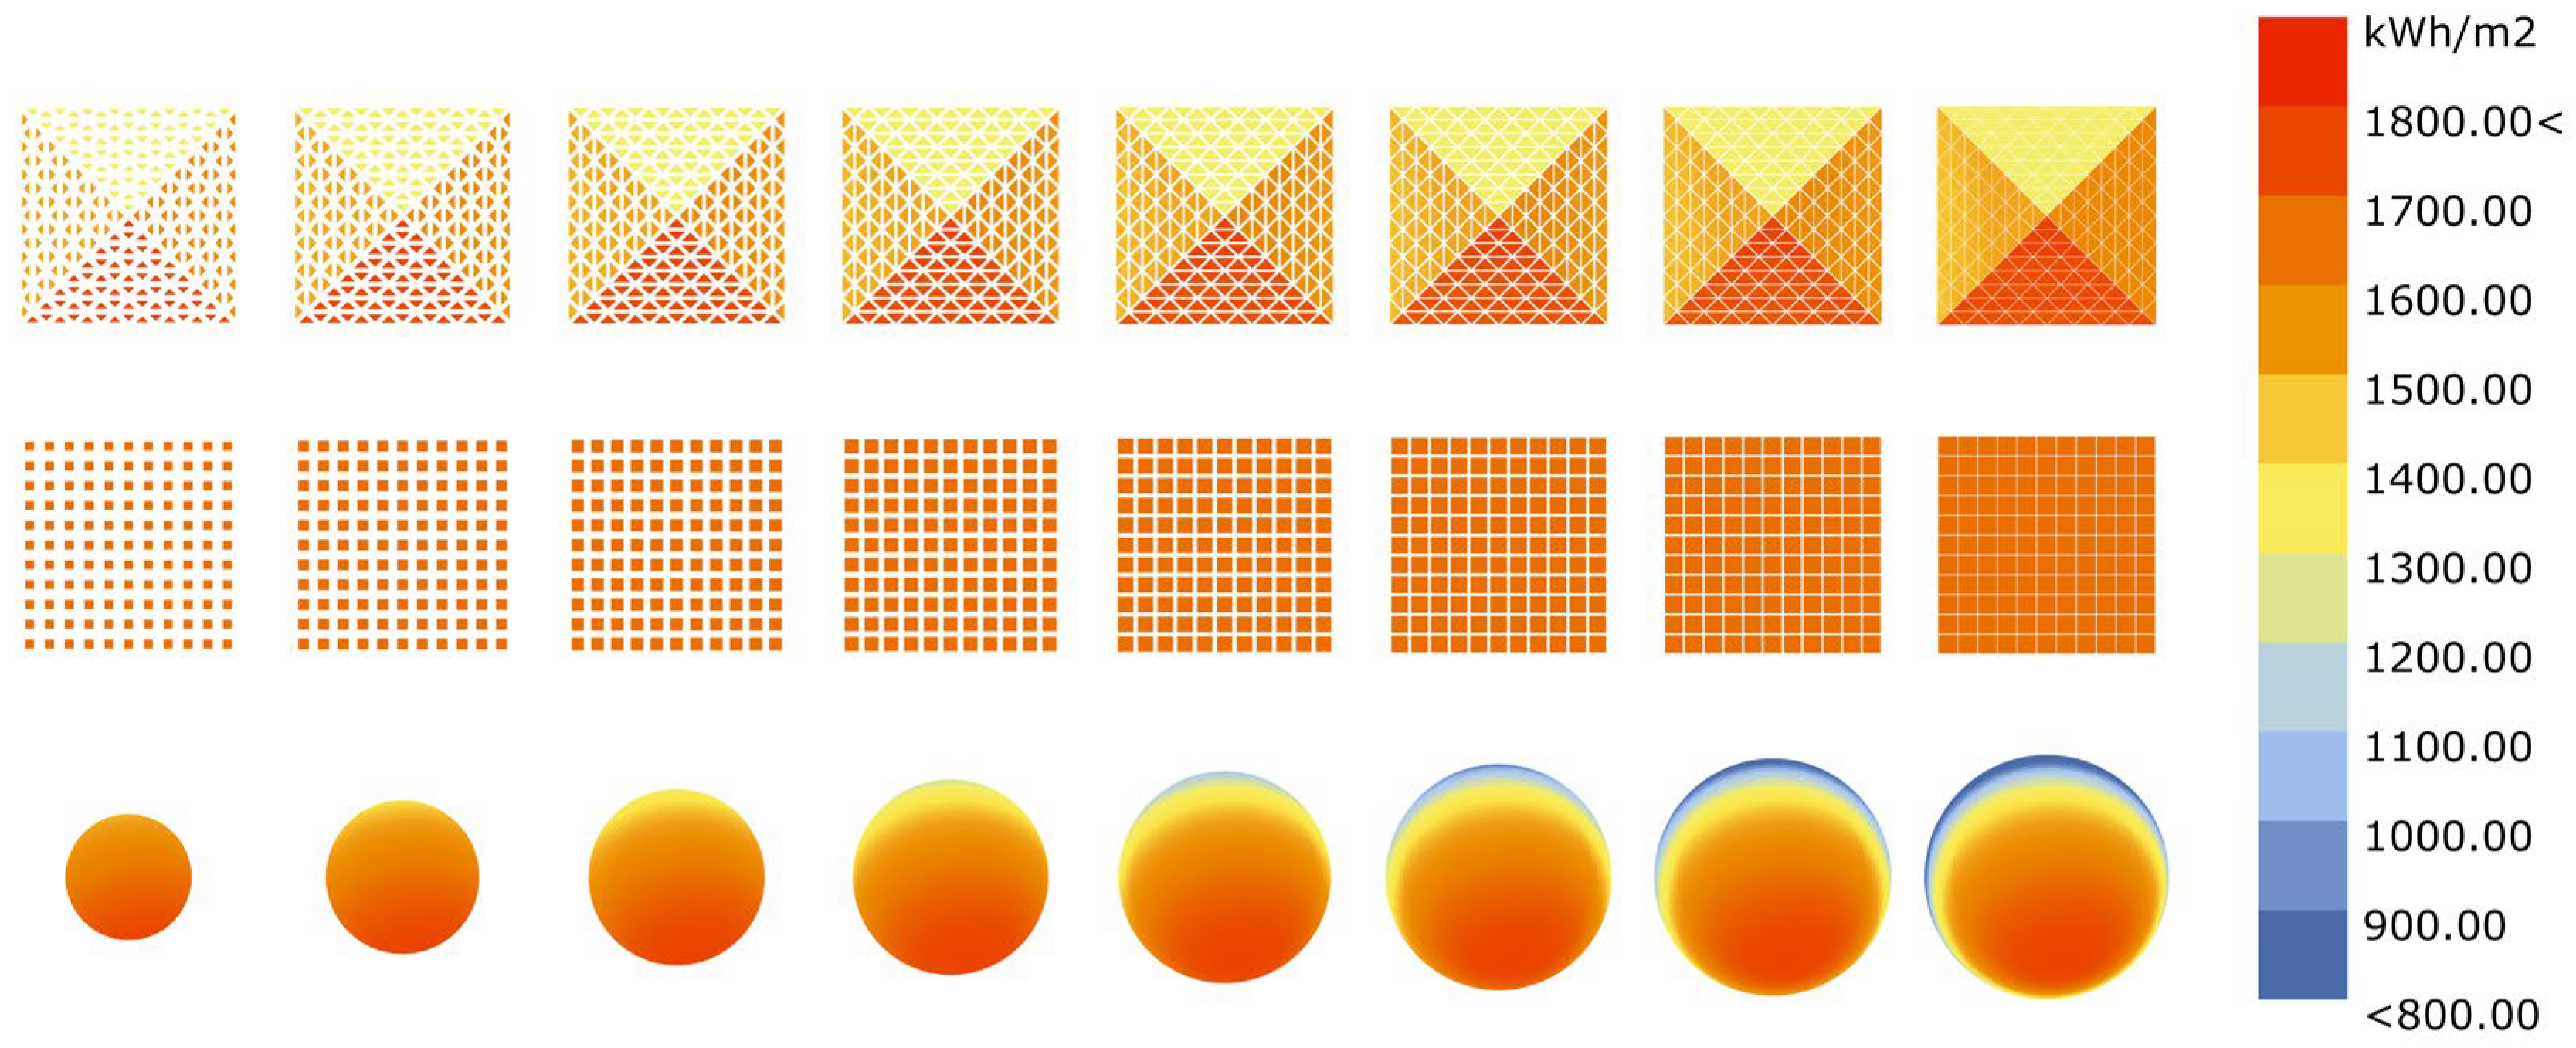
| Location | Sun Path and Diffuse Horizontal Radiation (21 Mar) | Radiation Analysis (1 Jan–31 Dec) | ||
|---|---|---|---|---|
| Flat Roof | Pyramidal Roof | Curvilinear Roof | ||
| Low-latitude city (Shenzhen, 22.62 N, 114.07 E), |  |  |  |  |
| High-latitude city (Harbin, 45.45 N, 126.46 E) |  |  |  |  |
| Power Grid | EFgrid,OM Simple,y (tCO2/MWh) | EFgrid,BM,y (tCO2/MWh) |
|---|---|---|
| North China Grid | 0.9419 | 0.4819 |
| Northeast Grid | 1.0826 | 0.2399 |
| East China Grid | 0.7921 | 0.3870 |
| Central China Grid | 0.8587 | 0.2854 |
| Northwest Grid | 0.8922 | 0.4407 |
| Southern Grid | 0.8042 | 0.2135 |
Publisher’s Note: MDPI stays neutral with regard to jurisdictional claims in published maps and institutional affiliations. |
© 2022 by the authors. Licensee MDPI, Basel, Switzerland. This article is an open access article distributed under the terms and conditions of the Creative Commons Attribution (CC BY) license (https://creativecommons.org/licenses/by/4.0/).
Share and Cite
Miao, Y.; Liu, P.; Fu, I.C.S.; Lei, Q.; Lau, S.S.Y.; Tao, Y. The Study of Architectural Geometry and Shape in the Energy Balance of Glazed Roofs. Buildings 2022, 12, 1550. https://doi.org/10.3390/buildings12101550
Miao Y, Liu P, Fu ICS, Lei Q, Lau SSY, Tao Y. The Study of Architectural Geometry and Shape in the Energy Balance of Glazed Roofs. Buildings. 2022; 12(10):1550. https://doi.org/10.3390/buildings12101550
Chicago/Turabian StyleMiao, Yijia, Ping Liu, Ivan Chin Shing Fu, Qinghua Lei, Stephen Siu Yu Lau, and Yiqi Tao. 2022. "The Study of Architectural Geometry and Shape in the Energy Balance of Glazed Roofs" Buildings 12, no. 10: 1550. https://doi.org/10.3390/buildings12101550