

Study on the Mechanical Response Mechanism and Damage Behavior of a Tunnel Lining Structure under Reverse Fault Dislocation
Abstract
:1. Introduction
1.1. Research Background and Significance
1.2. Research Status
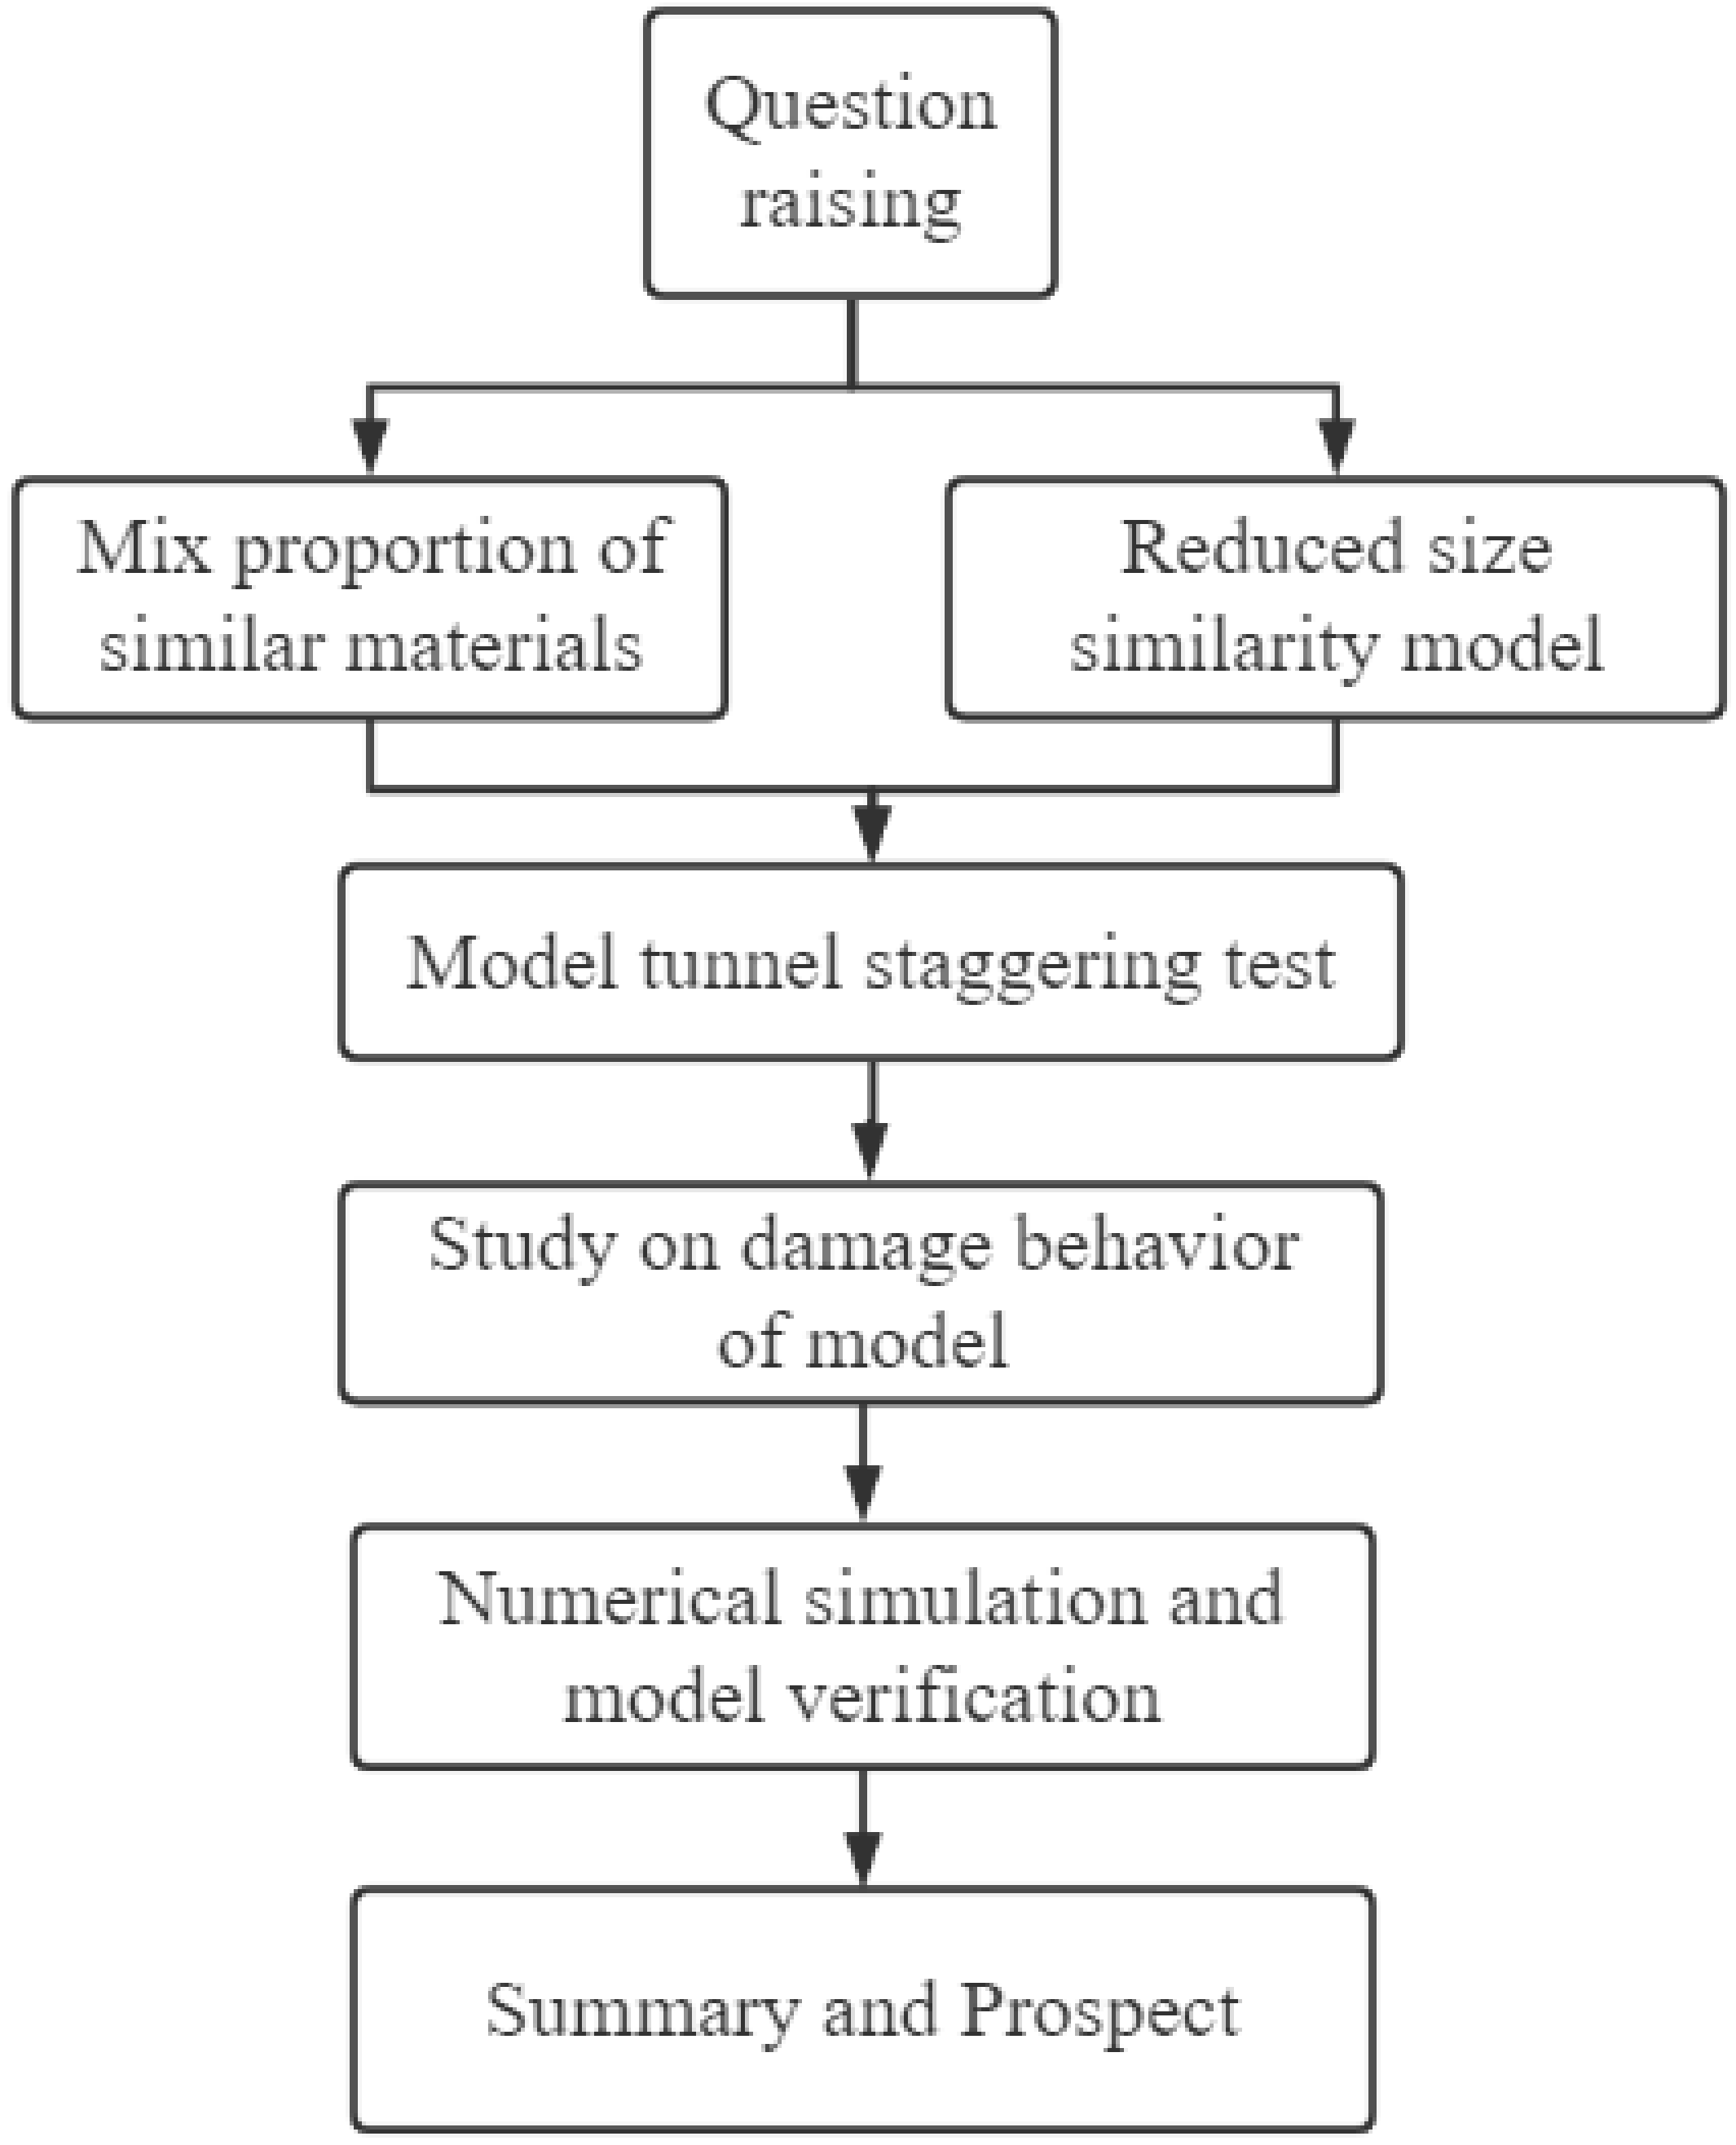
1.3. Research Framework Figure
2. Model Test
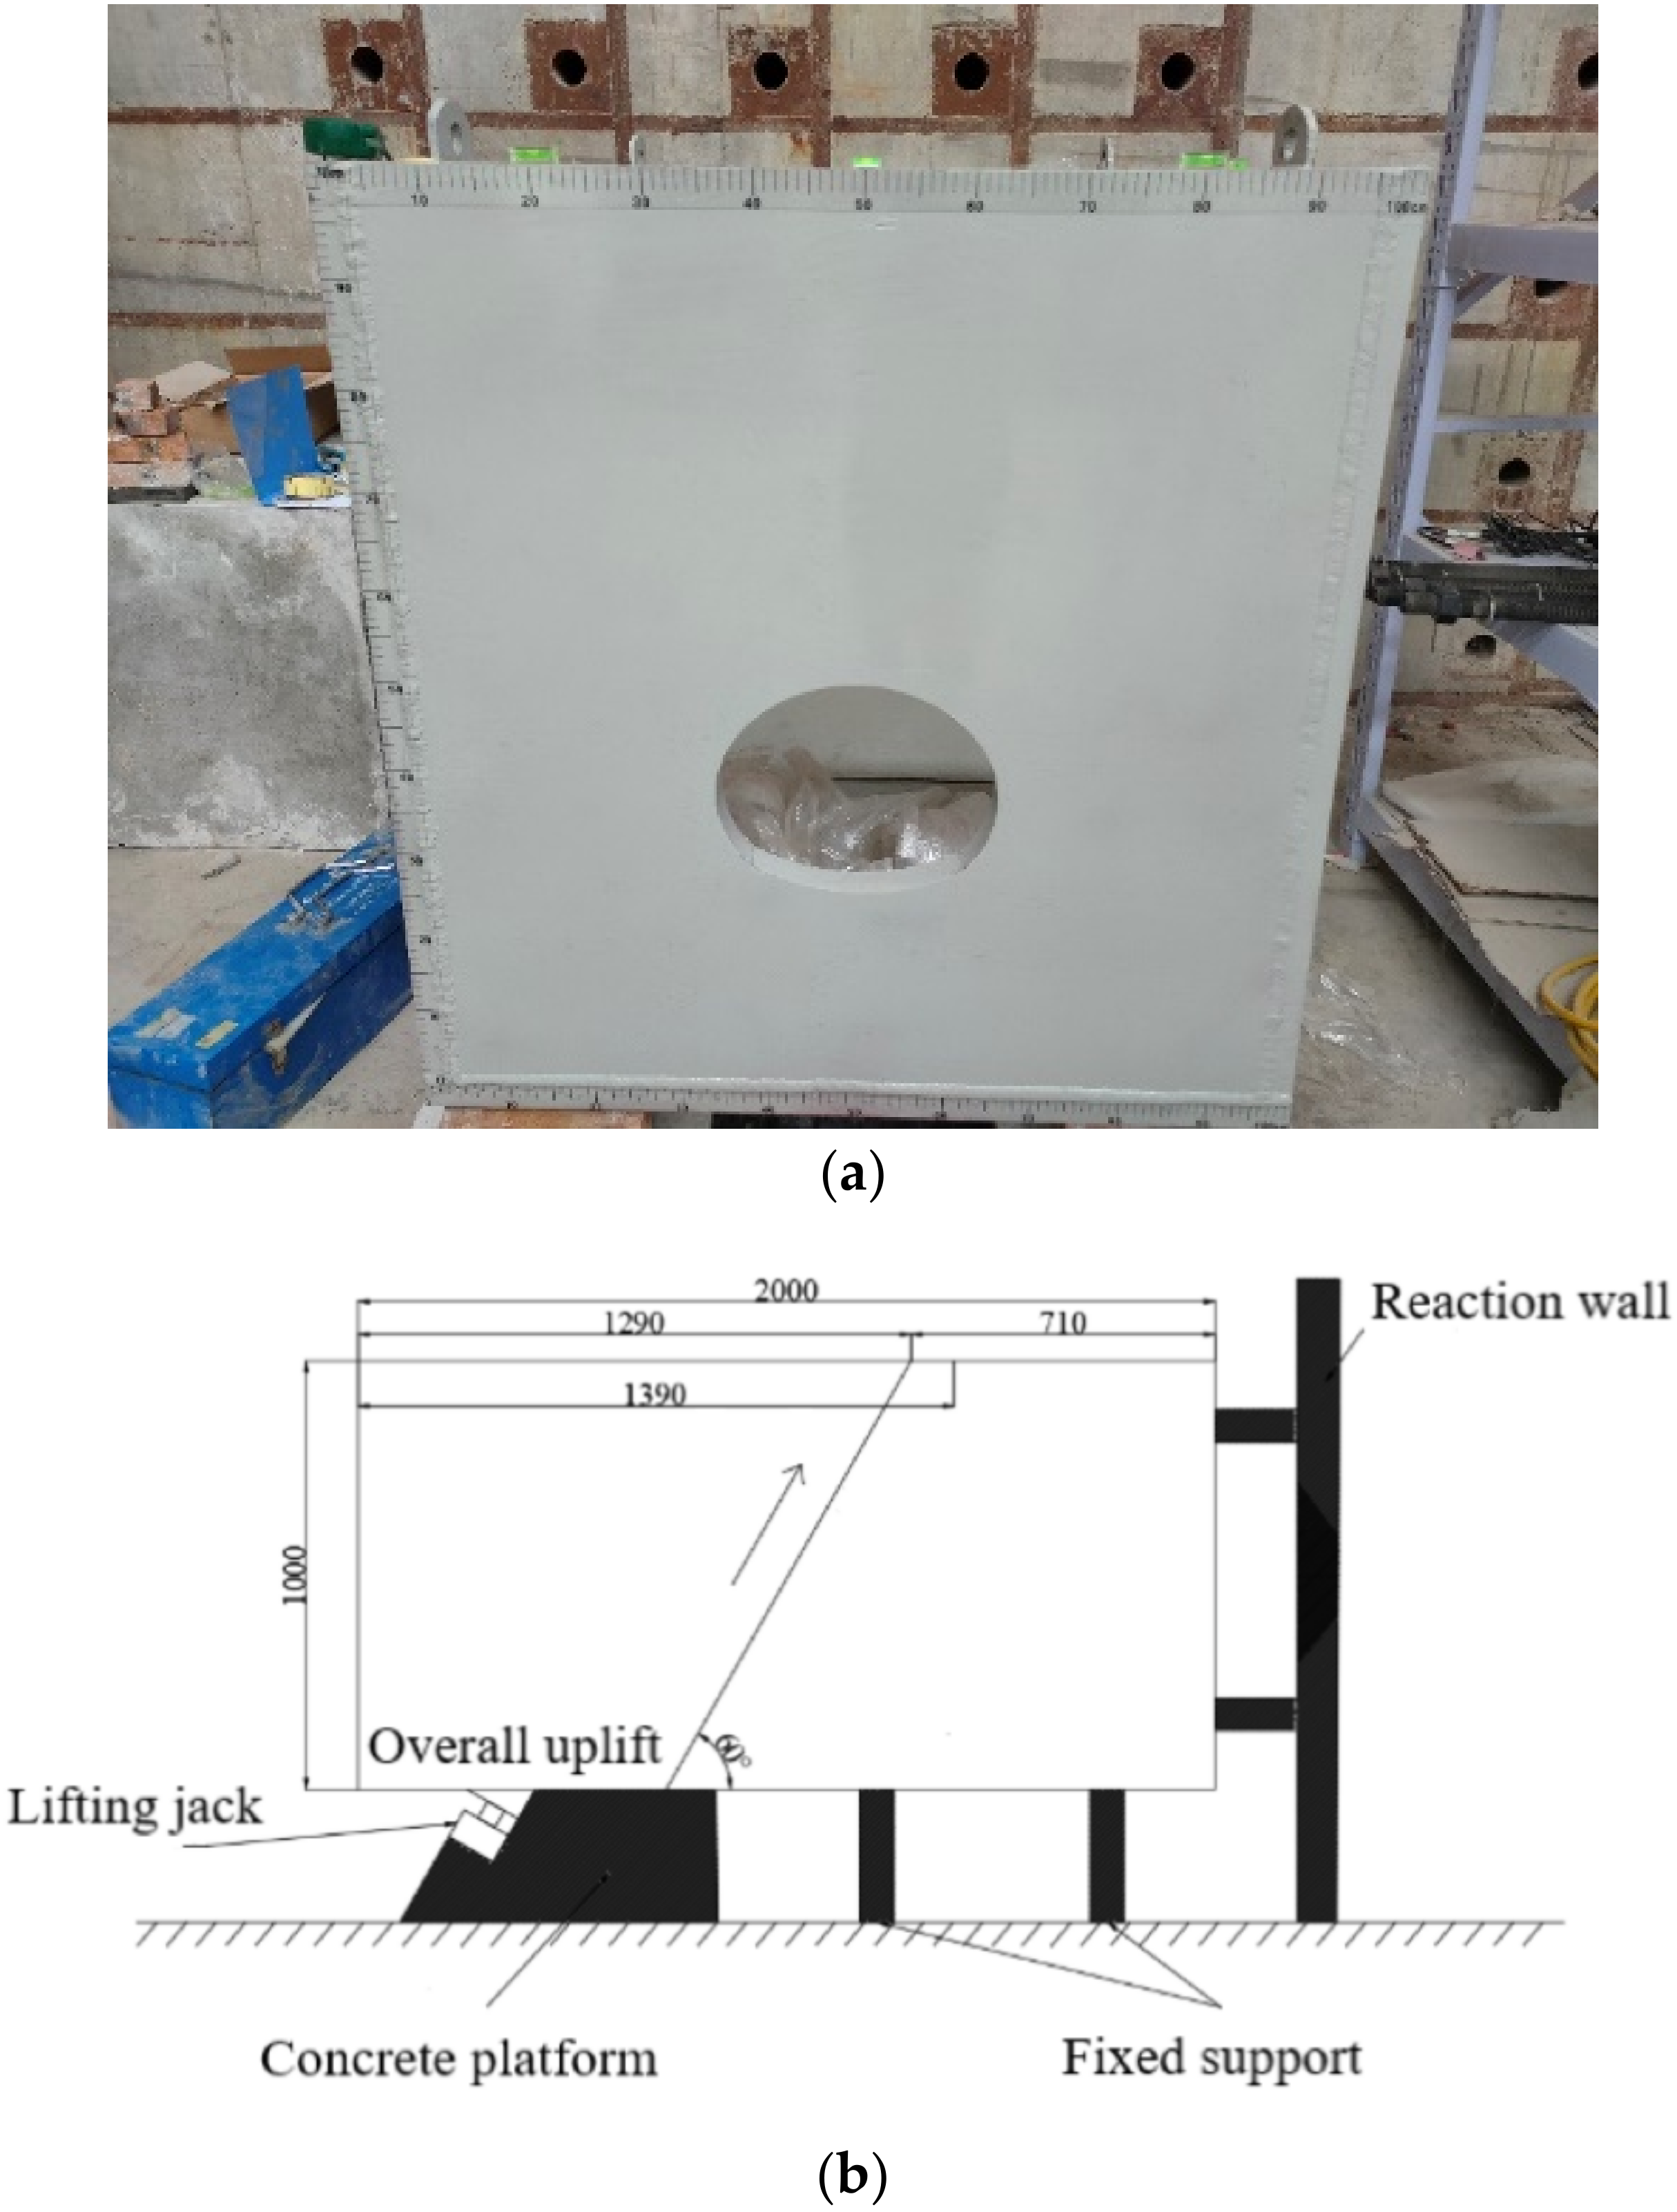
2.1. Test Device
2.2. Similarity Principle and Similarity Ratio
2.3. Similar Materials
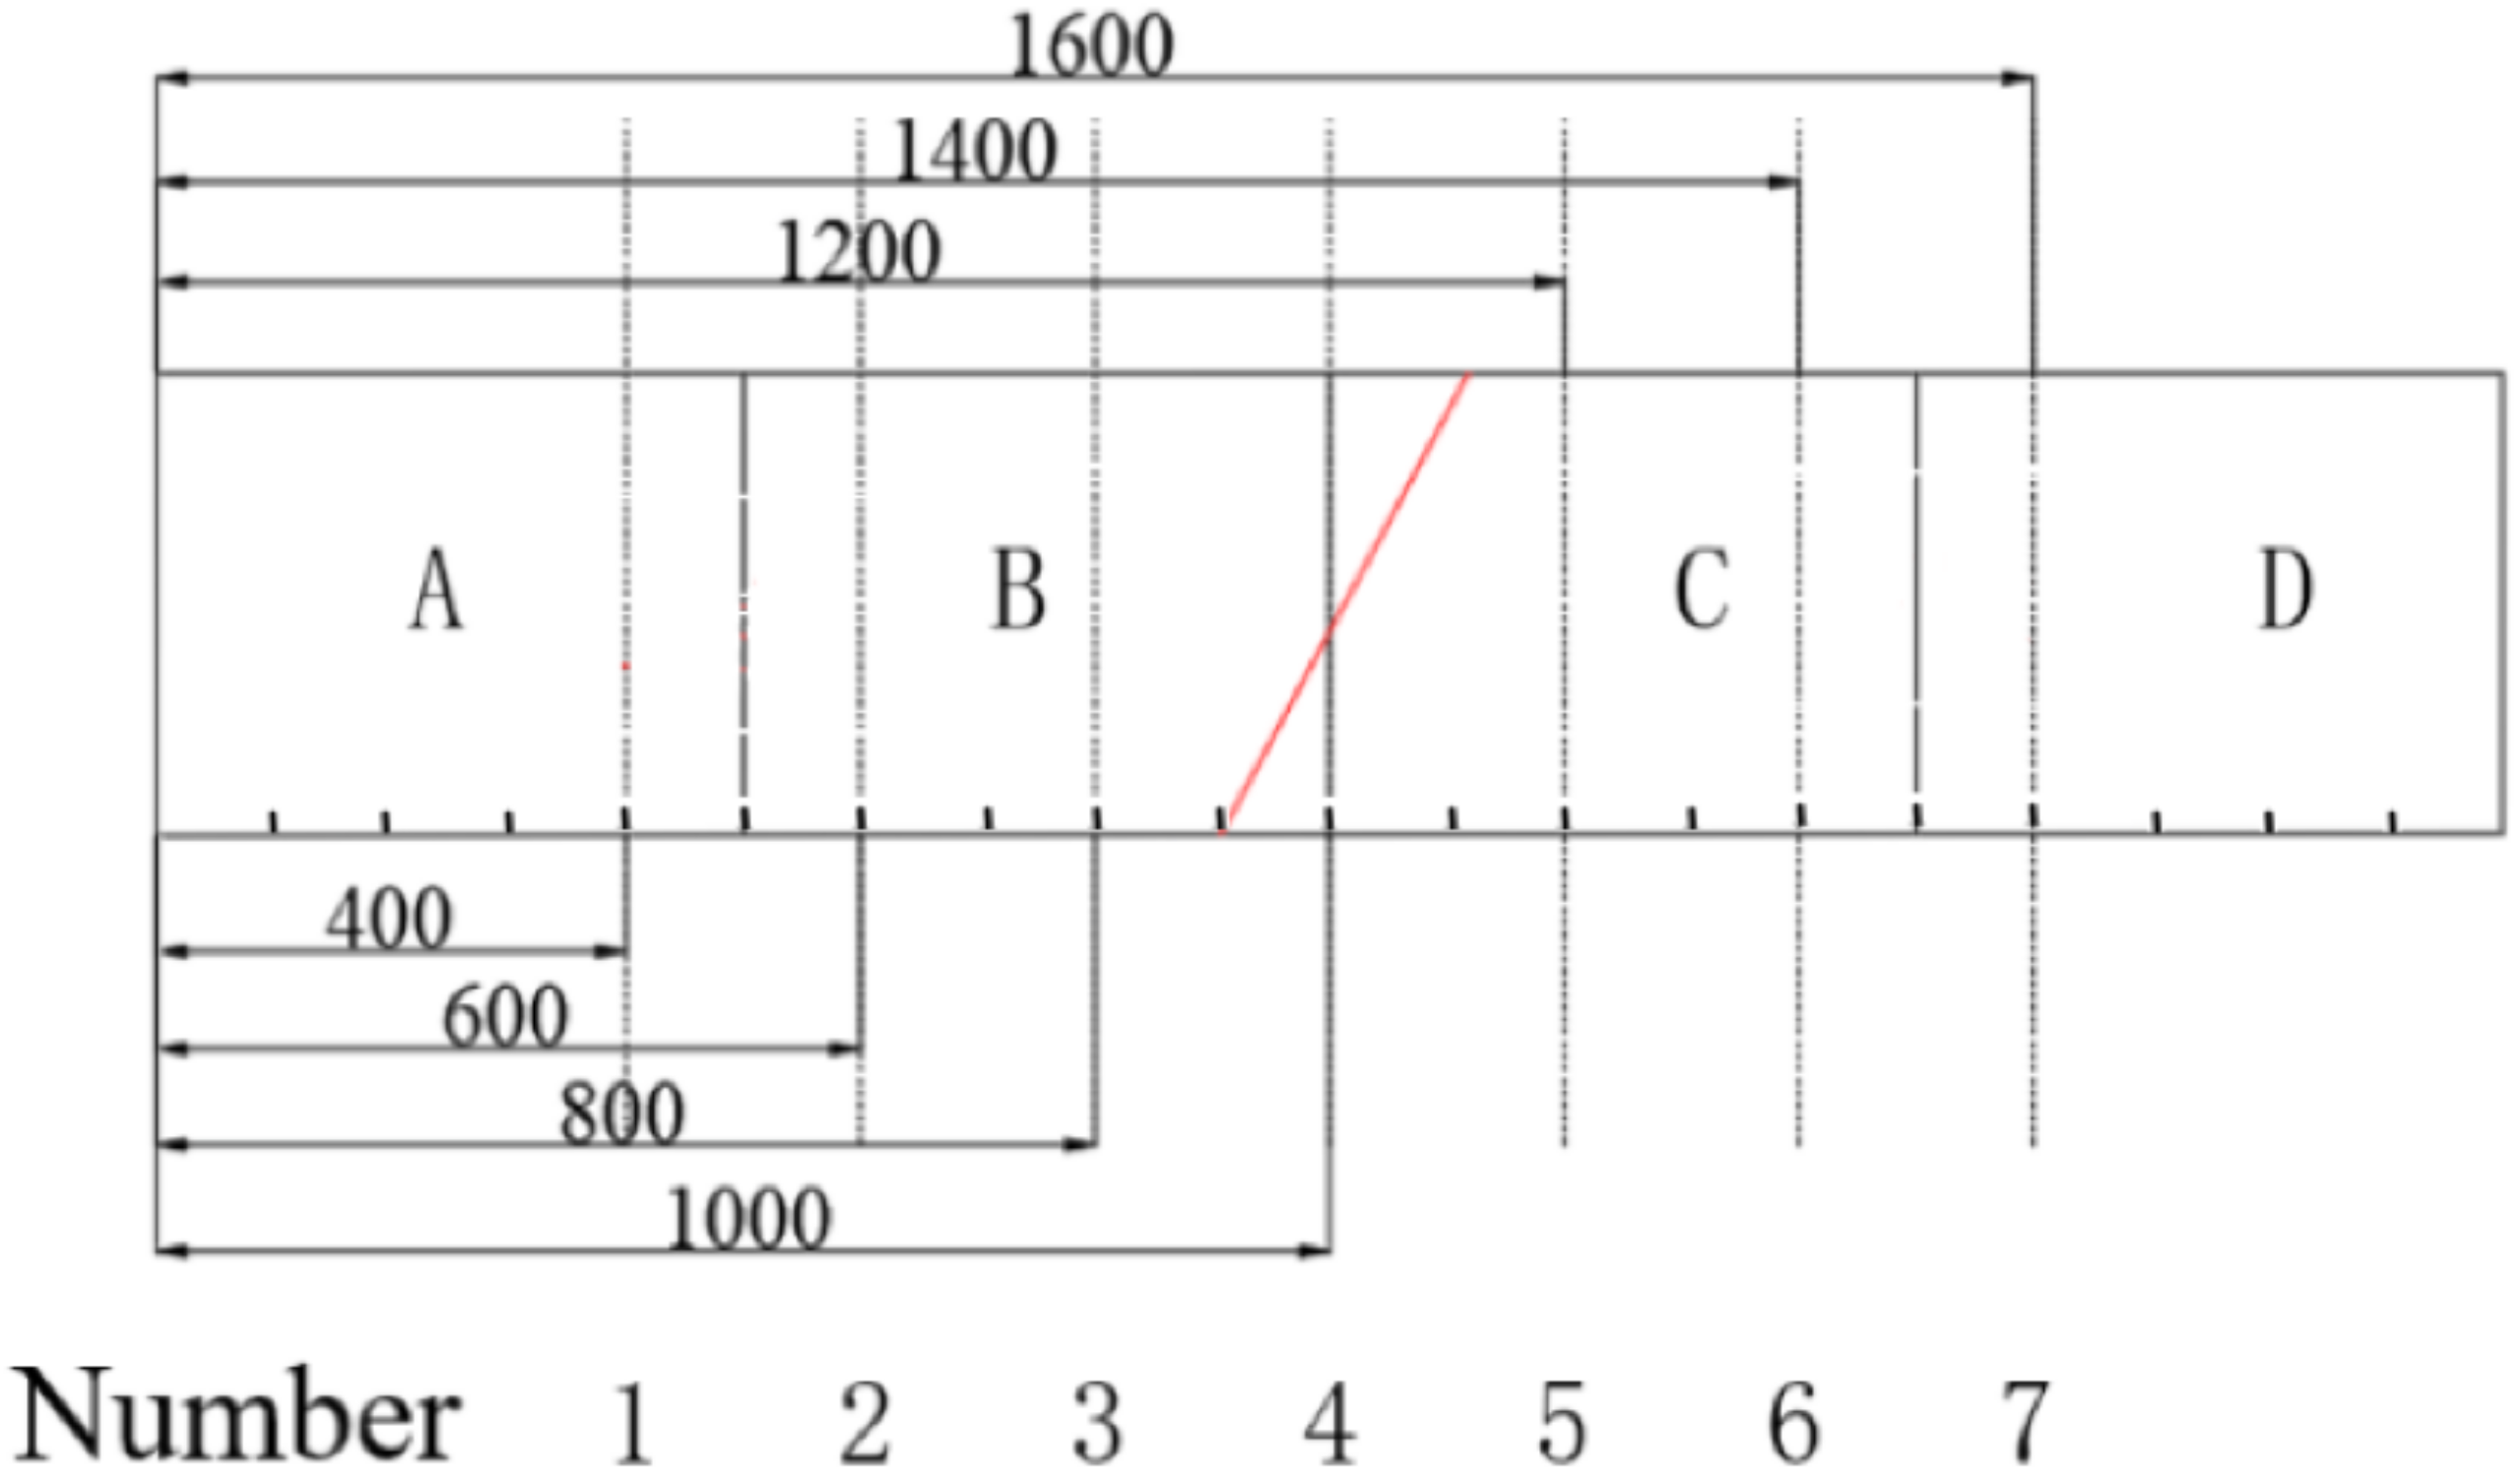
2.4. Test Content
- (1)
- We configured similar materials to the surrounding rock, and put raw materials such as river sand, fly ash, and waste engine oil into the mixer according to the ratio determined above to mix evenly.
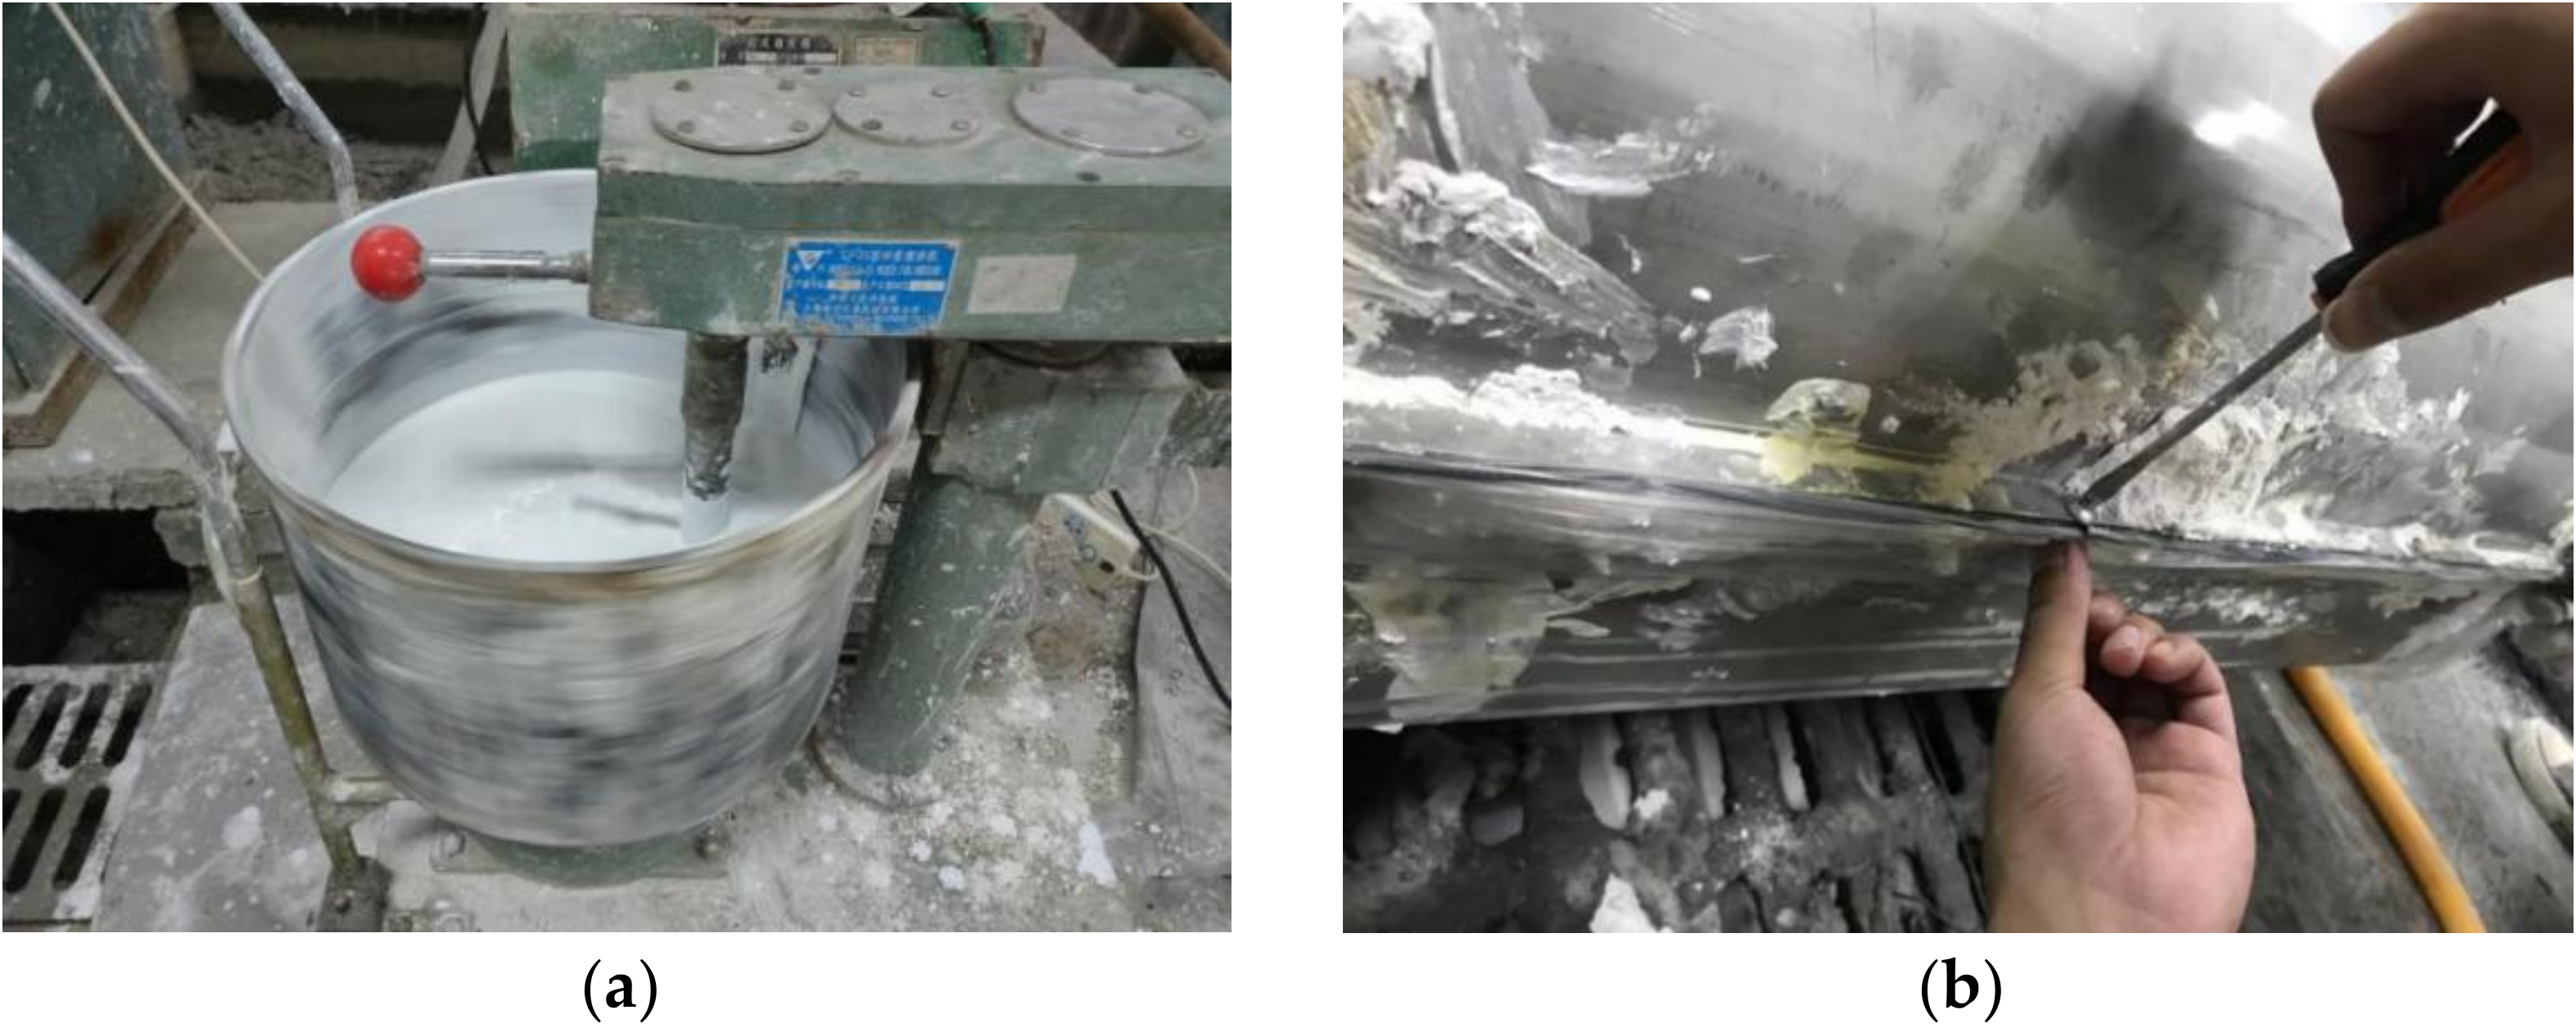
- (2)
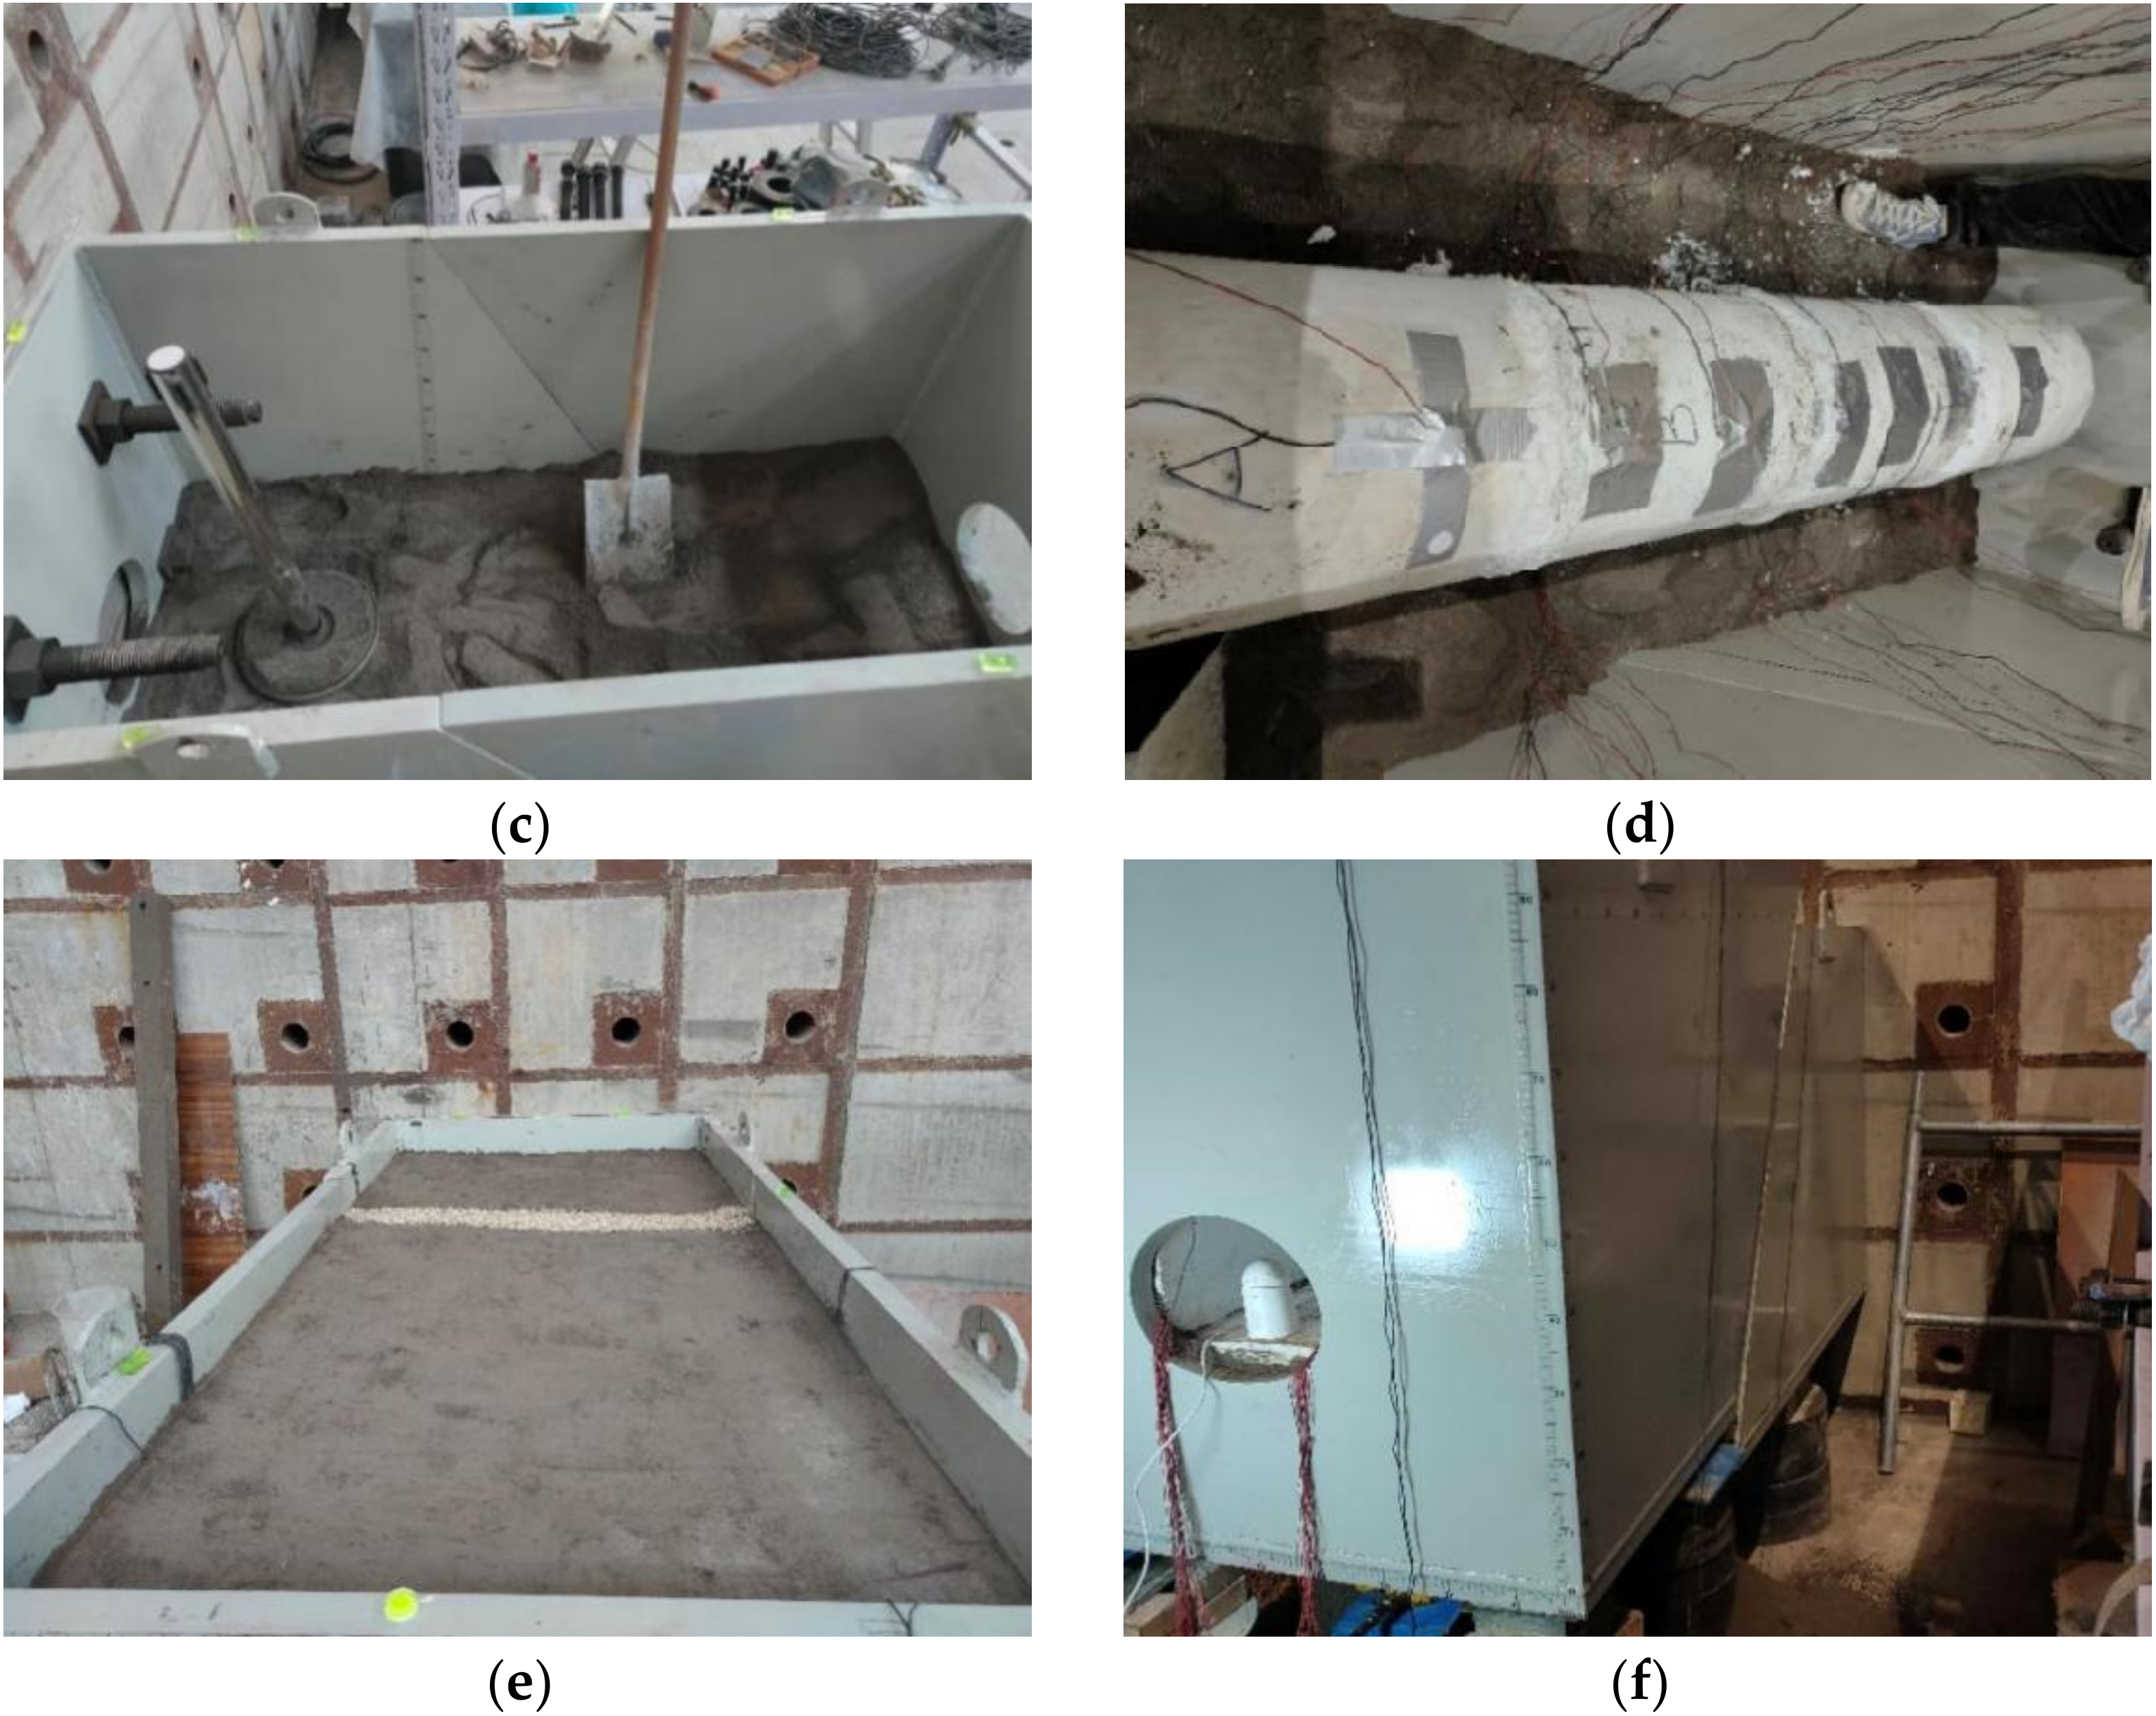
- Poured the lining model; put the gypsum, water, retarder, and other raw materials into the mixer according to the proportions determined above, mixed them evenly, and poured the lining model in the precast mold. In order to prevent the gypsum from flowing out of the side gap when it is not solidified, gaskets were added at the joint of the external formwork. In order to fix the relative position of the two outer molds, we used screws at the joint of the mold and clamped the screws so that the gasket filled the whole gap. The inner mold could be removed half an hour after pouring. After the gypsum was completely solidified, the outer mold was removed for curing. After the air drying reached sufficient strength, the strain gauge and micro pressure sensor were pasted onto the test section.
- (3)
- We filled the model box with the configured surrounding rock material. When it was filled to the height of the tunnel, we placed the lining model with the test elements arranged, sorted out and led out the conductors, checked whether they were intact with a multimeter, connected the instruments to test and zero, and then continued to compact the filler to the top of the box. After the work on the model box was completed, we opened the data acquisition instrument and observed whether there were abnormal test elements. If there were abnormal elements, we eliminated the abnormal conditions before proceeding to the next step. If there was no abnormality, we recorded the initial stress and displacement of the lining model, and then cleared the balance to prepare for the subsequent data collection.
- (4)
- A jack was used to load and lift the hanging wall of the model, so that the hanging wall could maintain displacement along the direction of the sliding surface to simulate the fault activity. The vertical displacement rate of the hanging wall was taken as 1 mm/min, and every 5 mm was a stage, with periodic dislocations of 5 mm, 10 mm, 15 mm, 20 mm, 25 mm, and 30 mm for 30 min, respectively. We collected and recorded the data of each monitoring element at this time. After the vertical stagger distance reached 30 mm, it did not stop periodically, and continued to load and lift until the model was seriously damaged.
- (5)
- After the test, we excavated the lining structure, and observed and recorded its damage.
2.5. Results of Model Test
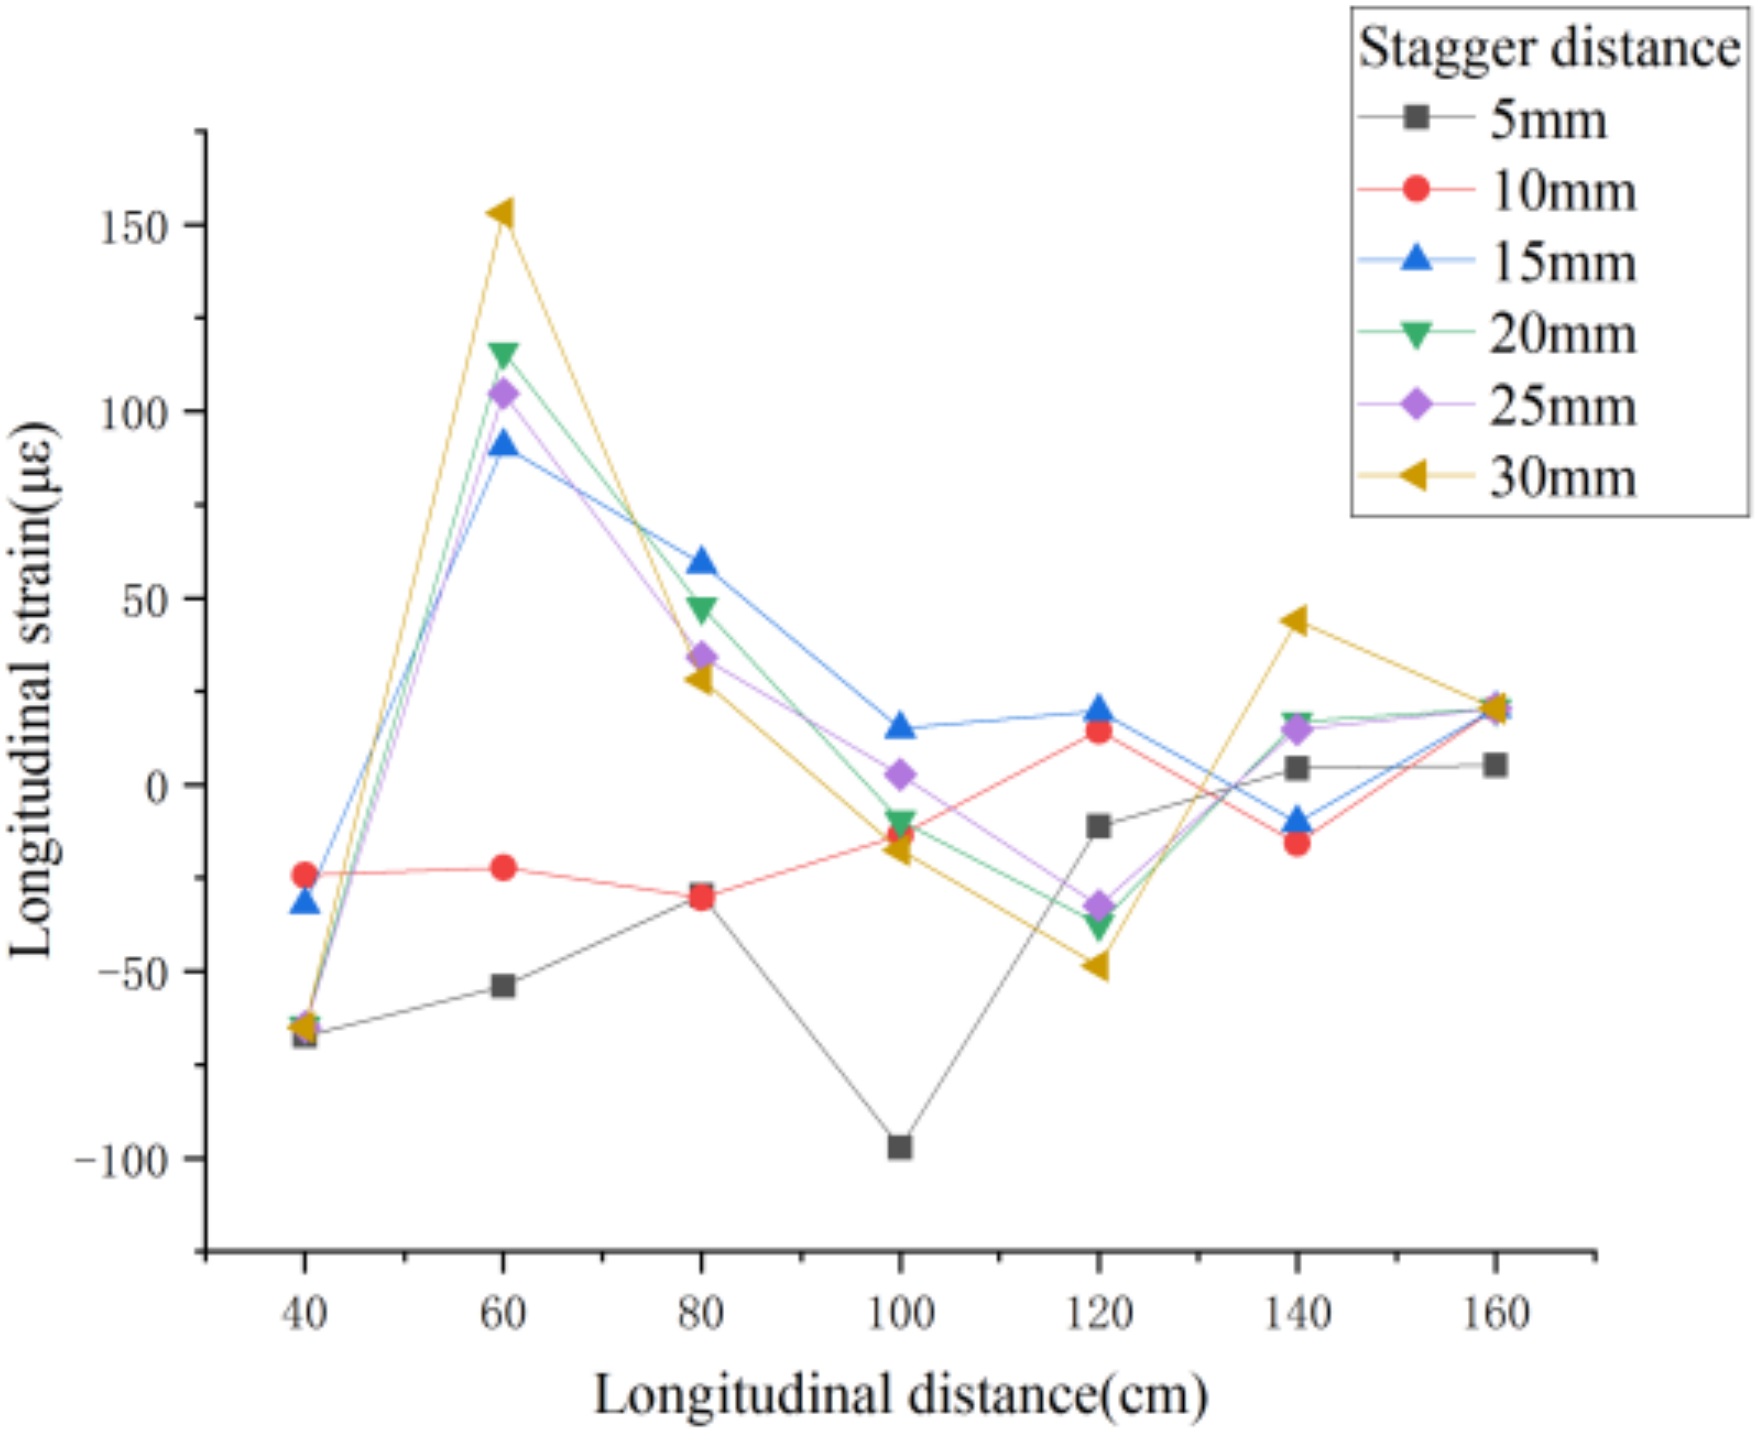
2.5.1. Longitudinal Strain Analysis of Arch Waist of Lining
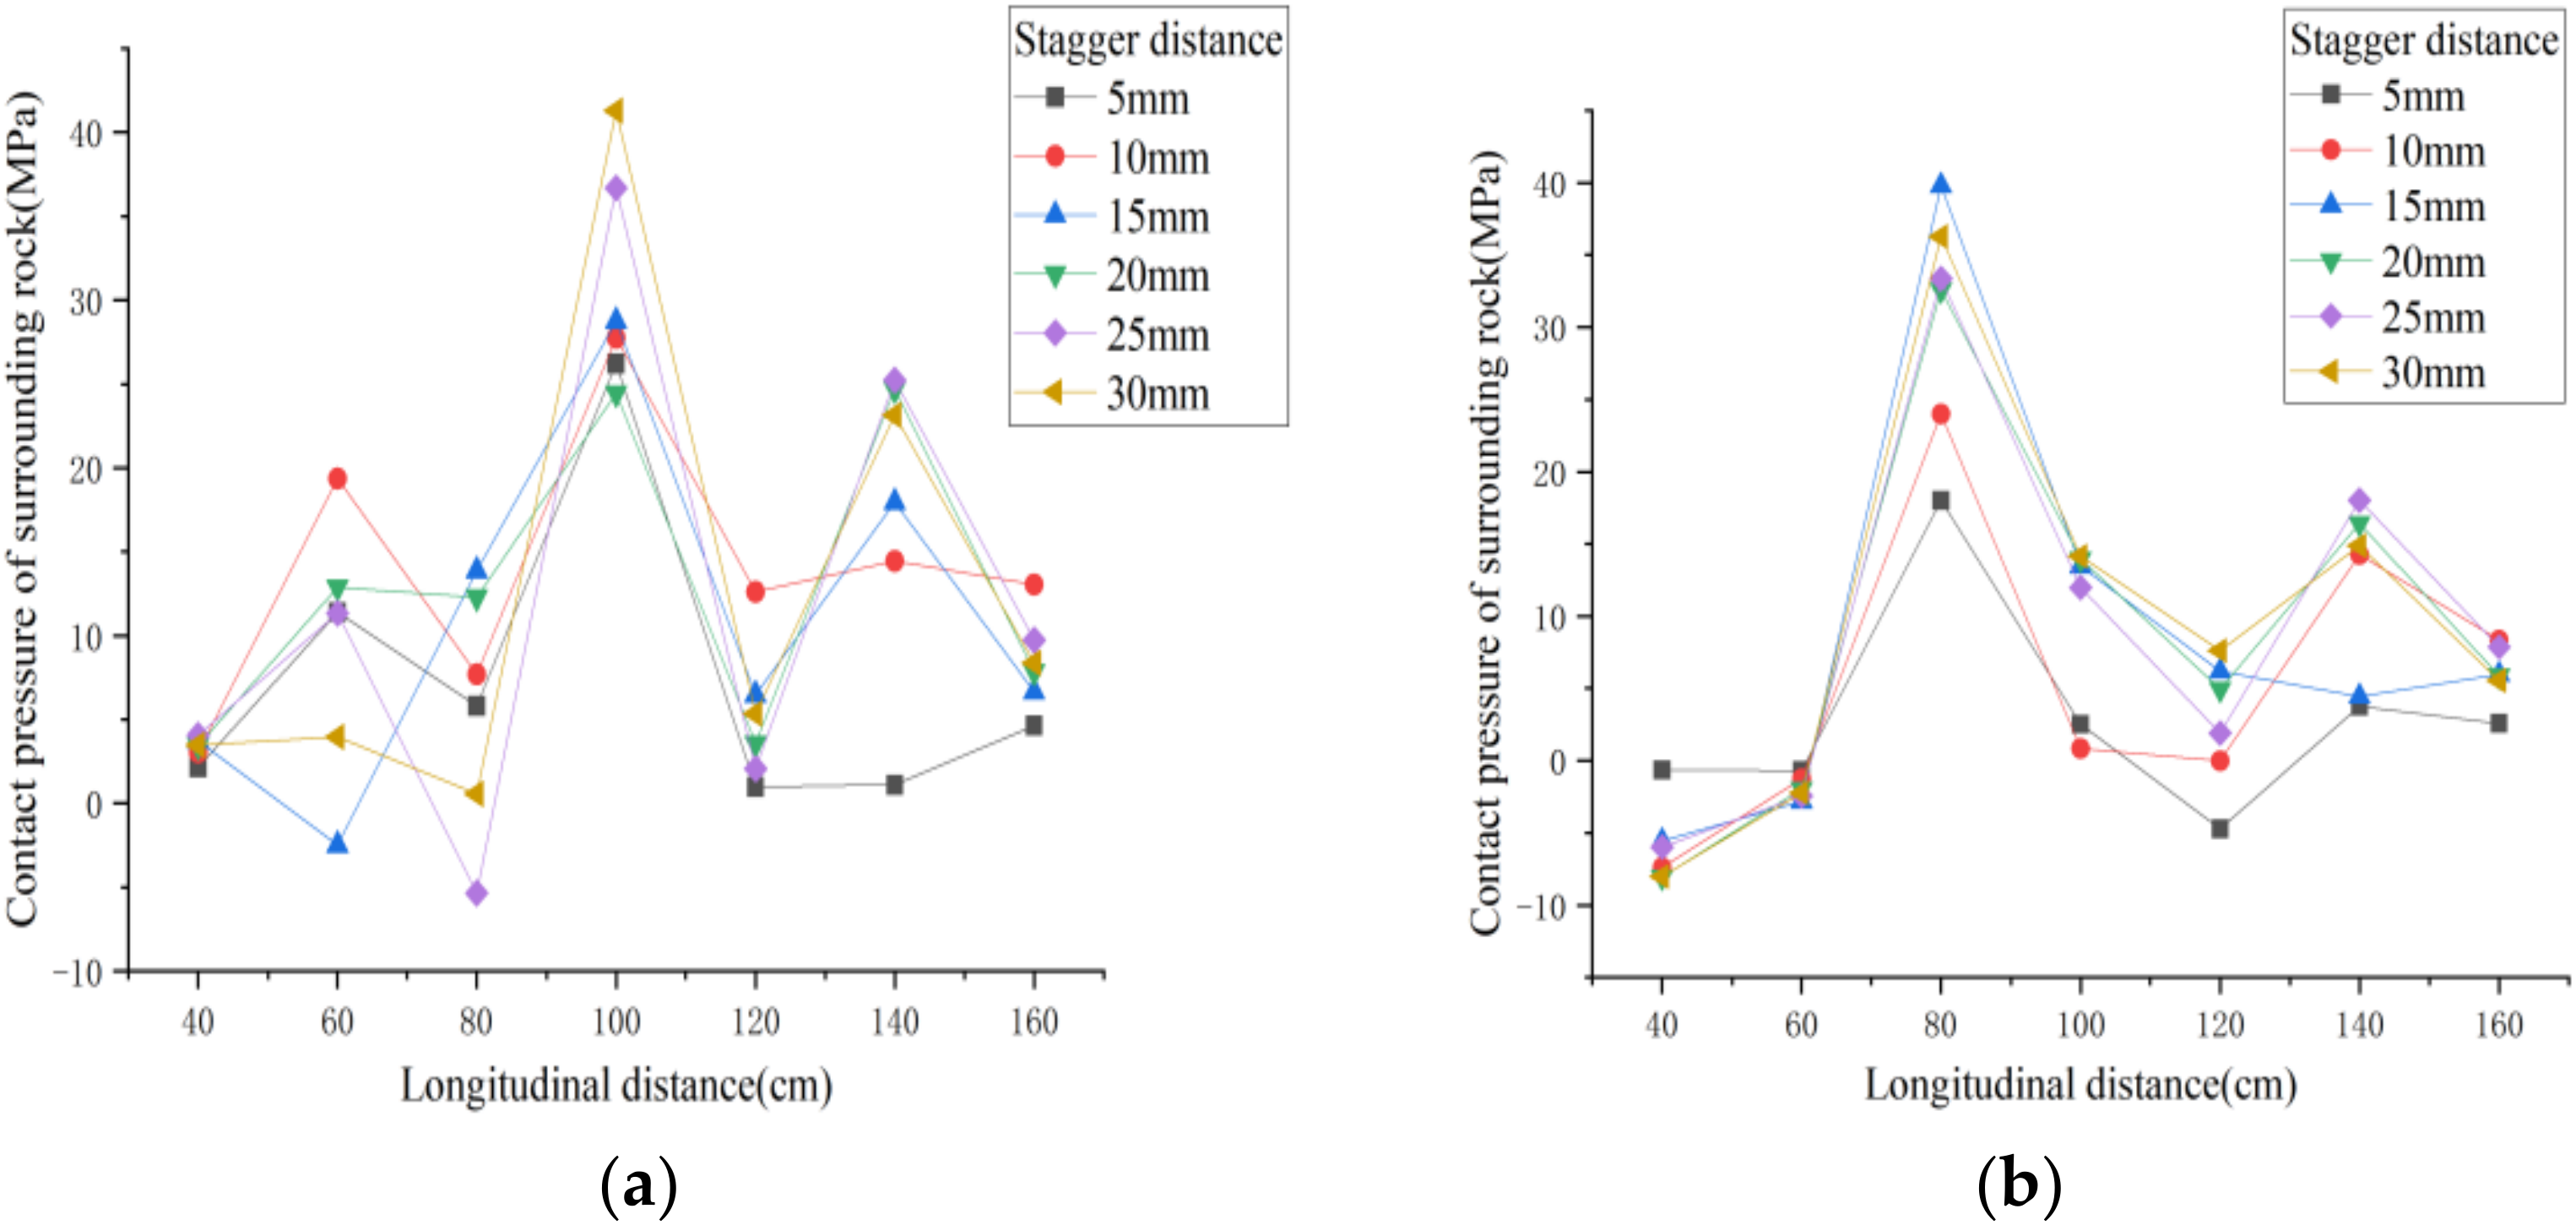
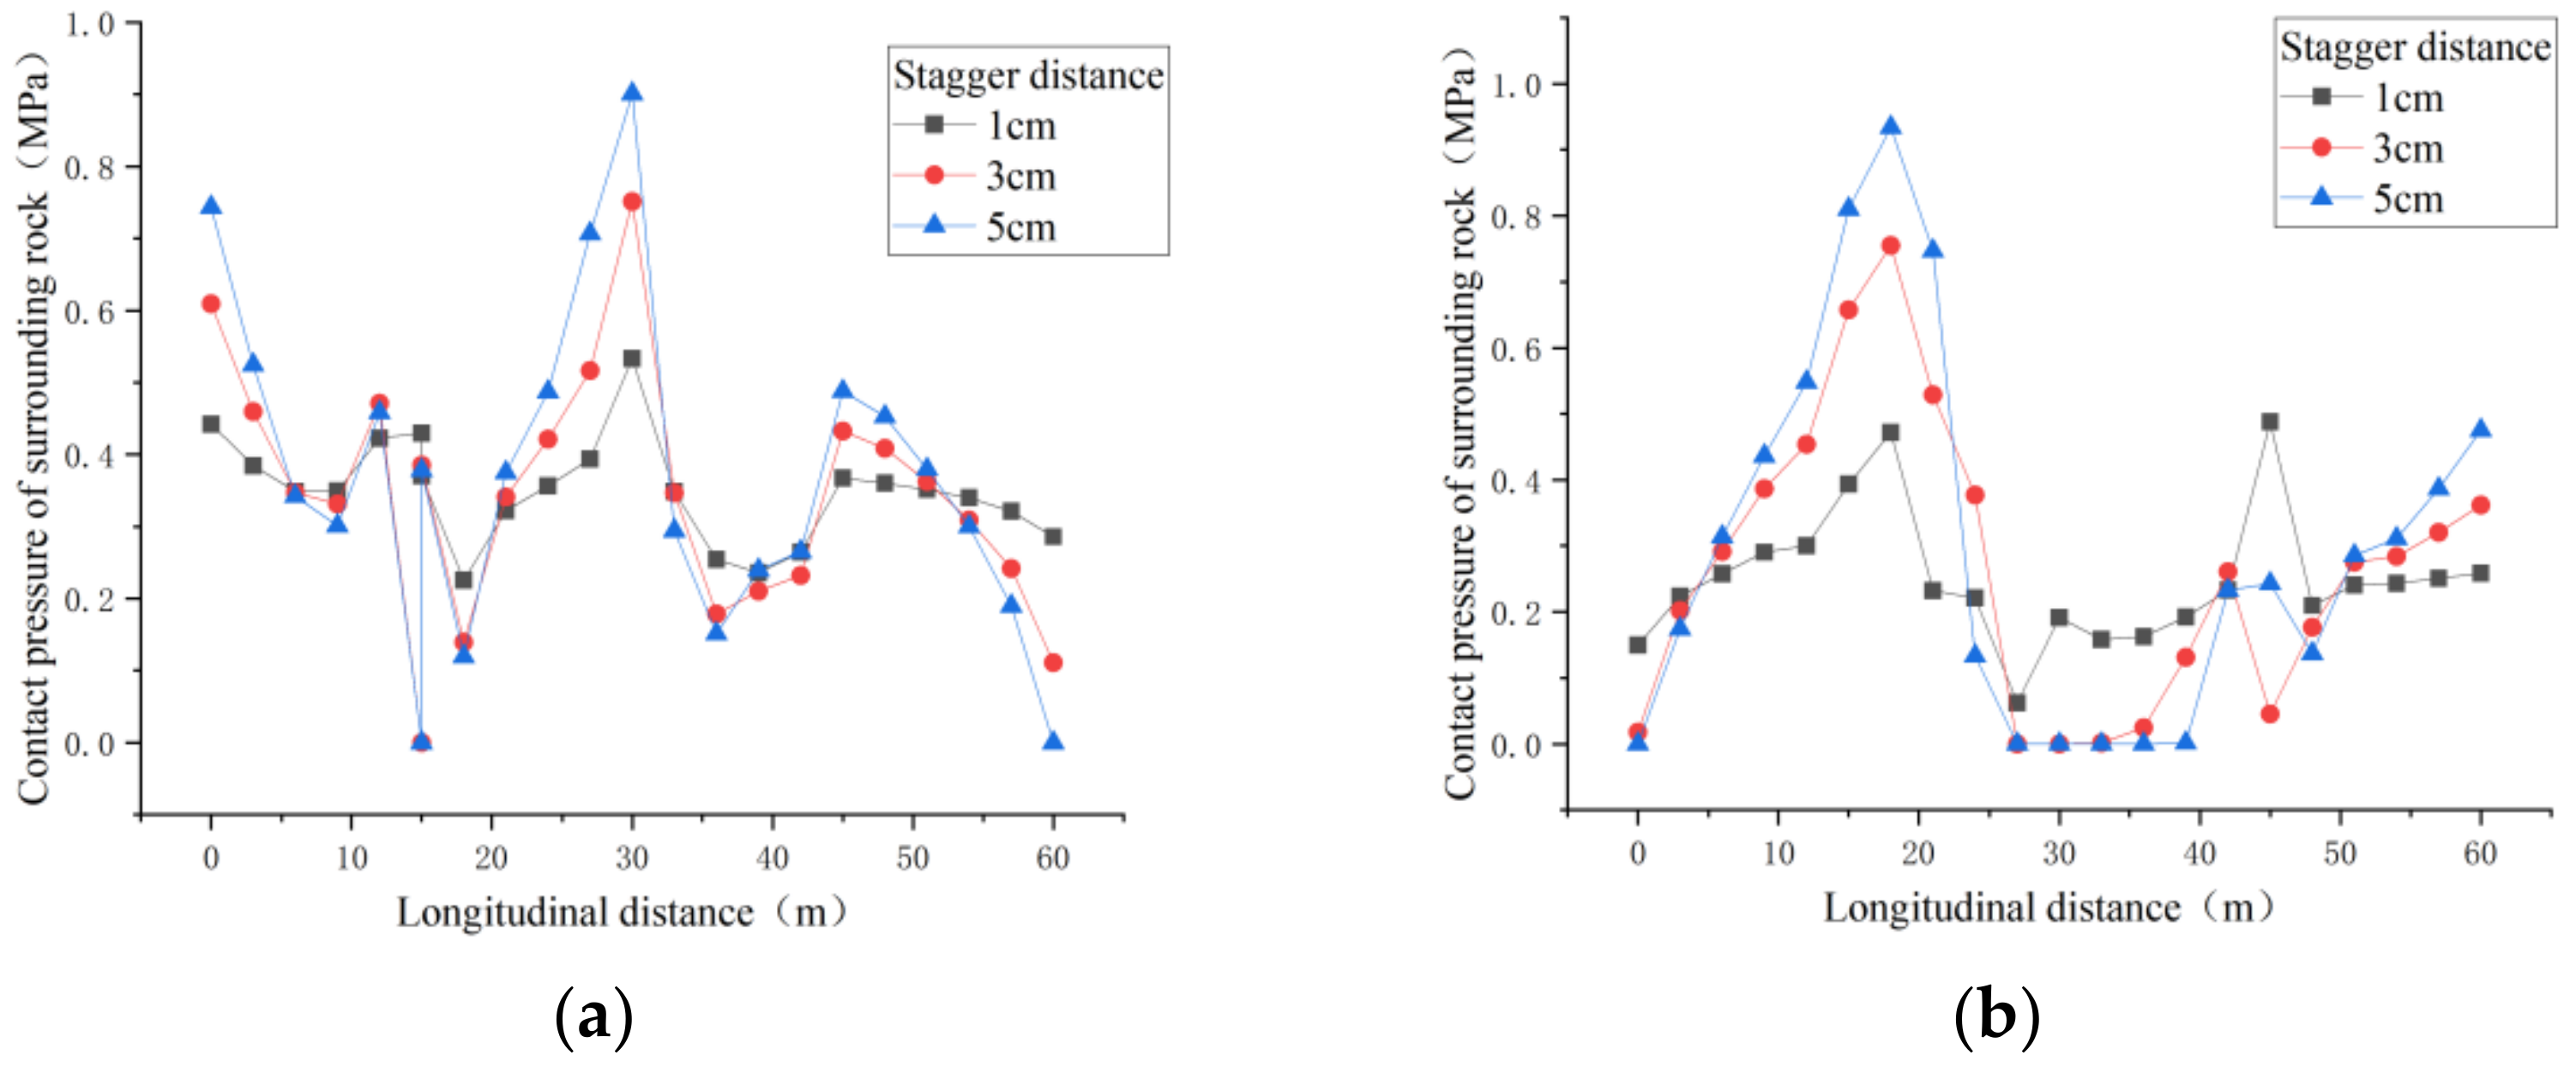
2.5.2. Analysis of Contact Pressure of the Surrounding Rock
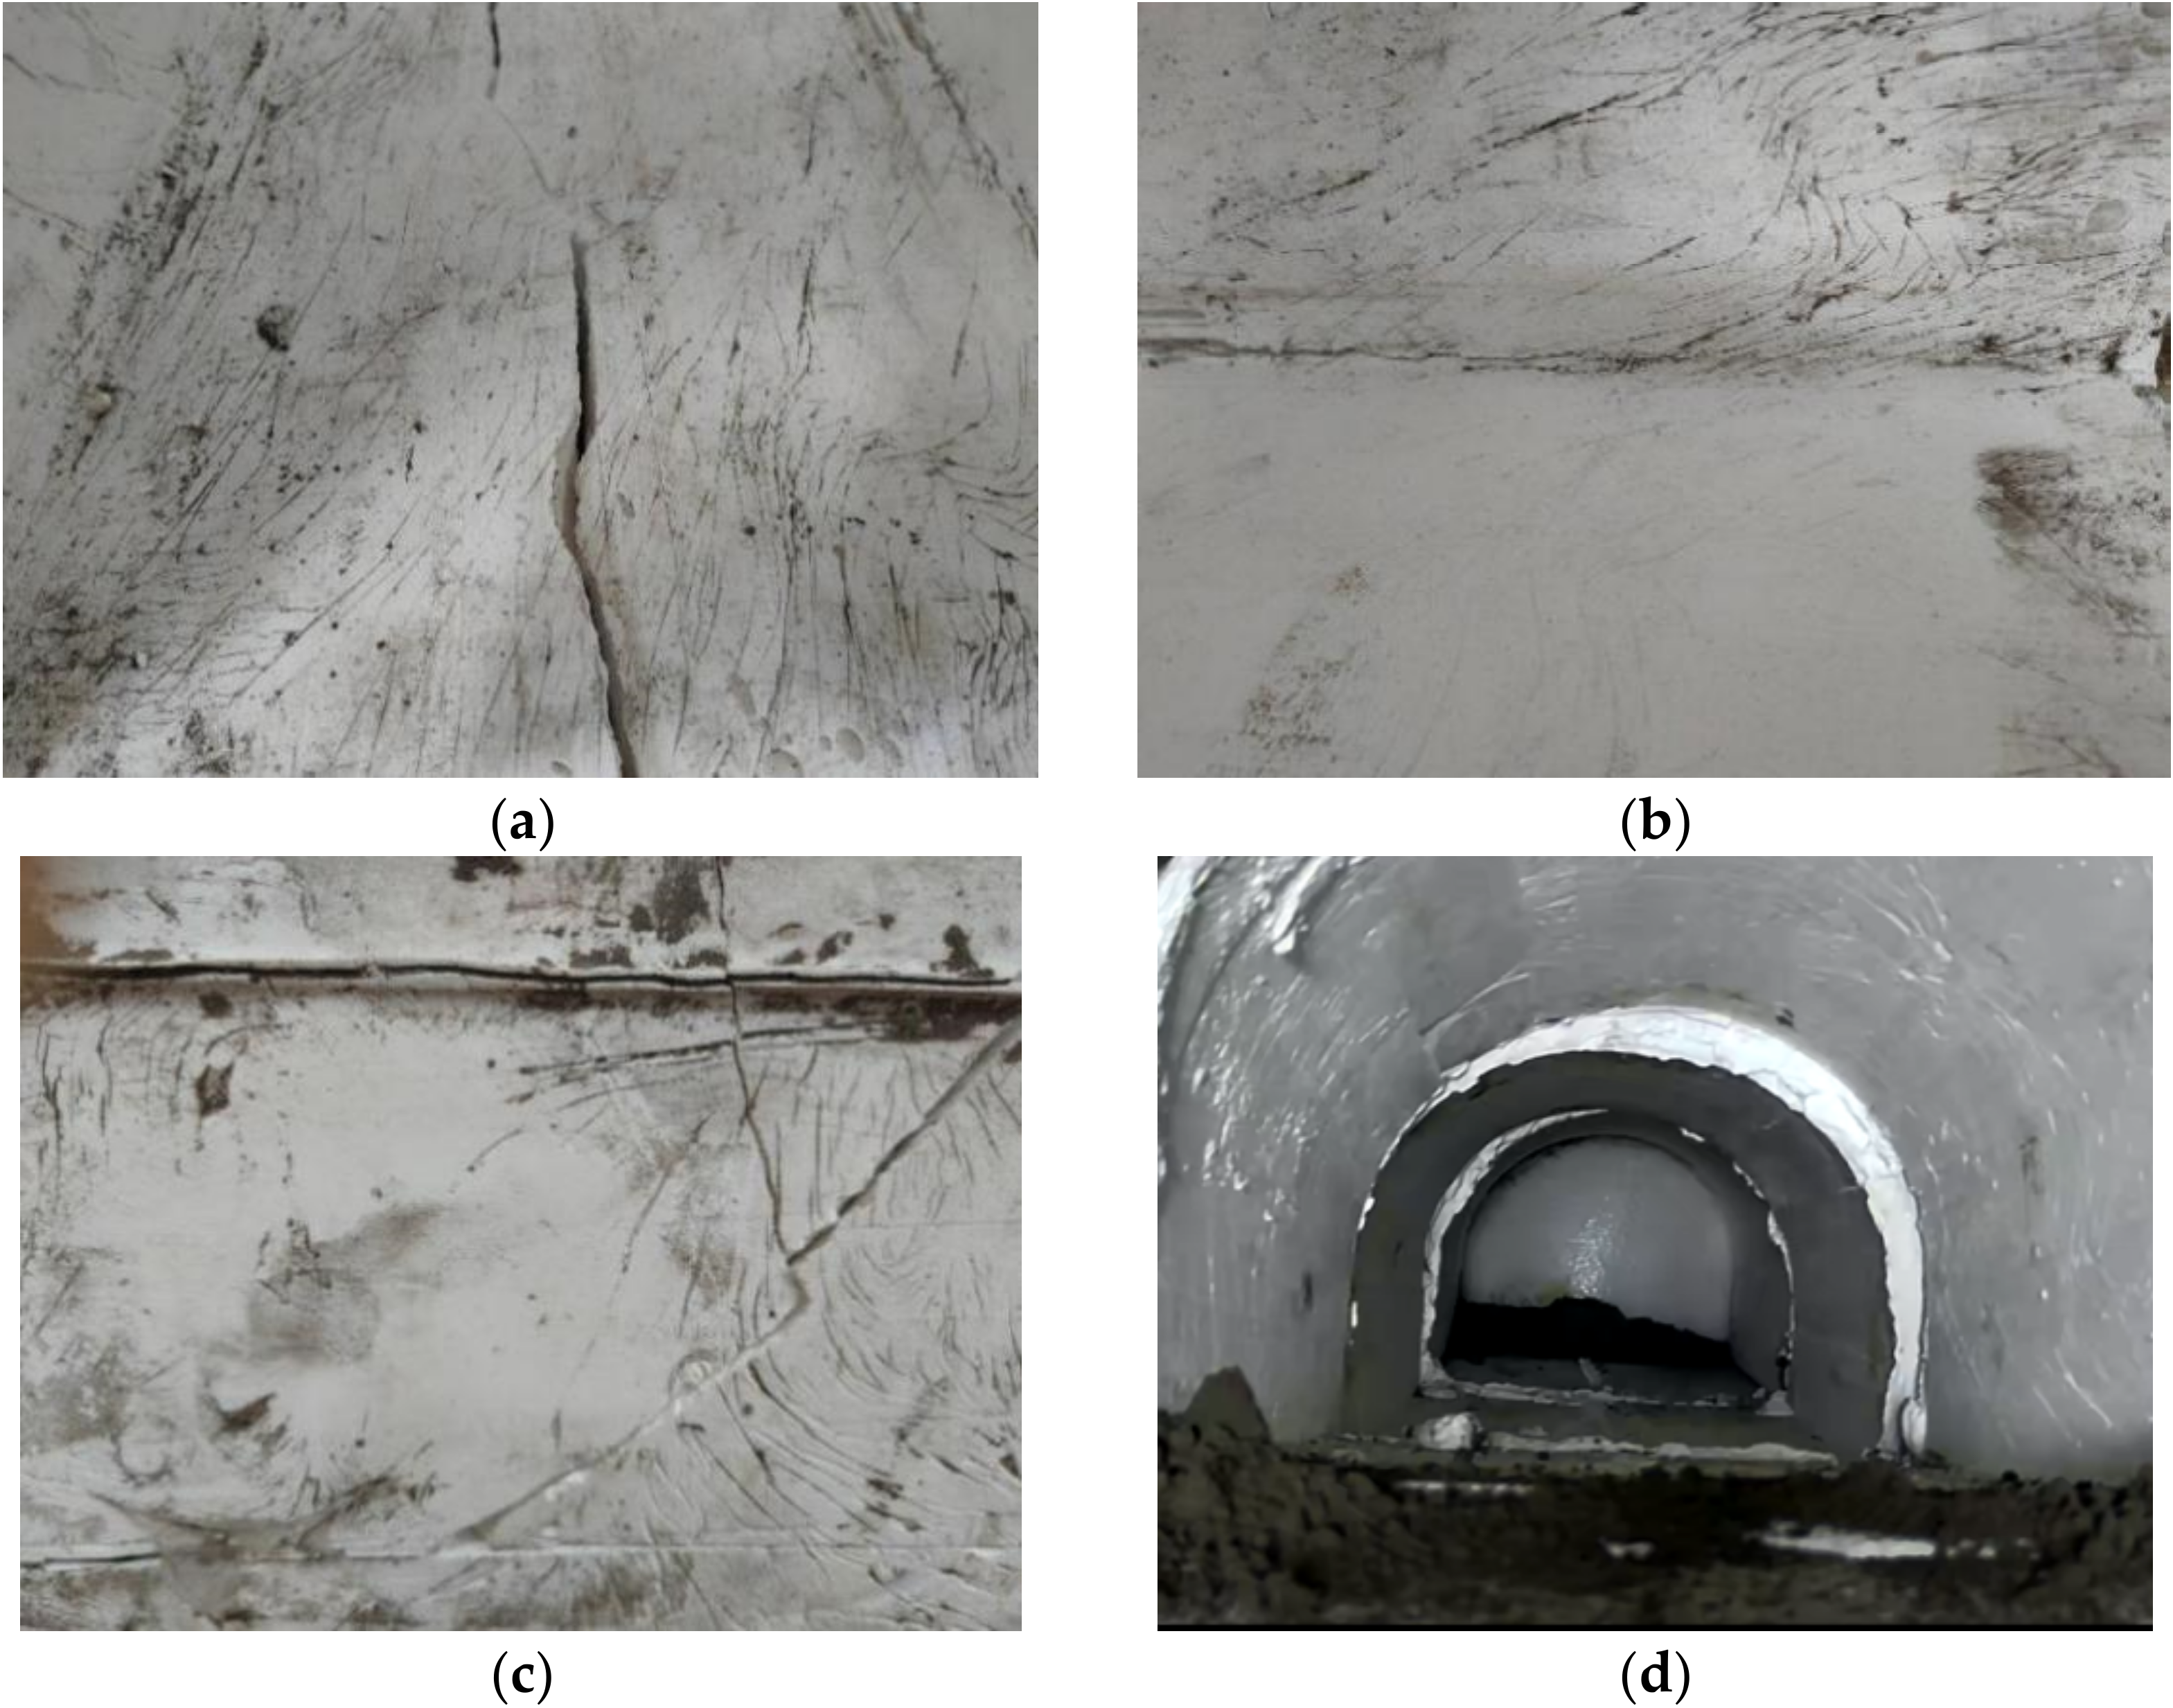
2.5.3. Analysis of Lining Damage and Failure
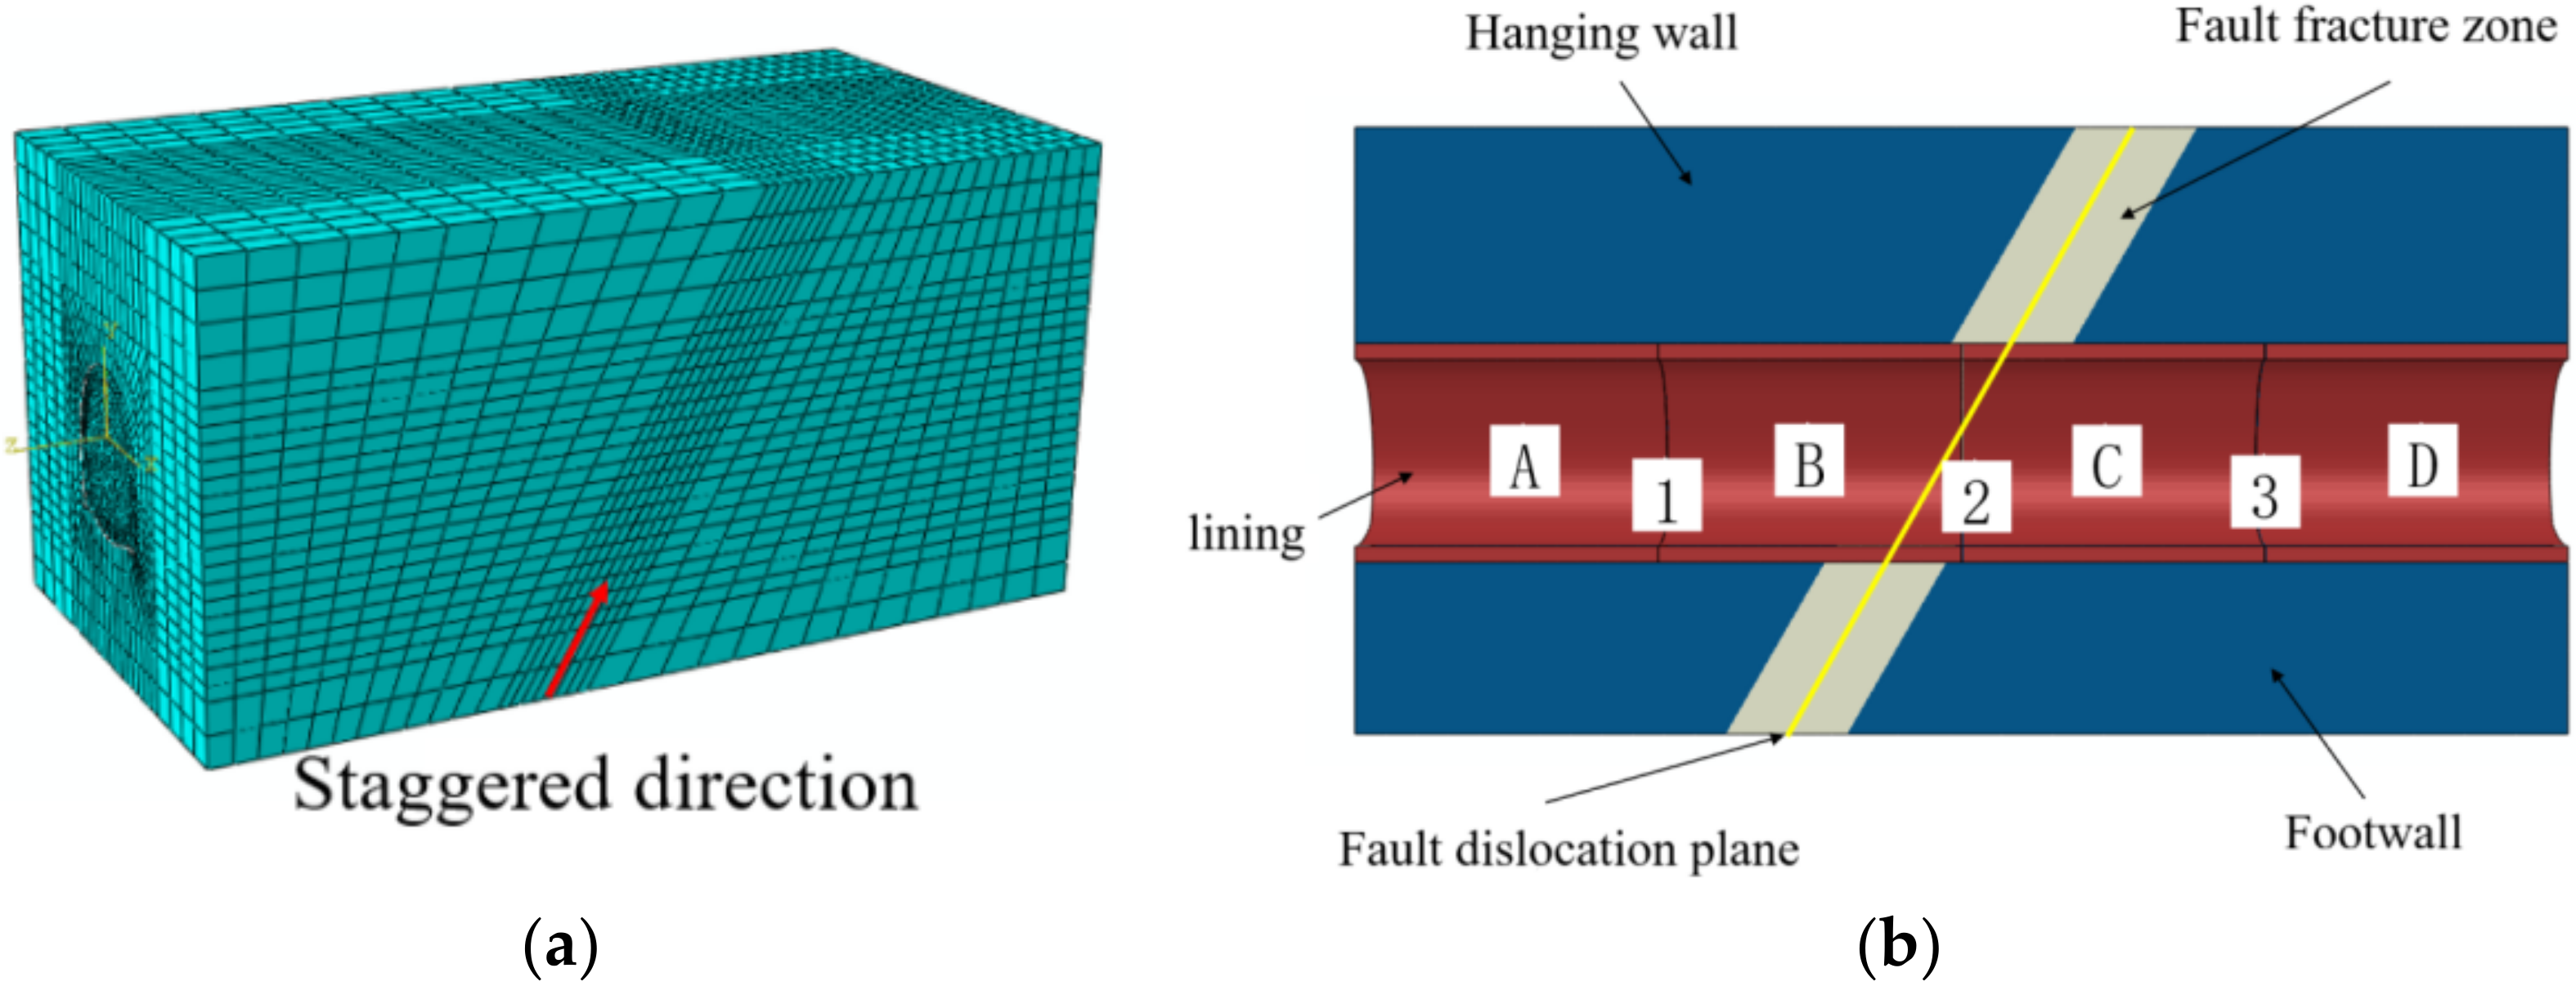
3. Numerical Simulation
- (1)
- We constrained the normal displacement of the side and bottom of the model, the upper surface was a free surface, we killed the tunnel lining structural unit, and we applied gravity load to the surrounding rock structure to balance the in situ stress. Due to the Mohr-Coulomb constitutive model of surrounding rock and the existence of a fault fracture zone, the geostatic automatic geostress balance analysis in ABAQUS did not easily converge, so the OBD method was introduced here to realize geostress balance.
- (2)
- The function of the life and death unit was to realize tunnel excavation and support, and the disturbance of tunnel excavation to the surrounding rock was not considered; that is, the construction length, excavation method, and support installation sequence were ignored, simplifying the process to one-step excavation and support.
- (3)
- The pseudo static method was used to realize the fault dislocation; that is, to keep the footwall fixed, and apply the displacement along the fault dip direction to the hanging wall. The dislocation was controlled by the vertical displacement, so the dislocation refers to the vertical dislocation.
4. Comparison of Results
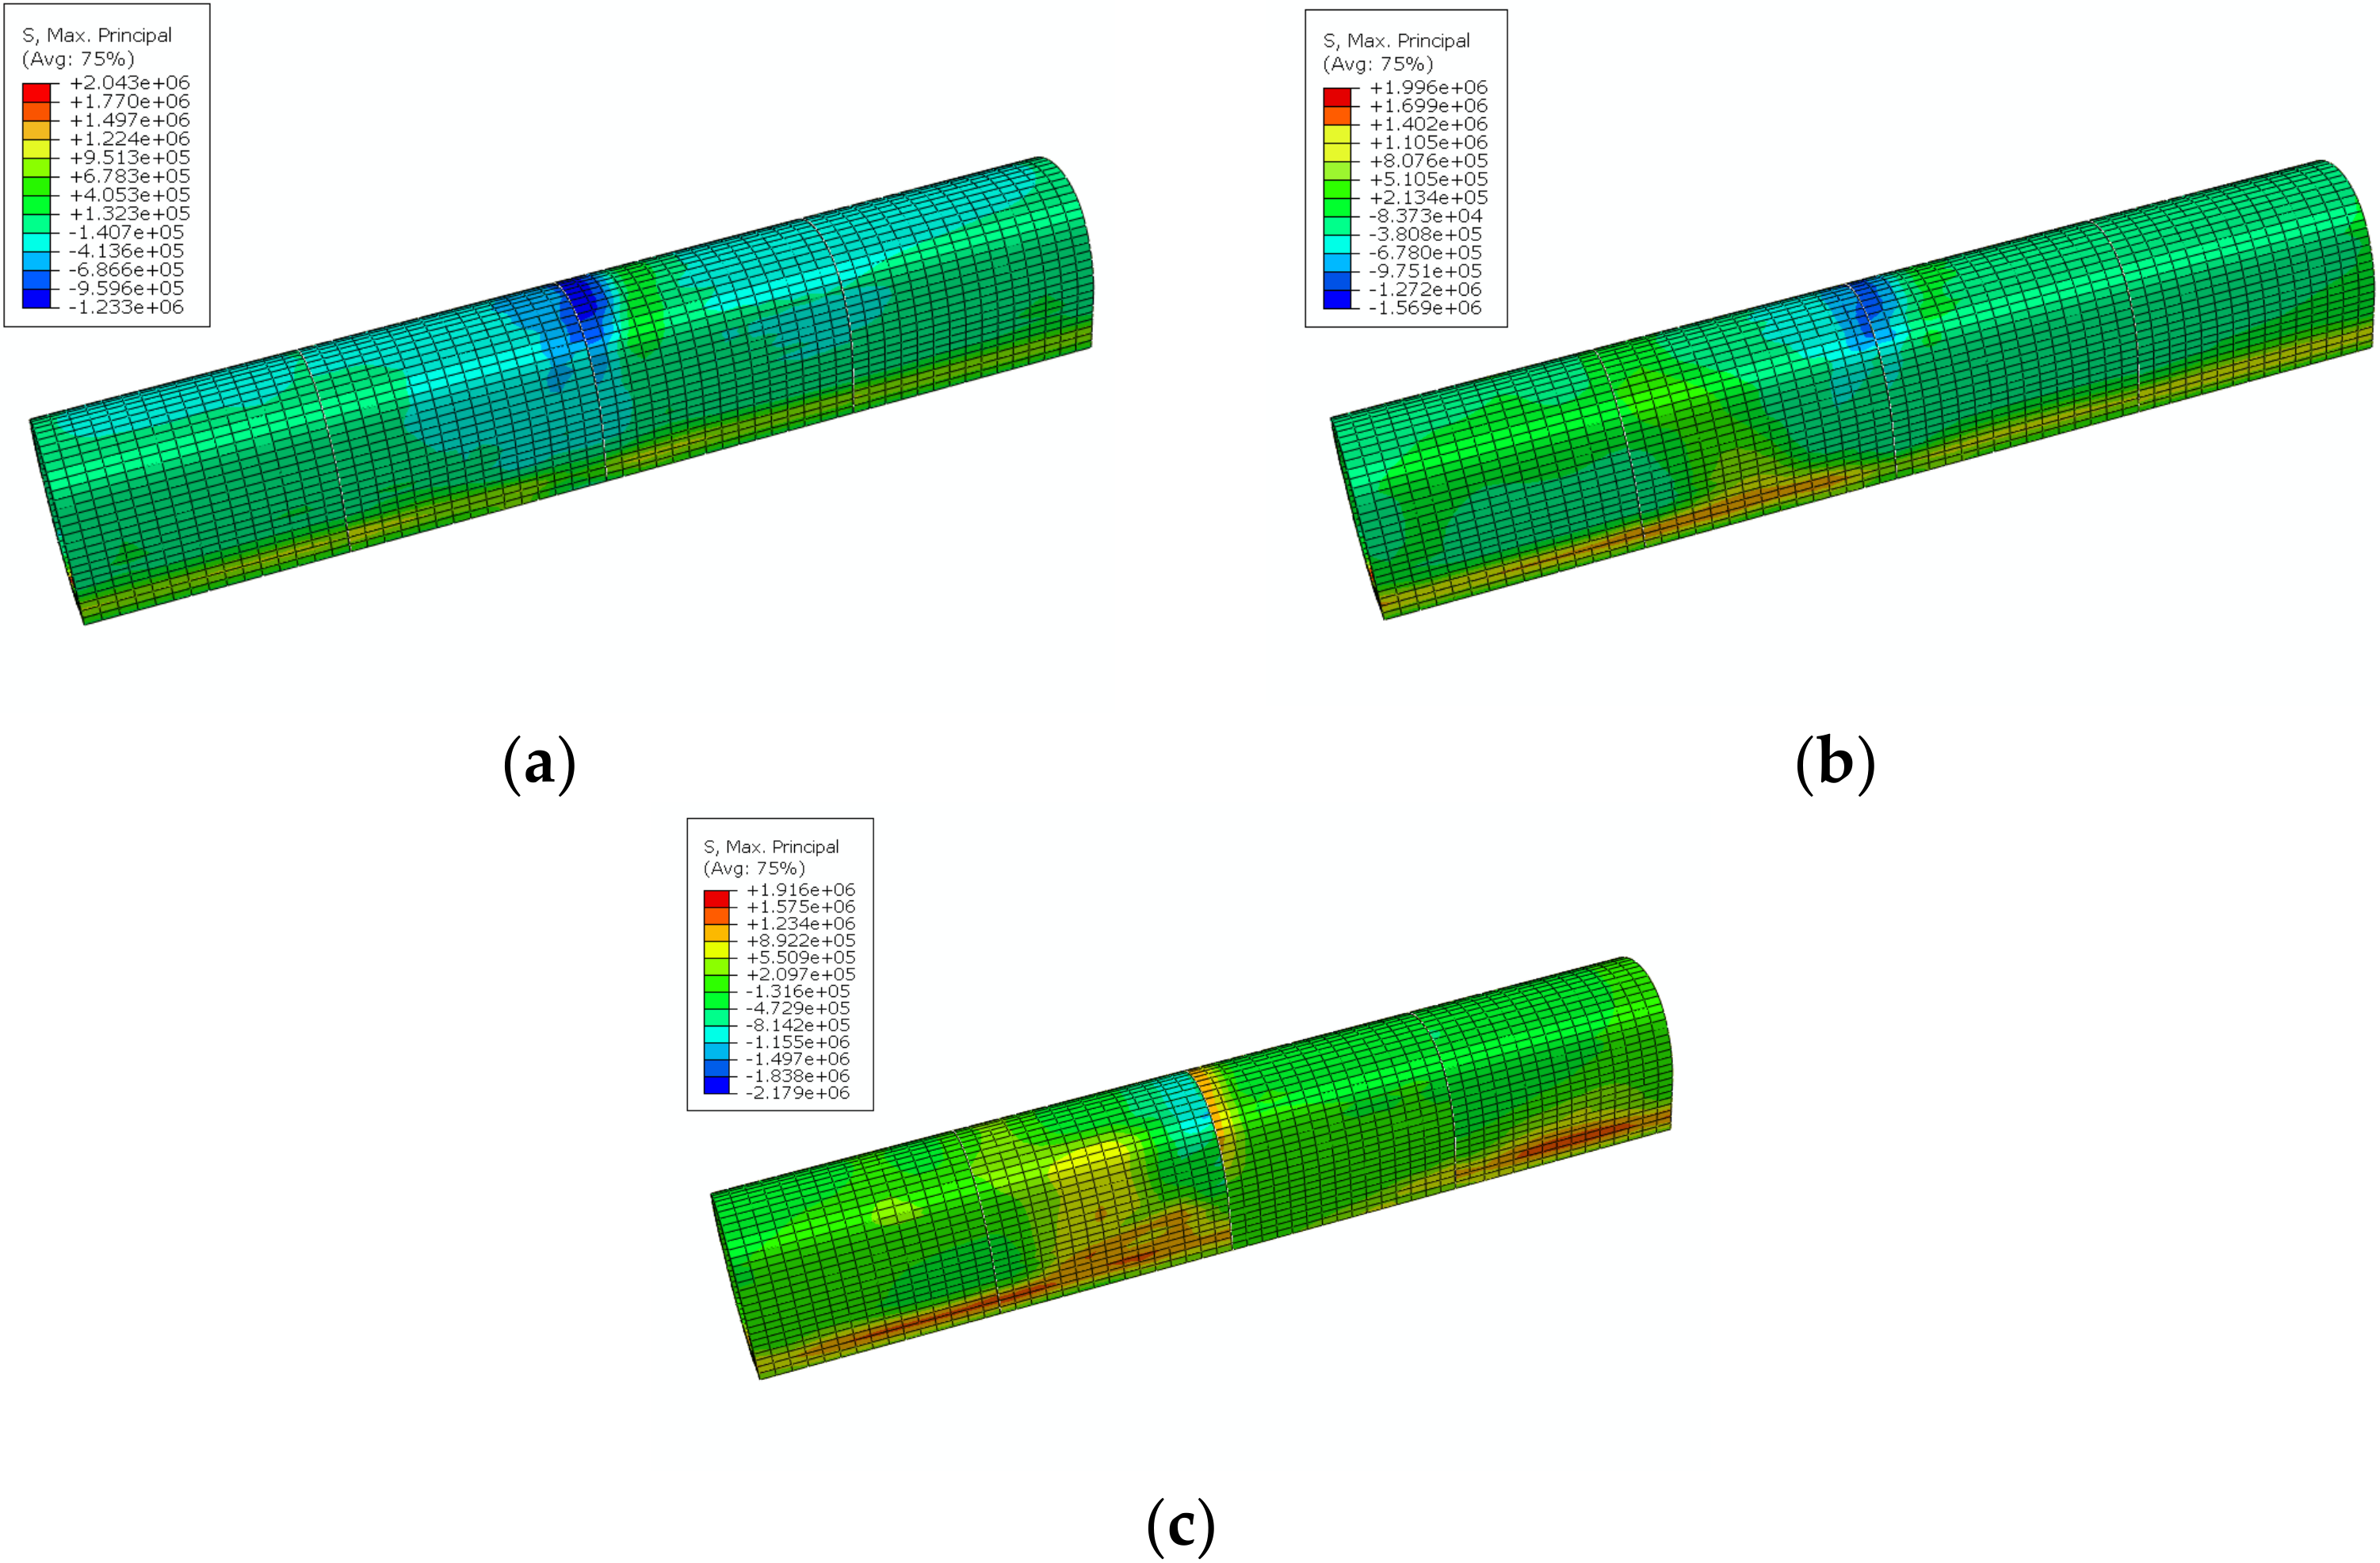
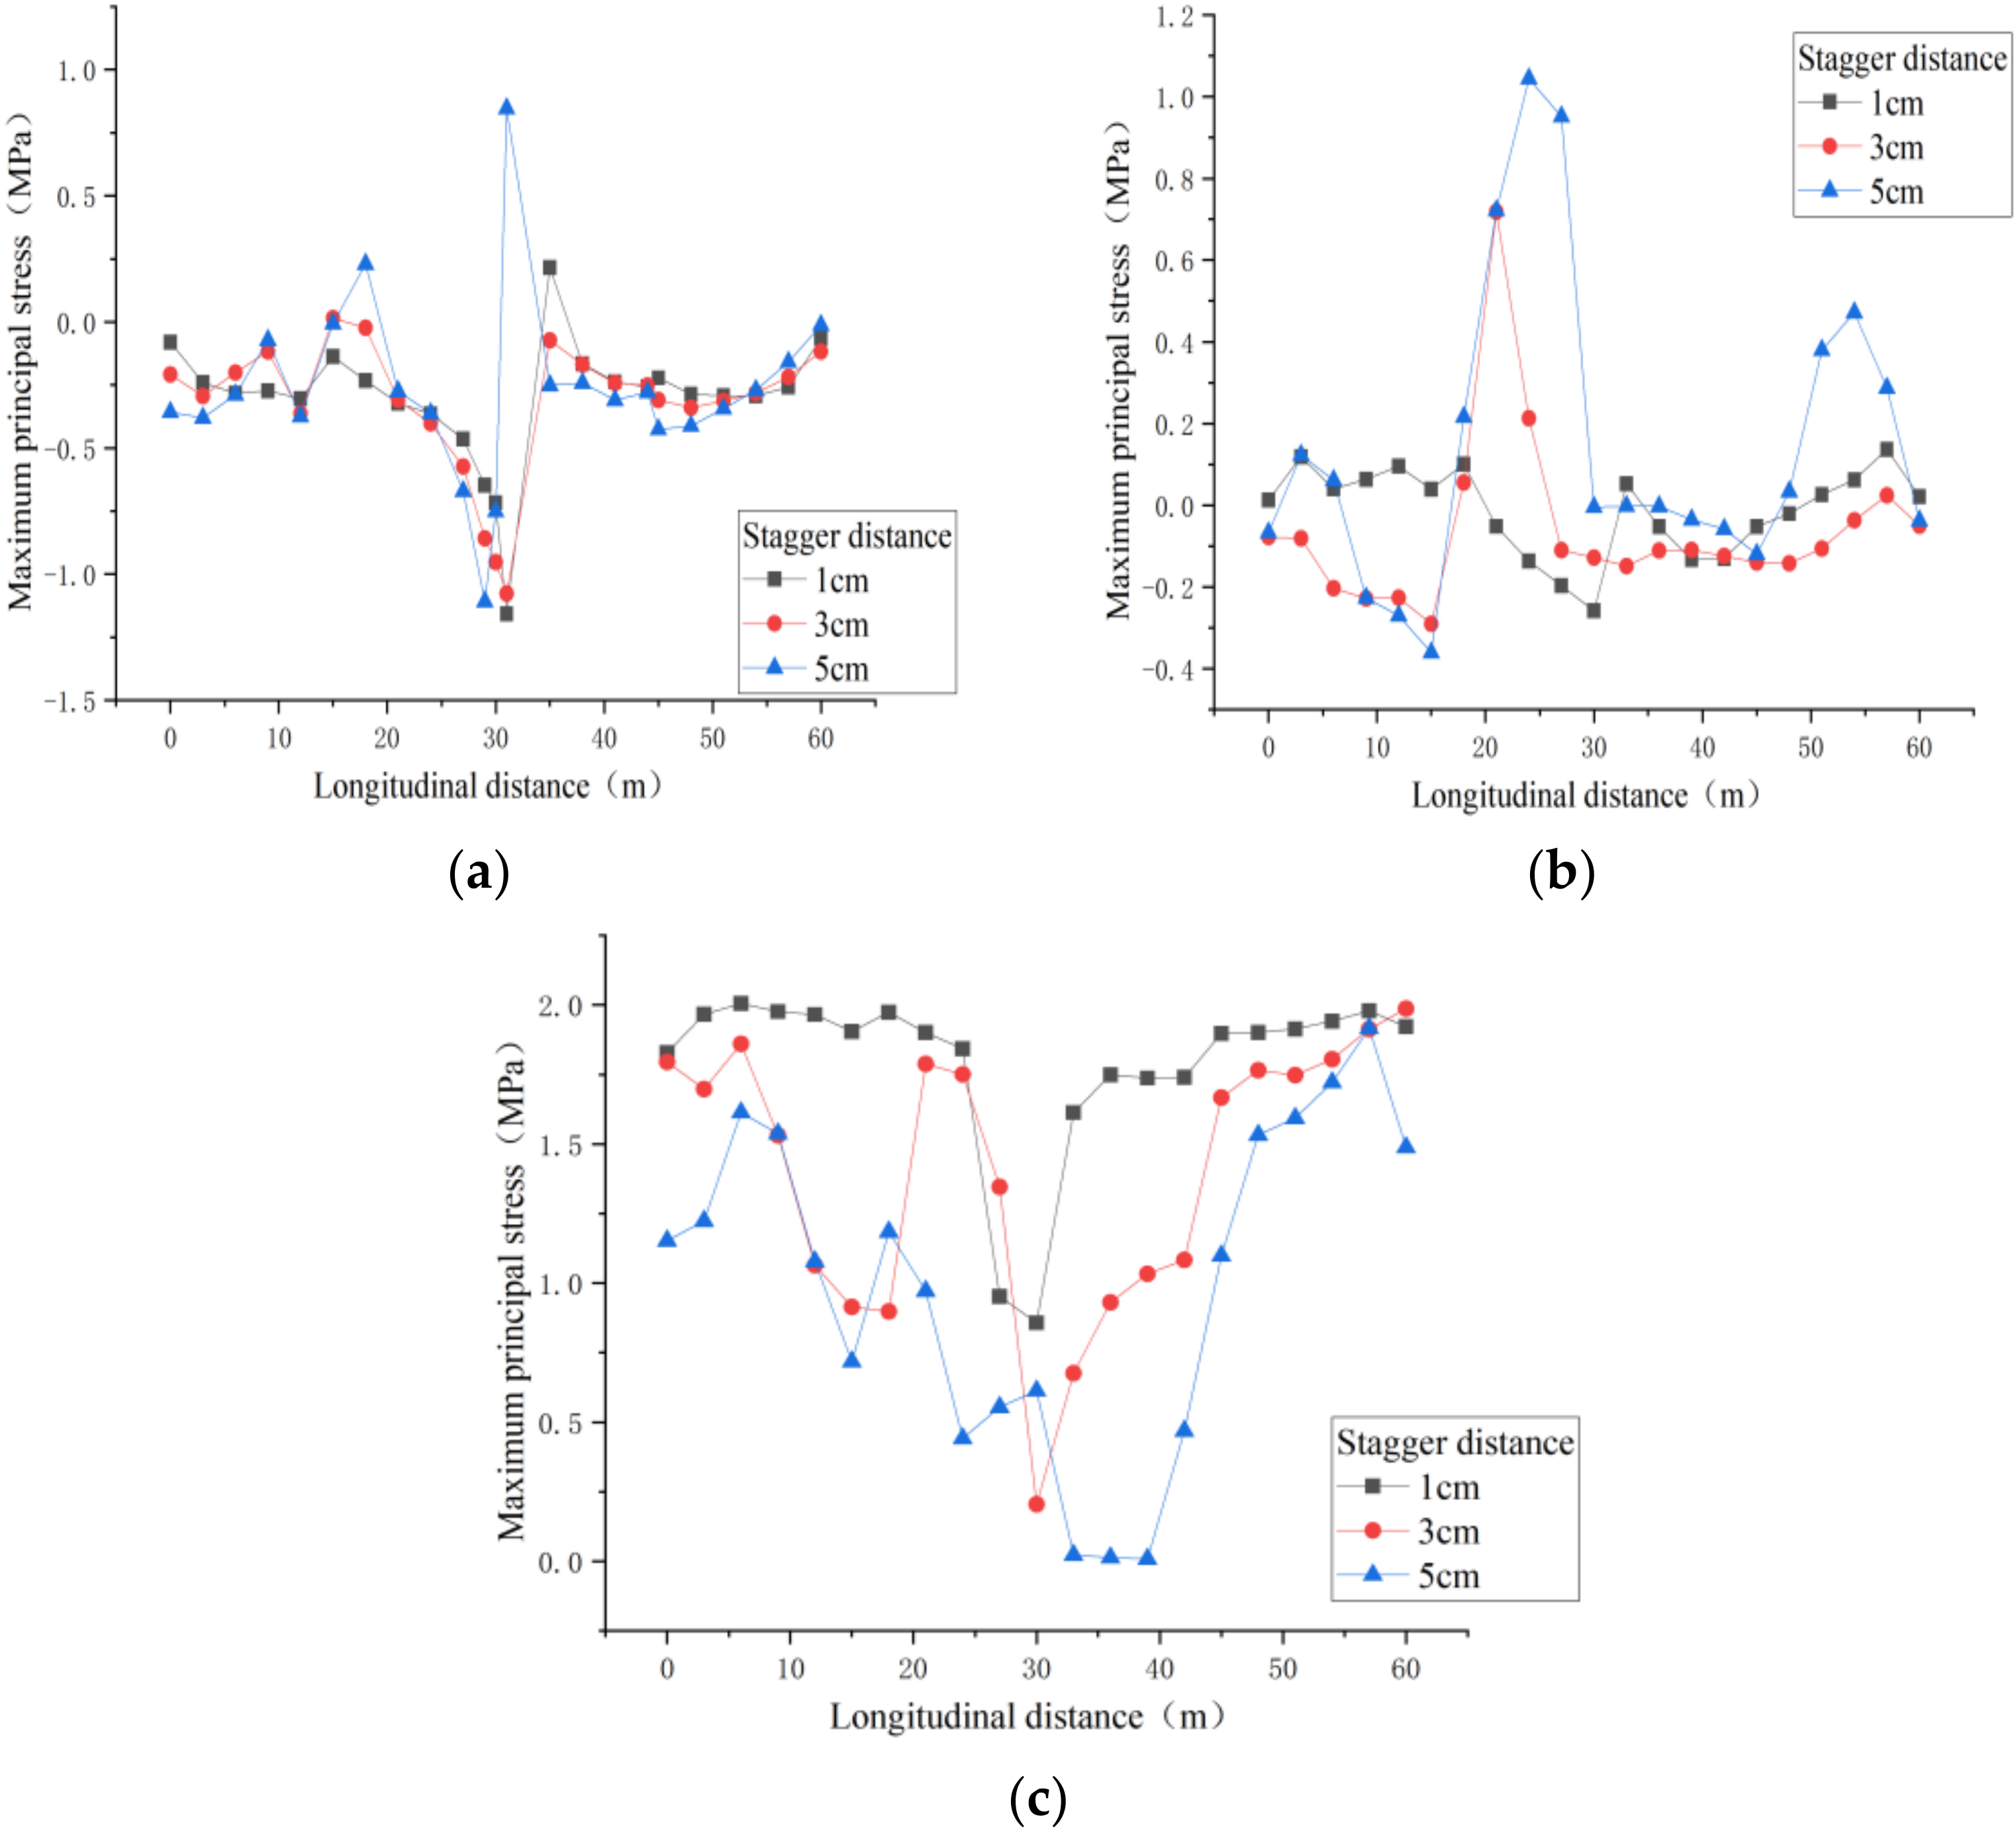
4.1. Maximum Principal Stress Analysis
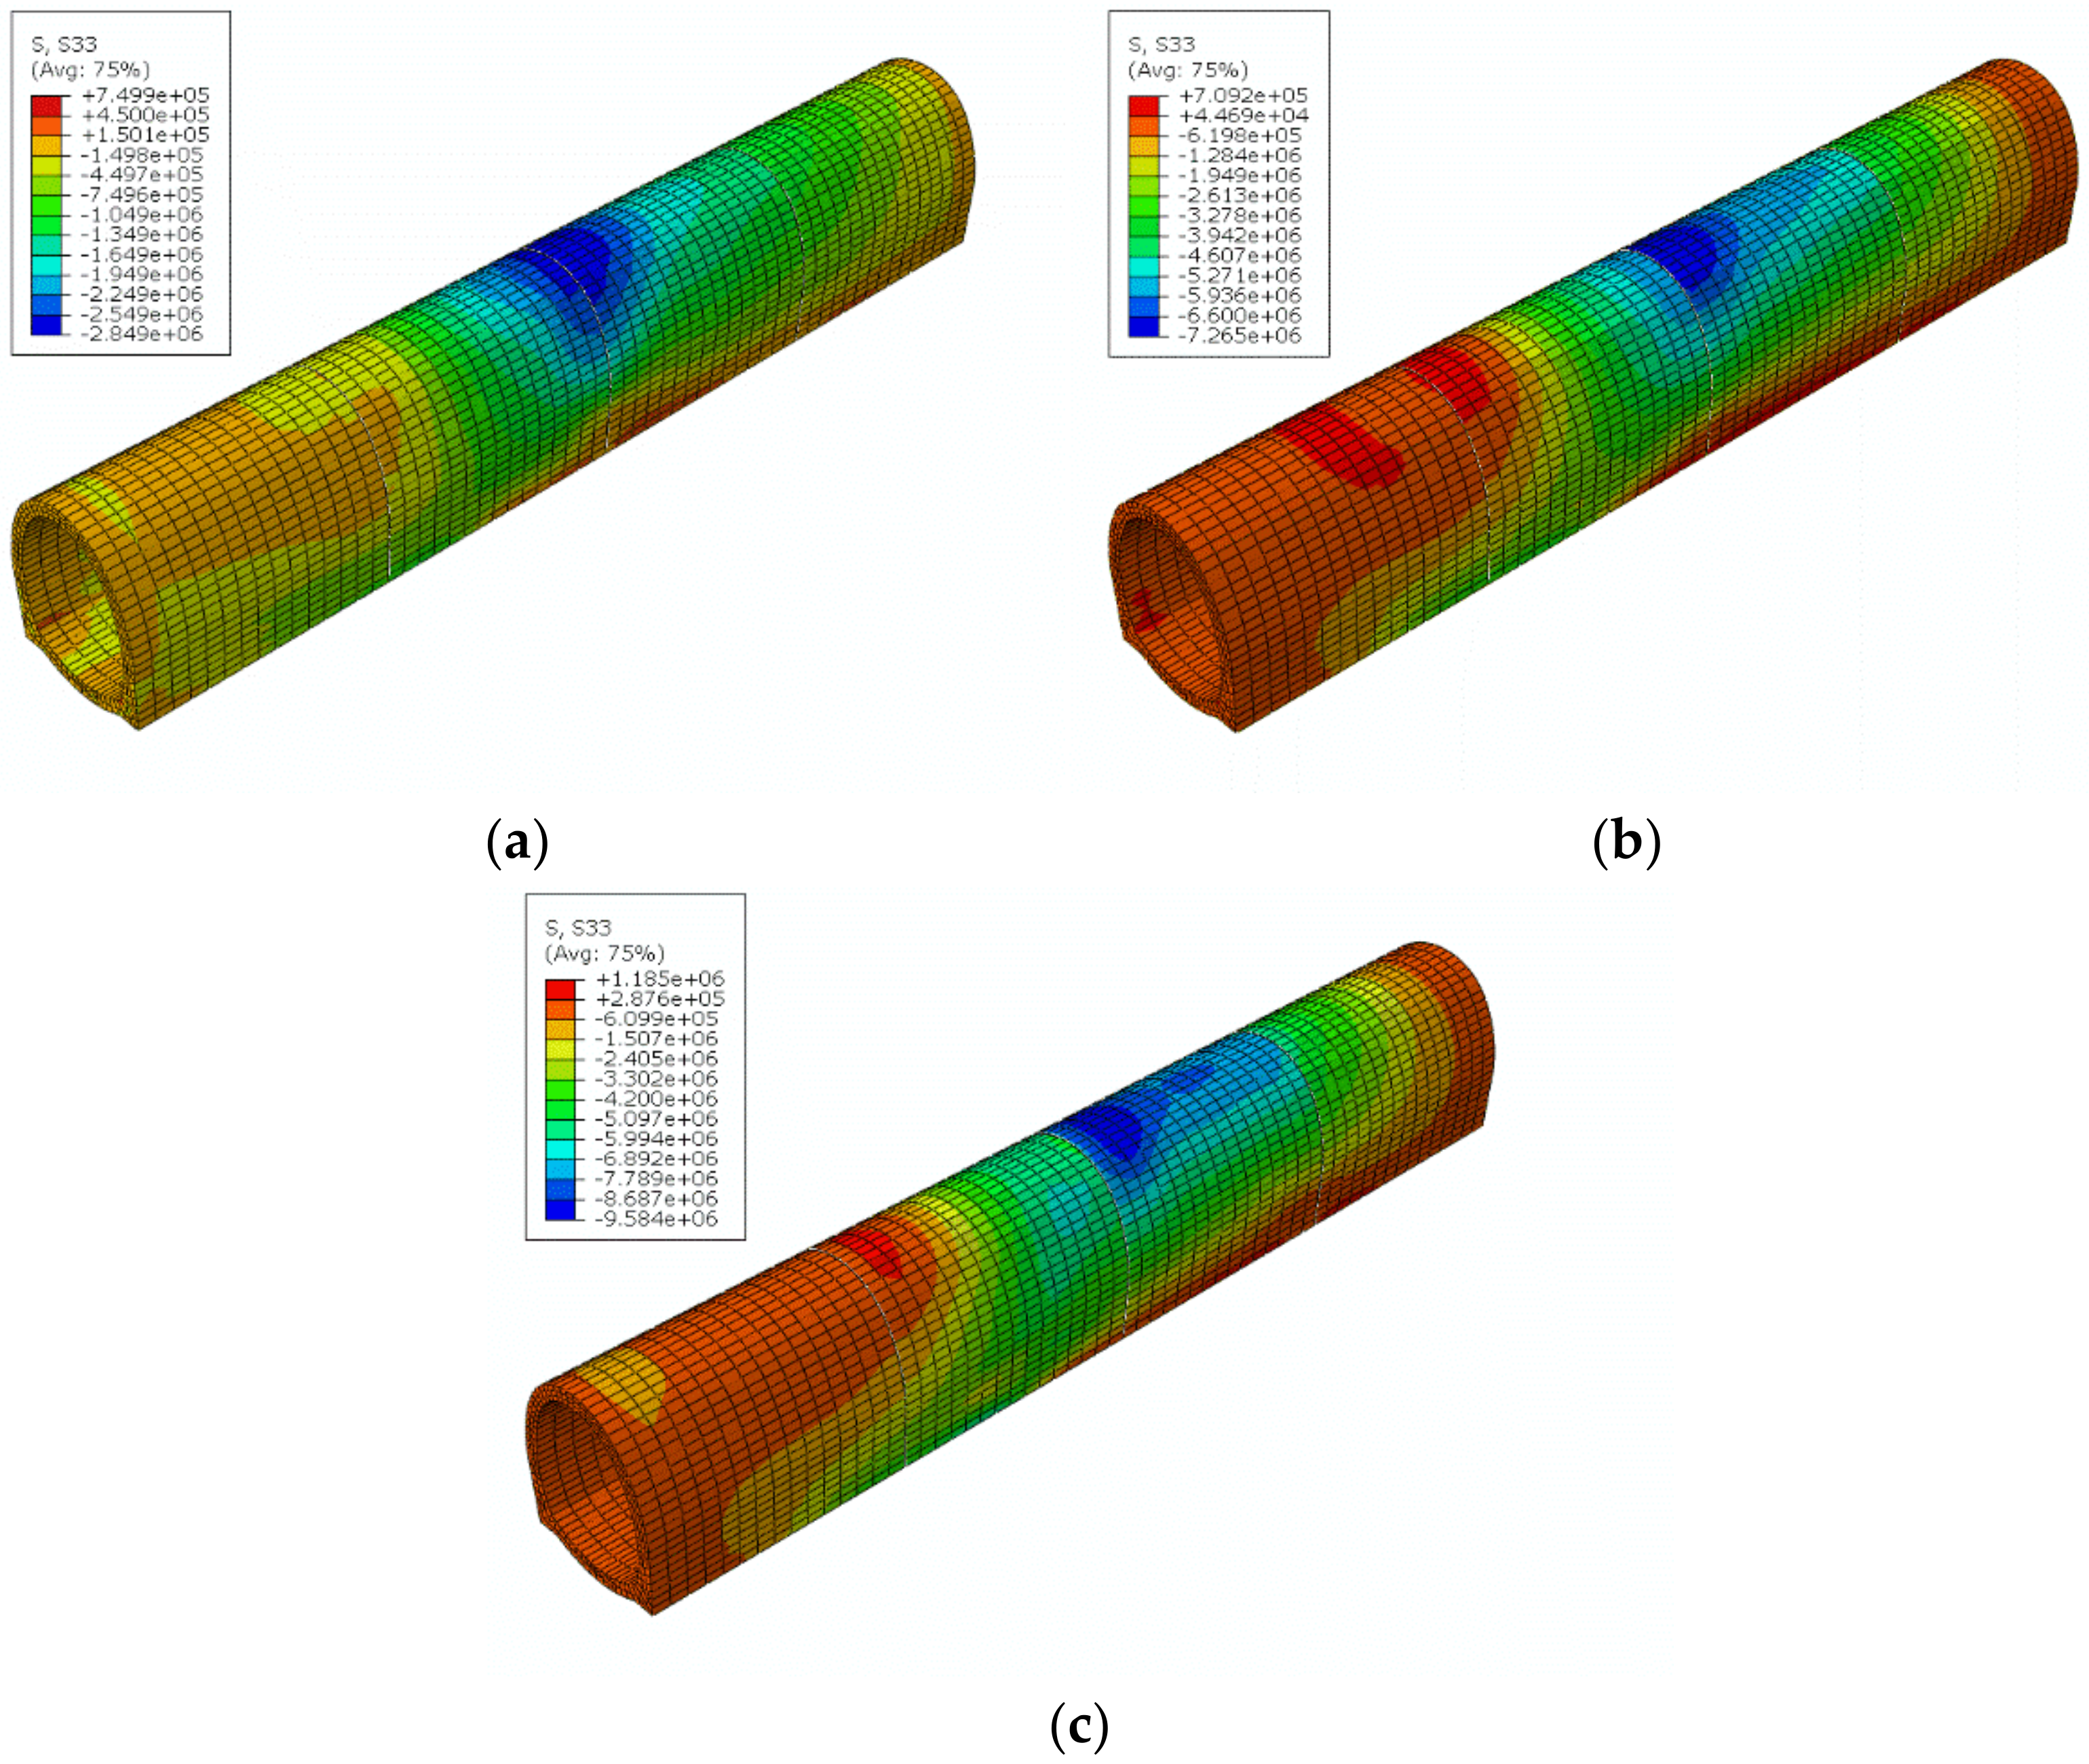
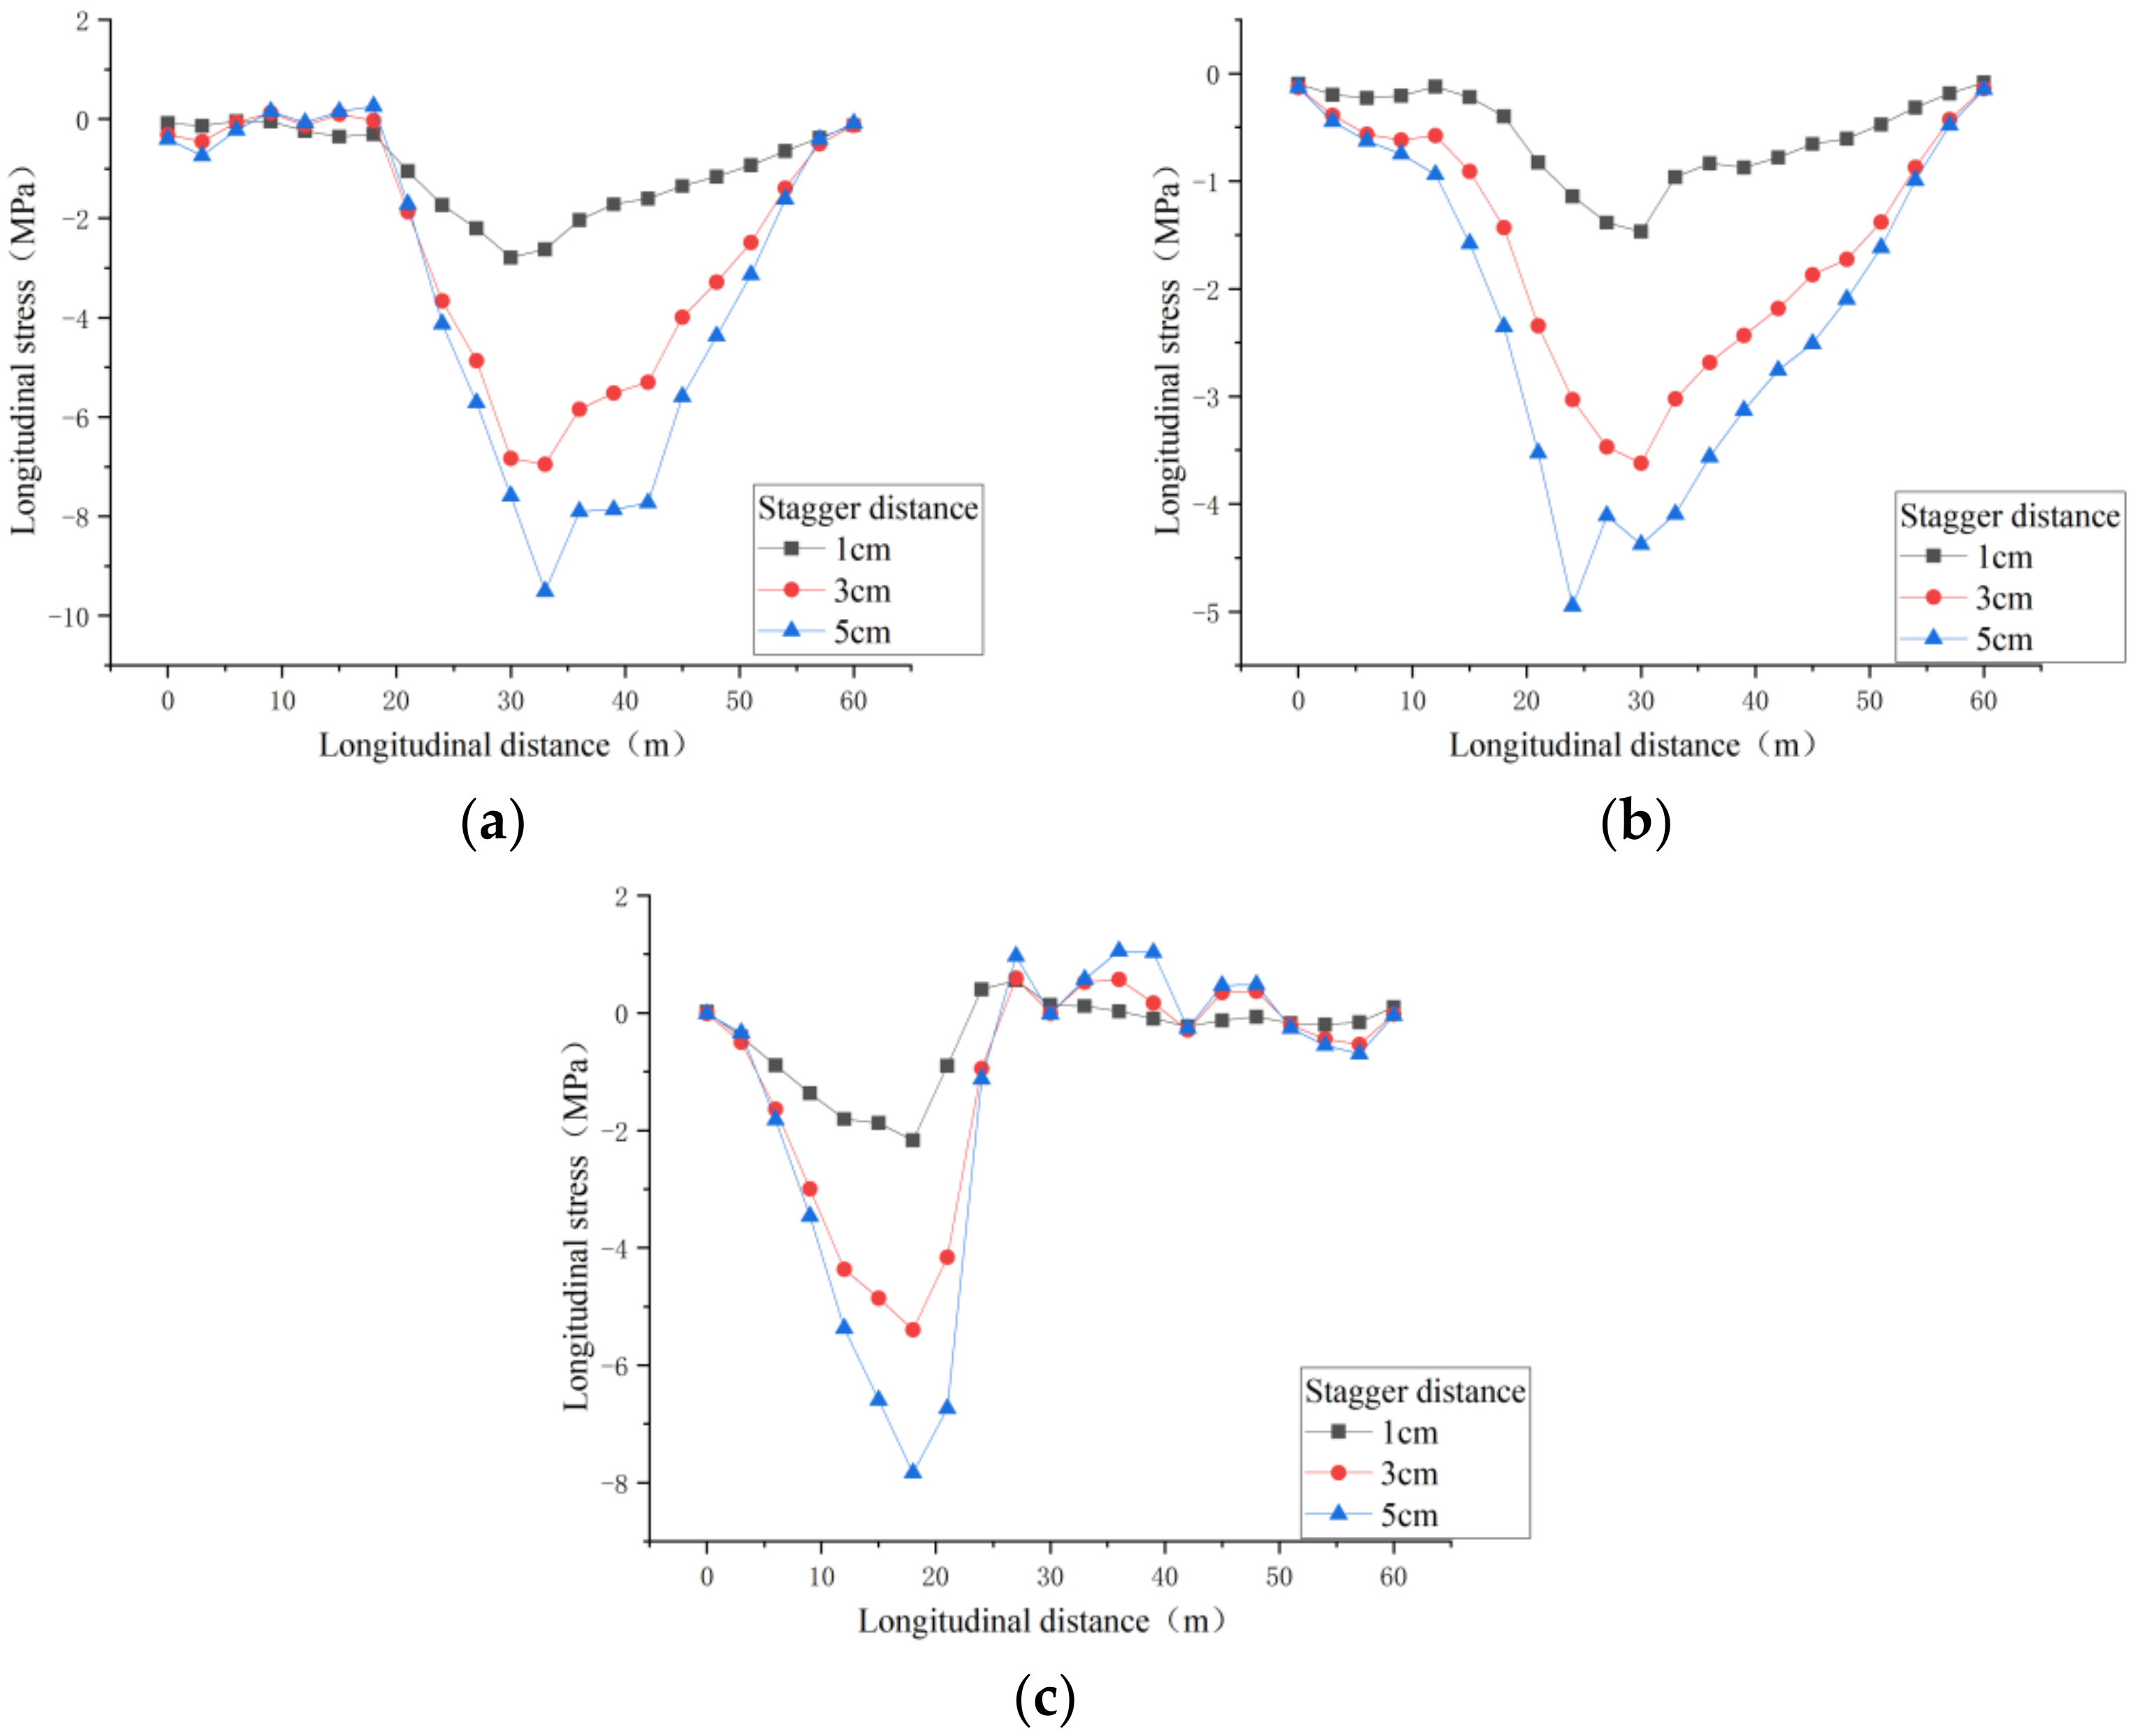
4.2. Longitudinal Stress Analysis
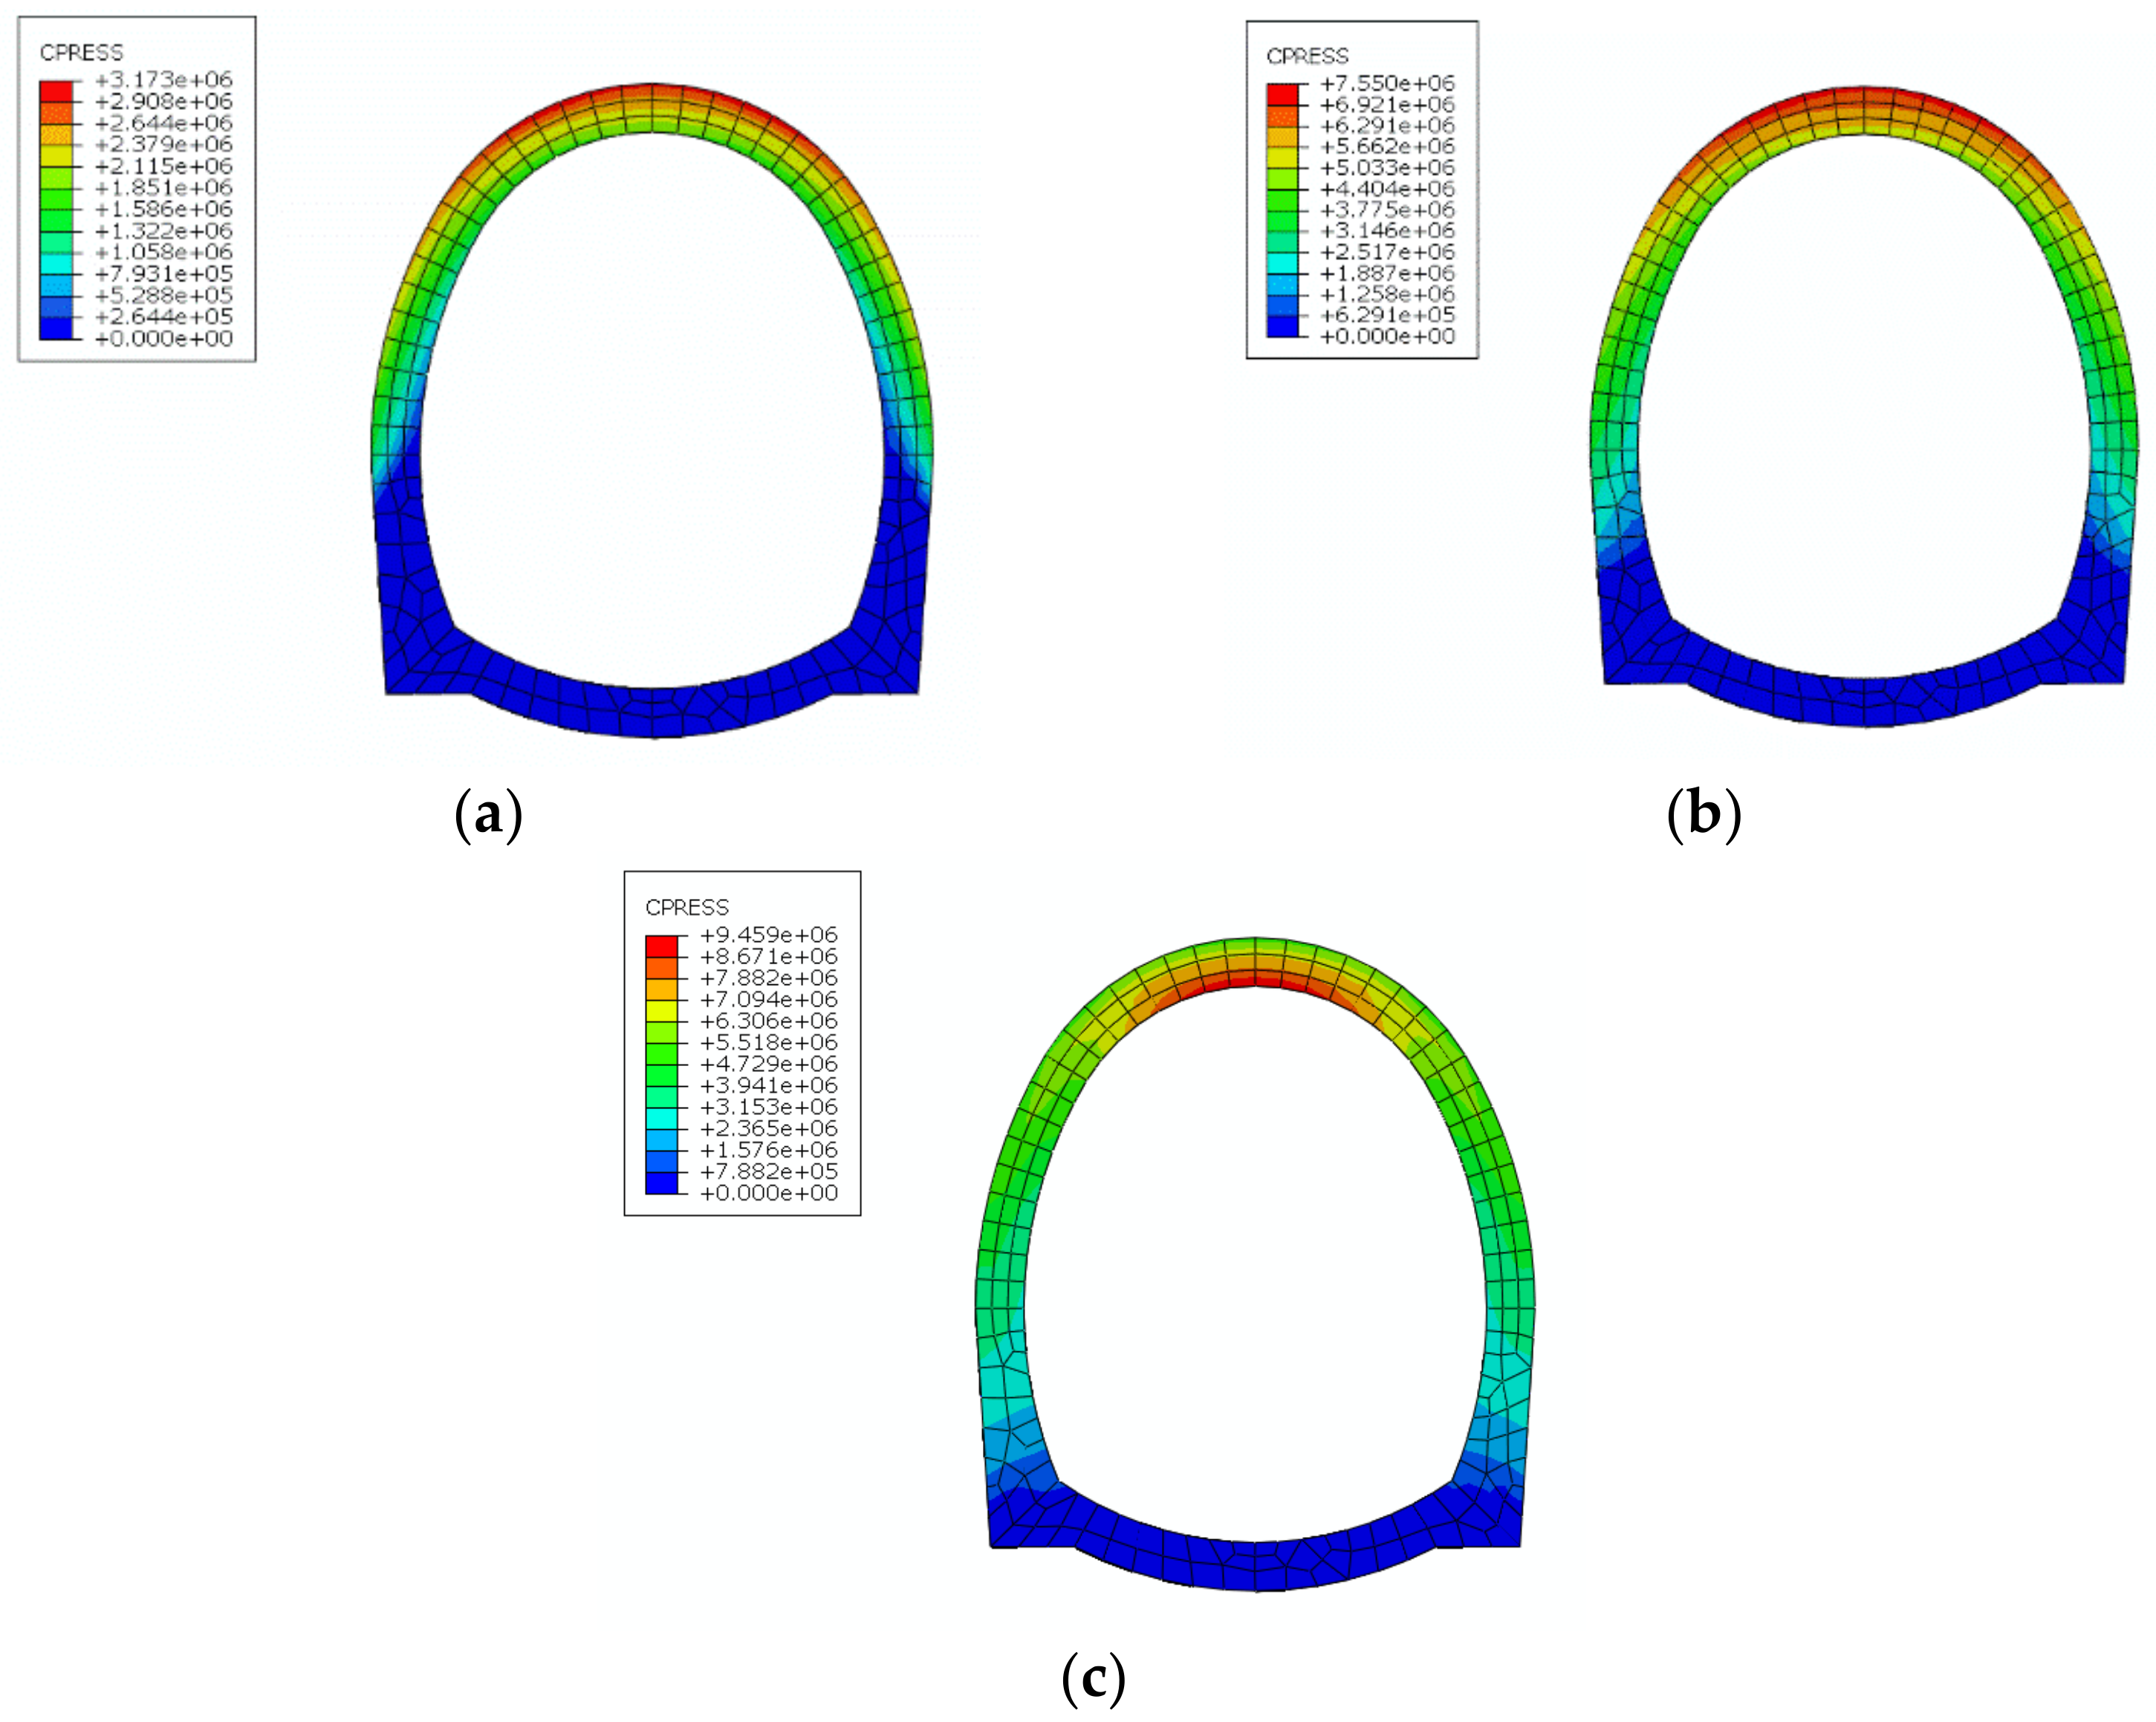
4.3. Contact Pressure Analysis
4.4. Verification Result Analysis
- (1)
- The staggered distances of 1 cm and 3 cm were analyzed by numerical simulation. The maximum principal stress values of the outer side of the tunnel crown, the outer side of the arch waist, and the inner side of the inverted arch under the condition of 5 cm were obtained. The evolution law of the cracks in the arch crown in the model test was verified.
- (2)
- The staggered distances of 1 cm and 3 cm were analyzed by numerical simulation. Longitudinal stress values of the outer side of the tunnel crown, the outer side of the arch waist, and the inner side of the inverted arch under the condition of 5 cm were obtained. The distribution and variation of the longitudinal strain at the arch waist of the lining surface with the displacement distance of the fault in the model test were compared, and they were basically consistent with the numerical simulation law.
- (3)
- The staggered distances of 1 cm and 3 cm were analyzed by numerical simulation. Longitudinal stress of the outer side of the tunnel crown, the outer side of the arch waist, and the inner side of the inverted arch under the condition of 5 cm were obtained.
5. Conclusions
5.1. Summary of Main Research Contents
- (1)
- Through an orthogonal test, the proportioning design of similar materials of the surrounding rock was carried out, a range analysis of the results was carried out, and the influence trend diagram of the river sand particle size combination, river sand content, and fly ash content on material cohesion and the internal friction angle was obtained. We found that the influence of the river sand particle size combination on cohesion was four times that of the river sand content and fly ash content, and the appropriate proportion of similar materials of the surrounding rock was obtained. According to the data fitting, when the retarder content was 0.5%, the relationship formula between the proportion of gypsum and water and the elastic modulus could be obtained, and the appropriate proportion of similar lining materials was determined. This provides reference and guidance for the configuration of similar materials for model tests in the future.
- (2)
- Through the model test, it was found that the deformation and failure of the tunnel lining structure were mainly concentrated in and near the fault fracture zone in the reverse fault dislocation. The influence range of the footwall was about 0.5 D (D is the tunnel diameter), and that of the hanging wall was about 1.5 D. The damage continued to accumulate with the increase in dislocation. The influence of fault dislocation on the tunnel in the hanging wall area was greater than that of the footwall, and the maximum surrounding rock pressure and the maximum longitudinal strain appeared in the hanging wall of the tunnel. The lining structure at the fault and near the hanging wall was damaged to a large extent, and there were inclined cracks and transverse and longitudinal cracks on the inner wall of the lining structure, and the abutment staggering phenomenon occurred at the fault along the longitudinal direction of the tunnel. Therefore, the reinforcement of the arch foot and arch waist should be strengthened at the position of the tunnel close to the fault to improve its shear resistance, while the flexible deformation capacity of the connecting material should be enhanced at the connection of the tunnel sections to improve its fault resistance.
- (3)
- The numerical simulation results were compared with the model test results to verify the effectiveness of both. Based on this, a three-dimensional simulation method of reverse fault dislocation based on a viscous interface model for railway tunnels is proposed.
5.2. Research Deficiencies and Future Prospects
- (1)
- Due to the limitations of test conditions and time, the model test simplified the tunnel prototype to varying degrees, failed to fully consider the impact of the model boundary on the tunnel, and simplified the tunnel lining support form into one. The above simplified design will have different degrees of impact on the test results. It is hoped that in future research, funding and time factors will allow model similarity to be achieved to the greatest extent.
- (2)
- Only the damage behavior of the tunnel lining structure under the dislocation of the reverse fault was analyzed and studied. In fact, the typical fault activity forms also include normal faults and strike slip faults, and the damage behavior of the tunnel lining structure under atypical combined fault forms needs to be further studied.
- (3)
- In the model test and numerical simulation, the surrounding rock and fault were treated as a single uniform medium, and the different distribution of the surrounding rock material properties and surface characteristics in the stratum were not considered. Further analysis and research are needed to ascertain the impact this may have had on the results.
- (4)
- The sensitivity analysis of the influencing factors only used the damage extreme value, so the evaluation of the overall damage of the lining was not comprehensive enough. In future, the damage index of the overall lining under tension and compression should be introduced for further study.
Author Contributions
Funding
Conflicts of Interest
References
- Elshaboury, N.; AlSakkaf, A.; Mohammed, A. Construction and Demolition Waste Management Research: A Science Mapping Analysis. Int. J. Environ. Res. Public Health 2022, 19, 4496. [Google Scholar] [CrossRef] [PubMed]
- Yuan, B.; Chen, W.; Zhao, J. The Effect of Organic and Inorganic Modifiers on the Physical Properties of Granite Residual Soil. Adv. Mater. Sci. Eng. 2022, 2022, 9542258. [Google Scholar] [CrossRef]
- Abdelkader, E.; AlSakkaf, A.; Elshaboury, N. Hybrid Grey Wolf Optimization-Based Gaussian Process Regression Model for Simulating Deterioration Behavior of Highway Tunnel Components. Processes 2021, 10, 36. [Google Scholar] [CrossRef]
- Yuan, B.; Li, Z.; Chen, W. Influence of Groundwater Depth on Pile–Soil Mechanical Properties and Fractal Characteristics under Cyclic Loading. Fractal Fract. 2022, 6, 198. [Google Scholar] [CrossRef]
- Yuan, B.; Chen, M.; Chen, W. Effect of Pile-Soil Relative Stiffness on Deformation Characteristics of the Laterally Loaded Pile. Adv. Mater. Sci. Eng. 2022, 2022, 4913887. [Google Scholar] [CrossRef]
- Sun, F. Study on Anti Dislocation Mechanism and Method of Tunnel Crossing Active Fault Mountains. Ph.D. Thesis, Beijing Jiaotong University, Beijing, China, 2018. [Google Scholar]
- Wang, H.; Liu, X.; Li, N.; Xie, D. Study on safety evaluation and reinforcement of longitudinal crack tunnel lining structure. J. Rock Mech. Eng. 2010, 29, 2651–2656. [Google Scholar]
- Qi, B.; Wang, F.; Chen, J. Numerical simulation of structural response of tunnel crossing fault under stick slip fault dislocation. Build. Struct. 2020, 50, 753–758. [Google Scholar]
- Xiao, Z. Research on Deformation and Failure of Soil Tunnel under Strike Slip Fault Dislocation. Master’s Thesis, Overseas Chinese University, Quanzhou, China, 2019. [Google Scholar]
- Liu, Y.; Lai, J.; Xin, J.; Li, X.; Xing, R. Dynamic comparative experimental study on Seismic Response Law of tunnel crossing fault. Geotech. Mech. 2019, 40, 4693–4702. [Google Scholar]
- Liu, X.; Wang, X.; Lin, L. Experimental analysis of the influence of 45° dip normal fault stick slip dislocation on the tunnel. J. Tongji Univ. Nat. Sci. Ed. 2014, 42, 44–50. [Google Scholar]
- Liu, X.; Wang, X.; Lin, L. Experimental study on the influence of 60° dip normal fault stick slip dislocation on mountain tunnel. J. Civ. Eng. 2014, 47, 121–128. [Google Scholar]
- Liu, X.; Wang, X.; Lin, L. Model test study on the influence of 75° dip normal fault stick slip dislocation on highway tunnel. J. Rock Mech. Eng. 2013, 32, 1714–1720. [Google Scholar]
- Zhang, Y.; Chen, X.; Yuan, Z. Influence of fault dislocation on cross fault tunnel. J. Nanjing Univ. Technol. Nat. Sci. Ed. 2019, 41, 129–134. [Google Scholar]
- Baziar, M.H.; Nabizadeh, A.; Lee, C.J.; Hung, W.Y. Centrifuge modeling of interaction between reverse faulting and tunnel. Soil Dyn. Earthq. Eng. 2014, 65, 151–164. [Google Scholar] [CrossRef]
- Kiani, M.; Akhlaghi, T.; Ghalandarzadeh, A. Experimental modeling of segmental shallow tunnels in alluvial affected by normal faults. Tunn. Undergr. Space Technol. Inc. Trenchless Technol. Res. 2016, 51, 108–119. [Google Scholar] [CrossRef]
- Sabagh, M.; Ghalandarzadeh, A. Centrifugal modeling of continuous shallow tunnels at active normal faults intersection. Transp. Geotech. 2020, 22, 100325. [Google Scholar] [CrossRef]
- Saiyar, M.S.; Take, W.A.; Moore, I.D. Post-failure fracture angle of brittle pipes subjected to differential ground movements. Tunn. Undergr. Space Technol. Inc. Trenchless Technol. Res. 2015, 49, 114–120. [Google Scholar] [CrossRef]
- Fu, J.; Xie, J.; Yang, J. The Effects of Local Cavities on the Cracking Performance of an Existing Tunnel Lining; Springer: Cham, Switzerland, 2018. [Google Scholar]
- Geng, Y.; Zhu, Z.; Gu, G.; Zhang, C. An Analysis of the Effects of Cavities in Different Positions Behind the Tunnel Lining under the Action of an Earthquake. Traffic Eng. Technol. Natl. Def. 2016, 14, 37–40. [Google Scholar]
- Kim, M.-J.; Park, T.-G. A Case Study on Crack Control of Tunnel Lining through Construction Example. Proc. Korean Concr. Soc. Acad. Conf. 2017, 29, 409–410. [Google Scholar]
- Fang, Y.; Guo, J.; Kang, H. Influence of voids behind lining on the mechanical behavior of lining structure of highway tunnel in watery strata. Chin. J. Rock Mech. Eng. 2016, 35, 1648–1658. [Google Scholar]
- Su, J.; Jie, Y.; Niu, X. Mechanical Behavior of Tunnel Lining with Cracks at Different Positions. Symmetry 2020, 12, 194. [Google Scholar] [CrossRef] [Green Version]
- Jin, M.; Liu, X.; Zhong, Z. Model Test Research on the Mechanical Characteristics of Tunnel Lining Structures under Local High Water Pressure in Concealed Karsts. IOP Conf. Ser. Earth Environ. Sci. 2021, 861, 022010. [Google Scholar] [CrossRef]
- Chen, Z.; Bian, M. Dynamic Centrifuge Test and Numerical Modelling of the Seismic Response of the Tunnel in Cohesive Soil Foundation. Buildings 2022, 12, 337. [Google Scholar] [CrossRef]
- Qiao, Y.; Tang, J.; Liu, G. Longitudinal mechanical response of tunnels under active normal faulting. Undergr. Space 2022, 7, 662–679. [Google Scholar] [CrossRef]
- An, S.; Tao, L.J.; Han, X.C.; Zhang, Y. Application of two-level design method on subway tunnel crossing active fault: A case study on Urumqi subway tunnel intersected by reverse fault dislocation. Bull. Eng. Geol. Environ. 2021, 80, 3871–3884. [Google Scholar] [CrossRef]


| Physical Quantity | Similarity Relation | Similar Scale |
|---|---|---|
| Length l/m | Cl | 30 |
| Stress σ/(N/m2) | Cσ | 45 |
| Strain ε | Cε = 1 | 1 |
| Poisson’s ratio ν | Cν = 1 | 1 |
| Internal friction angle φ/(°) | Cφ = 1 | 1 |
| Cohesion c/Pa | Cc = Cσ | 45 |
| Modulus of elasticity E/Pa | CE = Cσ | 45 |
| Density ρ/(kg/m3) | Cσ = CE/Cl | 1.5 |
| Category | Material Type | Density (kg/m3) | Modulus of Elasticity E (MPa) | Poisson’s Ratio (μ) | Cohesion c (kPa) | Internal Friction Angle (°) |
|---|---|---|---|---|---|---|
| Prototype | wall rock | 2100 | 4500 | 0.32 | 500 | 33 |
| lining | 2500 | 30,000 | 0.2 | -- | -- | |
| Model | wall rock | 1400 | 100 | 0.32 | 11 | 33 |
| lining | 1666.67 | 666.67 | 0.2 | -- | -- |
| Parameter | Prototype Value | Model Value | Measured Value | Relative Error |
|---|---|---|---|---|
| Density ρ/(kg/m3) | 2100~2200 | 1400~1467 | 1389 | 99.2% |
| Cohesion c/kPa | 500 | 11 | 11.315 | 97.1% |
| Internal friction angle φ/(°) | 33 | 33 | 33.11 | 99.7% |
| Lining density ρ/(kg/m3) | 2500 | 1666 | 1692 | 98.4% |
| Elastic modulus of lining E/MPa | 28,000 | 622 | 635 | 97.9% |
| Type | Density (kg/m3) | Modulus of Elasticity E/(MPa) | Shear Modulus G/(MPa) | Poisson’s Ratio ε (μ) | Cohesion c/(kPa) | Internal Friction Angle φ/(°) | Fracture Energy G/(N/m) |
|---|---|---|---|---|---|---|---|
| Surrounding rock | 2100 | 4500 | — | 0.32 | 500 | 33 | — |
| Fault | 1900 | 1500 | 560 | 0.4 | 150 | 25 | 20 |
| lining | 2500 | 30,000 | — | 0.2 | — | — | — |
Publisher’s Note: MDPI stays neutral with regard to jurisdictional claims in published maps and institutional affiliations. |
© 2022 by the authors. Licensee MDPI, Basel, Switzerland. This article is an open access article distributed under the terms and conditions of the Creative Commons Attribution (CC BY) license (https://creativecommons.org/licenses/by/4.0/).
Share and Cite
Su, H.; Zhao, Z.; Meng, K.; Zhao, S. Study on the Mechanical Response Mechanism and Damage Behavior of a Tunnel Lining Structure under Reverse Fault Dislocation. Buildings 2022, 12, 1521. https://doi.org/10.3390/buildings12101521
Su H, Zhao Z, Meng K, Zhao S. Study on the Mechanical Response Mechanism and Damage Behavior of a Tunnel Lining Structure under Reverse Fault Dislocation. Buildings. 2022; 12(10):1521. https://doi.org/10.3390/buildings12101521
Chicago/Turabian StyleSu, Huifeng, Zhongxiao Zhao, Kun Meng, and Shuo Zhao. 2022. "Study on the Mechanical Response Mechanism and Damage Behavior of a Tunnel Lining Structure under Reverse Fault Dislocation" Buildings 12, no. 10: 1521. https://doi.org/10.3390/buildings12101521