Article

Effects of Acoustic Perception on Outdoor Thermal Comfort in Campus Open Spaces in China’s Cold Region

Department of Landscape Architecture, College of Landscape Architecture and Arts, Northwest A&F University, Yangling 712100, China
*
Author to whom correspondence should be addressed.
Buildings 2022, 12(10), 1518; https://doi.org/10.3390/buildings12101518
Submission received: 23 August 2022 / Revised: 20 September 2022 / Accepted: 20 September 2022 / Published: 23 September 2022
(This article belongs to the Topic Bioclimatic Designs to Enhance Urban/Rural Resilience)

Abstract

:
To explore the effects of acoustic perception on outdoor thermal comfort, acoustic perception in five typical open spaces in a campus in China’s cold region with common soundscapes was evaluated by using meteorological measures, sound level devices, and a questionnaire survey. Eight adjectives were used to evaluate an individual’s acoustic perception, and the physiological equivalent temperature (PET) was selected as a thermal index. The correlations between acoustic perception and thermal comfort in these typical open spaces were further analyzed. We demonstrated that: (1) Acoustic sensation and comfort varied significantly among sound types (STPs). Respondents reported pleasant perceptions of broadcasting music, running water and birdsong, and wind (a gentle breeze) and insects. (2) Although there was no significant difference in the thermal sensation vote (TSV), we found large differences in the thermal comfort vote (TCV) among STPs. (3) The respondents’ neutral PET (NPET) varied among STPs. In autumn, the ranked order of NPET was machines > running water and birdsong > crowds > broadcasting music > wind (a gentle breeze) and insects. In winter, the order of the NPET was machines > wind (a gentle breeze) and insects > crowds > broadcasting music > running water and birdsong. (4) When people perceived “acoustic comfort”, their TSV improved, and vice versa.

1. Introduction

Campus open spaces are conducive to improving the staff’s and students’ physical and psychological health, relieving their pressure, and strengthening their learning and cognitive abilities [1,2]. High-quality campus open spaces can enrich campus life, improve the ability to adapt socially, and promote healthy growth and development. Among them, thermally comfortable environments play an important role in promoting physical health, altering psychology, and improving the emotional state of both staff and students [3].
The perception of human comfort is often defined as an individual’s satisfaction with a specific environment and is influenced by factors, both psychological and physical [4]. In addition to the significant influence of the thermal environment, the acoustic environment is also considered to be a very important factor inhuman comfort [5,6]. An uncomfortable acoustic environment has negative impacts on teaching, learning, and the health of staff and students [7], while a high-quality acoustic environment may provide positive impacts on social welfare, quality of life, and environmental health [8].
The factors influencing outdoor thermal comfort (OTC) can be divided into four levels: physical, physiological, psychological, and social/behavioral [9]. On the physical level, air temperature (Ta) is viewed as the primary influencer [10,11,12,13,14]. Moreover, solar radiation, wind velocity (Va), relative humidity (RH), surface type, vegetation, and water bodies can influence OTC to some extent [15,16,17,18,19,20,21,22,23,24,25,26]. On the physiological level, some studies demonstrated that physical indices, such as skin temperature, heart rate, and sweat feeling index can be used as thermal comfort indices [11,27,28,29,30]. Additionally, metabolic rate and activity type also may, to some extent, influence OTC [28,31,32,33]. At the social/behavioral level, social characteristics (e.g., gender, age, socioeconomic status, and cultural background) and thermal adaptation are all contributing factors [18,34,35,36,37,38,39].
Acoustic perception is usually defined as the “acoustic environment that an individual, a group or a community perceives in a given scene” [40]. Existing studies generally suggested that the subjective acoustic evaluation had a negative correlation to the sound pressure level [41], and natural sound is more easily accepted by respondents than other sound types (STPs) [42,43]. Moreover, age, gender, career, and the purpose of the visit of the respondents can all affect acoustic perceptions [44,45].
Acoustic perceptions in outdoor open spaces are vital to thermal comfort. Some scholars have conducted studies regarding this cross-modal effect on OTC. Tsai and Lin showed that neutral thermal conditions were related to a higher Leq, and a lower Leq was recorded under ‘hot’ to ‘very hot’ condition [46]. Under the same acoustic conditions, individuals tended to be more tolerant in the square where the ambiance and thermal conditions were better [47], and noise annoyance was related to thermal sensation [48,49]. Additionally, subjects felt more thermally unpleasant when the noise level increased [6]. It suggested that the outdoor acoustic environment is associated with individuals’ thermal perception [49,50,51], and the sound type and level have significant influences on thermal comfort [52].
In addition to healthy humans, the acoustic-thermal perceptual characteristics of atypically developed individuals in relation to the acoustic and thermal environment have received increasing attention worldwide. Such interest deals with both the functional and visual settings of their living spaces and other intangible aspects such as thermal and acoustic comfort [53,54,55,56,57,58,59]. Previous studies showed that noise and an overload of sounds should be avoided and that clients displaying challenging behavior should be taught how to deal with noises and sounds. The sound environment, however, might also have relaxing, comforting, and encouraging influences on people displaying challenging behavior [60].
To date, some studies on the acoustic–thermal correlation have been conducted in urban squares, parks, and residential areas across many climatic zones [49,61]. However, few studies have examined the cross-modal influence of acoustic perception on OTC for different sound types (STPs) in campus open spaces. In our study, five typical spaces in a campus in Xi’an, China were chosen to explore the relationship between acoustic perception and OTC. The primary objectives of this study were to: (1) determine the influences of the acoustic environment of typical open spaces on acoustic perception and comfort, and (2) withstand the influencing characteristics of the acoustic perception of typical open spaces on thermal comfort. Our results could provide theoretical references and technical guidance to create comfortable campus open spaces concerning the combined effects of acoustic and thermal perceptions.

2. Methods

2.1. Study Area

This study was carried out on a campus in Xi’an, a typical city in China’s cold region. Xi’an is located on the border between the humid subtropical climate area and the tropical and subtropical steppe climate area (Cwa to BSk) [62]. This places it in the warm temperate sub-humid continental monsoon climate. It is warm and windy in spring, hot and rainy in summer, cool and pleasant in autumn, and cold and dry in winter. According to meteorological data from 2011–2021, the highest monthly average Ta is in July (27.21 °C) with the highest value of 38.10 °C. The lowest monthly average Ta is in January (−0.92 °C) and the lowest value is −11.65 °C. The annual average RH is between 57.58 and 79.45% [63].
Our trials were carried out on a university campus (108°04′37″ E, 34°15′44″ N). It covers about 170 ha with diverse sound environments (broadcasting music, running water and birdsong, and machines), landscape types, and abundant outdoor spaces; 66% of the campus is green. Hence, it is an ideal place to study the acoustic comfort and thermal comfort of campus open spaces. Ta in urban spaces is influenced by the surrounding environment within a radius of 10–150 m centered at the site [64]. A circle within a radius of 10 m was used as the spatial scope in the experiment. Five representative outdoor spaces were chosen on campus with consideration to the sky view factor (SVF) and seasonal landscape that included a peony garden (PG), campus square (CS), wooded area (WA), ecological garden (EG), and patio space (PS) (Table 1).

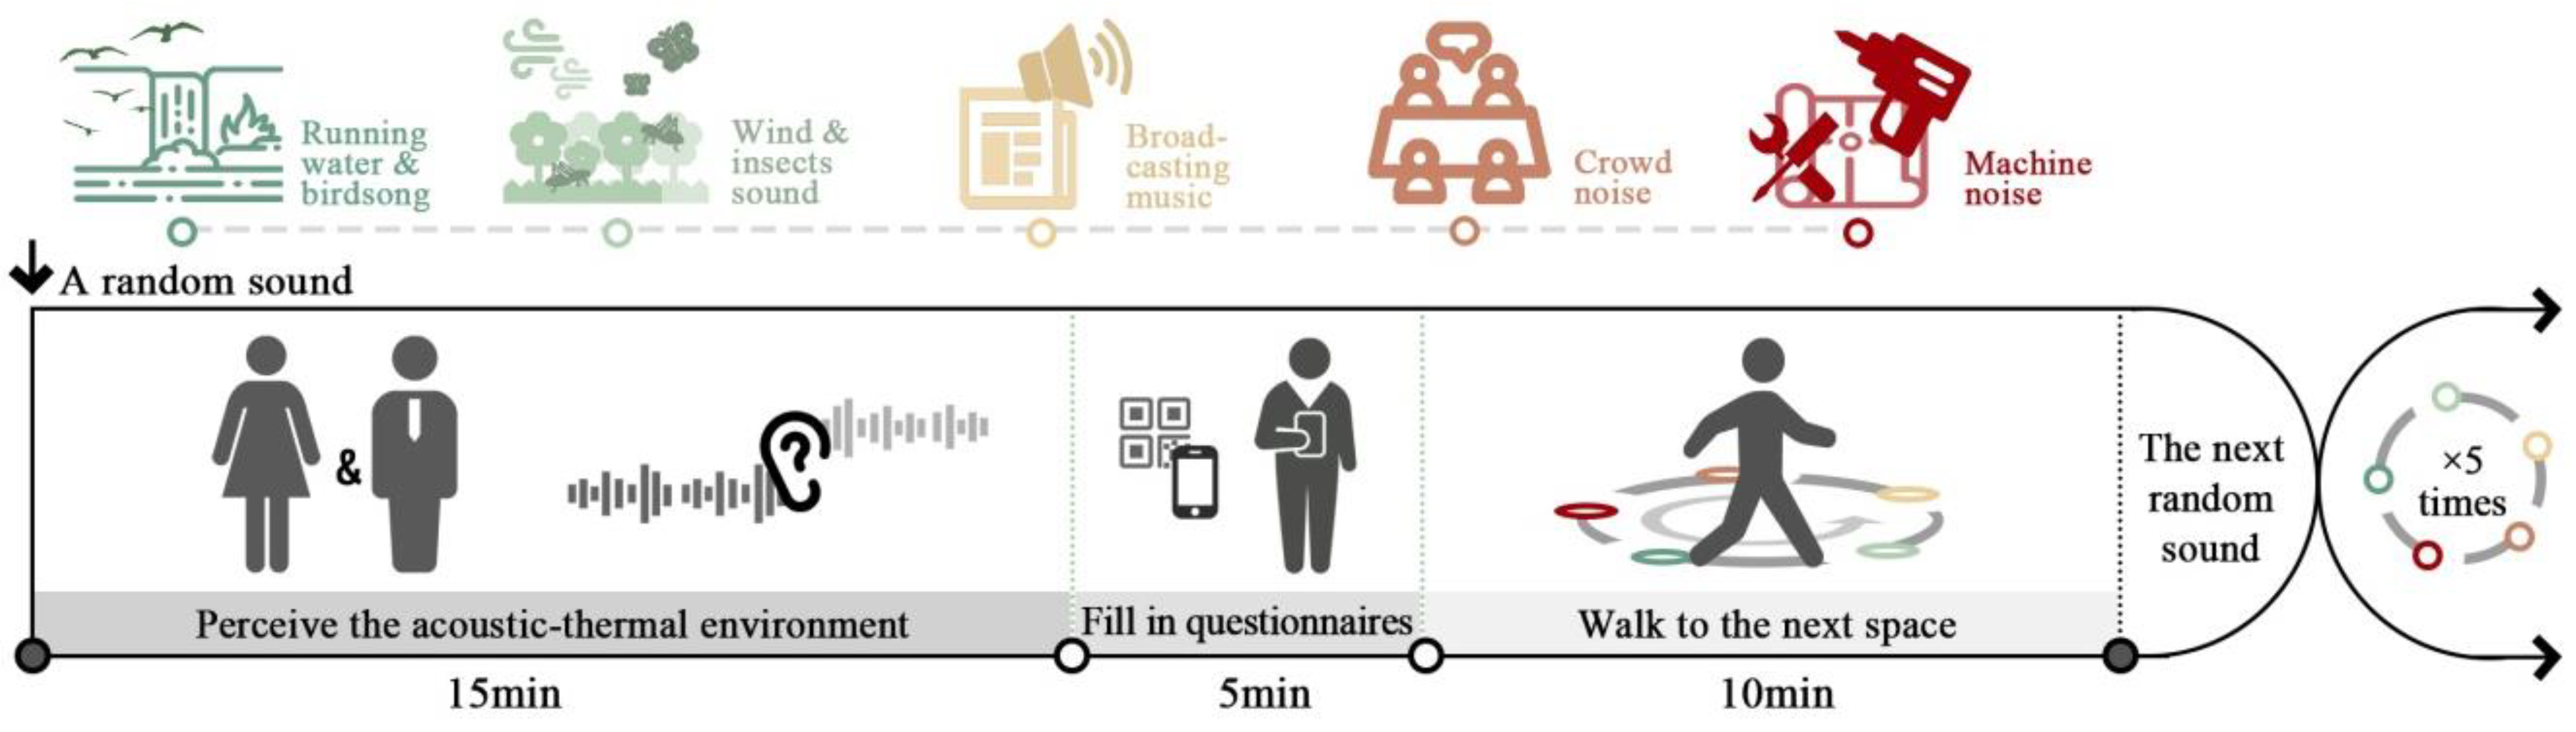
2.2. Experimental Design

The experiment was carried out in 7 days in the autumn and winter of 2020 (7, 17, 18, and 24 October; 11–13 December). The meteorological variables during the experiments are characteristic of the seasonality in Xi’an. When the sound pressure level (SPL) is between 65 and 70 dBA, the acoustic comfort vote is related to the acoustic source and user characteristics [64,65,66,67,68]. Therefore, the SPL was maintained to within 60–70 dBA during trials (Leq = 60–70 dBA) [69].
The trials were carried out simultaneously at the measured points. Before the trial, each respondent was briefed on the purpose of the experiment, methodology, and procedure. The respondents were then divided into five groups, and each group was randomly assigned to go to a space where they listened to a random sound in each space. A sound speaker was hidden at each measured point. Testers controlled the sound speaker so that it was set to play before each group of respondents arrived. Upon arrival, respondents were instructed to listen to the sounds and experience the environment for 15 min. The respondents were then asked to fill in the subjective questionnaire for 5 min. The respondents then moved to another trial site within 10 min. During the trial, the testers were asked to keep silent and static to prevent disturbing the respondents, and respondents were asked to stand throughout the experiment to prevent influences of different activity metabolism. The respondents visited five spaces and the five STPs randomly in half a day, without repetition (Figure 1). Such design controls for the order effect of an individual’s experimental results eliminated order bias [70].

2.2.1. Sound Selection

There is currently no fully standardized classification of sound types [71]. Axelsson et al. proposed a five-classification system of sound sources (vehicular traffic, fans, other noise, human sound, and natural sound) as a specification for acoustic assessment [72,73]. Other studies often classified sound types as ‘traffic’, ‘human voice’, ‘bird song’, ‘water’, and ‘music’ [74,75,76]. The overall environment on campus is quiet due to the constraints of teaching activities, and there is no traffic noise as in other outdoor experiments, with little difference in the sound levels between the various types of sound. Based on the previous studies [72,73,77], five types of sound (broadcasting music (Brm), running water and birdsong (Rus), wind (a gentle breeze) and insects (Wis), crowds (Crn), and machines (Macn) were obtained in advance using mobile phones as recording devices in real campus scenarios (e.g., after class, by the water in the spring garden, next to a construction site being renovated). The most representative sound clip of each sound was selected, the sound pressure level was adjusted at 10 dB (A) intervals using the Adobe Audition software, and each sound was edited into a 20-min sample. Each sample played one sound type repeatedly and it was used as the sound stimulus during trials [78]. The SPL was measured using an AWA5688 multi-functional sound level meter, and the SPL playing the sound equipment was controlled at 60–70 dB. During trials, we conducted a pre-site selection in advance and tried to choose some quiet sites to eliminate the influence of the background. Additionally, the wind speed during the experiment was 2.0 m/s for the maximum and 0.3 m/s for the minimum. The effect of wind sound on the experimental results was minimal [79]. Meanwhile, we arranged with the campus administration to ensure that there was no collective activity with loud sounds surrounding the measured sites.

2.2.2. Meteorological Measures

Physical measurement refers to the meteorological data by installing relevant apparatus in measured sites. Instruments were selected with reference to ASHRAE 55 and ISO 7726 [80,81] (Table 2). Each measured space was equipped with a meteorological station installed 1.1 m above the ground and data were recorded every 1 min. The monitored meteorological data include Ta, RH, Va, solar radiation (G), and the globe temperature (Tg). The mean radiant temperature (Tmrt) was calculated by the following equation [82].
T m r t = [ ( T g + 273 ) 4 + 1.10 × 10 8 V a 0.6 ε D 0.4 ( T g T a ) ] 0.25 273
where ε refers to the black globe reflectivity (ε = 0.95 in this study). D is the diameter of the black globe (D = 0.05 m in this study).
The respondents were required to stay in measured spaces for 20 min, during which SPL was controlled at 60–70 dBA. Therefore, an AWA5688 multi-functional sound level meter was used to measure the SPL every 20 min when recording meteorological parameters in each space.

2.3. Questionnaire Survey

Part I of the questionnaire captured the general respondents’ information, including gender, age, height, body weight, and clothing. The clothing insulation and metabolism referred to standards in ASHRAE 55 and ISO 7726 [80,81].
Part II investigated the respondents’ acoustic perception, including acoustic sensation, acoustic comfort, and acoustic acceptability. Eight adjectives, including eventful, exciting, pleasant, calm, uneventful, monotonous, annoying, and chaotic, were selected to evaluate the acoustic perception of each space [72,73,83]. A 5-level scale was applied to evaluate respondents’ acoustic perception of each adjective: −2: strongly disagree; −1: somewhat disagree; 0: neutral; +1, somewhat agree; +2 strongly agree. A 5-level scale was used to evaluate acoustic comfort: −2: discomfort; −1: slight discomfort; 0: neutral; 1: slight comfort; 2: comfort. A 3-level scale was used to evaluate the acoustic acceptability: −1: unwilling; 0: neutral; 1: willing [76].
Part III investigated the respondents’ outdoor thermal perception, including thermal sensation and thermal comfort. The respondents were asked about their comfort and acceptability of the whole environment. A 7-level scale (−3: cold; −2: cool; −1: slightly cool; 0: moderate; 1: slightly warm; 2: warm; 3: hot) was used to evaluate the thermal perception of residents. Thermal comfort was measured by a 5-level scale (−2: discomfort; −1: slight discomfort; 0: moderate; 1: slight comfort; 2: comfort) [84].

2.4. Statistical Analysis

In this study, physiological equivalent temperature (PET), based on the theoretical foundation of the MEMI model (human heat balance model), has been used extensively to predict thermal comfort in complex outdoor environments [85]. Meteorological parameters and individual parameters (height, body weight, age, gender, clothing insulation, and metabolic rate) were input into the Rayman to calculate the PET [86,87].
All original data were recorded and processed in Microsoft Excel. The linear regression equation was fitted, and the corresponding diagram was plotted. The one-way analysis of variance (ANOVA) in SPSS23.0 was used to analyze the data.

2.5. Respondents’ Attribute

A total of 241volunteers were recruited; 137 in autumn and 104 in winter. The volunteers were aged 17–27 years, with a height range of 1.52–1.90 m and a weight range of 42–96 kg (Table 3). The respondents were asked to stand during the experiment (70 W/m2). All respondents were staff or students who had lived in Xi’anfor more than a year and had adapted to the local climate and were able to accurately perceive temperature changes and adjust their clothing appropriately [88]. Each participant was informed of the procedure, requirements, and precautions prior to the trial, and they had normal hearing and were able to forma reasonable assessment of their acoustic surroundings.

3. Results

3.1. Meteorological Parameters

The average Ta of spaces PG and CS was high, but the value in space PS was relatively low, which is related to the space’s shadiness. There is relatively high SVF in both spaces, PG and CS. Without overhead shade, the Ta in these spaces increased quickly due to the direct sunshine. Since spaces WA and PS were completely shaded at the top, the Ta fluctuated slightly during the day. Space WA is covered overhead by trees, but some sunlight penetrates through the canopy. Space PS is surrounded by buildings, which makes it difficult for sunlight to penetrate. Hence, the mean Ta of WA was higher than that of PS. Since space EG is a square space, partially shaded by arbors, the mean Ta was lower than those of PG and CS, but it was higher than those of WA and PS.
Spaces WA and PS showed the highest average RH, followed by EG and PG. The average RH in space CS was the lowest, which is related to its morphology and vegetation planting. Space WA, with its high proportion of plants, had a higher average RH. Space PS is surrounded by high-rise buildings with small rainwater ponds, resulting in the relatively high average RH. Although there are relatively high proportions of plants in spaces EG and PG, these are open spaces with high Ta. Hence, the average RH of spaces EG and PG was relatively low.
The average Va of space CS was the highest, which is related to its morphological layout. Space CS is an open square in front of the administration building, with good ventilation and few barriers. The average Va of PS was0.3 m/s (autumn) and0.5 m/s (winter). Since there are tall buildings in the south and north of space PS, but good ventilation to the east and west, the courtyard formed a wind corridor.
Space CS had the highest average G in autumn. Space WA had the lowest average G in winter. Similar to Ta, this is related with overhead shade in these spaces. In spaces CS and PG without overhead shade, the average G and average Tg were relatively high. The Tg of PG was slightly lower than that of CS, which is due to its lawns. Since the plant shade is denser than the building shade, the average G and average Tg of space PS were higher than those of space WA in autumn (Table 4).

3.2. Thermal Perception

We calculated that the NPETautumn = 18.7 °C and the NPETR = 14.6−22.9 °C in autumn; the NPETwinter = 11.6 °C and the NPETR = 7.3–15.9 °C in winter. The NPET in winter and autumn, with the regression models of MTSV and PET, indicates that people can tolerate cold more in winter than in autumn. This may be because people have adapted to the cold environment (Figure 2).
MTSVautumn = 0.1192 PET − 2.2343 (R2 = 0.9203)
MTSVwinter = 0.1164 PET − 1.3458 (R2 = 0.9194)

3.3. Acoustic Perception

ANOVA of acoustic sensation vote (ASV), acoustic comfort vote (ACV), and acoustic unacceptable vote (AUV) showed that there were significant differences between ASV, ACV, and AUV at different STPs (F > 1; p < 0.01).

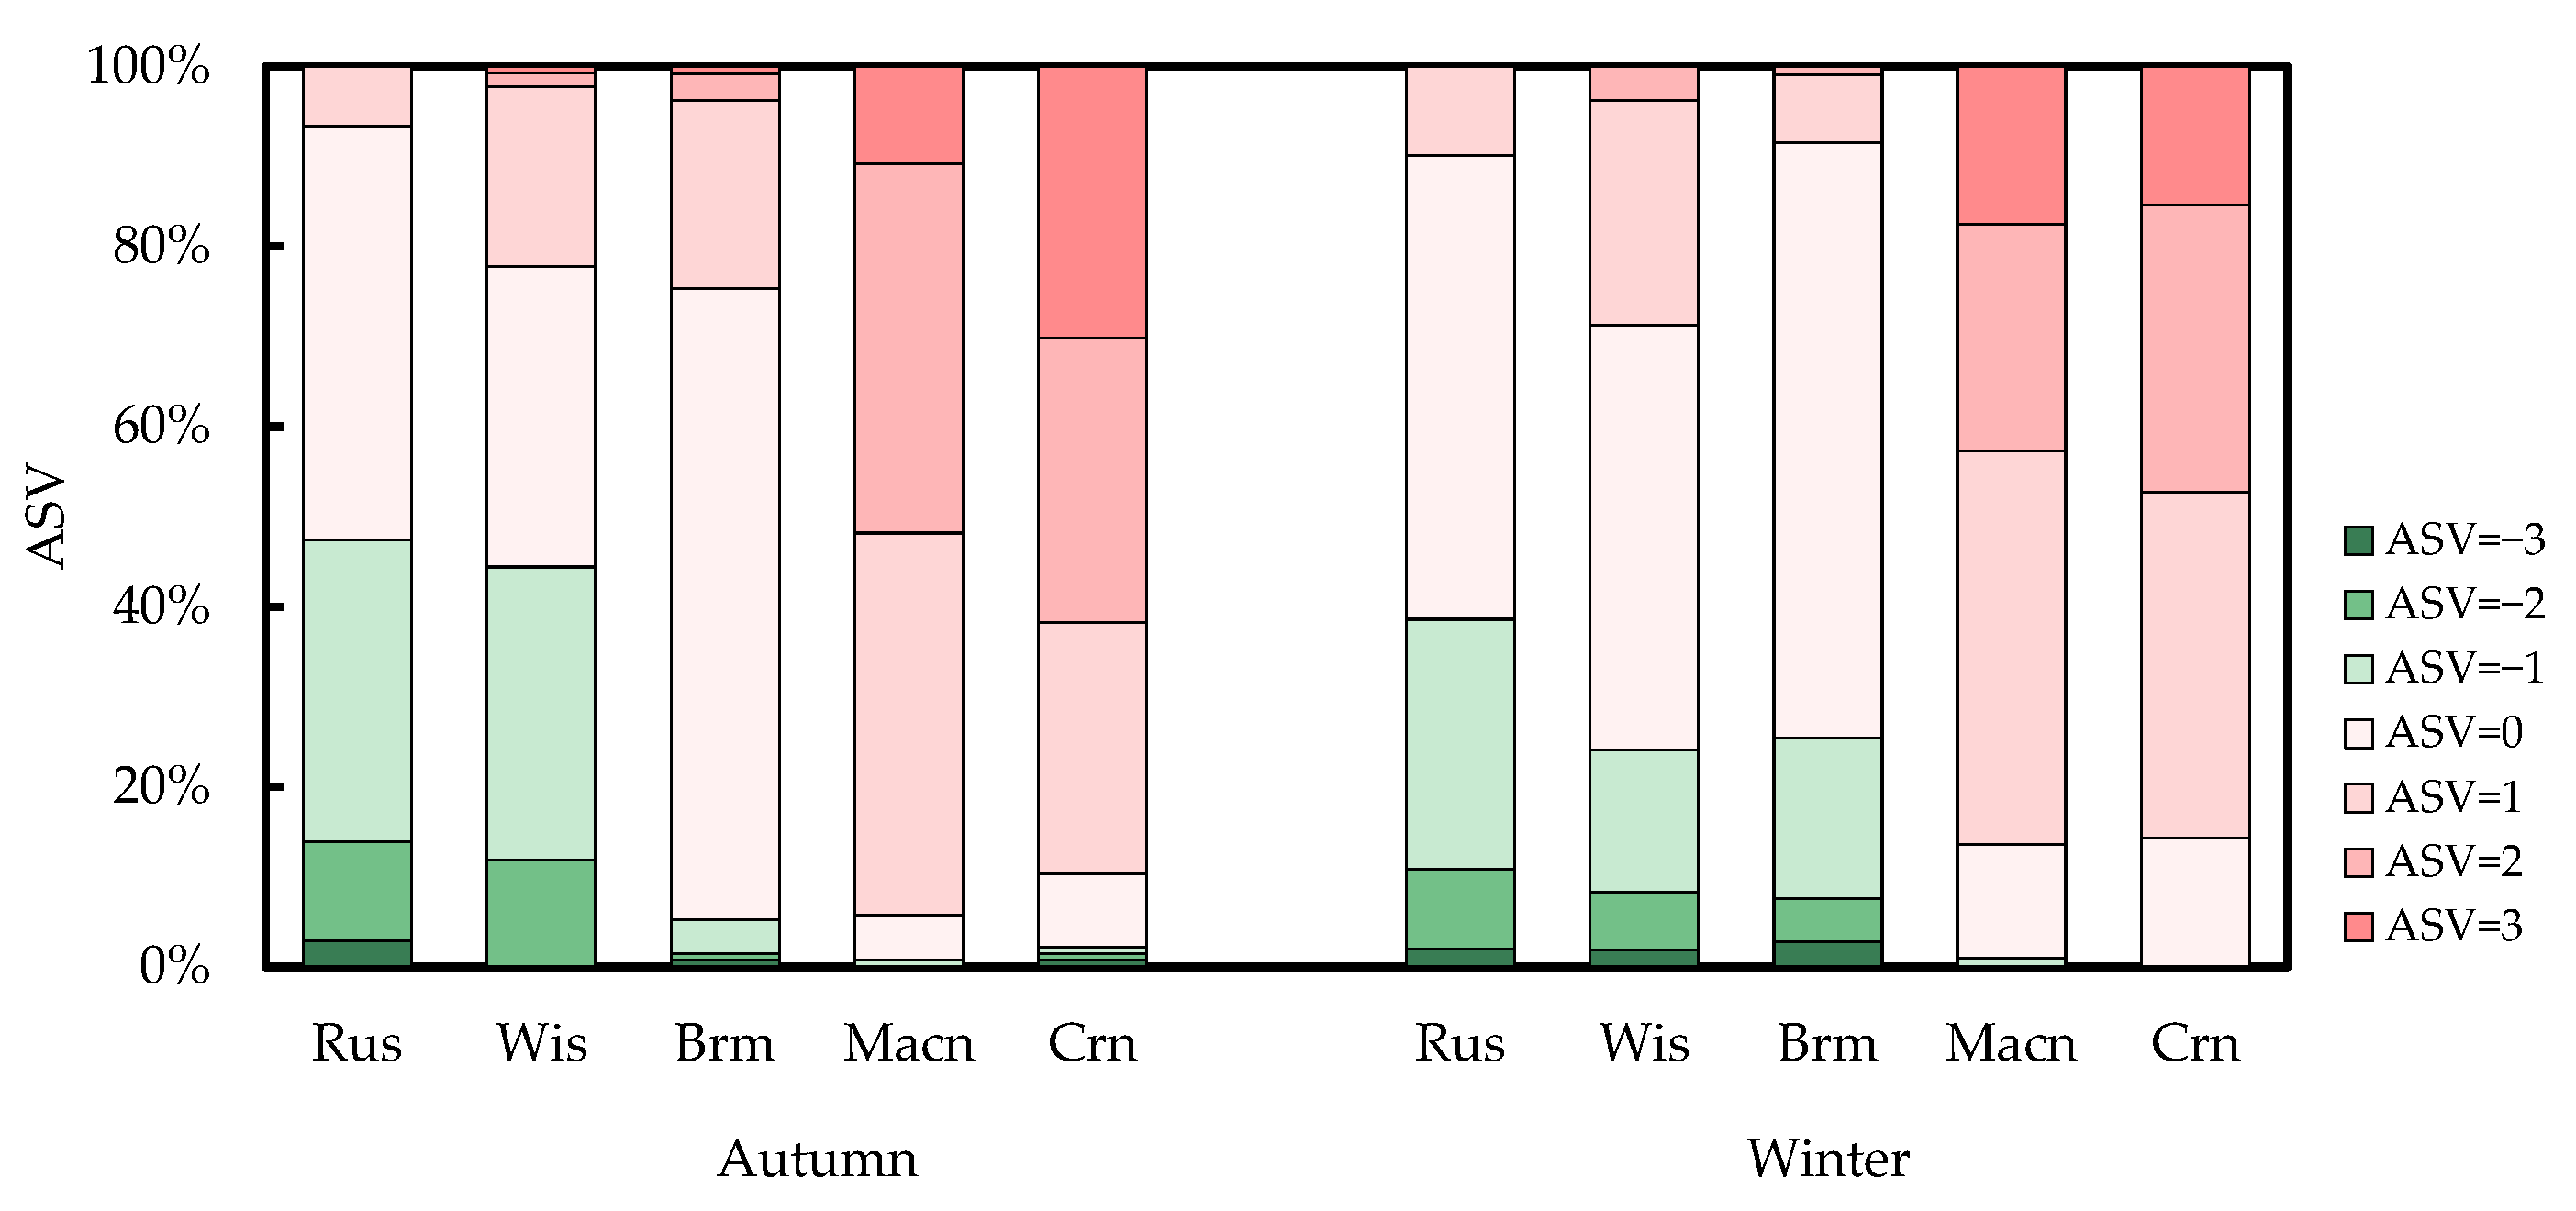
3.3.1. Acoustic Sensation

When calculating the percentages of the ASV of different levels in the total number of votes at different STPs, ASVs for “−3: very quiet”, “−2: quiet” and “−1: relatively quiet” were viewed as votes for “quiet”, and ASVs for “0: moderate” were viewed as neutral votes. ASVs for “3: very noisy”, “2: noisy” and “1: relatively noisy” were viewed as votes for “noisy” (Figure 3).
Given a constant SPL, we found a significant difference in the ASVs at different STPs. In autumn, the percentage of ASVs for “moderate” with broadcasting music was the highest (70.1%). The percentages of ASVs for “noisy” with crowds (94.2%) and machines (89.7%) were far higher than those with other STPs. In other words, crowds and machines made most respondents feel their environment was “noisy”. The percentage of ASVs for “3: very noisy” and “2: noisy” with running water and birdsong was 0, and only 6.6% of respondents voted for “relatively noisy”. This reflected that most respondents felt they were in a relatively quiet environment with running water and birdsong.
In winter, the percentage of ASVs for “moderate” with broadcasting music remained the highest (66.0%), followed by those with running water and birdsong (51.5%) and wind (a gentle breeze) and insects (47.2%). With running water and birdsong and broadcasting music, the percentage of ASVs for “quiet” was higher than that of votes for “noisy”. With crowd noise, the percentage of ASVs for “−3: very quiet” and “−2: quiet” was 0. With machines, the percentage of ASVs for “−3: very quiet”, “−2: quiet” and “−1: relatively quiet” was 0. In other words, the respondents felt that the environment was “noisy” by the sounds after class and machine noise. This was consistent with results in autumn. In this study, crowds and machines were perceived as noises, and we found that noise perception was insensitive to ambient Ta.

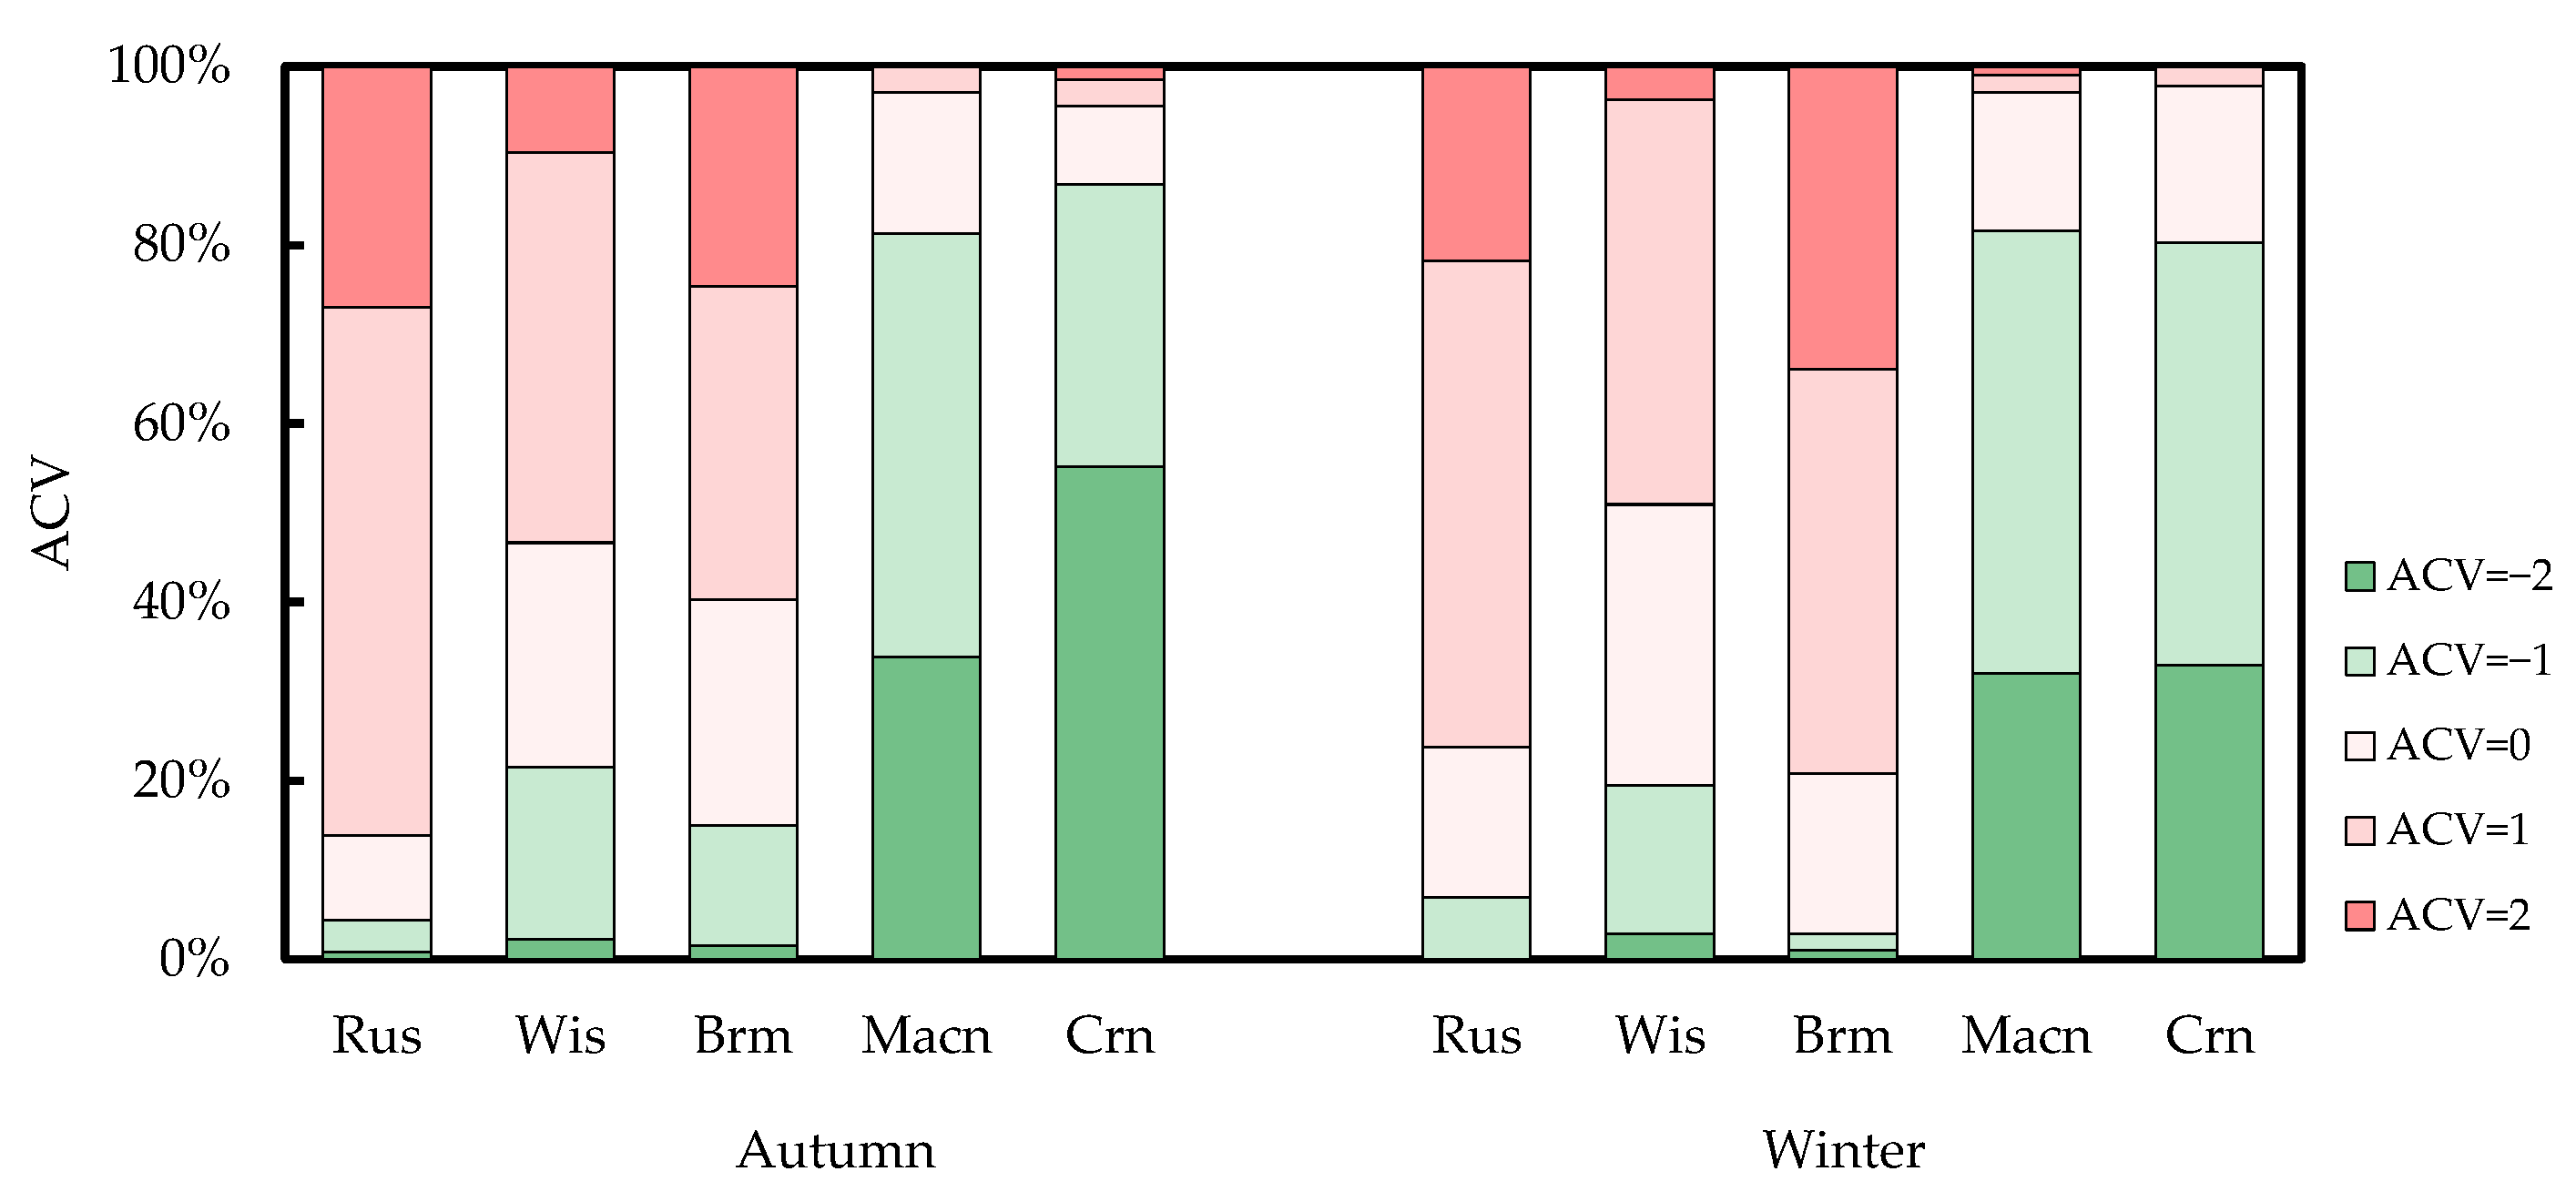
3.3.2. Acoustic Comfort

We calculated the percentage of ACVs from the total number of votes at different STPs. ACVs for “−2: discomfort” and “−1: slightly discomfort” were perceived as votes for “discomfort”. ACVs for “0: neutral” were perceived as neutral. ACVs for “1: slightly comfort” and “2: comfort” were perceived as the votes for “comfort” (Figure 4).
In autumn, the percentage of ACVs for acoustic comfort was relatively high with broadcasting music (86.3%), running water and birdsong (53.3%), and wind (a gentle breeze) and insects (59.7%). More than 50% of the respondents perceived a comfortable acoustic environment. Nevertheless, ACVs for acoustic comfort provided the completely opposite results with crowds and machines. Most respondents perceived that these two sound types brought them acoustic discomfort. Results demonstrated that different STPs influenced the acoustic comfort of people differently. We found no difference between winter and autumn ACVs despite different STPs.
In winter, the percentage of ACVs for “discomfort” and “moderate” at different STPs was higher compared to those in autumn. This appeared to be because a low Ta in winter increased acoustic discomfort. The percentages of ACVs for “comfort” with broadcasting music were the highest in both autumn and winter. In other words, acoustic comfort might not be influenced by low temperatures when it is accompanied by pleasant music. However, low Ta may increase acoustic discomfort with other STPs. Running water and birdsong and wind (a gentle breeze) and insects are often viewed as pleasant sounds. Running water and wind may increase the cold sensation of respondents, thus decreasing their TSV.

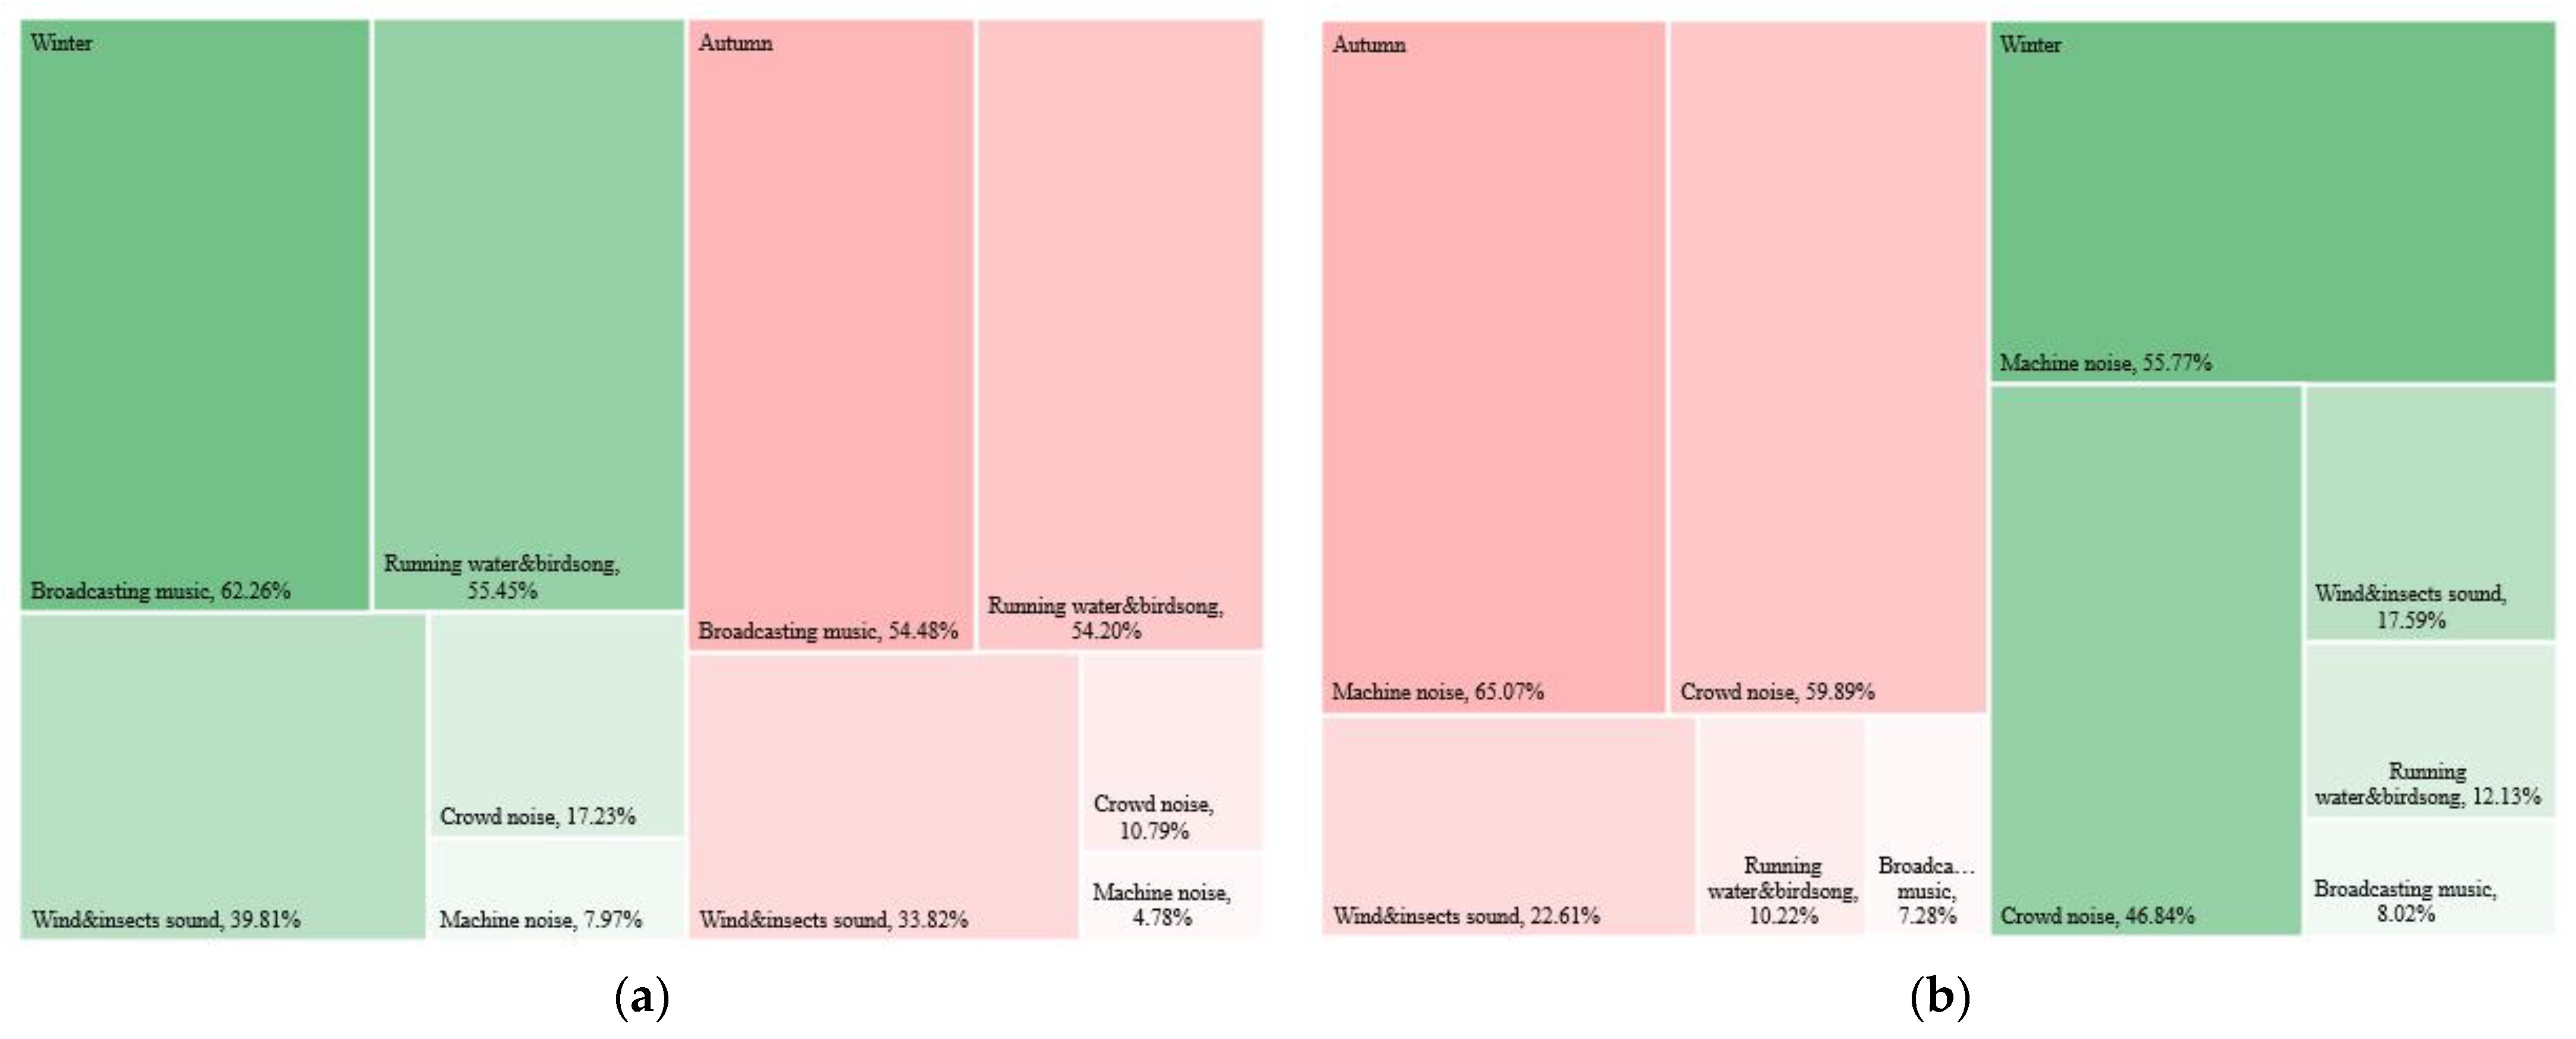
3.3.3. Acoustic Evaluation

The acoustic environment at each site was evaluated using eight adjectives. Specifically, “eventful, exciting, pleasant, and calm” were used as positive evaluations, whereas “uneventful, monotonous, annoying, and chaotic” were used as negative evaluations. Moreover, votes for “somewhat agree” and “strongly agree” were grouped as “agree”. Votes for “strongly disagree” and “somewhat disagree” were grouped as “disagree”. In autumn, proportions of votes for “agree” with positive evaluations were broadcasting music > running water and birdsong > wind (a gentle breeze) and insects >crowds > machines. The proportions of votes for “disagree” with negative evaluation were: machines > crowds > wind (a gentle breeze) and insects (22.6%) > running water and birdsong > broadcasting music. The adjective evaluation in winter was consistent with that in autumn. Positive and negative evaluations represent respondent preferences for different sounds. The respondents gave more positive evaluations of broadcasting music and running water and birdsong, but more negative evaluations of machines and crowds. With broadcasting music and running water and birdsong, the respondents perceived a pleasant acoustic environment with a better space landscape experience. With machines and crowd noises, the respondents perceived a poor acoustic environment, thus influencing their space landscape experiences. Broadcasting music achieved the highest positive evaluation and the lowest negative evaluation (Figure 5).

3.4. Effects of Acoustic Perception on Thermal Perception

An ANOVA of TSV and TCV was carried out on each STP. There were different TSVs at different STPs, but such differences were not significant (F > 1; p > 0.05). There were significant differences among STPs in terms of TCV (F > 1; p < 0.01).

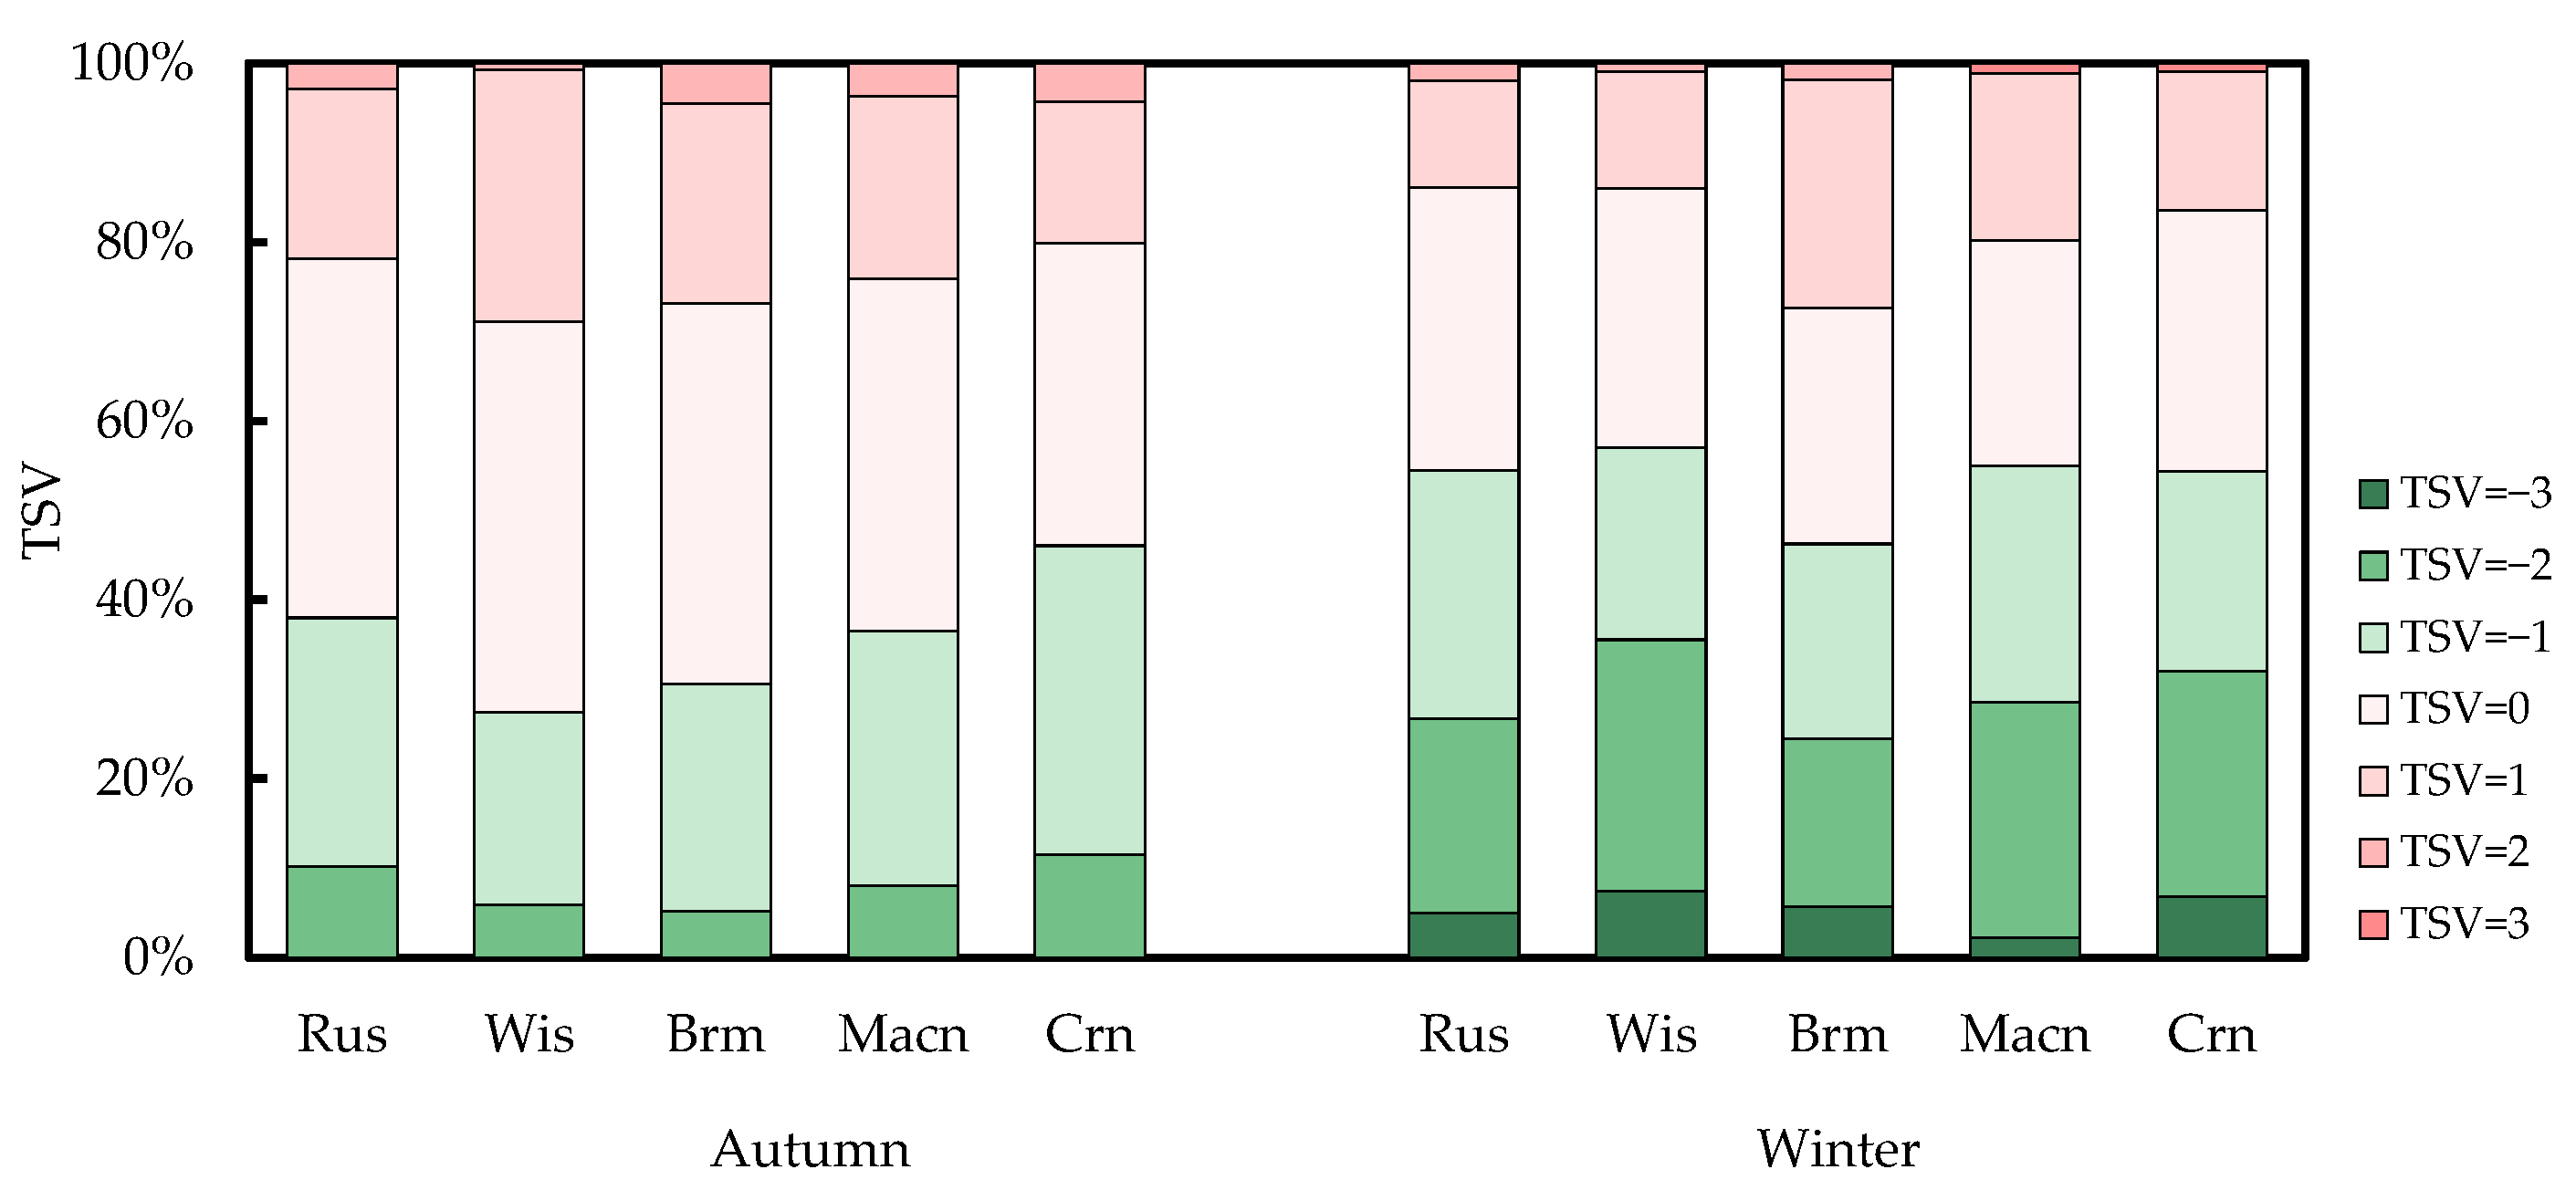
3.4.1. Thermal Sensation at Different STPs

The TSV distributions at different STPs were similar in autumn and winter. In autumn, the proportions of “TSV = 0” in broadcasting music, running water and birdsong, wind (a gentle breeze) and insects, crowds, and machines were similar. In winter, the proportions of “TSV = −2” (25.71%) and “TSV = −3” (5.71%) in wind (a gentle breeze) and insects were the highest. This revealed that people preferred the colder TSV with wind (a gentle breeze) and insects (Figure 6).

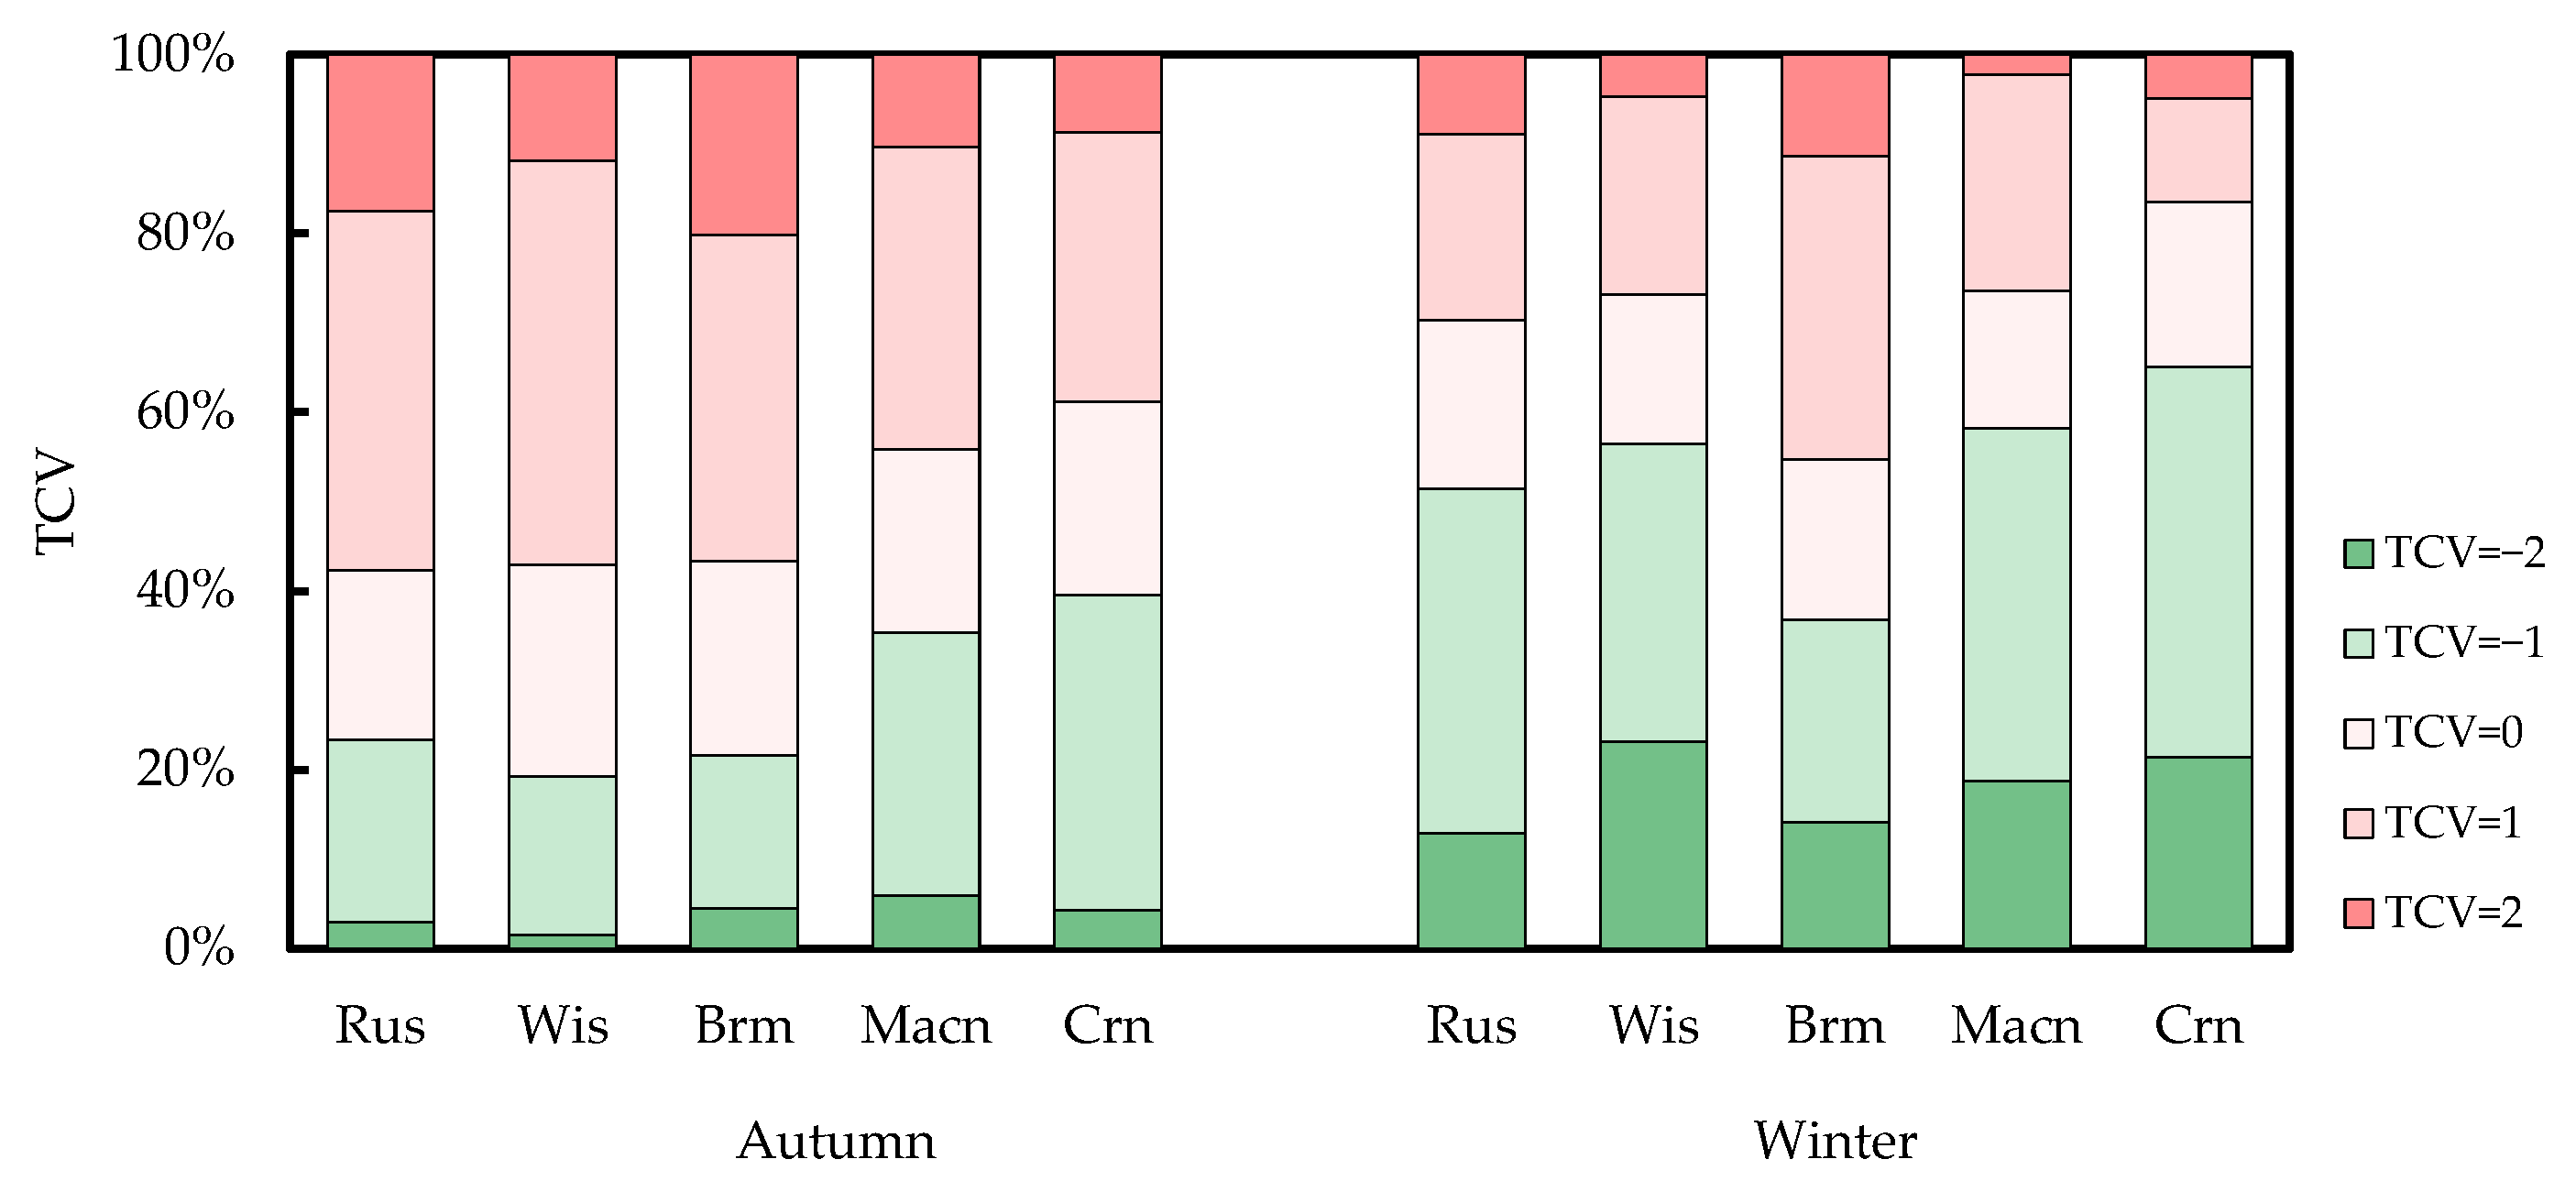
3.4.2. Thermal Comfort at Different STPs

We calculated the percentages of TCVs at different levels in the total number of votes at different STPs. In autumn, TCVs for “discomfort” (TCV = −2, −1) were relatively high with machines (35.3%) and crowds (39.6%). The TCVs for “comfort” (TCV = 1, 2) with running water and birdsong (57.7%), wind (a gentle breeze) and insects (57.0%), and broadcasting music (56.7%) exceeded 50% and were basically equal, indicating the high thermal comfort of respondents. In winter, the TCVs for “discomfort” at different STPs were higher than that in autumn, which might be related to the meteorological environment in winter. The percentage of TCVs for “discomfort” was the highest with crowds (65.0%), but the percentage of TCVs for “comfort” was the highest with broadcasting music (45.3%). In autumn and winter, the respondents reported high thermal comfort with broadcasting music, but low with machines and crowd noise (Figure 7). This may be because different STPs caused different acoustic comfort, thus influencing the respondents’ thermal comfort.

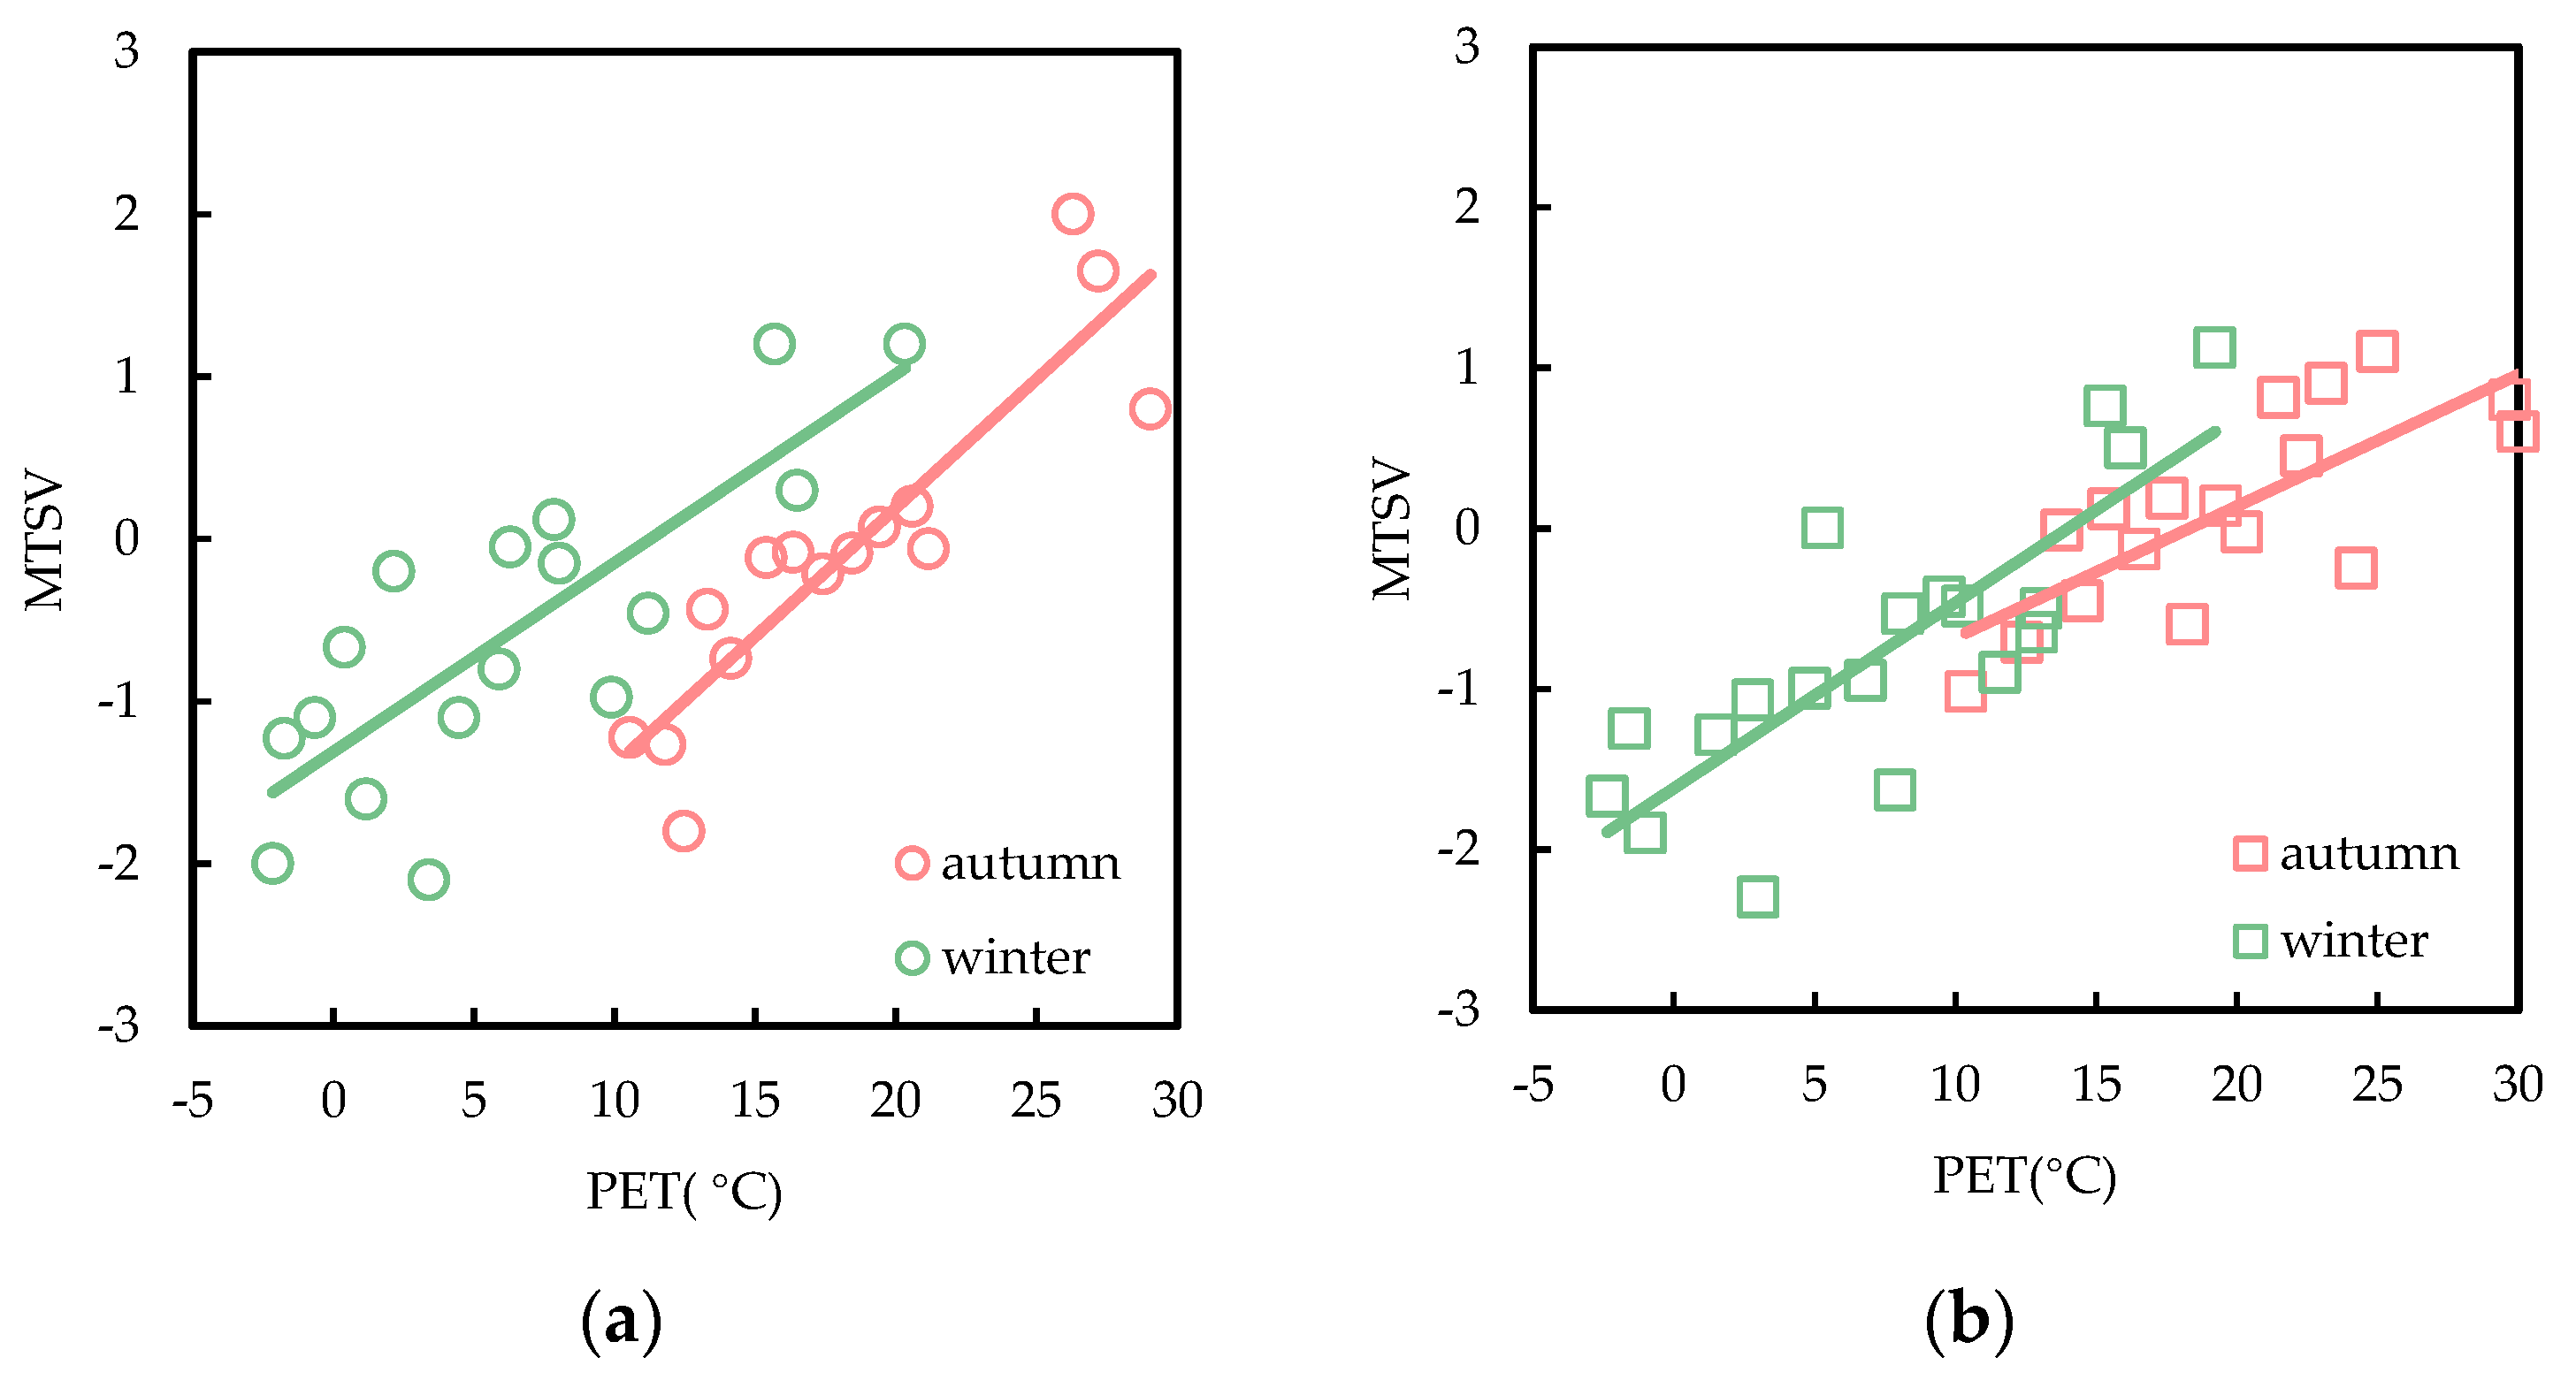
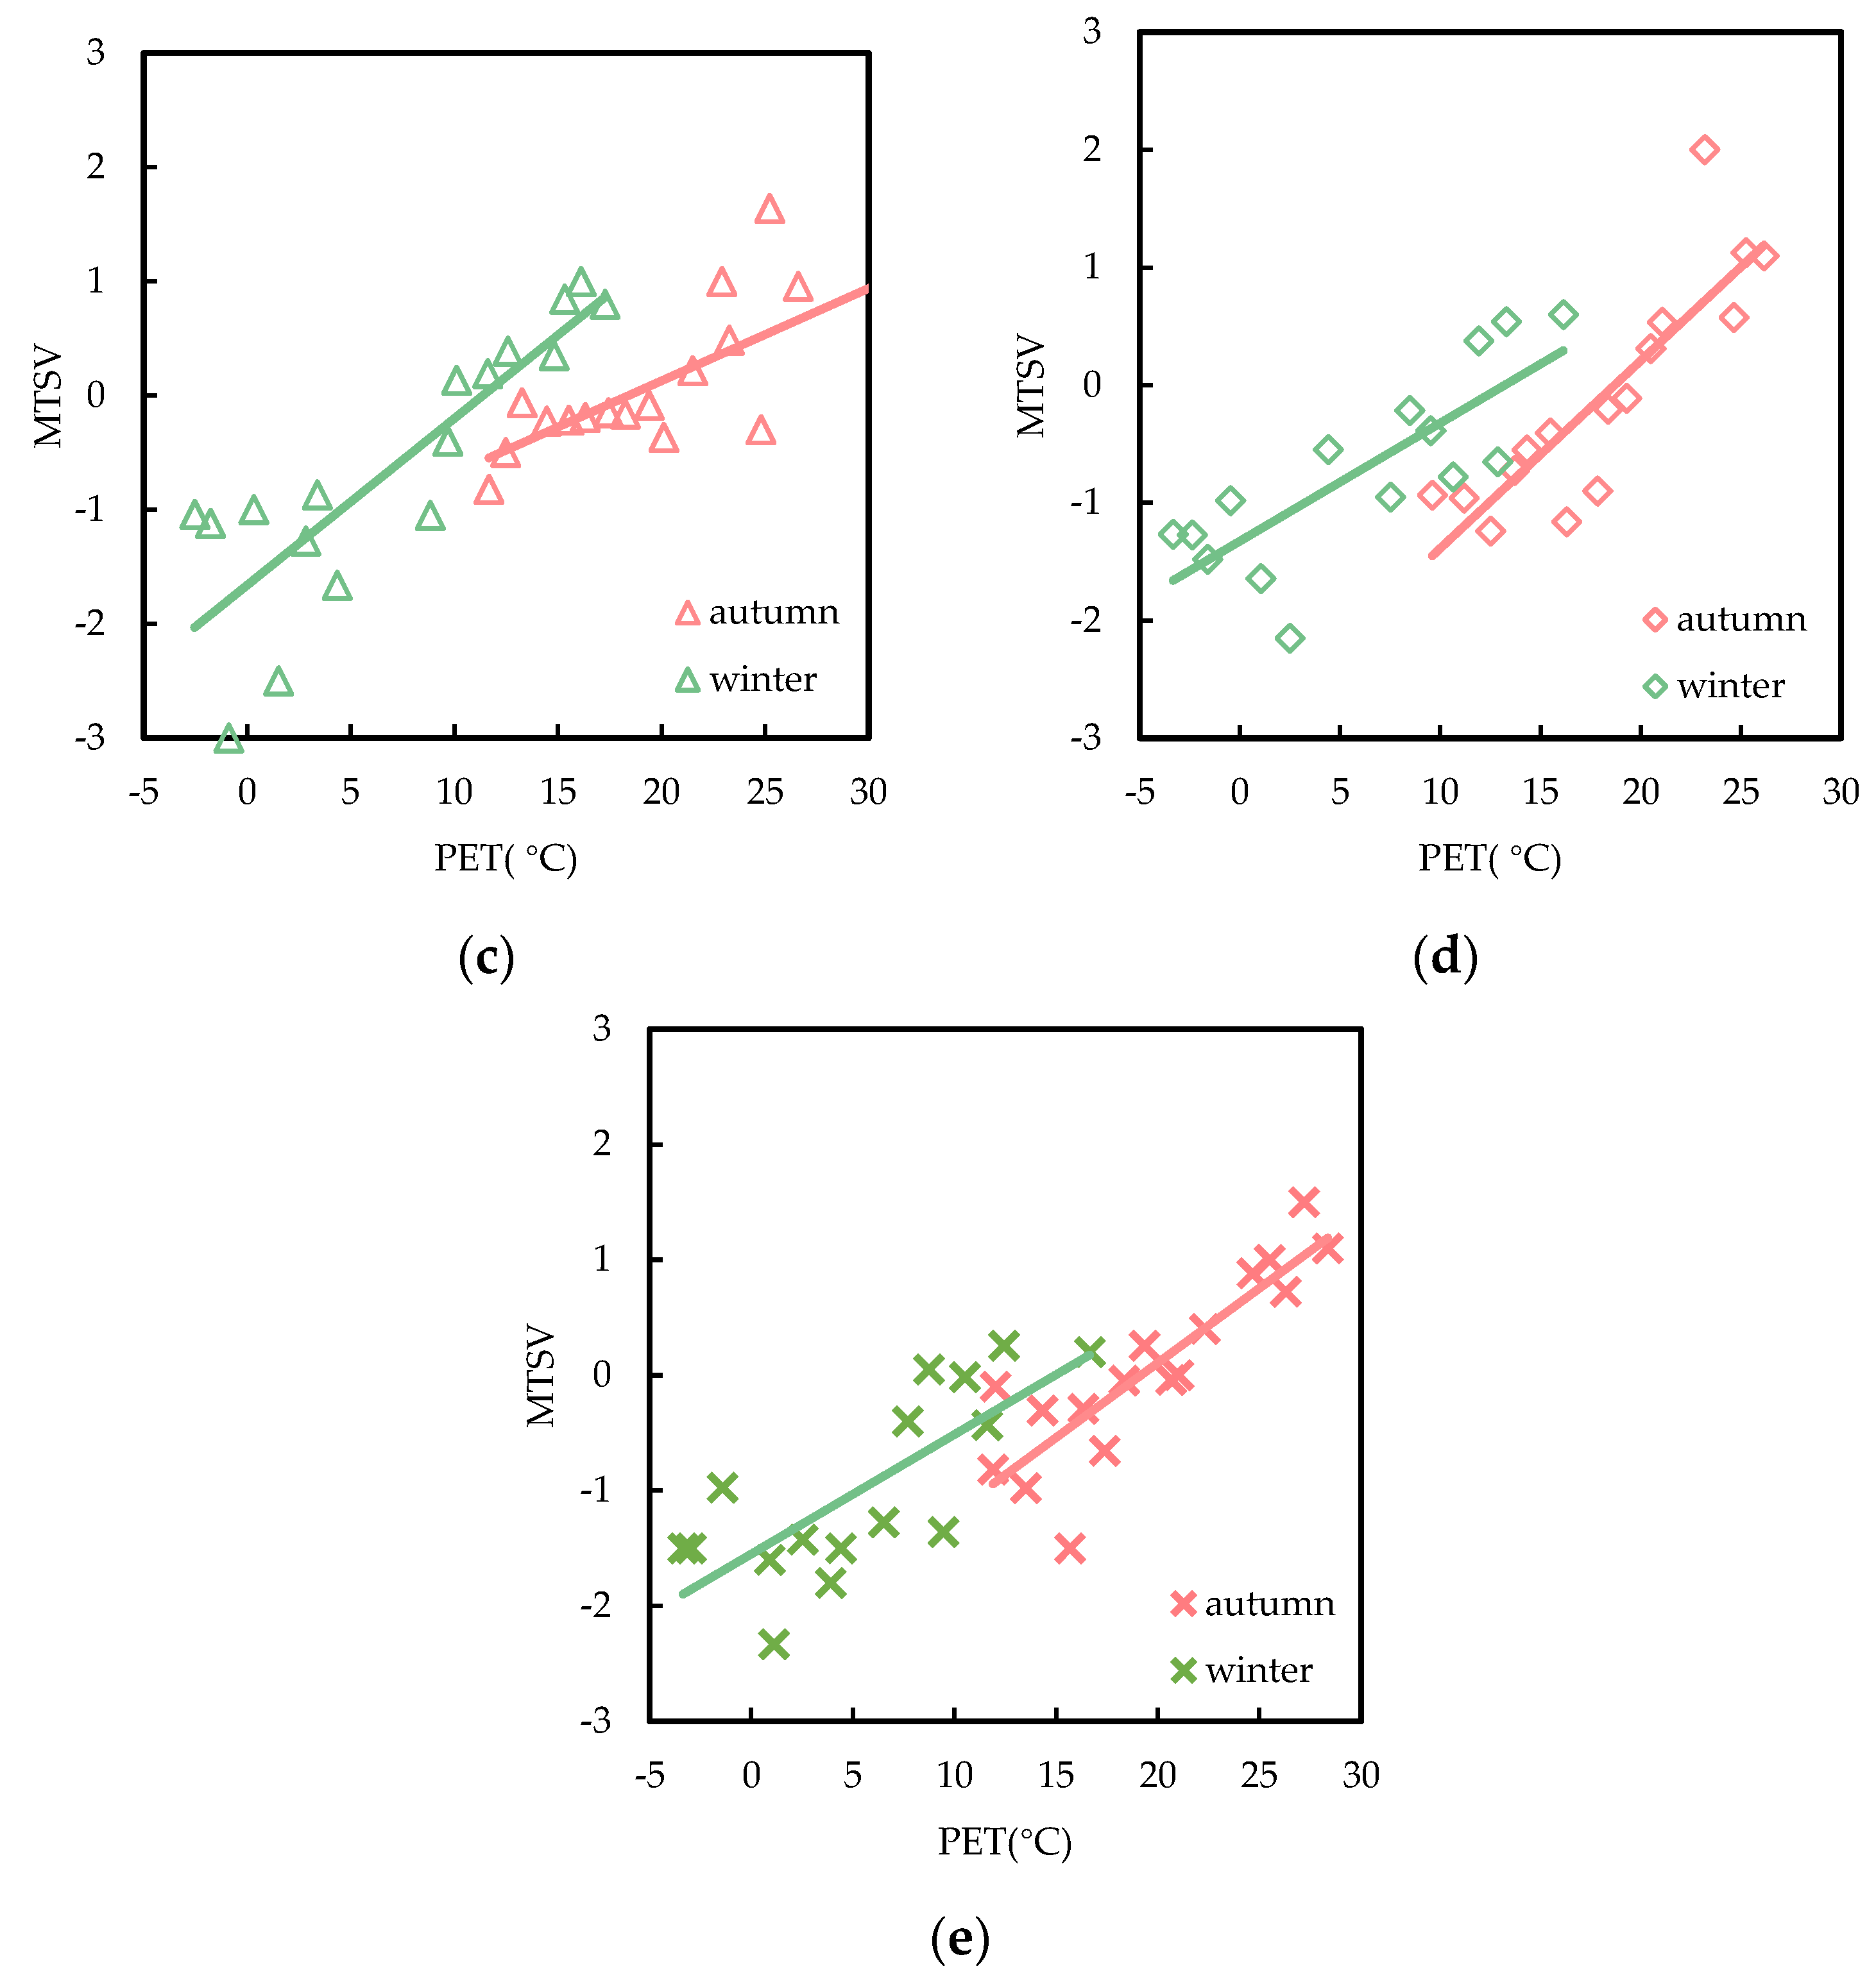
3.4.3. NPET at Different STPs

We calculated the weighted mean TSV for every 1 °C bin of PETs at different STPs in autumn and winter. NPETs at different STPs in autumn and winter were compared. In autumn, machines > running water and birdsong > crowds > broadcasting music > wind (a gentle breeze) and insects. In winter, machines > wind (a gentle breeze) and insects > crowds > broadcasting music > running water and birdsong. The NPETs with machines were the highest both in autumn and winter, accompanied by a higher TSV compared to those at other STPs. The influence of STP on thermal sensation had no significant patterns in autumn. The influences of STP on thermal sensation in winter were more significant compared to those in autumn (Figure 8, Table 5).

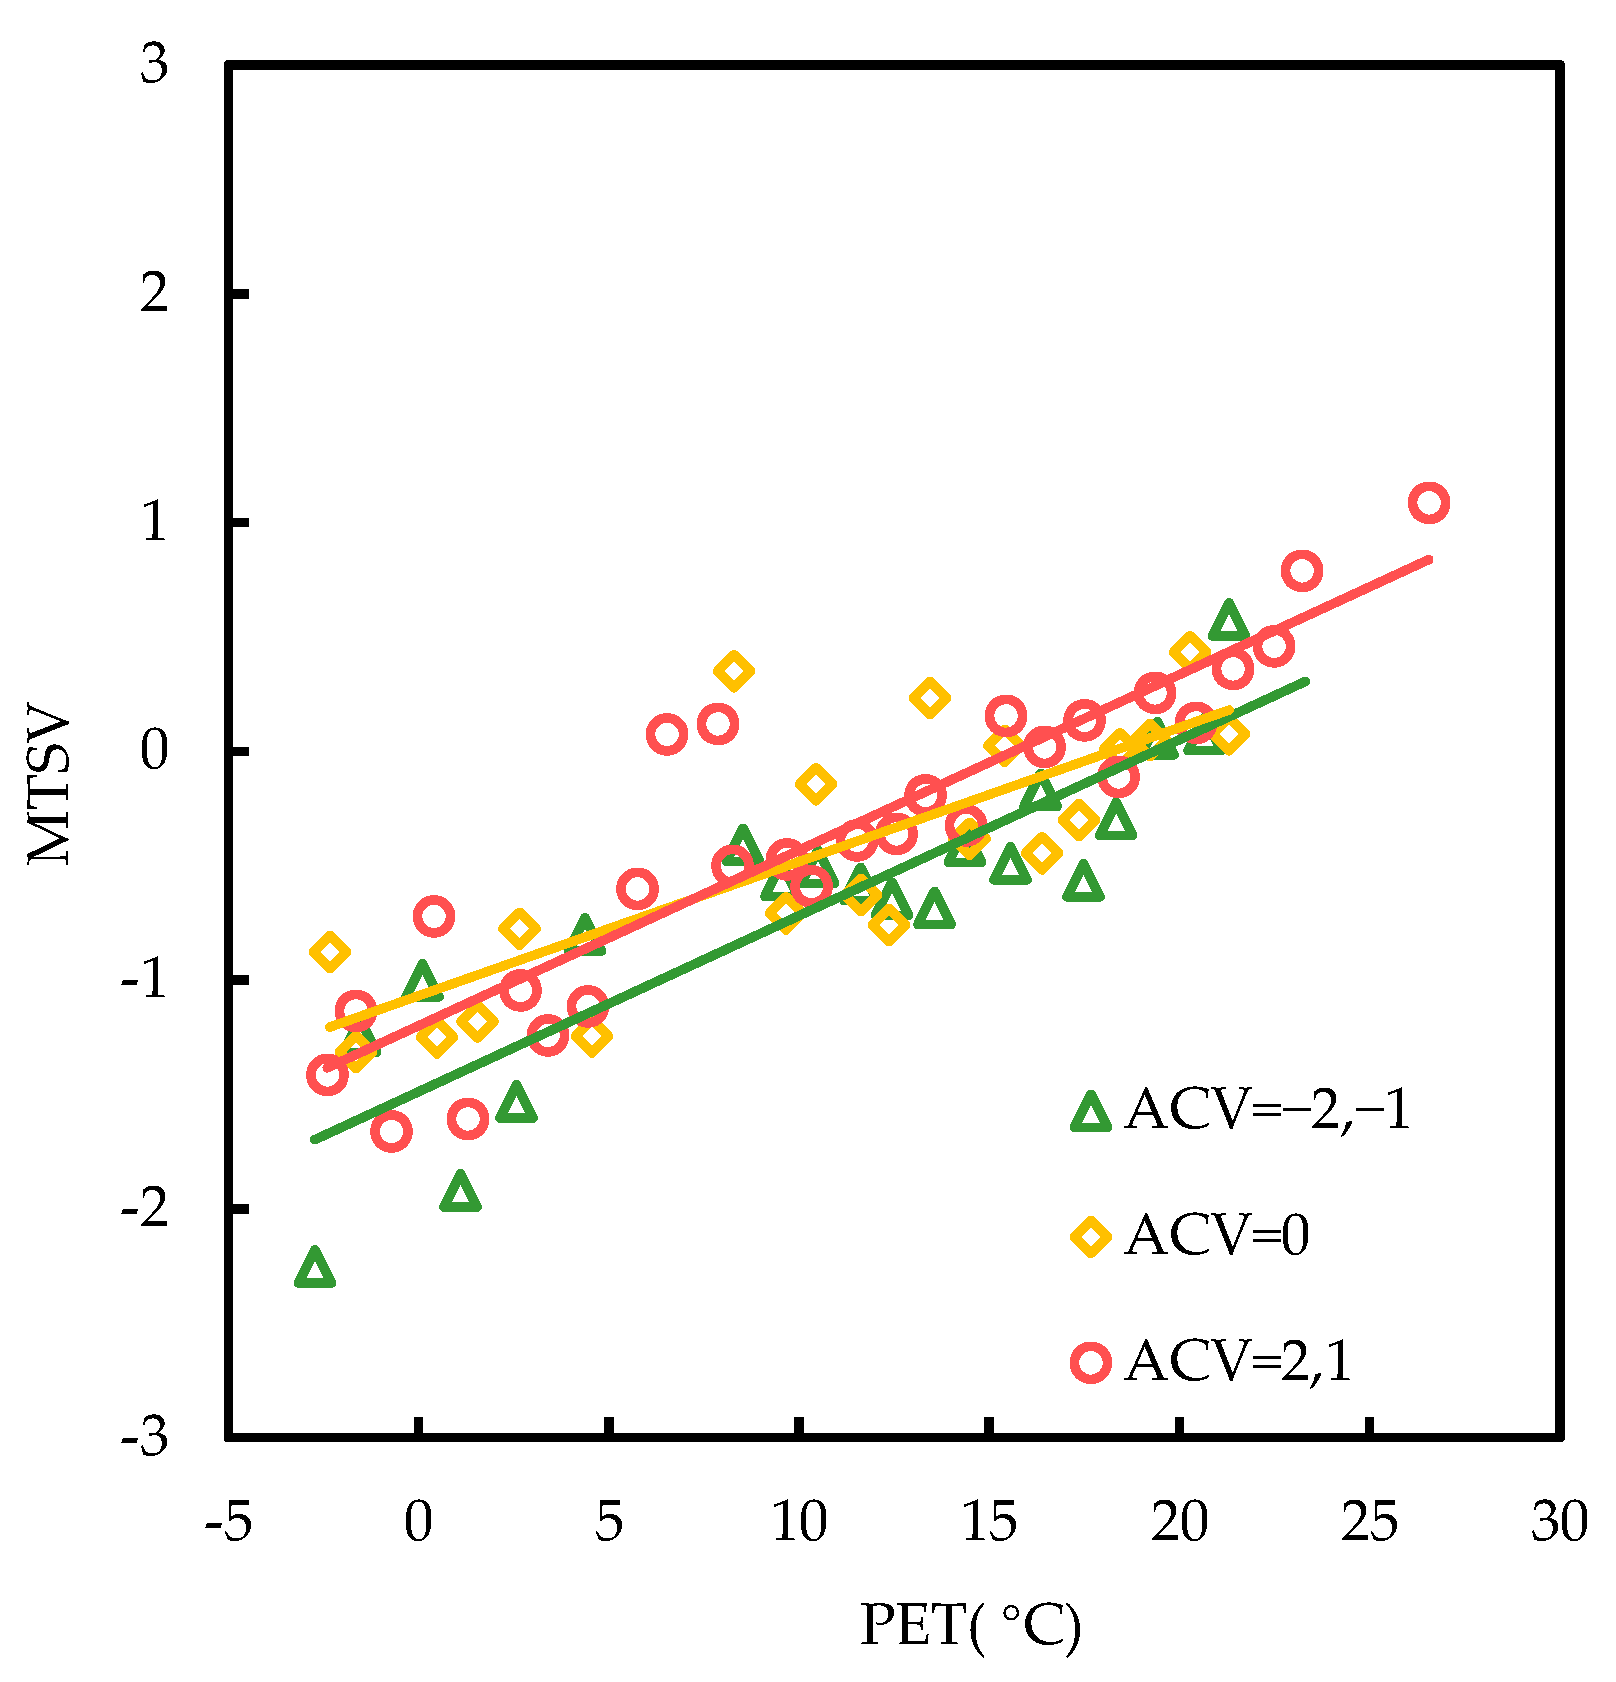
3.4.4. NPET at Different ACV Levels

The relationship between PET and MTSV with different acoustic comfort levels was calculated and fitted linearly (Figure 9). With different ACV levels, the relationship between PET and MTSV was:
ACV = 1, 2 (comfort level)  MTSV = 0.0769 PET − 1.4875 (R2 = 0.7787)
ACV = 0 (moderate level)  MTSV = 0.0586 PET − 1.068 (R2 = 0.6195)
ACV = −2, −1 (discomfort level)  MTSV = 0.0767 PET − 1.1989 (R2 = 0.823)
The NPET at corresponding ACV levels were calculated: NPETcomfort = 15.6 °C, NPETmoderate = 18.2 °C, and NPETdiscomfort = 19.3 °C. It shows an order of NPETcomfort ≤ NPETmoderate < NPETdiscomfort. The TSV was low in autumn and winter when the sound was uncomfortable. The TSV was high with acoustic comfort, but the respondents’ thermal sensation was lower when the sound was uncomfortable.

4. Discussion

4.1. Thermal Perception

We found no significant difference in the TSVs among different STPs, but a significant difference in TCVs. This result agrees with Guan’s study [89]. Some studies found that noise did not affect the cold sensations, but it affected thermal comfort and discomfort [90]. People were more sensitive to the perception of noise in hot environments [91]. The respondents’ TCVs were higher with broadcasting music, wind (a gentle breeze) and insects, and running water and birdsong compared to other STPs. With crowd and machine noises, the TCVs were relatively low, intensifying the respondents’ thermal discomfort. Yang and Moon found that sound types had significant effects on TCVs, ACVs, and OCVs [92,93]. Generally, TCVs were higher with acoustic comfort, but it was worse when acoustic discomfort was reported. Overall comfort is influenced by the interaction of SPL and Ta. Thermal, acoustic, and total comforts in a musical environment were all better than in a noisy environment [89]. This is similar to our results. Our experiments were conducted in autumn and winter, when a low Ta reduced the sensitivity of the respondents’ sound perception, resulting in differences in TSVs between sound types but not significantly. The TCVs in different sound types are not affected by temperature. A comfortable acoustic environment increases positive emotions, thus improving their thermal comfort.

4.2. Acoustic Perception

There were significant differences among STPs in terms of acoustic perception, acoustic comfort, and acoustic acceptability even though the SPL was similar among trials. Broadcasting music, running water and birdsong, and wind (a gentle breeze) and insects can make respondents feel more pleasant, thus receiving higher scores on acoustic evaluation. However, crowd and machine noises are viewed as too loud and unpleasant, thus resulting in low scores on acoustic evaluation. When experiencing a pleasant sound, the overall preference for the acoustic environment was higher [94]. People like street music, tramcar sounds, and birdsong. Residents living in rural areas prefer natural sounds and rhythms and reported a neutral attitude toward livestock sounds and communication sounds, but strongly disliked noises from traffic and machines [95]. Similar results are found in this study.
Independent sample t-tests were conducted on male and female subjects’ sound and thermal evaluations. The results showed there were no significant differences between gender on ASVs, ACVs, and TCVs, but significant differences were found in TSVs. This agrees with the conclusions of Yang and Kang’s study [68]. Additionally, analysis of the respondents’ TSVs under different STPs showed that male subjects that perceived ‘moderate’ (TSV = 0) were more than that of female subjects, while female subjects were more sensitive to thermal stress under the same sound stimuli during autumn and winter.

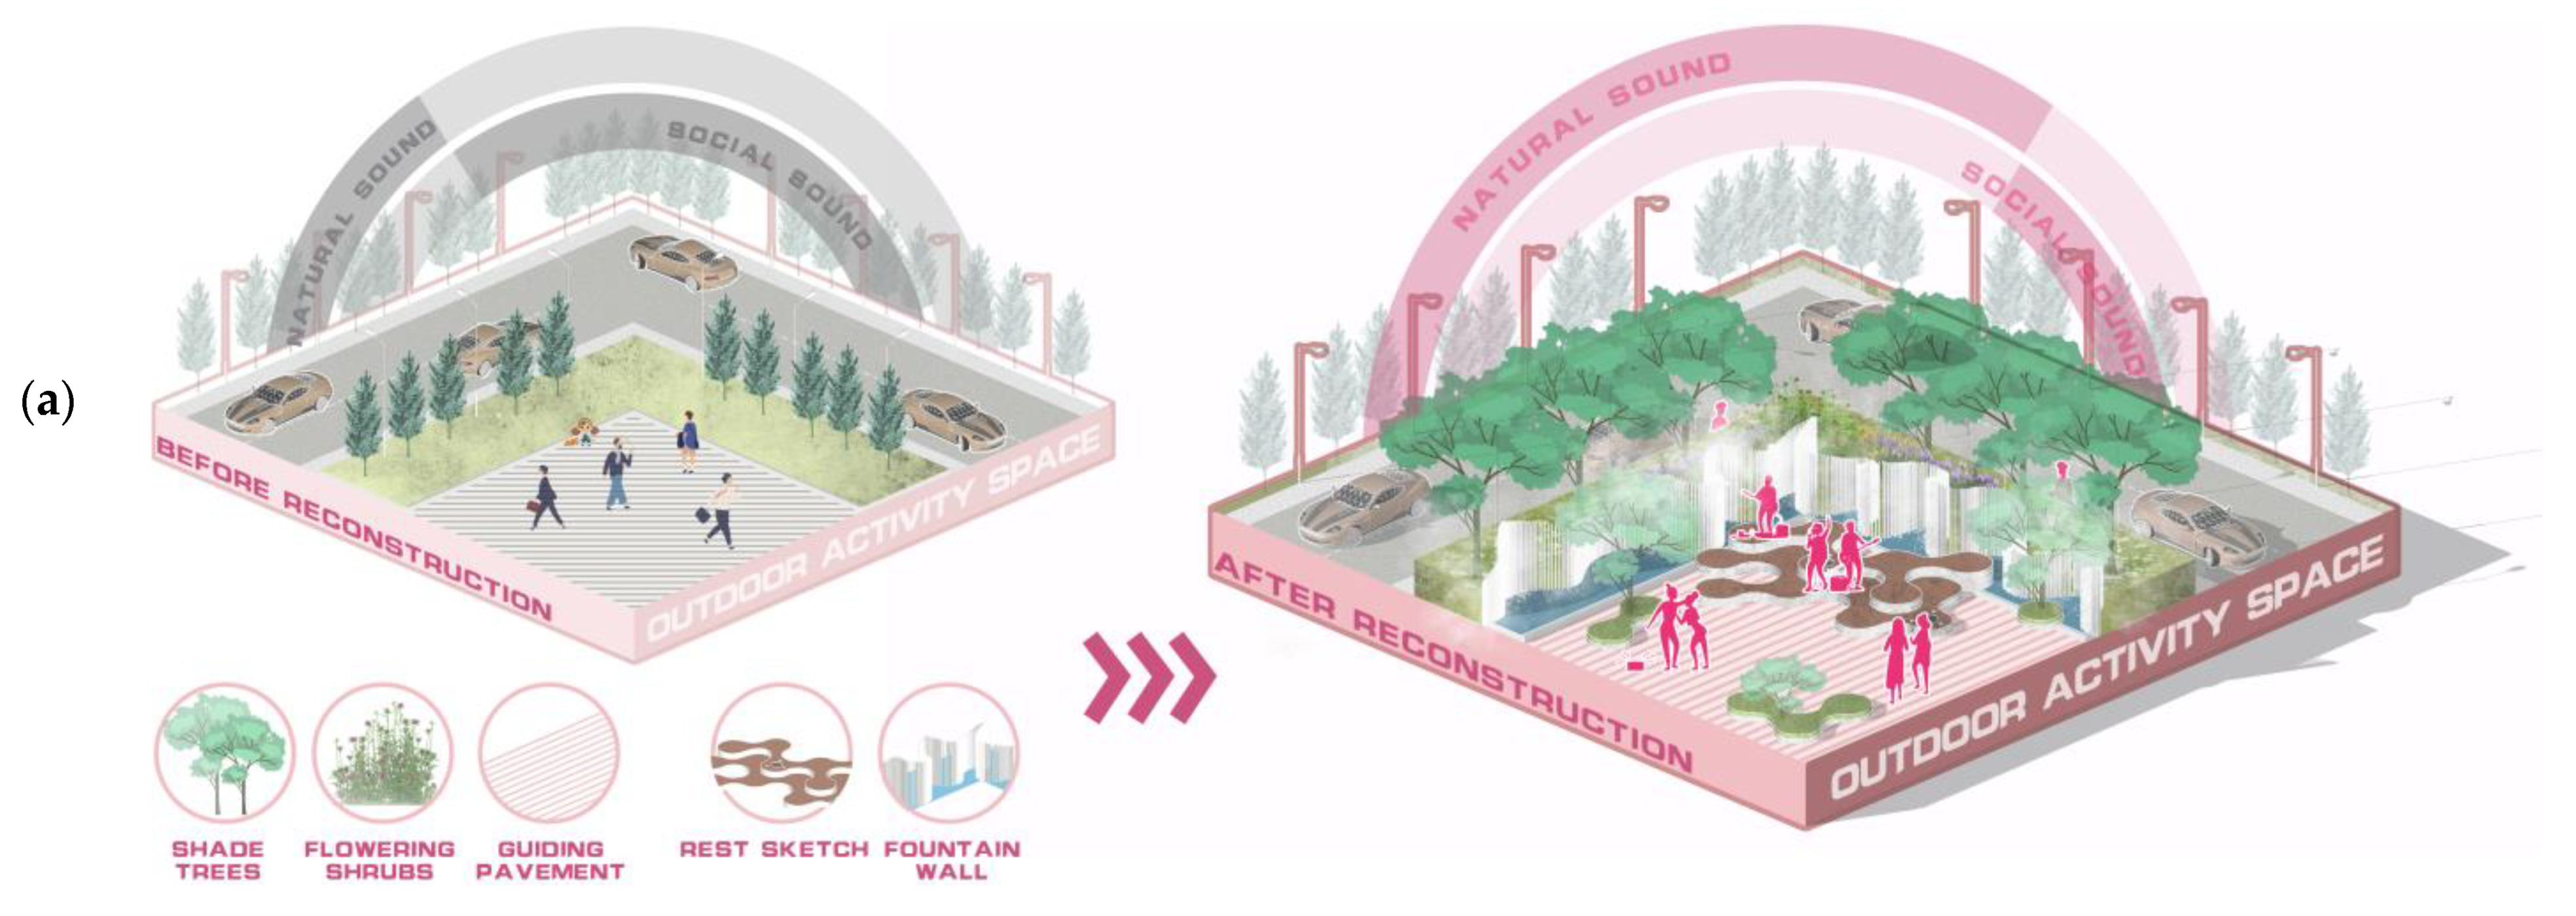
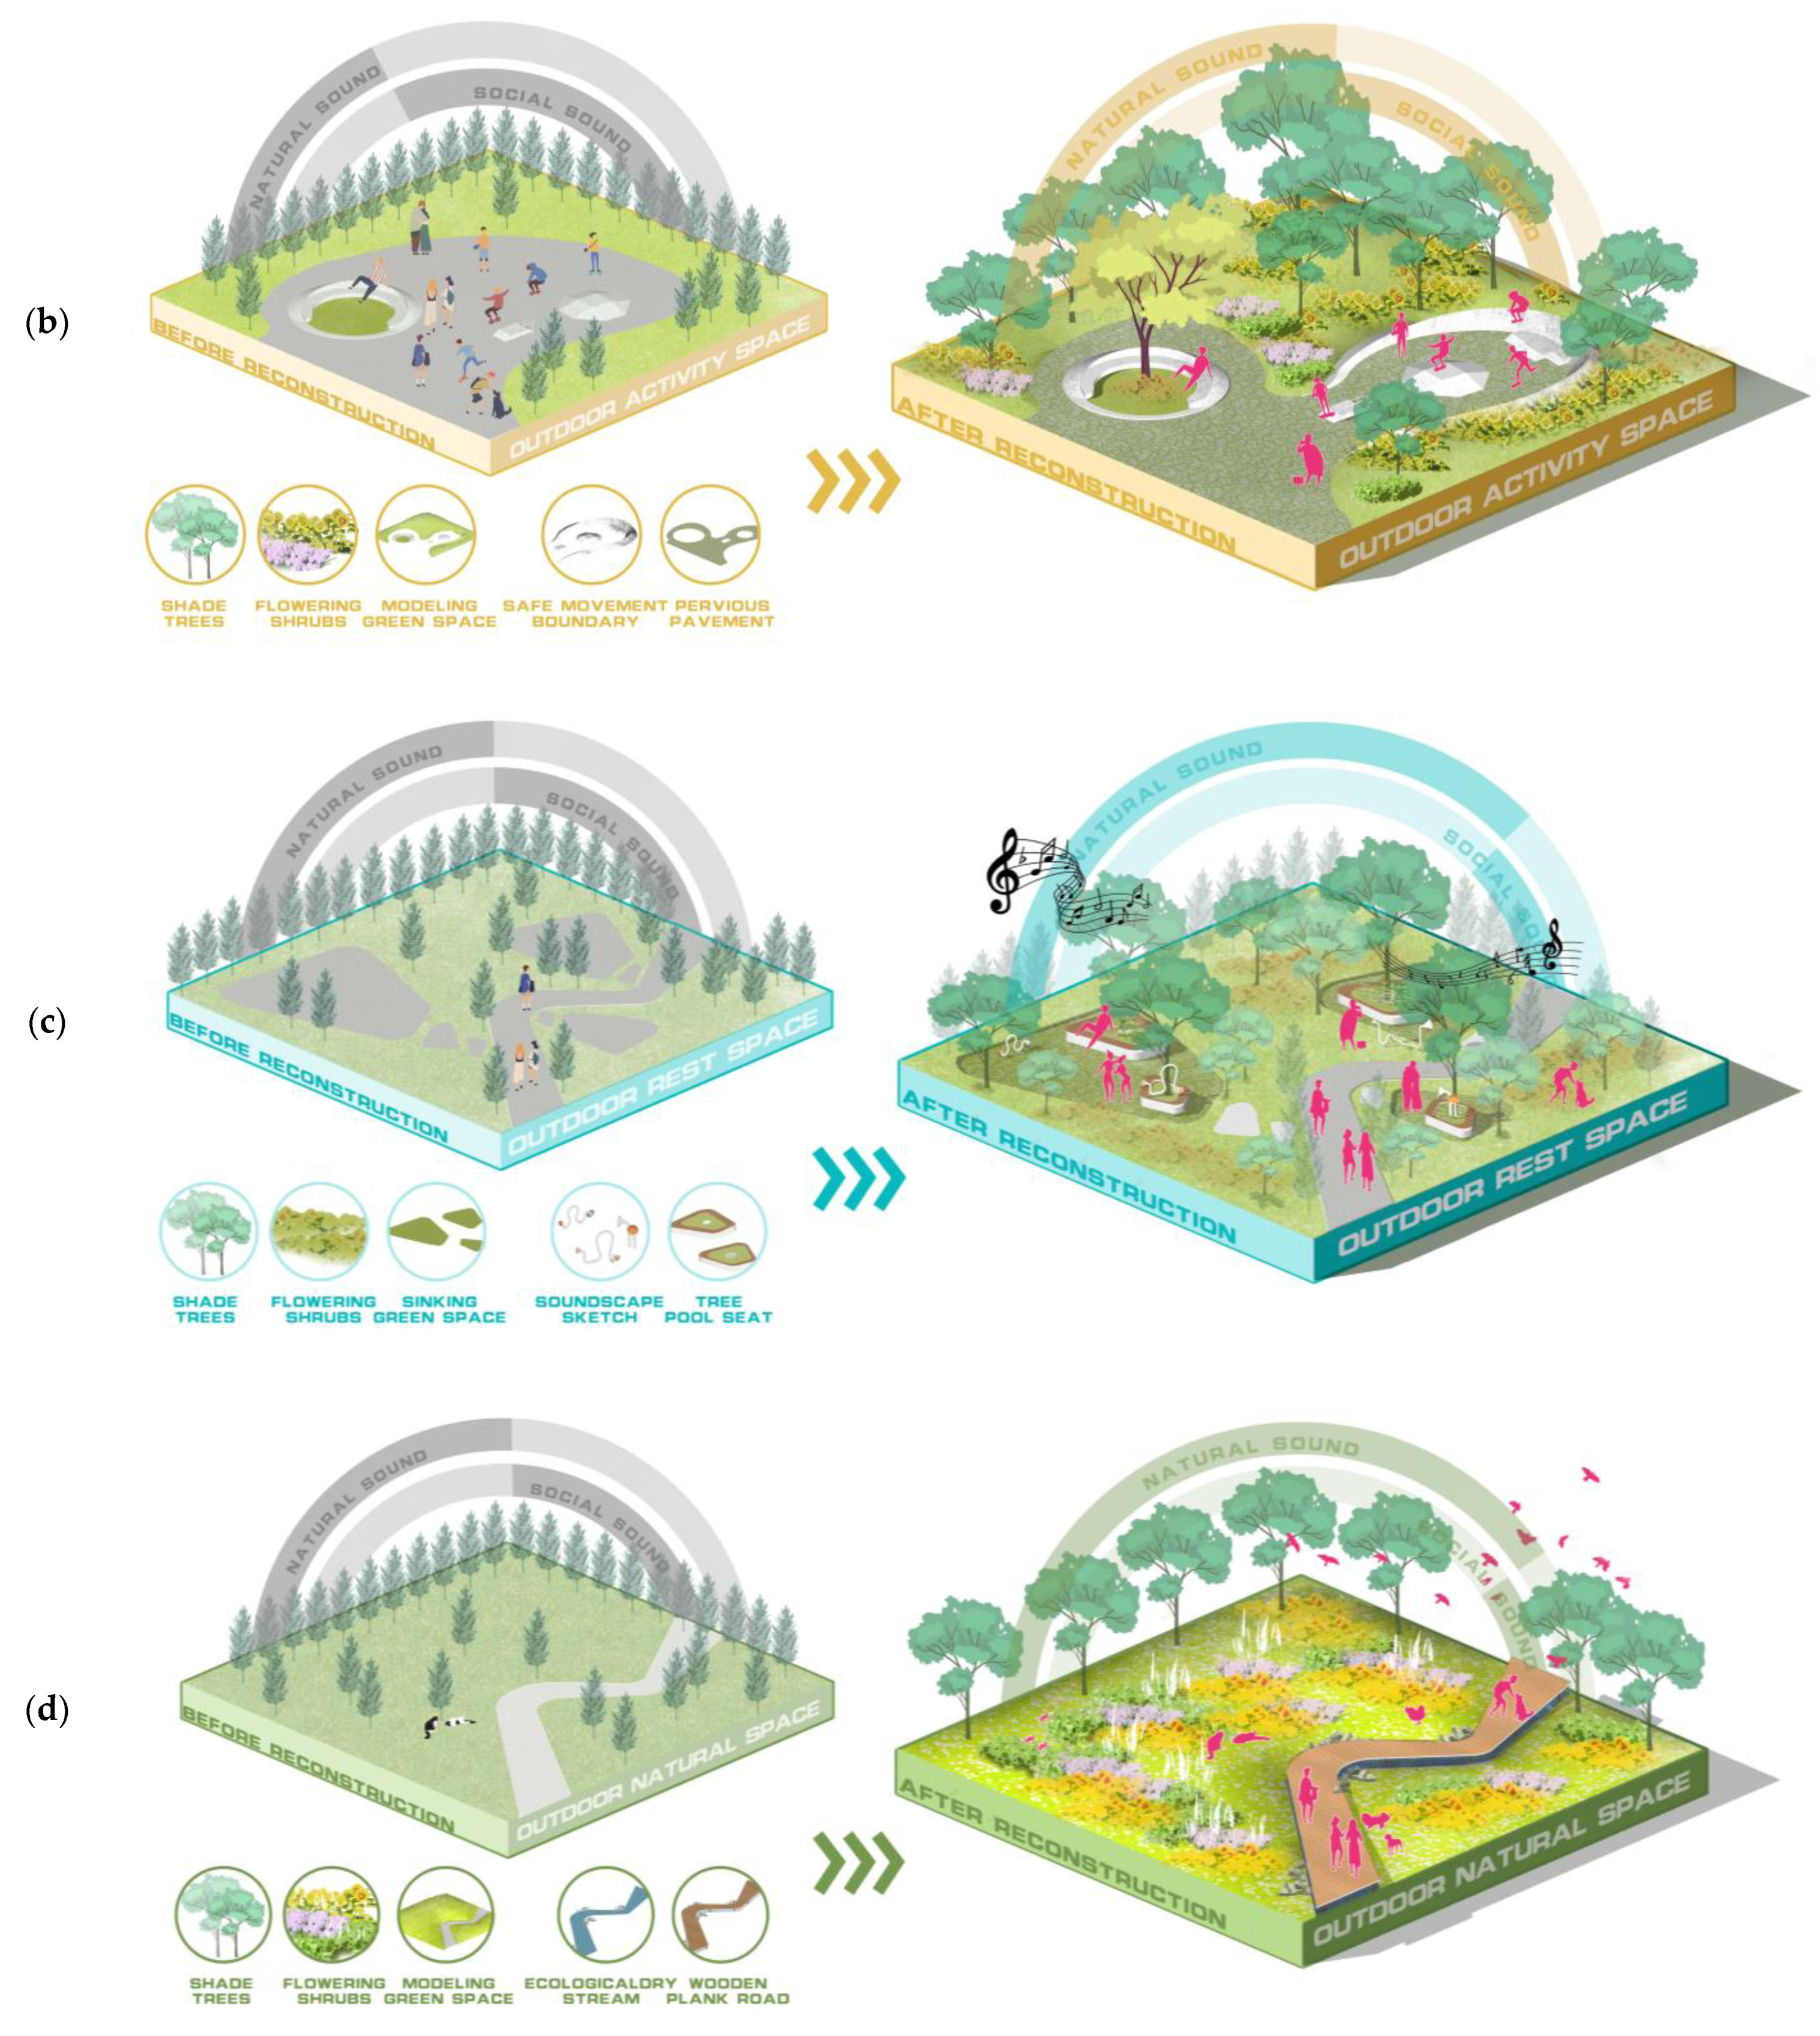
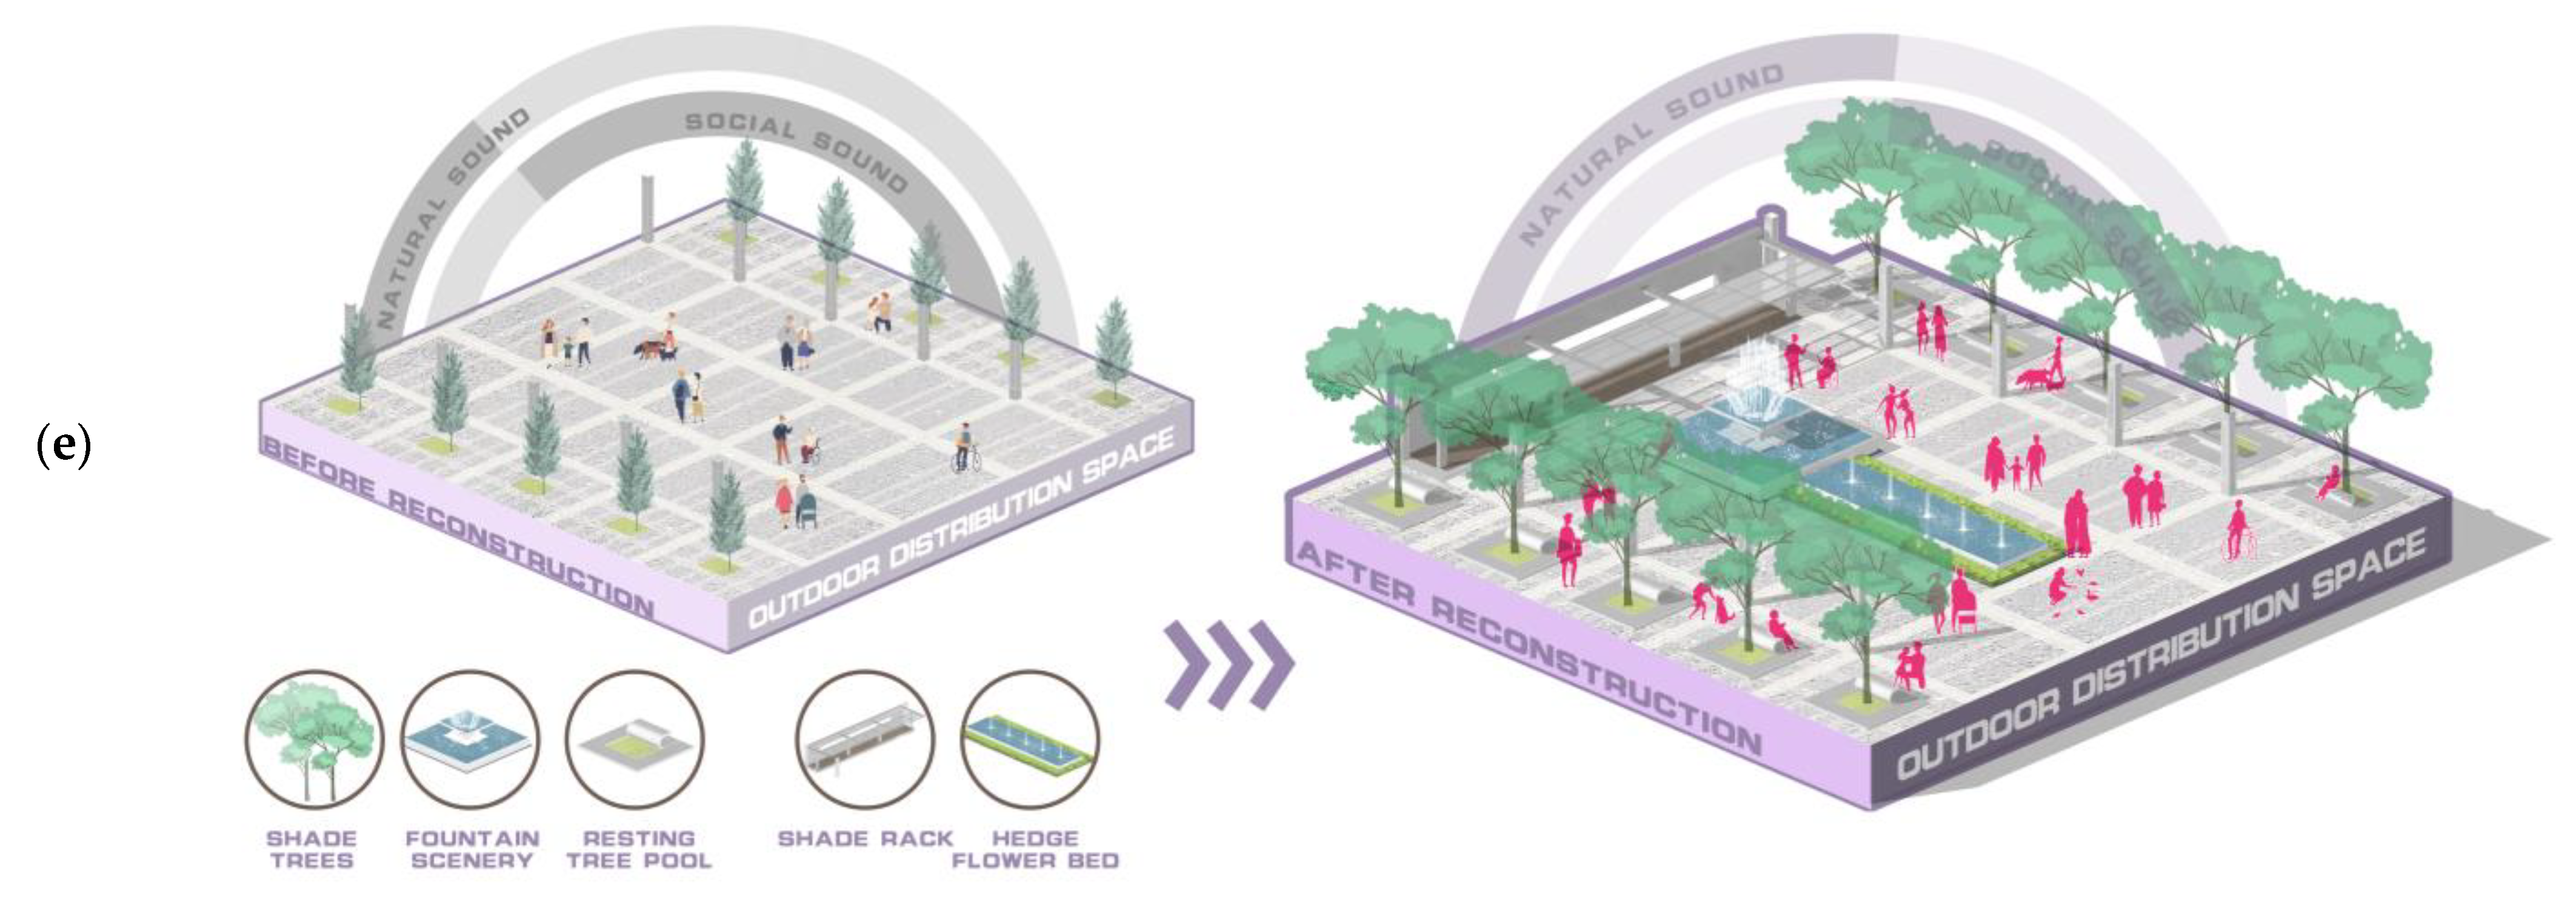
4.3. Strategies Based on Thermal–Acoustic Effects

Based on our results, optimal design strategies to improve outdoor comfortable perceptions using the combined effect of acoustic–thermal comfort were proposed. Machine noises may decrease acoustic and thermal comfort while running water and birdsong have positive effects on the acoustic environment. In an activity space with external noise disturbances, a design with a fountain background wall, tall trees that attract birds, and a large canopy will decrease acoustic discomfort (Figure 10a). In an activity space with few external noises, uneven green land, safety exercise boundaries, and vegetation can be designed to separate activity and rest zones and dampen crowd noise influences (Figure 10b). Soundscape sketches can be designed in outdoor rest spaces. We suggest increasing the duration and frequency of broadcasting music, designing sunken spaces and tree pool chairs, enclosed by flowering shrubs, and creating quiet and comfortable outdoor rest spaces (Figure 10c). Outdoor natural space provides appropriate habitats for animals like insects and birds by providing an appropriate plant community. We suggest designing an ecological drought stream or rainwater garden and increasing wind (a gentle breeze) and insects and running water and birdsong sounds (Figure 10d). Squares should consider designing foundations, pools, flower beds, corridors, and other landscape elements, planting trees with large crowns and deed shade, playing pleasant music, and improving the overall outdoor comfort and satisfaction of teachers and students (Figure 10e).
A good acoustic–thermal environment can also provide a satisfactory landscape experience for atypical persons. In our design strategy, playing pleasant music can soothe atypical people and have a positive impact, which is similar to what we often call music therapy, where a good mood will enhance the perceptual evaluation (including acoustic–thermal perception); adding natural sounds by improving the natural environment, which is beneficial for the health and therapeutic effects of atypical people; and lower noise levels in open spaces can reduce the stress of atypical people and avoid stress levels.

4.4. Limitations

This study has some limitations. First, we investigated the influences of STPs on acoustic and thermal perception with a fixed SPL. Future studies should explore the influences of STPs on acoustic and thermal perception with different SPLs. Second, our study was conducted in the cold and transition seasons. An experiment may well come to different conclusions with a high Ta in summer. Third, the respondents were exposed to recording sounds from speakers rather than the real sound environment, which may have led to different findings, and the role of the acoustic–thermal interaction in real scenarios should be further investigated in future studies. Fourth, we recruited healthy students for our experiment, but there are also atypical populations on campus, such as depressed and hearing-impaired people, who perceive the environment differently from healthy people. Therefore, future research should further investigate how the acoustic–thermal environment affects the perception of atypical populations.

5. Conclusions

In this study, five typical open spaces with five common STPs (broadcasting music, running water and birdsong, wind (a gentle breeze) and insects, crowds, and machines) on a campus in China’s cold region were tested. The acoustic perception in each space is evaluated as eventful, exciting, pleasant, calm, uneventful, monotonous, annoying, and chaotic, during which PET is selected as a thermal index to evaluate OTC. The relationship between acoustic perception and thermal comfort among open spaces during autumn and winter was analyzed. Some major conclusions are drawn:
  • There are significant differences among STPs in terms of acoustic perception and comfort and acoustic acceptability even though the SPLs are controlled. Broadcasting music, running water and birdsong, and wind (a gentle breeze) and insects make respondents feel more pleasant and acceptable, while crowds and machines are too loud and unpleasant.
  • The respondents’ thermal comfort is related to STPs. Different STPs influence people’s acoustic comfort, thus influencing their thermal comfort. With natural sounds (running water and birdsong) and meaningful sound (broadcasting), people experience higher thermal comfort. In autumn, the thermal comfort order with different STPs is: wind (a gentle breeze) and insects > running water and birdsong > broadcasting music > machines > crowds. In winter, this order is: broadcasting music > wind (a gentle breeze) and insects > running water and birdsong > machines > crowds.
  • The NPET is different for different STPs. In autumn, the NPET of machines, running water and birdsong, crowds, broadcasting music, and wind (a gentle breeze) and insects is 19.184 °C, 19.181 °C, 18.70 °C, 17.92 °C, and 17.56 °C, respectively. In winter, the NPET of machines, wind (a gentle breeze) and insects, crowds, broadcasting music, and running water and birdsong is 14.95 °C, 14.00 °C, 13.21 °C, 11.38 °C, and 11.26 °C, respectively. The NPET with machines is the highest in autumn and winter. People perceived high thermal sensation when they are acoustically comfortable, but low thermal sensation when in acoustic discomfort.

Author Contributions

H.C.: Investigation, Data curation, Writing—Original draft preparation. B.H.: Conceptualization, Methodology, Writing—Reviewing and Editing, Supervision. H.Q.: Investigation, Resources. Y.G.: Investigation, Data curation. M.S.: Investigation, Data curation. All authors have read and agreed to the published version of the manuscript.

Funding

This research was funded by the National Natural Science Foundation of China (grant number 51708451).

Institutional Review Board Statement

Not applicable.

Informed Consent Statement

Not applicable.

Data Availability Statement

The data presented in this study are available on request from the corresponding author upon reasonable request.

Conflicts of Interest

The authors declare no conflict of interest.

Nomenclature

PGPeony garden
CSCampus square
WAWooded area
EGEcological garden
PSPatio space
BrmBroadcasting music
RusRunning water and birdsong
WisWind (a gentle breeze) and insects
CrnCrowds
MacnMachines
SVFSky view factor
ASVAcoustic sensation vote
ACVAcoustic comfort vote
TSVThermal sensation vote
TCVThermal comfort vote
PETPhysiological equivalent temperature
NPETNeutral PET
STPSound type
LeqSound pressure level
TaAir temperature (°C)
RHRelative humidity (%)
VaWind speed (m/s)
TgGlobe temperature (°C)
TmrtMean radiant temperature (°C)
GGlobal radiation (W/m2)

References

  1. Zijlema, W.L.; Triguero-Mas, M.; Smith, G.; Cirach, M.; Martinez, D.; Dadvand, P.; Gascon, M.; Jones, M.; Gidlow, C.; Hurst, G.; et al. The relationship between natural outdoor environments and cognitive functioning and its mediators. Environ. Res. 2017, 155, 268–275. [Google Scholar] [CrossRef] [PubMed]
  2. Gulwadi, G.B.; Mishchenko, E.D.; Hallowell, G.; Alves, S.; Kennedy, M. The restorative potential of a university campus: Objective greenness and student perceptions in Turkey and the United States. Landsc. Urban Plan. 2019, 187, 36–46. [Google Scholar] [CrossRef]
  3. Li, D.; Sullivan, W.C. Impact of views to school landscapes on recovery from stress and mental fatigue. Landsc. Urban Plan. 2016, 148, 149–158. [Google Scholar] [CrossRef]
  4. Lai, D.; Chen, B.; Liu, K. Quantification of the influence of thermal comfort and life patterns on outdoor space activities. Build. Simul. 2020, 13, 113–125. [Google Scholar] [CrossRef]
  5. Kang, J.; Yang, W. Soundscape in urban open public spaces. World Archit. 2002, 144, 76–79. [Google Scholar]
  6. Kang, J.; Aletta, F.; Gjestland, T.T.; Brown, L.A.; Botteldooren, D.; Schulte-Fortkamp, B.; Lercher, P.; van Kamp, I.; Genuit, K.; Fiebig, A.; et al. Ten questions on the soundscapes of the built environment. Build. Environ. 2016, 108, 284–294. [Google Scholar] [CrossRef]
  7. Shield, B.; Conetta, R.; Dockrell, J.; Connolly, D.; Cox, T.; Mydlarz, C. A survey of acoustic conditions and noise levels in secondary school classrooms in England. J. Acoust. Soc. Am. 2015, 137, 177–188. [Google Scholar] [CrossRef]
  8. Van Kamp, I.; Klaeboe, R.; Kruize, H.; Brown, A.L.; Lercher, P. Soundscapes, human restoration and quality of life, INTER-NOISE and NOISE-CON congress and conference proceedings. Inst. Noise Control Eng. 2016, 253, 1205–1215. [Google Scholar]
  9. Chen, L.; Ng, E. Outdoor thermal comfort and outdoor activities: A review of research in the past decade. Cities 2012, 29, 118–125. [Google Scholar] [CrossRef]
  10. Liu, W.; Zhang, Y.; Deng, Q. The effects of urban microclimate on outdoor thermal sensation and neutral temperature in hot-summer and cold-winter climate. Energy Build. 2016, 128, 190–197. [Google Scholar] [CrossRef]
  11. Lai, D.; Lian, Z.; Liu, W.; Guo, C.; Liu, W.; Liu, K.; Chen, Q. A comprehensive review of thermal comfort studies in urban open spaces. Sci. Total Environ. 2020, 742, 140092. [Google Scholar] [CrossRef] [PubMed]
  12. Chen, X.; Xue, P.; Liu, L.; Gao, L.; Liu, J. Outdoor thermal comfort and adaptation in severe cold area: A longitudinal survey in Harbin, China. Build. Environ. 2018, 143, 548–560. [Google Scholar] [CrossRef]
  13. Xu, M.; Hong, B.; Jiang, R.; An, L.; Zhang, T. Outdoor thermal comfort of shaded spaces in an urban park in the cold region of China. Build. Environ. 2019, 155, 408–420. [Google Scholar] [CrossRef]
  14. Yao, J.; Yang, F.; Zhuang, Z.; Shao, Y.; Yuan, P.F. The effect of personal and microclimatic variables on outdoor thermal comfort: A field study in a cold season in Lujiazui CBD, Shanghai. Sustain. Cities Soc. 2018, 39, 181–188. [Google Scholar] [CrossRef]
  15. Andrade, H.; Alcoforado, M.J.; Oliveira, S. Perception of temperature and wind by users of public outdoor spaces: Relationships with weather parameters and personal characteristics. Int. J. Biometeorol. 2011, 55, 665–680. [Google Scholar] [CrossRef] [PubMed]
  16. Nikolopoulou, M.; Lykoudis, S. Thermal comfort in outdoor urban spaces: Analysis across different European countries. Build. Environ. 2006, 41, 1455–1470. [Google Scholar] [CrossRef]
  17. Li, J.; Niu, J.; Mak, C.M.; Huang, T.; Xie, Y. Exploration of applicability of UTCI and thermally comfortable sun and wind conditions outdoors in a subtropical city of Hong Kong. Sustain. Cities Soc. 2020, 52, 101793. [Google Scholar] [CrossRef]
  18. Amindeldar, S.; Heidari, S.; Khalili, M. The effect of personal and microclimatic variables on outdoor thermal comfort: A field study in Tehran in cold season. Sustain. Cities Soc. 2017, 32, 153–159. [Google Scholar] [CrossRef]
  19. Huang, L.; Li, J.; Zhao, D.; Zhu, J. A fieldwork study on the diurnal changes of urban microclimate in four types of ground cover and urban heat island of Nanjing, China. Build. Environ. 2008, 43, 7–17. [Google Scholar] [CrossRef]
  20. Lee, Y.Y.; Md Din, M.F.; Iwao, K.; Lee, Y.H.; Anting, N. Impact of thermal behaviour of different environmental conditions on ambient environment and thermal discomfort in Malaysia. Indoor Built Environ. 2021, 30, 520–534. [Google Scholar] [CrossRef]
  21. Ghaffarianhoseini, A.; Berardi, U.; Ghaffarianhoseini, A.; Al-Obaidi, K. Analyzing the thermal comfort conditions of outdoor spaces in a university campus in Kuala Lumpur, Malaysia. Sci. Total Environ. 2019, 666, 1327–1345. [Google Scholar] [CrossRef] [PubMed]
  22. Lin, T.P.; Tsai, K.T.; Liao, C.C.; Huang, Y.C. Effects of thermal comfort and adaptation on park attendance regarding different shading levels and activity types. Build. Environ. 2013, 59, 599–611. [Google Scholar] [CrossRef]
  23. Rahman, M.A.; Hartmann, C.; Moser-Reischl, A.; von Strachwitz, M.F.; Paeth, H.; Pretzsch, H.; Pauleit, S.; Rötzer, T. Tree cooling effects and human thermal comfort under contrasting species and sites. Agric. For. Meteorol. 2020, 287, 107947. [Google Scholar] [CrossRef]
  24. Xu, X.; Sun, S.; Liu, W.; Garcia, E.H.; He, L.; Cai, Q.; Xu, S.; Wang, J.; Zhu, J. The cooling and energy saving effect of landscape design parameters of urban park in summer: A case of Beijing, China. Energy Build. 2017, 149, 91–100. [Google Scholar] [CrossRef]
  25. Mahmoud, A.H.A. Analysis of the microclimatic and human comfort conditions in an urban park in hot and arid regions. Build. Environ. 2011, 46, 2641–2656. [Google Scholar] [CrossRef]
  26. Huang, Z.; Gou, Z.; Cheng, B. An investigation of outdoor thermal environments with different ground surfaces in the hot summer-cold winter climate region. J. Build. Eng. 2020, 27, 100994. [Google Scholar] [CrossRef]
  27. Lai, D.; Zhou, X.; Chen, Q. Measurements and predictions of the skin temperature of human subjects on outdoor environment. Energy Build. 2017, 151, 476–486. [Google Scholar] [CrossRef]
  28. Niu, J.; Hong, B.; Geng, Y.; Mi, J.; He, J. Summertime physiological and thermal responses among activity levels in campus outdoor spaces in a humid subtropical city. Sci. Total Environ. 2020, 728, 138757. [Google Scholar] [CrossRef]
  29. Wang, H.; Hu, S. Experimental study on thermal sensation of people in moderate activities. Build. Environ. 2016, 100, 127–134. [Google Scholar] [CrossRef]
  30. Su, M.; Hong, B.; Su, X.; Liu, A.; Chang, J. How the nozzle density and height of mist spraying affect pedestrian outdoor thermal comfort: A field study. Build. Environ. 2022, 215, 108968. [Google Scholar] [CrossRef]
  31. Chen, X.; Xue, P.; Gao, L.; Du, J.; Liu, J. Physiological and thermal response to real-life transient conditions during winter in severe cold area. Build. Environ. 2019, 157, 284–296. [Google Scholar] [CrossRef]
  32. Zhang, Y.; Zhou, X.; Zheng, Z.; Oladokun, M.O.; Fang, Z. Experimental investigation into the effects of different metabolic rates of body movement on thermal comfort. Build. Environ. 2020, 168, 106489. [Google Scholar] [CrossRef]
  33. Wu, Y.; Liu, H.; Li, B.; Kosonen, R.; Wei, S.; Jokisalo, J.; Cheng, Y. Individual thermal comfort prediction using classification tree model based on physiological parameters and thermal history in winter. Build. Simul. 2021, 14, 1651–1665. [Google Scholar] [CrossRef]
  34. Smith, P.; Henríquez, C. Perception of thermal comfort in outdoor public spaces in the medium-sized city of Chillán, Chile, during a warm summer. Urban Clim. 2019, 30, 100525. [Google Scholar] [CrossRef]
  35. He, X.; An, L.; Hong, B.; Huang, B.; Cui, X. Cross-cultural differences in thermal comfort in campus open spaces: A longitudinal field survey in China’s cold region. Build. Environ. 2020, 172, 106739. [Google Scholar] [CrossRef]
  36. Aljawabra, F.; Nikolopoulou, M. Thermal comfort in urban spaces: A cross-cultural study in the hot arid climate. Int. J. Biometeorol. 2018, 62, 1901–1909. [Google Scholar] [CrossRef] [PubMed]
  37. Eliasson, I.; Knez, I.; Westerberg, U.; Thorsson, S.; Lindberg, F. Climate and behaviour in a Nordic city. Landsc. Urban Plan. 2007, 82, 72–84. [Google Scholar] [CrossRef]
  38. Tung, C.H.; Chen, C.P.; Tsai, K.T.; Kantor, N.; Hwang, R.L.; Matzarakis, A.; Lin, T.P. Outdoor thermal comfort characteristics in the hot and humid region from a gender perspective. Int. J. Biometeorol. 2014, 58, 1927–1939. [Google Scholar] [CrossRef] [PubMed]
  39. Shooshtarian, S.; Ridley, I. The effect of individual and social environments on the users thermal perceptions of educational urban precincts. Sustain. Cities Soc. 2016, 26, 119–133. [Google Scholar] [CrossRef]
  40. International Standard 12913-1; Acoustics-Soundscape-Part 1: Definition and Conceptual Framework. ISO: Geneva, Switzerland, 2014.
  41. Wang, Y.; Yin, C.; Ji, X.; Wang, Y. Experimental study on soundscape and audio-visual perception of urban historic district. Appl. Acoust. 2020, 39, 104–111. [Google Scholar]
  42. Lian, Y.; Ou, D.; Pan, S.; Yang, L. An evaluation study on soundscape of different landscape space types. Build. Sci. 2020, 36, 57–63. (In Chinese) [Google Scholar]
  43. Yang, L.; Zhang, J.; Xu, Y.; Chen, X. Soundscape subjective evaluation based on tourists’ preference: A case study of Dayan ancient town. Appl. Acoust. 2020, 39, 625–631. [Google Scholar]
  44. Meng, Q.; Kang, J.; Jin, H. Field study on the influence of users’ social qualities on the evaluation of subjective loudness and acoustic comfort in underground shopping streets. Appl. Acoust. 2010, 29, 371–381. [Google Scholar]
  45. Yu, L.; Kang, J. Modeling subjective evaluation of soundscape quality in urban open spaces: An artificial neural network approach. J. Acoust. Soc. Am. 2009, 126, 1163–1174. [Google Scholar] [CrossRef] [PubMed]
  46. Tsai, K.T.; Lin, Y.H. Identification of urban park activity intensity at different thermal environments and visible sky by using sound levels. Int. J. Biometeorol. 2018, 62, 1987–1994. [Google Scholar] [CrossRef] [PubMed]
  47. Hirashima, S.Q.S.; Assis, E.S. Sound perception and acoustic comfort in urban spaces in the city of Belo Horizonte, MG. Ambiente Constr. 2017, 17, 7–22. [Google Scholar] [CrossRef] [Green Version]
  48. Larriva, M.T.B.; Higueras, E. Health risk for older adults in Madrid, by outdoor thermal and acoustic comfort. Urban Clim. 2020, 34, 100724. [Google Scholar] [CrossRef]
  49. Lau, K.K.; Choi, C.Y. The influence of perceived aesthetic and acoustic quality onoutdoor thermal comfort in urban environment. Build. Environ. 2021, 206, 108333. [Google Scholar] [CrossRef]
  50. Pellerin, N.; Candas, V. Combined effects of temperature and noise on human discomfort. Physiol. Behav. 2003, 78, 99–106. [Google Scholar] [CrossRef]
  51. Pellerin, N.; Candas, V. Effects of steady-state noise and temperature conditions on environmental perception and acceptability. Indoor Air 2004, 14, 129–136. [Google Scholar] [CrossRef]
  52. Yang, W.; Moon, H.J.; Kim, M.J. Combined effects of short-term noise exposure and hygrothermal conditions on indoor environmental perceptions. Indoor Built Environ. 2018, 27, 1119–1133. [Google Scholar] [CrossRef]
  53. Parker, C.; Barnes, S.; Mckee, K.; Morgan, K.; Torringtong, J.; Tregenza, P. Quality of life and building design in residential and nursing homes for older people. Ageing Soc. 2004, 24, 941–962. [Google Scholar] [CrossRef]
  54. Tartarini, F.; Cooper, P.; Fleming, R. Thermal environment and thermal sensations of occupants of nursing homes: A field study. Procedia Eng. 2017, 180, 373–382. [Google Scholar] [CrossRef]
  55. Mendes, A.; Papoila, A.L.; Carreiro-Martins, P.; Aguiar, L.; Bonassi, S.; Caires, I.; Caires, L.; Palmeiro, T.; Ribeiro, Á.S.; Neves, P.; et al. The Influence of Thermal Comfort on the Quality of Life of Nursing Home Residents. J. Toxicol. Environ. Health 2017, 80, 729–739. [Google Scholar] [CrossRef] [PubMed]
  56. Wiratha, M.S.; Tsaih, L. Acoustic comfort in long-term care facilities based on listening impressions from normal hearing individuals. Proc. Meet. Acoust. 170ASA 2015, 25, 015003. [Google Scholar]
  57. Mueller-Schotte, S.; Huisman, E.; Huisman, C.; Kort, H. The influence of the indoor environment on people displaying challenging behaviour: A scoping review. Technol. Disabil. 2022, 34, 133–140. [Google Scholar] [CrossRef]
  58. Devos, P.; Aletta, F.; Vander Mynsbrugge, T.; Thomas, P.; Filipan, K.; Petrovic, M.; De Vriendt, P.; Van de Velde, D.; Botteldooren, D. Soundscape design for management of behavioral disorders: A pilot study among nursing home residents with dementia. INTER-NOISE and NOISE-CON congress and conference proceedings. Inst. Noise Control. Eng. 2018, 258, 2104–2111. [Google Scholar]
  59. Putkinen, V.; Makkonen, T.; Eerola, T. Music-induced positive mood broadens the scope of auditory attention. Soc. Cogn. Affect. Neur. 2017, 12, 1159–1168. [Google Scholar] [CrossRef] [Green Version]
  60. McGill, P.; Teer, K.; Rye, L.; Hughes, D. Staff reports of setting events associated with challenging behavior. Behav. Modif. 2005, 29, 599–615. [Google Scholar] [CrossRef]
  61. Nitidara, N.P.A.; Sarwono, J.; Suprijanto, S.; Nugroho Soelami, F.X. The multisensory interaction between auditory, visual, and thermal to the overall comfort in public open space: A study in a tropical climate. Sustain. Cities Soc. 2022, 78, 103622. [Google Scholar] [CrossRef]
  62. Peel, M.C.; Finlayson, B.L.; McMahon, T.A. Updated world map of the Köppen-Geiger climate classification. Hydrol. Earth Syst. Sc. 2007, 11, 259–263. [Google Scholar] [CrossRef]
  63. China Meteorological Administration (CMA). Available online: http://data.cma.cn/ (accessed on 17 July 2022).
  64. Sun, C.Y. A street thermal environment study in summer by the mobile transect technique. Theor. Appl. Climatol. 2011, 106, 433–442. [Google Scholar] [CrossRef]
  65. Ballas, J.A. Common factors in the identification of an assortment of brief everyday sounds. J. Exp. Psychol. Hum. 1993, 19, 250–267. [Google Scholar] [CrossRef]
  66. Dubois, D. Categories as acts of meaning: The case of categories in olfaction and audition. Cogn. Sci. 2000, 1, 35–68. [Google Scholar]
  67. Gaver, W.W. What in the world do we hear?: An ecological approach to auditory event perception. Ecol. Psychol. 1993, 5, 1–29. [Google Scholar] [CrossRef]
  68. Yang, W.; Kang, J. Acoustic comfort evaluation in urban open public spaces. Appl. Acoust. 2005, 66, 211–229. [Google Scholar] [CrossRef]
  69. American Standard. Acoustical Terminology. Academic Medicine; American National Standards Institute: New York, NY, USA, 1994; p. 26. [Google Scholar]
  70. Gravetter, F.J.; Wallnau, L.B. Statistics for Behavioral Sciences, 8th ed.; Wadsworth: Belmont, CA, USA, 2009. [Google Scholar]
  71. Brown, A.L.; Gjestland, T.; Dubois, D. Acoustic environments and soundscapes. In Soundscape and the Built Environment; Kang, J., Schulte-Fortkamp, B., Eds.; CRC Press: Boca Raton, FL, USA, 2016; pp. 1–16. [Google Scholar]
  72. Axelsson, Ö.; Nilsson, M.E.; Berglund, B. The Swedish soundscape-quality protocol. J. Acoust. Soc. Am. 2012, 131, 3476. [Google Scholar] [CrossRef]
  73. Axelsson, Ö.; Nilsson, M.E.; Berglund, B. A Swedish instrument for measuring soundscape quality. Proc. Inst. Acoust. 2009, 31, 199–206. [Google Scholar]
  74. Liu, J.; Kang, J.; Luo, T.; Behm, H.; Coppack, T. Spatiotemporal variability of soundscapes in a multiple functional urban area. Landsc. Urban Plan. 2013, 115, 1–9. [Google Scholar] [CrossRef]
  75. Jeon, J.Y.; Jo, H.I. Effects of audio-visual interactions on soundscape and landscape perception and their influence on satisfaction with the urban environment. Build. Environ. 2020, 169, 106544. [Google Scholar] [CrossRef]
  76. Jeon, J.Y.; Hong, J.Y. Classification of urban park soundscapes through perceptions of the acoustical environments. Landsc. Urban Plan. 2015, 141, 100–111. [Google Scholar] [CrossRef]
  77. Axelsson, Ö.; Nilsson, M.E.; Berglund, B. A principal components model of soundscape perception. J. Acoust. Soc. Am. 2010, 128, 2836–2846. [Google Scholar] [CrossRef] [PubMed]
  78. Jin, Y.; Jin, H.; Kang, J. Combined effects of the thermal-acoustic environment on subjective evaluations in urban squares. Build. Environ. 2020, 168, 106517. [Google Scholar] [CrossRef]
  79. GB3096–2008; Environmental Quality Standard for Noise. Ministry of Ecology and Environment of the People’s Republic of China: Beijing, China, 2008.
  80. ASHRAE Standard 55; Thermal Environmental Conditions for Human Occupancy. American Society of Heating. Refrigerating and Air-Conditioning Engineers: Atlanta, GA, USA, 2013.
  81. International Standard 7726; Thermal Environment—Instruments and Method for Measuring Physical Quantities. ISO: Geneva, Switzerland, 1998.
  82. Hodder, S.G.; Parsons, K. The effects of solar radiation on thermal comfort. Int. J. Biometeorol. 2007, 51, 233–250. [Google Scholar] [CrossRef]
  83. Axelsson, Ö.; Nilsson, M.; Berglund, B. Validation of the Swedish soundscape quality protocol. J. Acoust. Soc. Am. 2012, 131, 3474. [Google Scholar] [CrossRef]
  84. International Standard 10551; Ergonomics of the Physical environment—Subjective Judgement Scales for Assessing Physical Environment. ISO: Geneva, Switzerland, 2019.
  85. Honjo, T. Thermal comfort in outdoor environment. Glob. Environ. Res. 2009, 13, 43–47. [Google Scholar]
  86. International Standard 7730; Ergonomics of the Thermal Environment-Analytical Determination and Interpretation of Thermal Comfort Using Calculation of the PMV and PPD Indices and Local Thermal Comfort Criteria. ISO: Geneva, Switzerland, 2005.
  87. Matzarakis, A.; Rutz, F.; Mayer, H. Modelling radiation fluxes in simple and complex environments-application of the RayMan model. Int. J. Biometeorol. 2007, 51, 323–334. [Google Scholar] [CrossRef]
  88. Nikolopoulou, M.; Steemers, K. Thermal comfort and psychological adaptation as a guide for designing urban spaces. Energy Build. 2003, 35, 95–101. [Google Scholar] [CrossRef]
  89. Guan, H.; Hu, S.; Lu, M.; He, M.; Mao, Z.; Liu, G. People’s subjective and physiological responses to the combined thermal-acoustic environments. Build. Environ. 2020, 172, 106709. [Google Scholar] [CrossRef]
  90. Nagano, K.; Horikoshi, T. New index of combined effect of temperature and noise on human comfort: Summer experiments on hot ambient temperature and traffic noise. Arch. Complex Environ. Stud. 2001, 13, 9. [Google Scholar]
  91. Yin, Y.; Zhang, D.; Zhen, M.; Jing, W.; Luo, W.; Feng, W. Combined effects of the thermal-acoustic environment on subjective evaluations in outdoor public spaces. Sustain. Cities Soc. 2022, 77, 103522. [Google Scholar] [CrossRef]
  92. Yang, W.; Moon, H.J. Cross-modal effects of noise and thermal conditions on indoor environmental perception and speech recognition. Appl. Acoust. 2018, 141, 1–8. [Google Scholar] [CrossRef]
  93. Yang, W.; Moon, H.J. Combined effects of acoustic, thermal, and illumination conditions on the comfort of discrete senses and overall indoor environment. Build. Environ. 2019, 148, 623–633. [Google Scholar] [CrossRef]
  94. Ma, K.W.; Mak, C.M.; Wong, H.M. Effects of environmental sound quality on soundscape preference in a public urban space. Appl. Acoust. 2021, 171, 107570. [Google Scholar] [CrossRef]
  95. Bahali, S.; Tamer-Bayazit, N. Soundscape research on the Gezi Park-Tunel Square route. Appl. Acoust. 2017, 116, 260–270. [Google Scholar] [CrossRef]
Figure 1. Experimental process.
Buildings 12 01518 g001
Figure 2. Correlation between MTSV and PET in autumn and winter.
Buildings 12 01518 g002
Figure 3. Distribution of the ASV among sound types.
Buildings 12 01518 g003
Figure 4. Distribution of the ACVs among sound types.
Buildings 12 01518 g004
Figure 5. Proportion of positive adjectives (a) and negative adjectives (b).
Buildings 12 01518 g005
Figure 6. Distribution of the TSV among sound types.
Buildings 12 01518 g006
Figure 7. Distribution of the TCVs among sound types.
Buildings 12 01518 g007
Figure 8. Correlation between PET and MTSV in different sound types: running water and birdsong (a), wind (a gentle breeze) and insects (b), broadcasting music (c), crowds (d), and machines (e).
Buildings 12 01518 g008aBuildings 12 01518 g008b
Figure 9. Correlation between PET and MTSV at different ACV levels.
Buildings 12 01518 g009
Figure 10. Optimum design strategies: (a) design with a fountain background wall and tall trees to attract birds and decrease acoustic discomfort; (b) design with uneven green land, safety exercise boundaries, and vegetation to dampen crowd noise influences; (c) increase the duration and frequency of broadcasting music to create comfortable outdoor rest space; (d) design with an ecological drought stream or rainwater garden to increase wind (a gentle breeze) and insects and running water and birdsong; (e) design with foundations, pools, flower beds, and corridors to improve the overall comfort and satisfaction.
Buildings 12 01518 g010aBuildings 12 01518 g010bBuildings 12 01518 g010c
Table 1. Site descriptions.
SpaceAerial PhotographAutumnWinter
Peony garden (PG)Buildings 12 01518 i001Buildings 12 01518 i002Buildings 12 01518 i003
SVF = 0.7385SVF = 0.7500
Wooded area (WA)Buildings 12 01518 i004Buildings 12 01518 i005Buildings 12 01518 i006
SVF = 0.1356SVF = 0.2480
Campus square (CS)Buildings 12 01518 i007Buildings 12 01518 i008Buildings 12 01518 i009
SVF = 0.8602SVF = 0.8674
Ecological garden (EG)Buildings 12 01518 i010Buildings 12 01518 i011Buildings 12 01518 i012
SVF = 0.3004SVF = 0.5163
Patio space (PS)Buildings 12 01518 i013Buildings 12 01518 i014Buildings 12 01518 i015
SVF = 0.1515SVF = 0.1517
Table 2. Instrument information.
InstrumentParametersRangePrecision
HOBO onset U23-001Air temperature−40–70 °C±0.21 °C
Relative humidity0–100%±2.5%
Kestrel 5500Wind speed0–40 m/s0.1 m/s
Delta OHM HD2107.2Globe temperature−30–120 °C±0.25 °C
JTR05Global radiation0–2000 W/m2≤±2%
AWA5688A weighted sound pressure level28 dBA–133 dBA
Table 3. Respondents’ attribute.
SeasonAgeGenderNumberHeight (cm)Weight (kg)
autumn18–26male35177.1 ± 6.3267.4 ± 10.42
17–25female102163.9 ± 5.4253.4 ± 5.99
winter21–27male20176.0 ± 3.571.6 ± 8.7
18–27female84163.0 ± 4.854.0 ± 7.1
Table 4. Meteorological parameters.
SeasonMeteorological FactorPGCSWAEGPS
AutumnTa (°C)
Max.19.720.118.919.118.4
Min.10.711.010.210.410.4
Mean ± SD15.6 ± 2.615.8 ± 2.714.8 ± 2.615.1 ± 2.614.7 ± 2.4
RH (%)
Max.82.581.187.687.187.0
Min.40.636.043.042.942.4
Mean ± SD59.0 ± 12.857.3 ± 13.262.7 ± 12.761.6 ± 12.962.6 ± 12.4
Va (m/s)
Max.0.91.30.50.51.1
Min.0.00.00.00.00.0
Mean ± SD0.3 ± 0.30.6 ± 0.40.1 ± 0.20.2 ± 0.10.3 ± 0.3
G (W/m²)
Max.706.7689.481.244.0105.6
Min.0.462.99.12.222.3
Mean ± SD254.4 ± 221.9255.6 ± 160.626.7 ± 14.019.5 ± 13.651.6 ± 21.1
Tg (°C)
Max.28.429.619.721.219.4
Min.13.513.410.511.511.1
Mean ± SD21.5 ± 3.622.1 ± 3.915.6 ± 2.416.7 ± 2.515.8 ± 2.2
Tmrt (°C)
Max.50.259.921.524.421.5
Min.13.517.910.511.812.0
Mean ± SD28.3 ± 9.532.8 ± 9.516.1 ± 2.518.3 ± 2.817.3 ± 2.8
WinterTa (°C)
Max.11.211.110.410.910.0
Min.−0.1−0.1−0.20.10.4
Mean ± SD5.4 ± 4.15.5 ± 4.05.0 ± 3.85.3 ± 3.95.0 ± 3.5
RH (%)
Max.70.969.270.870.770.7
Min.33.233.635.234.733.7
Mean ± SD51.9 ± 13.251.7 ± 12.853.5 ± 12.553.2 ± 13.054.3 ± 12.6
Va (m/s)
Max.0.82.01.21.01.4
Min.0.00.00.00.00.1
Mean ± SD0.1 ± 0.20.7 ± 0.50.3 ± 0.30.3 ± 0.20.5 ± 0.3
G (W/m²)
Max.394.3327.477.4303.362.1
Min.27.528.48.721.017.9
Mean ± SD175.9 ± 124.6157.9 ± 107.829.2 ± 18.0120.9 ± 99.136.5 ± 11.7
Tg (°C)
Max.19.520.212.617.610.5
Min.0.20.5−0.10.60.7
Mean ± SD9.7 ± 6.510.2 ± 6.55.8 ± 4.47.9 ± 5.55.6 ± 3.7
Tmrt (°C)
Max.25.040.818.730.712.9
Min.0.21.80.00.90.4
Mean ± SD10.5 ± 7.418.0 ± 12.46.8 ± 5.411.7 ± 9.16.9 ± 4.0
Table 5. Correlation between PET and MTSV in different sound types.
AutumnWinter
Machine noiseMTSV = 0.1294 PET − 2.4824
(R² = 0.7473)
MTSV = 0.1037 PET − 1.5505
(R² = 0.575)
Crowd noiseMTSV = 0.1594 PET − 2.98
(R² = 0.7419)
MTSV = 0.1003 PET − 1.3249
(R² = 0.6347)
Running water and birdsongMTSV = 0.1599 PET − 3.0671
(R² = 0.7539)
MTSV = 0.1163 PET − 1.3098
(R² = 0.6469)
Broadcasting musicMTSV = 0.1128 PET − 2.0213
(R² = 0.7122)
MTSV = 0.146 PET − 1.6612
(R² = 0.7254)
Wind and insects soundMTSV = 0.1198 PET − 2.1037
(R² = 0.6948)
MTSV = 0.1156 PET − 1.6189
(R² = 0.6554)
Publisher’s Note: MDPI stays neutral with regard to jurisdictional claims in published maps and institutional affiliations.

