Article

Understanding Occupants’ Thermal Sensitivity According to Solar Radiation in an Office Building with Glass Curtain Wall Structure

School of Architectural Civil, Environmental and Energy Engineering, Kyungpook National University, Daegu 41566, Korea
*
Author to whom correspondence should be addressed.
Buildings 2022, 12(1), 58; https://doi.org/10.3390/buildings12010058
Submission received: 2 December 2021 / Revised: 4 January 2022 / Accepted: 5 January 2022 / Published: 7 January 2022
(This article belongs to the Topic Energy Efficiency, Environment and Health)

Abstract

:
The thermal comfort of occupants in the increasing number of modern buildings with glass curtain wall structures is of significant research interest. As the thermal sensitivity of building occupants varies with building features, situational factors, and the human body’s thermal balance, it is necessary to derive the comfort temperature based on field research, which was conducted in this study in a South Korean office building with a glass curtain wall structure. The influence of solar radiation on the indoor thermal environment and thermal comfort obtained by measurements and occupant questionnaires was analyzed using cumulative graphs and a sensitivity analysis. The observed changes in operative temperature over time confirmed that occupant comfort was significantly affected by the radiant temperature. Based on this result, two groups (Group A near the windows and Group B near the interior corridor) were defined for analysis. Owing to the influx of solar radiation, Group A was more sensitive to changes in the thermal environment (0.67/°C) than Group B (0.49/°C), and the derived comfort temperature for each group differed from the set temperature by approximately ±2 °C. Thus, it was confirmed that the solar radiation introduced through a glass curtain wall building has a direct impact on the indoor thermal environment and occupant comfort according to location.

1. Introduction

With the rise of the modern construction industry, comfort, beauty, and constant balance have been sought in the field of architecture. In this regard, transparent envelopes (e.g., glazed facades, glass curtain walls, glass domes, and skylight windows) have been applied to many large public buildings [1,2,3]. The indoor thermal environments of such structures, including the indoor air temperature, are significantly affected by solar radiation either directly or indirectly depending on the external characteristics of the structure. Thus, the thermal comfort of building occupants will be affected by variations in solar radiation throughout the building. In a previous study related to solar radiation, the radiant temperature was identified as the main cause of a non-uniform indoor thermal environment [4]. Furthermore, the radiant temperature may act as an important parameter in the thermal exchange between the human body and the surrounding environment [5]. This exchange eventually affects the indoor air temperature and the thermal comfort of the occupants [1,2,3,6,7,8,9,10]. In other words, high solar radiation in summer has a negative impact on the thermal comfort of building occupants [11,12,13,14]. In addition, the increased heat provided by solar radiation requires more energy to power cooling devices [14]. As occupants near high-temperature areas may feel more discomfort, it is important to seek methods to maintain overall thermal comfort throughout transparent envelope buildings [1].
Thermal comfort is affected by situations beyond the human body’s heat balance physics, such as climate setting, social conditions, economic considerations, other situational factors, and particularly the building exterior. Nielsen [15] exposed six subjects to an artificial “sun” and proved that solar radiation has an important influence on the physiological condition of the human body. A number of studies have also mentioned that solar radiation affects indoor thermal sensation [16,17,18]. However, previous studies currently consider only basic factors (temperature and humidity) when studying the thermal comfort of occupants, and most of them do not consider solar radiation [1]. This cannot take into account the effects of intense solar radiation and hot weather on indoor radiation temperatures in summer. In addition, there is a limit to analyzing high-rise buildings of transparent sheath structure with previous studies because there may be differences in radiation temperature and indoor air temperature [1]. Therefore, it is necessary to determine how much solar radiation affects indoor thermal environment and occupant comfort [1]. As transparent envelopes are widely used in modern buildings [19,20,21], research on the thermal comfort related to the solar radiation permitted through such envelopes is clearly required.
Office space is the representative use of buildings with transparent envelopes. In offices, heating, ventilation, and air-conditioning (HVAC) systems cannot be controlled in individual units, and physical control (such as that provided by discrete temperature control systems, windows, and blinds) is limited. This limited control of the indoor thermal environment affects the building performance and the thermal comfort of its occupants. As a result, it is difficult to ensure occupant comfort in public buildings or large office buildings with transparent envelopes. Yet thermal comfort plays an important role in the satisfaction of office occupants with their environment, as manifested in work productivity, and other work performance metrics [22,23,24]. Indeed, the thermal environment of an office has been found to be correlated with work efficiency in addition to the comfort, health, and safety of building occupants [25,26,27]. Mak et al. [28] mentioned that among the aspects of indoor thermal environment, temperature has the largest impact on the productivity of office building occupants. Maula et al. [29] showed that inappropriate temperature adversely affects the mood, motivation, and concentration of building occupants. It has also been observed that work productivity decreases when the indoor air temperature increases from a medium level (e.g., 21 to 25 °C) to a high level (e.g., 26 °C or higher) [30,31]. Notably, any estimate of thermal comfort is affected by the temperature in the immediate vicinity of the human body [1]. Therefore, it is necessary to conduct research on the aspects of the indoor thermal environment that have the largest impact on thermal comfort and work productivity in offices [25,32].
When this is integrated, there is a lack of research on thermal comfort associated with solar radiation in modern buildings. Therefore, the thermal comfort of modern buildings (curtain walls) lacking prior research is studied. In particular, since the curtain wall structure is highly influenced by solar radiation, an analysis was conducted in consideration of this. Unlike previous studies, this study studied the correlation between solar radiation and comfort introduced into the curtain wall structure. A previous study of office thermal environments [33] found that different occupants in the same space often have different thermal preferences. Additionally, the non-uniform indoor thermal environment directly affects the heat released from the human body [5]. Thus, the typical thermal environment of an office building, which depends on the characteristics of the building and space within, cannot guarantee the comfort of all building occupants. The building envelope structure, building type, indoor thermal environment control, and occupant characteristics are all important information when conducting research to improve building energy use and occupant comfort [33]. Indeed, identifying such information addresses the limitations of previous research on the thermal comfort of occupants in buildings [2,34]. Huizenga et al. [35] evaluated the window performance for a human’s thermal comfort in various windows systems (solar heat gain coefficient, U-value, solar transmissivity, window region and frame, etc.). They concluded that this new high-performance window can gain solar heat and reduce cooling cost during the summer season and relieve thermal discomfort. Moreover, simulation studies have shown that solar radiation [36] and thermal characteristics [37] of windows could have a substantial effect on occupants’ thermal comfort [38]. Therefore, an analysis of the thermal environment according to occupant location in an office is required to inform research on occupant comfort in transparent envelope buildings.
In this study, a field experiment was therefore performed in an actual office building with a transparent envelope consisting of curtain walls instead of a laboratory (chamber) to reliably reflect the actual indoor thermal environment of an office and inform an analysis of the thermal comfort of its occupants. Unlike previous studies, the changes in indoor air temperature and radiant temperature over time were examined to investigate the influence of solar radiation on occupant comfort. The thermal comfort of the occupants who responded to changes in the indoor thermal environment was thus analyzed according to their location relative to the curtain wall. Different comfort temperatures were then derived and analyzed based on the thermal sensitivity of the occupants according to location.
By identifying thermal comfort levels in the non-uniform indoor thermal environment of a building with a transparent envelope, the results of this study contribute to the preparation of efficient measures for individual thermal control to improve the overall thermal comfort of office occupants.

2. Methods

Objective physical data and subjective personal data were collected for analysis in this study using field experiments [39,40,41,42]. The physical factors of the indoor thermal environment are the objective data measured using equipment, whereas the personal factors are the subjective data obtained through a questionnaire survey. The factors that affect the thermal comfort of indoor occupants include: (1) environmental factors, such as the air temperature, relative humidity, wind speed, and radiant temperature, and (2) individual factors, such as clothing and activities [43]. Therefore, in this study, the environmental factors related to occupant comfort were set as objective physical factors based on previous studies. These consisted of the temperature and humidity [44,45], which are the basic descriptors of the indoor environment. As office characteristics in summer [46] were the subject of this study, the average clothing insulation (clo) level and the metabolic rate (met) were calculated to be 0.5 and 1.2, respectively. The subjective data were collected from office occupants using a questionnaire. Prior consent was acquired from the participants for all processes, including data survey, sharing, storage, and requirements.

2.1. Field Data Collection

Laboratory chamber research relies upon an artificial environment and provides a limited ability to simulate and measure factors such as solar radiation and wind speed [2,47]. This study accordingly targeted a transparent envelope building to conduct field research on the correlation between solar radiation and thermal comfort [2] using equipment in an actual office space. The target building was an office building at K University in Daegu, South Korea, with a curtain wall structure through which a large quantity of heat is introduced by solar radiation (Table 1). Notably, Daegu exhibits slightly higher temperature than the surrounding areas because its basin topography inhibits the release of heat. In addition, the target building experiences a large influx of solar radiation because school buildings up to four stories in height are distributed around it. The target building has transparent curtain walls on its north and east faces that consist of highly air-tight, low-e double glazing with insulation film. U-value is 1.690 W/m2K, and solar heat gain coefficient (SHGC) is 0.486. The experimental space was located in the northeast corner of the ninth floor of the office building and had an area of approximately 133 m2 (15.78 m × 8.46 m). The indoor air temperature was set to 26 °C based on domestic regulations related to indoor air temperature in summer [48]. Three system air conditioners and eight energy recovery ventilation systems (ERVs) with 0.5 m × 0.5 m square vents were installed in the ceiling of the experimental space. These cooling and ventilation systems were controlled by the central HVAC system.
The experiments were performed from 09:00 to 18:00, except during lunch time from 11:30 to 13:00, every day in July when the average outdoor air temperature was higher than 30 °C. During the experimental period, the average outdoor temperature was 32.4 °C, the maximum temperature was 35.5 °C, and the standard deviation was 2.2. The indoor air temperature, relative humidity, wind speed, and radiant temperature were recorded every 15 min using the equipment detailed in Table 2. These instruments were located at 40 equipment points arranged in a 2 m × 2 m grid 1.2 m above the floor, as shown in Figure 1 (additional measurements were performed under the air conditioner vents to consider their influence). Figure 1 also shows the locations of the questionnaire respondents (subject points).

2.2. Subjects and Thermal Comfort Questionnaire

The heat dissipation rate of a subject’s body is proportional to the amount of activity they undertake, and varies depending on their, clothing, metabolic rate, and body surface area. The standard deviations (σ) of the amount of clothing and the metabolic rate of the subjects who participated in this study were found to be between approximately 10–20%, thereby minimizing their influence on the experiment results [49]. The subjects were all in their twenties and thirties, and a total of 40 office occupants (17 male and 23 female) in the study area were randomly selected to complete the questionnaire. All subjects were healthy and took no medication. They were requested to avoid alcohol, smoking, and intense physical activities at least 12 h before the experiments [2]. Table 3 shows the personal characteristics of the subjects, as obtained through the questionnaire.
The subjects entered the experimental space 30 min before the start of the experiment to ensure time for adaptation to the thermal environment. Each subject then completed a questionnaire to identify their comfort sensation vote (CSV) and thermal sensation vote (TSV) [50] every 15 min starting at the beginning of the experiment; the questionnaire response interval was same as the objective data measurement interval.
The two questionnaire items were ranked on a seven-point scale based on the seven-level sensory scale of the ASHRAE Standard and ISO 10551 [44,51,52], as shown in Figure 2. For TSV, a ranking of 1 indicates feeling cold, 4 indicates feeling neutral, and 7 indicates feeling hot; for CSV, a ranking of 1 indicates feeling very uncomfortable, 4 indicates feeling neutral, and 7 indicates feeling very comfortable.

3. Results and Discussion

Table 4 is the average hourly data for solar radiation in the experimental area (Daegu) at the time of the experiment. At 14:00 of the day, the highest solar radiation was 2.97 MJ/m2, and at 18:00, the lowest solar radiation was 1.03 MJ/m2.
Table 5 summarizes the physical and subjective data measured in this study. The average of TA was 25.7 °C, but the average of Tr was 26.7 °C. The average of TSV was slightly warm, and the average of CSV was derived as neutral.

3.1. Occupant Thermal Comfort according to the Difference between Indoor Air Temperature and Radiant Temperature

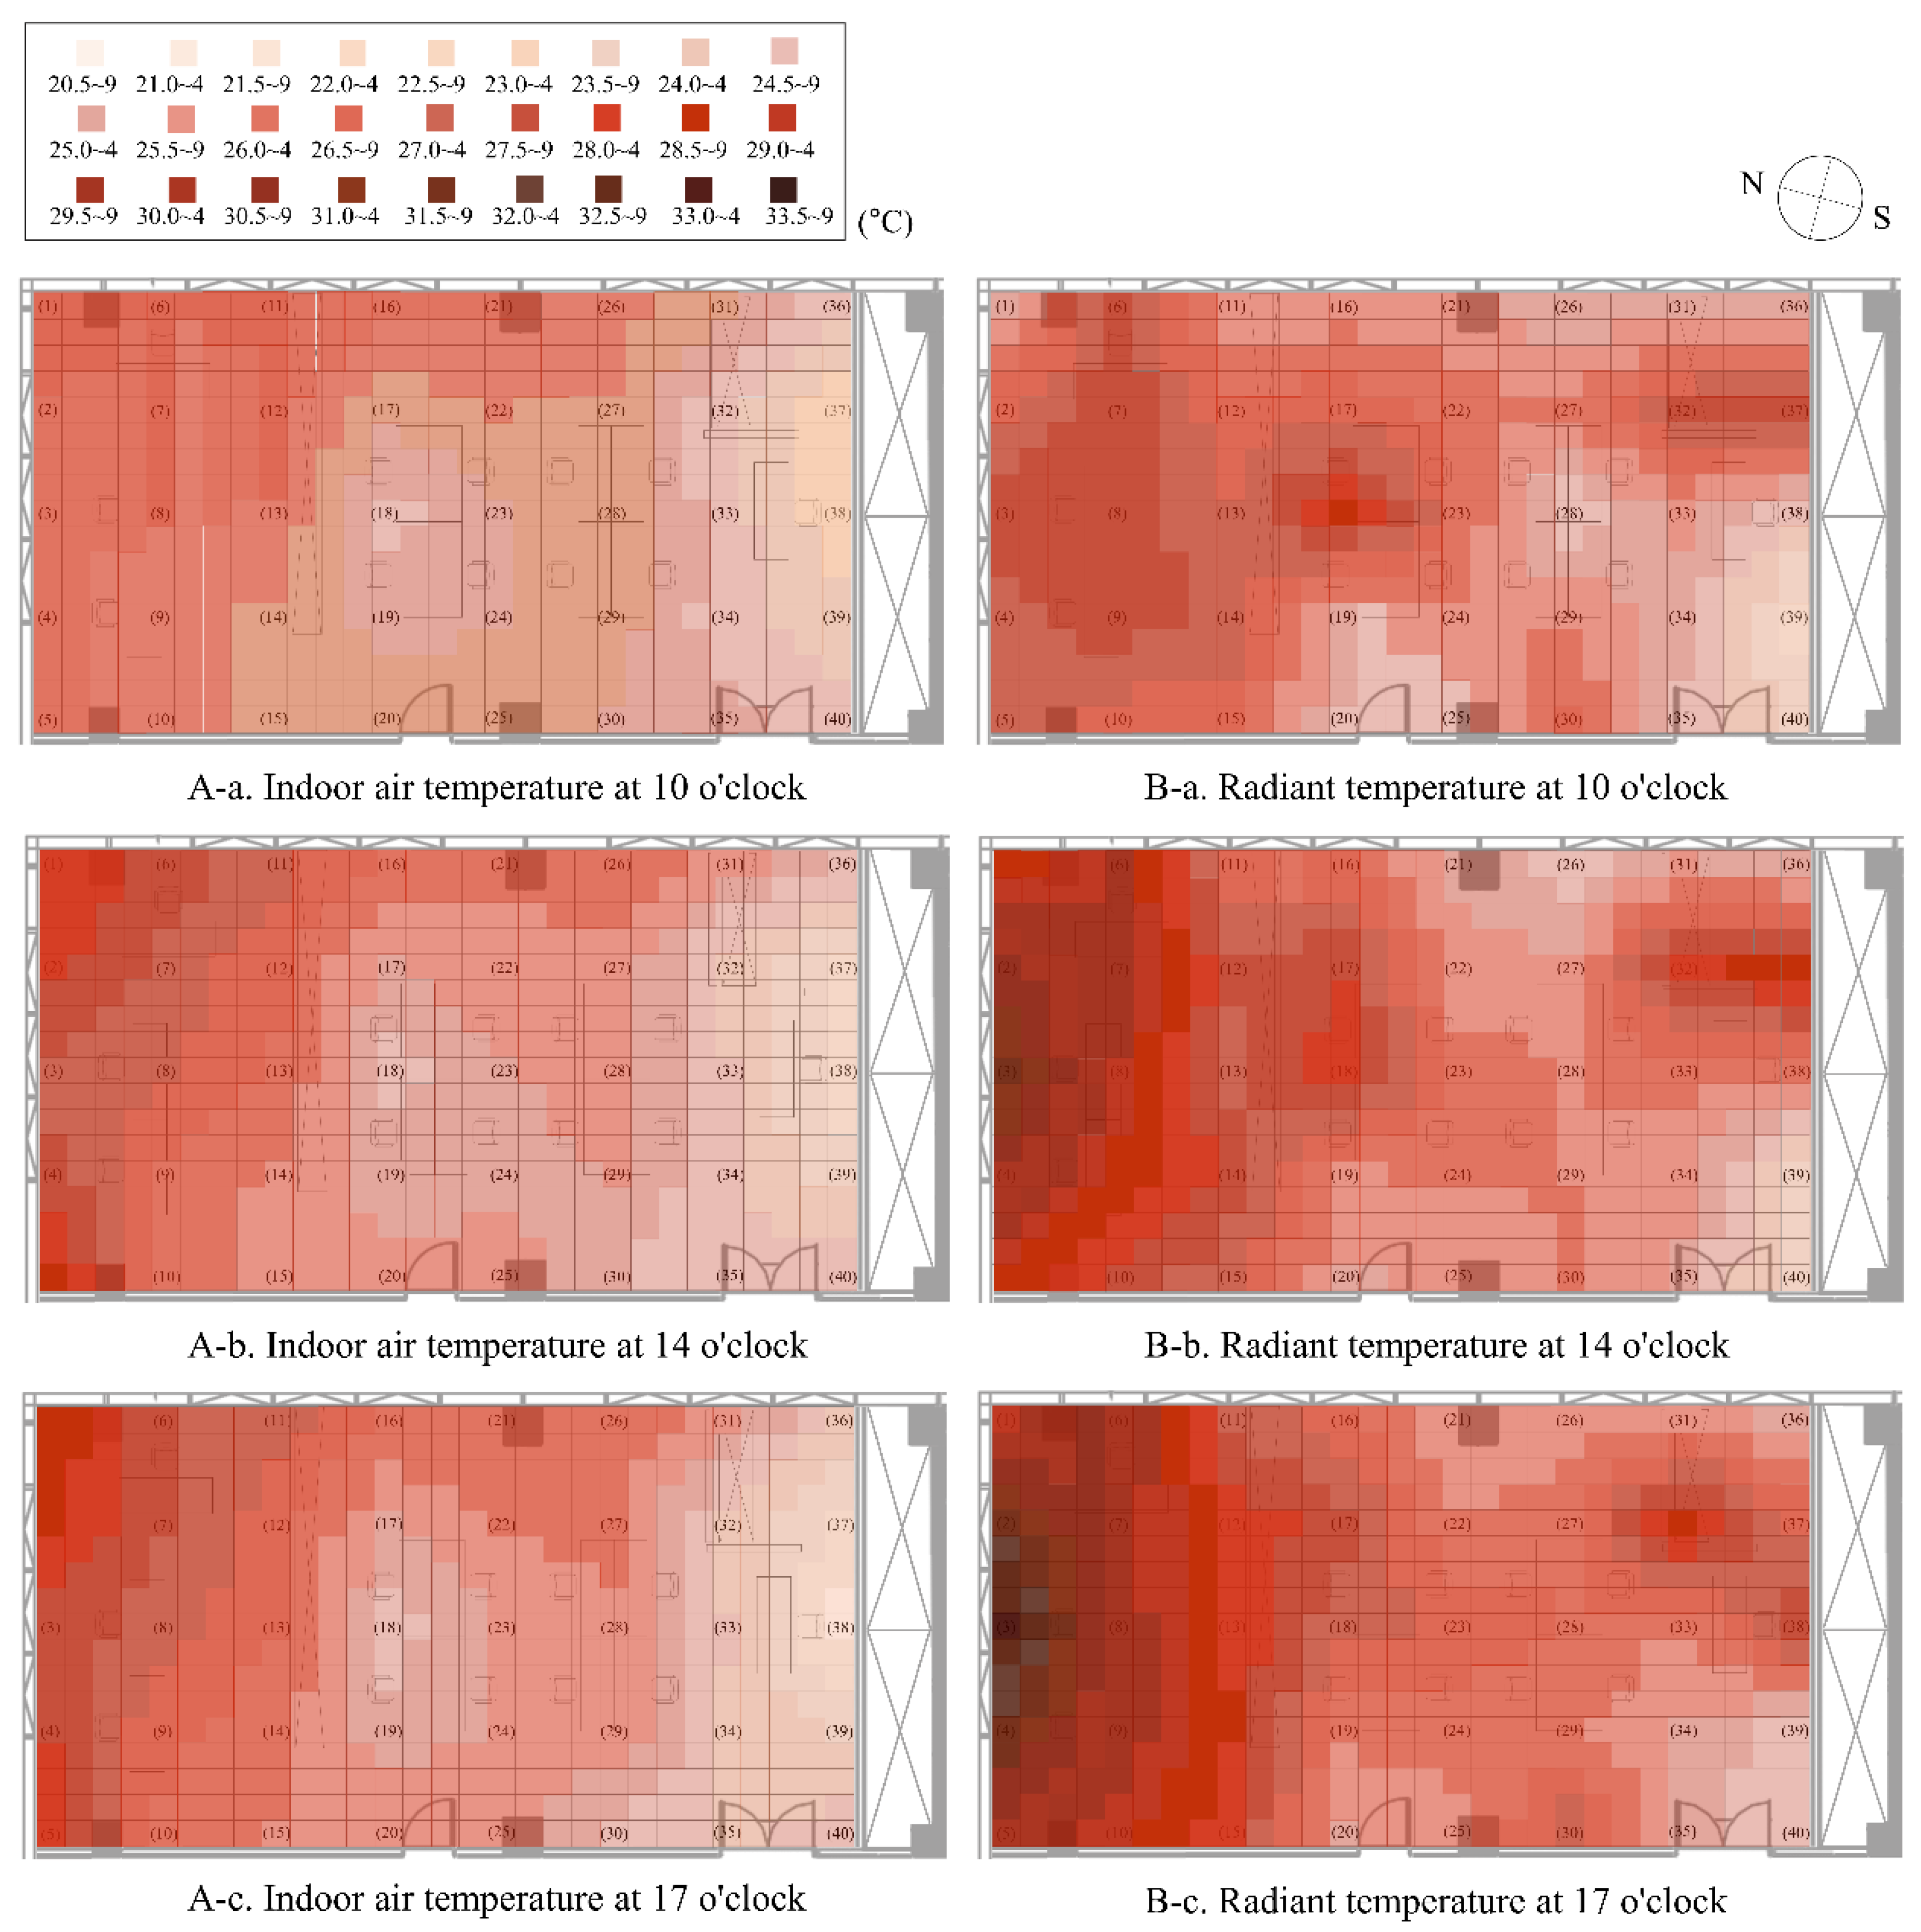
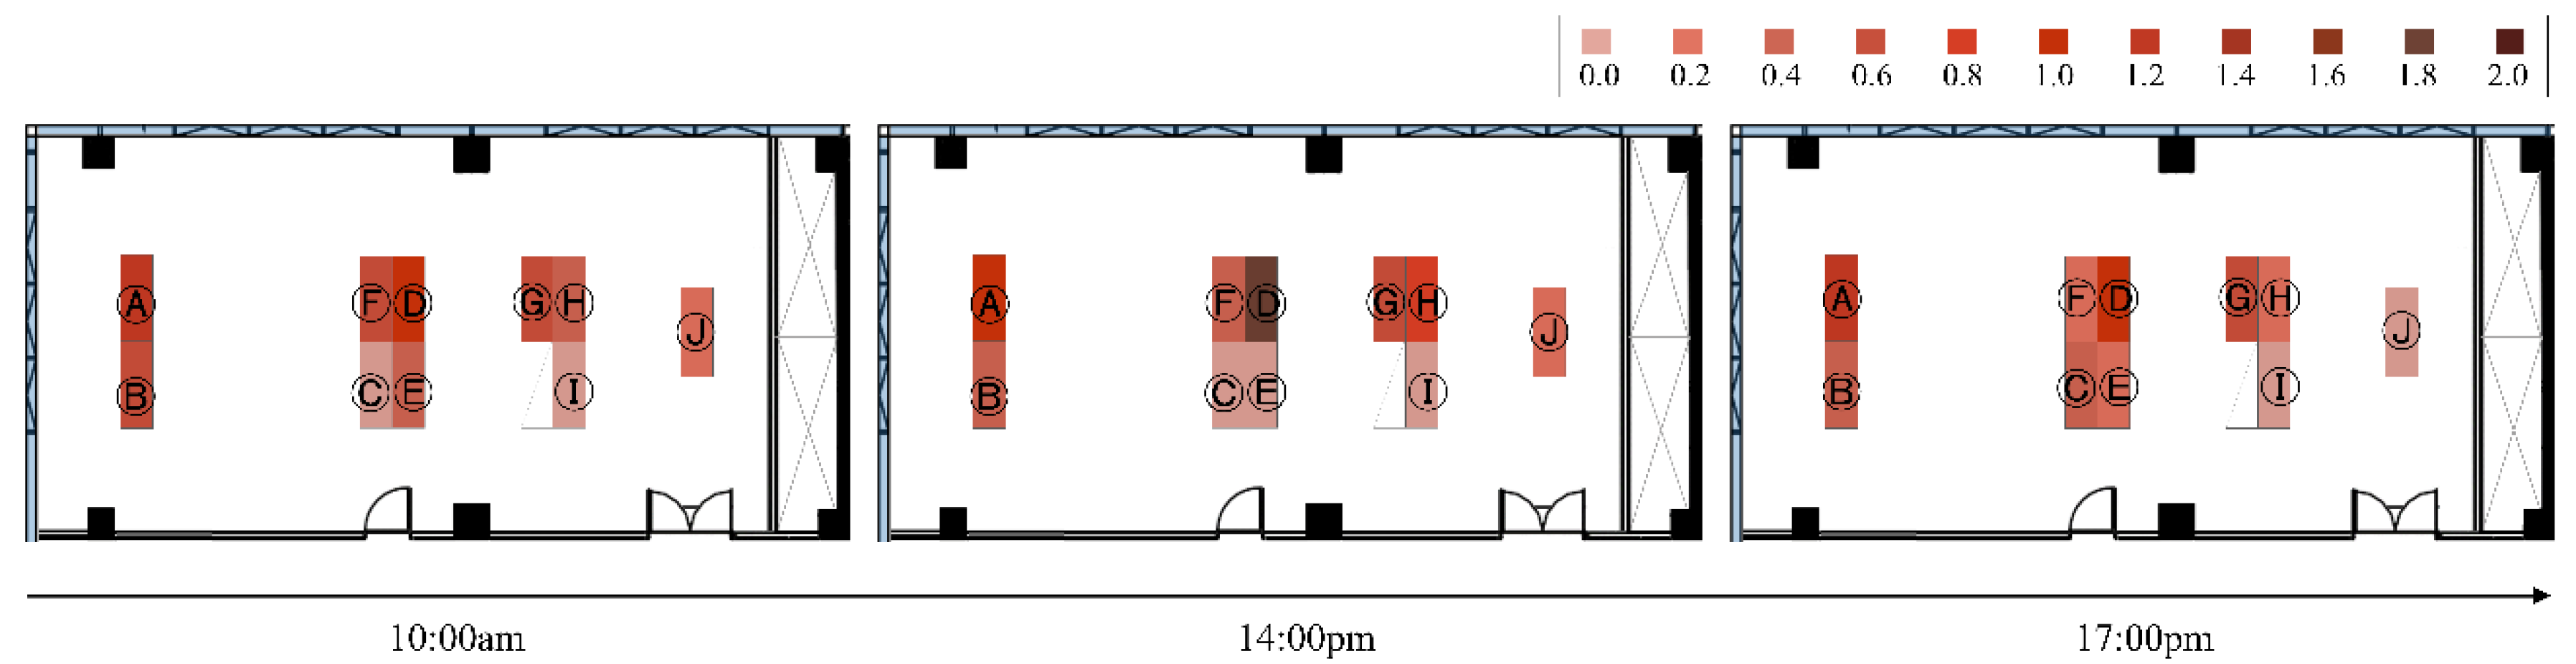
Figure 3 shows the changes in indoor air temperature (TA) and radiant temperature (Tr) over time. Both TA and Tr were high near the windows in the north and in the afternoon. During the experiment, TA ranged from a minimum of 23.15 °C at 10:00 to a maximum of 28.93 °C at 17:00, while Tr ranged from a minimum of 23.25 °C at 10:00 to a maximum of 33.35 °C at 17:00. Though the minima and maxima of both temperatures each occurred at the same time of day, TA increased from north to south whereas Tr increased from northwest to southeast.
The distribution of Tr showed notable characteristics that were not observed in that of TA; Tr increased in the central part of the indoor space over time and was exceptionally high in the southeast direction. These differences resulted from the presence of furniture (a partition) installed in the office space, suggesting that the radiant temperature was exceptionally high because the heat could not be dissipated in the air.
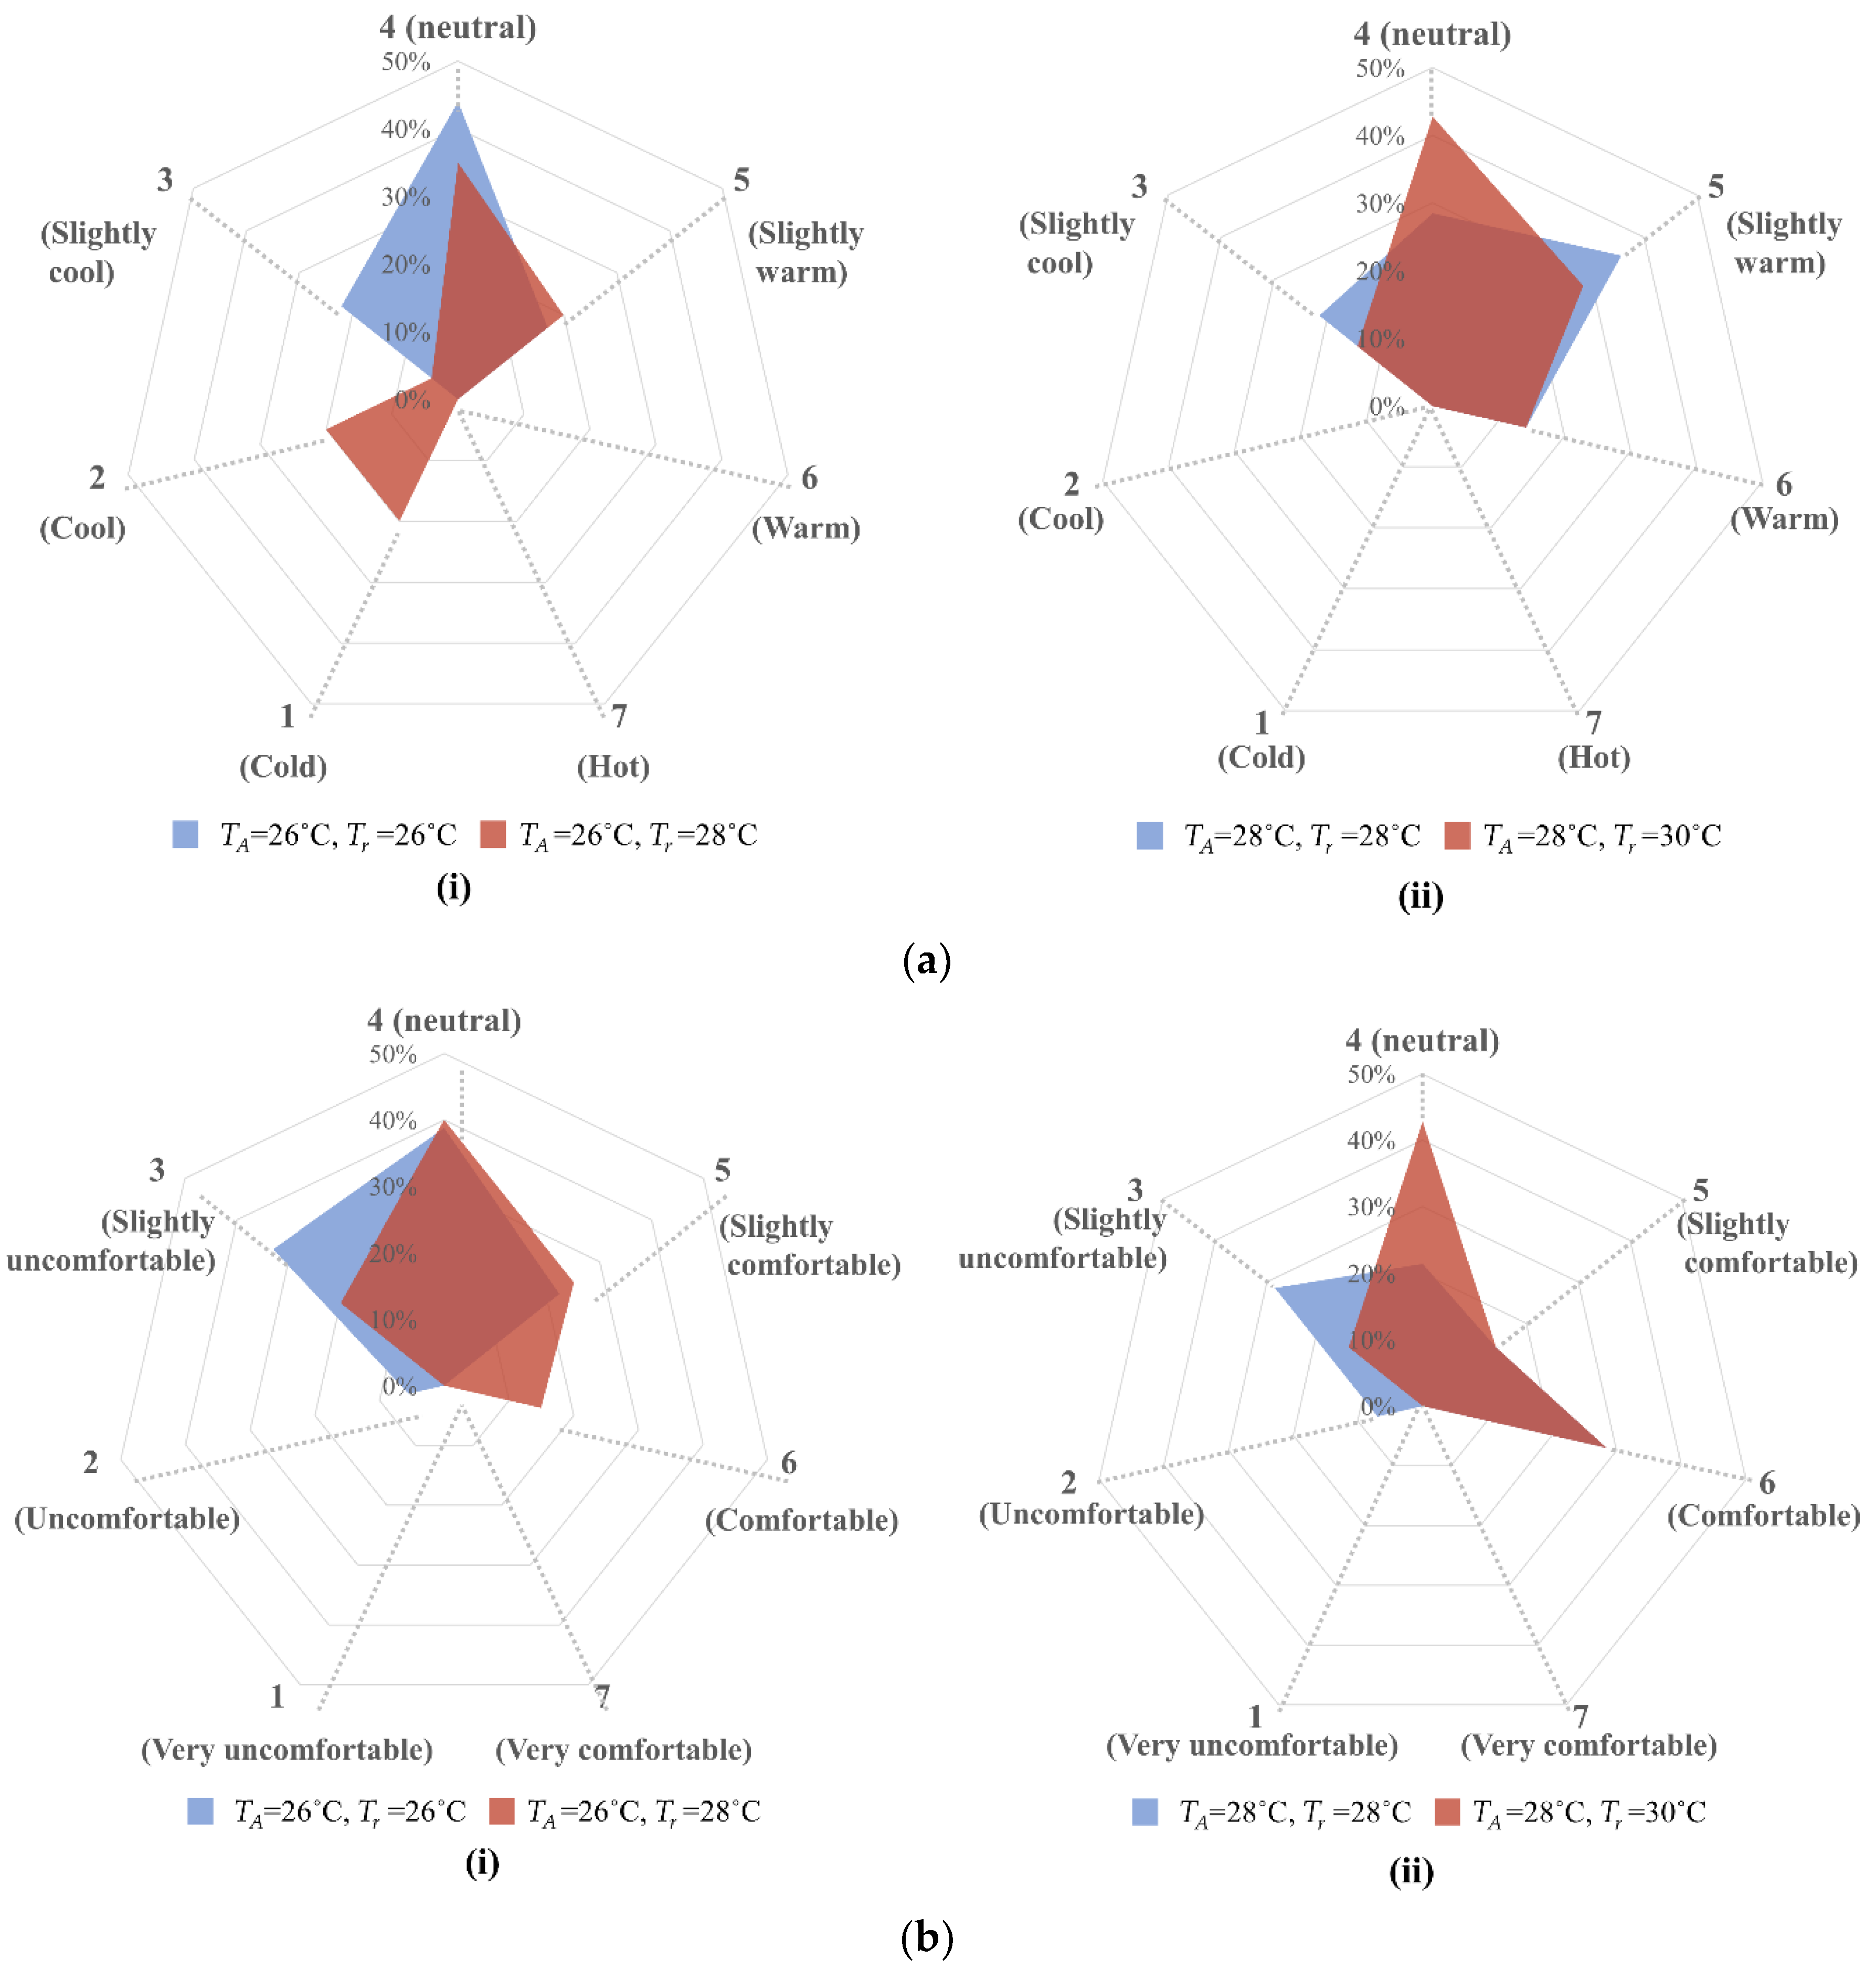
Figure 4a,b show the TSV and CSV responses of the subjects, respectively, according to TA. The blue area indicates that the indoor air temperature is the same as the radiant temperature, whereas the red area indicates that these temperatures are different. In Figure 4a, when TA = 28 °C (ii), the responses exhibit similar distributions regardless of Tr, with the largest percentage of responses (~35%) indicating the slightly warm TSV (5) when Tr = 28 °C (blue), whereas when Tr = 30 °C (red), the largest percentage of responses (~43%) indicated the neutral TSV (4). However, when TA = 26 °C (i), a wider distribution of responses can be observed for Tr = 28 °C (red) than for Tr = 26 °C (blue), with ~44% indicating the neutral TSV (4) and 20% each indicating the cold (1) cool (2), and slightly warm (5) TSVs in the former case. Thus, the distribution of TSV responses was wider when Tr was not the same as TA. Therefore, TSV results responded the most to the neutral when the indoor temperature was 26 degrees (i). In addition, when the indoor temperature was 28 degrees (ii), the response was highest to neutral and slimly warm.
In Figure 4b, when TA = 26 °C (i), the largest percentage of responses indicated the neutral CSV (4) whether Tr = 26 or 28 °C. However, when Tr = 26 °C (blue), more responses were distributed to the two uncomfortable CSVs (2 and 3), whereas when Tr = 28 °C (red), more responses were distributed to the two comfortable CSVs (5 and 6). When TA = 28 °C (ii), the same percentage of responses (28%) indicated the comfortable CSV (6) for Tr = 28 and 30 °C. However, 43% of responses indicated the neutral CSV (4) when Tr = 30 °C (red), whereas only ~20% of responses indicated the neutral CSV (4) when Tr = 28 °C, with 28% indicating the slightly uncomfortable CSV (3). Thus, the distribution of CSV responses was wider when Tr = TA. Therefore, most of the occupants responded to the neutral when the indoor temperature was 26 degrees (i). In addition, when the indoor temperature was 28 °C (ii), the response was high to neutral and comfortable.
The analysis results presented in Figure 4 indicate a clear difference between the TSV and CSV results. In addition, considerably different thermal comfort results were observed according to the indoor air temperature and radiant temperature. In particular, when the indoor air temperature was different from the radiant temperature, the TSVs of the occupants were distributed among several different and often opposing scores. In other words the blue areas in Figure 4 indicate an even distribution across the five vertices, whereas the red areas indicate an uneven distribution with a high response at a few specific vertices. It was also found that the comfort of the occupants varied depending on both the radiant temperature and the indoor air temperature. This confirms the influence of the building characteristics (curtain walls); it appears that the radiant temperature showed significant changes under the influence of the solar radiation introduced through the curtain walls, which also had a significant influence on thermal comfort. Thus, a simple comparison between the indoor air temperature and radiant temperature is only of limited utility when analyzing the thermal comfort of office occupants. To provide a more detailed analysis, thermal comfort was estimated in Section 3.2 based on the accumulated mean thermal sensation vote (mTSV) according to the temperature change.

3.2. Thermal Sensation Changes and Comfort Temperature over Time

The changes in thermal sensations of the subjects were analyzed using the TSV reported at each location. In previous studies, TSV has been used as a representative index for general thermal comfort evaluation [53]. The changes in TSV over time are shown in Figure 5, in which the greater the value, the larger the change. The average change in TSV at all ten subject locations was 0.55, with an average maximum of 1.80 and an average minimum of 0, indicating that there were subjects who experienced no thermal change. A σ of 0.45 was calculated for all data. At 10:00, 14:00, and 17:00, the average change in TSV was 1.22, 1.12, and 1.23, respectively, at point A; 0.58, 1.08, and 0.71, respectively, at point B; 0.02, 0.35, and 0.40, respectively, at point C; 0.90, 1.80, and 1.05, respectively, at point D; 0.13, 0.17, and 0.32, respectively, at point E; 0.34, 0.69, and 0.50, respectively, at point F; 0.31, 0.61, and 0.67, respectively, at point G; 0.52, 0.92, and 0.25, respectively, at point H; 0.00, 0.06, and 0.05, respectively, at point I; and 0.21, 0.20, and 0.11, respectively, at point J. Thus, the changes in TSV at point D were the largest, followed by those at A, B, H, G, F, C, E, J, and I.
The changes in TSV at each point were divided into two groups according to their proximity to the windows. Points A, B, D, F, G, and H, which showed changes exceeding the average, were combined together in Group A (Male 50: Female 50); all of these points were close to the windows, where they received high solar radiation. Points C, E, I, and J, which showed changes smaller than the average, were combined together in Group B (Male 15: Female 75); all of these points were relatively far from the windows and closer to the interior corridor. The average and σ of the change in the TSV of Group A were 0.81 and 0.13, respectively, whereas those of Group B were 0.17 and 0.07, respectively, confirming a significant difference between the thermal comfort experienced by the two groups over the course of the day.
The overall σ of the changes in TSV was 1.31. The mTSV was calculated to quantify the change in TSV over the course of the day, with a positive value indicating a change to a warmer sensation, zero indicating no change, and a negative value indicating a change to a cooler sensation. For Group A, mTSV was 5 (slightly warmer) and the corresponding σ was 1.25. For Group B, mTSV was 3 (slightly cooler) and the corresponding σ was 1.19.
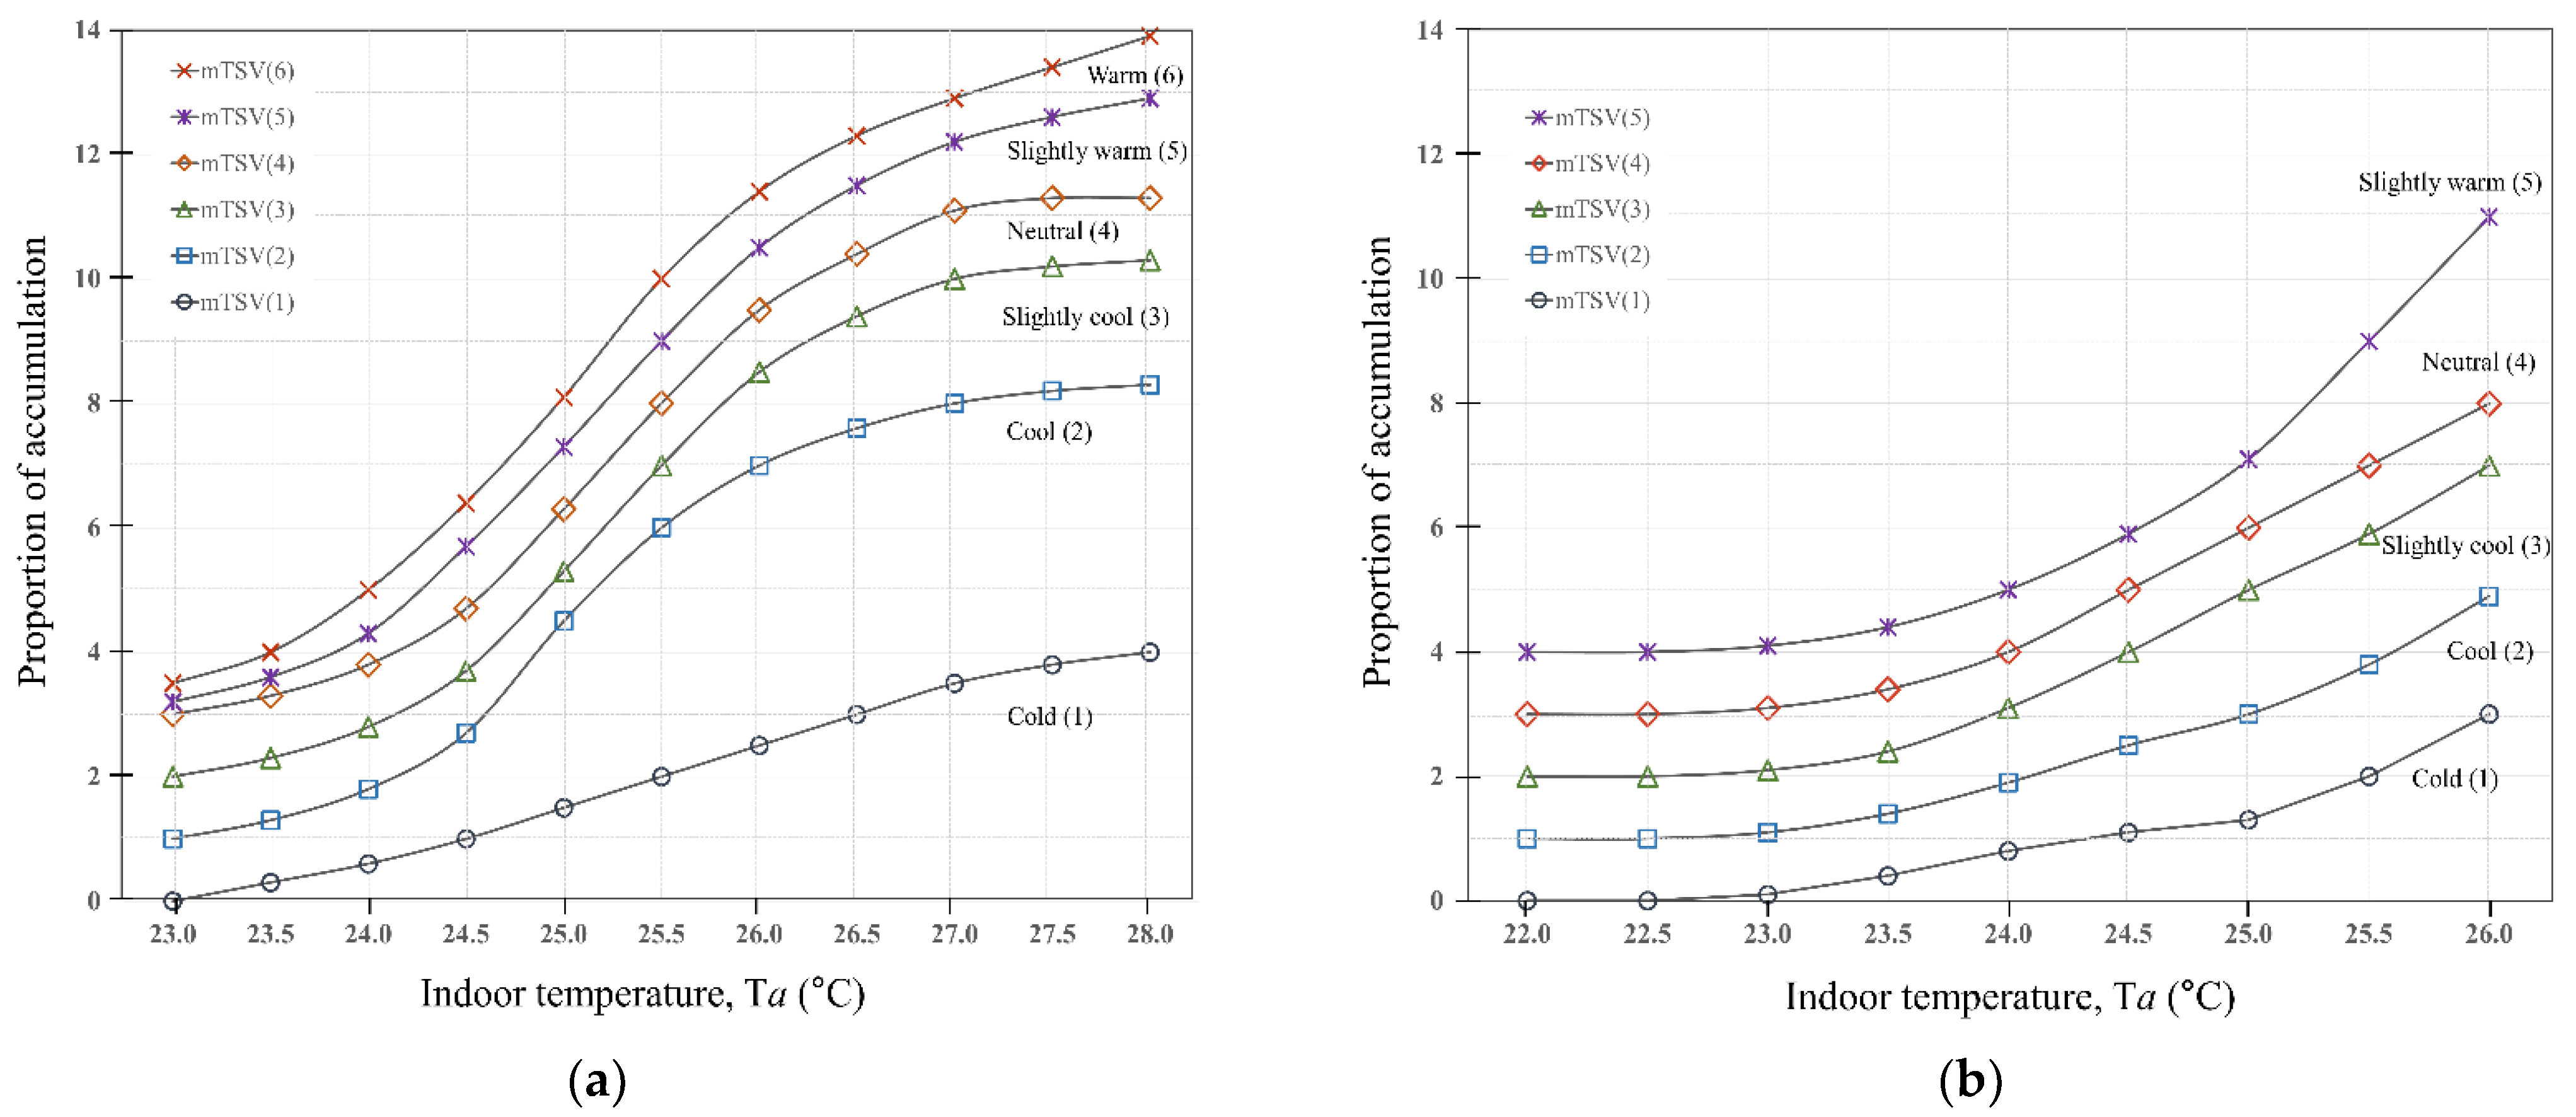
The mTSV results of each group were analyzed using a Probit regression analysis to estimate their respective levels of thermal comfort [54]; the results are shown in Figure 6. In Figure 6a, the highest curve represents the warm TSV (6) and the lowest curve represents the cold TSV (1). As the temperature increases from 23 to 28 °C, the curves representing the warm (6) and slightly warm (5) TSVs increase faster than the others. In Figure 6b, Group B only reported only five TSVs from cold (1) to slightly warm (5); the highest curve represents the slightly warm TSV (5) and the lowest curve represents the cold TSV (1). As the temperature increases from 22 to 26 °C, the curve representing the slightly warm TSV (5) increases faster than the others.
For both groups, the lowest curve represents the cold TSV (1), but a generally warmer thermal sensation scale is shown in Figure 6a than in Figure 6b because the highest curve in the former represents the warm TSV (6) whereas that in the latter represents the slightly warm TSV (5). In addition, the proportion of cold TSV (1) decreases with increasing indoor air temperature in Figure 6a but increases with increasing indoor air temperature in in Figure 6b. The comprehensive analysis results thus confirm that Group A felt warmer than Group B, indicating that the vicinity of Group A to the windows resulted in a higher temperature in the same office space. Based on these results, it can be determined that a clear difference in comfort temperature exists between the two groups and thus in the thermal environments of their respective spaces.
The comfort temperature results for each group, derived by regression analysis of the neutral score in Figure 6a,b, are shown in Table 6. The comfort temperature was derived from the Top and the mean of TSV. It was found to be at a significant level through the derived R2 and p values. The average comfort temperature for all groups was found to be 26.6 °C. Goto et al. [55], who used the same indoor set temperature as this study (26 °C), stated that the comfort temperature preferred in office buildings was approximately 26 °C. Furthermore, Madhavi et al. [56] identified 27.1 °C as the comfort temperature, which is also similar to the average comfort temperature obtained in this study.
The comfort temperature for Group A was found to be 24.7 °C for whereas that for Group B was 28.4 °C. Thus, the respondents in Group A felt comfortable at a temperature approximately 2 °C lower than the current indoor set temperature of 26 °C, whereas those in Group B felt comfortable at a temperature approximately 2 °C higher than the set temperature. Consequently, the comfort temperatures in different spaces differed by approximately 3.7 °C, indicating that the comfort temperature is clearly dependent on the occupant location, even in the same space.
Tanabe et al. [57] performed experiments in six different office buildings, finding that the occupant thermal satisfaction level was 75% at an indoor air temperature of 25 °C, but dropped to 40% at 28 °C. However, a comfort temperature of 28.4 °C was obtained for Group B in this study. Thus, despite a consistent temperature of 28°C, the analysis results were different depending on the presence of solar radiation and occupancy environment.

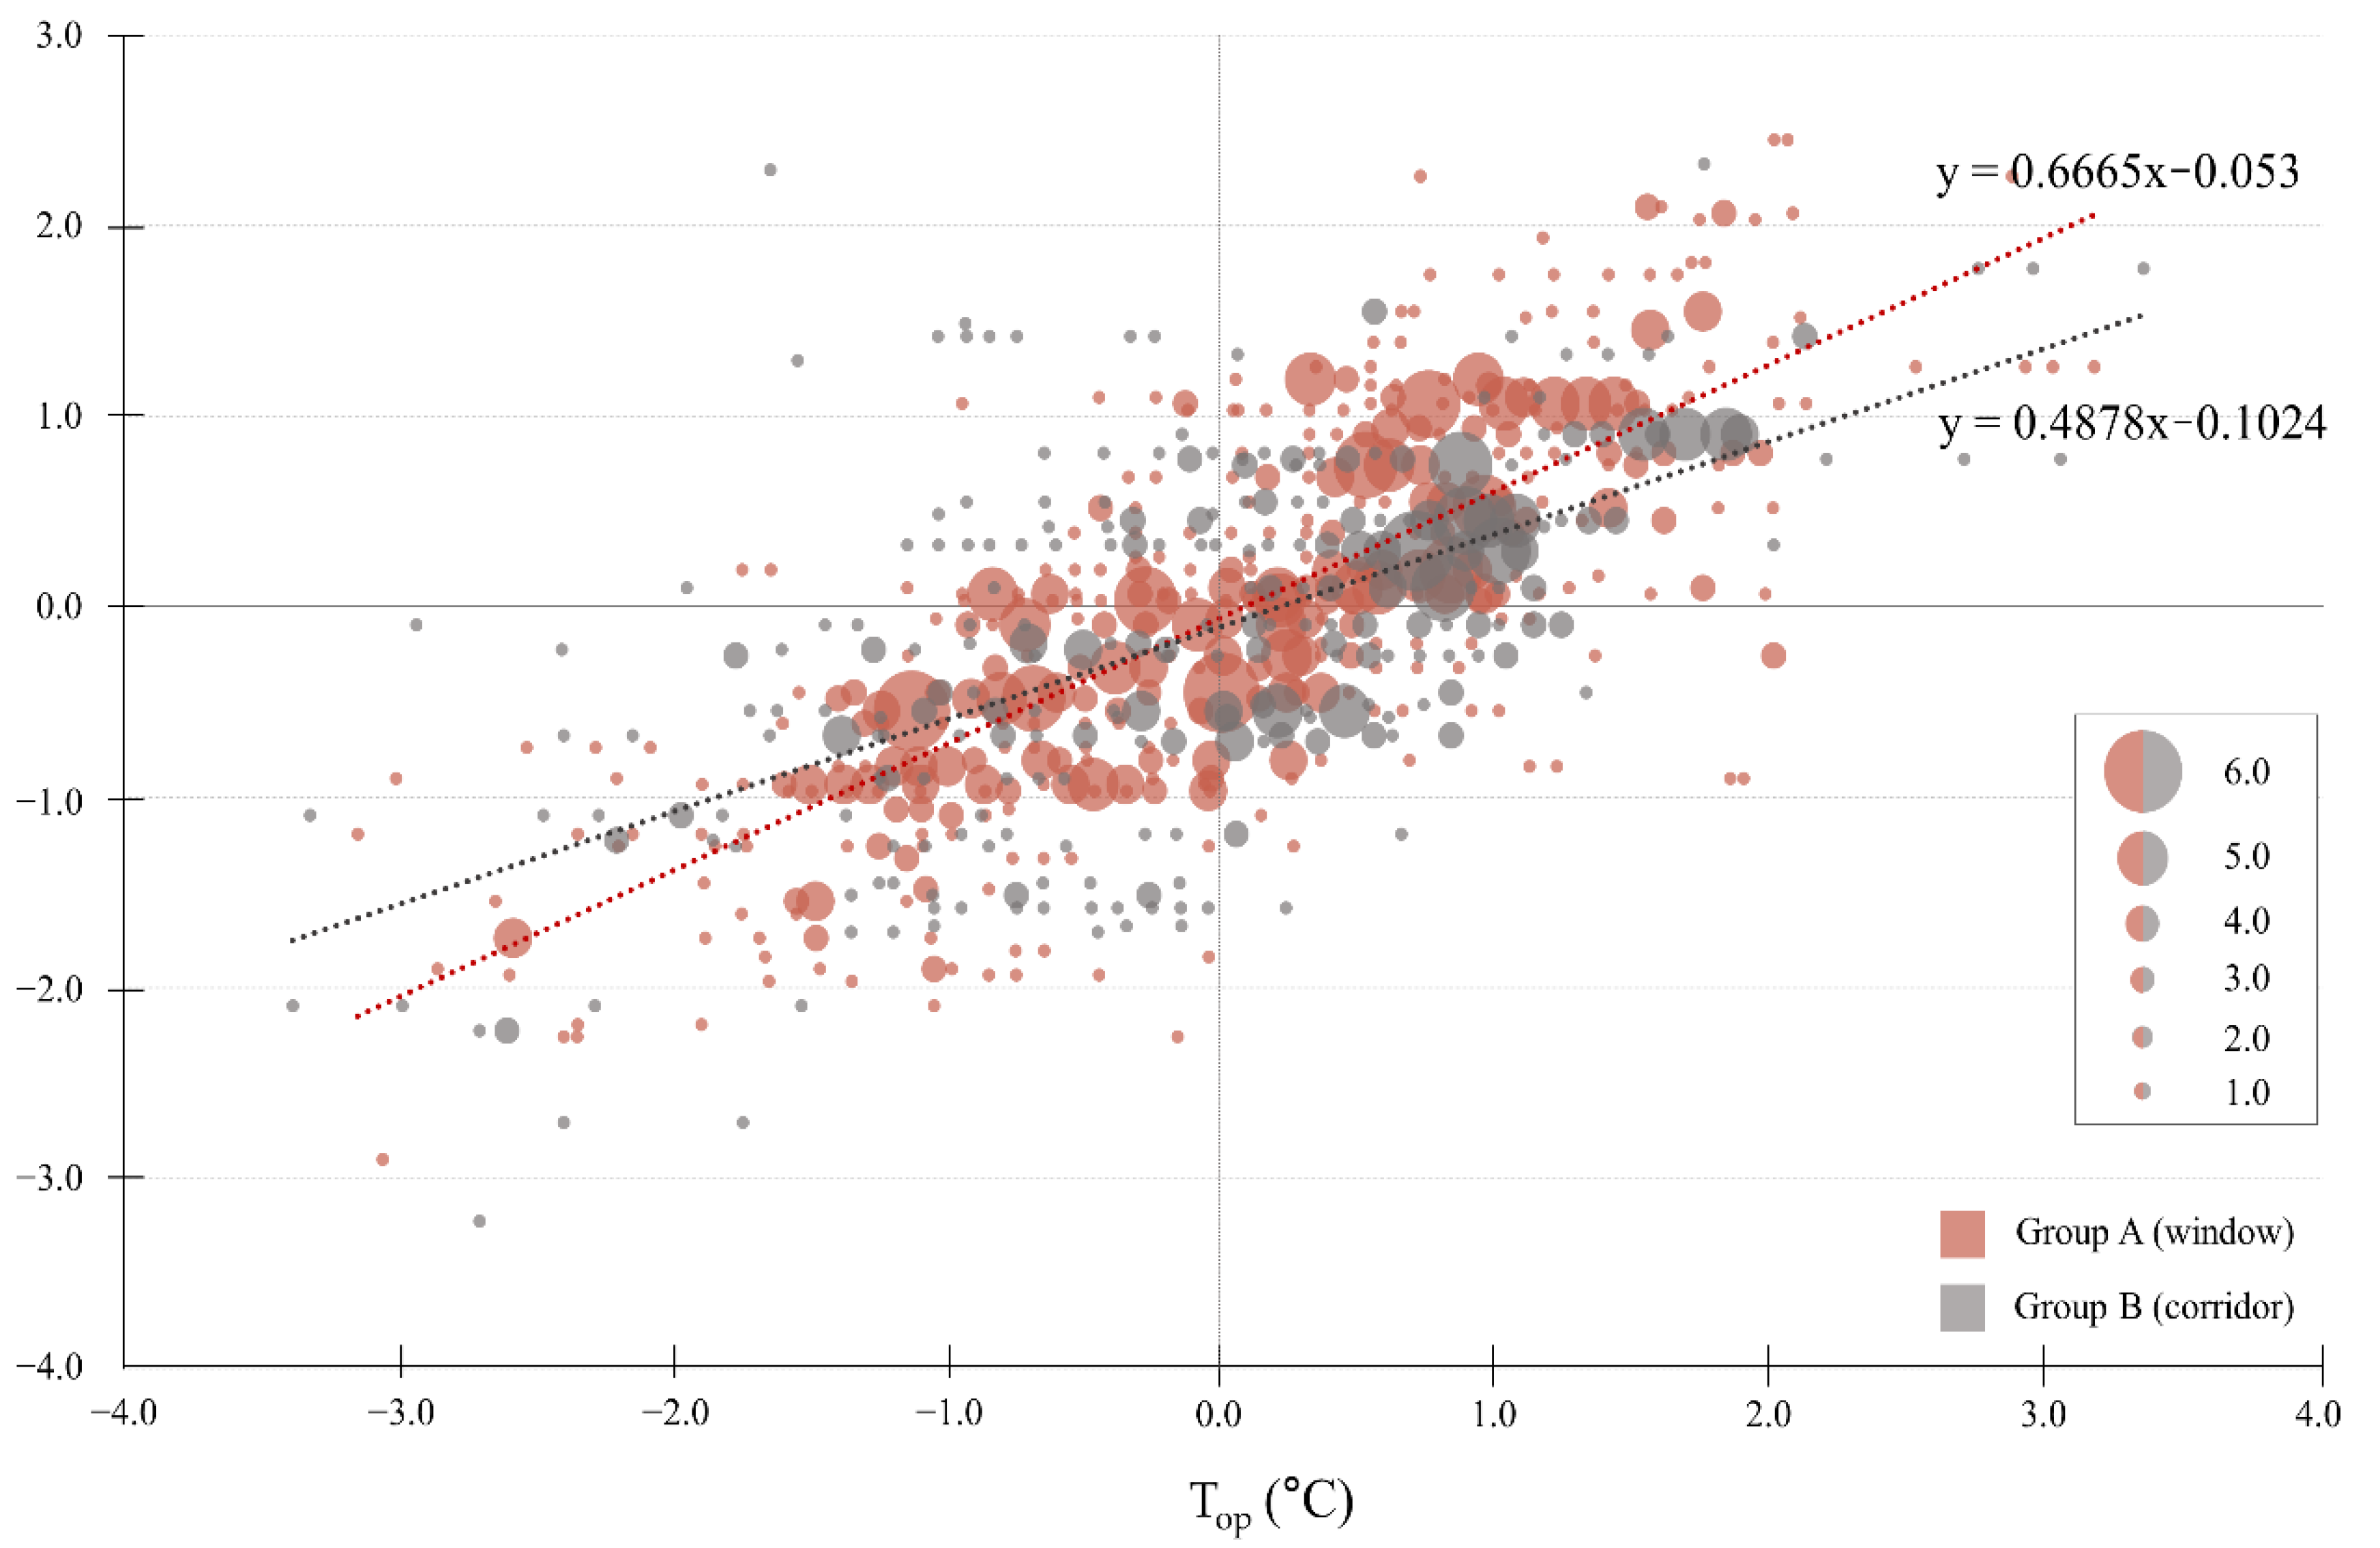
3.3. Analysis of Sensitivity to the Mean Thermal Sensation and Indoor Operative Temperature

Figure 7 shows the sensitivity analysis of the mean thermal sensation (MTS) to the indoor operative temperature (Top) for Groups A and B, in which a strong positive correlation can be observed between MTS and Top [39]. In the figure, the size of the bubble is proportional to the number of responses to the temperature change in the TSV results, and the slope of the regression equation thus represents the thermal sensitivity of the group to changes in Top. A low sensitivity indicates that the temperature change is not felt, whereas a high sensitivity indicates that the temperature change is directly felt. The overall average sensitivity was found to be 0.58/°C. The slope for Group A (0.67/°C) is higher than that for Group B (0.49/°C), indicating that Group A was more sensitive to changes in the indoor air temperature, and that Group B could accept a higher temperature. Therefore, Group B can set the temperature higher than 26 °C. Group B feels that they are comfortable with the temperature higher than average. This control can save cooling energy and at the same time, can keep the comfort of occupants having the characteristics of Group B. This will be a positive control.
Group B was likely less sensitive than Group A because the increase in solar radiation admitted through the curtain wall over the course of the day primarily affected Group A. In addition, the amount of change in MTS with temperature confirmed that Group A could not adapt to the temperature change and reacted more sensitively because the large temperature change in the area near the windows owing to the influx of solar radiation. Therefore, a temperature lower than the setting temperature is needed to Group A. Going further, temperature control by hour for reacting to the influence of solar radiation is needed. Thus, the results of this study indicate that sensitivity differs significantly according to the indoor thermal environment at the occupant location in an office space.
A previous study on thermal comfort in various building types [58] found that the universally adopted sensitivity (Griffiths constant) was close to 0.5/°C by Michael Humphreys. This value is not significantly different from the sensitivity results derived in this study; it is particularly similar to the sensitivity result obtained for Group B (0.49/°C). Furthermore, the comfort temperature (28.7 °C in [59] compared to 28.4 °C for Group B in this study) of the occupants with low sensitivity (0.255/°C in [59] compared to 0.49/°C for Group B in this study) was found to be relatively high. These occupants can clearly accept higher temperatures in summer.
Indeed, this study showed similar estimates for sensitivity as previous studies. Rupp et al. [58] estimated that the thermal sensitivity of office buildings in a subtropical climate, which is similar to the climate of Korea, was 0.568/°C. They also derived a sensitivity of approximately 0.440/°C in air-conditioned offices. These circumstances are comparable to those obtained through field research in summer in this study, but the derived results are different. Additional data are therefore required to confirm the validity of these results. Rupp et al. [58] mentioned that it remained necessary to avoid reliance on universal thermal sensitivity results by conducting further research because thermal sensitivity is not constant. They also emphasized the necessity of deriving the comfort temperature based on field research data. The field research conducted in this study was accordingly used to derive the comfort temperatures. However, research including more variables remains required to compensate for the limitations of such field research at present.
Thermal comfort is significantly affected by the exterior, type, and geographical location of a building along with situational factors and the human body’s thermal balance [39]. In this study, field measurements were performed, and subjective sensations collected in an office space experiencing a large influx of solar radiation in a building with a transparent envelope. The analysis confirmed that the solar radiation introduced into an indoor space has a direct impact on the indoor air temperature and the thermal comfort of the occupants. Similarly, Moon [15] conducted research on the relationship between solar radiation and indoor thermal comfort and emphasized that solar radiation must be considered during the design of HVAC systems, as solar radiation increases body temperature [11,17]. Since numerical data describing the influx of solar radiation were insufficient in this study, it remains necessary to collect additional relevant data. The inclusion of such data should be further discussed in future research to obtain definitive results describing thermal comfort in buildings. Thus, in future work, solar radiation data will be measured, and revised regression coefficients will be estimated using all relevant data.

4. Conclusions

In this study, the influence of solar radiation on the indoor thermal environment and thermal comfort of occupants in an office building with a transparent envelope was analyzed using measurements and questionnaire responses. The analysis results showed that there was a clear difference between the indoor air temperature and radiant temperature owing to the transparent envelope of the building. The comfort of occupants in a group subjected to the significant influence of solar radiation (Group A) was compared with that of a group less affected by solar radiation (Group B), confirming the effect of solar radiation. The overall average sensitivity of the questionnaire respondents was 0.58/°C, and the average comfort temperature was found to be 26.6 °C. The sensitivity of Group A was 0.67/°C—higher than the average sensitivity—whereas that of Group B was 0.49/°C—lower than the average sensitivity. The comfort temperature of Group A was 24.7 °C—approximately 2 °C lower than the set temperature (26 °C)—whereas that of Group B was 28.4 °C—approximately 2 °C higher than the set temperature. In the analysis results, the two groups exhibited prominent differences in comfort according to the influence of solar radiation in a single office space. This indicates that solar radiation affects the indoor operative temperature, which is directly related to the thermal comfort of the occupants.
The derived comfort temperatures differed from the set temperature by approximately ±2 °C depending on the occupant location in the office. In particular, it was found that the solar radiation introduced through the transparent envelope eventually had a direct impact on the indoor thermal environment of the office and the comfort of its occupants. As a result, the simple form of temperature control typically applied through the central HVAC system in an office building can create a thermal imbalance among occupants. Therefore, the results of this study could be used to account for the effects of solar radiation through transparent envelopes when investigating individualized measures to properly control the indoor thermal environment and thereby maintain the thermal comfort of occupants. Additional research on the relationship between the thermal comfort of occupants and solar radiation remains to be conducted by collecting numerical data describing the solar radiation inside building spaces.

Author Contributions

Conceptualization, S.-K.K. and J.-H.R.; methodology, S.-K.K. and J.-H.R.; formal analysis, S.-K.K.; investigation, S.-K.K.; writing—original draft preparation, S.-K.K. and J.-H.R.; writing—review and editing, H.-C.S. and W.-H.H. All authors have read and agreed to the published version of the manuscript.

Funding

This work was supported by a National Research Foundation of Korea (NRF) grant funded from the Korean government (MSIP, South Korea) (No.2020R1C1C1007127).

Institutional Review Board Statement

The study was conducted according to the guidelines of the Declaration of Helsinki. Nonetheless, ethical review and approval were waived for this study, due to the characteristics of the study: no medical experiments were performed on human; Subjects were informed of the objectives of the study and expressed their consent by self-enrolling in the survey; occupants’ data was collected under written given consent; data was anonymised.

Informed Consent Statement

Informed consent was obtained from all subjects involved in the study.

Data Availability Statement

The data presented in this study are available on request from authors.

Acknowledgments

This research was supported by Basic Science Research Program through the National Research Foundation of Korea (NRF) funded by the Ministry of Education (NRF-2019R1A6A3A01096814). This work was supported by NRF (National Research Foundation of Korea) Grant funded by the Korean Government (NRF-2019-Global Ph.D. Fellowship Program).

Conflicts of Interest

The authors declared no potential conflict of interest with respect to the research, authorship, and/or publication of this article.

References

  1. Dong, Q.; Li, S.; Han, C. Numerical and experimental study of the effect of solar radiation on thermal comfort in a radiant heating system. J. Build. Eng. 2020, 32, 101497. [Google Scholar] [CrossRef]
  2. Zhang, H.; Yang, R.; You, S.; Zheng, W.; Zheng, X.; Ye, T. The CPMV index for evaluating indoor thermal comfort in buildings with solar radiation. Build. Environ. 2018, 134, 1–9. [Google Scholar] [CrossRef]
  3. Zhang, T.; Chen, Q. Novel air distribution systems for commercial aircraft cabins. Build. Environ. 2007, 42, 1675–1684. [Google Scholar] [CrossRef]
  4. Song, C.; Duan, G.; Wang, D.; Liu, Y.; Du, H.; Chen, G. Study on the influence of air velocity on human thermal comfort under non-uniform thermal environment. Build. Environ. 2021, 196, 107808. [Google Scholar] [CrossRef]
  5. Atmaca, I.; Kaynakli, O.; Yigit, A. Effects of radiant temperature on thermal comfort. Build. Environ. 2007, 42, 3210–3220. [Google Scholar] [CrossRef]
  6. Al-Masrani, S.M.; Al-Obaidi, K.M.; Zalin, N.A.; Isma, M.I.A. Design optimisation of solar shading systems for tropical office buildings: Challenges and future trends. Sol. Energy 2018, 170, 849–872. [Google Scholar] [CrossRef]
  7. Cheng, C.L.; Chen, C.L.; Chou, C.P.; Chan, C.Y. A mini-scale modeling approach to natural daylight utilization in building design. Build. Environ. 2007, 42, 372–384. [Google Scholar] [CrossRef]
  8. Karlsen, L.; Heiselberg, P.; Bryn, I.; Johra, H. Verification of simple illuminance based measures for indication of discomfort glare from windows. Build. Environ. 2015, 92, 615–626. [Google Scholar] [CrossRef]
  9. Baker, N.; Steemers, K. Daylight Design of Buildings: A Handbook for Architects and Engineers; Routledge: London, UK, 2014. [Google Scholar]
  10. Munaaim, M.A.C.; Al-Obaidi, K.M.; Ismail, M.R.; Rahman, A.M.A. A review study on the application of the fibre optic daylighting system in Malaysian buildings. Int. J. Sustain. Build. Technol. Urban Dev. 2014, 5, 146–158. [Google Scholar] [CrossRef]
  11. Yang, R.; Zhang, H.; You, S.; Zheng, W.; Zheng, X.; Ye, T. Study on the thermal comfort index of solar radiation conditions in winter. Build. Environ. 2020, 167, 106456. [Google Scholar] [CrossRef]
  12. O’Brien, W.; Kapsis, K.; Athienitis, A.K. Manually-operated window shade patterns in office buildings: A critical review. Build. Environ. 2013, 60, 319–338. [Google Scholar] [CrossRef]
  13. Al-Obaidi, K.M.; Ismail, M.A.; Rahman, A.M.A. Effective use of hybrid turbine ventilator to improve thermal performance in Malaysian tropical houses. Build. Serv. Eng. Res. Technol. 2016, 37, 755–768. [Google Scholar] [CrossRef]
  14. Wu, J.; Li, X.; Lin, Y.; Yan, Y.; Tu, J. A PMV-based HVAC control strategy for office rooms subjected to solar radiation. Build. Environ. 2020, 177, 106863. [Google Scholar] [CrossRef]
  15. Moon, J.H.; Lee, J.W.; Jeong, C.H.; Lee, S.H. Thermal comfort analysis in a passenger compartment considering the solar radiation effect. Int. J. Therm. Sci. 2016, 107, 77–88. [Google Scholar] [CrossRef]
  16. Roller, W.L.; Goldman, R.F. Prediction of solar heat load on man. J. Appl. Physiol. 1968, 24, 717–721. [Google Scholar] [CrossRef]
  17. Nielsen, B. Solar heat load: Heat balance during exercise in clothed subjects. Eur. J. Appl. Physiol. 1990, 60, 452–456. [Google Scholar] [CrossRef] [PubMed]
  18. Hodder, S.G.; Parsons, K. The effects of solar radiation on thermal comfort. Int. J. Biometeorol. 2007, 51, 233–250. [Google Scholar] [CrossRef]
  19. Zhu, W.S. The application of glass materials in building design. Adv. Mater. Res. 2013, 706–708, 516–519. [Google Scholar] [CrossRef]
  20. Collin, S.; Jackson, K.A. Effects of the network environment on the vibrational modes of glass building blocks. Strahlentherapie 1964, 123, 463–496. [Google Scholar]
  21. Nikitin, Y.; Murgul, V.; Vatin, N.; Pukhkal, V. Uses of glass in architecture: Heat losses of buildings based on translucent structures. Appl. Mech. Mater. 2014, 680, 481–485. [Google Scholar] [CrossRef]
  22. al Horr, Y.; Arif, M.; Kaushik, A.; Mazroei, A.; Katafygiotou, M.; Elsarrag, E. Occupant productivity and office indoor environment quality: A review of the literature. Build. Environ. 2016, 105, 369–389. [Google Scholar] [CrossRef] [Green Version]
  23. Lan, L.; Wargocki, P.; Lian, Z. Quantitative measurement of productivity loss due to thermal discomfort. Energy Build. 2011, 43, 1057–1062. [Google Scholar] [CrossRef]
  24. Humphreys, M.A. Quantifying occupant comfort: Are combined indices of the indoor environment practicable? Build. Res. Inform. 2005, 33, 317–325. [Google Scholar] [CrossRef]
  25. Jazizadeh, F.; Ghahramani, A.; Becerik-Gerber, B.; Kichkaylo, T. Personalized thermal comfort-driven control in HVAC-Operated office buildings. In Proceedings of the 2013 ASCE International Workshop on Computing in Civil Engineering, Los Angeles, CA, USA, 23–25 June 2013. [Google Scholar]
  26. Tarantini, M.; Pernigotto, G.; Gasparella, A. A co-citation analysis on thermal comfort and productivity aspects in production and office buildings. Buildings 2017, 7, 36. [Google Scholar] [CrossRef] [Green Version]
  27. Mofidi, F.; Akbari, H. An integrated model for position-based productivity and energy costs optimization in offices. Energy Build. 2019, 183, 559–580. [Google Scholar] [CrossRef]
  28. Mak, C.M.; Lui, Y.P. The effect of sound on office productivity. Build. Serv. Eng. Res. Technol. 2011, 33, 339–345. [Google Scholar] [CrossRef]
  29. Maula, H.; Hongisto, V.; Östman, L.; Haapakangas, A.; Koskela, H.; Hyönä, J. The effect of slightly warm temperature on work performance and comfort in open-plan offices—A laboratory study. Indoor Air 2015, 26, 286–297. [Google Scholar] [CrossRef] [PubMed]
  30. Hygge, S.; Knez, I. Effects of noise, heat and indoor lighting on cognitive performance and self-reported affect. J. Environ. Psychol. 2001, 21, 291–299. [Google Scholar] [CrossRef]
  31. Lan, L.; Wargocki, P.; Wyon, D.P.; Lian, Z. Effects of thermal discomfort in an office on perceived air quality, SBS symptoms, physiological responses, and human performance. Indoor Air 2011, 21, 376–390. [Google Scholar] [CrossRef] [PubMed]
  32. Gunay, H.B.; Shen, W.; Newsham, G.; Ashouri, A. Modelling and analysis of unsolicited temperature setpoint change requests in office buildings. Build. Environ. 2018, 133, 203–212. [Google Scholar] [CrossRef]
  33. Shahzad, S.; Calautit, J.K.; Hughes, B.R.; Satish, B.K.; Rijal, H.B. Patterns of thermal preference and Visual Thermal Landscaping model in the workplace. Appl. Energy 2019, 255, 113674. [Google Scholar] [CrossRef]
  34. Gennusa, M.L.; Nucara, A.; Pietrafesa, M.; Rizzo, G. A model for managing and evaluating solar radiation for indoor thermal comfort. Sol. Energy 2007, 81, 594–606. [Google Scholar] [CrossRef]
  35. Huizenga, C.; Zhang, H.; Mattelaer, P.; Yu, T.; Arens, E.; Lyons, P. Window Performance for Human Thermal Comfort; Report to the National Fenestration Rating Council; Center for the Built Environment: Berkeley, CA, USA, 2006. [Google Scholar]
  36. Lyons, P.; Arates, D.; Huizenga, C. Window performance for human thermal comfort. ASHRAE Trans. 1999, 73, 400–420. [Google Scholar]
  37. Stegou-Sagia, A.; Antonopoulos, K.; Angelopoulou, C.; Kotsiovelos, G. The impact of glazing on energy consumption and comfort. Energy Convers. Manag. 2007, 48, 2844–2852. [Google Scholar] [CrossRef]
  38. Bessoudo, M.; Tzempelikos, A.; Athienitis, A.K.; Zmeureanu, R. Indoor thermal environmental conditions near glazed facades with shading devices—Part I: Experiments and building thermal model. Build. Environ. 2010, 45, 2506–2516. [Google Scholar] [CrossRef]
  39. Fang, Z.; Zhang, S.; Cheng, Y.; Fong, A. Field study on adaptive thermal comfort in typical air conditioned classrooms. Build. Environ. 2018, 133, 73–82. [Google Scholar] [CrossRef] [Green Version]
  40. Abowitz, D.A.; Toole, T.M. Mixed method research: Fundamental issues of design, validity, and reliability in construction research. J. Constr. Eng. Manag. 2009, 136. [Google Scholar] [CrossRef]
  41. Creswell, J.W.; Clark, V.L.P. Designing and Conducting Mixed Methods Research; SAGE Publications, USA, Inc.: Thousand Oaks, CA, USA, 2007; ISBN 978-1412975179-13. [Google Scholar]
  42. Zou, P.X.; Xu, X.; Sanjayan, J.; Wang, J. A mixed methods design for building occupants’ energy behavior research. Energy Build. 2018, 166, 239–249. [Google Scholar] [CrossRef]
  43. Sarhadi, F.; Rad, V.B. The structural model for thermal comfort based on perceptions individuals in open urban spaces. Energy Build. 2020, 185, 107260. [Google Scholar] [CrossRef]
  44. Gunnarsen, L.; Fanger, P.O.; Fanger, P.O. Adaptation to indoor air pollution. Environ. Int. 1992, 18, 43–54. [Google Scholar] [CrossRef]
  45. Nguyen, A.T.; Singh, M.K.; Reiter, S. An adaptive thermal comfort model for hot humid South-East Asia. Build. Environ. 2012, 56, 291–300. [Google Scholar] [CrossRef] [Green Version]
  46. Chapter 9: Thermal Comfort. In ASHRAE Handbook Fundamentals; American Society of Heating, Refrigerating and Air-Conditioning Engineers, USA, Inc.: Atlanta, GA, USA, 2009; pp. 1–9.
  47. Trebilcock, M.; Soto-Muñoz, J.; Piggot-Navarrete, J. Evaluation of thermal comfort standards in office buildings of Chile: Thermal sensation and preference assessment. Build. Environ. 2020, 183, 107158. [Google Scholar] [CrossRef]
  48. Ministry of Trade, Industry and Energy (MOTIE). Regulation on Promotion of Rationalization of Energy Use by Public Institutions; Ministry of Trade, Industry and Energy: Sejong, Korea, 2018.
  49. Wu, Q.; Liu, J.; Zhang, L.; Zhang, J.; Jiang, L. Study on thermal sensation and thermal comfort in environment with moderate temperature ramps. Build. Environ. 2020, 171, 106640. [Google Scholar] [CrossRef]
  50. Xiong, Y.; Liu, J.; Kim, J. Understanding differences in thermal comfort between urban and rural residents in hot summer and cold winter climate. Build. Environ. 2019, 165, 106393. [Google Scholar] [CrossRef]
  51. Zhang, Y.; Zhao, R. Overall thermal sensation, acceptability and comfort. Build. Environ. 2008, 43, 44–50. [Google Scholar] [CrossRef]
  52. International Standard ISO 10551: 2009. Ergonomics of the Physical Environment-Subjective Judgement Scales for Assessing Physical Environment; International Organization for Standardization (ISO):: Geneva, Switzerland, 2009; p. 5. [Google Scholar]
  53. Luo, M.; Cao, B.; Damiens, J.; Lin, B.; Zhu, Y. Evaluating thermal comfort in mixed-mode buildings: A field study in a subtropical climate. Build. Environ. 2015, 88, 46–54. [Google Scholar] [CrossRef]
  54. Khalid, W.; Zaki, S.A.; Rijal, H.B.; Yakub, F. Investigation of comfort temperature and thermal adaptation for patients and visitors in Malaysian hospitals. Energy Build. 2019, 183, 484–499. [Google Scholar] [CrossRef]
  55. Goto, T.; Mitamura, T.; Yoshino, H.; Tamura, A.; Inomata, E. Long-term field survey on thermal adaptation in office buildings in Japan. Building Environ. 2007, 42, 3944–3954. [Google Scholar] [CrossRef]
  56. Indraganti, M.; Ooka, R.; Rijal, H.B. Thermal comfort in offices in summer: Findings from a field study under the ‘setsuden’conditions in Tokyo. Build. Environ. 2013, 61, 114–132. [Google Scholar] [CrossRef]
  57. Tanabe, S.; Iwahashi, Y.; Tsushima, S. Thermal comfort and productivity in offices under mandatory electricity savings after great East Japan earthquake. In Proceedings of the 7th Windsor Conference: The Changing Context of Comfort in an Unpredictable World Cumberland Lodge, Windsor, UK, 12–15 April 2012. [Google Scholar]
  58. Rupp, R.F.; Kim, J.; Ghisi, E.; de Dear, R.J. Thermal sensitivity of occupants in different building typologies: The Griffiths Constant is a Variable. Energy Build. 2019, 200, 11–20. [Google Scholar] [CrossRef]
  59. Liu, Y.; Dong, Y.; Song, C.; Wang, Y.; Liu, L.; Liu, J. A tracked field study of thermal adaptation during a short-term migration between cold and hot-summer and warm-winter areas of China. Build. Environ. 2017, 124, 90–103. [Google Scholar] [CrossRef]
Figure 1. Locations of measurement instruments and questionnaire respondents.
Buildings 12 00058 g001
Figure 2. Questionnaire items and rating scale used in this study: (top) the seven-point scale for the thermal sensation vote (TSV) and (bottom) the seven-point scale for the comfort sensation vote (CSV).
Buildings 12 00058 g002
Figure 3. Changes in indoor air temperature TA (A) and radiant temperature Tr (B) at 10:00 (a), 14:00 (b) and 17:00 (c).
Buildings 12 00058 g003
Figure 4. Thermal comfort response results according to the difference between the TA and Tr: (a) TSV for (i) TA = 26 °C and (ii) TA = 28 °C, and (b) CSV for (i) TA = 26 °C and (ii) TA = 28 °C.
Buildings 12 00058 g004
Figure 5. Changes in the thermal sensations of the subjects.
Buildings 12 00058 g005
Figure 6. Proportions of mTSV: (a) Group A (window); (b) Group B (corridor).
Buildings 12 00058 g006
Figure 7. Regression analysis of mean thermal sensation (MTS) and indoor operative temperature (Top).
Buildings 12 00058 g007
Table 1. Overview of the target building.
CategoryContent
Buildings 12 00058 i001LocationSangyeok-dong, Buk-gu, Daegu
ScaleOne basement floor and 17 floors above the ground
FacilityBuilding G of K University
Total floor area37,277 m2
Experimental area133 m2
Facility useOffice space
Cooling methodCentral HVAC system (central cooling system)
Building features24 mm low-e double glass
U-value1.690 W/m2K
SHGC0.486
Table 2. Test range and precision of the measurement instruments.
ModelEnvironmental Parameters MeasuredTest RangePrecisionResolution
TESTO 480Air temperature (TA, °C)0–50 °C±0.1 °C0.1 °C
Radiant temperature (Tr, °C) 0–120 °C −40 to 1000 °C-
Data loggerAir temperature (TA, °C)0–50 °C -
Table 3. Personal characteristics of the experimental subjects.
SubjectsAgeHeight (cm)
MeanσMeanσ
Male (N:17)26.41.51756.5
Female (N:23)25.61.8166.36.2
σ is standard deviation.
Table 4. Mean solar radiation data per hour in the experimental area.
(MJ/m2)Time
9:0010:0011:0012:0013:0014:0015:0016:0017:0018:00
Solar radiation1.561.622.282.582.702.972.782.001.51.03
Table 5. Summary of physical and subjective data.
DataPhysicalSubjective
TA (°C)Tr (°C)TSVCSV
Max30.535.5--
mean25.726.754
σ1.52.71.51.3
σ is standard deviation.
Table 6. Regression analysis of comfort temperature according to group.
GroupRegression EquationR2p ValueComfort Temperature
Group Ay = 0.402x − 9.9680.5150.00024.7 °C
Group By = 0.307x − 8.7350.3780.00128.4 °C
Publisher’s Note: MDPI stays neutral with regard to jurisdictional claims in published maps and institutional affiliations.

