
Response Spectra-Based Post-Earthquake Rapid Structural Damage Estimation Approach Aided with Remote Sensing Data: 2020 Samos Earthquake


Abstract
:1. Introduction
- (i)
- Using a CNN to extract buildings from high-resolution remote sensing imagery pre- and post-earthquake and thus, detect collapsed buildings;
- (ii)
- Using shadow information from high-resolution satellite imagery to calculate building heights;
- (iii)
- Estimation of fundamental vibration periods of detected buildings using the calculated building heights;
- (iv)
- Comparing the fundamental periods with the response spectra of ground shaking gathered from the critical accelerometer station for predicting damaged buildings;
- (v)
- Proposing a model for rapid damage estimation and prediction for post-earthquake analyses.
2. Materials and Methods
2.1. Study Area
2.2. Methodology
2.2.1. Remote Sensing Data and Techniques
2.2.2. Response Spectra-Based Damage Estimation
3. Results
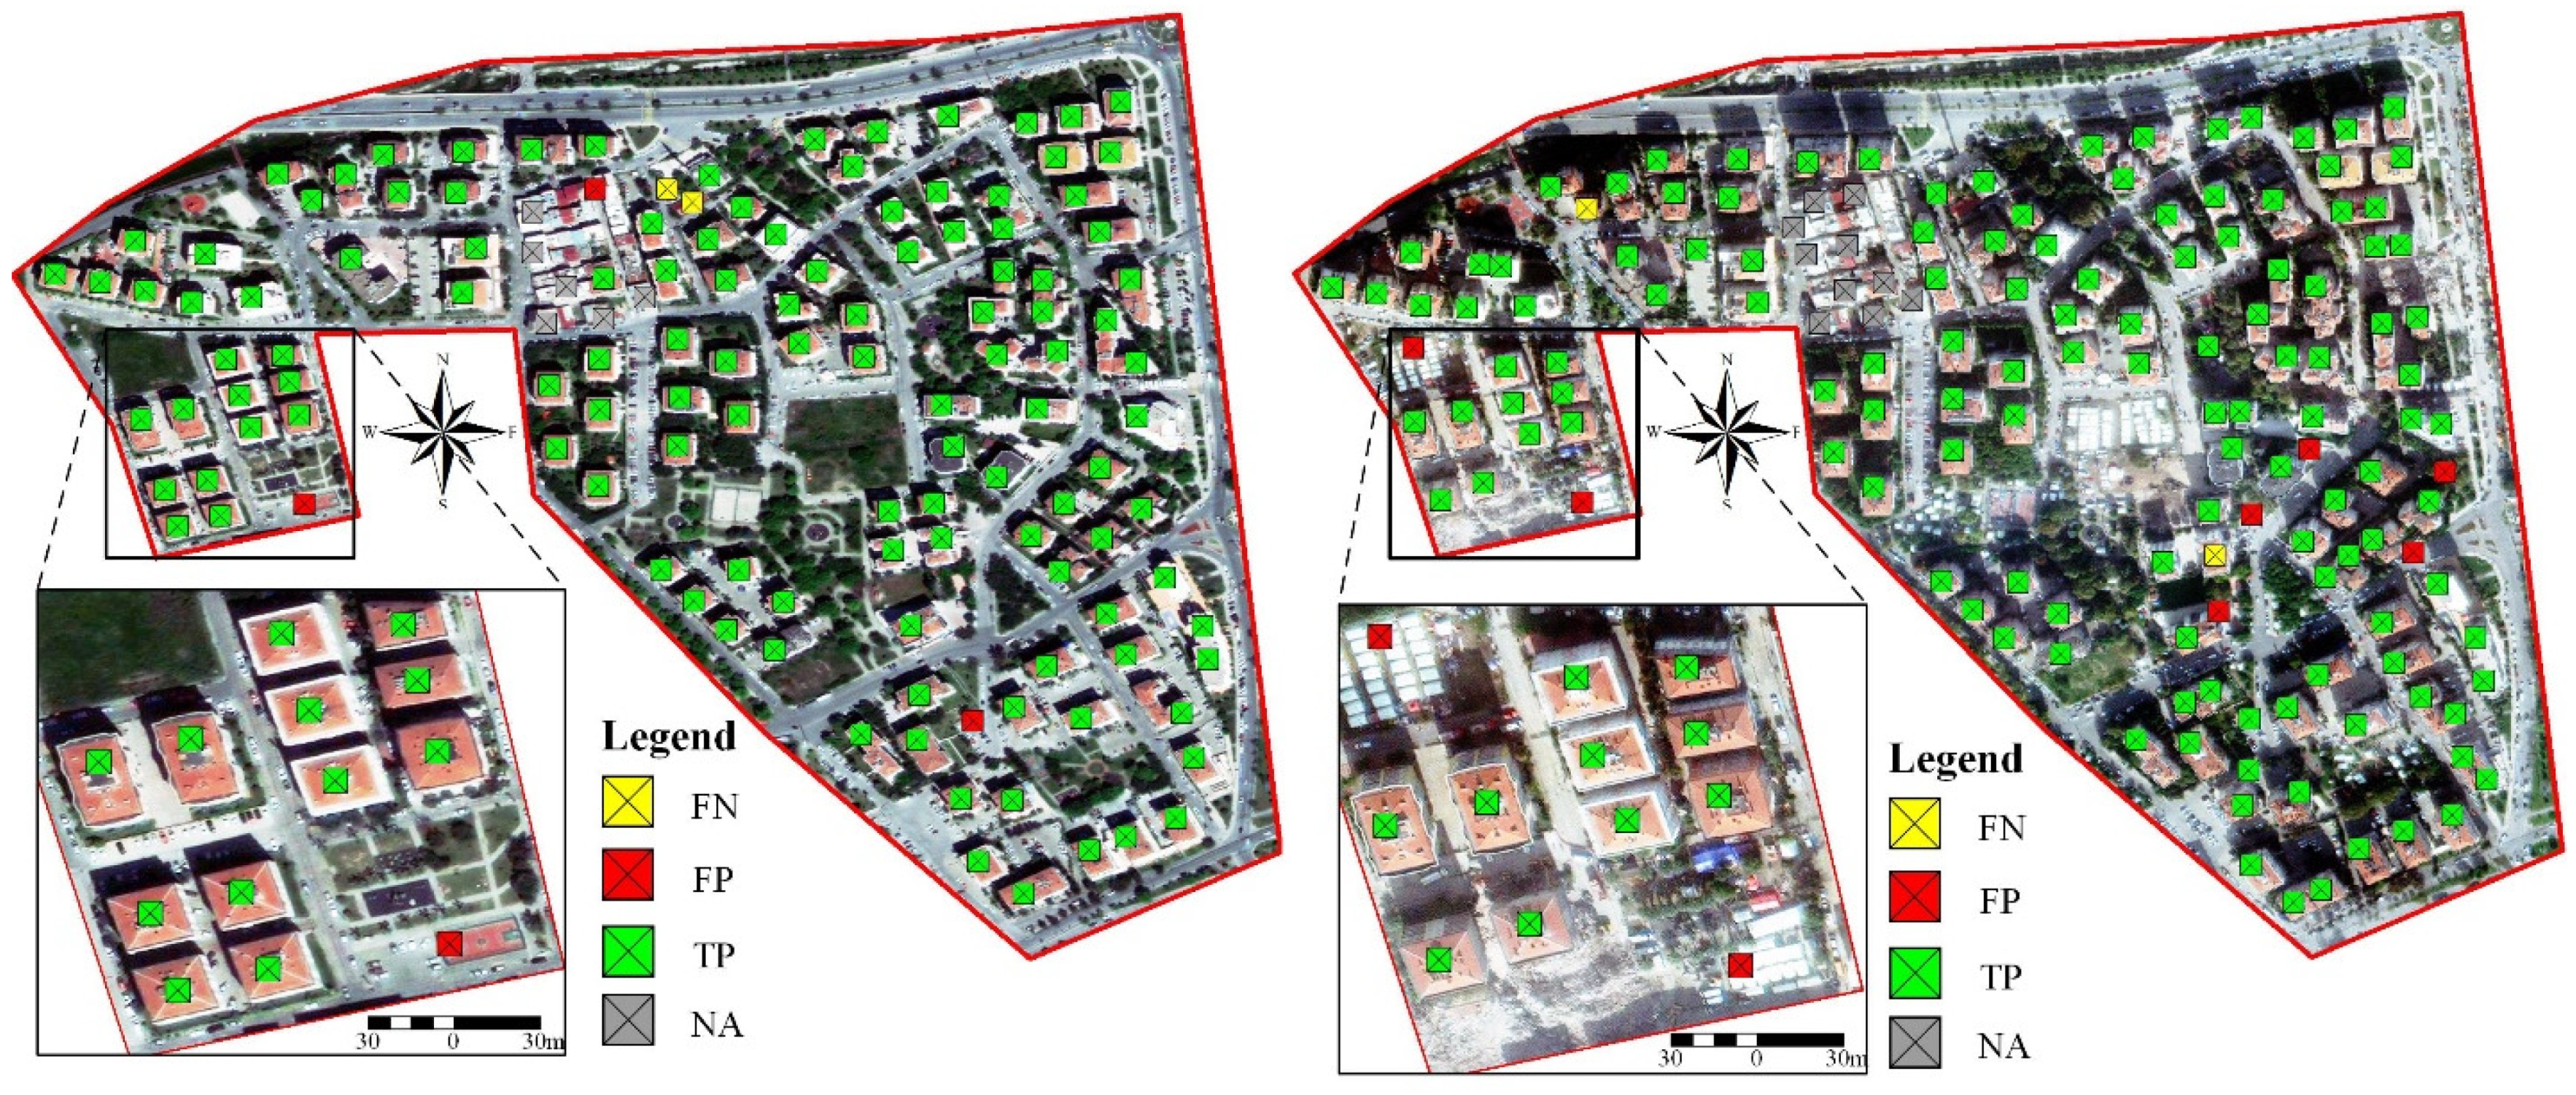
3.1. Remote Sensing
3.2. Structural Damage Estimation Results
4. Discussion
5. Conclusions
- The proposed approach appears to be efficient in diverting the site inspectors to the buildings expected to be heavily damaged. The accuracy assessment showed that the sensitivity (Recall) of the method is high (91%). The necessary time spent by the in situ damage assessment teams to detect the critical buildings that can cause casualties in a possible strong aftershock would have been significantly reduced (more than 50%) for the study area.
- The proposed approach uses remote sensing techniques to estimate the building heights from satellite images that can be provided anywhere on the earth, so the proposed methodology can be applied regardless of having an inventory database that includes building height information for the region.
- Integration with an existing building inventory in a GIS environment can provide more accurate results. Possible knowledge about the building capacity would be beneficial in addition to seismic demand provided from response spectra.
- The proposed approach can be used for the regions where the fragility curves do not exist.
- The critical seismic recording station selection is based on correlations between the selected region and the soil properties of the station locations and PGV, Housner, and Arias intensity values of the ground motions recorded at the surrounding stations. So, a dense seismic recording network is needed to conduct the proposed methodology, or empirical GMPM’s or simulated datasets can be used.
- All peaks of the response spectra of ground motion at the selected critical station should be considered as crucial periods, especially if any of the peaks are above the design spectrum of the region.
- The empirical equation used to predict the elastic fundamental periods of the buildings should be region specific and represent the design spectra of the region and construction characteristics.
- Estimation of yield building periods can provide better damage predictions.
- The current state of the approach is limited to investigating RC buildings because of the used empirical period equation. Additionally, distinguishing masonry and RC buildings from each other using satellite images is a challenging task.
- The building height extraction methodology needs to be improved for the adjacent buildings and be automatized.
Author Contributions
Funding
Informed Consent Statement
Data Availability Statement
Conflicts of Interest
References
- Askan, A.; Gülerce, Z.; Roumelioti, Z.; Sotiriadis, D.; Melis, N.S.; Altindal, A.; Akbaş, B.; Sopaci, E.; Karimzadeh, S.; Kalogeras, I.; et al. The Samos Island (Aegean Sea) M7. 0 Earthquake: Analysis and engineering implications of strong motion data. Bull. Earthq. Eng. 2021. [Google Scholar] [CrossRef]
- Yakut, A.; Sucuoğlu, H.; Binici, B.; Canbay, E.; Donmez, C.; Ilki, A.; Caner, A.; Celik, O.C.; Ay, B. Performance of structures in İzmir after the Samos island earthquake. Bull. Earthq. Eng. 2021. [Google Scholar] [CrossRef]
- Erdik, M.; Şeşetyan, K.; Demircioğlu, M.; Hancılar, U.; Zülfikar, C. Rapid earthquake loss assessment after damaging earthquakes. Soil Dyn. Earthq. Eng. 2011, 31, 247–266. [Google Scholar] [CrossRef]
- Tong, X.; Hong, Z.; Liu, S.; Zhang, X.; Xie, H.; Li, Z.; Yang, S.; Wang, W.; Bao, F. Building-damage detection using pre-and post-seismic high-resolution satellite stereo imagery: A case study of the May 2008 Wenchuan earthquake. ISPRS J. Photogramm. Remote Sens. 2012, 68, 13–27. [Google Scholar] [CrossRef]
- Dong, L.; Shan, J. A comprehensive review of earthquake-induced building damage detection with remote sensing techniques. ISPRS J. Photogramm. Remote Sens. 2013, 84, 85–99. [Google Scholar] [CrossRef]
- Karimzadeh, S.; Matsuoka, M. A Preliminary Damage Assessment Using Dual Path Synthetic Aperture Radar Analysis for the M 6.4 Petrinja Earthquake (2020), Croatia. Remote Sens. 2021, 13, 2267. [Google Scholar] [CrossRef]
- Omarzadeh, D.; Karimzadeh, S.; Matsuoka, M.; Feizizadeh, B. Earthquake Aftermath from Very High-Resolution WorldView-2 Image and Semi-Automated Object-Based Image Analysis (Case Study: Kermanshah, Sarpol-e Zahab, Iran). Remote Sens. 2021, 13, 4272. [Google Scholar] [CrossRef]
- Amini Amirkolaee, H.; Arefi, H. CNN-based estimation of pre-and post-earthquake height models from single optical images for identification of collapsed buildings. Remote Sens. Lett. 2019, 10, 679–688. [Google Scholar] [CrossRef]
- Tang, R.; Liu, H.; Wei, J.; Tang, W. Supervised learning with convolutional neural networks for hyperspectral visualization. Remote Sens. Lett. 2020, 11, 363–372. [Google Scholar] [CrossRef]
- Li, W.; Fu, H.; Yu, L.; Cracknell, A. Deep learning based oil palm tree detection and counting for high-resolution remote sensing images. Remote Sens. 2017, 9, 22. [Google Scholar] [CrossRef] [Green Version]
- Chen, B.; Xiao, X.; Li, X.; Pan, L.; Doughty, R.; Ma, J.; Dong, J.; Qin, Y.; Zhao, B.; Wu, Z.; et al. A mangrove forest map of China in 2015: Analysis of time series Landsat 7/8 and Sentinel-1A imagery in Google Earth Engine cloud computing platform. ISPRS J. Photogramm. Remote Sens. 2017, 131, 104–120. [Google Scholar] [CrossRef]
- Wang, Z.; Underwood, J.; Walsh, K.B. Machine vision assessment of mango orchard flowering. Comput. Electron. Agric. 2018, 151, 501–511. [Google Scholar] [CrossRef]
- Mubin, N.A.; Nadarajoo, E.; Shafri, H.Z.M.; Hamedianfar, A. Young and mature oil palm tree detection and counting using convolutional neural network deep learning method. Int. J. Remote Sens. 2019, 40, 7500–7515. [Google Scholar] [CrossRef]
- Timilsina, S.; Sharma, S.; Aryal, J. Mapping urban trees within cadastral parcels using an object-based convolutional neural network. ISPRS Ann. Photogramm. Remote Sens. Spat. Inf. Sci. 2019, 4, 111–117. [Google Scholar] [CrossRef] [Green Version]
- Ocer, N.E.; Kaplan, G.; Erdem, F.; Kucuk Matci, D.; Avdan, U. Tree extraction from multi-scale UAV images using Mask R-CNN with FPN. Remote Sens. Lett. 2020, 11, 847–856. [Google Scholar] [CrossRef]
- Zhang, Q.; Wang, Y.; Liu, Q.; Liu, X.; Wang, W. CNN based suburban building detection using monocular high resolution Google Earth images. In Proceedings of the 2016 IEEE International Geoscience and Remote Sensing Symposium (IGARSS), Beijing, China, 10–15 July 2016. [Google Scholar]
- Hu, Y.; Guo, F. Building Extraction Using Mask Scoring R-CNN Network. In Proceedings of the 3rd International Conference on Computer Science and Application Engineering, Sanya, China, 22–24 October 2019. [Google Scholar]
- Nie, S.; Jiang, Z.; Zhang, H.; Cai, B.; Yao, Y. Inshore ship detection based on mask R-CNN. In Proceedings of the IGARSS 2018–2018 IEEE International Geoscience and Remote Sensing Symposium, Valencia, Spain, 22–27 July 2018. [Google Scholar]
- Nie, X.; Duan, M.; Ding, H.; Hu, B.; Wong, E.K. Attention Mask R-CNN for Ship Detection and Segmentation From Remote Sensing Images. IEEE Access 2020, 8, 9325–9334. [Google Scholar] [CrossRef]
- Chopra, A.K. Elastic response spectrum: A historical note. Earthq. Eng. Struct. Dyn. 2007, 36, 3–12. [Google Scholar] [CrossRef]
- Bommer, J.J.; Boore, D.M. Engineering Geology/Seismology, Encyclopedia of Geology; Elsevier Academic: Oxford, UK, 2005; pp. 499–514. [Google Scholar]
- Pan, T.-C.; Goh, K.S.; Megawati, K. Empirical relationships between natural vibration period and height of buildings in Singapore. Earthq. Eng. Struct. Dyn. 2014, 43, 449–465. [Google Scholar] [CrossRef]
- Hong, L.-L.; Hwang, W.-L. Empirical formula for fundamental vibration periods of reinforced concrete buildings in Taiwan. Earthq. Eng. Struct. Dyn. 2000, 29, 327–337. [Google Scholar] [CrossRef]
- Kaplan, O.; Guney, Y.; Dogangun, A. A period-height relationship for newly constructed mid-rise reinforced concrete buildings in Turkey. Eng. Struct. 2021, 232, 111807. [Google Scholar] [CrossRef]
- Akinci, A.; Cheloni, D.; Dindar, A. The 30 October 2020, M7. 0 Samos Island (Eastern Aegean Sea) Earthquake: Effects of source rupture, path and local-site conditions on the observed and simulated ground motions. Bull. Earthq. Eng. 2021, 19, 4745–4771. [Google Scholar] [CrossRef]
- Erdik, M.; Demircioğlu, M.; Cüneyt, T. Forensic Analysis Reveals the Causes of Building Damage in İzmir in the Oct. 30 Aegean Sea Earthquake. 2020. Temblor Website. Available online: https://temblor.net/earthquake-insights/forensic-analysis-reveals-the-causes-of-building-damage-in-izmir-in-the-oct-30-aegean-sea-earthquake-12098/ (accessed on 25 October 2021).
- Günay, S.; Mosalam, K.M.; Archbold, J.; Dilsiz, A.; Beyazit, A.Y.; Wilfrid, G.D.; Gupta, A.; Concern, O.; Hassan, W.; María, S.; et al. StEER Preliminary Virtual Reconnaissance Report (PVRR): Aegean Sea Earthquake (M7.0), 30 October 2020. Available online: https://www.designsafe-ci.org/data/browser/public/designsafe.storage.published/PRJ-2953/#details-4779265402462334485-242ac116-0001-012 (accessed on 25 October 2021).
- Vîrghileanu, M.; Săvulescu, I.; Mihai, B.-A.; Nistor, C.; Dobre, R. Nitrogen dioxide (NO2) pollution monitoring with sentinel-5p satellite imagery over europe during the coronavirus pandemic outbreak. Remote Sens. 2020, 12, 3575. [Google Scholar] [CrossRef]
- CNN. Powerful Earthquake Jolts Turkey and Greece, Killing at Least 27. 31 October 2020. Available online: https://edition.cnn.com/2020/10/30/europe/earthquake-greece-turkey-aegean-intl/index.html (accessed on 25 October 2021).
- Csillik, O.; Cherbini, J.; Johnson, R.; Lyons, A.; Kelly, M. Identification of citrus trees from unmanned aerial vehicle imagery using convolutional neural networks. Drones 2018, 2, 39. [Google Scholar] [CrossRef] [Green Version]
- Metropolitan Municipality of Izmir (MMI) Izmir Earthquake Masterplan. 2000. Available online: http://www.izmir.bel.tr/izmirdeprem/izmirrapor.htm (accessed on 25 October 2021). (In Turkish).
- Turkish Accelerometric Database and Analysis System (TADAS). TADAS 2021. Available online: https://tadas.afad.gov.tr/login (accessed on 1 November 2021).
- TBEC-2018. Turkey Building Earthquake Code; AFAD, Ministry of Interior, Disaster and Emergency Management Presidency: Ankara, Turkey, 2018.
- Turkish Earthquake Code (TEC-2007): Specifications for Buildings to Be Built in Seismic Areas; Ministry of Public Works and Settlement: Ankara, Turkey, 2007. (In Turkish)
- Turkish Earthquake Resistant Design Code (TEC-1997): Specifications for Structures to Be Built in Disaster Areas; Ministry of Public Works and Settlement: Ankara, Turkey, 1997. (In Turkish)
- Turkish Earthquake Code (TEC-1975): Specifications for Buildings to Be Built in Seismic Areas; Ministry of Public Works and Settlement: Ankara, Turkey, 1975. (In Turkish)
- Onder Cetin, K.; Mylonakis, G.; Sextos, A.; Stewart, J.P. Seismological and Engineering Effects of the M 7.0 Samos Island (Aegean Sea) Earthquake. Available online: http://learningfromearthquakes.org/images/earthquakes/2020_Samos_Greece_Izmir_Turkey/Samos_Island_Earthquake_Final_Report.pdf (accessed on 25 October 2021).
- Stratoulias, D.; Nuthammachot, N. Air quality development during the COVID-19 pandemic over a medium-sized urban area in Thailand. Sci. Total Environ. 2020, 746, 141320. [Google Scholar] [CrossRef]
- Ilki, A.; Halici, O.; Kupcu, E.; Comert, M.; Demir, C. Modifications on seismic damage assessment system of TCIP based on reparability. In Proceedings of the 17th World Conference on Earthquake Engineering 17WCEE, Sendai, Japan, 22 April 2020. [Google Scholar]
- Boduroglu, H.; Ozdemir, P.; Binbir, E.; Ilki, A. Seismic damage assessment methodology developed for Turkish compulsory insurance system. In Proceedings of the 9th Annual International Conference of the International Institute for Infrastructure Renewal and Reconstruction, Brisbane, Australia, 8–10 July 2013. [Google Scholar]
- Kaplan, G.; Kaplan, O. PlanetScope Imagery for Extracting Building Inventory Information. Environ. Sci. Proc. 2021, 5, 19. [Google Scholar] [CrossRef]
- Boore, D.M.; Stewart, J.P.; Skarlatoudis, A.A.; Seyhan, E.; Margaris, B.; Theodoulidis, N.; Scordilis, E.; Kalogeras, I.; Klimis, N.; Melis, N.S. A ground-motion prediction model for shallow crustal earthquakes in Greece. Bull. Seismol. Soc. Am. 2021, 111, 857–874. [Google Scholar] [CrossRef]
- Karimzadeh, S.; Askan, A.; Erberik, M.A.; Yakut, A. Seismic damage assessment based on regional synthetic ground motion dataset: A case study for Erzincan, Turkey. Nat. Hazards 2018, 92, 1371–1397. [Google Scholar] [CrossRef]
- Bayhan, B.; Avcı, E.; Kayı, D.B. EGE DENİZİ SEFERİHİSAR AÇIKLIKLARI M6.6 DEPREMİ 30 EKİM 2020 YAPI ÖN DEĞERLENDİRME RAPORU; Bursa Teknik Üniversitesi, Deprem Mühendisliği Uygulama ve Araştırma Merkezi, Bursa, Turkey, 2020. (In Turkish). Available online: https://depo.btu.edu.tr/dosyalar/btu/Dosyalar/Rapor_Bursa.Teknik.Uni.Deprem.2020.10.30.pdf (accessed on 25 October 2021).
- National Earthquake Hazards Reduction Program: Recommended Provisions for the Development of Seismic Regulations for New Buildings; Building Seismic Safety Council: Washington, DC, USA, 1994.
- National Research Council: The National Building Code (NBC); National Research Council: Ottawa, ON, Canada, 1995.
- Ordaz, M.; Reinoso, E.; Jaimes, M.A.; Alcántara, L.; Pérez, C. High-resolution early earthquake damage assessment system for Mexico City based on a single-station. Geofísica Int. 2017, 56, 117–135. [Google Scholar] [CrossRef]
- Comert, R.; Kaplan, O. Object Based Building Extraction And Building Period Estimation from Unmanned Aerial Vehicle Data. In Proceedings of the ISPRS Annals of the Photogrammetry, Remote Sensing and Spatial Information Sciences, Beijing, China, 7–10 May 2018. [Google Scholar]
- Rossetto, T.; Elnashai, A. A new analytical procedure for the derivation of displacement-based vulnerability curves for populations of RC structures. Eng. Struct. 2005, 27, 397–409. [Google Scholar] [CrossRef]


| Station Code | Rrup (km) | Repi (km) | Vs30 (m/s) | Comp. | PGA (cm/s2) | PGV (cm/s) | PGD (cm) | Significant Duration (s) | Arias Intensity (cm/s) | Housner Intensity (cm) |
|---|---|---|---|---|---|---|---|---|---|---|
| 3513 | 65.05 | 72.00 | 196 | E-W | 94.67 | 14.42 | 3.15 | 20.16 | 35.30 | 84.81 |
| N-S | 106.28 | 17.11 | 2.90 | 20.59 | 33.17 | 79.76 | ||||
| U-D | 44.19 | 4.48 | 0.80 | 30.84 | 6.42 | 23.29 | ||||
| 3514 | 66.62 | 73.39 | 836 | E-W | 56.02 | 6.41 | 1.31 | 23.75 | 4.58 | 28.26 |
| N-S | 39.42 | 4.23 | 1.44 | 25.90 | 3.52 | 22.39 | ||||
| U-D | 25.15 | 1.94 | 0.73 | 27.17 | 2.10 | 10.91 | ||||
| 3520 | 68.46 | 75.78 | 875 | E-W | 58.55 | 8.37 | 2.04 | 5.21 | 5.21 | 36.08 |
| N-S | 36.11 | 4.65 | 1.13 | 3.60 | 3.60 | 24.21 | ||||
| U-D | 19.37 | 2.68 | 0.70 | 1.33 | 1.33 | 13.63 |
| Pre-Earthquake Image | Post-Earthquake Image | |
|---|---|---|
| P | 97.6 | 93.5 |
| R | 98.4 | 98.5 |
| F-score | 98.0 | 95.9 |
Publisher’s Note: MDPI stays neutral with regard to jurisdictional claims in published maps and institutional affiliations. |
© 2021 by the authors. Licensee MDPI, Basel, Switzerland. This article is an open access article distributed under the terms and conditions of the Creative Commons Attribution (CC BY) license (https://creativecommons.org/licenses/by/4.0/).
Share and Cite
Kaplan, O.; Kaplan, G. Response Spectra-Based Post-Earthquake Rapid Structural Damage Estimation Approach Aided with Remote Sensing Data: 2020 Samos Earthquake. Buildings 2022, 12, 14. https://doi.org/10.3390/buildings12010014
Kaplan O, Kaplan G. Response Spectra-Based Post-Earthquake Rapid Structural Damage Estimation Approach Aided with Remote Sensing Data: 2020 Samos Earthquake. Buildings. 2022; 12(1):14. https://doi.org/10.3390/buildings12010014
Chicago/Turabian StyleKaplan, Onur, and Gordana Kaplan. 2022. "Response Spectra-Based Post-Earthquake Rapid Structural Damage Estimation Approach Aided with Remote Sensing Data: 2020 Samos Earthquake" Buildings 12, no. 1: 14. https://doi.org/10.3390/buildings12010014