Review

3D Tree Reconstruction in Support of Urban Microclimate Simulation: A Comprehensive Literature Review

1
School of Built Environment, University of New South Wales, Sydney, NSW 2052, Australia
2
School of Civil and Environmental Engineering, University of New South Wales, Sydney, NSW 2052, Australia
*
Author to whom correspondence should be addressed.
Buildings 2021, 11(9), 417; https://doi.org/10.3390/buildings11090417
Submission received: 16 July 2021 / Revised: 9 September 2021 / Accepted: 11 September 2021 / Published: 17 September 2021
(This article belongs to the Collection Cities and Infrastructure)

Abstract

:
The negative climate change induced by rapid urbanization has become a global environmental issue. Numerous studies have been devoted to microclimate regulation functions performed by urban vegetation. Digital city information modeling provides a powerful tool for various simulations and data analytics for the sustainable development of urban areas. However, the method reconstructing urban trees is still in its early stage compared to the relatively mature building modeling. Most prior studies on tree reconstruction focused on retrieving geometric features, while other factors related to urban microclimate simulation were rarely addressed. This paper presents a comprehensive literature review and in-depth analysis covering two distinct research directions in relation to urban microclimate simulation. The first one is set on the identification of key factors related to trees’ impact on urban microclimate. The second one is dedicated to approaches for three-dimensional (3D) tree reconstruction. Based on the findings, the paper identifies information including trees’ geometric, physiological characteristics and relation to the surroundings required for 3D tree reconstruction in the context of urban microclimate simulation, and further assesses the potential of the 3D tree reconstruction approaches to accommodate these pieces of information. An appropriate 3D tree reconstruction approach, which allows for the supply of the required information for urban microclimate simulation, is recommended.

1. Introduction

With growing urbanization globally, the built environment and its residents are suffering from increasingly serious urban environment issues resulting from negative climate change effects such as global warming and the urban heat island (UHI) effect [1]. Such negative climate change effects derive from the rapid process of urbanization, where anthropogenic heat emissions rise while evaporative cooling decreases as artificial structures and surfaces gradually replace natural ones [2]. Some studies on energy efficiency and green performance in the built environment have focused on the embodied energy of building materials and energy consumption during the building operational phase [3,4,5]. On the other hand, the common urban features including vegetation coverage, ground surface albedos, increasing surface roughness and narrow urban canyon geometry exacerbating UHI effect, etc., are increasingly being considered recently, as they cause severe effects on the built environment, e.g., increasing energy and water use, unsatisfactory indoor and outdoor thermal comfort and decreasing health conditions and wellbeing [6,7,8,9]. Urban vegetation plays a significant role in mitigating such negative climate change effects due to its function in microclimate regulation [10,11]. Urban vegetation reduces the radiation absorbed by buildings and the ground through shading [12], cools the air temperature and ground temperature through evaporation [13,14,15,16] and considerably modifies the wind field in urban areas [17]. Therefore, there is significant value in investigating how to mitigate the negative impact of climate change in urban areas through the optimization of urban planning in which the role of urban vegetation is highly valued.
Computer science has been increasingly desired in urban planning and remote city monitoring in recent decades, for the efficient and meticulous management of cities. Two emerging concepts, namely Smart city and Digital twin have been proposed and promoted accordingly, along with the sophistication of information and communication technology (ICT), ubiquitous technologies [18,19,20] and the Internet of Things (IoT) [21]. The construction of a Smart city or Digital twin assists the monitoring of cities and allows for more effective decision-making [22], which benefits the sustainable development of urban areas. The linkage between real cities and the corresponding virtual digital representations becomes increasingly necessary. In parallel with this, city models and building information models are becoming widely used. In this research, a “city model” is used according to the OGC standard CityGML (https://www.ogc.org/standards/citygml, accessed on 13 August 2021), which defines it as a 3D model containing buildings, terrain, vegetation, transportation and water objects. A comprehensive city model including 3D digital models of urban objects would bridge the gap and provide a basic virtual environment for analysis and simulation of the urban areas. The potential of city models has been seen in many aspects, such as urban energy modeling [23].
From the perspective of city modeling from point cloud data, urban vegetation, compared to buildings, gains less attention and is usually represented in less detail or is completely omitted. While the 3D models of buildings can be reconstructed rapidly from optical or ranging sensors, the 3D modeling of urban vegetation is still at an early stage. Current studies on vegetation reconstruction focus on the geometry and morphology of urban vegetation, including a few physiological characteristics of urban vegetation (e.g., tree species, foliage distribution, leaf optical traits), but do not address basic geometric features [24]. As a result, the reconstructed urban vegetation models do not provide sufficient information about trees’ 3D structure, physiological characteristics and interactions with the surroundings. Consequently, these reconstructed models can hardly support applications such as accurate and comprehensive analysis of the urban microclimate.
On the other hand, from the perspective of urban microclimate simulation, the digital models carrying information about real trees in the simulated area can improve the accuracy of simulation results. In the past two decades, many studies have focused on involving trees in urban microclimate simulation (both thermal environment and air pollution) [25,26,27,28,29,30,31,32,33,34,35,36,37]. Although the simulation methods and simulation models keep improving, the representation of urban vegetation is generally hypothetical or overly simplified. For instance, some studies have parameterized urban vegetation in microclimate simulations [27,29,30]. However, the parameters of trees (e.g., foliage distribution, height, crown size, etc.) are usually empirical values [25,26,29,30] and the complex geometries of urban vegetation are seldom addressed [26]. Such representation of urban vegetation in urban microclimate simulation does not necessarily match the reality and limits the fidelity of a simulation result, thereby limiting the contribution to urban planning. Nowadays, the sensors have become smaller, cheaper and more portable so that they can be carried by different platforms. Hence, some studies have detected land cover information for urban microclimate simulation through applying hyperspectral imagery and light detection and ranging (LiDAR) techniques. However, the obtained data are usually at a low geometric resolution and cannot obtain the exact information about urban vegetation [38]. Therefore, it is valuable to determine a reliable way to provide realistic urban vegetation models with a high geometric resolution, sufficient physiological characteristics and accurate locations that can be used in urban microclimate simulation.
Urban trees play one of the most significant roles in regulating the urban microclimate, along with bushes and green spaces, which can be taken as a simpler form of “trees” in the reconstruction process. However, the association of urban microclimate simulation and tree reconstruction has hardly been considered comprehensively in prior studies, although some tree models have been used for a particular part of the microclimate, e.g., radiative transfer modeling [39,40,41,42], transpiration simulation [43], shadow effect evaluation [44], etc.
This paper aims to carry out a comprehensive literature review to identify key factors related to trees’ impact on the urban microclimate and to assess current tree reconstruction approaches. A tree reconstruction approach is proposed, which is expected to contain trees’ geometric features, physiological characteristics and relation with the surroundings. The trees therefore can be used in more comprehensive and accurate urban microclimate simulation. For the sake of simplicity, the composition of trees’ geometric features, physiological characteristics and relation with surroundings are collectively referred to as tree information in this paper.
The remainder of this paper is arranged as follows: Section 2 illustrates the research methodology and the literature search approach. Section 3 reviews the studies evaluating trees’ impact on the urban microclimate and identifies all key factors concerned with the evaluation. Section 4 provides in-depth analysis of studies on tree reconstruction and their advantages and disadvantages. Section 5 analyzes the potential of tree reconstruction approaches with respect to identifying key factors and proposes an approach to reconstruct trees in support of the urban microclimate simulation.

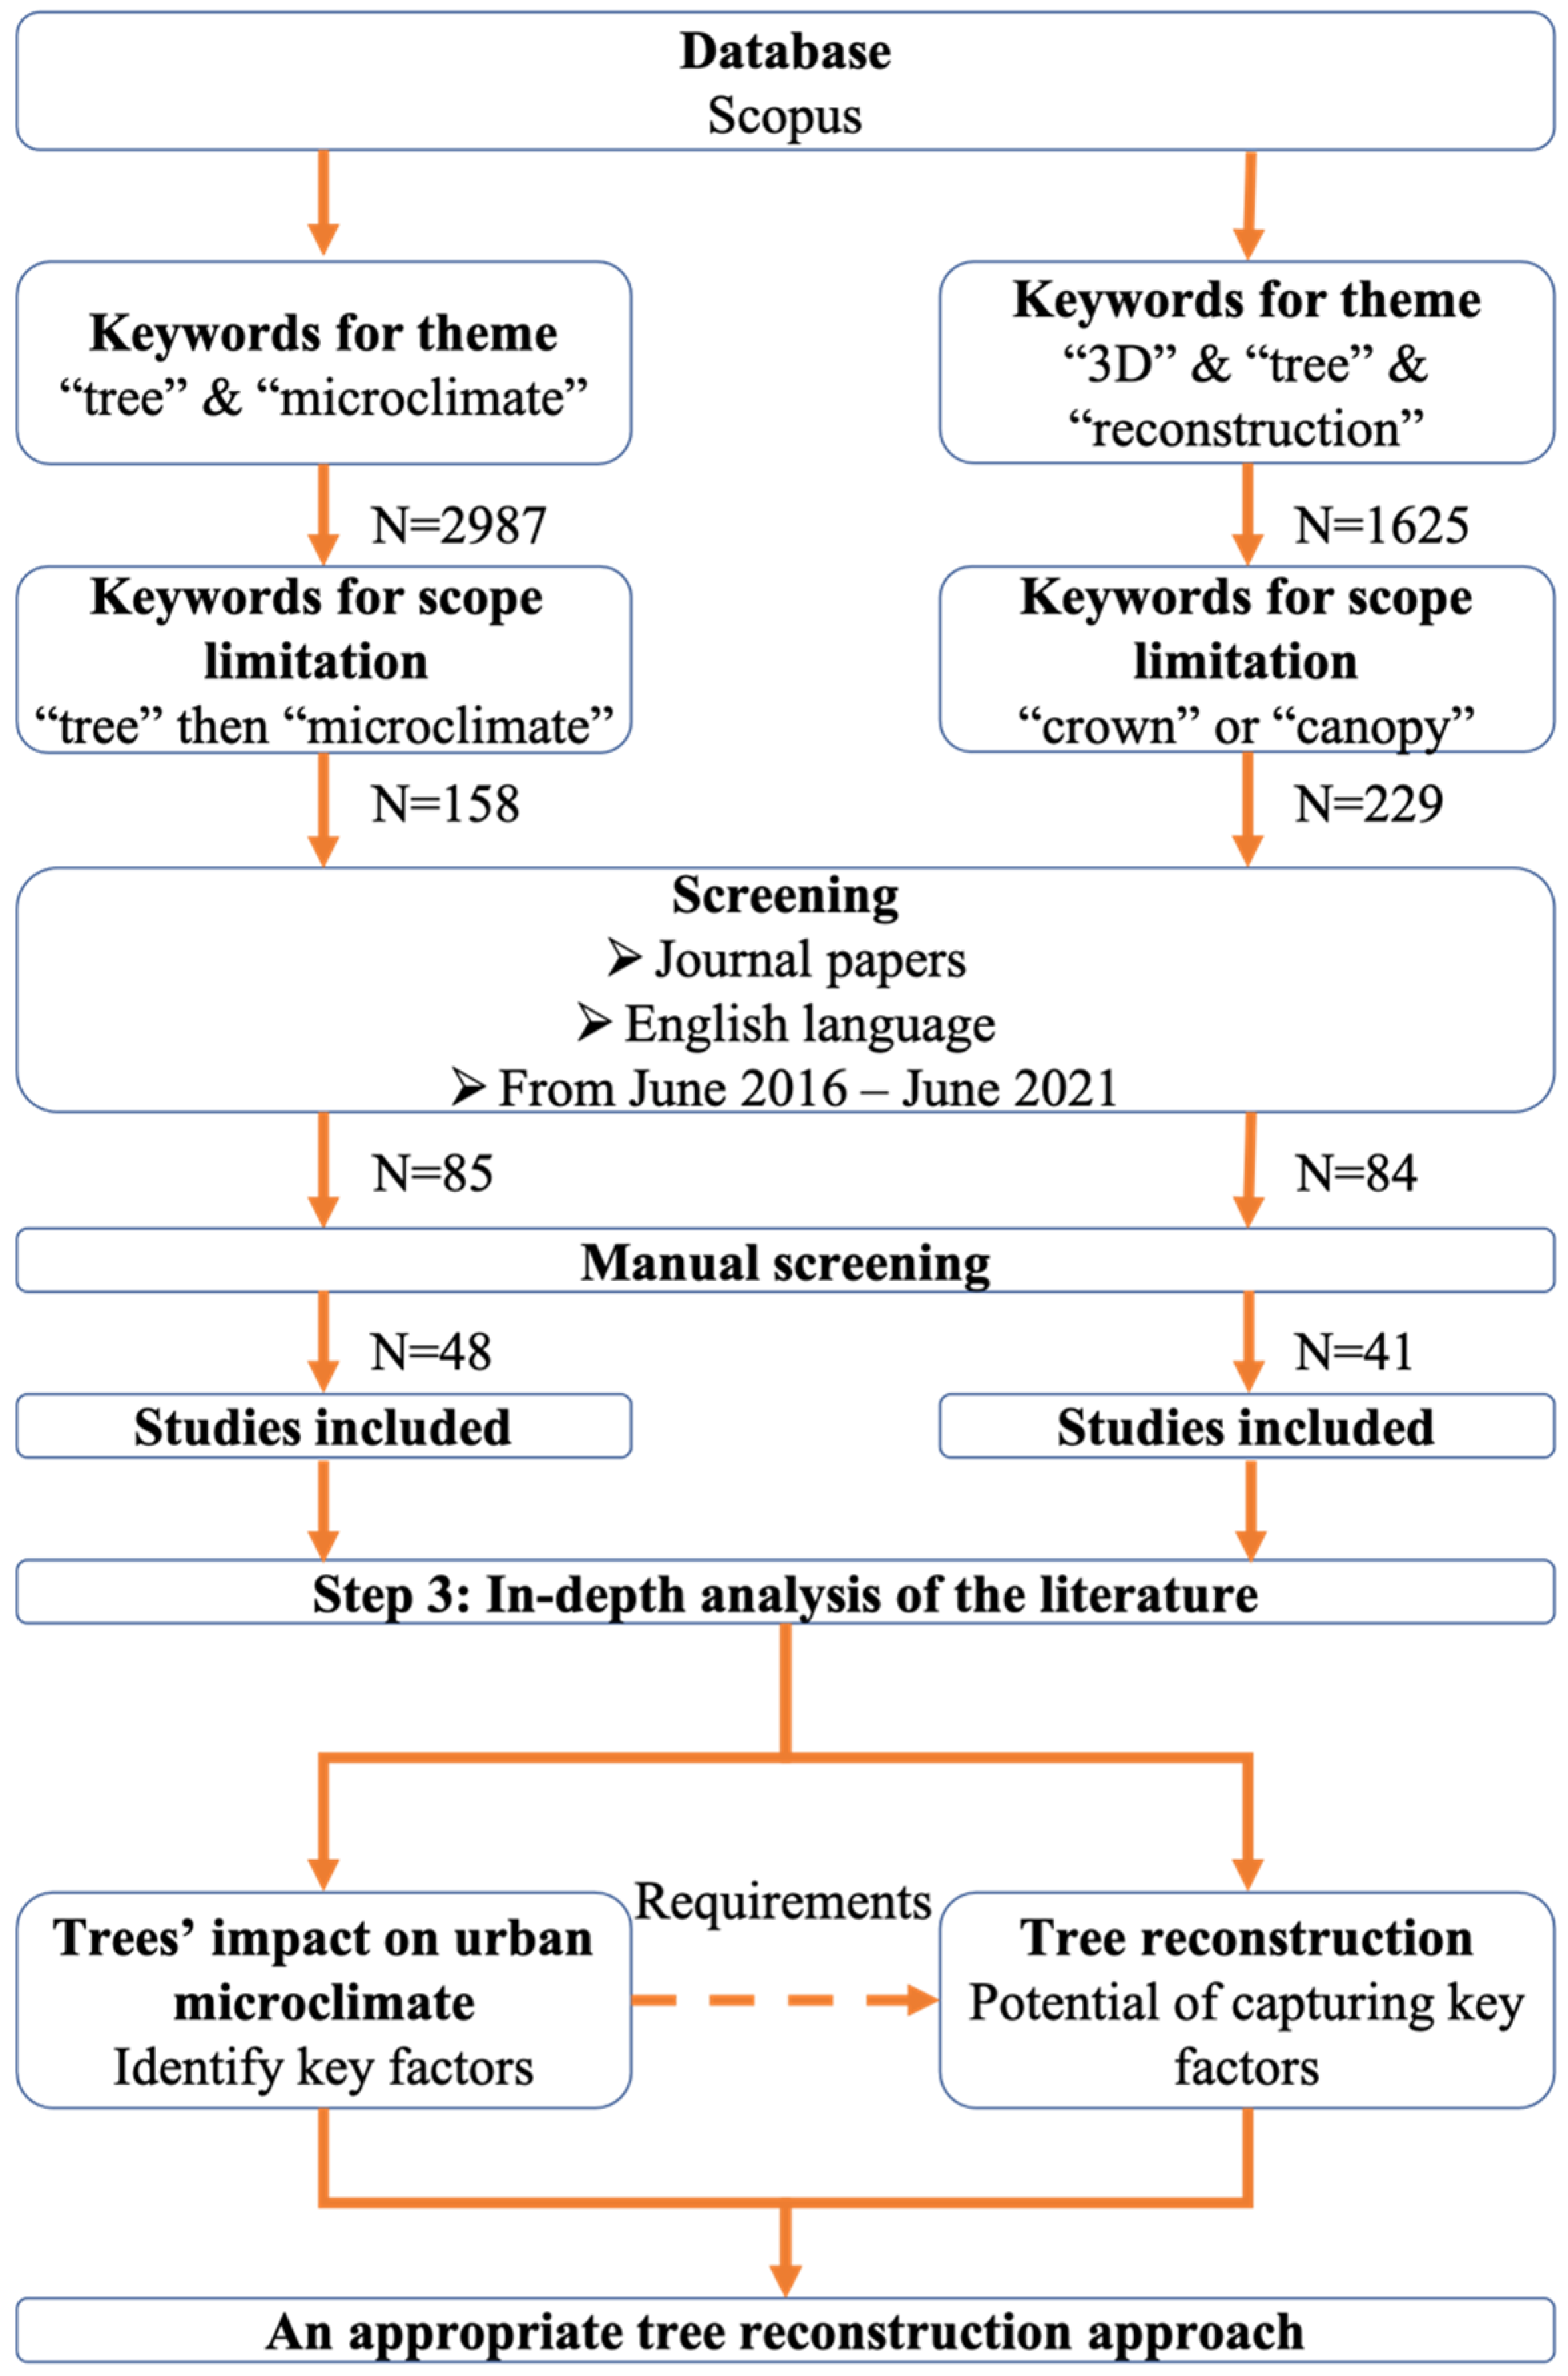
2. Research Methodology and Materials

Sophisticated 3D tree models reconstructed with sufficient information are crucial as the basis of urban microclimate simulation, which calls for a consolidated view on how to evaluate trees’ impact on the urban microclimate and tree reconstruction. Hence, in this research, a qualitative-based literature review was conducted systematically to address two research directions (trees’ function in microclimate regulation and tree reconstruction), followed by corresponding in-depth analysis and discussions. As a qualitative-based literature review, the purpose of this research is not to exhaust data, but to construct new knowledge from the structured interpretation of a body of existing work [45]. The review process is given in Section 2.1 for a clear overview of the methodology of this research. Details about the procedure of searching for the literatures are presented in Section 2.2, including the keywords used and the screening rules.

2.1. Research Process

The whole research process is illustrated in Figure 1, including a literature review and the corresponding in-depth analysis. In the literature review, Scopus, as one of the largest research publication databases, was chosen for the literature search, since it stores ranges of quality publications in various interdisciplinary research topics [46].
For both research directions (trees’ function in urban microclimate regulation and tree reconstruction), a literature search was first conducted with specific keywords (which are discussed in Section 2.2). The searched literature was then limited to journal papers published in English over the last 5 years (June 2016–June 2021) with several filters. This research concentrates on the last 5 years because (1) these studies are expected to rely on the previous publications and provide improvements, and (2) many tree reconstruction approaches have been optimized and developed in recent years. An in-depth analysis was subsequently conducted to identify tree factors for urban microclimate and explore the potential of current tree reconstruction approaches to capture them. Finally, an appropriate tree reconstruction approach was proposed to reconstruct tree models in support of urban microclimate simulation.

2.2. Research Materials

The literature search algorithms are listed in Table 1. To search the literature evaluating trees’ contribution to regulating the urban microclimate, the keywords “tree” and “microclimate” were first used to set the theme of the literature search. “Urban” and “regulation” were then added to restrict the scope of the search result. Eighty-five papers remained after limiting the search results to English articles published within 5 years. The literature search algorithm is listed in the second row in Table 1. All 85 papers were subsequently reviewed manually and only those closely related to the impact of urban trees/vegetation on urban microclimate were selected. The keywords were selected according to the purpose of this paper.
Trees’ overall impact on the urban microclimate can be divided into many aspects, including reduced ambient and surface temperatures, increased evapotranspiration, absorption and deposition of pollutants and control of the wind field. The reconstructed tree models should be able to support all these aspects. Therefore, instead of using particular keywords (“e.g., “temperature”, “pollution”, “humidity”, etc.), we used the more generic keyword “microclimate”. We argue it allows to search for papers discussing these various aspects comprehensively and therefore the review could identify tree reconstruction approaches to support urban microclimate simulations. In the manual screening process, a few key papers were also selected from the references of the retrieved papers to enhance the comprehensiveness of the review. Finally, 48 papers were included in the in-depth analysis.
As for the studies on tree reconstruction, the keywords “3D”, “tree” and “reconstruction” were used to search the literature for tree reconstruction. Subsequently, the addition of the keywords ”crown” and “canopy” restrained the search scope, since the foliage parts of trees have been identified as the key contributor to regulating the urban microclimate from in-depth analysis of the literature evaluating trees’ impact on urban microclimate. The research algorithm is listed in the third row of Table 1. A total of 84 papers remained after restricting the search results to articles published in English within 5 years. These papers were further screened manually. Forty-one papers were recognized as highly relevant to tree reconstruction with crowns or canopies and were included in in-depth analysis.

3. In-Depth Analysis of Studies on Evaluating Trees’ Impact on Urban Microclimate

Two types of methods are found in the reviewed papers that investigated trees’ impact on the urban microclimate, namely numerical simulation and field measurement. In numerical simulation, the Computational Fluid Dynamic (CFD) models are commonly used to evaluate the urban microclimate based on trees’ evaporation, aerodynamic performances and shadow effect. In CFD models, trees are generally seen as porous mediums, which are “modeled by the addition of a momentum source (sink) term to the standard fluid flow equations” [25]. In addition to CFD models, urban canopy models (UCMs) are also commonly used to conduct urban microclimate simulation. UCMs simplify the urban form as the archetypal “urban canyon” [47] and associate microclimate processes in numerous other ways relative to real neighborhoods [37]. In UCMs, trees are always represented with simple shapes (e.g., circular shapes) in the cross-sectional plane with several parameters (e.g., LAD, height, crown radius, view factors, etc.) [29,30]. For the studies that used numerical simulation, the trees’ information they focused on and set in the simulation are recorded for in-depth analysis.
In the field measurement methods, numerous environmental sensors have been used to measure urban microclimate data (e.g., air temperature, relative humidity and radiation etc.), and human observations or digital devices have been used to detect trees’ information. Due to the huge time and cost spent on the installation and maintenance of onsite sensor networks, some studies used sensors mounted on unmanned or manned aerial vehicles (e.g., infrared thermography) to observe land surface temperature more efficiently [48,49,50]. Commonly, in the field measurement methods, the considered factors and measured tree information are recorded. Other factors that have been neither included in the numerical simulation nor the field measurement but mentioned in their future works are also summarized to make this in-depth analysis comprehensive.
Guanwardena et al. [51] determined a key method in which trees impact the urban microclimate through a meta-analysis of various studies. The important factors related to the trees’ function in microclimate regulation mentioned from their conclusions are also recorded for in-depth analysis in this research.
All key factors identified from a total of 48 papers are summarized and divided into five groups: Geometric features, crown-level physiological characteristics, leaf-level physiological characteristics, locations of trees and surrounding factors, which are listed in Table 2, Table 3, Table 4 and Table 5, followed by an in-depth analysis.

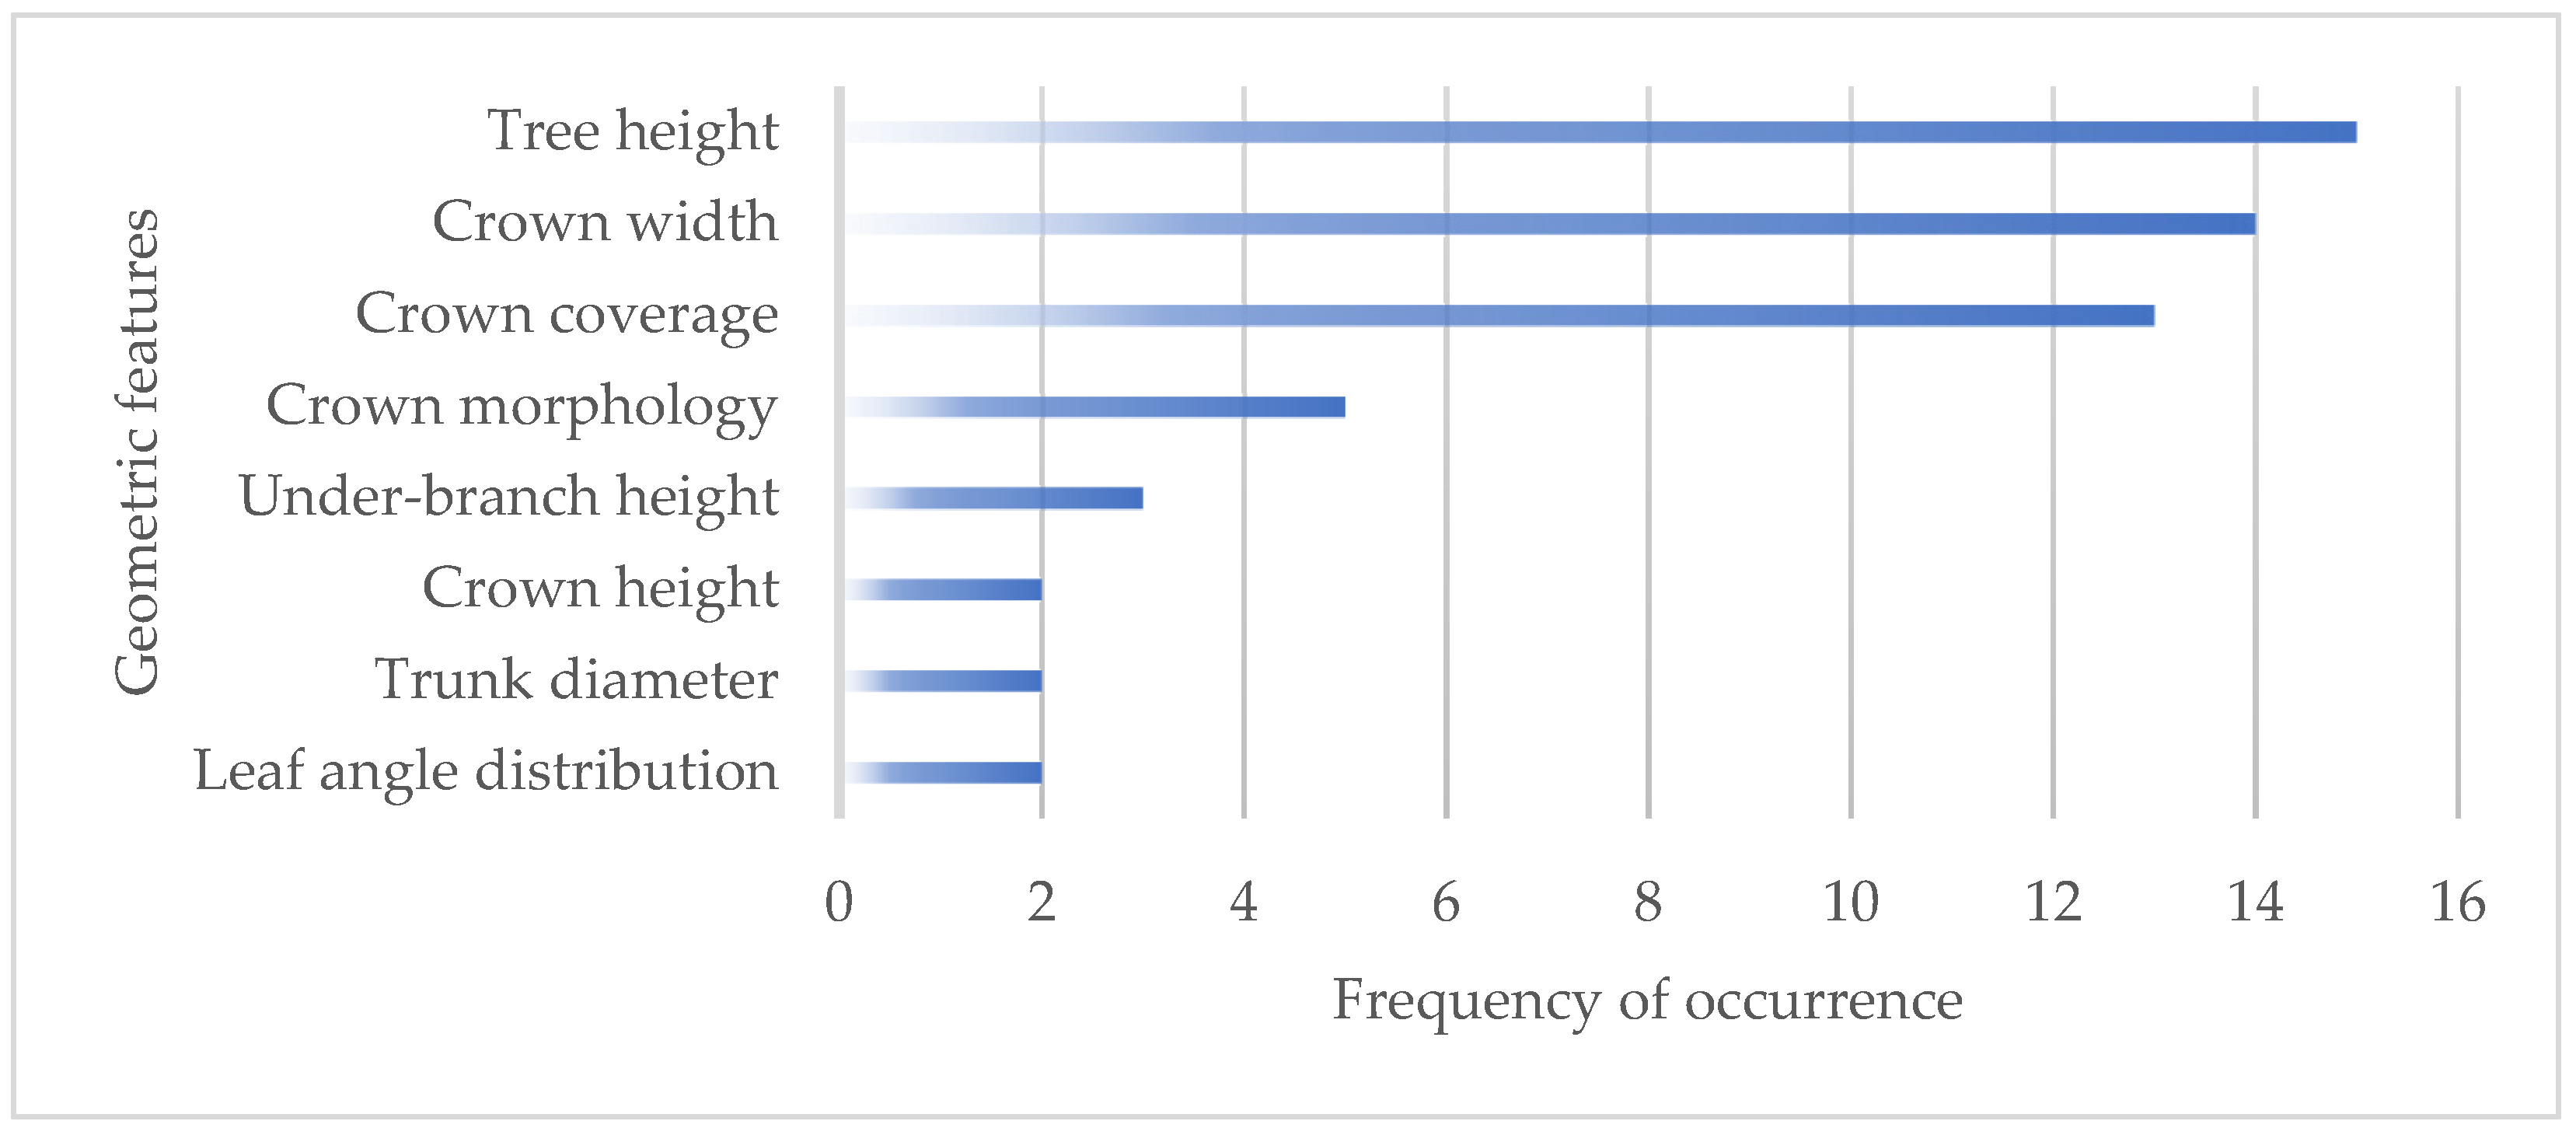
3.1. Geometric Features

Trees’ geometric features are the most elementary information when evaluating the contribution of an individual tree to regulating the urban microclimate. The geometries of trees are highly associated with the radiation reflected or blocked, the heat reduced through the evaporation in the area and the wind dragged, thereby impacting the urban microclimate. A positive correlation between the tree size and the functions provided by the trees has been proved [52].
The geometric features identified in the 48 papers included in the in-depth analysis are listed in Table 2. The number of papers referring to them is seen as their frequency of occurrence and is represented visually in Figure 2. Tree height, crown width and crown coverage are three dominative geometric features considered in the 48 papers, which occur 15, 14 and 13 times, respectively. Following this is crown morphology (or crown shape). It should be mentioned that crown morphology may be equally essential with tree height despite its low frequency of occurrence. Crown coverage, crown width and crown height are often used to describe the crown morphology for convenience in the quantitative analysis.
By contrast, trunk diameter and leaf angle distribution are less considered. Trunk diameter is directly related to tree age, which can be a crucial piece of information in some studies [53]. Leaf angle distribution is relatively labor-intensive and time-consuming to measure, which may explain its low frequency of occurrence.

3.2. Physiological Characteristics

Trees’ physiological characteristics denote trees’ biological parameters that determine trees’ performance. From the perspective of tree reconstruction, the large-scale characteristics are easier and more likely to be detected or evaluated than the small-scale ones, earning them more potential to be incorporated with the process of tree reconstruction. Hence, in this paper, trees’ physiological characteristics are divided into two categories in terms of scale: Crown-level and leaf-level physiological characteristics.

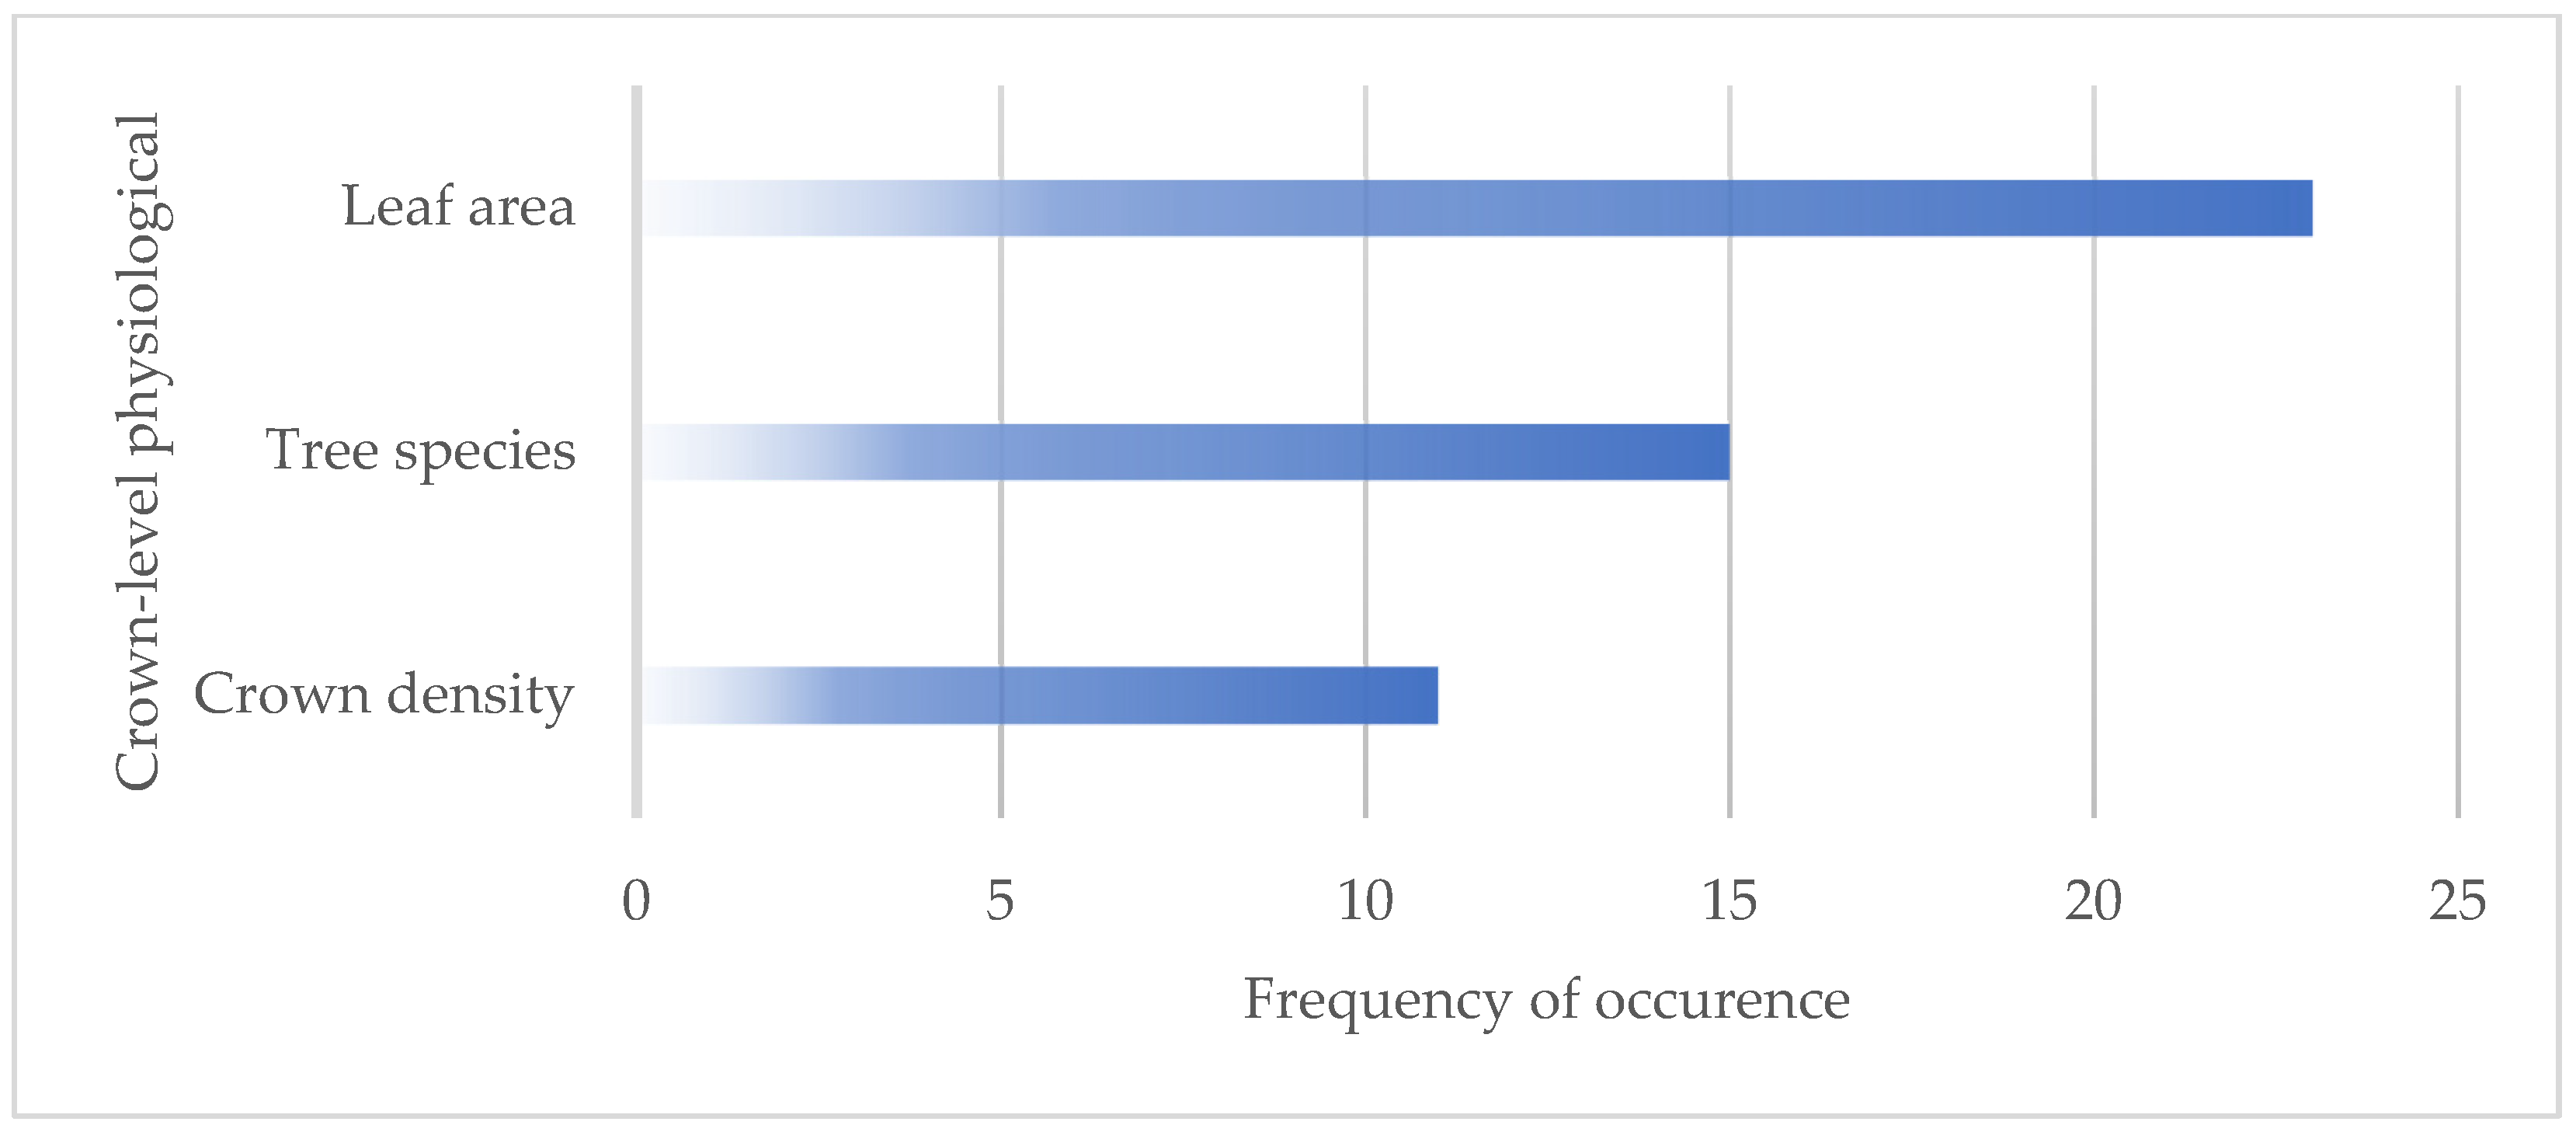
3.2.1. Crown-Level Physiological Characteristics

Generally, at crown or canopy level, two physiological characteristics, namely foliage distribution and tree species, are commonly mentioned, as listed in Table 3. The physiological characteristic of foliage distribution occurs most often (in total, 34 times in the 48 papers included in the in-depth analysis). With horizontal and vertical foliage distribution, it can be used to determine the “energy and mass fluxes in heterogeneous ecosystems” [74], estimate the canopy-scale regulated light use efficiency [75,76], assess photosynthetic capacity and simulate the exchanges of CO2, water vapor and other trace gases. The leaf area index (LAI) and leaf area density (LAD) are the mathematical indices describing 3D foliage distribution in a simple and quantitative way. LAD is defined as “the total one-sided leaf area of photosynthetic tissue per unit canopy volume” (m2/m3) [77] and LAI is its integral along the height, which denotes the total single-side leaf area per unit ground horizontal surface area (m2/m2).
By contrast, crown density is a vague indicator to describe the foliage distribution. Although it is often mentioned in the 48 papers analyzed, few give a clear definition. According to [78], crown density can be defined as “the mass of foliage present in the upper half of the crown, relative to the crown mass of an imaginary reference tree” and can be the basis to estimate tree volume, classify tree species and reflect the health status of trees [78,79].
Tree species is another important crown-level physiological characteristic, which is mentioned in 15 studies as a key factor related to trees’ impact on the urban microclimate. From the perspective of urban management or urban planning, it is meaningful to choose a tree species considered capable of withstanding the local future development and making positive changes to the urban climate [80]. Furthermore, tree species is often regarded as the determinant of the leaf-level physiological characteristics that are hard to directly obtain such as the leaf type, stomatal conductance and leaf optical traits [64,81,82,83] (introduced in Section 3.2.2). This makes it one of the dominant physiological characteristics.
The frequency of occurrence of each crown-level physiological characteristic is illustrated in Figure 3. As LAI and LAD are both indices to describe the leaf area in the crown, the frequencies of occurrence of LAI, LAD and total leaf area are tallied together to show their significance. It could be seen that the crown-level physiological characteristics are all high-frequency characteristics in the 48 papers included in the in-depth analysis, which shows their high degree of attention and their significant role in trees’ function in urban microclimate regulation [51,53,55,56,58,59,60,63,69,71,73,84,85,86,87,88,89,90].

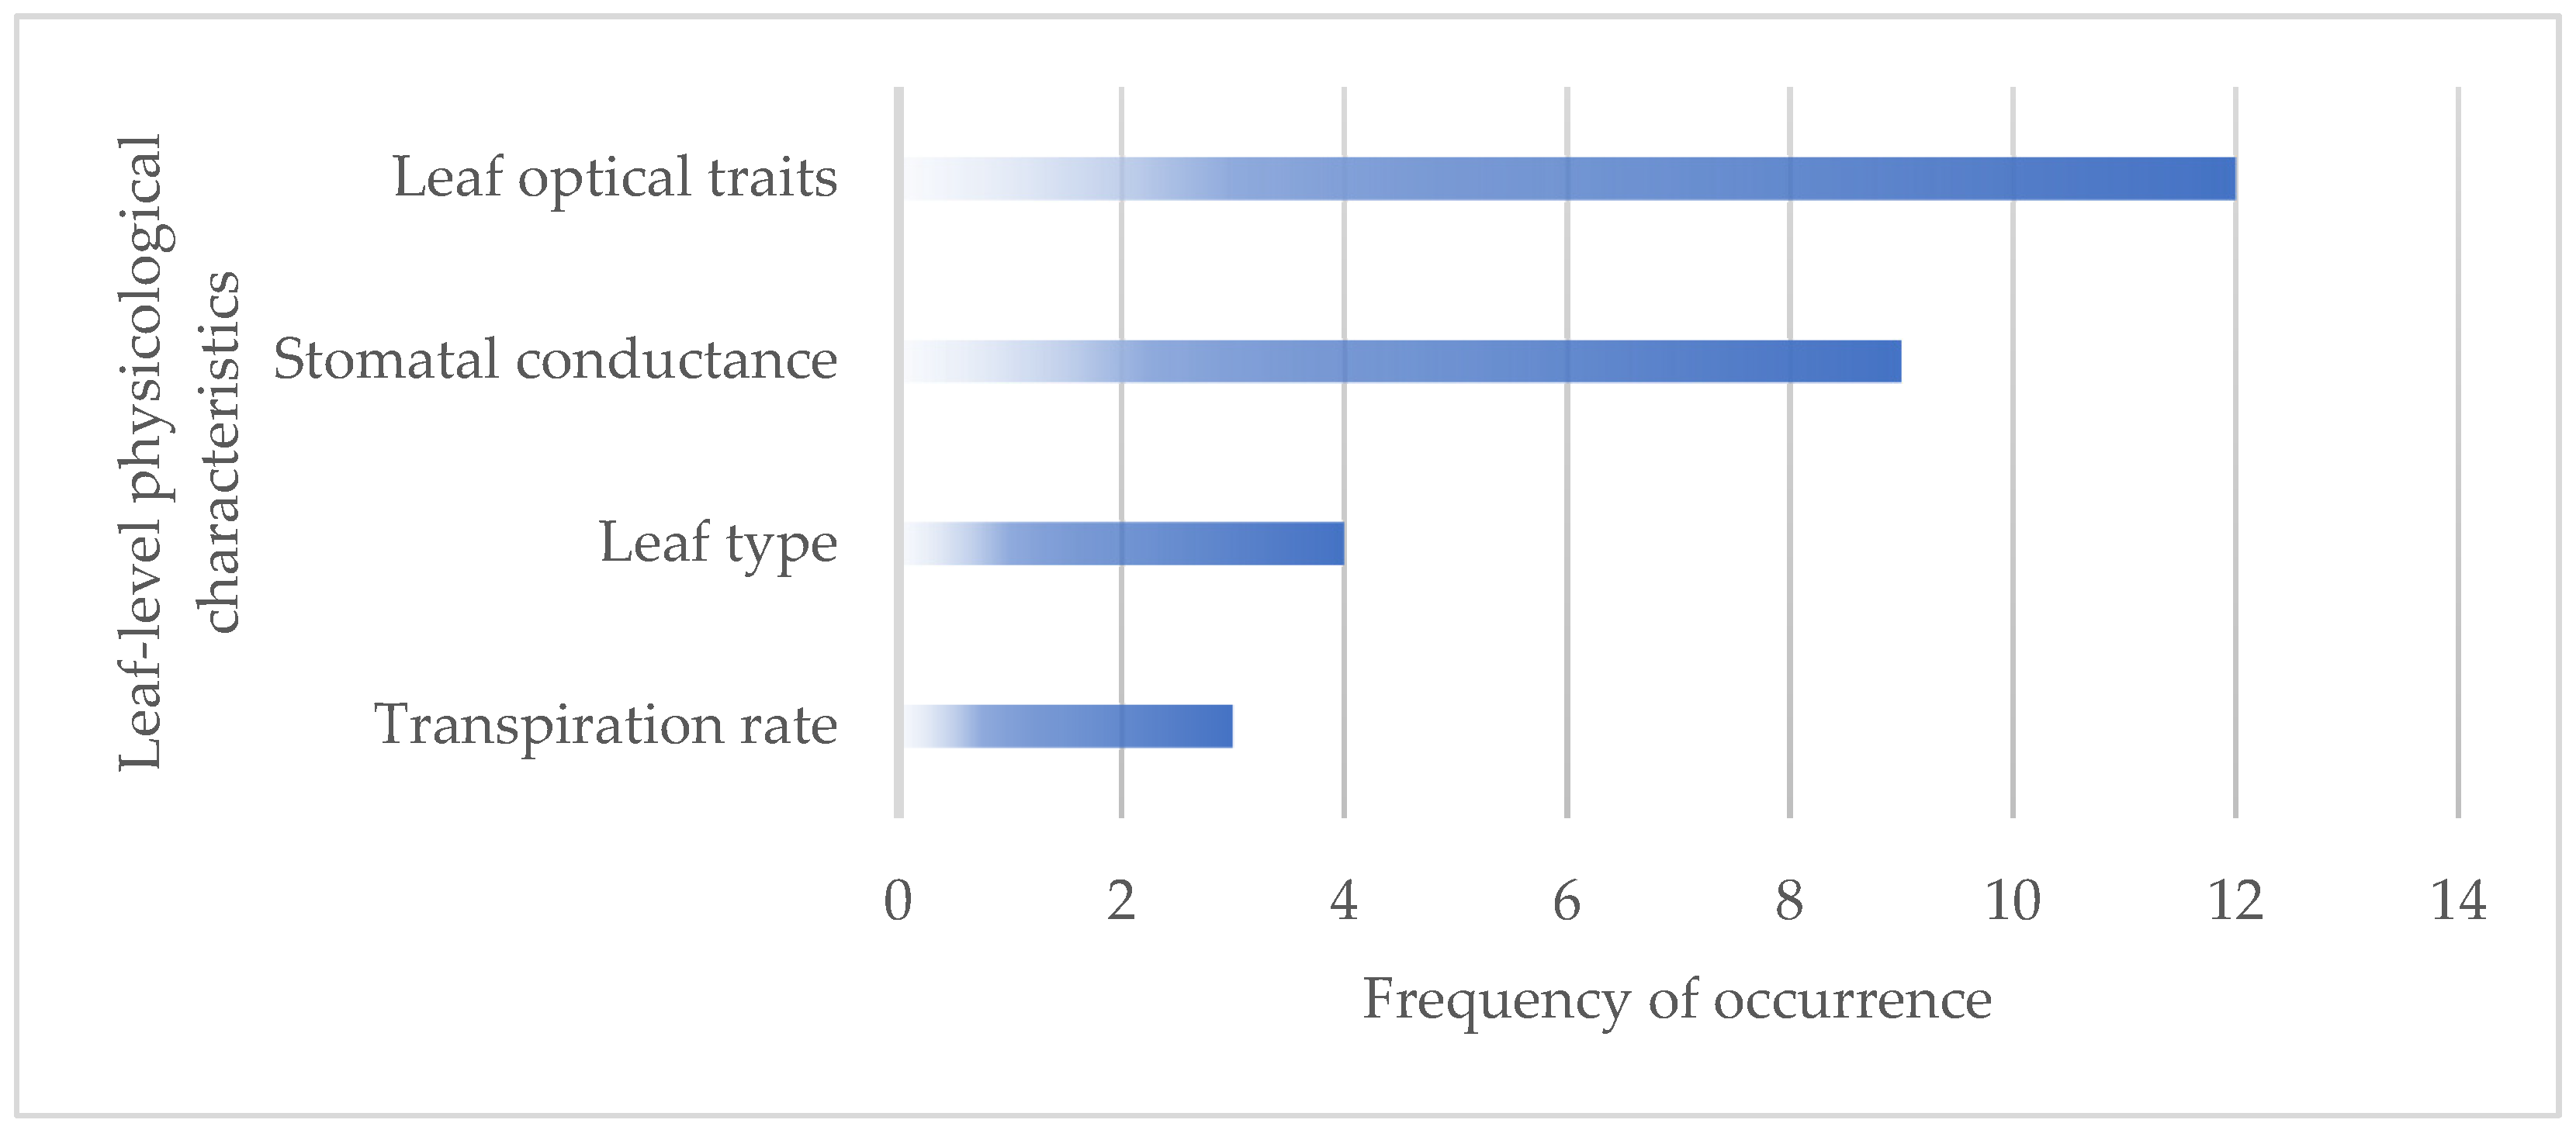
3.2.2. Leaf-Level Physiological Characteristics

Leaf-level physiological characteristics encompass very detailed information about leaves, including leaf type, transpiration rate, stomatal conductance and leaf optical traits. Table 4 lists the leaf-level physiological characteristics and the literature mentioning them, while Figure 4 gives the frequency of occurrence of each leaf-level physiological characteristic.
It is often difficult to obtain leaf-level physiological characteristics due to the high cost in labor and time, which explains why they are less seen in the studies using field measurement in comparison to numerical simulation. As an alternative, they are always inferred from other factors. Hence, in the following introduction of leaf-level physiological characteristics, factors relevant to them will also be discussed.
The most prevalent leaf-level physiological characteristics are leaf optical traits, including the longwave and shortwave transmittance and albedo. This may be due to their non-negligible association with the radiation transfer in the crown. In some studies, the optical coefficients are used to quantitatively represent their role in reducing radiation [68,85]. Leaf optical traits are related to tree species, leaf size and leaf color [65,83,92].
Stomatal conductance is the second-most prevalent leaf-level physiological characteristic, which occurs 9 times in the 48 papers. It determines the transpiration rate, the third-most prevalent characteristic, to a great extent. It is also a physiological characteristic commonly seen in studies that proposed self-designed models to simulate the urban microclimate [56,68,85]. Many factors affect stomatal conductance, including tree species [51,64], planting patterns [64], water vapor pressure deficit [56] and soil conditions [56], etc.
Leaf type receives the least of attention with just four studies taking it into account. This may be due to the huge effort devoted to detecting it, and the fact that the leaf information can be inferred by tree species in most cases.

3.3. Locations and Surrounding Factors

In an accurate evaluation of urban microclimate, the interactions between trees and other urban objects are vitally important, especially when the research scope is as large as a street or a neighborhood. An individual tree cannot be a single research object in this scenario but should be viewed as a participant contributing to urban microclimate regulation through the incorporation with other urban objects. Hence, the locations and surrounding factors of urban trees are crucial in practice.
Table 5 lists the locations and surrounding factors summarized from the 48 papers analyzed. Tree location is mentioned in eight papers and provides a basis for the investigation of trees’ relation with other surrounding objects. The planting pattern or tree arrangement has been seen seven times in this analysis. The planting pattern can influence the transpiration rate of trees by changing the stomal conductance. It has been observed that the trees planted in groups outperform those planted separately in lowering air temperature [64]. The distance between two trees and whether adjacent canopies overlap can both affect the shading in the ecosystem of the research area [73]. Similarly, the air flow in the research area can also be affected, therefore impeding the urban canyon ventilation and cooling potential.
The species composition in a group of trees plays a significant role in the regulation of the urban microclimate. There are four studies exploring the influence of tree species composition on the urban microclimate. The results show that a more complex composition provides better microclimate benefits [55,94,95,96].
The soil and pavement that trees occupy are also engaged in urban microclimate regulation. The soil conditions including soil moisture content and soil temperature drive the transpiration rate of trees [53,64], while the material of the pavement surface with different albedo impacts the radiation transfer beneath canopies [53,60,62,87,97].
In addition to the interaction between trees, the interactions between trees and nearby buildings or water bodies are also mentioned in the 48 papers included in the in-depth analysis. The buildings actually participate in the radiation transfer between atmosphere and trees [59]. That is why the building material is mentioned in four papers [59]. Besides, the distance to the nearby buildings and the buildings’ height determine the solar radiation received by trees [84].
The sky view factor (SVF) is worth mentioning as a key parameter describing the urban form elements [88,101]. It is defined as a numerical dimensionless value ranging from 0 to 1 to represent the ratio of radiation received from the sky by a planar surface to that received from the entire hemispheric radiating environment [102], where 0 represents a completely closed environment and 1 represents a completely opened area without any obstacles. The SVF of trees can describe the relation with neighboring trees or buildings. Due to the limitation of the detection range, this description generally can only cover neighboring objects in a certain range centered around the tree.
As the SVF can only partially reflect the interactions between trees and buildings, the view factors, as a more general form, are used to model the interactions between trees and the surroundings [29,30]. A radiative view factor Fij refers to the geometric relation between two surfaces i and j as the fraction of uniform diffuse radiation leaving a surface i that directly reaches another surface j [103]. The surfaces could be trees, ground, sky or walls. The view factors change as a result of the intervention of trees and thus describe the interactions between the trees and their surroundings.
The presence/absence of water bodies and the distance to them are considered in three studies and one study, respectively. Water bodies influence the water balance [54] and hydrological cycle [51], of which the evaporation from trees is one part. However, it seems the interactions between trees and water bodies have not been emphasized. Perhaps with the increase in papers analyzed, the interactions between trees and water bodies will be explored.
Other surrounding factors are macroscopic, including meteorological data, street structure, street orientation and landscape structure. The contribution of these factors increases with the scope of the research, especially when the research scope is large enough to cover a street or a square [53,54,62,89,100]. However, it is worth mentioning that the meteorological data can dominate urban microclimate regulation. Wang et al. [94] found that the climate condition accounts for more than tree size in regulating the urban microclimate. Therefore, this should be considered in research at any scale.

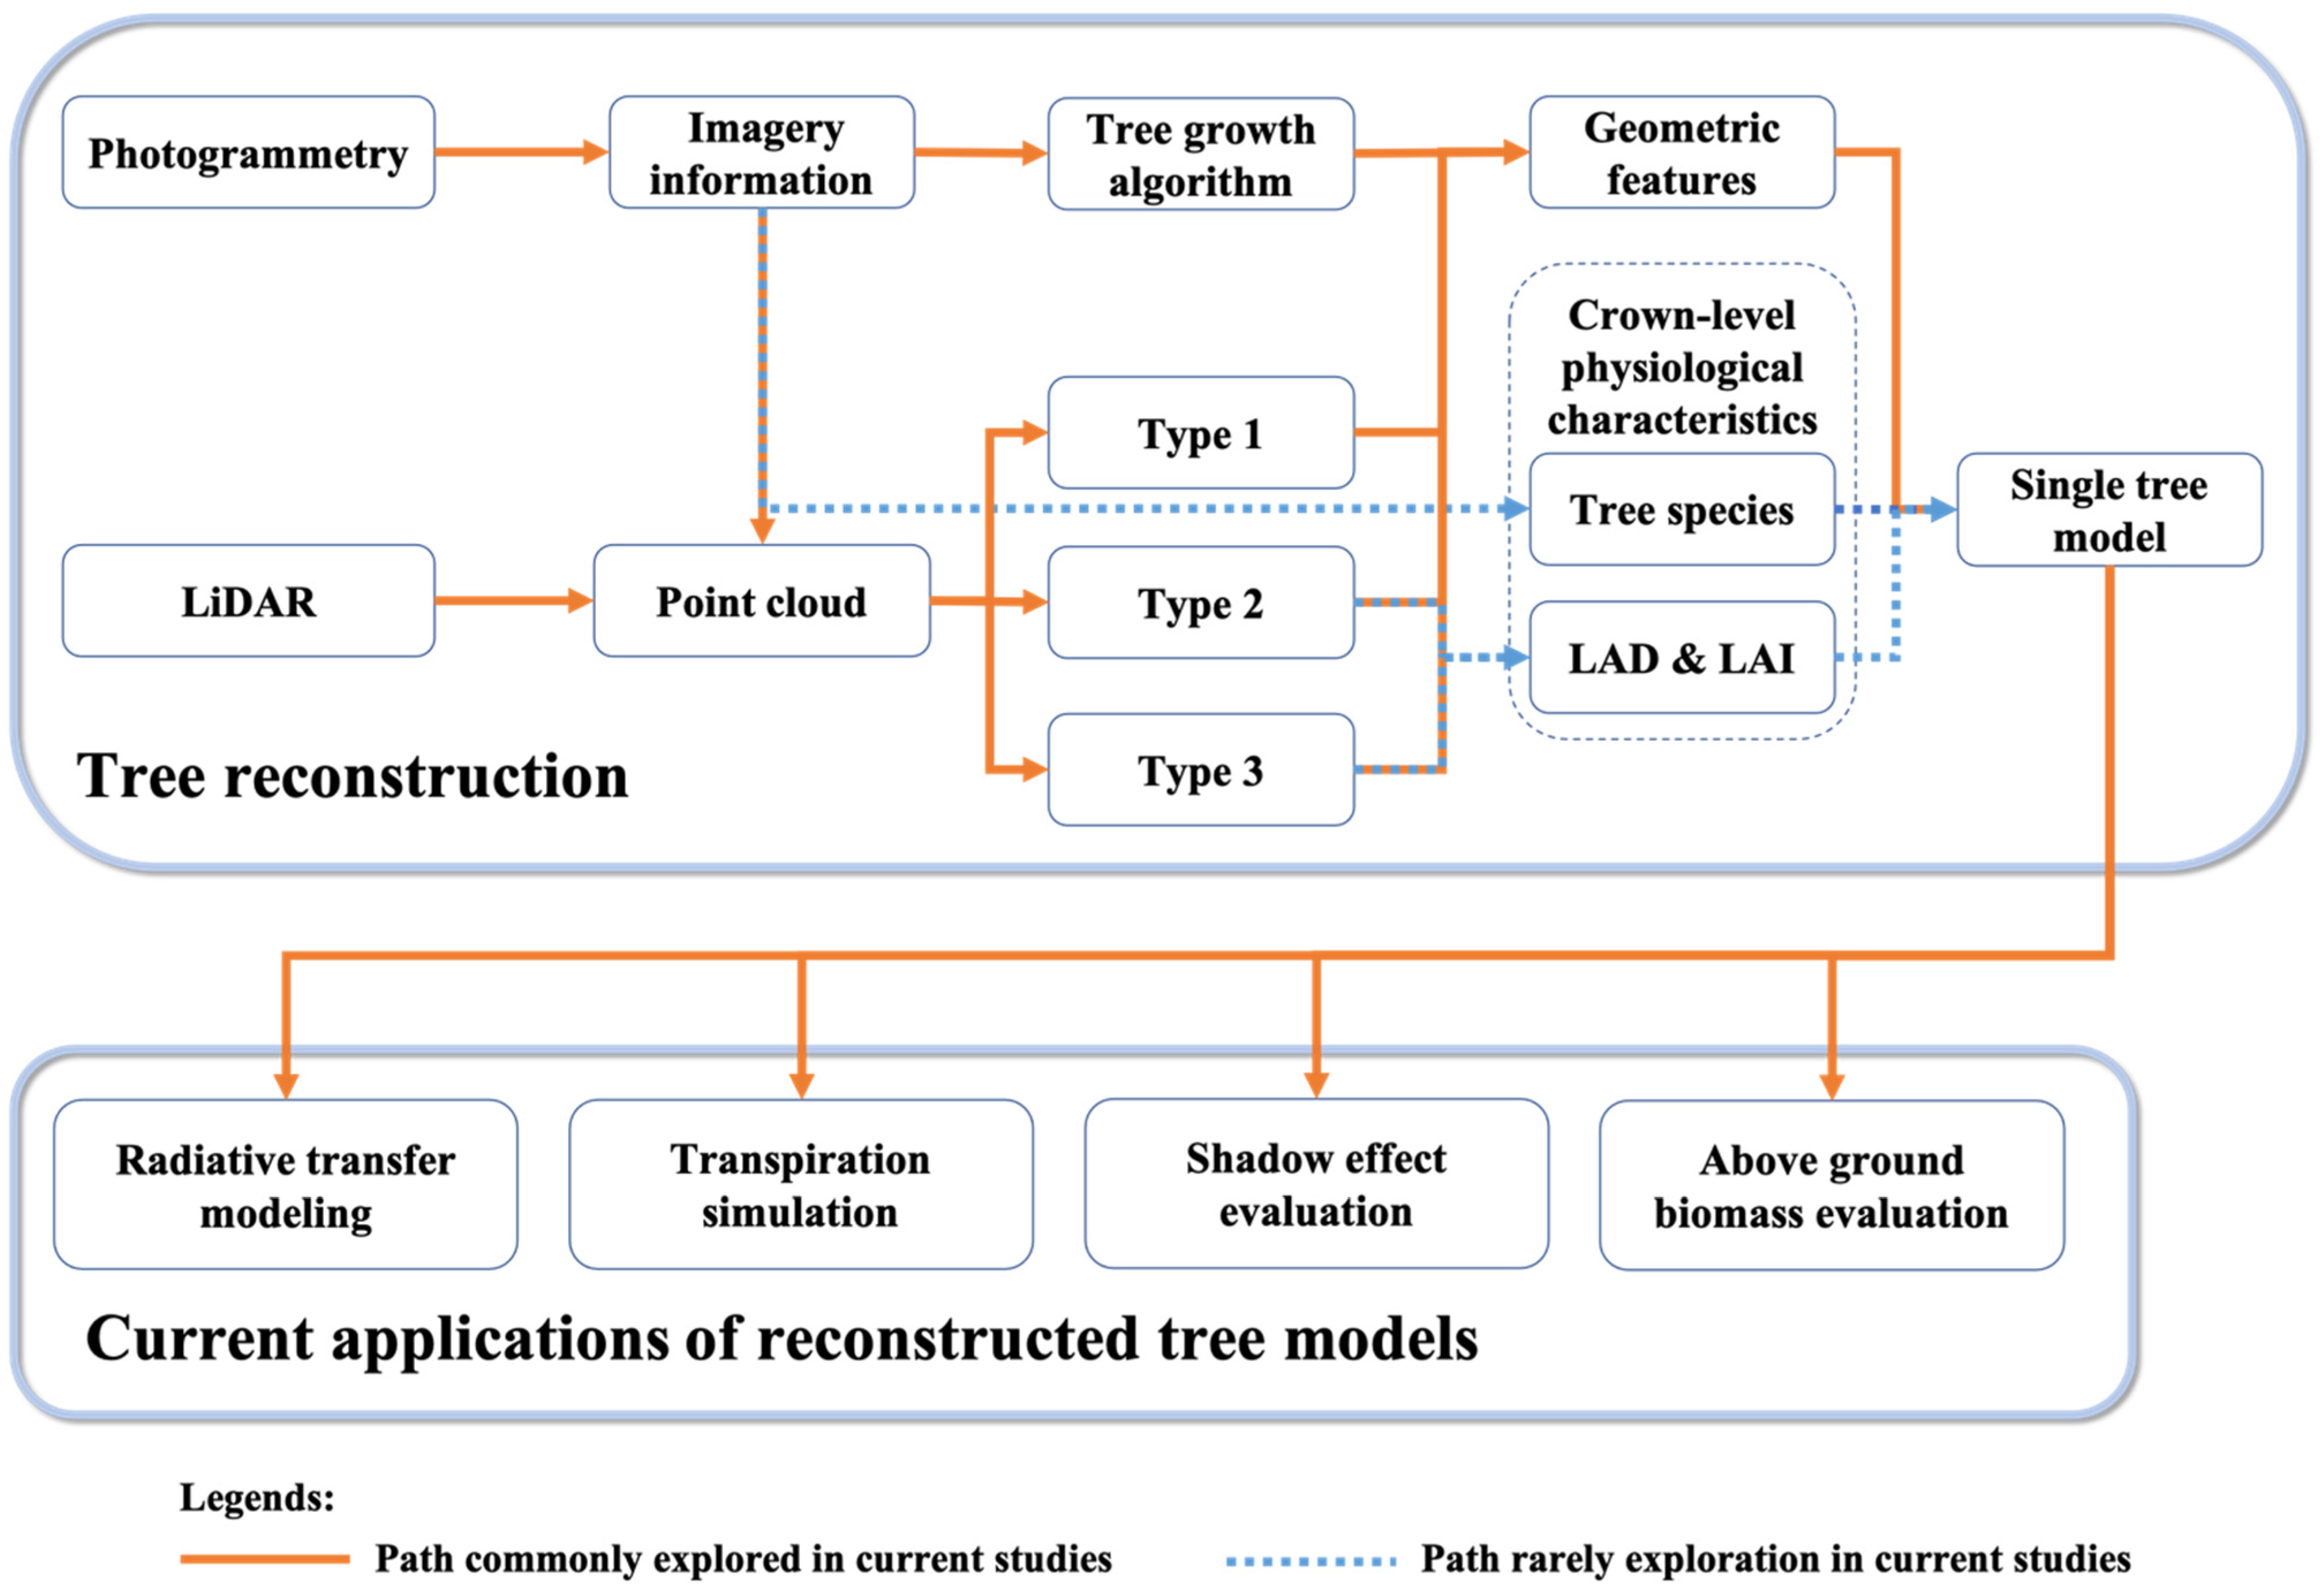
3.4. Required Factors in Tree Reconstruction

As the 3D tree models with high fidelity to reality are increasingly desired in urban microclimate simulation [39], there are high demands on the reconstruction of trees that go beyond mere geometric reconstruction. The factors related to trees’ impact on the urban microclimate can be seen as the requirements to guide tree reconstruction. Based on the findings from the in-depth analysis presented above, it can be summarized that the following factors should be included in tree reconstruction for comprehensive urban microclimate simulation:
  • The tree models reconstructed should contain sufficient information including geometric features, physiological characteristics and relation with the surroundings for the urban microclimate simulation;
  • The geometric features of trees are the basic factors that can be seen in almost all 48 papers included in the in-depth analysis. Among them, the tree height and crown morphology are the most important. The tree models reconstructed should at least describe trees’ geometric features;
  • Two crown-level physiological characteristics are frequently mentioned in the 48 papers analyzed, namely foliage distribution and tree species. From the reconstruction perspective, the crown-level physiological characteristics should be included when reconstructing trees since they are possible to retrieve at a reasonable cost and can be used to infer leaf-level physiological characteristics;
  • The leaf-level physiological characteristics of trees are mentioned frequently in numerical simulation. They are too detailed to detect but can be optionally inferred from other factors in the tree reconstruction;
  • Besides the factors about trees themselves, the interactions with other urban objects are also crucial to evaluating trees’ impact on urban microclimate. Therefore, it is better to integrate the reconstructed tree models in a virtual space with other urban objects, such as city models stored in the geography information system (GIS) or building information models (BIMs).

4. In-Depth Analysis of Studies on Tree Reconstruction

As discussed in Section 3, many factors are supposed to be taken into account when exploring trees’ impact on urban microclimate, and therefore should also be included in tree reconstruction [93]. 3D tree models reconstructed from reality carrying sufficient information pave the way towards sustainable development of urban areas. However, current tree reconstruction approaches put more emphasis on the geometric features of trees than the physiological characteristics, leading to missing information in the tree models. Besides, to explain the relation with other urban objects, tree models are expected to be integrated in a virtual space (e.g., digital twin) where the interactions between others are allowed to be simulated. In order to reconstruct such 3D tree models in support of the urban microclimate simulation, the studies on tree reconstruction are reviewed and analyzed in this section to explore the possibility of capturing trees’ biological characteristics in tree reconstruction. The memory space required to store the reconstructed 3D tree models and the processing time or computational effort of each reconstruction approach are also discussed to assess their feasibility in different research scopes. As mentioned in Section 2.2, a total of 41 papers are included in the in-depth analysis in this section.

4.1. Input Data Sources

The trees are commonly reconstructed from point cloud data. Table 6 lists the literature on tree reconstruction and the input data as well as the data sources they used. For the studies using both point clouds and optical images, the intended uses of images are underlined.
The first column of Table 6 shows the data sources for tree reconstruction. In summary, there are two technologies, namely photogrammetry and LiDAR to obtain point clouds. Photogrammetry relies on a multiple overlapping images and information about their internal and external orientation parameters, image overlap, etc. These images can be a sequence of overlapping images taken as the platform moves, or the multi-view images taken from different positions. Through an image-matching algorithms such as structure from motion (SfM) or multi-view stereophotogrammetry, it is possible to generate photogrammetric point clouds.
By contrast, LiDAR, or laser scanning, is used to obtain point clouds directly through a laser beam. LiDAR has become a very promising technology to be used in a wide range of built environment applications [104,105,106]. It has been applied in ecological applications, change studies, forest inventory applications and individual tree crown characteristics measurement in both forests [107,108] and urban areas [109]. Some studies used digital photos of trees as supplementary data when reconstructing trees from LiDAR point clouds. Instead of addressing the 3D structure of trees, these images are used to extract individual trees, separate foliage and woody components [110], refine in-crown structure [42,111,112] or identify tree species [41]. There is still a focus on processing LiDAR points to reconstruct trees.
There are several differences between the photogrammetric approach and LiDAR, although they can both address the 3D structure of trees. Photogrammetric point clouds are colorized, while LiDAR point clouds are mostly not. On the other hand, LiDAR point clouds usually have less noise and clutter, which makes it easier to make precise measurements. By contrast, photogrammetric point clouds require extensive cleaning to obtain clear point clouds. The image matching relies on identifiable features. If there are vague features, misplaced points may occur during the image matching. LiDAR usually takes less time to filter and clean a point cloud dataset. Furthermore LiDAR beam is able to penetrate through semi-transparent objectives such as tree canopy. Therefore, LiDAR point clouds can offer more in-crown information compared with photogrammetric point clouds.
Photogrammetry and LiDAR can both provide point clouds from various views, depending on what type of platform’s RGB cameras (for photogrammetry) and laser scanners (for LiDAR) are mounted. LiDAR can be therefore classified as airborne laser scanning (ALS), terrestrial laser scanning (TLS) and mobile laser scanning (MLS) when the laser scanners are mounted on aero vehicles, fixed positions on the ground (e.g., fixed tripods) and mobile vehicles on the ground (e.g., cars), respectively. In ALS, objects are scanned from above, therefore the point clouds may have less data of the sides of the objects. By contrast, in TLS, objects are scanned from the ground, therefore there may be less data of the top of the objects in the point clouds. In MLS, the back side of the objects to the scanners may be missed in the point clouds. The resolution of the point clouds increases with the decrease in the distance to the objects. Photogrammetry has the same classification and problems. This explains why one paper in the in-depth analysis is found to combine the TLS point cloud and the aerial photogrammetric point cloud together for tree reconstruction [113]. This integration may offer some of the coverage benefits of aerial photogrammetry and the improved accuracy of TLS [114].
One paper is found to reconstruct the tree structures based on an L-system [145], one of the classic algorithms describing growing rules related to plant anatomy and topology from empirical observations. However, this approach is more like simulating a tree model than reconstructing one. The reconstructed tree models are not “biologically” correct 3D representations of real irregular trees caused by natural and anthropogenic factors, thus they are less suitable for ecosystem studies that require high accuracy of trees (e.g., spruce needle defoliation and regeneration) [39]. By contrast, a large number of studies prefer point clouds (either photogrammetric or LiDAR) as the main reconstruction input. Hence, the subsequent in-depth analysis continues with a focus on the tree reconstruction approaches from point clouds.

4.2. Tree Reconstruction Approaches from Point Clouds

Point clouds provide sufficient 3D spatial information of trees based on emission and reception of low-divergence laser beams at a high frequency [146]. Nevertheless, the LiDAR points are unstructured and have no topological connections, leading to difficulty in addressing the 3D structures of trees [147]. Besides, there are still challenges in the foliage-woody separation, complex branching and self-occlusion effects [39,148]. To overcome these challenges, three mainstream reconstruction approaches have been developed. For the sake of concise expression, these three approaches are referred to as Type 1, Type 2 and Type 3 approaches in this paper. The brief introduction of each reconstruction approach is given as follows:
Type 1—Using geometric shapes to delineate the crown surface.
Type 2—Reconstructing trees with voxels.
Type 3—Reconstructing the skeletons of trees and then adding leaf configurations.
Voxels in the Type 2 approach can be seen as the 3D extension of 2D grids, which are a 3D matrix of cubic volume elements [149]. The skeleton of a tree mentioned in the Type 3 approach denotes the branches and the main trunk.
Table 7 lists the reconstruction approaches and the literature adopting them. More details about their advantages and disadvantages are discussed in Section 4.2.1, Section 4.2.2 and Section 4.2.3.

4.2.1. Type 1 Approach

The Type 1 approach focuses on the crown shape of trees and delineates the crown surfaces with geometric shapes. In this kind of approach, the outline and shape of the crown are the most important information expressed in the model. The common shapes used include alpha-shapes [122], convex hulls [143,144] and concave hulls [142]. According to Colaço et al. [144], the alpha-shape outperforms the convex hull in representing the crown because it is able to delineate the concave silhouette surfaces of the crown [144].
The Type 1 approach produces a highly compact 3D model of trees delineating the shape of crowns. The concise representation of geometric shapes makes it possible to reconstruct lightweight 3D tree models rapidly and efficiently since it requires less computational effort and memory space for the storage of models [39,151]. Although this kind of representation is highly simplified, some external geometric features of the crowns (e.g., tree height, crown width, crown base height, crown top height, breast height diameter, crown length and crown projection surface area) can be estimated by the abstract shape of the crown with an acceptable loss of precision [43,122,143,144,151,152]. Besides, such statistically based 3D shape signatures make it possible to reconstruct trees from low-quality point clouds due to its insensitivity to noise [153] and are well suited for relatively simple tree architecture such as broadleaf trees [39].
The intrinsic limit of the Type 1 approach lies in the loss of in-crown information as it only delineates a boundary outlier of the crown without the inner structure of crowns. During the reconstruction of trees, the points inside crowns are reduced for less computational time in traversing all points since the crown shapes are the emphasis. It is usually assumed that in the convex hull representation of crowns, the internal distribution of leaves is homogeneous [43,151], which is actually commonly fractal [154]. Consequently, it cannot represent the gaps in the canopy compared with the other two approaches, resulting in an overestimation of canopy volume [143]. It can be concluded that the internal information and details of the inner structure of crowns are lost or oversimplified, leading to the low structural accuracy and lack of details of foliage distribution inside crowns when using the Type 1 approach.

4.2.2. Type 2 Approach

The Type 2 approach converts point clouds into voxel spaces and addresses the 3D structure of crowns with voxels, the so-called voxel-based approach. Each voxel can be assigned with a value according to the number of points contained or the intensity of the return laser beam. The voxel value is a useful index to identify the object and delete the noise in the point cloud. In those voxels, the crown points are recognized and then assembled into a crown model. Voxel-based representation is a compromise of the implicit and explicit representations.
Representing the canopy with voxels is a convenient and efficient way to describe spatial foliage distribution [155,156,157]. The voxelated nature of a tree representation accelerates the computation, making it possible to complete the reconstruction within minutes [39,157]. The Type 2 approach also allows one to ignore empty voxels and remove voxels potentially arising from noise according to the voxel value [157,158,159]. In addition, the Type 2 approach preserves more details of the crown compared with the Type 1 approach [39,143]. The air gaps and foliage distribution are retained during the reconstruction. Besides, the Type 2 approach provides a concise but informative representation of trees. The voxelized models have been applied successfully to simulate the reflectance of canopies and are considered to be the most operational representation due to the low computational pressure [39].
The Type 2 approach may reconstruct less structurally precise tree models compared with the Type 3 approach, but more importantly, the reconstruction results depend on the spatial allocation and voxel size [155,160,161]. The influence of voxel size has been discussed in [155,158]. Large voxels can reduce the influence of occlusion since points and nearby missing points that are not scanned can be consolidated into one voxel. In contrast, small voxels, followed by low occlusion compensation, can produce a more accurate and architecture-independent model. Hence, the determination of voxel size should balance the occlusion compensation and the accuracy of reconstruction, depending on the final objectives of the application.

4.2.3. Type 3 Approach

The Type 3 approach reconstructs the skeletons of trees before adding leaves entities. There are two methods used to reconstruct tree skeletons. The first one uses cylinders to fit the trunk and branches of an individual tree. The reconstructed models are usually called quantitative structure models (QSMs), where the woody components are topologically and hierarchically ordered and represented as “a broad set of cylinders” [139]. The second one reconstructs tree skeletons with graph theory (e.g., the Dijkstra algorithm, the minimum spanning tree algorithm, etc.) based on the geodesic graphs built by connecting and clustering points in the point clouds.
Regardless of which method is used to reconstruct the skeletons of trees, the Type 3 approach is very sensitive to noise and has strict requirements of the quality of point clouds. If the satisfactory denoising procedure cannot be programmed, the noise has to be removed manually to obtain clean point clouds of trees [42,44,135,139]. Besides, to obtain a clear branch structure, the reconstruction of skeletons is usually conducted on point clouds scanned in trees’ dormancy stage when trees are leafless or leaf-off [40,112,135,138,162]. However, this makes the Type 3 approach not appliable when reconstructing evergreen trees.
For QSMs, the parameters need to be predefined manually for tree reconstruction (e.g., cover patch/set diameter, relative cylinder length), especially for the cover set diameter [44,133,163,164]. The patchwork “cover sets” algorithm, which grows a global surface by connecting local patches, is applied before segmenting the point clouds of trees into individual woody branches and trunks in the initial step of the reconstruction [163]. Different cover set diameters result in significant differences in final QSMs [133]. Extra effort is demanded in the optimization of these parameters [44].
The addition of leaves can be very complex, relying on external study on the physiology theory of trees’ architecture [39,42] or the predefined leaf structure model as templates [110,112], which makes the reconstruction approach specific to certain tree species [112]. Sometimes, the creation of leaf templates needs human intervention to set parameters (e.g., leaf length, leaf shape, leaf size distribution, leaf orientation distribution, leaf area density distribution, leaf angle distribution) [42,112] based on the experiment of artificial survey or extra effort of scanning the leaves for their shapes with refined digital instruments [162]. However, such an assumption of leaf type introduces errors in tree reconstruction, e.g., the overestimation of canopy reflectance [39]. Additionally, the complex leaf configuration greatly increases the memory space and can be computationally demanding [39].
Through all these efforts, the Type 3 approach is able to produce visually impressive explicit models with high structural accuracy. The 3D models reconstructed with leaves entities and the detailed branching structure can be applied in many applications, e.g., radiative transfer modeling [40,42]. Due to the detailed branching structure, Type 3 gains advantages in retrieving physiological characteristics in addition to geometric features (e.g., tree volume, canopy gaps and crown shape) [165,166,167]. For instance, according to Bournez et al. [43], the models reconstructed by the Type 3 approach perform better in estimating the transpiration rate of trees than those reconstructed by Type 1 and Type 2 approaches.
Table 8 lists the advantages and disadvantages of each reconstruction approach for a more concise and clear understanding. To sum up, each reconstruction approach has its own strength and weakness, but the geometric features (e.g., DBH, tree height, crown coverage) can be obtained by all three approaches with different accuracies. As a comparison, their potential to capture other information still needs to be explored.

5. Analysis of Review Findings and Discussions

The factors that influence trees’ impact on the urban microclimate and tree reconstruction approaches have been analyzed through the literature review. As discussed before, the geometric features of trees are the primary objective of tree reconstruction and can be obtained with varying accuracy. The potential of the tree reconstruction approaches to include trees’ physiological characteristics and relation with the surroundings is discussed in this section. The crown-level physiological characteristics take priority because of their higher access possibility and more significant influence at the macro level.
Some studies in the 41 papers about tree reconstruction analyzed are found to consider parts of trees’ physiological characteristics during the tree reconstruction. These studies are listed as examples in the following sections for the discussion of considering factors related to trees’ impact on the urban microclimate in tree reconstruction.

5.1. Required Physiological Characteristics and Input Data for Tree Reconstruction

From the perspective of input data used for tree reconstruction, point clouds captured by LiDAR scanners include detailed 3D structure information of trees. However, the information in those scattered points is still limited. Some physiological characteristics such as foliage distribution can be addressed through the analysis of point clouds, while it is not worthwhile to obtain other physiological characteristics such as tree species and leaf-level characteristics from point clouds because information like leaf features pointing to the tree species can hardly be sought in such unstructured points.
RGB images can supplement LiDAR point clouds and provide information of tree species. As shown in Table 9, one paper included in the in-depth analysis is found to identify the tree species during tree reconstruction. In [41], RGB images captured with a charge-coupled device (CCD) sensor were used to supplement the information about tree species instead of classifying tree species directly from the LiDAR point clouds. Both the multi-spectral or hyperspectral images taken from UAV or images taken from the ground with digital cameras have been used to identify tree species through machine-learning algorithms such as random forest [41,168,169,170,171,172], thereby determining leaf-level characteristics. It should be noted that the multi-spectral images can also provide information about the spectral traits of leaves, which is also seen in 1 paper among the 41 papers analyzed [126]. Hence, the images are recommended to be used as input data for tree reconstruction.

5.2. Required Physiological Characteristics and Tree Reconstruction Approaches

As tree species can be identified through imagery information, another important crown-level physiological characteristic, foliage distribution, can be obtained from point clouds. Success in acquisition of LAD and LAI has been seen from both airborne laser scanning (ALS) [173,174] and terrestrial laser scanning (TLS) [24,175,176], showing the unique potential of LiDAR point clouds in retrieving foliage distribution in crowns.
Some studies predefined the LAI or LAD to guide the addition of leaves [39], so that the tree models reconstructed can be applied in some scenarios such as radiative modeling [39] or transpiration rate estimation [43], as listed in Table 10. These studies assumed the foliage distribution instead of obtaining the foliage distribution from the input data used in the tree reconstruction, therefore failing to incorporate the estimation of foliage distribution with tree reconstruction.
By contrast, some other studies estimated LAD or LAI based on the point clouds. Table 11 lists these studies as well as the reconstruction approaches and the methods of foliage distribution estimation they used. It can be found that voxelizing the point cloud is prevalent in the estimation of LAD and LAI, even in the studies where the Type 2 approach is not used for tree reconstruction [110,111,118]. This coincides with other studies, where the LAD and LAI are always estimated within voxels segmenting point clouds of trees [177,178]. The LiDAR point clouds of trees are usually put into voxel spaces and then LAD or LAI is estimated from the information of each voxel, such as the number of laser beams entering, hitting and passing through each voxel as well as the attenuation of the laser beam [146,175].
Since the estimation of LAD and LAI and the Type 2 approach both rely on the voxelization of point clouds, it is possible and efficient to combine these two processes. Besides, as an optional and informative representation of trees, the voxelized models perform well in accommodating LAI and LAD. However, whether the other two reconstruction approaches are able to capture the mathematical indices LAD and LAI to describe the foliage distribution in the crown still needs to be discussed.
In the Type 1 approach, as shown in Table 8, the inside information of crowns is often omitted or simplified when using geometric shapes to represent the crowns. Therefore, it is not a suitable reconstruction approach for capturing physiological characteristics of trees despite its high computational efficiency and small memory space for the storage of models.
The Type 3 approach produces detailed 3D models of trees, where the foliage distribution is represented by arranged entities of leaves. The basis of the addition of leaves differs in the studies using the Type 3 approach and three main methods are found to reconstruct leaves in the Type 3 approach, as listed in Table 11. The first one is to use the L-Architect method to simulate the distribution of leaves. Bremer et al. [112] used this method to reconstruct plausible leaves under the control of foliage density properties captured by DHPs. However, the reconstructed leaf arrangement loses fidelity to reality.
Another method is to segment point clouds of trees into voxels to estimate the LAD or LAI of the crown and thereby adds leaves according to the estimation result [110,111], which gets a similar result as the Type 2 approach.
Apart from the voxelizing point clouds, some studies used allometric statistics to link the leaf area to the biological parameters of branches (e.g., branches’ length, branches’ relative height along the tree and the position of branches) [40,43,44]. With the leaf area of each branch, the leaves can be added. However, the leaf configuration is predefined such as leaf size, orientation and distribution pattern, and large samples of leaves are needed to conduct the allometric statistics [40,43,44]. The comparison between the allometric statistics and the estimation based on voxelized point clouds is needed to analyze the reliability and robustness of their results, which is out of the scope of this research. In this research, voxelizing point clouds is recommended because it saves computational effort and can be combined with the Type 2 tree reconstruction approach directly without extra effort.
Although the voxelized point clouds are preferred in estimating the foliage distribution of trees, there is still room for improvement during the incorporation with tree reconstruction. For instance, Xie et al. [110] used voxelized point clouds to estimate leaf area during the tree reconstruction. However, they estimated leaf area with a retrieved value whose accuracy will affect the estimation, and leaf area is underestimated in their research. Besides, the optimization of the voxel size remains a challenge. Different voxel sizes may lead to different LAD and LAI estimation results [146]. In addition, the voxel sizes suitable for LAD and LAI estimation and the accurate reconstruction of trees are usually different [161]. The equipment used to scan the tree can also influence the estimation due to the varying quality of point clouds [179]. The estimation of LAD or LAI from point clouds should be enhanced to provide reliable methods.
In conclusion, voxelizing point clouds is a convenient means of describing foliage distribution, which is a crucial physiological characteristic of trees. Besides, the voxelized tree models reconstructed by the Type 2 approach is a reliable representation of trees that can be used in the radiative transfer modeling, proving their accommodation of trees’ physiological characteristics. Therefore, it is efficient and adequate to insert the estimation of LAD and LAI into the voxel-based approach, in which putting point clouds into voxel spaces is the initial step. However, the optimization of the voxel-based approach in estimating foliage distribution and how to capture other physiological characteristics remain to be explored. The sophisticated tree models with detailed branch structures and visually impressive leaves reconstructed by the Type 3 approach may provide a more accurate representation of trees and can be used when the entities of leaves are demanded.

5.3. Surrounding Factors and Tree Reconstruction

As discussed in Section 3.4, trees’ impact on the urban microclimate depends not only on one single individual tree, but also on their interactions with the surroundings. Hence, tree models are supposed to be integrated in a virtual space such as city models or BIMs containing digital representations of other urban objects. In this scenario, the reconstruction efficiency and memory space of the reconstructed models should be considered.
The input data used for tree reconstruction should be determined based on the scale of the urban area of interests. Most studies used TLS to obtain high-quality and complete point clouds from which the tree properties and leaf characteristics can be readily extracted [132]. However, as the research scope extends to the street level or even city level, TLS is too uneconomical due to its fixed scanning position and slow scanning speed. A large number of scan stations are required to cover such a large area. In this scenario, mobile laser scanning (MLS) or ALS are preferred, as well as photos taken from vehicles or UAVs.
Similarly, determining the reconstruction approach depends on the scale of the urban area of interest. The balance between low computation time and high accuracy can hardly be achieved due to the complex structure of tree [140]. When taking surrounding factors into account, the Type 2 approach has more advantages compared to the Type 3 approach thanks to its higher adaptability and lower computational cost. Besides, the voxelized models have been considered to be the most operational in radiative transfer modeling [39]. So, the Type 2 approach is recommended in most scenarios as it can already provide sufficient information for a comprehensive urban microclimate simulation covering a large area, while Type 3 models are also applicable to get more detailed information of trees when the research scale is small, only a few trees are to be reconstructed and an extremely accurate simulation is desired.
The storage of reconstructed tree models is also a crucial issue. Given the co-action of the trees and their surroundings on the urban microclimate, tree models are supposed to be stored in a virtual space containing the digital representations of other urban objects (e.g., buildings, waterbodies, pavements, etc.). Both city models and BIMs can provide such a virtual space, while the city model is more recommended when the urban microclimate simulation covers a certain range of urban areas. To integrate tree models with digital models representing urban objects, the reconstructed tree models are required to take up as little memory space as possible while still providing sufficient information. Hence, the models reconstructed by the Type 2 approach, as a compromise of explicit and implicit representations of real trees, has more advantages than Type 1 and Type 3 approaches.

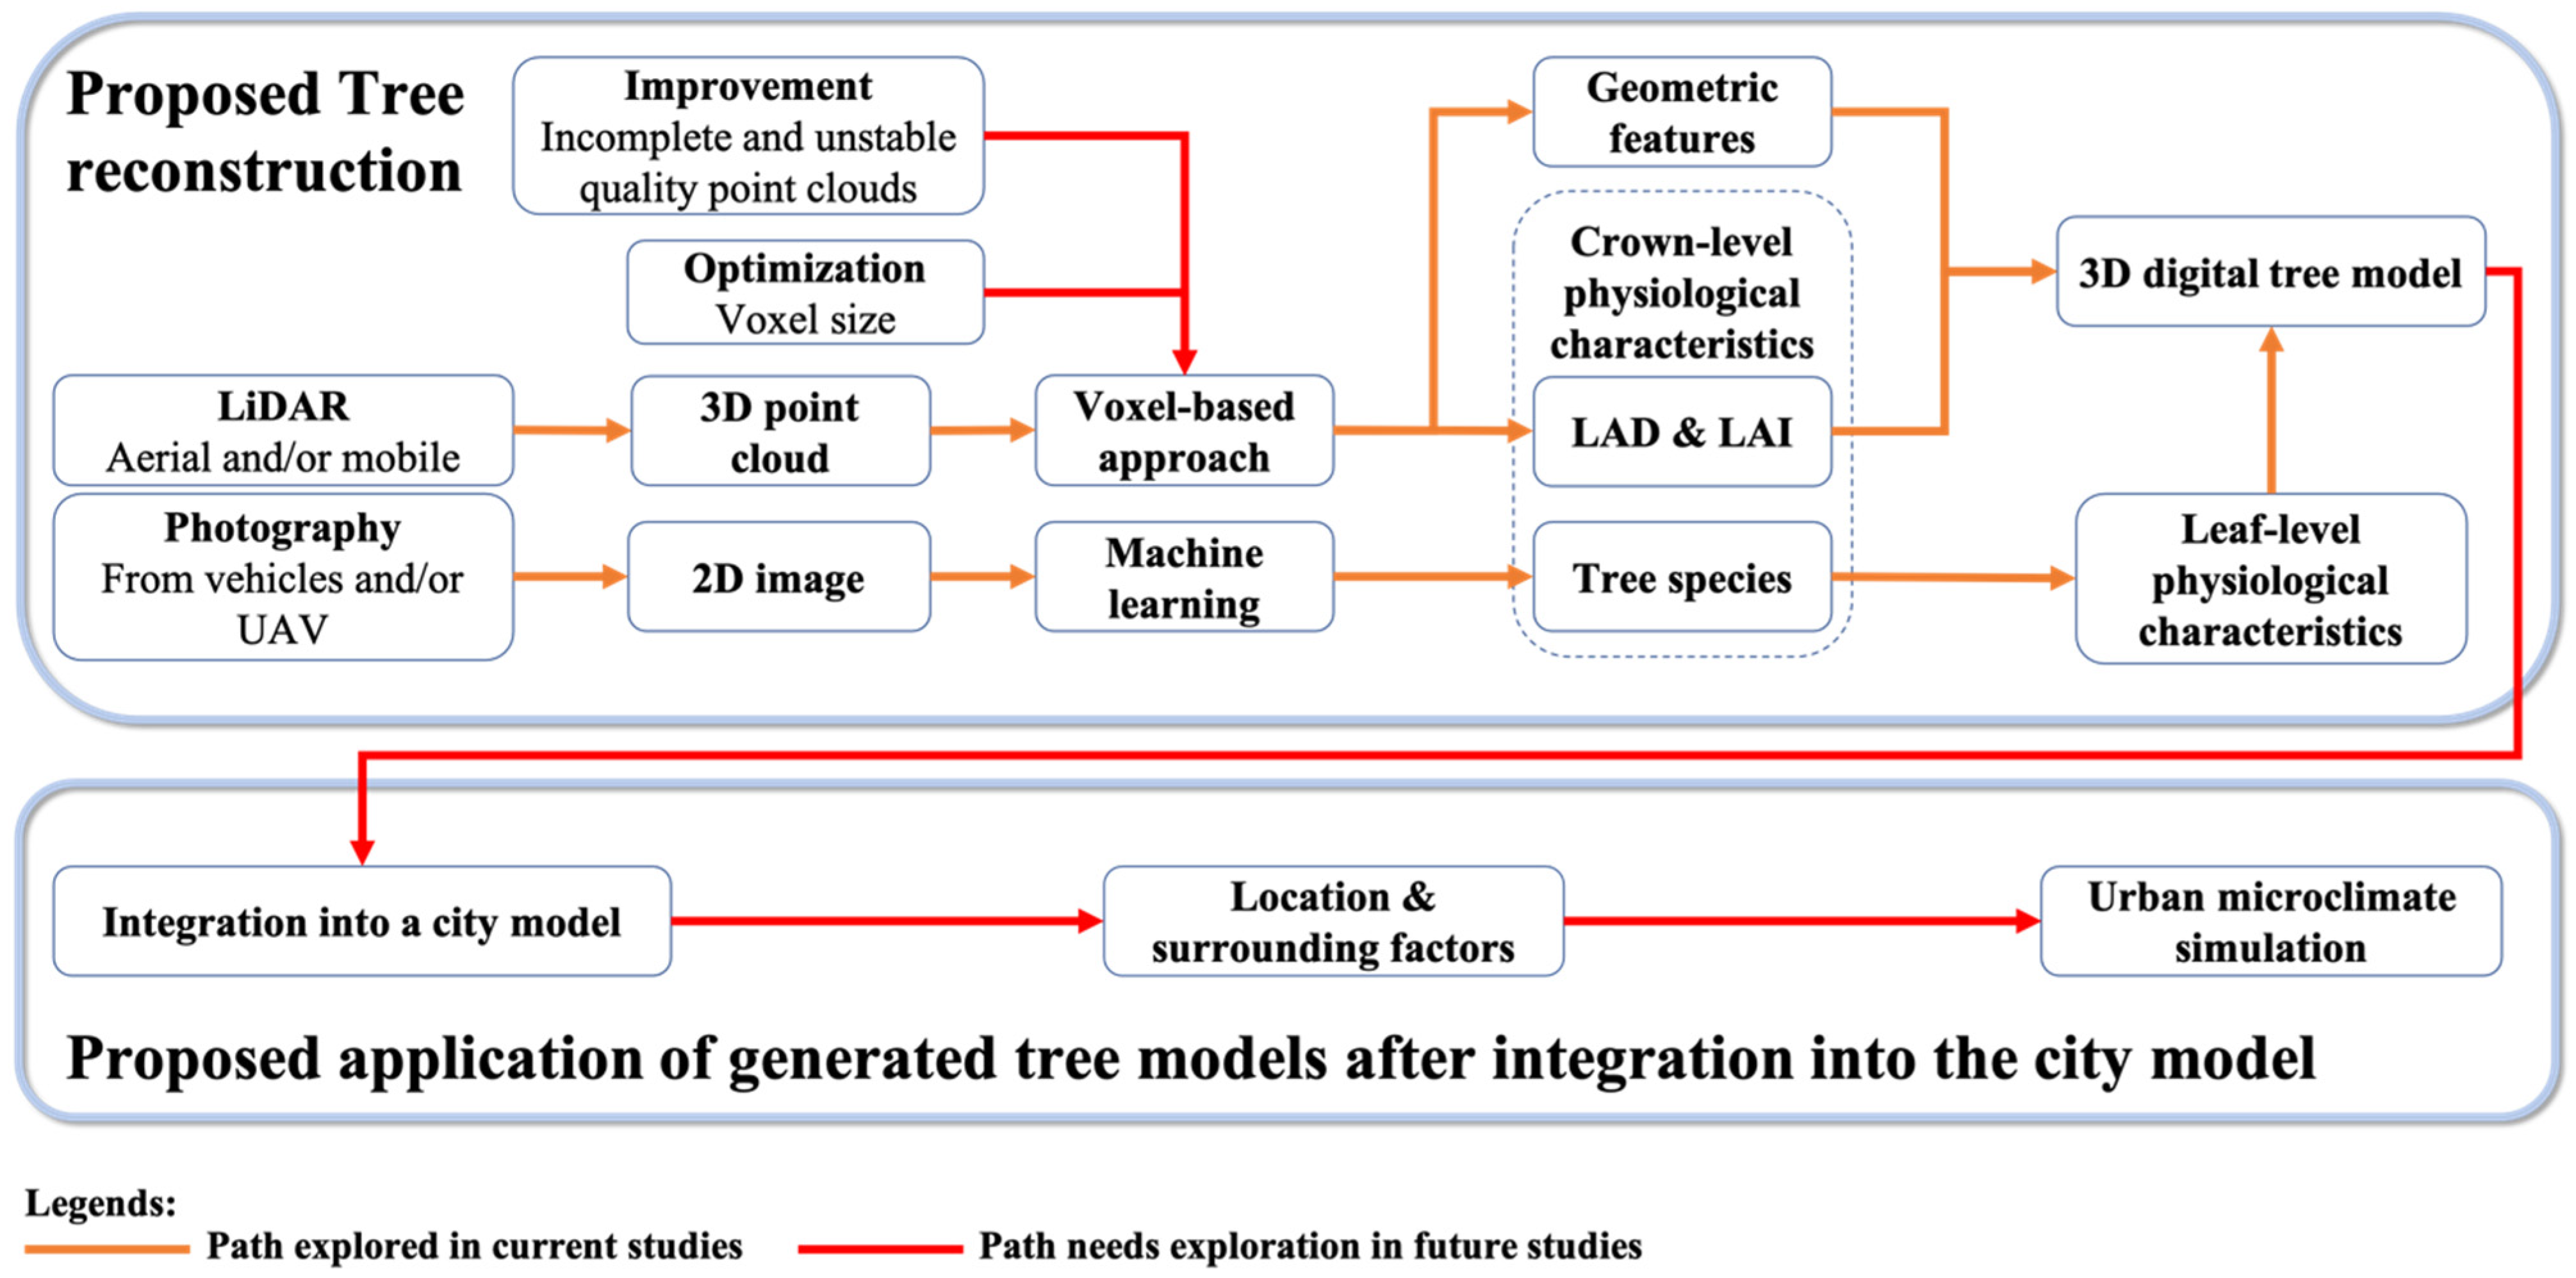
5.4. Proposed 3D Tree Reconstruction Approach for Urban Microclimate Simulation

Figure 5 illustrates the current tree reconstruction approaches and the applications of reconstructed tree models. In the current tree reconstruction, the physiological characteristics such as tree species, LAD and LAI are not usually considered (shown by the blue dashed lines), not to mention the leaf-level characteristics. Besides, the reconstructed tree models are not integrated with models with other urban objects (e.g., buildings, waterbodies, pavements, etc.), therefore making it difficult to take trees’ locations and surrounding factors into account. These reconstructed single-tree models have been applied in radiative transfer modelling [39,40,41,42], transpiration simulation [43], shadow effect evaluation [44] and aboveground biomass evaluation [133] in this review, however sometimes with assumptions such as hypothetical LAI [39,42] or homogenous foliage distribution [43]. These applications are usually conducted at the level of a single tree. The overall role of all trees is addressed by aggregating the results of each tree. In this process, the interaction between trees is hardly considered.
By contrast, in the existing literature, there is hardly any association between tree reconstruction and urban microclimate simulation, leading to inaccurate simulation results with limited support for urban environmental planning. Compared with current applications of reconstructed tree models, urban microclimate simulation is more complex and more factors have to be considered to obtain an accurate and comprehensive simulation result. These factors have rarely been completely included in current tree reconstruction. Hence, the artificially predetermined hypothetical tree models, which do not necessary match real trees and sometimes overly simplify real trees (e.g., polyhedrons with only width and height), have to be used to represent trees as an alternative in current microclimate simulation. Consequently, the contribution and role of urban vegetation cannot be completely considered during the simulation.
Based on the analysis of all findings of this research, a new approach is proposed to enable more accurate and realistic urban microclimate simulations by including all factors related to trees’ impact on the urban microclimate, as illustrated in Figure 6. The orange lines indicate that the approaches have been proposed in existing studies, and the red lines denote the works that have not been addressed and therefore need to be developed in the future.
Figure 6 shows the proposed key steps on how improved tree models can be used in a comprehensive urban microclimate simulation, including the voxel-based tree reconstruction, integration of tree models into the city model with 3D models of other urban objects (e.g., buildings, waterbodies, etc.) and the urban microclimate simulation based on the integrated city models.
Firstly, in the step of tree reconstruction, LiDAR and photography are used conjointly as a data source. LiDAR is used to obtain reliable point clouds of trees with more in-crown details as the laser beams can penetrate through the surfaces of trees and thereby detect the inner structure of crowns with multi-return features [114]. Moreover, photography supplements images rich in features pointing to tree species and leaf-level physiological characteristics. It should be noted that in the proposed tree reconstruction approach, the images of trees are not required to supply the depth information. Hence, the photos taken by the cameras are sufficient as the input data.
From the images of trees, the tree species is identified by machine-learning methods. The leaf-level physiological characteristics are then inferred based on the tree species. It may lose some accuracy, but is much more computationally efficient. On the other hand, the point clouds of trees are put into the voxel spaces to address trees’ 3D structure and details of LAD and LAI. Eventually, trees’ geometry and physiological characteristics are obtained and compiled into 3D digital tree models.
The tree reconstruction procedure should cover and map each tree in the area of interest to ensure the information for microclimate analysis is as accurate as possible. To address the spatio-temporal aspect of vegetation, a robust automatic procedure should be provided to ensure the process can be repeated on a regular basis so that corresponding tree models can always be up to date. In this scenario, several points need to be noted for tree reconstruction in terms of the selection of the data sources and the optimization of the voxel-based approach. TLS, the most prevalent data source, is not recommended because it can only cover a limited area due to the stationary scanning procedures. For the same reason, terrestrial photography with cameras mounted on stationary tripods is not suitable either. By contrast, ALS, MLS and photography from vehicles or UAV are preferrable for generating point clouds and taking images in the proposed tree reconstruction approach because they are capable of covering large urban-scale areas in a short time.
In another aspect, optimization and improvement in the voxel-based approach for the tree reconstruction are necessary in the proposed approach. When using the voxel-based approach to reconstruct trees, the voxel size will affect the final models and the estimation of foliage distribution. Besides, the computational effort and the memory size of reconstructed tree models increase with the increase of the voxel resolution. A study of the voxel size is necessary to balance the accuracy of LAD and LAI estimators, trees’ geometry and computational cost. Another challenge of the proposed tree reconstruction approach is the incomplete and unstable quality of the point clouds caused by the method of scanning and the configuration of scanners. For research that aims to simulate the urban microclimate covering a large area, MLS and ALS are more applicable than TLS. However, those two kinds of data sources are not able to provide the complete point cloud as TLS does. It is difficult to detect the back of the side facing the scanner and the lower structure of trees under the canopy from MLS and ALS, respectively. Tree reconstruction based on incomplete point clouds where missing regions may exist remains a technical challenge. Besides, the quality of point clouds depends on the configuration of scanners. Especially for ALS, specifically, the quality of point clouds is also influenced by the flight altitude. Due to the different scanners used in ALS, TLS and MLS, the accuracy of estimation of LAD and LAI in ALS and MLS will face different challenges from that faced in TLS [179]. As an alternative, combining ALS and MLS data may improve the quality of point clouds and make them able to address the 3D structure of trees.
The 3D digital tree models reconstructed using the proposed approach can be integrated into city models, as shown in the second step of Figure 6. In this way, trees’ locations and surrounding factors could be considered after the integration. Subsequently, an accurate and comprehensive urban microclimate simulation can be conducted based on information provided by the integrated city models, including trees’ geometric features, physiological characteristics and relation with the surroundings. In the era of the revolution around the concept of the digital twin, the proposed approach aims to provide realistic tree models to be integrated within virtual 3D city models to support microclimate visualization and simulation. The currently common method of urban microclimate simulation is to use a 2D urban land surface model (e.g., UCM) with many features (including ground vegetation and trees) properly parameterized, or to create 3D models for CFD simulation. For the urban land surface model, the proposed tree reconstruction approach can provide realistic parameters of trees (e.g., LAD, LAI, tree height, tree location, crown size) instead of using empirical values. On the other hand, in CFD models, 3D trees are sometimes modelled as porous mediums with a momentum source (sink) term in the standard fluid flow equations, which are represented with 3D grids. The voxelized tree models can meet the requirement of CFD models. Besides, CFD models are usually used to simulate a small part of a city (e.g., a street, campus, square, etc.). Due to the reduced range, the required simulation accuracy will also be higher. In these cases, the reconstructed tree models can replace the hypothetical tree models, which have overly simplified geometries and empirical values. Both ways can benefit from the sufficient realistic information carried by the reconstructed tree models in the proposed approach, which gives the urban microclimate simulation higher fidelity to reality. Furthermore, the realistic tree models reconstructed from point cloud data also benefit the visualization of the simulation, providing better support for urban environmental planning.

5.5. Knwoledge Gaps and Future Work

When considering tree reconstruction in the context of microclimate simulation, the following knowledge gaps and corresponding future research areas can be identified:
  • Current microclimate simulations use hypothetical tree models, whose geometries are overly simplified, and physiological characteristics are obtained from empirical data. Sometimes, the location of trees is assumed. As the tree models do not necessarily match the real trees, the simulation results cannot accurately reflect reality;
  • Current tree reconstruction methods emphasize addressing trees’ 3D structures, while the physiological characteristics and the surrounding factors are not adequately considered. Therefore, the applications of the reconstructed tree models are limited;
  • The tree models are rarely integrated with digital models of other urban objects and therefore it is difficult to consider the interactions between trees and the surroundings in specific applications. Despite the fact that many models such as CityGML (in GIS), or virtual applications such as Google Earth, offer options for integrated storage of trees and other city objects, the trees are either of low quality or not available outside of the virtual application.
This research brings together these three knowledge gaps and future areas, and further explores the second future area. The outcome of this research also lays the foundation for the first and third future areas. To be specific, this research proposes a new tree reconstruction approach to support urban microclimate simulation. The proposed approach is based on a comprehensive literature review and the capability of current technologies. This approach can be implemented in future research, and further adjustment and improvement may still be necessary.
There are several ways to improve the proposed tree reconstruction approach. This research identifies the key factors related to trees’ impact on the urban microclimate from the literatures. It focuses on trees’ geometric features, and explores their potential in retrieving trees’ physiological characteristics and relation with the surroundings. In the future, more methods of capturing trees’ physiological characteristics should be reviewed to explore their potential in incorporating tree reconstruction approaches, especially for leaf-level characteristics, which are recommended to be inferred from tree species in this research. In addition, the foliage health condition impacted by anthropogenic factors and background climate is also a key factor when considering trees’ impact on the microclimate. Some studies explored trees’ foliage health condition, and this should be considered to improve the proposed tree reconstruction approach.
This research focuses on a 3D tree reconstruction approach, which uses realistic tree models containing information about geometric and physiological characteristics and can be integrated within 3D city models. On the basis of such integrated 3D city models, we can derive parameters and mathematical descriptions, which will be the basis for microclimate simulation models. Apart from trees, urban microclimate simulation is also related to other human factors [180,181], e.g., building occupants’ behavior and their interaction with the natural environment, adding another dimension to be considered in future work.
The importance of the key factors in this research is ranked by their frequency of occurrence in the literature. It is a reasonable rating method in this research, which is conducted through a comprehensive literature review. However, it may be more reliable to rank the importance of each factor according to the extent to which it contributes to urban microclimate regulation, which could be done in future research. As including all factors in tree reconstruction is computationally heavy and time consuming, it is more reasonable to include only the factors that have a great influence on the urban microclimate.

6. Conclusions

This research is motivated by the increasing concerns on environmental issues and the need for accurate virtual digital representations of precinct objects for the sustainable development of urban areas, and future digital twin applications. Urban vegetation is crucial in regulating the urban microclimate, and urban trees are the dominant type of vegetation. Therefore, a reconstruction approach that can reconstruct realistic 3D tree models in support of an accurate and comprehensive urban microclimate simulation is required.
A comprehensive literature review covering both trees’ impact on the urban microclimate and trees’ reconstruction approaches with high adherence to reality has been conducted in this paper. From the in-depth analysis of previous studies evaluating trees’ contribution to urban microclimate regulation, the factors that influence trees’ impact on the urban microclimate are first summarized, including trees’ geometric features, crown-level physiological characteristics (e.g., tree species and foliage distribution), leaf-level physiological characteristics (e.g., leaf type, transpiration rate, stomatal conductance and leaf optical traits), locations and surrounding factors. These factors should be included in tree reconstruction to support a more realistic urban microclimate simulation.
The literature on the current tree reconstruction methods has been reviewed extensively, in consideration of how the identified factors can be best included in these tree reconstruction methods. The point clouds generated from images taken by photogrammetry or obtained directly from LiDAR are the main input data for addressing the 3D structure of trees. Some studies used images in addition to point clouds to supplement extra information of trees to assist the tree reconstruction. Subsequently, the tree reconstruction approaches using point clouds as input were further analyzed. Three mainstream reconstruction approaches have been found. The three reconstruction approaches were introduced, followed by the analysis of advantages and disadvantages, and then were further analyzed in terms of their potential in capturing trees’ physiological characteristics and surrounding factors. Although in need of some optimization and improvement, the voxel-based approach was found to be promising in retrieving both the 3D tree structure and the foliage distribution. It also provides a computationally efficient way to reconstruct 3D tree models, taking up little memory space and therefore suitable for integration with the models of other urban objects.
Based on the literature review and the in-depth analysis that followed, a new tree reconstruction approach is proposed for urban microclimate simulation in this study. The approach considers all important factors that impact the urban microclimate, the computational complexity of the 3D models and the range covered by the data source. Different to common exiting simulation methods where hypothetical tree models are used, the proposed tree reconstruction approach uses both LiDAR point clouds and RGB images as input data source of real trees. The digital cameras mounted on ground vehicles and/or UAV are used to take images of trees, while the ALS and/or MLS are used to acquire point clouds of trees. Machine-learning methods can be used to identify tree species and thereby infer leaf-level physiological characteristics. The improved voxel-based approach with optimized voxel size will be used to retrieve the 3D tree structure and trees’ foliage distribution from point clouds with an unstable quality and missing regions scanned from ALS and/or MLS. In this way, trees’ geometric features and physiological characteristics are both incorporated in the 3D tree models. The tree models reconstructed by the proposed approach can be further integrated with a city model by considering trees’ relation to the surroundings. Based on the information provided by the integrated city model, a more accurate and realistic urban microclimate simulation can be conducted.
Future work will focus on the implementation and improvement of the proposed tree reconstruction approach as discussed in the paper. It is planned that a case study will be carried out to implement the proposed tree reconstruction approach for modeling a reduced-scale urban area before a full-scale urban microclimate simulation is carried out. This will be reported in future papers of the research team.

Author Contributions

Conceptualization, H.X., C.C.W., X.S. and S.Z.; methodology, H.X., C.C.W. and X.S.; validation, C.C.W., X.S. and S.Z.; formal analysis, H.X., C.C.W. and X.S.; investigation, H.X.; writing—original draft preparation, H.X.; writing—review and editing, H.X., C.C.W., X.S. and S.Z.; supervision, C.C.W., X.S. and S.Z.; project administration, C.C.W. and X.S.; funding acquisition, C.C.W., X.S. and S.Z. All authors have read and agreed to the published version of the manuscript.

Funding

This research was funded by the University of New South Wales (UNSW Sydney) Scientia PhD Scholarship Scheme.

Conflicts of Interest

The authors declare no conflict of interest.

References

  1. Payne, T. Summary for Policymakers. In Global Warming of 1.5 °C above Pre-Industrial Levels and Related Global Greenhouse Gas Emission Pathways, in the Context of Strengthening the Global Response to the Threat of Climate Change; World Meteorological Organization: Geneva, Switzerland, 2018. [Google Scholar]
  2. Stewart, I.D.; Oke, T. Local Climate Zones for Urban Temperature Studies. Bull. Am. Meteorol. Soc. 2012, 93, 1879–1900. [Google Scholar] [CrossRef]
  3. Wang, C.; Sepasgozar, S.; Wang, M.; Sun, J.; Ning, X. Green Performance Evaluation System for Energy-Efficiency-Based Planning for Construction Site Layout. Energies 2019, 12, 4620. [Google Scholar] [CrossRef] [Green Version]
  4. Barati, K.; Shen, X. Operational level emissions modelling of on-road construction equipment through field data analysis. Autom. Constr. 2016, 72, 338–346. [Google Scholar] [CrossRef]
  5. Barati, K.; Shen, X. Optimal Driving Pattern of On-Road Construction Equipment for Emissions Reduction. Procedia Eng. 2017, 180, 1221–1228. [Google Scholar] [CrossRef]
  6. Santamouris, M. Recent Progress on Urban Overheating and Heat Island Research. Integrated Assessment of the Energy, Environmental, Vulnerability and Health Impact Synergies with the Global Climate Change. Energy Build. 2019, 207, 109482. [Google Scholar] [CrossRef]
  7. Santamouris, M. Analyzing the heat island magnitude and characteristics in one hundred Asian and Australian cities and regions. Sci. Total Environ. 2015, 512, 582–598. [Google Scholar] [CrossRef] [PubMed]
  8. Roxon, J.; Ulm, F.J.; Pellenq, R. Urban heat island impact on state residential energy cost and CO2 emissions in the United States. Urban Clim. 2020, 31, 100546. [Google Scholar] [CrossRef]
  9. Lowe, S. An energy and mortality impact assessment of the urban heat island in the US. Environ. Impact Assess. Rev. 2016, 56, 139–144. [Google Scholar] [CrossRef]
  10. Coseo, P.; Larsen, L. How factors of land use/land cover, building configuration, and adjacent heat sources and sinks explain Urban Heat Islands in Chicago. Landsc. Urban Plan. 2014, 125, 117–129. [Google Scholar] [CrossRef]
  11. De Carvalho, R.M.; Szlafsztein, C.F. Urban vegetation loss and ecosystem services: The influence on climate regulation and noise and air pollution. Environ. Pollut. 2019, 245, 844–852. [Google Scholar] [CrossRef] [PubMed]
  12. Dissegna, M.A.; Yin, T.; Wei, S.; Richards, D.; Grêt-Regamey, A. 3-D reconstruction of an urban landscape to assess the influence of vegetation in the radiative budget. Forests 2019, 10, 700. [Google Scholar] [CrossRef] [Green Version]
  13. Bowler, D.E.; Buyung-Ali, L.; Knight, T.M.; Pullin, A.S. Urban greening to cool towns and cities: A systematic review of the empirical evidence. Landsc. Urban Plan. 2010, 97, 147–155. [Google Scholar] [CrossRef]
  14. Shiflett, S.A.; Liang, L.L.; Crum, S.M.; Feyisa, G.L.; Wang, J.; Jenerette, G.D. Variation in the urban vegetation, surface temperature, air temperature nexus. Sci. Total Environ. 2017, 579, 495–505. [Google Scholar] [CrossRef]
  15. Ziter, C.D.; Pedersen, E.J.; Kucharik, C.J.; Turner, M.G. Scale-dependent interactions between tree canopy cover and impervious surfaces reduce daytime urban heat during summer. Proc. Natl. Acad. Sci. USA 2019, 116, 7575–7580. [Google Scholar] [CrossRef] [PubMed] [Green Version]
  16. Bolund, P.; Hunhammar, S. Ecosystem Services in Urban Areas. Ecol. Econ. 1999, 29, 293–301. [Google Scholar] [CrossRef]
  17. Martini, A.; Biondi, D.; Batista, A. The Influence of Street Trees on Urban Microclimate. Floresta 2020, 50, 1486. [Google Scholar] [CrossRef]
  18. Anthopoulos, L.; Fitsilis, P. From Digital to Ubiquitous Cities: Defining a Common Architecture for Urban Development. In Proceedings of the 2010 Sixth International Conference on Intelligent Environments, Kuala Lumpur, Malaysia, 19–21 July 2010; pp. 301–306. [Google Scholar]
  19. Bakici, T.; Almirall, E.; Wareham, J. A Smart City Initiative: The Case of Barcelona. J. Knowl. Econ. 2012, 4, 135–148. [Google Scholar] [CrossRef]
  20. Chourabi, H.; Nam, T.; Walker, S.; Gil-Garcia, J.R.; Mellouli, S.; Nahon, K.; Pardo, T.; Scholl, H. Understanding Smart Cities: An Integrative Framework. In Proceedings of the 45th Hawaii International Conference on System Sciences, Maui, HI, USA, 4–7 January 2012; pp. 2289–2297. [Google Scholar] [CrossRef]
  21. Su, K.; Li, J.; Fu, H. Smart City and the Applications. In Proceedings of the 2011 International Conference on Electronics, Communications and Control (ICECC), Ningbo, China, 9–11 September 2011; pp. 1028–1031. [Google Scholar]
  22. Zhang, K.; Deng, T.; Shen, M. A Systematic Review of the Digital Twin City: The New Pattern of Urban Governance Towards Smart City. J. Manag. Sci. Eng. 2021, 6, 125–134. [Google Scholar] [CrossRef]
  23. Ferrando, M.; Causone, F.; Hong, T.; Chen, Y. Urban building energy modeling (UBEM) tools: A state-of-the-art review of bottom-up physics-based approaches. Sustain. Cities Soc. 2020, 62, 102408. [Google Scholar] [CrossRef]
  24. Schneider, F.D.; Kükenbrink, D.; Schaepman, M.; Schimel, D.; Morsdorf, F. Quantifying 3D structure and occlusion in dense tropical and temperate forests using close-range LiDAR. Agric. For. Meterol. 2019, 268, 249–257. [Google Scholar] [CrossRef]
  25. Buccolieri, R.; Santiago, J.L.; Rivas, E.; Sanchez, B. Review on urban tree modelling in CFD simulations: Aerodynamic, deposition and thermal effects. Urban For. Urban Green. 2018, 31, 212–220. [Google Scholar] [CrossRef]
  26. Gromke, C.; Blocken, B.; Janssen, W.; Merema, B.; van Hooff, T.; Timmermans, H. CFD analysis of transpirational cooling by vegetation: Case study for specific meteorological conditions during a heat wave in Arnhem, Netherlands. Build. Environ. 2015, 83, 11–26. [Google Scholar] [CrossRef]
  27. Krayenhoff, E.; Santiago, J.; Martilli, A.; Christen, A.; Oke, T. Parametrization of Drag and Turbulence for Urban Neighbourhoods with Trees. Bound.-Layer Meteorol. 2015, 156, 157–189. [Google Scholar] [CrossRef]
  28. Wang, C.; Li, Q.; Wang, Z.H. Quantifying the impact of urban trees on passive pollutant dispersion using a coupled large-eddy simulation–Lagrangian stochastic model. Build. Environ. 2018, 145, 33–49. [Google Scholar] [CrossRef]
  29. Wang, C.; Wang, Z.H.; Yang, J. Cooling Effect of Urban Trees on the Built Environment of Contiguous United States. Earths Future 2018, 6, 1066–1081. [Google Scholar] [CrossRef] [Green Version]
  30. Wang, C.; Wang, Z.H.; Ryu, Y.H. A single-layer urban canopy model with transmissive radiation exchange between trees and street canyons. Build. Environ. 2021, 191, 107593. [Google Scholar] [CrossRef]
  31. Krayenhoff, E.S.; Jiang, T.; Christen, A.; Martilli, A.; Oke, T.R.; Bailey, B.N.; Nazarian, N.; Voogt, J.A.; Giometto, M.G.; Stastny, A.; et al. A multi-layer urban canopy meteorological model with trees (BEP-Tree): Street tree impacts on pedestrian-level climate. Urban Clim. 2020, 32, 100590. [Google Scholar] [CrossRef]
  32. Redon, E.; Lemonsu, A.; Masson, V.; Morille, B.; Musy, M. Implementation of street trees within the solar radiative exchange parameterization of TEB in SURFEX v8.0. Geosci. Model Dev. 2017, 10, 385–411. [Google Scholar] [CrossRef] [Green Version]
  33. Gromke, C.; Buccolieri, R.; Di Sabatino, S.; Ruck, B. Dispersion study in a street canyon with tree planting by means of wind tunnel and numerical investigations—Evaluation of CFD data with experimental data. Atmos. Environ. 2008, 42, 8640–8650. [Google Scholar] [CrossRef]
  34. Gromke, C.; Ruck, B. On the impact of trees on dispersion processes of traffic emissions in street canyons. Bound.-Layer Meteorol. 2009, 131, 19–34. [Google Scholar] [CrossRef]
  35. Krayenhoff, E.S.; Voogt, J.A. A microscale three-dimensional urban energy balance model for studying surface temperatures. Bound.-Layer Meteorol. 2007, 123, 433–461. [Google Scholar] [CrossRef]
  36. Grylls, T.; van Reeuwijk, M. Tree model with drag, transpiration, shading and deposition: Identification of cooling regimes and large-eddy simulation. Agric. For. Meterol. 2021, 298, 108288. [Google Scholar] [CrossRef]
  37. Krayenhoff, E.S.; Christen, A.; Martilli, A.; Oke, T.R. A Multi-layer Radiation Model for Urban Neighbourhoods with Trees. Bound.-Layer Meteorol. 2014, 151, 139–178. [Google Scholar] [CrossRef]
  38. Kugler, Z.; Tóth, Z.; Szalay, Z.; Szagri, D.; Barsi, Á. Supporting microclimate modeling with 3D uas data acquisition. Idojaras 2019, 123, 279–294. [Google Scholar] [CrossRef] [Green Version]
  39. Janoutová, R.; Homolová, L.; Malenovskỳ, Z.; Hanuš, J.; Lauret, N.; Gastellu-Etchegorry, J.P. Influence of 3D spruce tree representation on accuracy of airborne and satellite forest reflectance simulated in DART. Forests 2019, 10, 292. [Google Scholar] [CrossRef] [Green Version]
  40. Calders, K.; Origo, N.; Burt, A.; Disney, M.; Nightingale, J.; Raumonen, P.; Åkerblom, M.; Malhi, Y.; Lewis, P. Realistic forest stand reconstruction from terrestrial LiDAR for radiative transfer modelling. Remote Sens. 2018, 10, 933. [Google Scholar] [CrossRef] [Green Version]
  41. Qi, J.; Xie, D.; Guo, D.; Yan, G. A Large-Scale Emulation System for Realistic Three-Dimensional (3-D) Forest Simulation. IEEE J. Sel. Top. Appl. Earth Observ. Remote Sens. 2017, 10, 4834–4843. [Google Scholar] [CrossRef]
  42. Liu, W.; Atherton, J.; Mõttus, M.; Gastellu-Etchegorry, J.P.; Malenovský, Z.; Raumonen, P.; Åkerblom, M.; Mäkipää, R.; Porcar-Castell, A. Simulating solar-induced chlorophyll fluorescence in a boreal forest stand reconstructed from terrestrial laser scanning measurements. Remote Sens. Environ. 2019, 232, 111274. [Google Scholar] [CrossRef]
  43. Bournez, E.; Landes, T.; Najjar, G.; Kastendeuch, P.; Ngao, J.; Saudreau, M. Sensitivity of simulated light interception and tree transpiration to the level of detail of 3D tree reconstructions. Urban For. Urban Green. 2019, 38, 1–10. [Google Scholar] [CrossRef] [Green Version]
  44. Reckziegel, R.B.; Larysch, E.; Sheppard, J.P.; Kahle, H.P.; Morhart, C. Modelling and comparing shading effects of 3D tree structures with virtual leaves. Remote Sens. 2021, 13, 532. [Google Scholar] [CrossRef]
  45. Thomas, J.; Harden, A. Methods for the thematic synthesis of qualitative research in systematic reviews. BMC Med. Res. Methodol. 2008, 8, 45. [Google Scholar] [CrossRef] [PubMed] [Green Version]
  46. Boyle, F.; Sherman, D. Scopus™: The product and its development. Ser. Libr. 2005, 49, 147–153. [Google Scholar] [CrossRef]
  47. Nunez, M.; Oke, T.R. Energy Balance of An Urban Canyon. J. Appl. Meteorol. 1977, 16, 11–19. [Google Scholar] [CrossRef]
  48. Karvatte, N.J.; Miyagi, E.S.; de Oliveira, C.C.; Barreto, C.D.; Mastelaro, A.P.; Bungenstab, D.J.; Alves, F.V. Infrared thermography for microclimate assessment in agroforestry systems. Sci. Total Environ. 2020, 731, 139252. [Google Scholar] [CrossRef]
  49. Richter, R.; Hutengs, C.; Wirth, C.; Bannehr, L.; Vohland, M. Detecting tree species effects on forest canopy temperatures with thermal remote sensing: The role of spatial resolution. Remote Sens. 2021, 13, 135. [Google Scholar] [CrossRef]
  50. Středová, H.; Stehnová, E.; Středa, T.; Vysoudil, M. Microclimate conditions on Mohelno serpentine steppe national nature reserve after management plan realization. In Proceedings of the Public Recreation and Landscape Protection—With Sense Hand in Hand—Conference, Křtiny, Czech Republic, 13–15 May 2019; pp. 240–245. [Google Scholar]
  51. Gunawardena, K.R.; Wells, M.J.; Kershaw, T. Utilising green and bluespace to mitigate urban heat island intensity. Sci. Total Environ. 2017, 584, 1040–1055. [Google Scholar] [CrossRef]
  52. Wang, W.; Wang, H.; Xiao, L.; He, X.; Zhou, W.; Wang, Q.; Wei, C. Microclimate regulating functions of urban forests in changchun city (North-east China) and their associations with different factors. IForest 2018, 11, 140–147. [Google Scholar] [CrossRef] [Green Version]
  53. Rahman, M.A.; Moser, A.; Rötzer, T.; Pauleit, S. Microclimatic differences and their influence on transpirational cooling of Tilia cordata in two contrasting street canyons in Munich, Germany. Agric. For. Meterol. 2017, 232, 443–456. [Google Scholar] [CrossRef]
  54. Wang, W.; Zhang, B.; Xiao, L.; Zhou, W.; Wang, H.; He, X. Decoupling forest characteristics and background conditions to explain urban-rural variations of multiple microclimate regulation from urban trees. PeerJ 2018, 6, e5450. [Google Scholar] [CrossRef] [PubMed]
  55. Fan, S.; Zhang, M.; Li, Y.; Li, K.; Dong, L. Impacts of composition and canopy characteristics of plant communities on microclimate and airborne particles in beijing, china. Sustainability 2021, 13, 4791. [Google Scholar] [CrossRef]
  56. Moss, J.L.; Doick, K.J.; Smith, S.; Shahrestani, M. Influence of evaporative cooling by urban forests on cooling demand in cities. Urban For. Urban Green. 2019, 37, 65–73. [Google Scholar] [CrossRef] [Green Version]
  57. Fabbri, K.; Ugolini, A.; Iacovella, A.; Bianchi, A.P. The effect of vegetation in outdoor thermal comfort in archaeological area in urban context. Build. Environ. 2020, 175, 106816. [Google Scholar] [CrossRef]
  58. Tsoka, S.; Leduc, T.; Rodler, A. Assessing the effects of urban street trees on building cooling energy needs: The role of foliage density and planting pattern. Sustain. Cities Soc. 2021, 65, 102633. [Google Scholar] [CrossRef]
  59. Fahmy, M.; El-Hady, H.; Mahdy, M.; Abdelalim, M.F. On the green adaptation of urban developments in Egypt; predicting community future energy efficiency using coupled outdoor-indoor simulations. Energy Build. 2017, 153, 241–261. [Google Scholar] [CrossRef]
  60. Gret-Regamey, A.; Gret-Regamey, A.; Gret-Regamey, A.; Galleguillos-Torres, M.; Dissegna, A.; Weibel, B. How urban densification influences ecosystem services—A comparison between a temperate and a tropical city. Environ. Res. Lett. 2020, 15, 075001. [Google Scholar] [CrossRef]
  61. Park, J.; Kim, J.H.; Lee, D.K.; Park, C.Y.; Jeong, S.G. The influence of small green space type and structure at the street level on urban heat island mitigation. Urban For. Urban Green. 2017, 21, 203–212. [Google Scholar] [CrossRef]
  62. Lobaccaro, G.; Acero, J.A.; Martinez, G.S.; Padro, A.; Laburu, T.; Fernandez, G. Effects of orientations, aspect ratios, pavement materials and vegetation elements on thermal stress inside typical urban canyons. Int. J. Environ. Res. Public Health 2019, 16, 3574. [Google Scholar] [CrossRef] [PubMed] [Green Version]
  63. Ngao, J.; Adam, B.; Saudreau, M. Intra-crown spatial variability of leaf temperature and stomatal conductance enhanced by drought in apple tree as assessed by the RATP model. Agric. For. Meterol. 2017, 237, 340–354. [Google Scholar] [CrossRef]
  64. Zhao, D.; Lei, Q.; Shi, Y.; Wang, M.; Chen, S.; Shah, K.; Ji, W. Role of species and planting configuration on transpiration and microclimate for urban trees. Forests 2020, 11, 825. [Google Scholar] [CrossRef]
  65. Deng, J.; Pickles, B.J.; Smith, S.T.; Shao, L. Infrared radiative performance of urban trees: Spatial distribution and interspecific comparison among ten species in the UK by in-situ spectroscopy. Build. Environ. 2020, 172, 106682. [Google Scholar] [CrossRef]
  66. Huang, Z.; Wu, C.; Teng, M.; Lin, Y. Impacts of tree canopy cover on microclimate and human thermal comfort in a shallow street canyon in Wuhan, China. Atmosphere 2020, 11, 588. [Google Scholar] [CrossRef]
  67. Irmak, M.A.; Yilmaz, S.; Mutlu, E.; Yilmaz, H. Assessment of the effects of different tree species on urban microclimate. Environ. Sci. Pollut. Res. 2018, 25, 15802–15822. [Google Scholar] [CrossRef]
  68. Pace, R.; De Fino, F.; Rahman, M.A.; Pauleit, S.; Nowak, D.J.; Grote, R. A single tree model to consistently simulate cooling, shading, and pollution uptake of urban trees. Int. J. Biometeorol. 2021, 65, 277–289. [Google Scholar] [CrossRef] [PubMed]
  69. Xiong, Y.; Zhang, J.; Xu, X.; Yan, Y.; Sun, S.; Liu, S. Strategies for improving the microclimate and thermal comfort of a classical Chinese garden in the hot-summer and cold-winter zone. Energy Build. 2020, 215, 109914. [Google Scholar] [CrossRef]
  70. Li, Y.; Xia, C.; Wu, R.; Ma, Y.; Mu, B.; Wang, T.; Petropoulos, E.; Hokoi, S. Role of the urban plant environment in the sustainable protection of an ancient city wall. Build. Environ. 2021, 187, 107405. [Google Scholar] [CrossRef]
  71. Coccolo, S.; Pearlmutter, D.; Kaempf, J.; Scartezzini, J.L. Thermal Comfort Maps to estimate the impact of urban greening on the outdoor human comfort. Urban For. Urban Green. 2018, 35, 91–105. [Google Scholar] [CrossRef]
  72. Horváthová, E.; Badura, T.; Duchková, H. The value of the shading function of urban trees: A replacement cost approach. Urban For. Urban Green. 2021, 62, 127166. [Google Scholar] [CrossRef]
  73. Zhao, Q.; Sailor, D.J.; Wentz, E.A. Impact of tree locations and arrangements on outdoor microclimates and human thermal comfort in an urban residential environment. Urban For. Urban Green. 2018, 32, 81–91. [Google Scholar] [CrossRef] [Green Version]
  74. Soma, M.; Pimont, F.; Dupuy, J.L. Sensitivity of voxel-based estimations of leaf area density with terrestrial LiDAR to vegetation structure and sampling limitations: A simulation experiment. Remote Sens. Environ. 2021, 257, 112354. [Google Scholar] [CrossRef]
  75. Ellsworth, D.; Reich, P. Canopy structure and vertical patterns of photosynthesis and related leaf traits in a deciduous forest. Oecologia 1993, 96, 169–178. [Google Scholar] [CrossRef]
  76. Kitajima, K.; Mulkey, S.; Wright, S.J. Variation in Crown Light Utilization Characteristics among Tropical Canopy Trees. Ann. Bot. 2005, 95, 535–547. [Google Scholar] [CrossRef] [PubMed] [Green Version]
  77. Weiss, M.; Baret, F.; Smith, G.J.; Jonckheere, I.; Coppin, P. Review of methods for in situ leaf area index (LAI) determination: Part II. Estimation of LAI, errors and sampling. Agric. For. Meterol. 2004, 121, 37–53. [Google Scholar] [CrossRef]
  78. Solberg, S.; Strand, L. Crown density assessments, control surveys and reproducibility. Environ. Monit. Assess. 1999, 56, 75–86. [Google Scholar] [CrossRef]
  79. Zhen, Z.; Quackenbush, L.J.; Zhang, L. Trends in automatic individual tree crown detection and delineation-evolution of LiDAR data. Remote Sens. 2016, 8, 333. [Google Scholar] [CrossRef] [Green Version]
  80. Vogt, J.; Gillner, S.; Hofmann, M.; Tharang, A.; Dettmann, S.; Gerstenberg, T.; Schmidt, C.; Gebauer, H.; Van de Riet, K.; Berger, U.; et al. Citree: A database supporting tree selection for urban areas in temperate climate. Landsc. Urban Plan. 2017, 157, 14–25. [Google Scholar] [CrossRef]
  81. Sanusi, R.; Johnstone, D.; May, P.; Livesley, S.J. Microclimate benefits that different street tree species provide to sidewalk pedestrians relate to differences in Plant Area Index. Landsc. Urban Plan. 2017, 157, 502–511. [Google Scholar] [CrossRef]
  82. Li, J.; Liu, J.; Srebric, J.; Hu, Y.; Liu, M.; Su, L.; Wang, S. The effect of tree-planting patterns on the microclimate within a courtyard. Sustainability 2019, 11, 1665. [Google Scholar] [CrossRef] [Green Version]
  83. Deng, J.; Pickles, B.J.; Shao, L. In-situ spectroscopy and shortwave radiometry reveals spatial and temporal variation in the crown-level radiative performance of urban trees. Remote Sens. Environ. 2021, 253, 112231. [Google Scholar] [CrossRef]
  84. Shata, R.O.; Mahmoud, A.H.; Fahmy, M. Correlating the sky view factor with the pedestrian thermal environment in a hot arid university campus plaza. Sustainability 2021, 13, 468. [Google Scholar] [CrossRef]
  85. Meili, N.; Manoli, G.; Burlando, P.; Carmeliet, J.; Chow, W.T.L.; Coutts, A.M.; Roth, M.; Velasco, E.; Vivoni, E.R.; Fatichi, S. Tree effects on urban microclimate: Diurnal, seasonal, and climatic temperature differences explained by separating radiation, evapotranspiration, and roughness effects. Urban For. Urban Green. 2021, 58, 126970. [Google Scholar] [CrossRef]
  86. Fahmy, M.; Kamel, H.; Mokhtar, H.; Elwy, I.; Gimiee, A.; Ibrahim, Y.; Abdelalim, M. On the development and optimization of an Urban Design Comfort Model (UDCM) on a passive solar basis at mid-latitude sites. Climate 2019, 7, 1. [Google Scholar] [CrossRef] [Green Version]
  87. Ma, X.; Fukuda, H.; Zhou, D.; Gao, W.; Wang, M. The study on outdoor pedestrian thermal comfort in blocks: A case study of the Dao He Old Block in hot-summer and cold-winter area of southern China. Sol. Energy 2019, 179, 210–225. [Google Scholar] [CrossRef]
  88. Tan, Z.; Lau, K.K.L.; Ng, E. Planning strategies for roadside tree planting and outdoor comfort enhancement in subtropical high-density urban areas. Build. Environ. 2017, 120, 93–109. [Google Scholar] [CrossRef]
  89. Chan, S.Y.; Chau, C.K. On the study of the effects of microclimate and park and surrounding building configuration on thermal comfort in urban parks. Sustain. Cities Soc. 2021, 64, 102512. [Google Scholar] [CrossRef]
  90. Wang, Y.; Ni, Z.; Hu, M.; Chen, S.; Xia, B. A practical approach of urban green infrastructure planning to mitigate urban overheating: A case study of Guangzhou. J. Clean Prod. 2021, 287, 124995. [Google Scholar] [CrossRef]
  91. Wu, Z.; Kong, F.; Wang, Y.; Sun, R.; Chen, L. The impact of greenspace on thermal comfort in a residential quarter of Beijing, China. Int. J. Environ. Res. Public Health 2016, 13, 1217. [Google Scholar] [CrossRef] [Green Version]
  92. Deng, J.; Pickles, B.J.; Kavakopoulos, A.; Blanusa, T.; Halios, C.H.; Smith, S.T.; Shao, L. Concept and methodology of characterising infrared radiative performance of urban trees using tree crown spectroscopy. Build. Environ. 2019, 157, 380–390. [Google Scholar] [CrossRef]
  93. Helletsgruber, C.; Stanley, C.; Hof, A. Urban trees in sync with urban climate—Phenology and microclimate monitoring using geocommunication and citizen science. GI_Forum 2019, 7, 10–17. [Google Scholar] [CrossRef]
  94. Wang, W.; Zhang, B.; Zhou, W.; Lv, H.; Xiao, L.; Wang, H.; Du, H.; He, X. The effect of urbanization gradients and forest types on microclimatic regulation by trees, in association with climate, tree sizes and species compositions in Harbin city, northeastern China. Urban Ecosyst. 2019, 22, 367–384. [Google Scholar] [CrossRef]
  95. Teixeira, C.F.B. Green space configuration and its impact on human behavior and URBAN environments. Urban Clim. 2021, 35, 100746. [Google Scholar] [CrossRef]
  96. Vieira, J.; Matos, P.; Mexia, T.; Silva, P.; Lopes, N.; Freitas, C.; Correia, O.; Santos-Reis, M.; Branquinho, C.; Pinho, P. Green spaces are not all the same for the provision of air purification and climate regulation services: The case of urban parks. Environ. Res. 2018, 160, 306–313. [Google Scholar] [CrossRef]
  97. Dekić, J.P.; Mitković, P.B.; Dinic Branković, M.M.; Igić, M.Z.; Dekić, P.S.; Mitković, M.P. The study of effects of greenery on temperature reduction in urban areas. Therm. Sci. 2018, 22, 988–1000. [Google Scholar] [CrossRef] [Green Version]
  98. Grilo, F.; Pinho, P.; Aleixo, C.; Catita, C.; Silva, P.; Lopes, N.; Freitas, C.; Santos-Reis, M.; McPhearson, T.; Branquinho, C. Using green to cool the grey: Modelling the cooling effect of green spaces with a high spatial resolution. Sci. Total Environ. 2020, 724, 138182. [Google Scholar] [CrossRef]
  99. Chen, L.; Zhang, Y.; Han, J.; Li, X. An investigation of the influence of ground surface properties and shading on outdoor thermal comfort in a high-altitude residential area. Front. Archit. Res. 2021, 10, 432–446. [Google Scholar] [CrossRef]
  100. Heris, M.P.; Middel, A.; Muller, B. Impacts of form and design policies on urban microclimate: Assessment of zoning and design guideline choices in urban redevelopment projects. Landsc. Urban Plan. 2020, 202, 103870. [Google Scholar] [CrossRef]
  101. Tong, L.; Buccolieri, R.; Gao, Z. A Numerical Study on the Correlation between Sky View Factor and Summer Microclimate of Local Climate Zones. Atmosphere 2019, 10, 438. [Google Scholar] [CrossRef] [Green Version]
  102. Garratt, J.R. Boundary layer climates. Earth-Sci. Rev. 1990, 27, 265. [Google Scholar] [CrossRef]
  103. Howell, J.; Mengüç, M.P.; Siegel, R. Thermal Radiation Heat Transfer, 6th ed.; CRC Press: Boca Raton, FL, USA, 2015; 971p. [Google Scholar]
  104. Wang, M.; Wang, C.; Sepasgozar, S.; Zlatanova, S. A Systematic Review of Digital Technology Adoption in Off-Site Construction: Current Status and Future Direction towards Industry 4.0. Buildings 2020, 10, 204. [Google Scholar] [CrossRef]
  105. Sepasgozar, S.; Wang, C.; Shirowzhan, S. Challenges and Opportunities for Implementation of Laser Scanners in Building Construction. In Proceedings of the International Symposium on Automation and Robotics in Construction, Auburn, AL, USA, 18–21 July 2016; pp. 742–751. [Google Scholar]
  106. Jia, J.; Zlatanova, S.; Zhang, K. Exploring Spatial Parameters to Evaluate Human Walking Accessibility of Urban Green Space. ISPRS-Int. Arch. Photogramm. Remote. Sens. Spat. Inf. Sci. 2020, 44, 73–80. [Google Scholar] [CrossRef]
  107. Carson, W.; Andersen, H.-E.; Reutebuch, S.; McGaughey, R. LiDAR applications in forestry—An overview. In Proceedings of the ASPRS Annual Conference, Denver, CO, USA, 3 May 2004. [Google Scholar]
  108. Dassot, M.; Constant, T.; Fournier, M. The use of terrestrial LiDAR technology in forest science: Application fields, benefits and challenges. Ann. For. Sci. 2011, 68, 959–974. [Google Scholar] [CrossRef] [Green Version]
  109. Shahtahmassebi, A.R.; Li, C.; Fan, Y.; Wu, Y.; Lin, Y.; Gan, M.; Wang, K.; Malik, A.; Blackburn, G.A. Remote sensing of urban green spaces: A review. Urban For. Urban Green. 2021, 57, 126946. [Google Scholar] [CrossRef]
  110. Xie, D.; Wang, X.; Qi, J.; Chen, Y.; Mu, X.; Zhang, W.; Yan, G. Reconstruction of single tree with leaves based on terrestrial LiDAR point cloud data. Remote Sens. 2018, 10, 686. [Google Scholar] [CrossRef] [Green Version]
  111. Bremer, M.; Wichmann, V.; Rutzinger, M. Calibration and validation of a detailed architectural canopy model reconstruction for the simulation of synthetic hemispherical images and airborne LiDAR data. Remote Sens. 2017, 9, 220. [Google Scholar] [CrossRef] [Green Version]
  112. Bremer, M.; Wichmann, V.; Rutzinger, M. Multi-temporal fine-scale modelling of Larix decidua forest plots using terrestrial LiDAR and hemispherical photographs. Remote Sens. Environ. 2018, 206, 189–204. [Google Scholar] [CrossRef]
  113. Aicardi, I.; Dabove, P.; Lingua, A.M.; Piras, M. Integration between TLS and UAV photogrammetry techniques for forestry applications. IForest 2017, 10, 41–47. [Google Scholar] [CrossRef] [Green Version]
  114. Surový, P.; Yoshimoto, A.; Panagiotidis, D. Accuracy of reconstruction of the tree stem surface using terrestrial close-range photogrammetry. Remote Sens. 2016, 8, 123. [Google Scholar] [CrossRef] [Green Version]
  115. Kohek, Š.; Strnad, D.; Žalik, B.; Kolmanič, S. Estimation of projection matrices from a sparse set of feature points for 3D tree reconstruction from multiple images. Period. Eng. Nat. Sci. 2017, 5, 278–285. [Google Scholar] [CrossRef] [Green Version]
  116. Bayati, H.; Najafi, A.; Vahidi, J.; Gholamali Jalali, S. 3D reconstruction of uneven-aged forest in single tree scale using digital camera and SfM-MVS technique. Scand. J. For. Res. 2021, 36, 210–220. [Google Scholar] [CrossRef]
  117. Liu, J.; Feng, Z.; Yang, L.; Mannan, A.; Khan, T.U.; Zhao, Z.; Cheng, Z. Extraction of sample plot parameters from 3D point cloud reconstruction based on combined RTK and CCD continuous photography. Remote Sens. 2018, 10, 1299. [Google Scholar] [CrossRef] [Green Version]
  118. Rossi, R.; Leolini, C.; Costafreda-Aumedes, S.; Leolini, L.; Bindi, M.; Zaldei, A.; Moriondo, M. Performances evaluation of a low-cost platform for high-resolution plant phenotyping. Sensors 2020, 20, 3150. [Google Scholar] [CrossRef]
  119. Wells, L.A.; Chung, W. Evaluation of ground plane detection for estimating breast height in stereo images. For. Sci. 2020, 66, 612–622. [Google Scholar] [CrossRef]
  120. Piermattei, L.; Karel, W.; Wang, D.; Wieser, M.; Mokroš, M.; Surový, P.; Koreň, M.; Tomaštík, J.; Pfeifer, N.; Hollaus, M. Terrestrial structure from motion photogrammetry for deriving forest inventory data. Remote Sens. 2019, 11, 933. [Google Scholar] [CrossRef] [Green Version]
  121. Yang, H.; Wang, X.; Sun, G. Three-dimensional morphological measurement method for a fruit tree canopy based on Kinect sensor self-calibration. Agronomy 2019, 9, 741. [Google Scholar] [CrossRef] [Green Version]
  122. Dong, W.; Roy, P.; Isler, V. Semantic mapping for orchard environments by merging two-sides reconstructions of tree rows. J. Field Robot. 2020, 37, 97–121. [Google Scholar] [CrossRef]
  123. Moriondo, M.; Leolini, L.; Staglianò, N.; Argenti, G.; Trombi, G.; Brilli, L.; Dibari, C.; Leolini, C.; Bindi, M. Use of digital images to disclose canopy architecture in olive tree. Sci. Hortic. 2016, 209, 1–13. [Google Scholar] [CrossRef]
  124. Sun, T.; Kan, J.; Liu, J.; Huang, Q.; Ma, K.; Sun, T. 3D reconstruction of tree and limb based on aerial image of UAV. Acta Tech. CSAV (Ceskoslovensk Akad. Ved) 2017, 62, 165–175. [Google Scholar]
  125. Zhang, Y.; Wu, H.; Yang, W. Forests growth monitoring based on tree canopy 3D reconstruction using UAV aerial photogrammetry. Forests 2019, 10, 1052. [Google Scholar] [CrossRef] [Green Version]
  126. Jurado, J.M.; Ortega, L.; Cubillas, J.J.; Feito, F.R. Multispectral mapping on 3D models and multi-temporal monitoring for individual characterization of olive trees. Remote Sens. 2020, 12, 1106. [Google Scholar] [CrossRef] [Green Version]
  127. de Castro, A.I.; Rallo, P.; Suárez, M.P.; Torres-Sánchez, J.; Casanova, L.; Jiménez-Brenes, F.M.; Morales-Sillero, A.; Jiménez, M.R.; López-Granados, F. High-Throughput System for the Early Quantification of Major Architectural Traits in Olive Breeding Trials Using UAV Images and OBIA Techniques. Front. Plant Sci. 2019, 10, 1472. [Google Scholar] [CrossRef] [Green Version]
  128. Sun, T.; Liu, J.; Kan, J.; Sui, T.; Li, J.; Ji, M. Research on clustering matching strategy of 3d reconstruction based on image fusion features. UPB Sci. Bull Electr. Eng. Comput. Sci. 2020, 82, 87–106. [Google Scholar]
  129. Pap, M.; Király, S.; Molják, S. Analysing the vegetation of energy plants by processing UAV images. Ann. Math. Et Inform. 2020, 52, 183–197. [Google Scholar] [CrossRef]
  130. Vauhkonen, J.; Ruotsalainen, R. Reconstructing forest canopy from the 3D triangulations of airborne laser scanning point data for the visualization and planning of forested landscapes. Ann. For. Sci. 2017, 74, 9. [Google Scholar] [CrossRef] [Green Version]
  131. Indirabai, I.; Nair, M.V.H.; Jaishanker, R.N.; Nidamanuri, R.R. Terrestrial laser scanner based 3D reconstruction of trees and retrieval of leaf area index in a forest environment. Ecol. Inform. 2019, 53, 100986. [Google Scholar] [CrossRef]
  132. Indirabai, I.; Nair, M.V.H.; Nair, J.R.; Nidamanuri, R.R. Direct estimation of leaf area index of tropical forests using LiDAR point cloud. Remote Sens. Appl. Soc. Environ. 2020, 18, 100295. [Google Scholar] [CrossRef]
  133. Muumbe, T.P.; Tagwireyi, P.; Mafuratidze, P.; Hussin, Y.; van Leeuwen, L. Estimating above-ground biomass of individual trees with terrestrial laser scanner and 3D quantitative structure modelling. South. For. 2021, 83, 56–68. [Google Scholar] [CrossRef]
  134. Mei, J.; Zhang, L.; Wu, S.; Wang, Z.; Zhang, L. 3D tree modeling from incomplete point clouds via optimization and L1-MST. Int. J. Geogr. Inf. Sci. 2017, 31, 999–1021. [Google Scholar] [CrossRef]
  135. Jackson, T.; Shenkin, A.; Wellpott, A.; Calders, K.; Origo, N.; Disney, M.; Burt, A.; Raumonen, P.; Gardiner, B.; Herold, M.; et al. Finite element analysis of trees in the wind based on terrestrial laser scanning data. Agric. For. Meterol. 2019, 265, 137–144. [Google Scholar] [CrossRef]
  136. Lau, A.; Bentley, L.P.; Martius, C.; Shenkin, A.; Bartholomeus, H.; Raumonen, P.; Malhi, Y.; Jackson, T.; Herold, M. Quantifying branch architecture of tropical trees using terrestrial LiDAR and 3D modelling. Trees Struct. Funct. 2018, 32, 1219–1231. [Google Scholar] [CrossRef] [Green Version]
  137. Luck, L.; Hutley, L.B.; Calders, K.; Levick, S.R. Exploring the variability of tropical savanna tree structural allometry with terrestrial laser scanning. Remote Sens. 2020, 12, 3893. [Google Scholar] [CrossRef]
  138. Lau, A.; Martius, C.; Bartholomeus, H.; Shenkin, A.; Jackson, T.; Malhi, Y.; Herold, M.; Bentley, L.P. Estimating architecture-based metabolic scaling exponents of tropical trees using terrestrial LiDAR and 3D modelling. For. Ecol. Manag. 2019, 439, 132–145. [Google Scholar] [CrossRef]
  139. Fan, G.; Nan, L.; Chen, F.; Dong, Y.; Wang, Z.; Li, H.; Chen, D. A new quantitative approach to tree attributes estimation based on LiDAR point clouds. Remote Sens. 2020, 12, 1779. [Google Scholar] [CrossRef]
  140. Xu, R.; Yun, T.; Cao, L.; Liu, Y. Compression and recovery of 3d broad-leaved tree point clouds based on compressed sensing. Forests 2020, 11, 257. [Google Scholar] [CrossRef] [Green Version]
  141. Fan, G.; Nan, L.; Dong, Y.; Su, X.; Chen, F. AdQSM: A new method for estimating above-ground biomass from TLS point clouds. Remote Sens. 2020, 12, 3089. [Google Scholar] [CrossRef]
  142. Risse, B.; Mangan, M.; Stürzl, W.; Webb, B. Software to convert terrestrial LiDAR scans of natural environments into photorealistic meshes. Environ. Model. Softw. 2018, 99, 88–100. [Google Scholar] [CrossRef] [Green Version]
  143. Chakraborty, M.; Khot, L.R.; Sankaran, S.; Jacoby, P.W. Evaluation of mobile 3D light detection and ranging based canopy mapping system for tree fruit crops. Comput. Electron. Agric. 2019, 158, 284–293. [Google Scholar] [CrossRef]
  144. Colaço, A.F.; Trevisan, R.G.; Molin, J.P.; Rosell-Polo, J.R.; Escolà, A. A method to obtain orange crop geometry information using a mobile terrestrial laser scanner and 3D modeling. Remote Sens. 2017, 9, 763. [Google Scholar] [CrossRef] [Green Version]
  145. Françon, J. The algorithmic beauty of plants. Plant Sci. 1997, 122, 109–110. [Google Scholar] [CrossRef]
  146. Soma, M.; Pimont, F.; Durrieu, S.; Dupuy, J.-L. Enhanced Measurements of Leaf Area Density with T-LiDAR: Evaluating and Calibrating the Effects of Vegetation Heterogeneity and Scanner Properties. Remote Sens. 2018, 10, 1580. [Google Scholar] [CrossRef] [Green Version]
  147. Liu, H.; Wu, C. Developing a scene-based triangulated irregular network (TIN) technique for individual tree crown reconstruction with LiDAR data. Forests 2020, 11, 28. [Google Scholar] [CrossRef] [Green Version]
  148. Kwak, E.-A.; Ahn, S.; Jaworski, J. Microfabrication of Custom Collagen Structures Capable of Guiding Cell Morphology and Alignment. Biomacromolecules 2015, 16, 295. [Google Scholar] [CrossRef]
  149. Côté, J.-F.; Fournier, R.A.; Egli, R. An architectural model of trees to estimate forest structural attributes using terrestrial LiDAR. Environ. Modell. Softw. 2011, 26, 761–777. [Google Scholar] [CrossRef]
  150. Wang, D.; Hollaus, M.; Puttonen, E.; Pfeifer, N. Automatic and self-adaptive stem reconstruction in landslide-affected forests. Remote Sens. 2016, 8, 974. [Google Scholar] [CrossRef] [Green Version]
  151. Cluzeau, C.; Dupouey, J.L.; Courbaud, B. Polyhedral representation of crown shape. A geometric tool for growth modelling. Ann. Sci. Forest. 1995, 52, 297–306. [Google Scholar] [CrossRef] [Green Version]
  152. Yang, Q.; Chen, Z.; Sun, G. Automatic Extraction Method of Tree Measurement Factors Based on Point Cloud Data. Nongye Jixie Xuebao 2017, 48, 179–185. [Google Scholar] [CrossRef]
  153. Dong, P. Characterization of individual tree crowns using three-dimensional shape signatures derived from LiDAR data. Int. J. Remote Sens. 2009, 30, 6621–6628. [Google Scholar] [CrossRef]
  154. Zeide, B.; Pfeifer, P. A Method for Estimation of Fractal Dimension of Tree Crowns. For. Sci. 1991, 37, 1253–1265. [Google Scholar] [CrossRef]
  155. Lecigne, B.; Delagrange, S.; Messier, C. Exploring trees in three dimensions: VoxR, a novel voxel-based R package dedicated to analysing the complex arrangement of tree crowns. Ann. Bot. 2018, 121, 589–601. [Google Scholar] [CrossRef]
  156. Béland, M.; Baldocchi, D.D.; Widlowski, J.L.; Fournier, R.A.; Verstraete, M.M. On seeing the wood from the leaves and the role of voxel size in determining leaf area distribution of forests with terrestrial LiDAR. Agric. For. Meterol. 2014, 184, 82–97. [Google Scholar] [CrossRef]
  157. Barton, J.; Gorte, B.; Eusuf, M.S.R.S.; Zlatanova, S. A Voxel-Based Method to Estimate Near-Surface and Elevated Fuel from Dense Lidar Point Cloud for Hazard Reduction Burning. ISPRS-Ann. Photogramm. Remote. Sens. Spat. Inf. Sci. 2020, 6, 3–10. [Google Scholar] [CrossRef]
  158. Vonderach, C.; Voegtle, T.; Adler, P. Voxel-based approach for estimating urban tree volume from terrestrial laser scanning data. Int. Arch. Photogramm. Remote. Sens. Spat. Inf. Sci. 2012, 8, 451–456. [Google Scholar] [CrossRef] [Green Version]
  159. Eusuf, M.S.R.S.; Barton, J.; Gorte, B.; Zlatanova, S. Volume Estimation of Fuel Load for Hazard Reduction Burning: First Results to a Voxel Approach. ISPRS-Int. Arch. Photogramm. Remote. Sens. Spat. Inf. Sci. 2020, 43, 1199–1206. [Google Scholar] [CrossRef]
  160. Kato, A.; Moskal, L.M.; Schiess, P.; Swanson, M.E.; Calhoun, D.; Stuetzle, W. Capturing tree crown formation through implicit surface reconstruction using airborne lidar data. Remote Sens. Environ. 2009, 113, 1148–1162. [Google Scholar] [CrossRef]
  161. Grau, E.; Durrieu, S.; Fournier, R.; Gastellu-Etchegorry, J.P.; Yin, T. Estimation of 3D vegetation density with Terrestrial Laser Scanning data using voxels. A sensitivity analysis of influencing parameters. Remote Sens. Environ. 2017, 191, 373–388. [Google Scholar] [CrossRef]
  162. Wu, S.; Xiao, B.; Wen, W.; Guo, X.; Liu, L. Fruit trees 3D data acquisition and reconstruction based on multi-source. IFIP Adv. Inf. Commun. Technol. 2019, 546, 162–172. [Google Scholar] [CrossRef]
  163. Raumonen, P.; Kaasalainen, M.; Markku, A.; Kaasalainen, S.; Kaartinen, H.; Vastaranta, M.; Holopainen, M.; Disney, M.; Lewis, P. Fast automatic precision tree models from terrestrial laser scanner data. Remote Sens. 2013, 5, 491–520. [Google Scholar] [CrossRef] [Green Version]
  164. Disney, M.; Boni Vicari, M.; Burt, A.; Calders, K.; Lewis, S.; Raumonen, P.; Wilkes, P. Weighing trees with lasers: Advances, challenges and opportunities. Interface Focus 2018, 8, 20170048. [Google Scholar] [CrossRef] [Green Version]
  165. Kaasalainen, S.; Krooks, A.; Liski, J.; Raumonen, P.; Kaartinen, H.; Kaasalainen, M.; Puttonen, E.; Anttila, K.; Mäkipää, R. Change detection of tree biomass with terrestrial laser scanning and quantitative structure modelling. Remote Sens. 2014, 6, 3906–3922. [Google Scholar] [CrossRef] [Green Version]
  166. Ye, N.; van Leeuwen, L.; Nyktas, P. Analysing the potential of UAV point cloud as input in quantitative structure modelling for assessment of woody biomass of single trees. Int. J. Appl. Earth Obs. Geoinf. 2019, 81, 47–57. [Google Scholar] [CrossRef]
  167. Calders, K.; Newnham, G.; Burt, A.; Murphy, S.; Raumonen, P.; Herold, M.; Culvenor, D.; Avitabile, V.; Disney, M.; Armston, J.; et al. Nondestructive estimates of above-ground biomass using terrestrial laser scanning. Methods Ecol. Evol. 2015, 6, 198–208. [Google Scholar] [CrossRef]
  168. Liu, H.; Wu, C. Crown-level tree species classification from AISA hyperspectral imagery using an innovative pixel-weighting approach. Int. J. Appl. Earth Obs. Geoinf. 2018, 68, 298–307. [Google Scholar] [CrossRef]
  169. Shojanoori, R.; Shafri, H.Z.M.; Mansor, S.; Ismail, M.H. Generic rule-sets for automated detection of urban tree species from very high-resolution satellite data. Geocarto Int. 2018, 33, 357–374. [Google Scholar] [CrossRef]
  170. Pontius, J.; Hanavan, R.P.; Hallett, R.A.; Cook, B.D.; Corp, L.A. High spatial resolution spectral unmixing for mapping ash species across a complex urban environment. Remote Sens. Environ. 2017, 199, 360–369. [Google Scholar] [CrossRef]
  171. Liu, L.; Coops, N.C.; Aven, N.W.; Pang, Y. Mapping urban tree species using integrated airborne hyperspectral and LiDAR remote sensing data. Remote Sens. Environ. 2017, 200, 170–182. [Google Scholar] [CrossRef]
  172. Mozgeris, G.; Juodkiene, V.; Jonikavičius, D.; Straigyte, L.; Gadal, S.; Ouerghemmi, W. Ultra-Light aircraft-based hyperspectral and colour-infrared imaging to identify deciduous tree species in an urban environment. Remote Sens. 2018, 10, 1668. [Google Scholar] [CrossRef] [Green Version]
  173. Kamoske, A.G.; Dahlin, K.M.; Stark, S.C.; Serbin, S.P. Leaf area density from airborne LiDAR: Comparing sensors and resolutions in a temperate broadleaf forest ecosystem. For. Ecol. Manag. 2019, 433, 364–375. [Google Scholar] [CrossRef]
  174. Stark, S.; Leitold, V.; Wu, J.; Hunter, M.; Castilho, C.; Costa, F.; McMahon, S.; Parker, G.; Shimabukuro, M.; Lefsky, M.; et al. Amazon forest carbon dynamics predicted by profiles of canopy leaf area and light environment. Ecol. Lett. 2012, 15, 1406–1414. [Google Scholar] [CrossRef] [PubMed] [Green Version]
  175. Béland, M.; Widlowski, J.-L.; Fournier, R.A.; Côté, J.-F.; Verstraete, M.M. Estimating leaf area distribution in savanna trees from terrestrial LiDAR measurements. Agric. For. Meterol. 2011, 151, 1252–1266. [Google Scholar] [CrossRef]
  176. Hosoi, F.; Nakai, Y.; Omasa, K. Estimation and Error Analysis of Woody Canopy Leaf Area Density Profiles Using 3-D Airborne and Ground-Based Scanning Lidar Remote-Sensing Techniques. Geoscience and Remote Sensing. IEEE Trans. Geosci. Remote Sens. 2010, 48, 2215–2223. [Google Scholar] [CrossRef]
  177. Hosoi, F.; Nakai, Y.; Omasa, K. 3-D voxel-based solid modeling of a broad-leaved tree for accurate volume estimation using portable scanning lidar. ISPRS J. Photogramm. Remote Sens. 2013, 82, 41–48. [Google Scholar] [CrossRef]
  178. Zheng, G.; Moskal, L. Leaf Orientation Retrieval from Terrestrial Laser Scanning (TLS) Data. IEEE Trans. Geosci. Remote Sens. 2012, 50, 3970–3979. [Google Scholar] [CrossRef]
  179. Wang, Y.; Fang, H. Estimation of LAI with the LiDAR technology: A review. Remote Sens. 2020, 12, 3457. [Google Scholar] [CrossRef]
  180. Abisuga, A.O.; Wang, C.C.; Sunindijo, R.Y. A holistic framework with user-centred facilities performance attributes for evaluating higher education buildings. Facilities 2019, 38, 132–160. [Google Scholar] [CrossRef]
  181. Wang, C.; Zamri, A. Effect of IEQ on Occupant Satisfaction and Study/Work Performance in a Green Educational Building: A Case Study. In Proceedings of the 2013 International Conference on Construction and Real Estate Management, Karlsruhe, Germany, 10–11 October 2013; pp. 234–246. [Google Scholar]
Figure 1. Workflow of the research process.
Buildings 11 00417 g001
Figure 2. Frequency of occurrence of trees’ geometric features in the 48 papers analyzed.
Buildings 11 00417 g002
Figure 3. Frequency of occurrence of trees’ crown-level physiological characteristics in the 48 papers analyzed.
Buildings 11 00417 g003
Figure 4. Frequency of occurrence of crown-level physiological characteristics of trees in the 48 papers analyzed.
Buildings 11 00417 g004
Figure 5. Current tree reconstruction approaches and applications of reconstructed tree models.
Buildings 11 00417 g005
Figure 6. Proposed tree reconstruction approach and application of reconstructed tree models.
Buildings 11 00417 g006
Table 1. Research algorithms for two research directions.
Research DirectionSearch Algorithm
Trees’ function in urban microclimate regulation(Title-Abs-Key (tree AND microclimate)) AND (urban AND regulation) And (LIMIT-TO (PUBYEAR, 2020) OR LIMIT-TO (PUBYEAR, 2019) OR LIMIT-TO (PUBYEAR, 2018) OR LIMIT-TO (PUBYEAR, 2017) OR LIMIT-TO (PUBYEAR, 2016) AND (LIMIT-TO (DOCTYPE, “ar”)) AND (LIMIT-TO (LANGUAGE, “English”))
Tree reconstruction(Title-Abs-Key (3D AND tree AND reconstruction)) AND (crown OR canopy) And (LIMIT-TO (PUBYEAR, 2020) OR LIMIT-TO (PUBYEAR, 2019) OR LIMIT-TO (PUBYEAR, 2018) OR LIMIT-TO (PUBYEAR, 2017) OR LIMIT-TO (PUBYEAR, 2016) AND (LIMIT-TO (DOCTYPE, “ar”)) AND (LIMIT-TO (LANGUAGE, “English”))
Table 2. Geometric features of trees summarized from the literature.
Geometric FeaturesLiterature
Tree height[28,29,30,52,53,54,55,56,57,58,59,60,61,62,63]
Under-branch height[51,52,54]
Tree circumference/Trunk diameter[52,56]
Crown morphology[58,61,63,64,65]
Canopy area/Canopy coverage[25,28,29,30,51,52,54,56,66,67,68,69,70]
Crown height[61,71]
Canopy diameter/Diameter at breast height (DBH)/Crown width/Crown radius[29,30,52,53,54,55,56,57,61,62,63,71,72,73]
Leaf angle distribution[60,63]
Table 3. Crown-level physiological characteristics of trees summarized from the literature.
Crown-Level Physiological CharacteristicsLiterature
Foliage distributionLeaf area index (LAI)[31,32,51,53,55,59,69,71,73,84,85,86,87,91]
Leaf area density (LAD)[25,28,31,58,59,60,63,69,86,87,88,89,90,91]
Total leaf area[56,63]
Crown density[51,52,55,58,61,62,64,67,73,83,92]
Tree species [28,51,54,55,56,58,64,67,68,69,73,83,92,93,94]
Table 4. Leaf-level physiological characteristics summarized in the literature.
Leaf-Level Physiological CharacteristicsLiterature
Leaf type (including leave growth pattern, leave longevity, leave width, leave shape, etc.)[51,64,71,93]
Transpiration rate/evaporation efficiency[60,64,70]
Stomatal conductance[30,31,32,51,56,64,68,71,85]
Leaf optical traits[30,31,32,59,62,65,68,70,71,83,85,92]
Table 5. Locations and surrounding factors of trees summarized from the literature.
Locations and Surrounding FactorsLiterature
Tree location[29,30,52,60,63,73,86,88]
Planting patterns/planting configuration/tree arrangement[58,61,62,64,73,86,91]
Tree species composition[55,94,95,96]
Soil conditions[32,51,53,59,64]
Pavement surfaces[30,32,53,60,62,87,97]
The distance to nearby buildings[30,54,58,69,89,98]
Nearby building height[29,31,32,54,56,61,69,87,89]
Nearby building material[30,32,59,91]
Sky view factors (SVF)[55,67,84,85,88,99]
View factors[29,30]
The presence/absence of water bodies[51,54,69]
The distance to water bodies[98]
Meteorological data[29,31,52,53,70,89,91,94]
Street structure/Square structure[53,54,62,100]
Street orientation/Park orientation[62,89]
Landscape structure[32,52,54,60,91]
Table 6. Input data sources for tree reconstruction.
Data SourceInput DataLiterature
Terrestrial photogrammetryPhotogrammetric point cloud[115,116,117,118,119,120,121,122,123]
Aerial photogrammetryUAV sequence images[124]
Photogrammetric point cloud[125,126,127,128,129]
Aerial laser scanningLiDAR point clouds[130]
Terrestrial laser scanning (TLS)LiDAR point clouds[39,40,43,44,131,132,133,134,135,136,137,138,139,140,141,142]
Mobile laser scanning (MLS)LiDAR point clouds[143,144]
Aerial laser scanning (ALS) & aerial photographyLiDAR point clouds & images identifying tree species[41]
Terrestrial laser scanning (TLS) & terrestrial photographyLiDAR point clouds & digital hemispherical photographs (DHP) identifying the gap fraction in the crown or providing basis for adding leaves or refining models[42,111,112]
LiDAR point clouds & images segmenting the point clouds[110]
Terrestrial laser scanning (TLS) & aerial photogrammetryLiDAR point clouds & Photogrammetric point cloud[113]
Table 7. Reconstruction approaches used for tree reconstruction.
Reconstruction ApproachLiterature
Type 1[43,113,122,130,142,143,144]
Type 2[39,43,131,132,143]
Type 3[39,40,42,43,44,110,111,112,122,131,132,133,134,135,136,137,138,139,141,150]
Table 8. Advantages and disadvantages of each reconstruction approach.
Reconstruction ApproachAdvantagesDisadvantages
Type 1
  • Insensitive to noise
  • Computationally effective
  • Suitable for simple tree architecture such as broadleaf trees
  • Structurally less precise
  • No information for in-crown structures
Type 2
  • Computationally effective
  • Has spatial foliage distribution
  • Adequately consider gaps in the canopy
  • Structurally less precise
  • Sensitive to voxel size
Type 3
  • Detailed 3D branch structure
  • Detailed representation of leaves
  • Sensitive to noise
  • Sensitive to preset parameters
  • Need leafless or leaf-off tree point cloud for the skeleton reconstruction
  • Need complex procedure to add leaves
Table 9. Input data used in the studies considering tree species and spectral traits.
Input DataPhysiological CharacteristicsLiterature
Point clouds & RGB imagesTree species[41]
High-resolution RGB images & multispectral imagesSpectral traits[126]
Table 10. Literature using predefined physiological characteristics for specific applications.
Application of Reconstructed Tree ModelsPredefined Physiological CharacteristicsLiterature
Transpiration rateLAI & LAD[43]
Radiative transfer modelingLAI[39,42]
Table 11. Literature estimating foliage distribution during tree reconstruction.
Reconstruction ApproachPhysiological CharacteristicsFoliage Distribution Estimation MethodLiterature
Generating point clouds as final resultLeaf areaVoxelizing the point cloud[118]
Type 2LAIMultivariate regression of DBH and tree heights[131]
LAIVoxelizing the point cloud[132]
Type 3Leaf areaVoxelizing the point cloud[110]
Foliage distributionAllometric statistics[40,43,44]
Foliage densityL-Architect method[112]
LADVoxelizing the point cloud[110,111]
LAIVoxelizing the point cloud[110,111]
Publisher’s Note: MDPI stays neutral with regard to jurisdictional claims in published maps and institutional affiliations.

