After the development of the IQC process, a prefabricated construction project in China was used for determining the values of parameters used for the segmentation process, so that the method proposed could be validated and the parameters adopted for similar projects.
5.1. Case Background
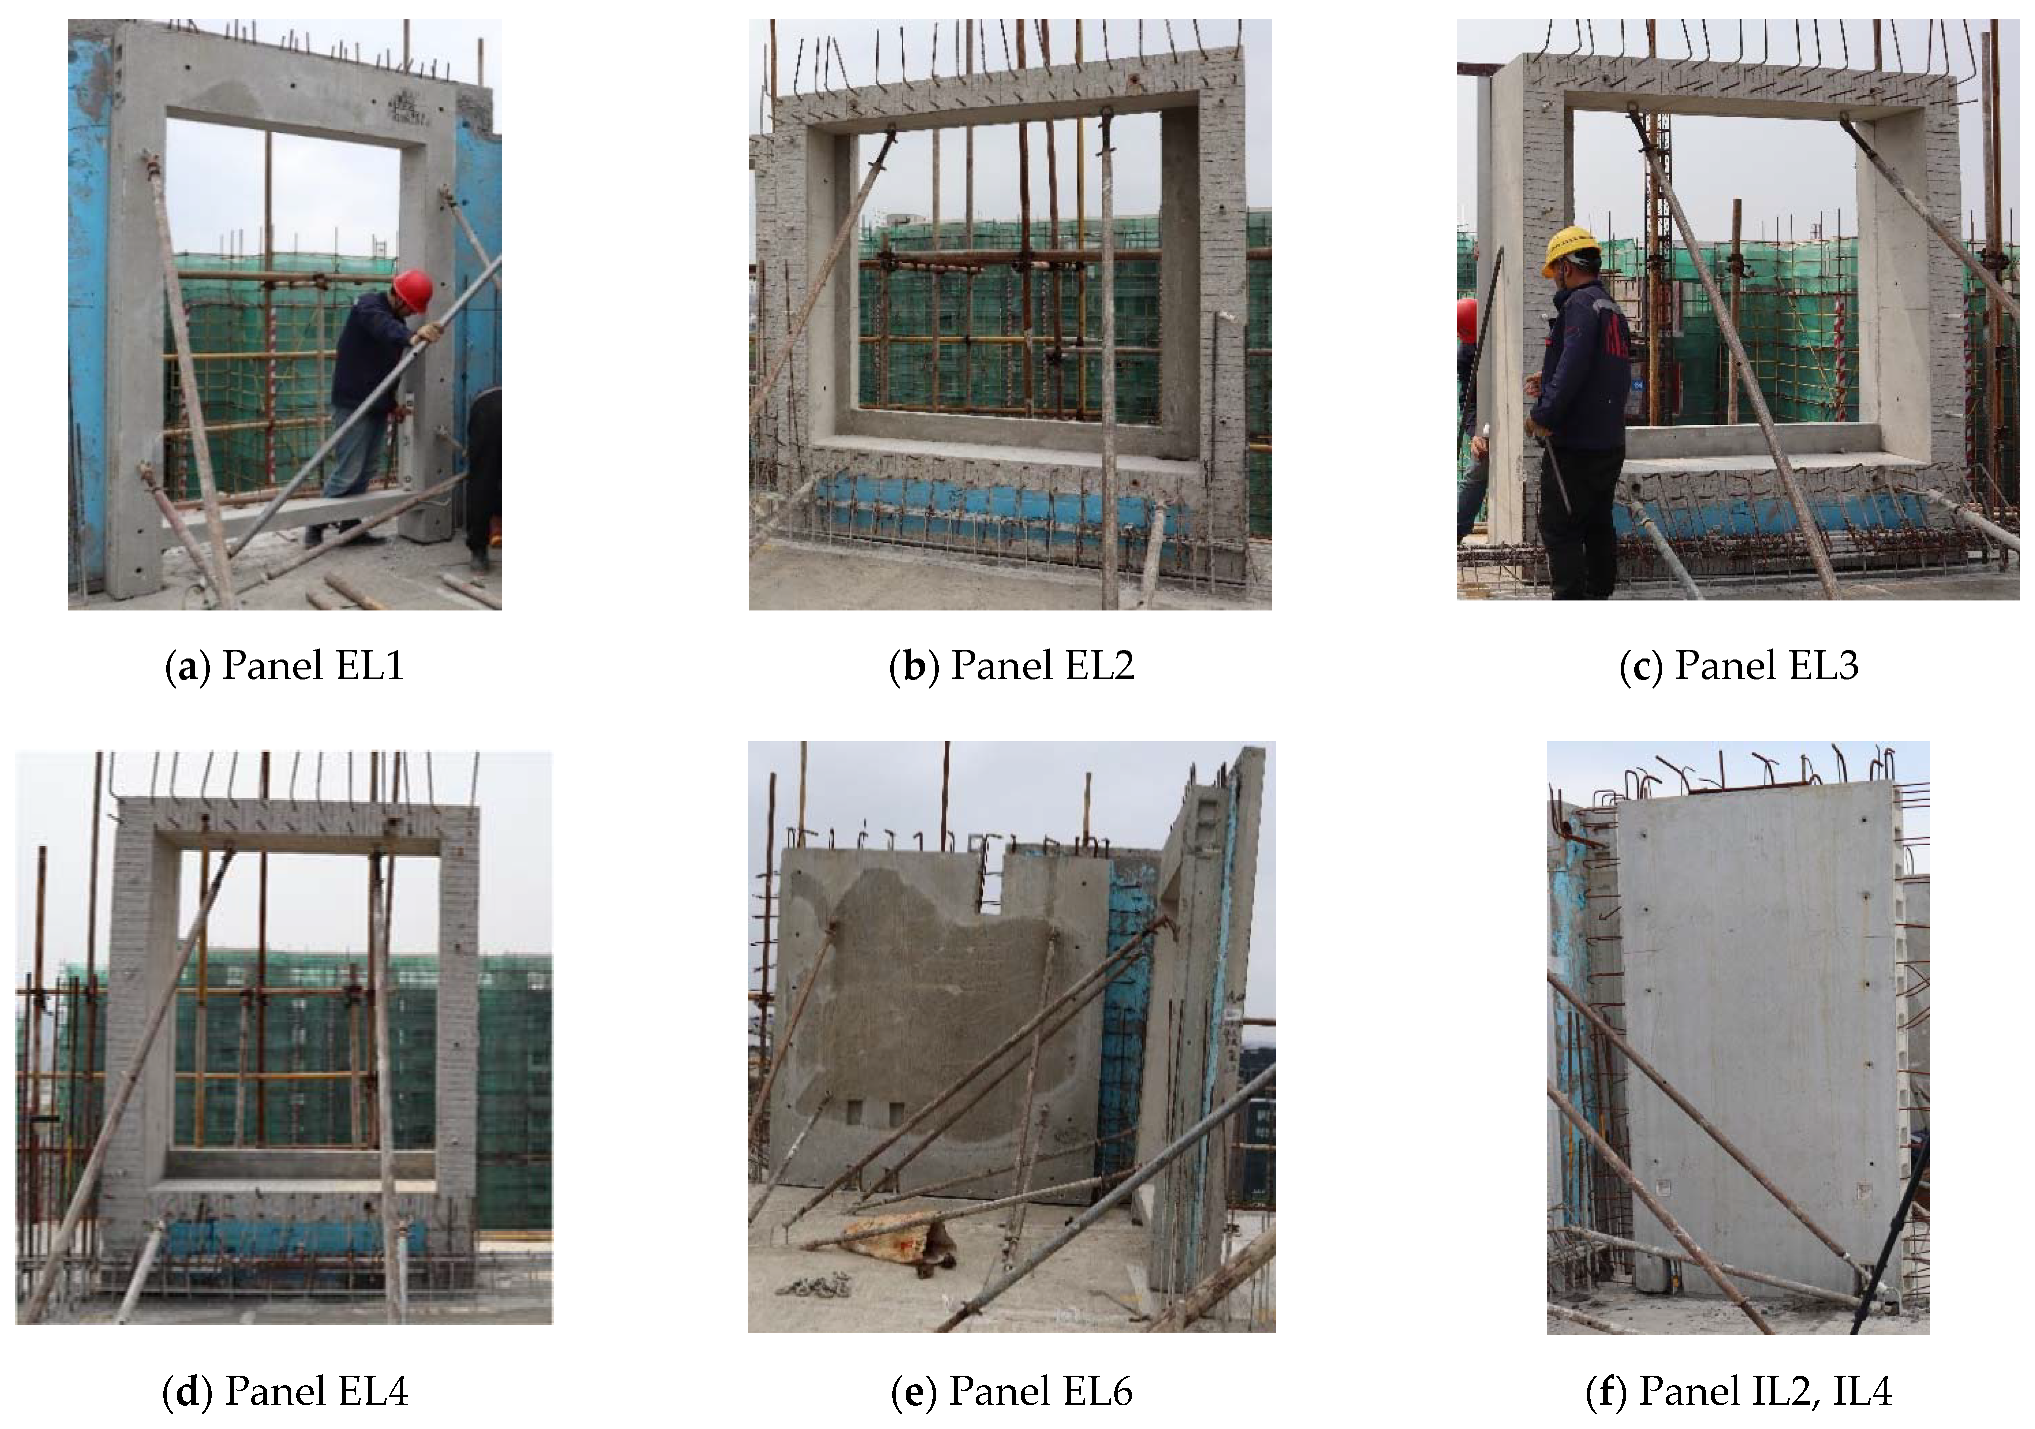
The selected prefabricated project is located in Pudong district, Shanghai, China. The total floor area of this project is more than 14 ha with 15 high-rise residential buildings. The No. 11 building is a work-in-progress building and is selected for the case study in this research. It has sixteen floors, and each floor has four units. Each unit covers approximately 112–140 m
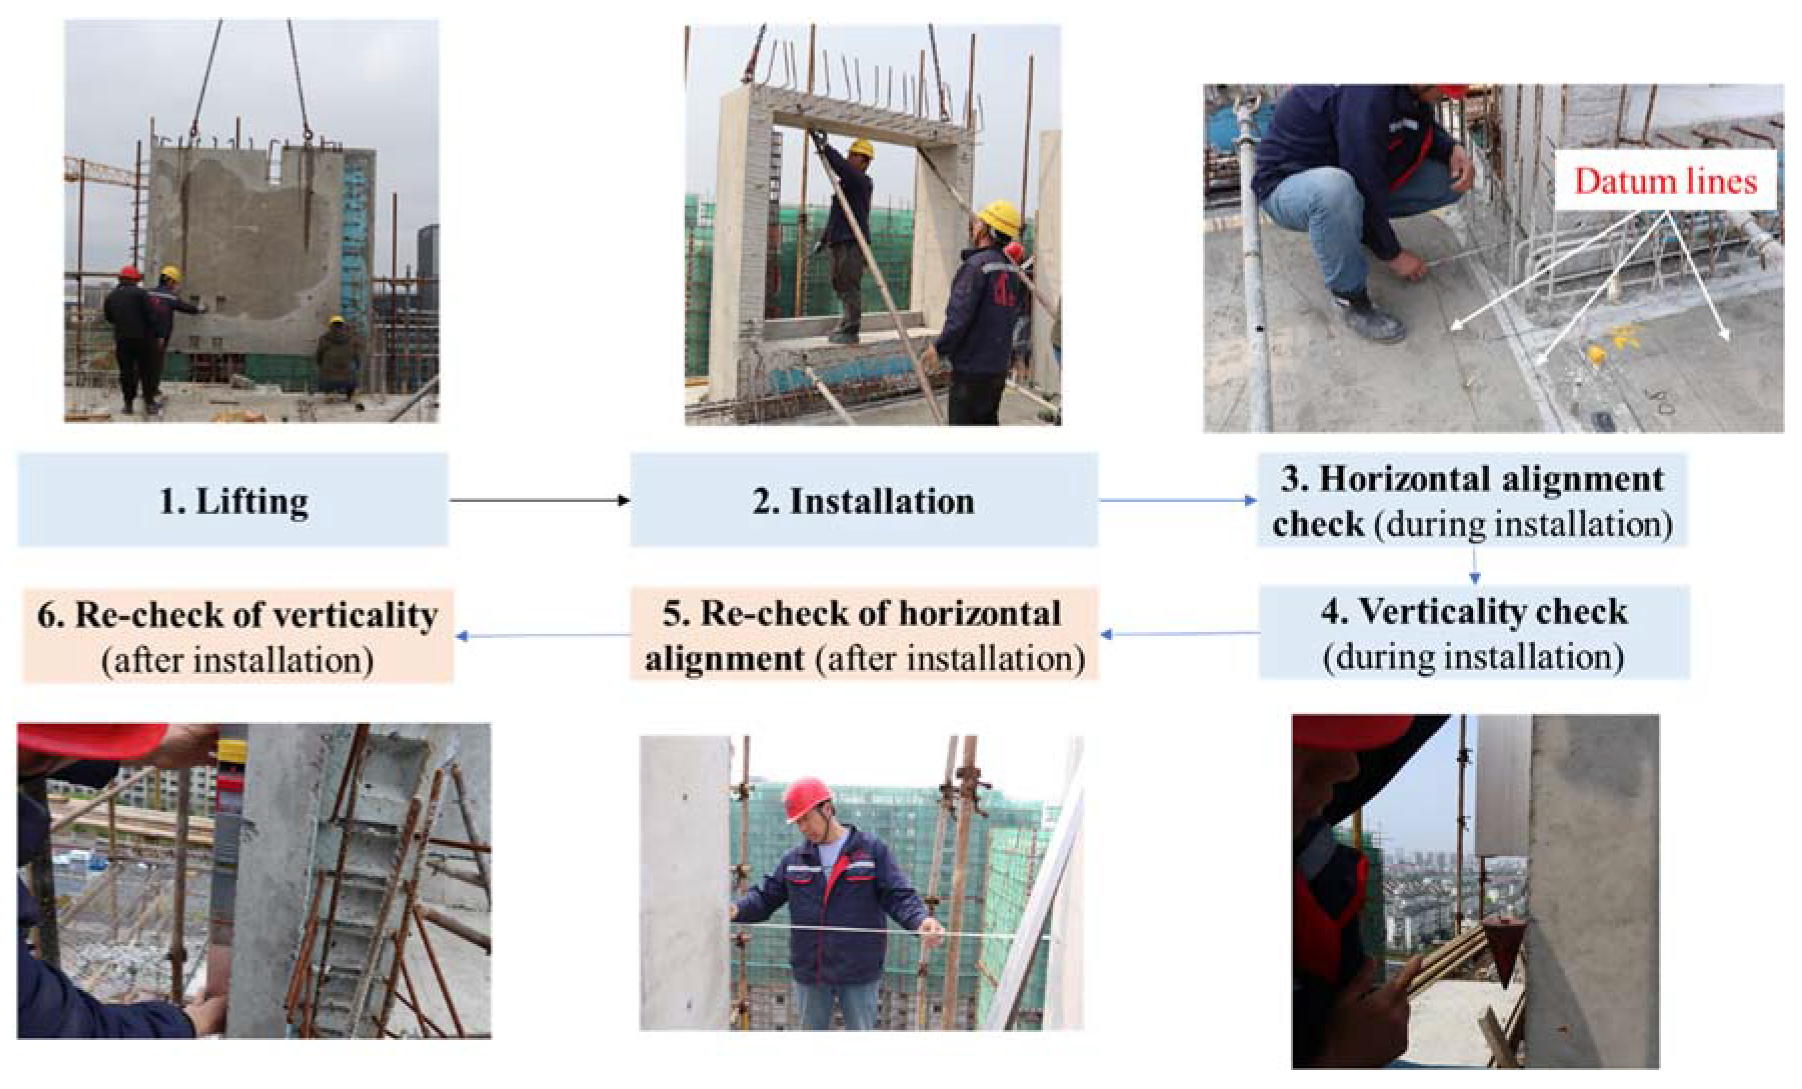
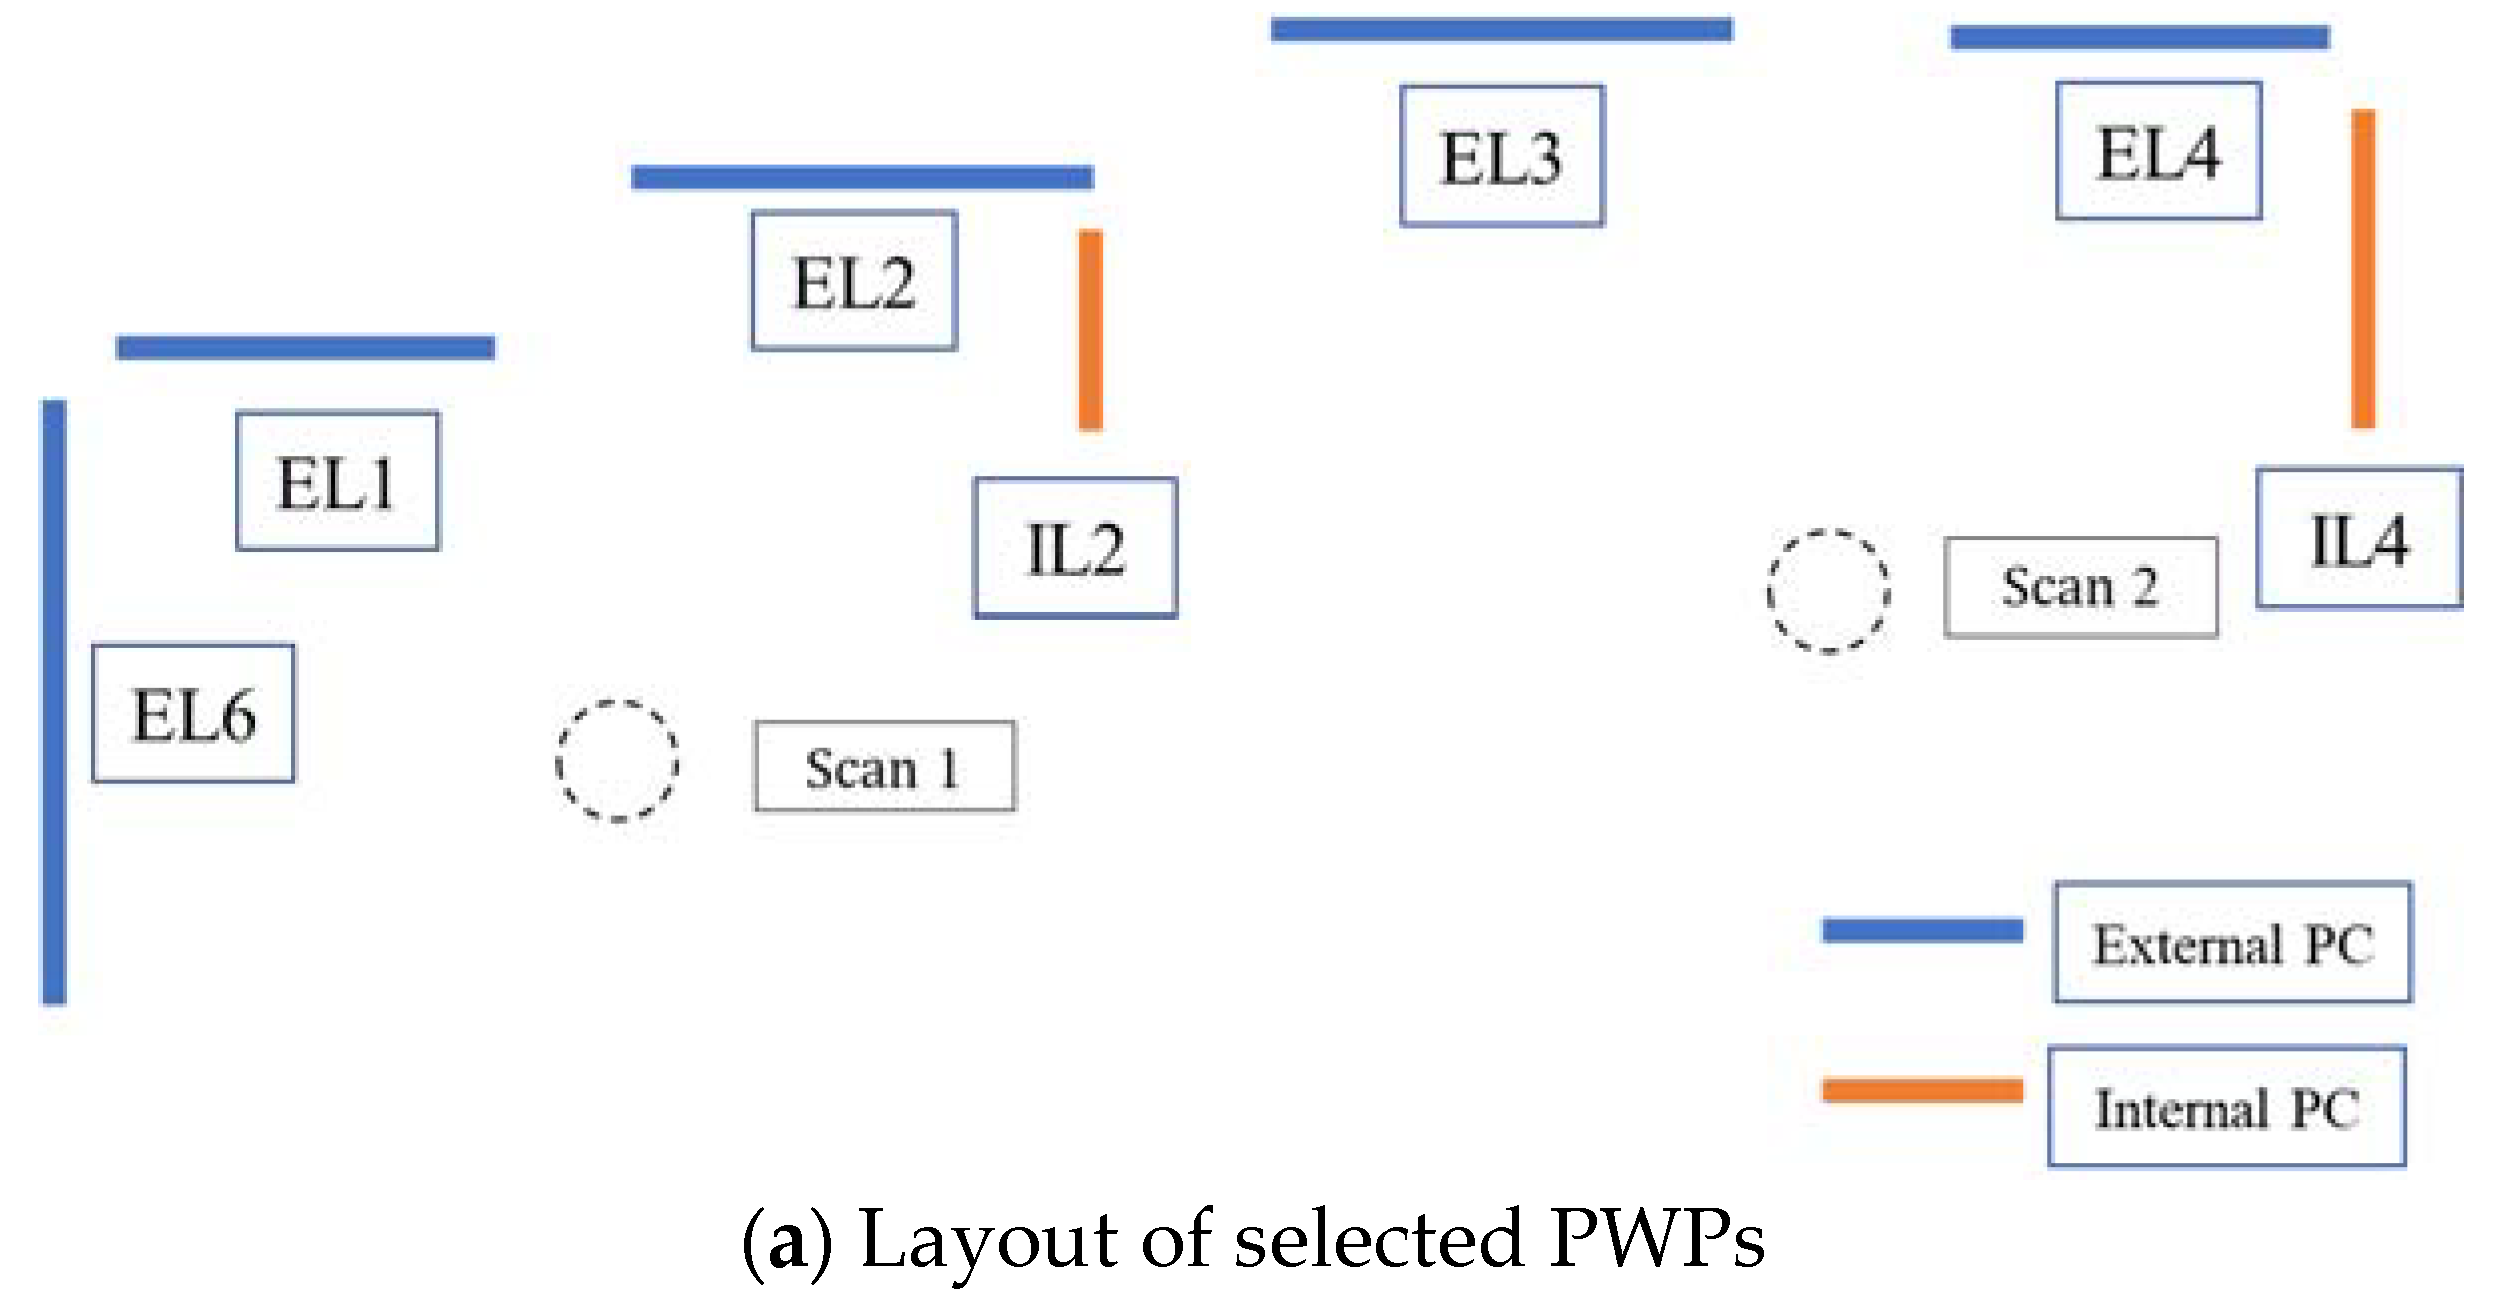
2 floor area. The external walls, some parts of internal walls, and floor panels are prefabricated. Each floor has 24 external PWPs and 18 internal PWPs. The external PWPs were installed before internal PWPs. After installation of all PWPs for one floor area, the conventional IQC process was conducted on all panels individually. In this case study, the proposed laser scanning method is used for one-quarter of the total floor to check the panel installation, in comparison with the conventional manual method, as shown in
Figure 1. The types of PWPs in this floor were covered in the selected part. As presented earlier, a Leica BLK 360 scanner is used. The layout of PWPs and scanning positions are given in
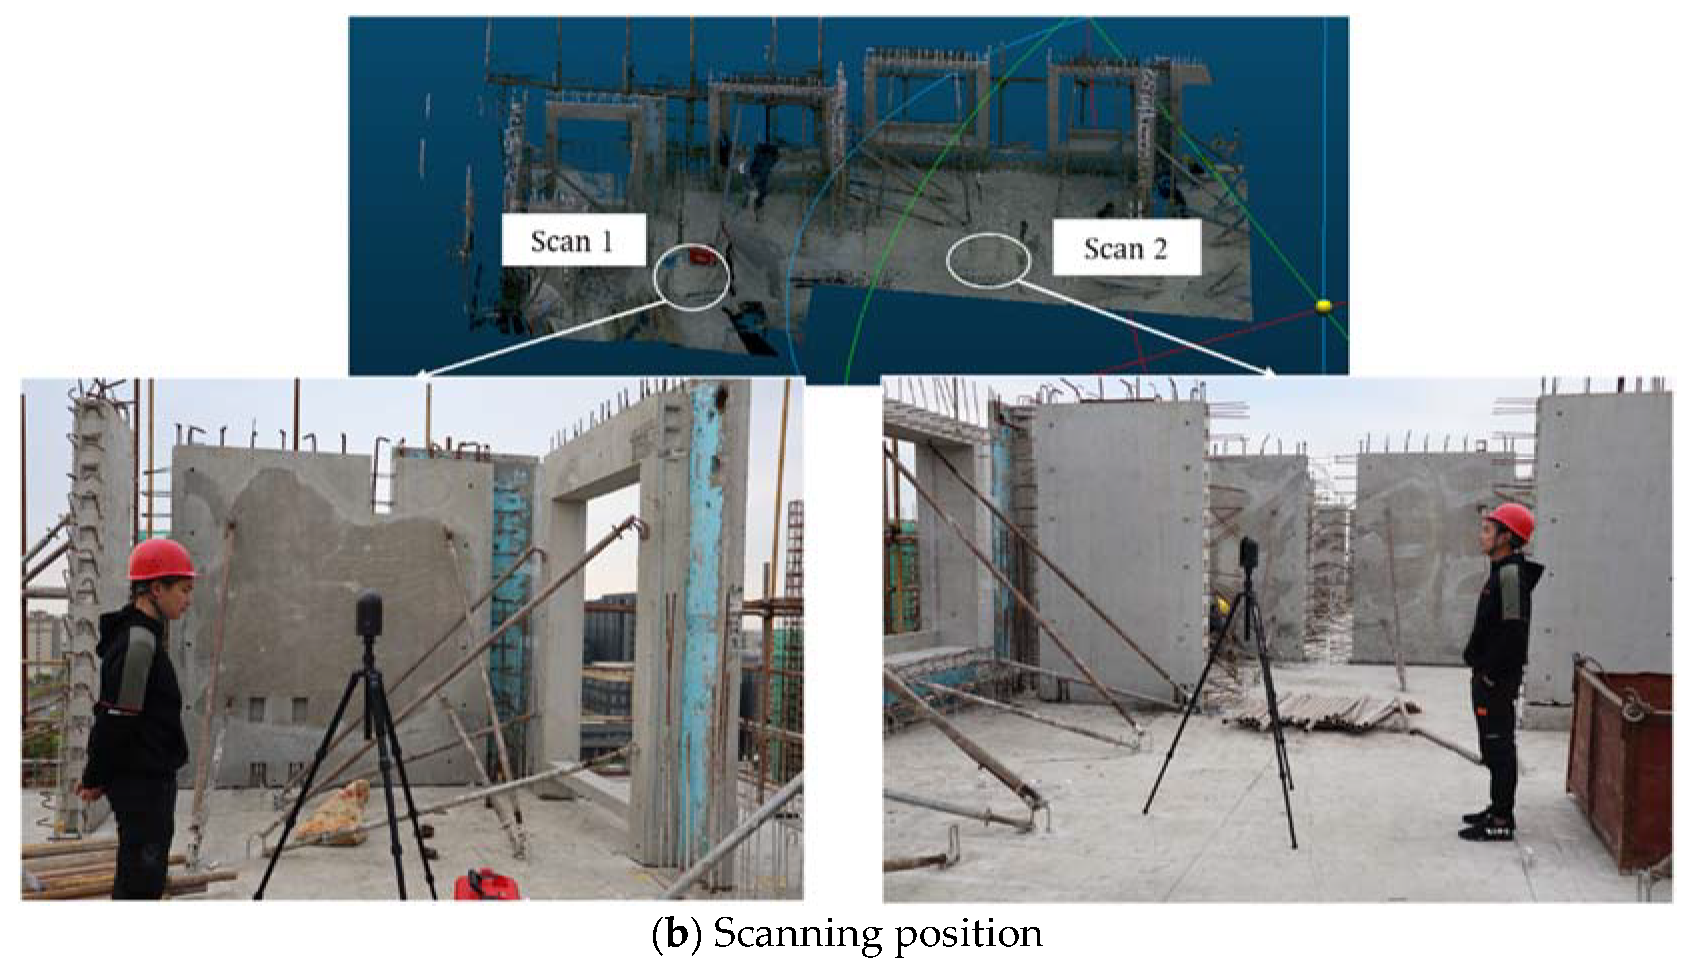
Figure 7a. Seven PWPs are scanned simultaneously, as seen in
Figure 7b, and information of PWPs is presented in
Table 4 and
Figure 8.
Figure 7b shows the scanning process; the green circles are the places where the scanner was positioned. Two scans were used for the test PWPs. The point cloud co-registration was performed using the commercial Leica Cyclone software, along with manually cropping out the surrounding environment. The points of surrounding environment were removed to avoid unnecessary data processing with these points, as they were not used in the quality check process. Manual cropping of the surrounding environment usually required about 1 or 2 min. Finally, a total of 10,226,246 points were used in the validation tests.
5.2. Determination of Segmentation Parameters
As mentioned in
Section 4.2.1, the suitable values of the five segmentation parameters (
KS,
NN,
MC,
ST,
CT) need to be determined for the test-use case. We performed many rounds of trial and error before determining suitable parameter values. The purpose of choosing suitable values of parameters is to avoid over-segmentation and under-segmentation [
34]. The general guideline for tuning the values of
KS,
NN, and
ST is to increase the values of
KS,
NN, and
ST if the result is over-segmentation. If the result is under-segmentation, then the values of
KS,
NN, and
ST need to be decreased. The following paragraph presents the process for each parameter, considering that some parameters were already assigned suitable values. In the figures of segmentation results, segments are represented in different colors.
For K search (
KS), as discussed in
Section 4.2.1, the smallest value proposed by Xiao et al. [
57] is 15, the largest value proposed by Deschaud and Goulette [
59] is 50, so 15~50 is used as a testing range of
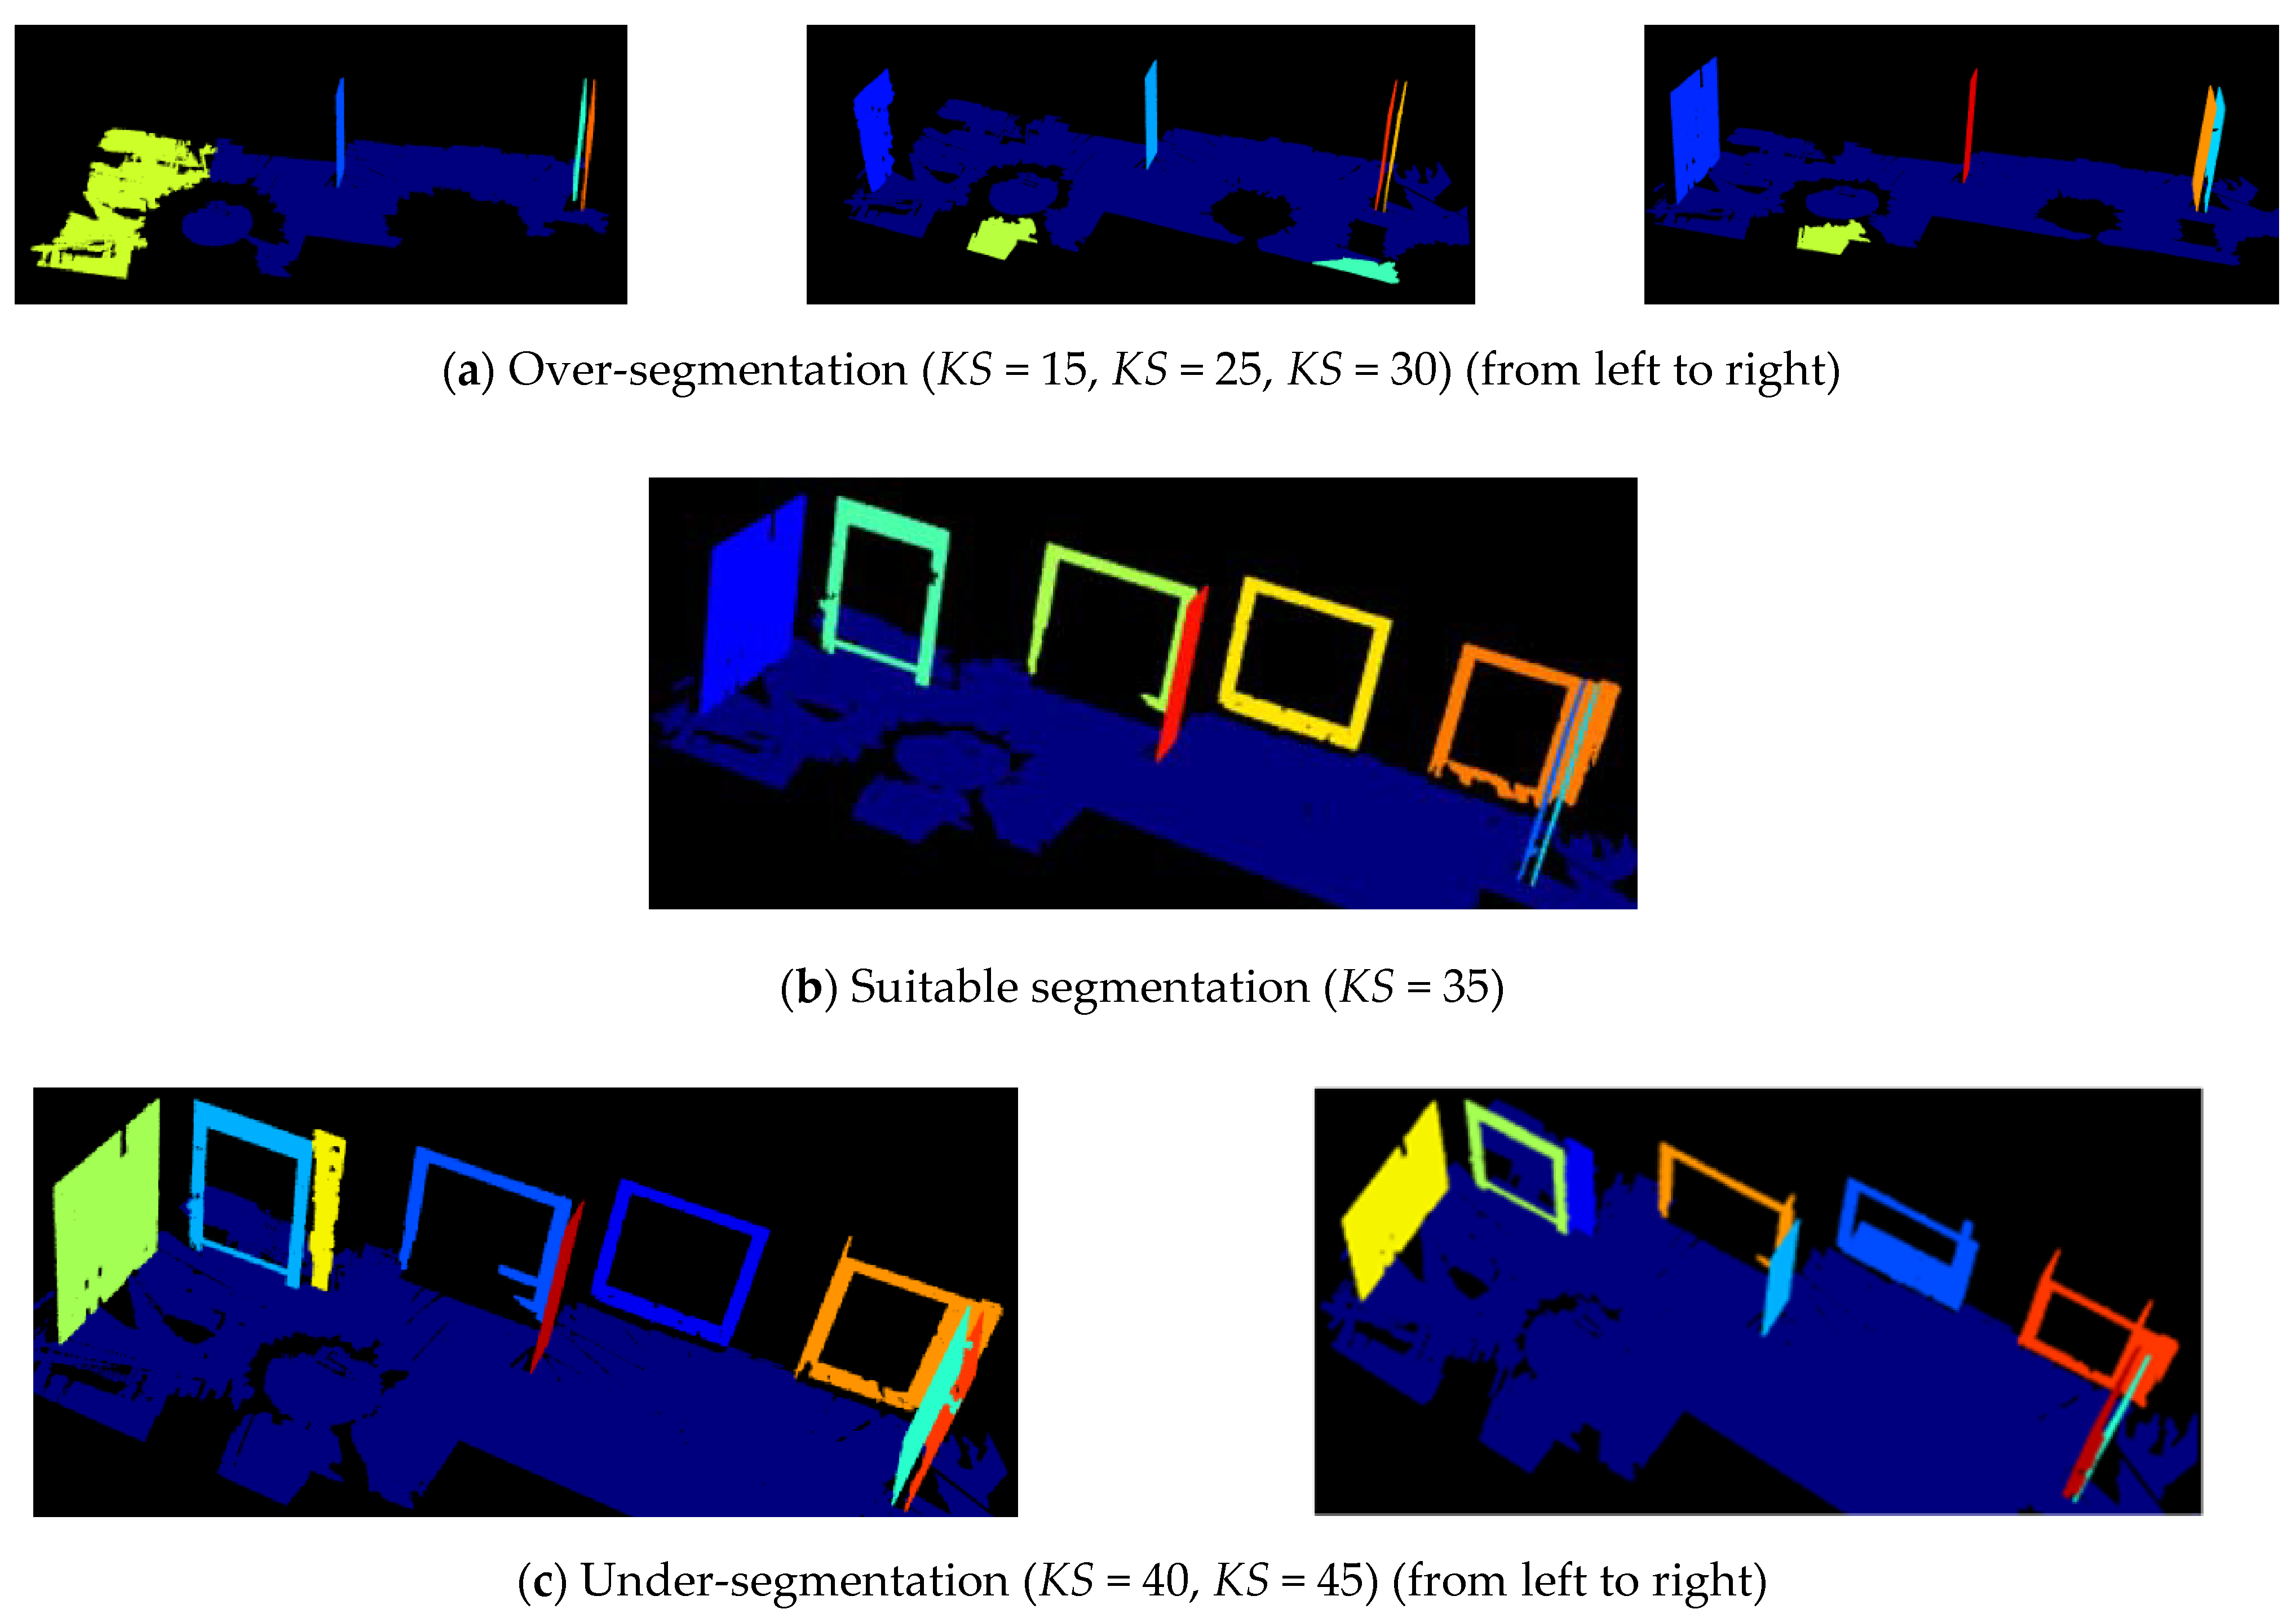
KS in this research, and the interval is set as 5. The testing results are summarized in
Table 5 and
Figure 9, for
NN = 25 and
ST = 5. In
Figure 9a, when
KS = 15, 25, and 30, only internal panels, IL2, IL4, and EL6 of regular rectangular shape are segmented, and this is over-segmentation.
Figure 9b shows that, when
KS = 35, the point cloud is appropriately segmented. All PWPs are segmented clearly from the data set. In
Figure 9c, when
KS = 40, 45, although PWPs can be recognized from the point cloud, some extra points are also recognized for EL1 and EL4. The segments are not planar surfaces and this is under-segmentation. Using this case study analysis, it is suggested that
KS = 35 be used for similar cases.
The determination of the suitable value of
NN is similar to that of
KS. As
NN and
KS adopt the same method for finding neighbor points, the testing range of
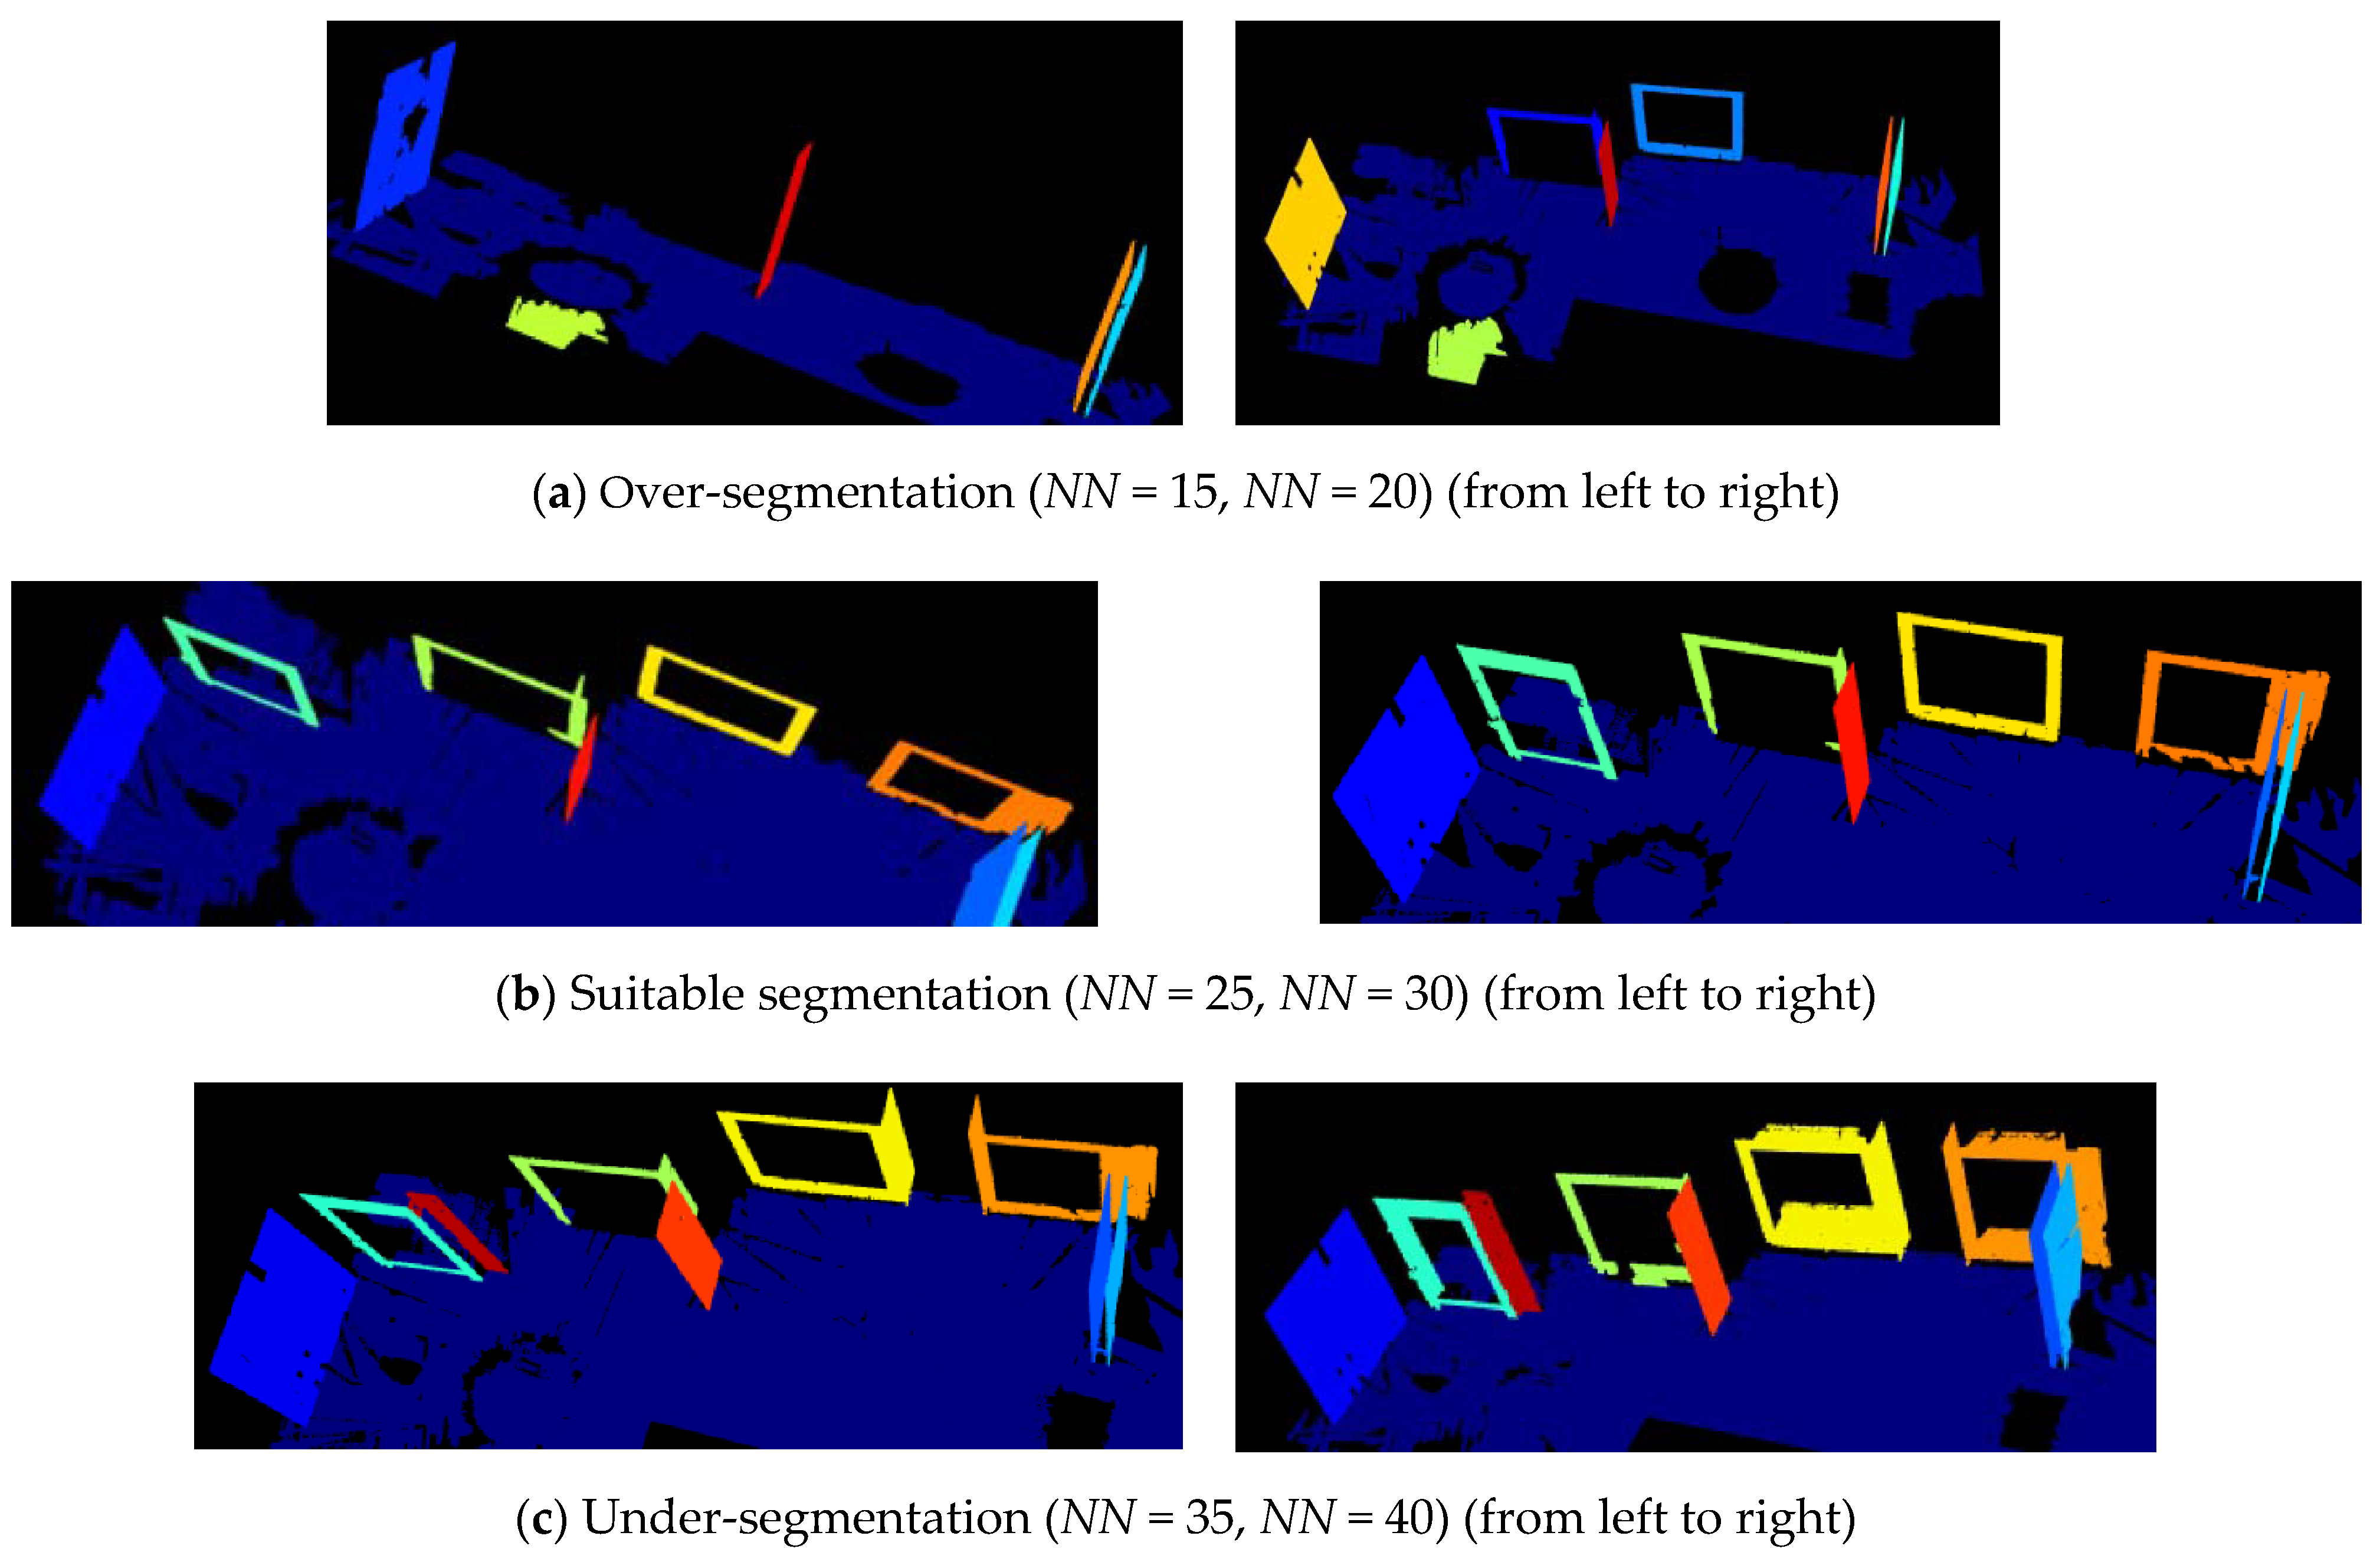
NN is 15~50 as well. The segmentation results are given in
Table 6 and
Figure 10 (
KS = 35 and
ST = 5). When
NN is set as 15 and 20, only IL2, IL4, and EL6 are recognized, as seen in
Figure 10a, and this is over-segmentation. When
NN is set as 35 and 40,
Figure 10c shows many extra points are connected with EL1, EL3, and EL4 after segmentation. These segments of PWPs are not planer surfaces, and this is under-segmentation. While
NN is set 25 and 30, the PWPs can be appropriately segmented, as shown in
Figure 10b. Therefore, they are suggested as suitable
NN values. This study uses
NN = 25.
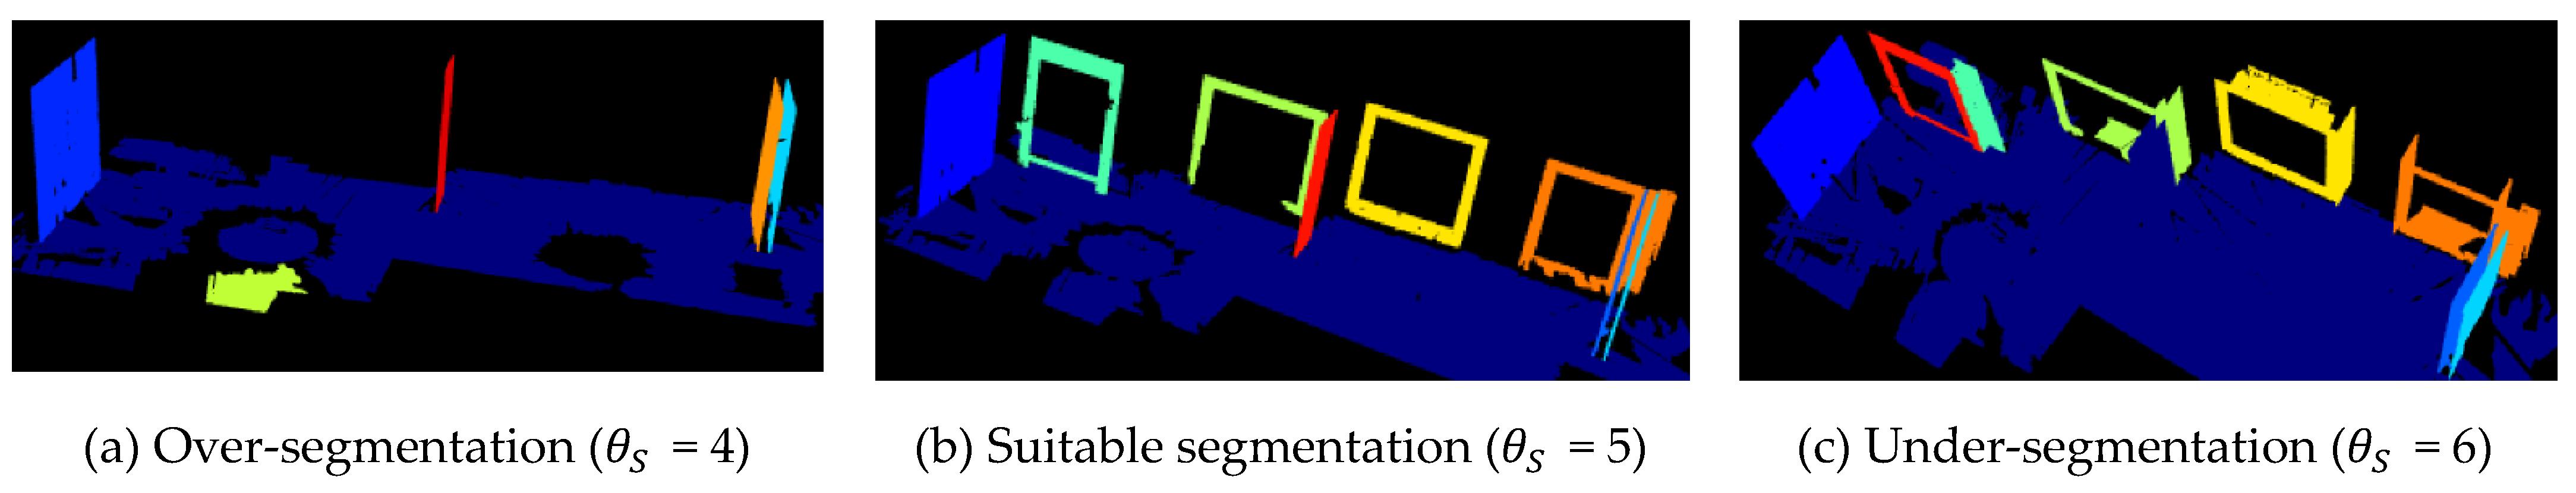
Smoothness threshold
(
ST), as mentioned in
Section 4.2.1 and given a value of 10, could be a relatively large value for
[
34]. Thus, the thresholding test of
is started from 1 to 10, when
KS = 35 and
NN = 25. To quickly identify the suitable value and reduce testing times, first the middle value
is tested. When
is smaller than 5 (
4), the data are over-segmentation, as seen in
Figure 11a. When
is larger than 5 (
= 6), it is under-segmentation, as seen in
Figure 11c. Thus, 5 is the suitable value for
(
Figure 11b).
After the tests, the suggested values of
CT (
),
MC,
KS,
NN, and
ST (
) are summarized in
Table 7. At this time, all the PWPs and floor surface in the case data can be identified after segmentation, and there are no other unnecessary segments. These suggested values can be adopted in the installation quality check-up processes for similar residential building projects using the same scanner. Since PWPs are widely used in prefabricated residential buildings, the values suggested can be used in many other cases. There may be variations in the shape and size of PWPs used in different projects, but the same values of these parameters can be used for the same type of laser scanners. When different laser scanners are used, these suggested parameter values provide a good estimate range, which can save time and effort in determining the suitable values for these scanners. Then, the RANSAC algorithm is used to fit the plane and remove outliers. Finally, normal vectors
of each PWP are computed and used for checking the verticality of the installation of the wall panels.
5.3. IQC Results and Validation by Conventional Method
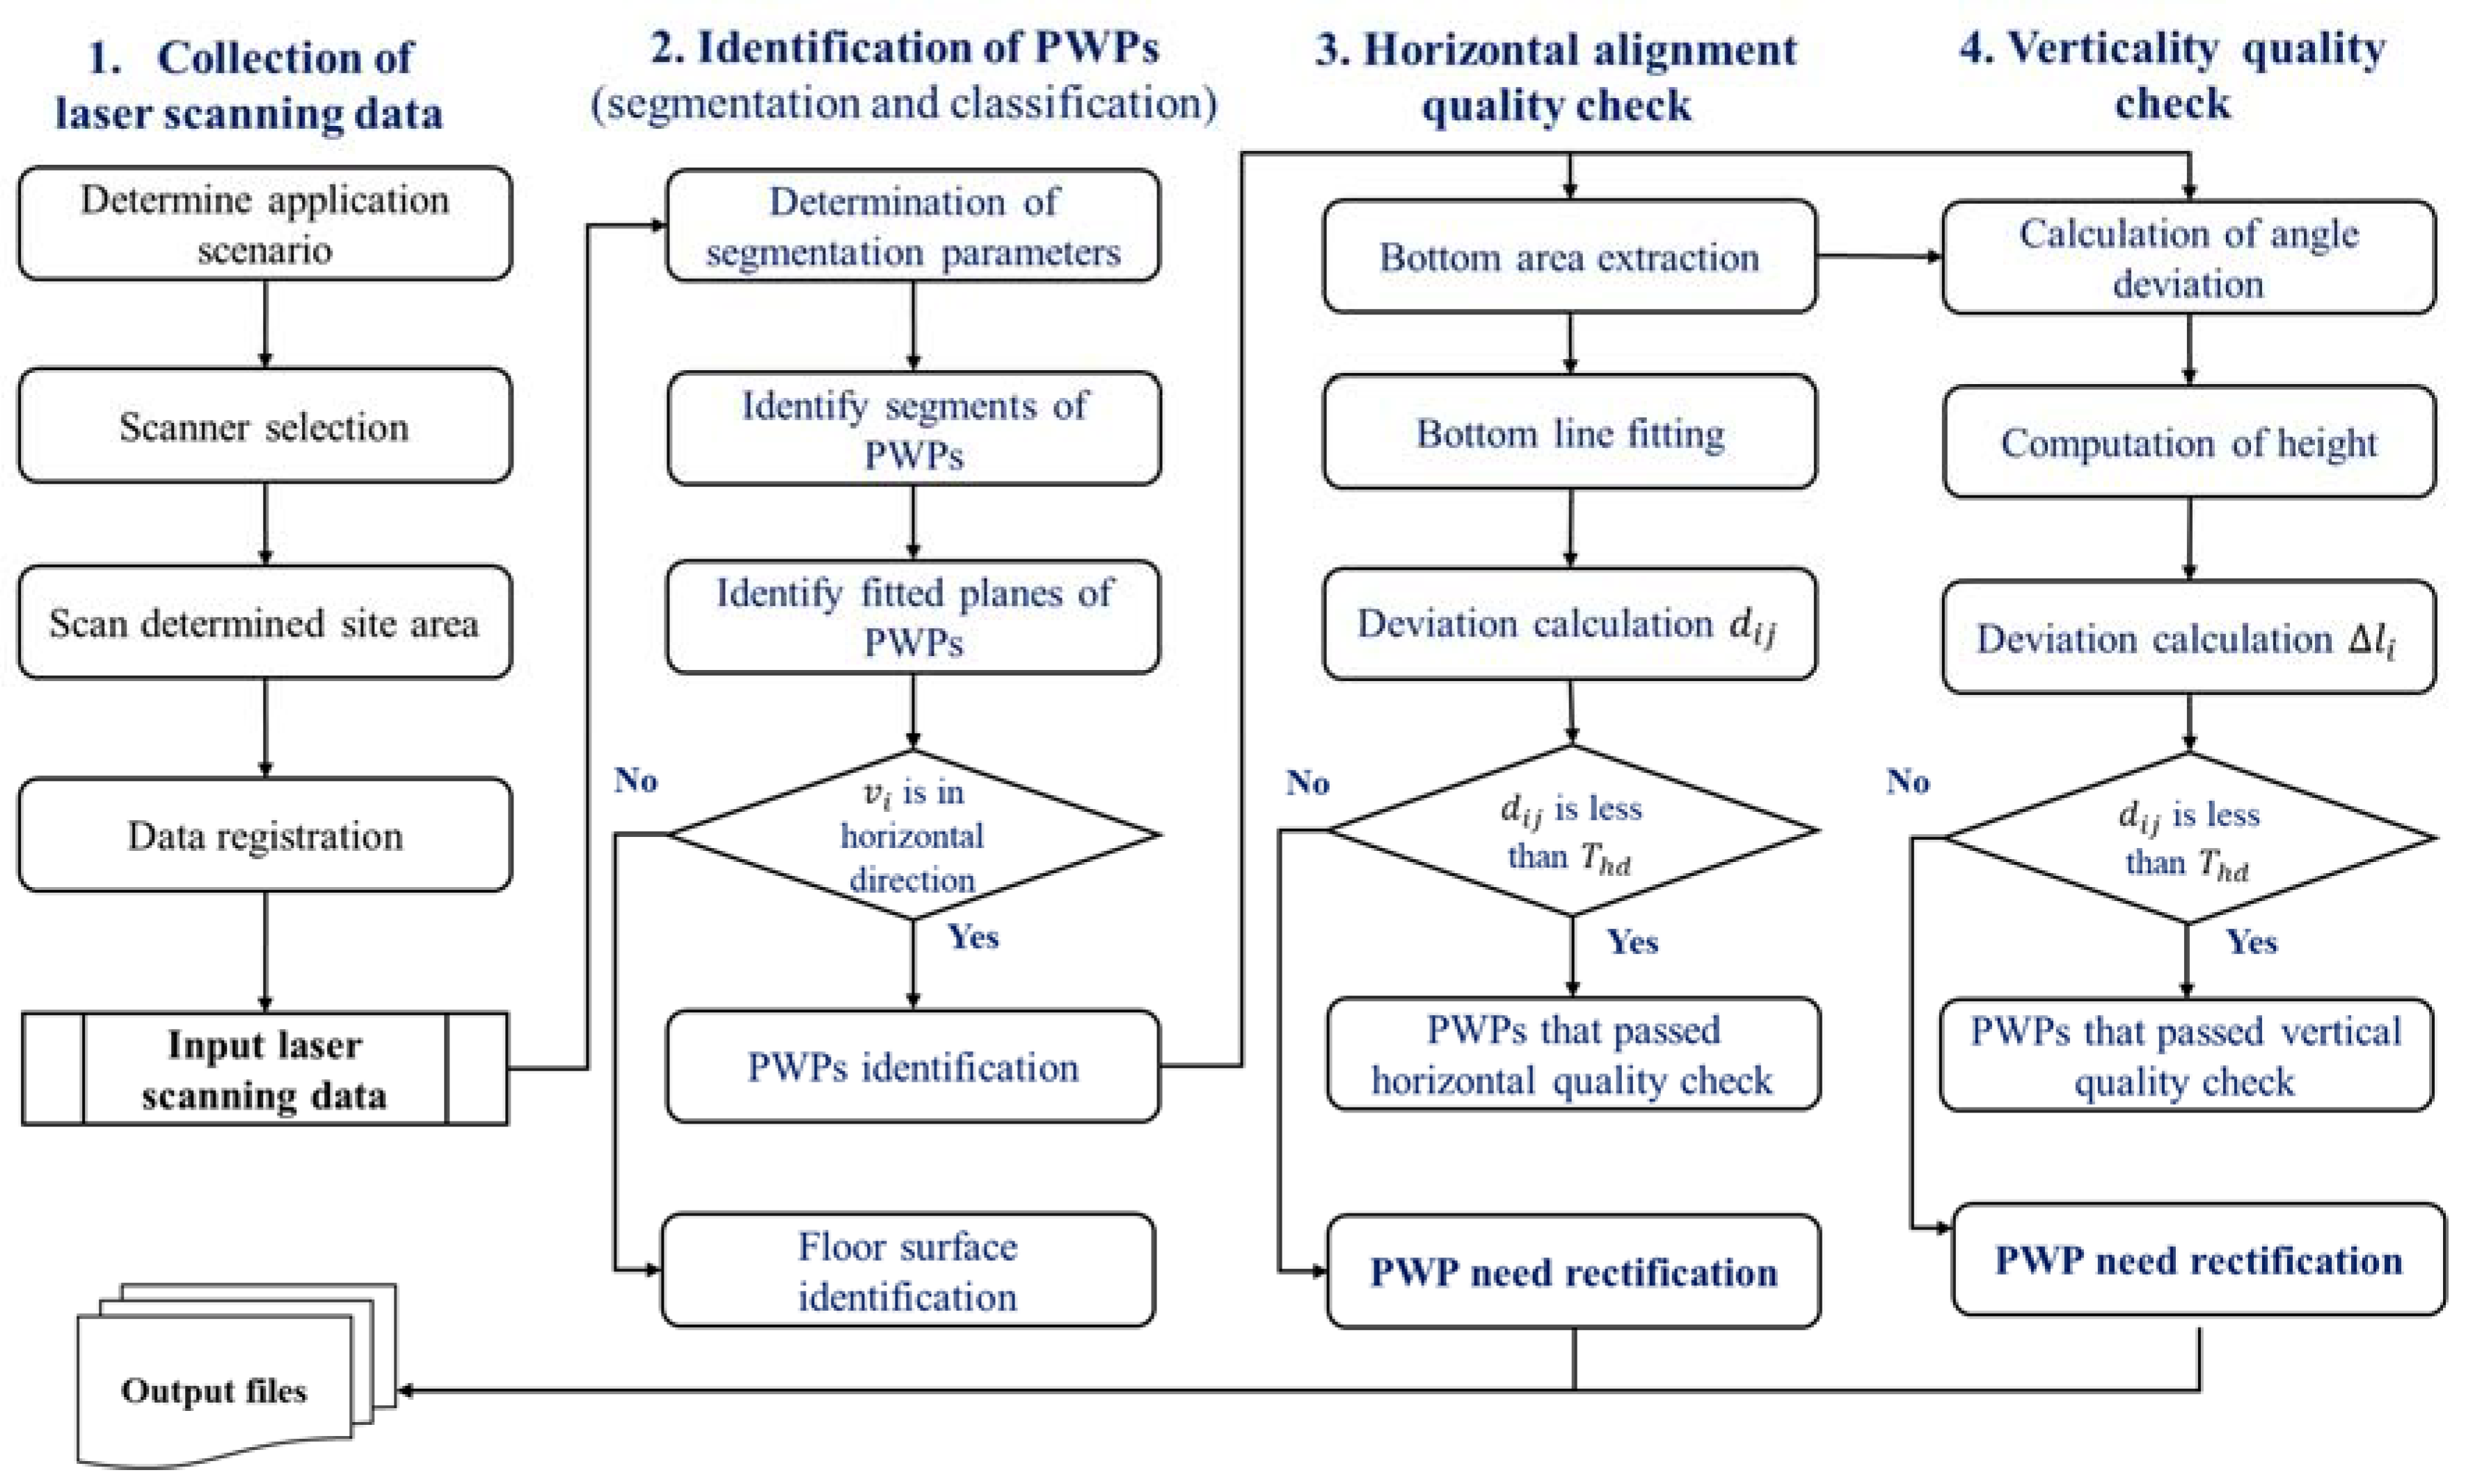
The IQC process was conducted using the approach presented in
Section 4.3. To validate the quality check results of the proposed method, a conventional method of IQC was conducted at the same time as the laser scanning. This was carried out by the manual check (steps 5 and 6 as shown in
Figure 1). The validation results demonstrated that the proposed laser scanning method could correctly identify the PWPs need to be rectified. The IQC results of the manual check and proposed method are given in
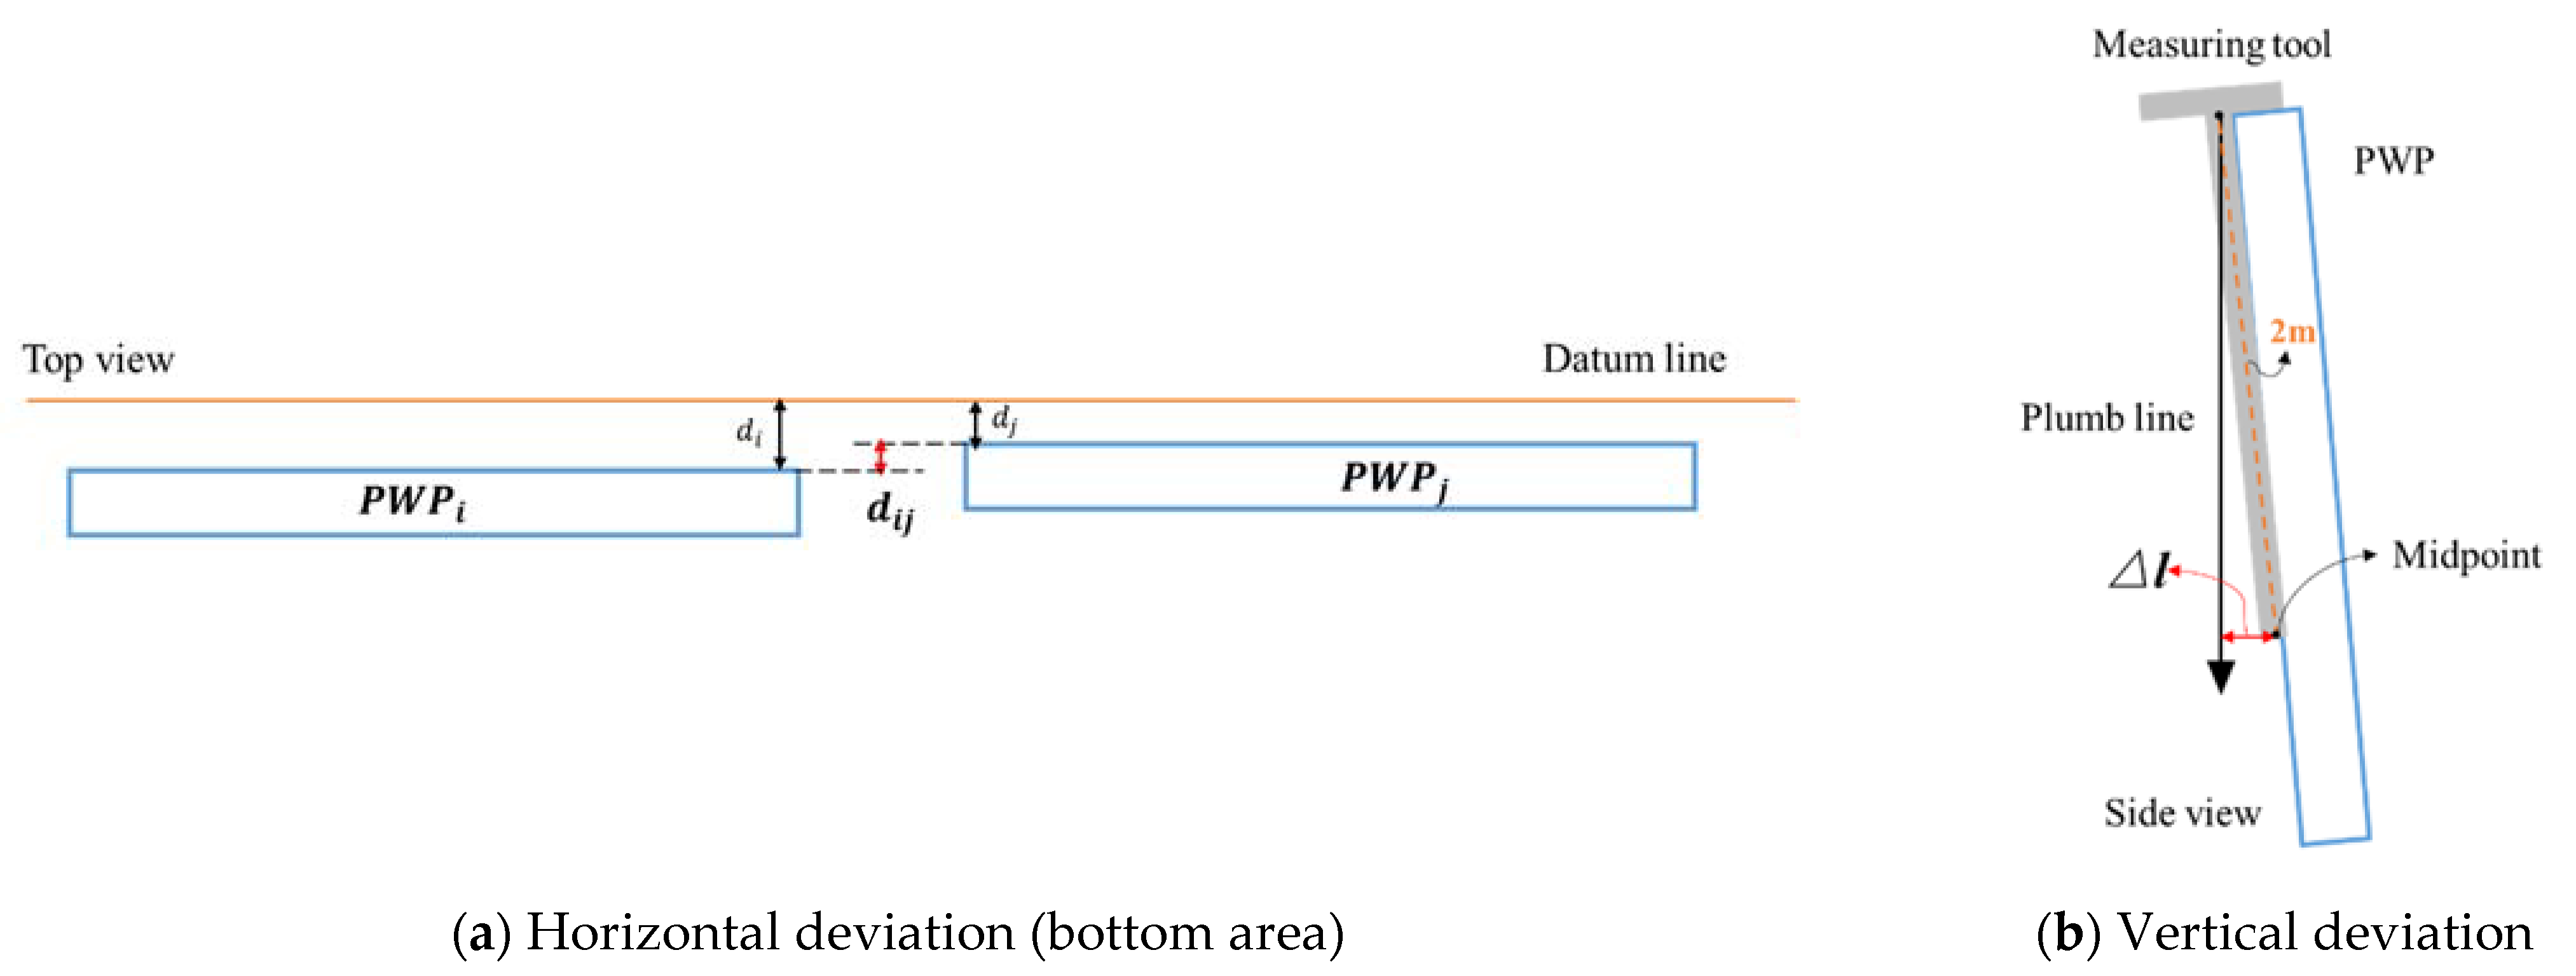
Table 8. This table includes the horizontal alignment deviation, vertical deviation, and the panels need to be rectified based on the check results of horizontal and vertical deviation.
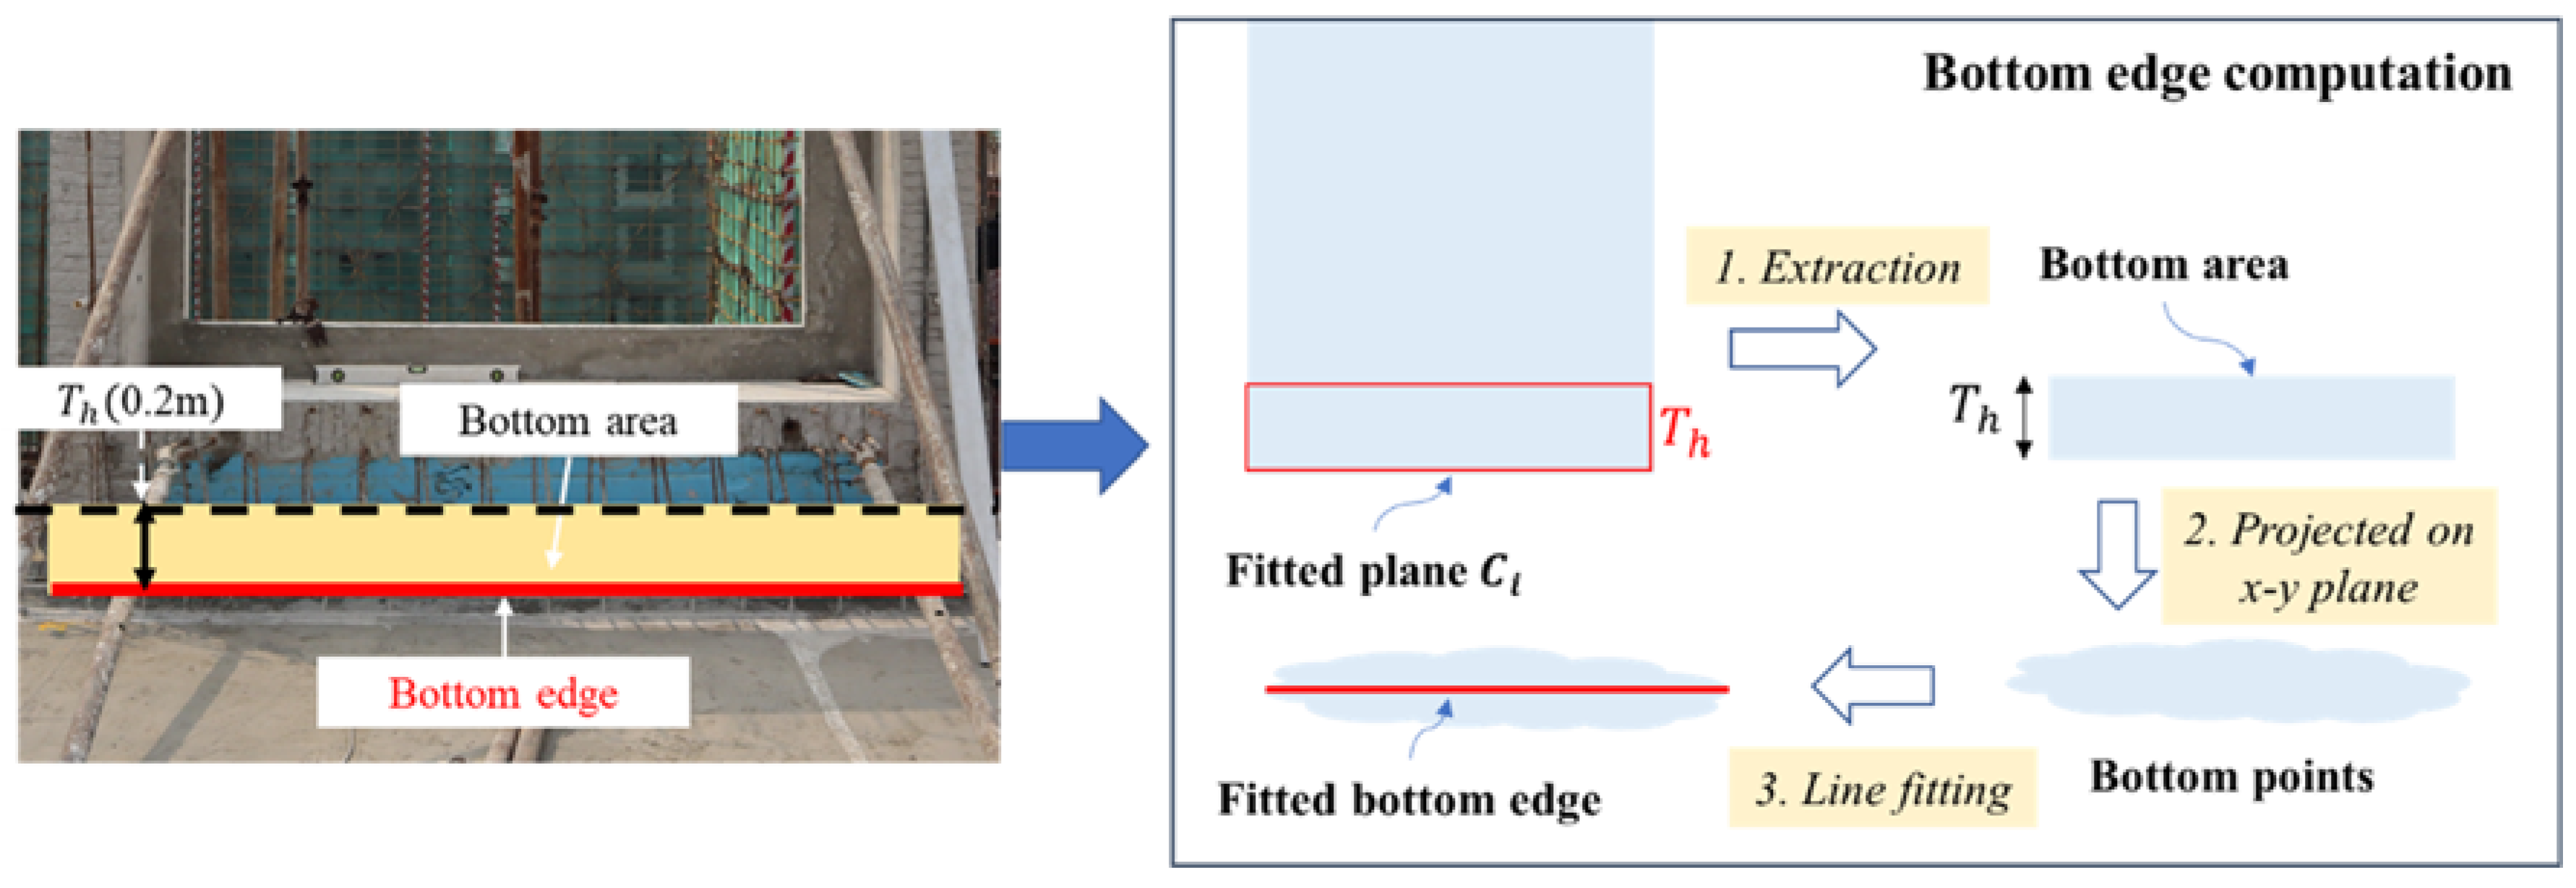
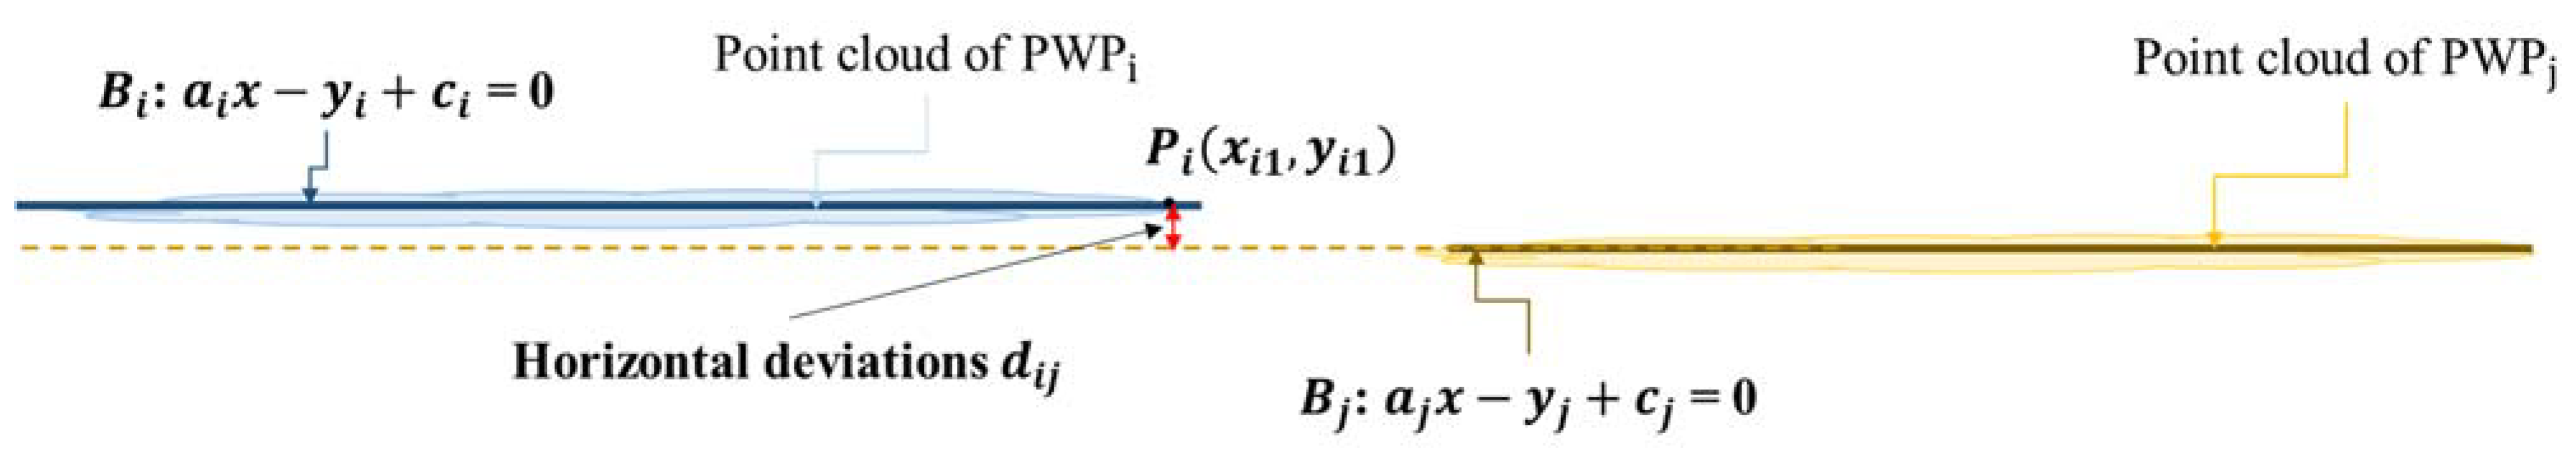
The results of horizontal alignment check are given in
Table 8. Based on design requirements and design drawings, the bay window panel EL3 and panel EL4 need to be installed horizontally aligned, as seen in
Figure 7a. Therefore, a quality check of horizontal alignment needs to be conducted on these two PWPs. According to the check result of the proposed laser scanning method, the relative horizontal deviation between panels EL3 and EL4 are computed as 6.716 mm, which is larger than horizontal alignment deviation threshold (
= 5 mm) as given in
Section 3. Therefore, the IQC method indicates the installation of EL3 and EL4 do not satisfy the quality requirement. At the same time, their horizontal alignment deviation obtained by manual check is 5.2 mm. The manual check indicates the panels EL3 and EL4 are not aligned and need to be rectified. Therefore, the horizontal alignment check of the proposed method matched with the manual check.
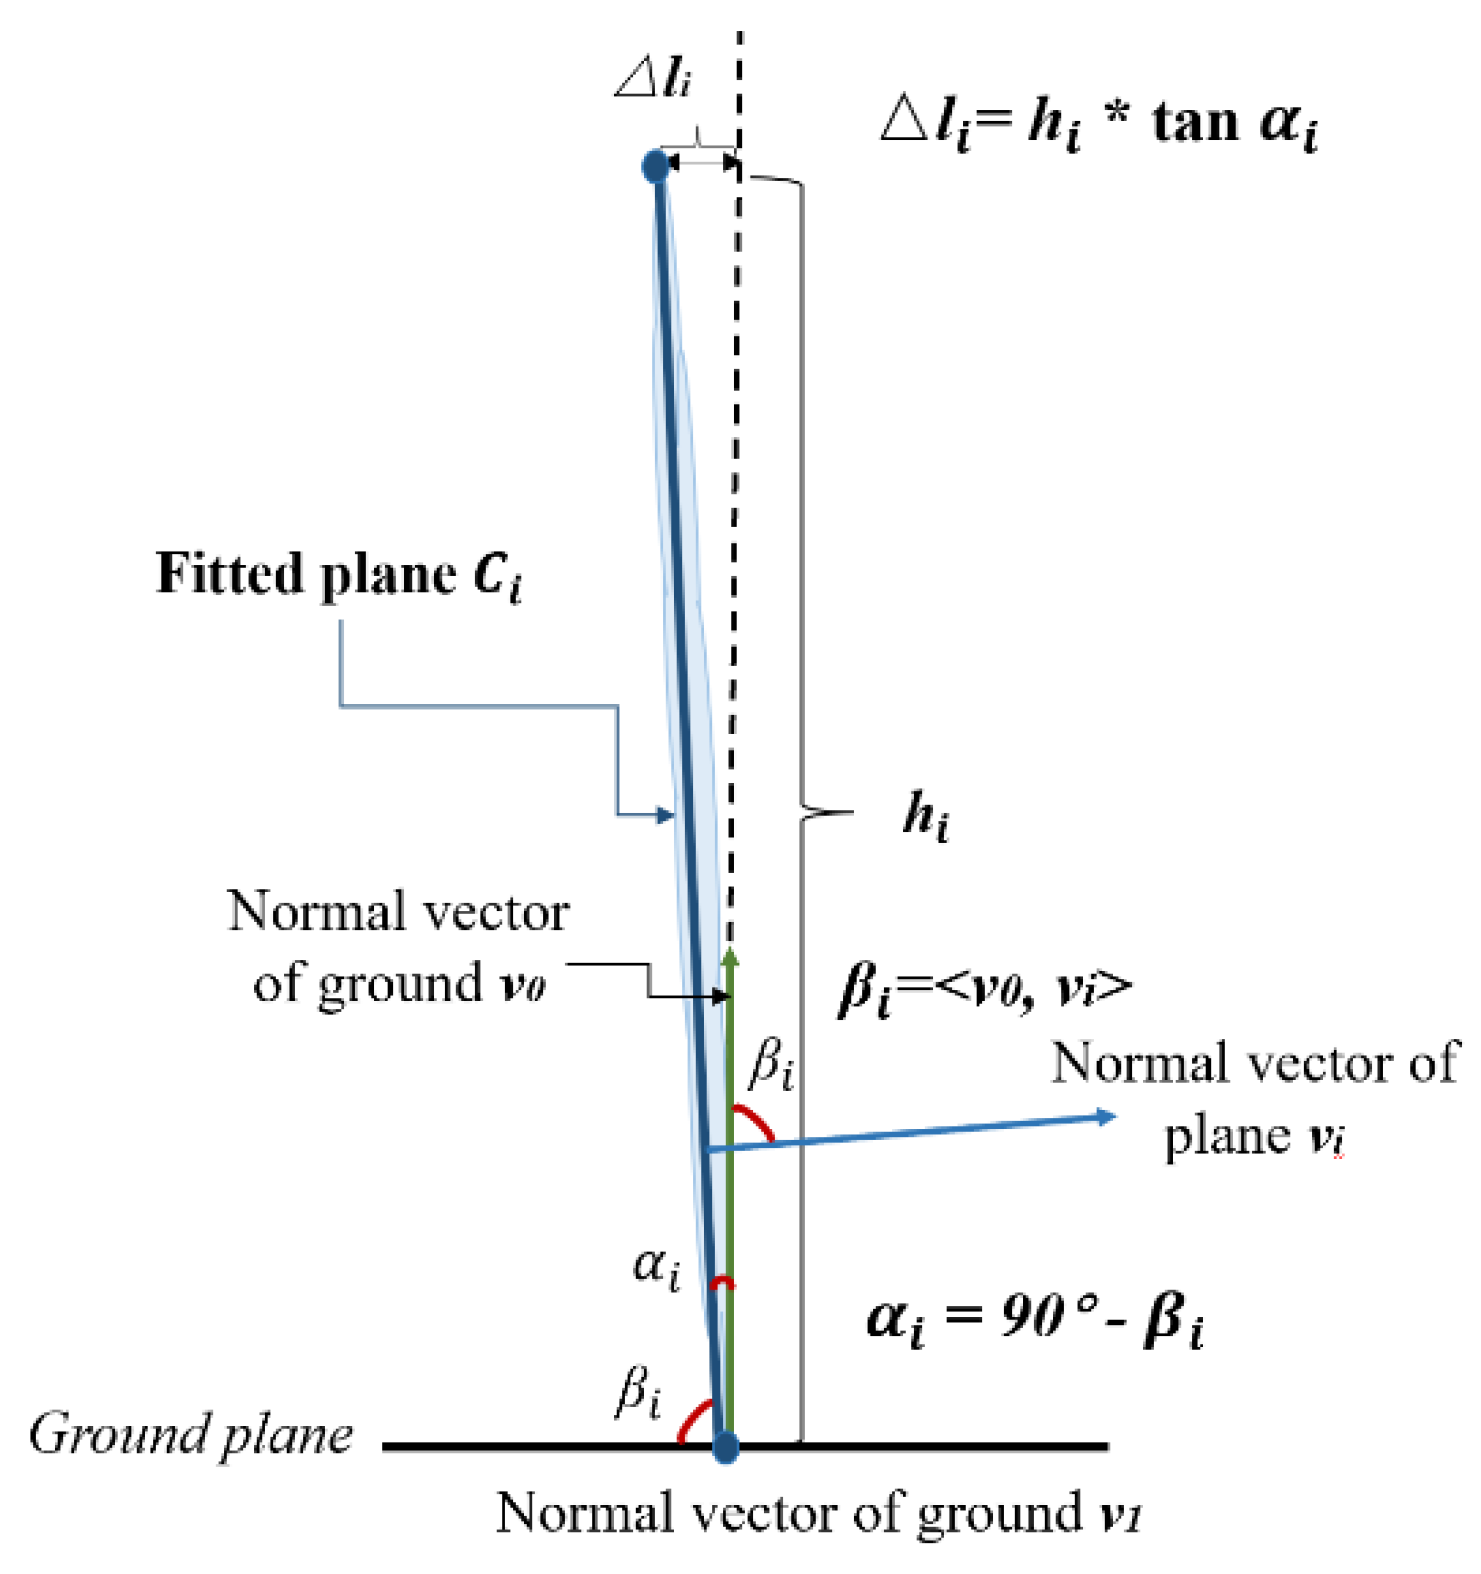
The check results of the verticality are also given in
Table 8. The vertical deviation of panel EL6 is 5.597 mm according to the proposed laser scanning method, which is higher than the quality check requirement of verticality
= 5 mm) as presented in
Section 3. Thus, panel EL6 needs rectification. Panels EL2, EL3, and EL4 passed the vertical quality check, while their deviation
of IQC method is drastically different from the manual check method. This is because there are many rebar connected on the bottom area of panels EL2, EL3, and EL4. The tuning of segmentation parameters might not be able to segment panels apart from rebar, which causes errors in the computation of verticality. According to the manual check, the vertical deviation of panel EL6 is 5.9 mm. The manual check shows that panel EL6 needs rectification. Therefore, the verticality check results of the proposed method and manual check are also consistent.
After the quality check of horizontal alignment and verticality, resulting data for the panels that need to be rectified are presented in
Table 8. If one of the horizontal alignment check or vertical check fails, the panel needs to be rectified. Therefore, panels EL3, EL4, and EL6 are identified for rectification. In conclusion, the proposed method could make IQC using laser scanning data and identify PWPs that need rectification correctly in this case study, which is the same as the results of the manual check.
The total time of using the laser scanning method included onsite data collection, preprocessing including data registration and cropping out the surrounding environment, and data processing of IQC. The data collection and preprocessing took around 10 min. The total computation time of the data processing of IQC is shown in
Table 9. The segmentation process was completed in approximately 140 s, which is fast and efficient. The fitting process was finished in around 84 s. The computation of IQC results for all PWPs took less than 4 min. The total time using laser scanning for quality check was less than 14 min.
5.4. Discussion
This study uses the conventional manual quality check result to validate the laser scanning method as it is the current acceptable method used in practice. However, the manual check method is prone to many errors, such as reading errors, inaccurate placement of measuring tools, inaccuracy of the tools, etc. [
3,
7,
53]. Theoretically, the laser scanning technology should have higher accuracy than the manual method and provide more reliable measuring results [
8,
9]. The accuracy of the results, however, depends on the scanning process and the applied processing algorithms. As the results show, the laser scanning quality check method and the conventional manual method identified the same panels that needed to be rectified. However, there are some differences in the values of horizontal and vertical deviations detected by these two methods.
Based on the experiments using these case data, it is found that some factors could influence the determination of segmentation parameters. First is the shape of PWP. The regular PWPs are more easily identified by the region growing algorithm, and larger range of parameters could be suitable for segmentation of regular shapes. For irregular PWPs, a much smaller range of parameters is suitable, especially the values for
KS,
NN, and
ST. Second, the size of PWPs and point cloud density could also influence the value of parameters. For example, the
MC is determined by the PWP segment that has the smallest number of points, so changing either the size of PWP or point cloud density could affect the value of
MC. The
KS and
NN could also be influenced by the point cloud density. When the point cloud density is higher, the normal estimation and neighbor point search for each point are more representative of local surface features under the same condition of
KS and
NN [
54]. Therefore, for point cloud datasets of different density, the value of segmentation parameters needs to be adjusted. Some other factors, such as floor layout and the material of PWPs, might also influence the value of the segmentation parameters.
For future exploration, there are some other approaches that can be used for segmentation and plane fitting. For example, segmentation based on voxel or mesh [
33], or weighted regression techniques [
65], etc., could be more promising approaches. The RANSAC is crucial to the verticality check. In addition to RANSAC, the Hough transform and least squares methods are alternative estimation techniques that may be useful for plane fitting [
15,
31]. Further study can be focused on the comparison among these approaches.
This case example adopted a single type of laser scanner BLK 360, which is easy to use on construction sites. This scanner was selected as it is widely available in Chinese construction companies due to its reasonable price; therefore, the proposed method can be conveniently adopted in practice. The operation of the BLK 360 scanner is quite simple, so it can be used by workers having no experience in surveying. The scanning time is fast, which is less than 3 min for one scan. The disadvantage of BLK 360 is that it has lower accuracy than other higher-end and more expensive scanners. In the next phase of the research, different types of scanners will be used to compare their effectiveness in quality check of installing prefabricated elements.


