
Earthquake Damage Repair Loss Estimation in New Zealand: What Other Variables Are Essential Based on Experts’ Opinions?


Abstract
:1. Introduction
Variables Considered in Current Cost Estimation Models
2. Materials and Methods
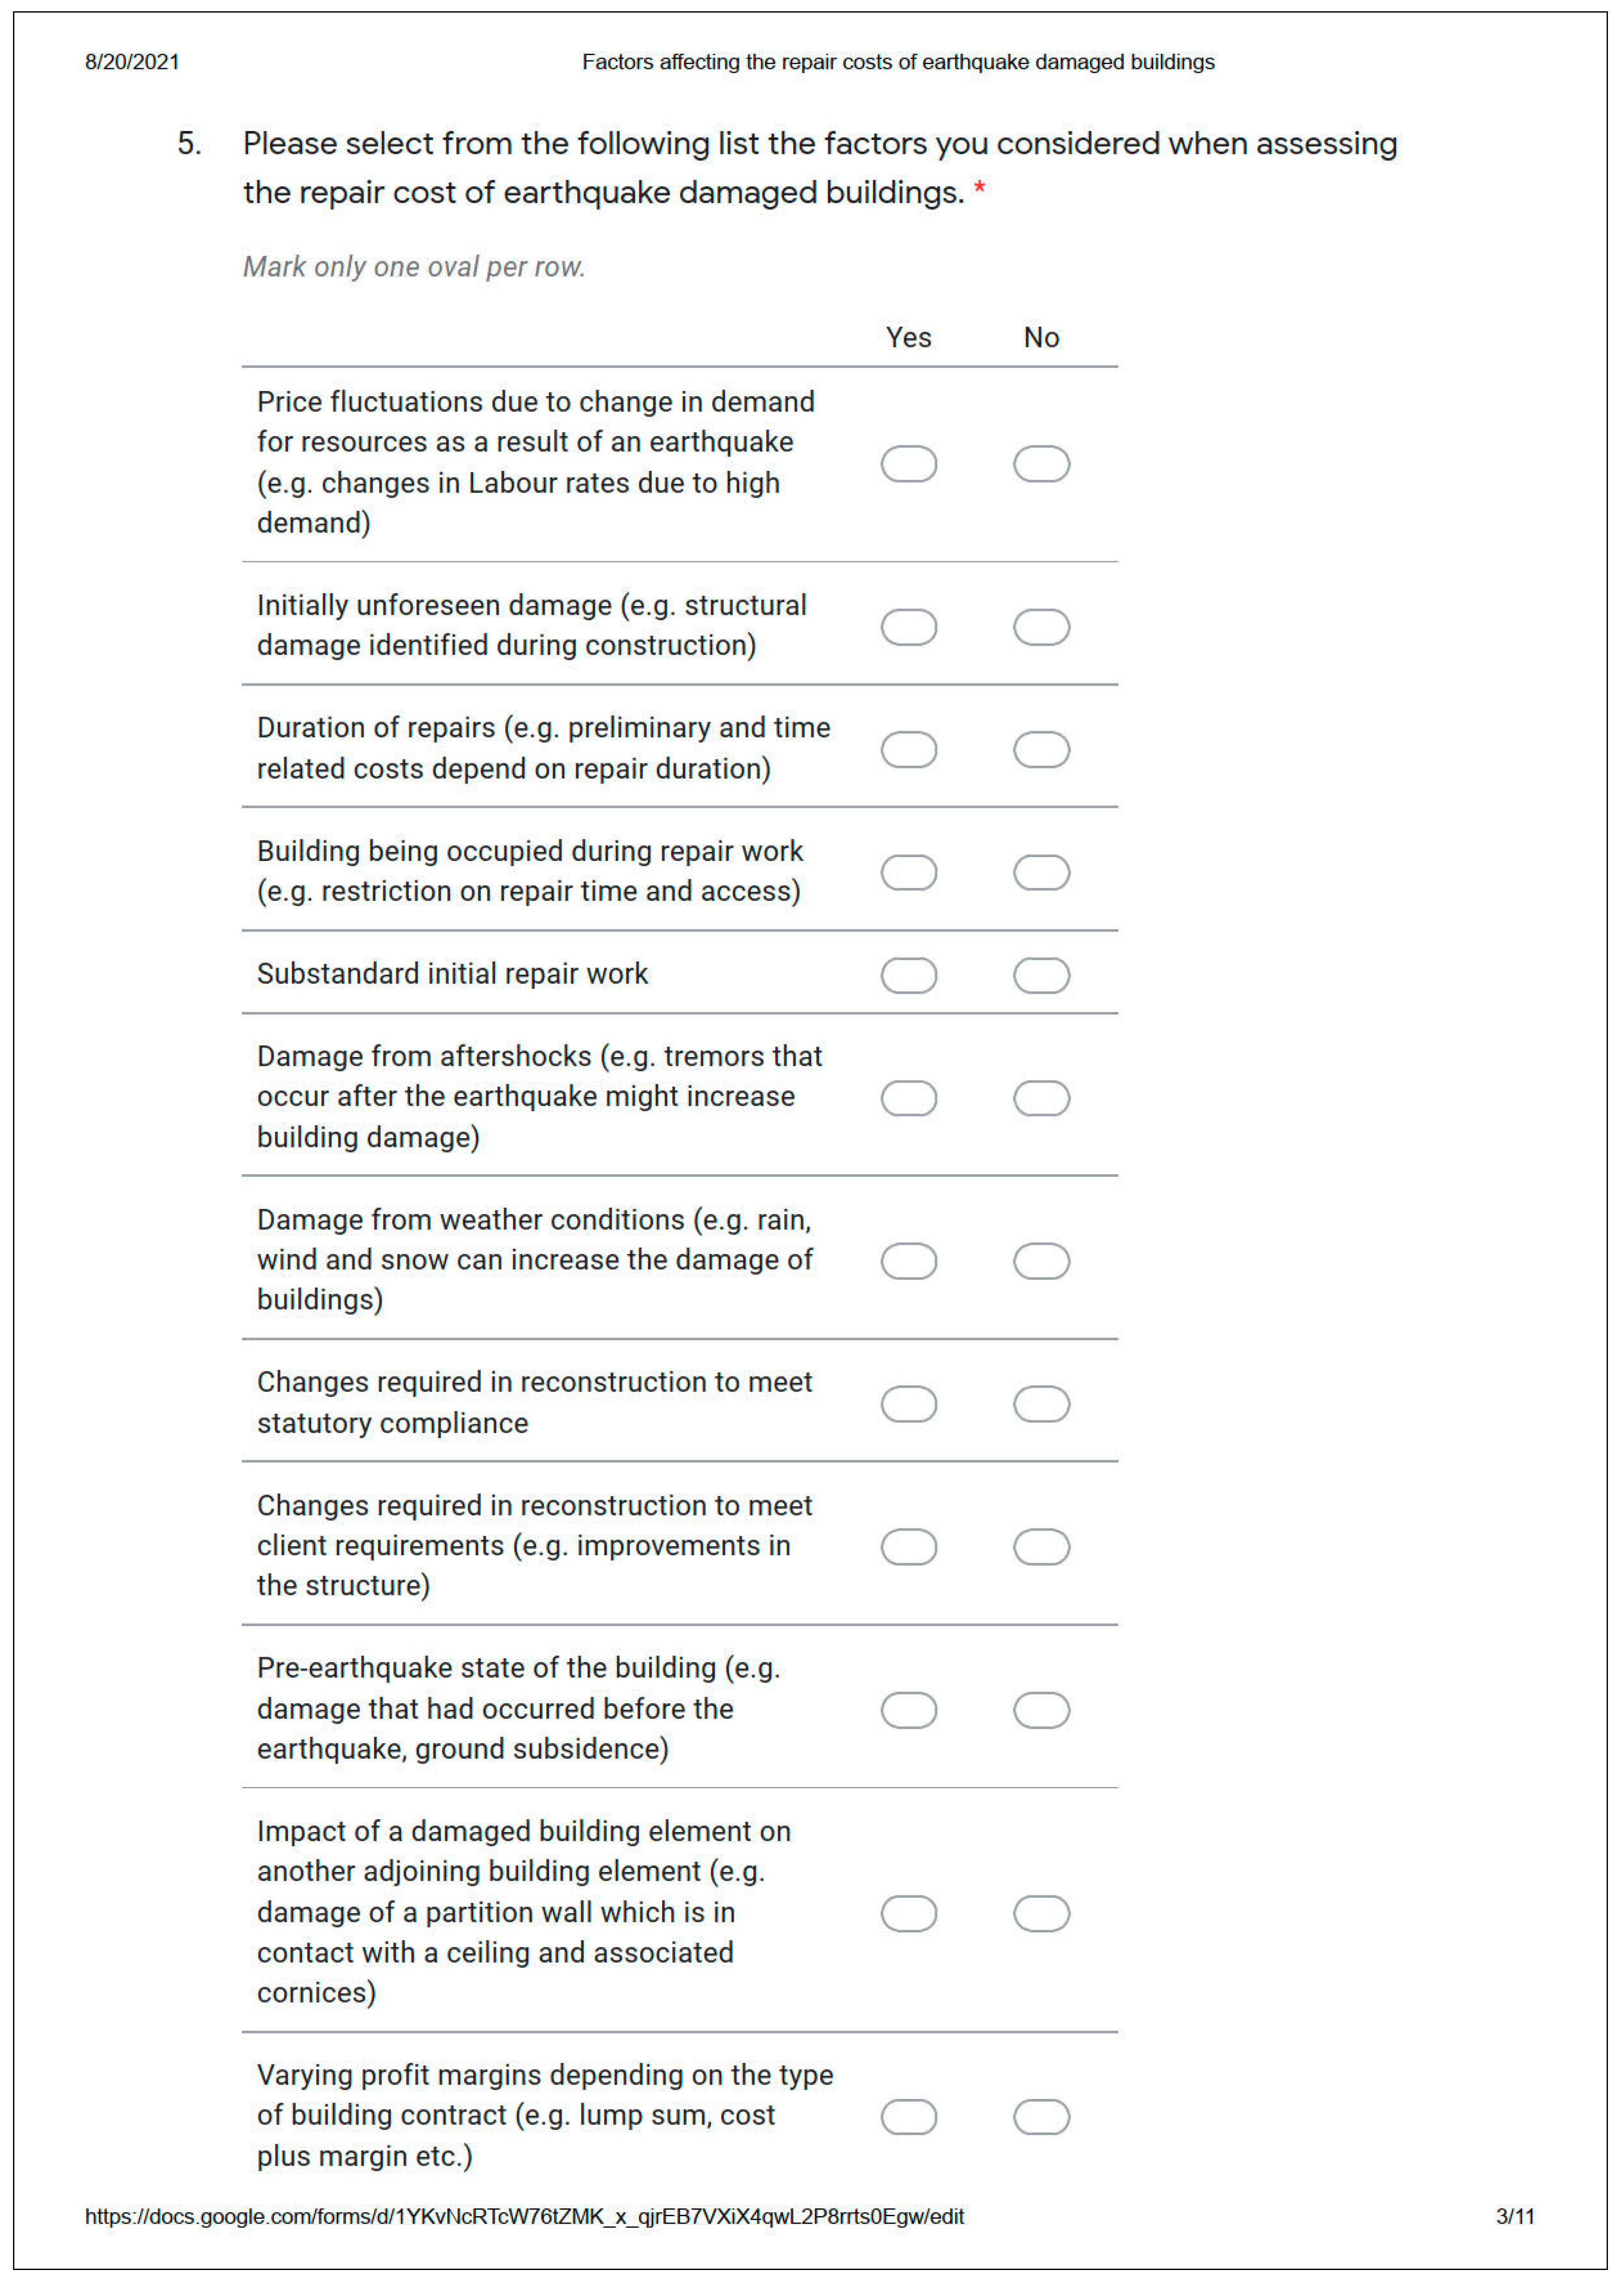
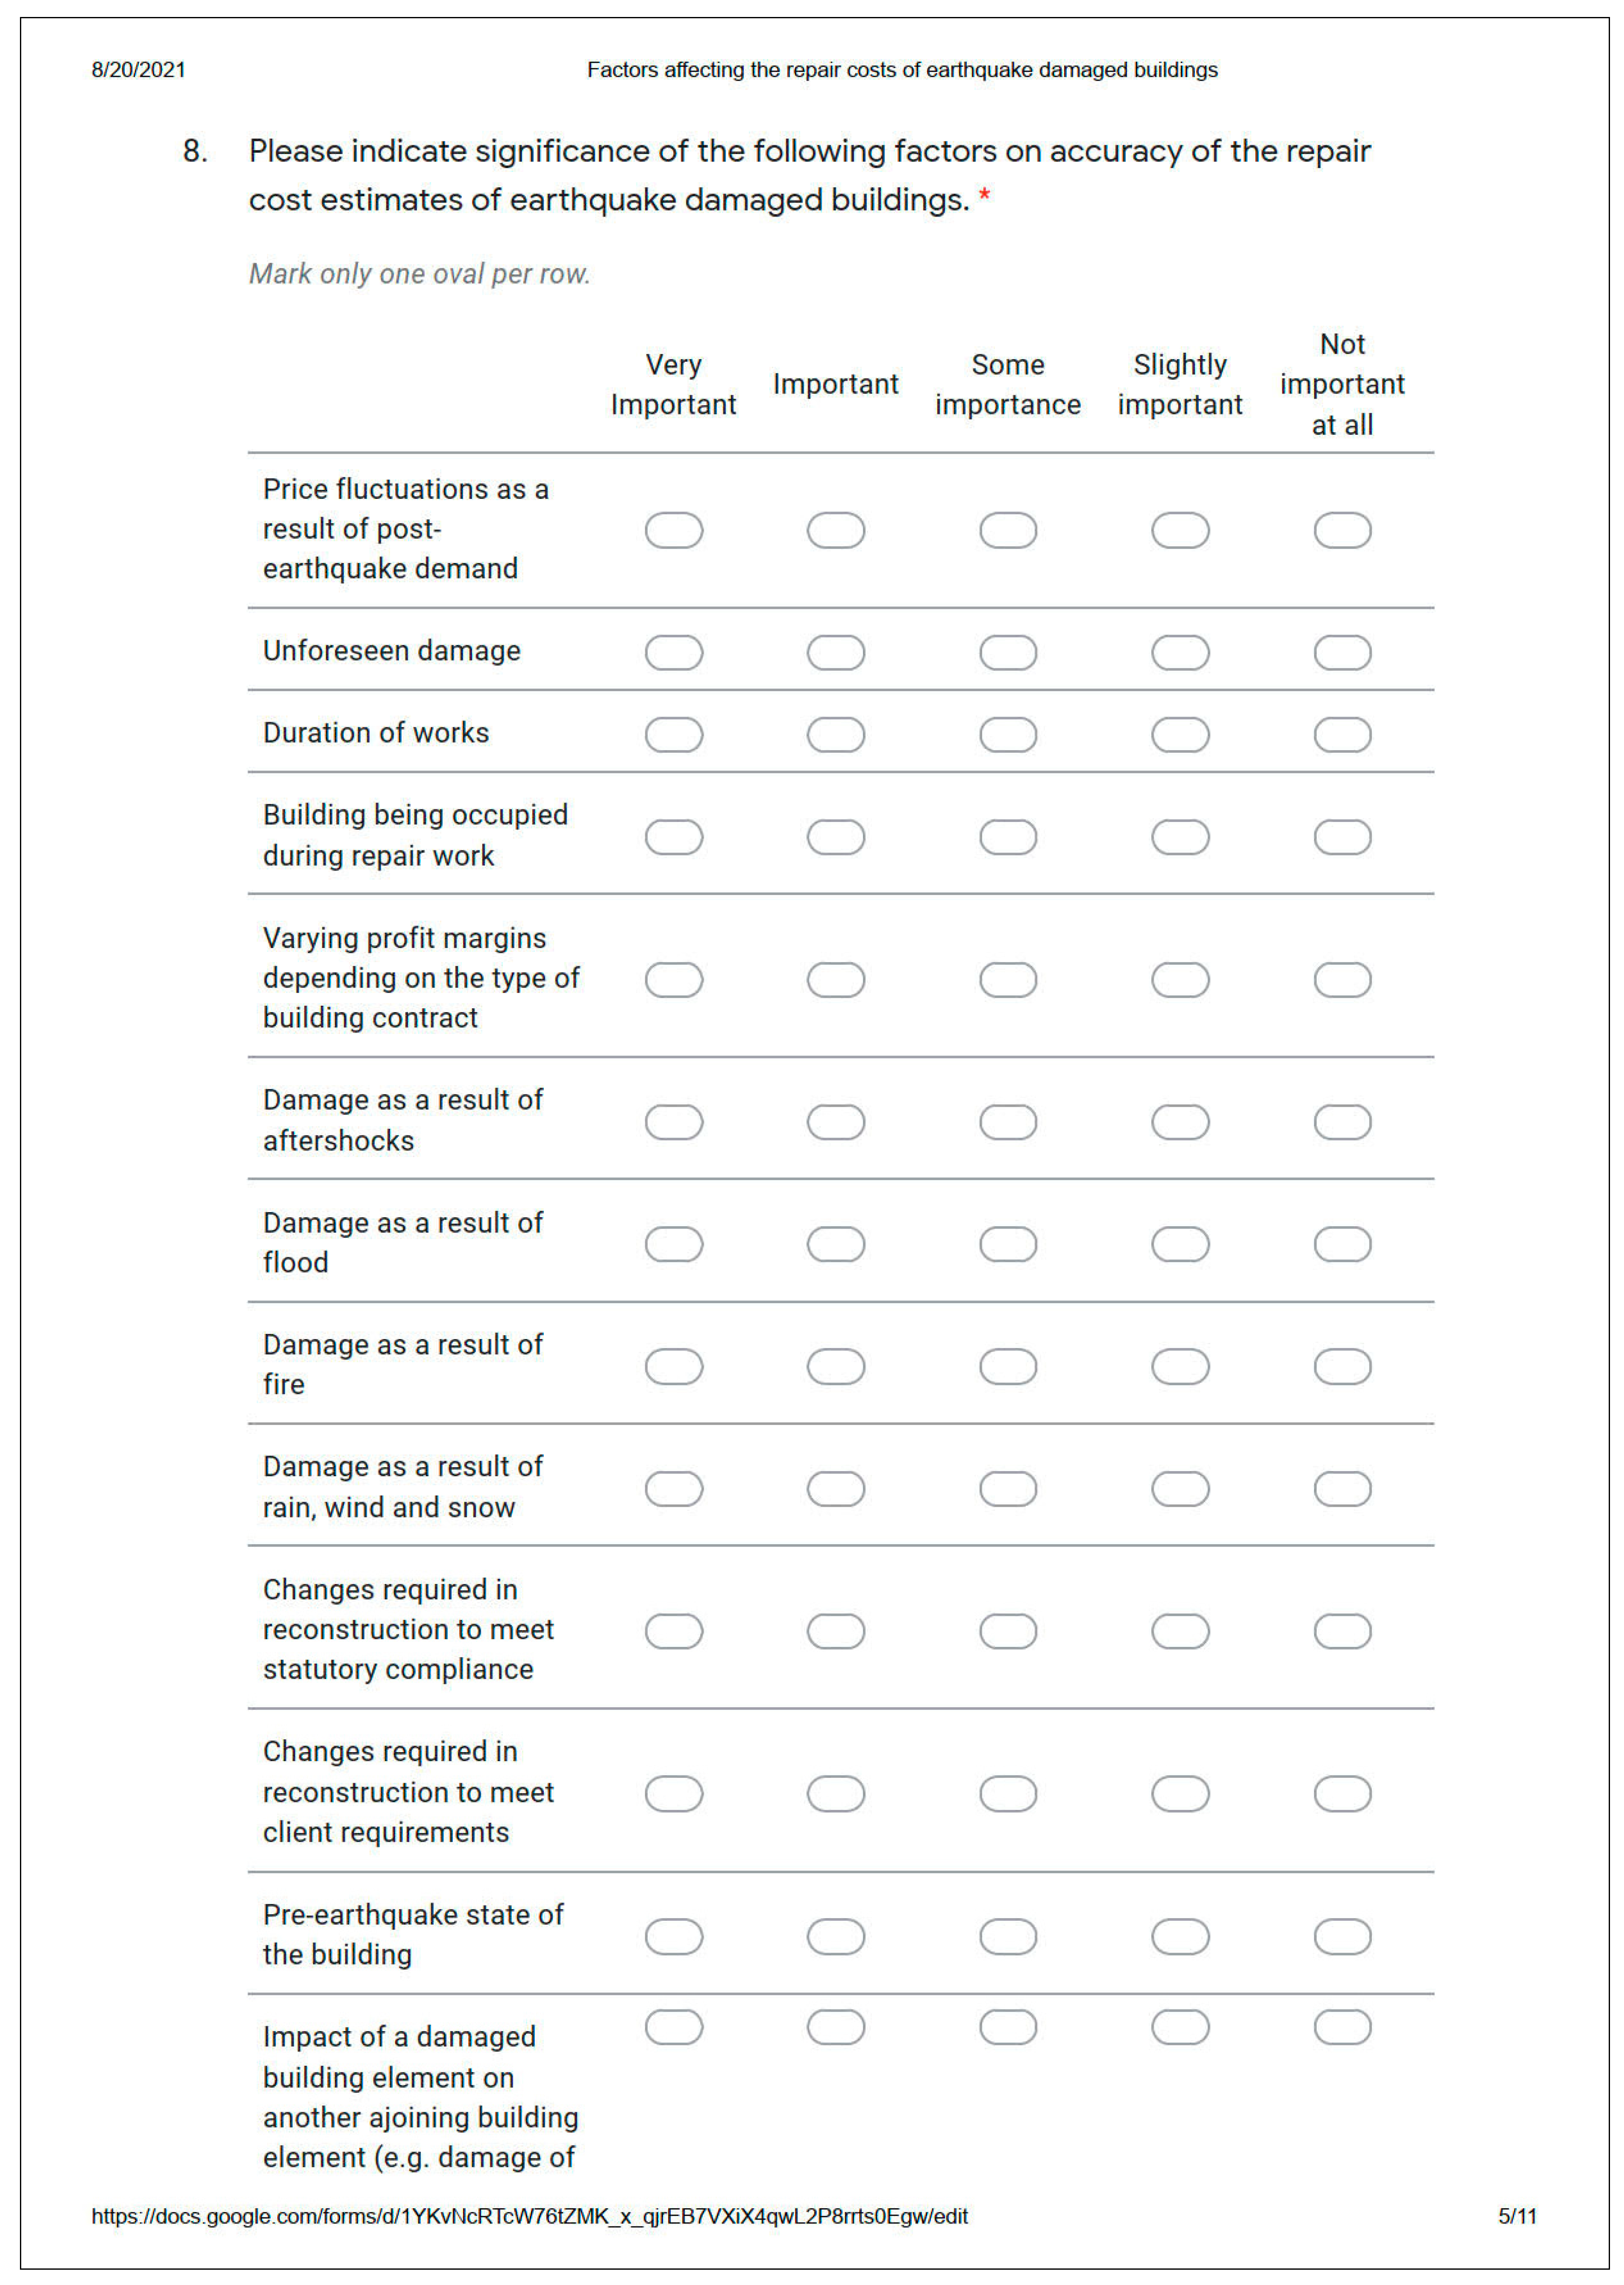
2.1. Questionnaire Design
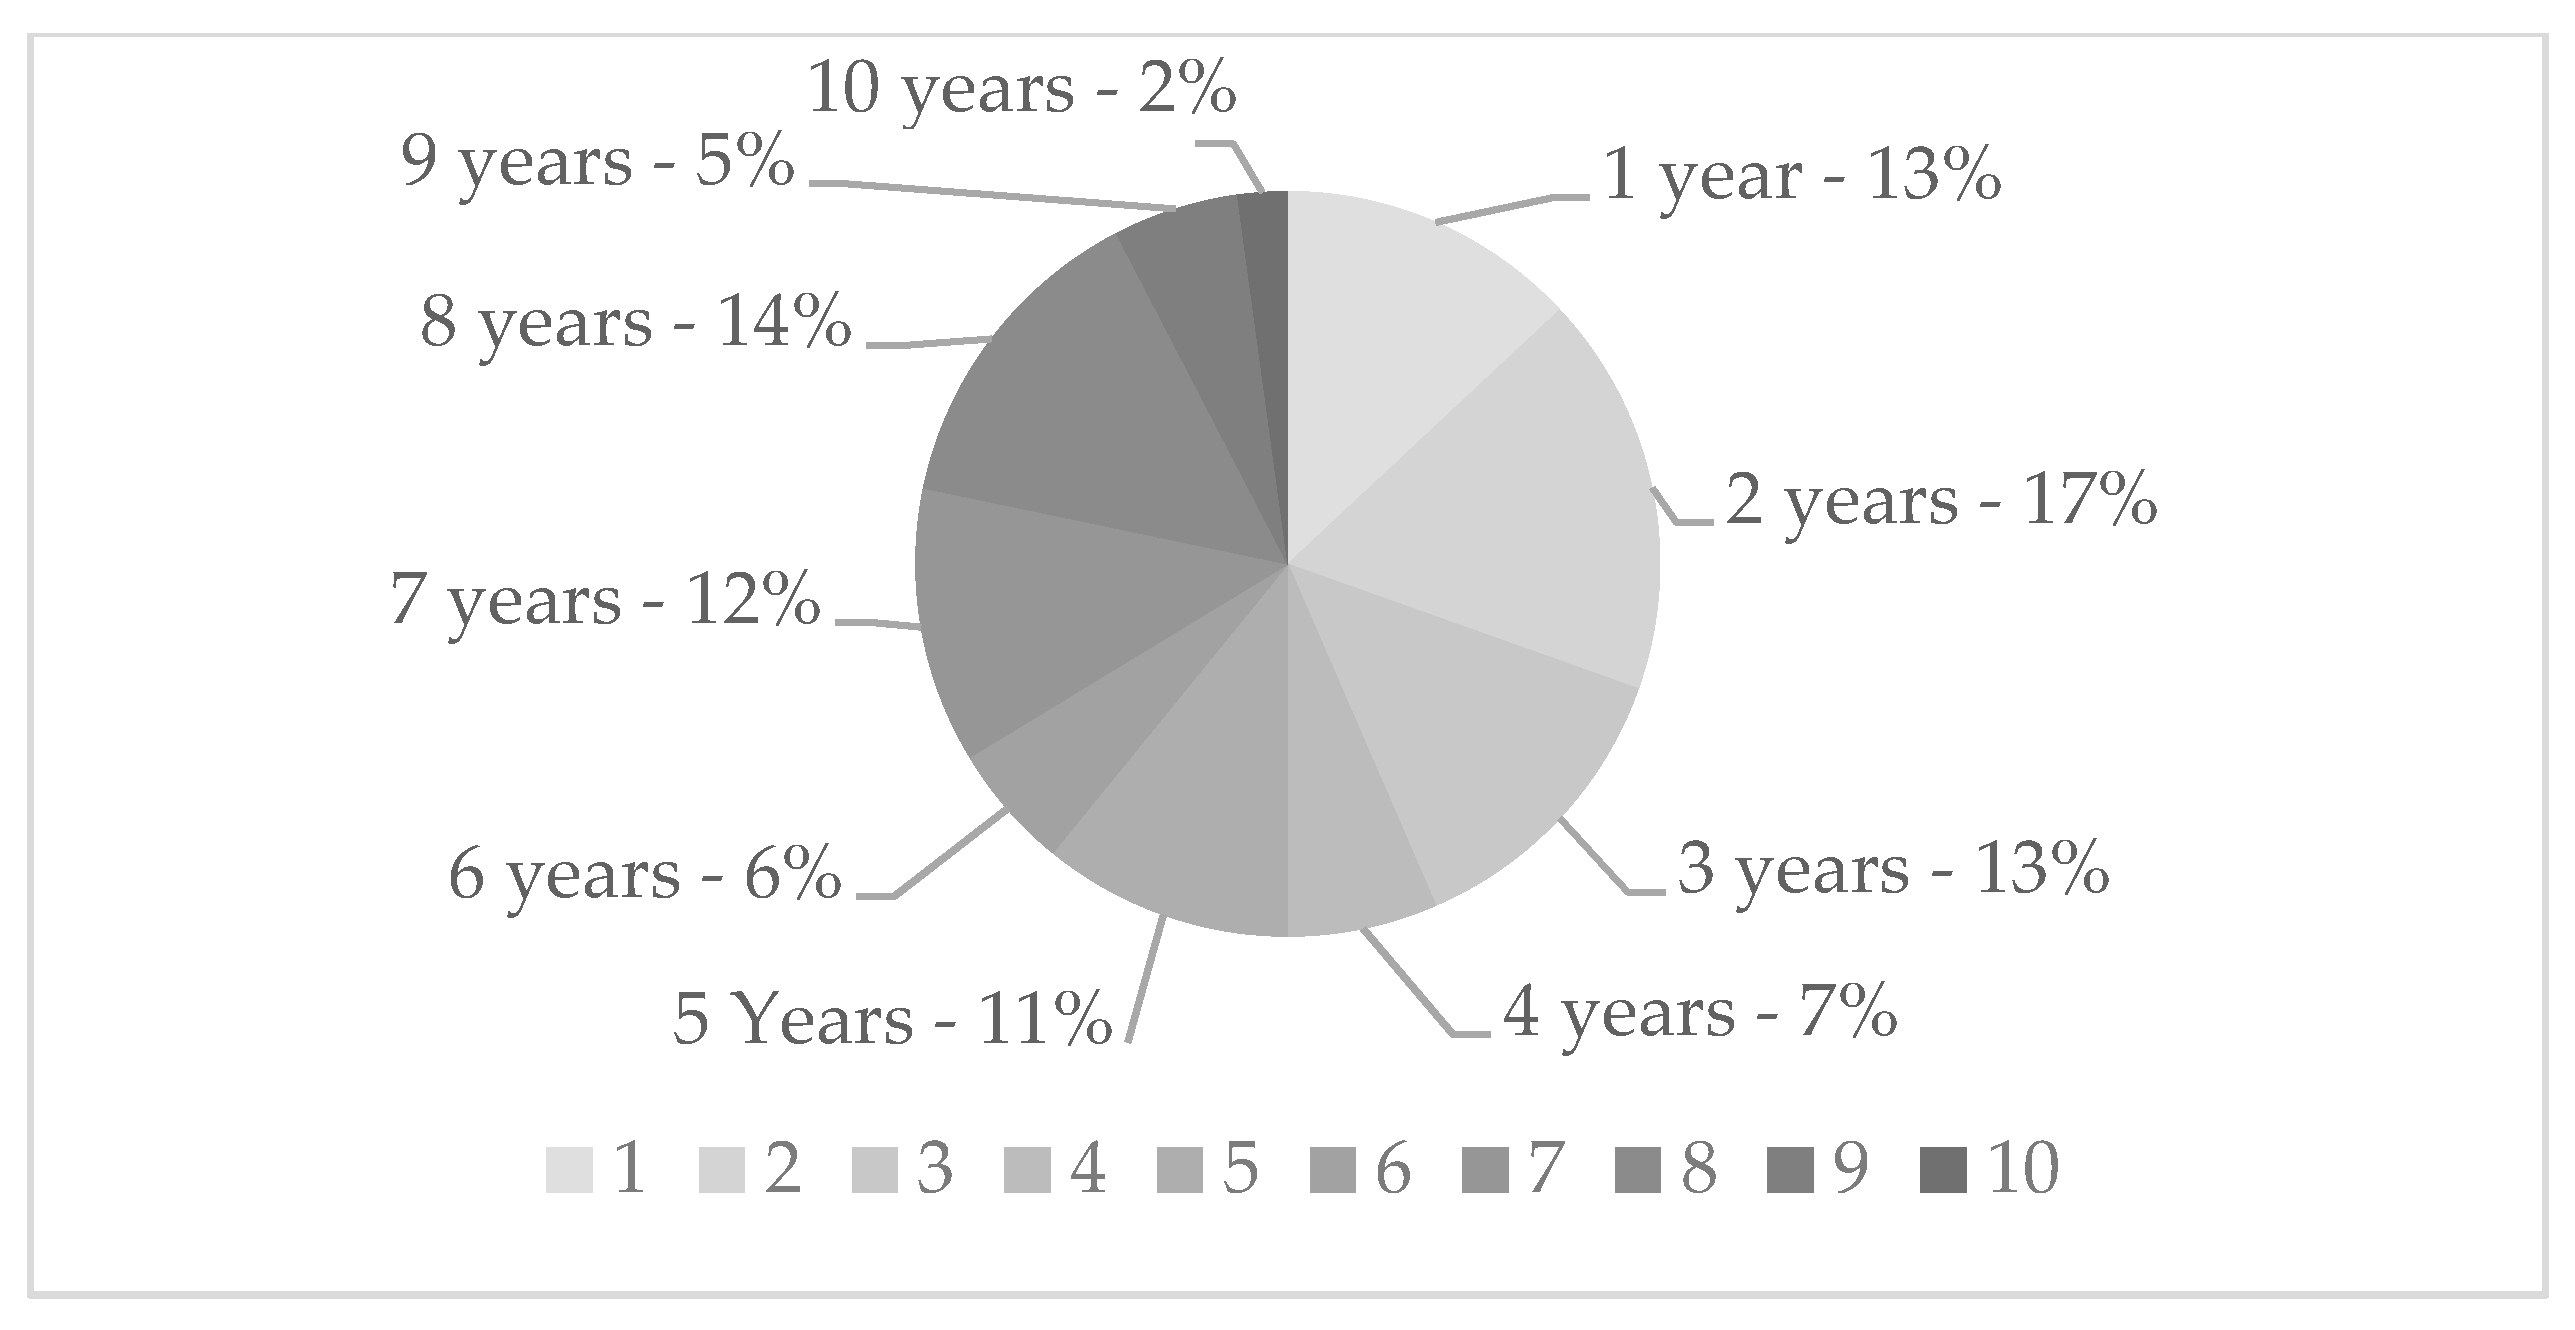
2.2. Sampling Method and Data Collection
2.3. Validity and Reliability
2.4. Research Bias
2.5. Data Analysis Method
3. Results
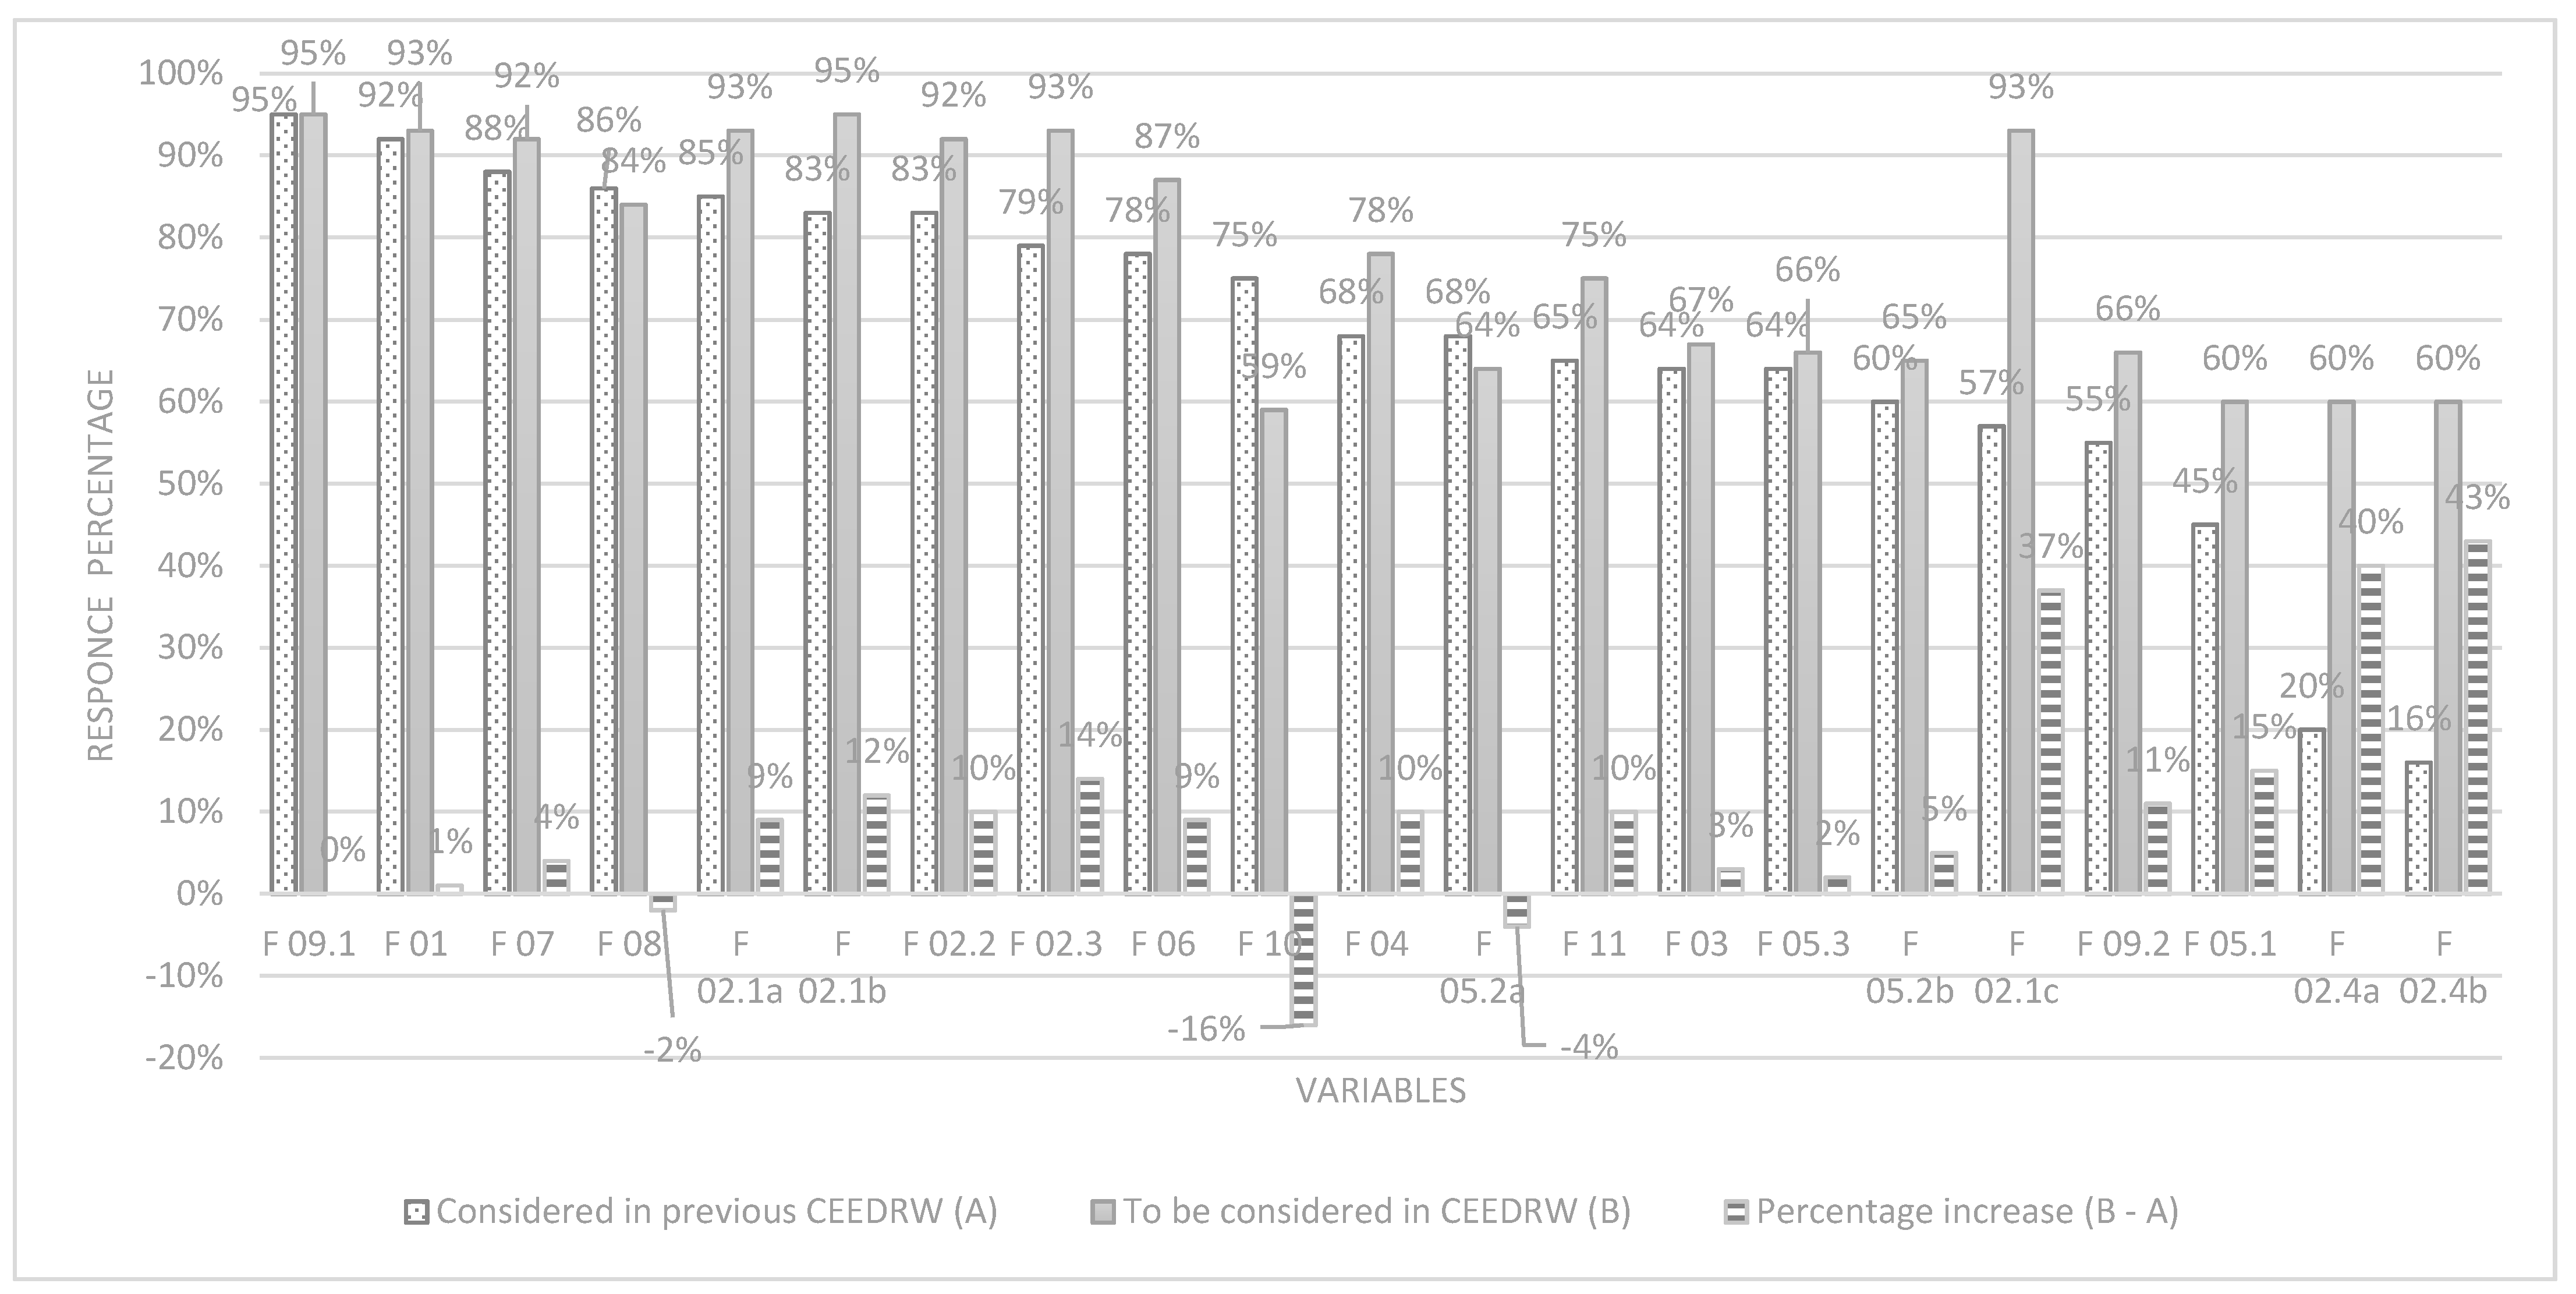
3.1. Variables Considered in Past CEEDRW and to Be Considered in Future CEEDRW
3.2. Significance of These Variables on Cost
3.3. Exploratory Factor Analysis on the 21 Variables
4. Discussion
4.1. Earthquake Damage Amplifiers
4.2. Architectural and Engineering Service Costs
4.3. Complexities and Indirect Earthquake Influences
5. Conclusions
Author Contributions
Funding
Institutional Review Board Statement
Informed Consent Statement
Data Availability Statement
Acknowledgments
Conflicts of Interest
Appendix A


References
- Munich Re Group. Earthquake/Tsunami Events Worldwide 1980–2018; Munich Re Group: München, Germany, 2020. [Google Scholar]
- Horspool, N.A.; King, A.B.; Lin, S.L.; Uma, S.R. Damage and losses to residential buildings during the Canterbury earthquake sequence. Proc. N. Z Soc. Earthq. Eng. 2016. Available online: https://www.nzsee.org.nz/db/2016/Papers/O-04%20Horspool.pdf (accessed on 20 May 2021).
- ICNZ Canterbury Earthquakes. Available online: https://www.icnz.org.nz/natural-disasters/canterbury-earthquakes/ (accessed on 27 October 2019).
- Applied Technology Council. Seismic Performance Assessment of Buildings, Volume 1—Methodology, 2nd ed.; Applied Technology Council: Redwood City, CA, USA, 2018; Volume 1. [Google Scholar]
- FEMA. HAZUS-MH MR4 Technical Manual; FEMA: Washington, DC, USA, 2003. [Google Scholar]
- HaseltonBaker Risk Group. Seismic Risk Assessment Report–Full Detailed Report. 2020. Available online: https://sp3risk.com/sp3-riskmodel/ (accessed on 20 May 2021).
- Molina, S.; Lang, D.H.; Lindholm, C.D. SELENA—An open-source tool for seismic risk and loss assessment using a logic tree computation procedure. Comput. Geosci. 2010, 36, 257–269. [Google Scholar] [CrossRef]
- Applied Technology Council. PACT 3.1.2—Software; Applied Technology Council: Redwood City, CA, USA, 2018. [Google Scholar]
- Applied Technology Council. Seismic Performance Assessment of Buildings, Volume 2—Implementation Guide, 2nd ed.; Applied Technology Council: Redwood City, CA, USA, 2018; Volume 2. [Google Scholar]
- Bradley, B.A. User Manual for SLAT: Seismic Loss Assessment Tool Version 1.14; Department of Civil Engineering, University of Canterbury: Christchurch, New Zealand, 2009. [Google Scholar]
- Charalambos, G.; Dimitrios, V.; Symeon, C. Damage Assessment, Cost Estimating, and Scheduling for Post-Earthquake Building Rehabilitation Using BIM. In Computing in Civil and Building Engineering; American Society of Civil Engineers: Orlando, FL, USA, 2014; pp. 398–405. [Google Scholar]
- Vona, M.; Mastroberti, M.; Mitidieri, L.; Tataranna, S. New resilience model of communities based on numerical evaluation and observed post seismic reconstruction process. Int. J. Disaster Risk Reduct. 2018, 28, 602–609. [Google Scholar] [CrossRef]
- Jiao, Q.; Jiang, H.; Li, Q. Building Earthquake Damage Analysis Using Terrestrial Laser Scanning Data. Adv. Civ. Eng. 2019, 2019, 1–12. [Google Scholar] [CrossRef]
- Kahandawa, R.; Domingo, N.D.; Park, K.S.; Uma, S.R. Earthquake damage estimation systems: Literature review. Procedia Eng. 2018, 212, 622–628. [Google Scholar] [CrossRef]
- Applied Technology Council. Seismic Performance Assessment of Buildings Volume 1—Methodology (FEMA P-58-1); Applied Technology Council: Washington, DC, USA, 2012; Volume FEMA, p. 58. [Google Scholar]
- Memon, A.H.; Rahman, I.A.; Abdullah, M.R.; Azis, A.A.A. Factors affecting construction cost in Mara Large Construction Project: Perspective of project management consultant. Int. J. Sustain. Constr. Eng. Technol. 2010, 1, 41–54. [Google Scholar]
- Olawale, Y.A.; Sun, M. Cost and time control of construction projects: Inhibiting factors and mitigating measures in practice. Constr. Manag. Econ. 2010, 28, 509–526. [Google Scholar] [CrossRef]
- Frimpong, Y.; Oluwoye, J.; Crawford, L. Causes of delay and cost overruns in construction of groundwater projects in a developing countries; Ghana as a case study. Int. J. Proj. Manag. 2003, 21, 321–326. [Google Scholar] [CrossRef]
- Rahman, I.A.; Mem, A.H.; Karim, A.T.A. Significant factors causing cost overruns in large construction projects in Malaysia. J. Appl. Sci. 2013, 13, 286–293. [Google Scholar] [CrossRef] [Green Version]
- Kim, S.Y.; Tuan, K.N.; Do Lee, J.; Pham, H.; Luu, V.T. Cost overrun factor analysis for hospital projects in Vietnam. KSCE J. Civ. Eng. 2018, 22, 1–11. [Google Scholar] [CrossRef]
- Kahandawa, R.; Domingo, N.; Chawynski, G.; Uma, S.R. Factors impacting post-earthquake damage repair cost estimations. Int. J. Disaster Resil. Built Environ. 2020. [Google Scholar] [CrossRef]
- Dhakal, R.P. Damage to non-structural components and contents in 2010 Darfield earthquake. Bull. N. Z. Soc. Earthq. Eng. 2010, 43, 404–411. [Google Scholar] [CrossRef]
- BRANZ. Learnings from the Canterbury Earthquakes; BRANZ: Porirua, New Zealand, 2012. [Google Scholar]
- Di Ludovico, M.; Prota, A.; Moroni, C.; Manfredi, G.; Dolce, M. Reconstruction process of damaged residential buildings outside historical centres after the L’Aquila earthquake: Part II—“heavy damage” reconstruction. Bull. Earthq. Eng. 2017, 15, 693–729. [Google Scholar] [CrossRef]
- Brook, M. Estimating and Tendering for Construction Work. [Electronic Resource], 5th ed.; Routledge, Taylor and Francis Group: Abingdon, UK, 2017; ISBN 9781317561736. [Google Scholar]
- Paul Geoffrey Myall vs Tower Insurance Ltd.; 2017; CIV-2015-409–000230 [2017] NZHC 251. Available online: https://forms.justice.govt.nz/search/Documents/pdf/jdo/51/alfresco/service/api/node/content/workspace/SpacesStore/27f756f8-1c8a-429a-9917-73aa3c6324b6/27f756f8-1c8a-429a-9917-73aa3c6324b6.pdf (accessed on 20 May 2021).
- Duncan Cotterill. Judgment Summary—Paul Geoffrey Myall V Tower Insurance Ltd. [2017] NZHC 251; 2017. Available online: https://duncancotterill.com/publications/judgment-summary-paul-geoffrey-myall-v-tower-insurance-ltd-2017-nzhc-251 (accessed on 20 May 2021).
- Ward, A.E.; Azhar, S.; Khalfan, M. Construction in Occupied Spaces. Slovak J. Civ. Eng. 2017, 25, 15–23. [Google Scholar] [CrossRef] [Green Version]
- Jia, J. Earthquake damages. In Modern Earthquake Engineering; Springer: Berlin/Heidelberg, Germany, 2017; pp. 413–431. ISBN 978-3-642-31853-5. [Google Scholar]
- Inland Marine Underwriters Association. Builders Risk Guide to Loss Prevention Part Two: Water Related Exposures; Inland Marine Underwriters Association: New York, NY, USA, 2001. [Google Scholar]
- Potter, S.H.; Becker, J.S.; Johnston, D.M.; Rossiter, K.P. An overview of the impacts of the 2010–2011 Canterbury earthquakes. Int. J. Disaster Risk Reduct. 2015, 14, 6–14. [Google Scholar] [CrossRef] [Green Version]
- Baker, G.B.; Collier, P.C.R.; Abu, A.K.; Houston, B.J. Post-Earthquake Structural Design for Fire—A New Zealand Perspective. Eng. Conf. Contrib. 2012. [Google Scholar] [CrossRef]
- Davis, C.A.; Giovinazzi, S.; Hart, D.E. Liquefaction Induced Flooding in Christchurch New Zealand. In Proceedings of the 6th International Conference on Earthquake Geotechnical Engineering, Christchurch, New Zealand, 1–4 November 2015. [Google Scholar]
- Tower Insurance Ltd V Earthquake Commission. 2011, p. CIV-2011-485–1116. Available online: https://www.interest.co.nz/sites/default/files/Earthquake%20Commission-1.pdf (accessed on 20 May 2021).
- Döhrmann, D.; Gürtler, M.; Hibbeln, M. Insured loss inflation: How natural catastrophes affect reconstruction costs. J. Risk Insur. 2017, 84, 851–879. [Google Scholar] [CrossRef] [Green Version]
- Statistics New Zealand Labour Cost Index—Median and Mean Increase by Industry & Location. Available online: https://www.stats.govt.nz/ (accessed on 1 January 2021).
- Perdia, S.; McNaughton, A. Post-Earthquake Price Dynamics in Christchurch/Canterbury; Canterbury Development Corporation: Christchurch, New Zealand, 2014. [Google Scholar]
- Khodahemmati, N. Diagnosis and Quantification of Post-Disaster Construction Material Cost Fluctuations. Univ. Tex. Arlington 2018. Available online: https://www.researchgate.net/publication/340805007_Diagnosis_and_Quantification_of_Postdisaster_Construction_Material_Cost_Fluctuations (accessed on 20 May 2021).
- Ahmadi, N.; Shahandashti, S.M. Role of predicate construction market conditions in influencing post disaster demand surge. Nat. Hazards Rev. 2018, 19, 1–13. [Google Scholar] [CrossRef]
- Chang, Y.; Wilkinson, S.; Seville, E.; Potangaroa, R. Changes in resource need for post-disaster reconstruction: A longitudinal study in China. Build. Res. Inf. 2012, 40, 327–336. [Google Scholar] [CrossRef]
- Almufti, I.; Willford, M.; Delucchi, M.; Davis, C.; Hanson, B.; Langdon, D.; Friedman, D.; Johnson, L.; Nielsen, G.; Riordan, N.O.; et al. REDi Rating System. Available online: Publications.arup.com/publications/r/redi_rating_systemtions (accessed on 27 March 2017).
- Khosrowshahi, F.; Kaka, A.P. Estimation of project total cost and duration for housing projects in the U.K. Build. Environ. 1996, 31, 373–383. [Google Scholar] [CrossRef]
- Clifton, C.; Bruneau, M.; MacRae, G.; Leon, R.; Fussell, A. Steel structures damage from the Christchurch earthquake series of 2010 and 2011. Bull. N. Z. Soc. Earthq. Eng. 2011, 44, 297–318. [Google Scholar] [CrossRef] [Green Version]
- Galloway, B.D.; Hare, H.J. A review of post-earthquake building control policies with respect to the recovery of the Christchurch CBD. Bull. N. Z. Soc. Earthq. Eng. 2012, 45, 105–116. [Google Scholar] [CrossRef]
- Robertson, G.; Woods, M. Resolution for Canterbury Owners of On-Sold Homes. Available online: https://www.beehive.govt.nz/release/resolution-canterbury-owners-sold-homes (accessed on 4 November 2019).
- Doloi, H.; Sawhney, A.; Iyer, K.C.; Rentala, S. Analysing factors affecting delays in Indian construction projects. Int. J. Proj. Manag. 2012, 30, 479–489. [Google Scholar] [CrossRef]
- Gebrehiwet, T.; Luo, H. Analysis of delay impact on construction project based on RII and Correlation Coefficient: Empirical study. Procedia Eng. 2017, 196, 366–374. [Google Scholar] [CrossRef]
- Sohu, S.; Abd Halid, A.; Nagapan, S.; Fattah, A.; Latif, I.; Ullah, K. Causative factors of cost overrun in highway projects of Sindh province of Pakistan. IOP Conf. Ser. Mater. Sci. Eng. 2017, 271. [Google Scholar] [CrossRef]
- Chawynski, G. Preparing expert witness documents to support earthquake affected insurance policy holders in Christchurch, New Zealand. J. Build. Surv. Apprais. Valuat. 2019, 5, 362–368. [Google Scholar]
- Cretney, R. “An opportunity to hope and dream”: Disaster politics and the emergence of possibility through community-led recovery. Antipode 2019, 51, 497–516. [Google Scholar] [CrossRef]
- Price, S.; Peters, T. New Zealand: Substandard Repairs to Earthquake-Damaged Homes in Christchurch. Available online: http://www.wsws.org (accessed on 4 November 2019).
- Kahandawa, R.; Domingo, N.; Chawynski, G.; Uma, S.R. Factors Affecting Post-Earthquake Damage Repair Cost Estimations. Available online: https://ir.canterbury.ac.nz/bitstream/handle/10092/17186/POSTER-Kahandawa_Investigation_into_the_Factors_Affecting_Costs_of_Earthquake_Damage_Repair_Work.pdf?sequence=1&isAllowed=y (accessed on 16 October 2019).
- Bryman, A.; Bell, E. Business Research Methods, 3rd ed.; Oxford University Press: Oxford, UK, 2011; ISBN 9788578110796. [Google Scholar]
- Neuman, W.L. Social Research Methods: Qualitative and Quantitative Approaches, 7th ed.; Pearson Education Limited: Essex, UK, 2014; ISBN 9781292020235. [Google Scholar]
- Saunders, M.; Lewis, P.; Thornhill, A. Research Methods for Business Students, 8th ed.; Pearson Education: Harlow, UK, 2019; ISBN 9781292016627. [Google Scholar]
- Iyer, K.C.; Jha, K.N. Factors affecting cost performance: Evidence from Indian construction projects. Int. J. Proj. Manag. 2005, 23, 283–295. [Google Scholar] [CrossRef]
- Kaiser, H.F. An index of factorial simplicity. Psychometrika 1974, 39, 31–36. [Google Scholar] [CrossRef]
- Williams, B.; Onsman, A.; Brown, T. Exploratory factor analysis: A five-step guide for novices. Australas. J. Paramed. 2010, 8, 1–13. [Google Scholar] [CrossRef] [Green Version]
- Hayton, J.C.; Allen, D.G.; Scarpello, V. Factor retention decisions in Exploratory Factor Analysis: A tutorial on Parallel Analysis. ORM Artic. Interest 2004, 7, 191–205. [Google Scholar] [CrossRef]
- Henson, R.K.; Roberts, J.K. Use of Exploratory Factor Analysis in published research. Educ. Psychol. Meas. 2006, 66, 393–416. [Google Scholar] [CrossRef] [Green Version]
- Costello, A.B.; Osborne, J.W. Best practices in exploratory factor analysis: Four recommendations for getting the most from your analysis. Pract. Assess. Res. Eval. 2005, 10. [Google Scholar] [CrossRef]
- Kaiser, H.F. The application of electronic computers to Factor Analysis. Educ. Psychol. Meas. 1960, 20, 141–151. [Google Scholar] [CrossRef]
- Flanagan, R.; Jewell, C. New Code of Estimating Practice; John Wiley & Sons, Ltd.: Chichester, UK, 2018; ISBN 9781119329671. [Google Scholar]
- Stephenson, J. Labour Cost Escalation in Canterbury; New Zealand Institiue of Economic Research: Wellington, New Zealand, 2013. [Google Scholar]
- Olsen, A.H.; Porter, K.A. Storm surge to demand surge: Exploratory study of hurricanes, labor wages, and material prices. Nat. Hazards Rev. 2013, 14, 247–257. [Google Scholar] [CrossRef]
- Nwadike, A.N.; Wilkinson, S. Building Code Amendment Process: A case study of New Zealand. In Proceedings of the 9th International Conference on Building Resilience-ICBR, Bali, Indonesia, 13–15 January 2020. [Google Scholar]


| Variable | Description | Impact |
|---|---|---|
| Consequential damage repair (F 01) | Elements in buildings are interconnected. Damage to one element might cause damage to other elements. Additional damage can also occur during repair work. | For example, damaged hot water cylinders, brick chimneys, and brick parapet walls had caused damage to other elements like; roof structure, roof tiling, canopies, plumbing, electrical services, and other building elements during CEQS [22,23]. |
| Cost of professional services (F 02) | The cost of professional services in construction is generally related to; design, architectural, and engineering fees (D/A/E). However, if the repair work is funded by insurance, legal fees can come into play. | A study was carried out in Italy on repairs conducted for 5775 residential buildings after the ‘L’Aquila earthquake identified that professional fees for D/A/E services could be as high as 16% to 17% of the total cost [24]. However, the professional fees did not include legal fees. |
| Varying profit margins depending on the type of building contract (F 03) | Depending on the risk, the profit of the contractor will vary, thus changing the construction costs. | A fixed-price contract will assign this risk to a contractor allowing no changes of price. On the other hand, cost-plus-profit contracts could assign the client’s risk, which pays all the contractor’s costs plus profit [25]. According to a New Zealand court case [26], the average profit margin on repairs CEQS was identified as 10 percent, which can vary according to the required specialised skills and changes risk [27]. |
| Restrictions during repair work (F 04) | Repair work of a building might be restricted due to it being occupied during construction [15]. Restrictions would result in additional work, increasing the cost and repair time. | Preventive measures are required to restrict access to the whole building and protect occupants from health and safety issues. For example, daily cleaning, covering of working areas, temporary pathways, and construction work restrictions are few measures. Additionally, Ward et al. [28] verified that repair time and cost would be higher in occupied buildings. |
| Aftershocks, earthquake-induced hazards and weather conditions (F 05) | Other than significant shaking, earthquakes create aftershocks, liquefaction, tsunamis, seiches, fire, inundation, and landslides [29]. These can create additional damage to buildings. Buildings that have had their external fabric compromised might be damaged further by normal weather conditions like rain, wind, and snow [30]. | Damage from post-earthquake liquefaction, aftershock [31], fire [32], and flooding [33] have also been identified after the CEQS. Damage from liquefaction is typically considered earthquake damage and considered in cost estimation models. However, the cause of damage from aftershocks, fire, and inundation requires additional evaluations to prove their direct causation from an earthquake [34]. Furthermore, building elements like; plasterboard, furniture, and electrical services can easily be damaged if the building interior is exposed to prolonged weather conditions. |
| Price fluctuations after an earthquake (F 06) | Earthquake damages create a sudden need to repair or rebuild based on the demand for construction-related goods and services. The sudden imbalance between supply and demand can increase the cost of construction. This dynamic price fluctuation occurring after an earthquake is defined as a demand surge [35]. Demand surge and annual price fluctuations will affect the price of construction-related goods. The start date will, therefore, determine applicable rates of construction. Therefore, it will be considered under price fluctuations. | Evidence of price inflation after a disaster can be seen in New Zealand [36,37], the United States of America [38,39], and China [40]. The start date of repair work is affected by the time required to acquire; long-lead equipment, post-earthquake building inspections, finance, engineering input for repair work, building permits, and suitably qualified builder [41]. There has been much research on estimating demand surge [38,39]. However, there is no known reference for its usage in construction projects. |
| Repair time (F 07) | Repair time is inter-dependent on the cost of a project [42]. Repair time can be separated into duration and start date. Duration of repair work can be prolonged by variables like building occupancy during construction and resource availability [15]. | Repair duration has a direct relationship to preliminary item cost that impact the overall project. Although duration estimation methods are available in P-58 based models [15], these are not linked to the cost estimation process. |
| Initially unforeseen damage (F 08) | Initially, unforeseen damages are concealed earthquake damage. For example, structural columns, foundations, and services such as electrical and plumbing work are uncovered usually through destructive testing or during repair work [43,44]. | Uncovering additional damage can lead to changes in cost estimates which become apparent during rehabilitation work after CEQS [45]. P-58 methodology is capable of predicting damage from an earthquake [15]. Therefore, the P-58 methodology can be used as a method to determine the extent of earthquake damage. However, due to the probabilistic nature of this methodology, estimations can vary. |
| Changes to the final repair state (F 09) | In any construction work, the cost of construction will be related to the required final output. The final state of repairs may differ from pre-earthquake or as-built conditions during post-earthquake repair work. Changes can be instigated by building code or main stakeholders—building owners and insurance claim providers. | According to previous research, changes in the final required state or design changes may affect final repair costs [20,46,47,48]. Furthermore, different cost estimations are required for any changes in the final repair state. |
| Pre-earthquake state of the building (F 10) | Pre-earthquake conditions may not reflect as-built drawings. Such deviations can occur due to damage sustained before an earthquake (such as historical subsidence), inadequate construction work and substandard repair work. | These pre-earthquake damage is not covered by earthquake insurance-funded repair work [49]. However, pre-earthquake damage may also need to be repaired to meet statutory requirements if it is required. Therefore, additional inspections and separate cost estimations may be required as part of the scope to repair that will not be covered by insurance. Insurance claims-based repair work can have substantial impact. For example, the insurance loss reported by the CEQS was NZ $21 billion, which was more than 52% of the total loss [3]. |
| Substandard repair work (F 11) | Large-scale repairs were conducted after each earthquake and can often be repaired below the required standard. | Cretney [50], Price and Peters [51] agreed that substandard repair work was prominent after the CEQS. Substandard repair work creates additional problems, including hidden damage, repetitive work such as finishing work, demolition, secondary damage identification, and potentially further damage to the building due to comprised structural integrity. |
| Variable ID | Variable |
|---|---|
| F 01 | Consequential damage repair |
| F 02.1a | Cost of structural engineering services |
| F 02.1b | Cost of geotechnical engineering services |
| F 02.1c | Cost of land surveying services |
| F 02.2 | Cost of architectural services |
| F 02.3 | Cost of quantity surveying services |
| F 02.4a | Cost of lawyers’/advocates’ legal services |
| F 02.4b | Cost of dispute resolution facilitators’/dispute resolvers’ services |
| F 03 | Varying profit margins depending on the type of building contract |
| F 04 | Restrictions during repair (e.g., building being occupied during repair work) |
| F 05.1 | Damage from aftershocks |
| F 05.2a | Damage from earthquake-induced hazards–flood |
| F 05.2b | Damage from earthquake-induced hazards–fire |
| F 05.3 | Damage from weather conditions |
| F 06 | Price fluctuations due to change in demand for resources caused by an earthquake |
| F 07 | Duration of repairs |
| F 08 | Initially unforeseen damage |
| F 09.1 | Changes required to final repair state–to meet statutory compliance |
| F 09.2 | Changes required to final repair state–to meet stakeholder requirements |
| F 10 | Pre-earthquake state of the building |
| F 11 | Substandard initial repair work |
| Type of Validity | Description | Method of Achievement |
|---|---|---|
| Content validity | Does the questionnaire cover the required scope? | Questions were developed based on a literature review and reviews from costing professionals. |
| Construct validity | Do questions achieve the intended measurement? | Qualitative. The questions for the questionnaire were directly interpreted from the hypothesis. Furthermore, five cost estimation professionals validated the questionnaire and objective with experience in CEEDRW in the pilot survey. |
| Predictive validity | Ability to make accurate predictions from the data collected? | The research did not intend to achieve predictive validity. Not knowing the population and use non-random sampling prevents achieving. |
| Face validity | Evaluation with non-experts to check the understanding? | Achieved by giving the questionnaire to three non-experts in the pilot survey for comments. |
| Type of Bias | Description | Reason of Unavoidability |
|---|---|---|
| Selection bias | Occurs when sample does not represent the population | The population could not be clearly identified; thus random sampling could not be used. |
| Convivence bias | Occurs when participants were selected based on convivence | The types of respondents required for the study were specialised and hard to find. Therefore, purposing sampling was used. This method would lead to some forms of convivence-based respondent selection. |
| Volunteer bias | Occurs when participants are people who volunteer | Since the study cannot be forced, respondents had to be volunteers. |
| Non-response bias | Occurs when invited respondents did not respond | Since the study was voluntary, there were potential respondents that did not respond to the request. Even if participants were reminded several times, there were instances where this could not be avoided. |
| Response bias | Participants change the responses because they want to change the outcome | Participants were requested to be true, but each respondent has the ability to deviate from the truth. Furthermore, respondents tend to provide positive feedback rather than the truth. |
| Wording bias | Occurs through inaccurate wording or leading questions | Inaccurate wording or leading questions were reduced through the pilot survey. However, there could be residual wording bias. |
| Rank | Variables Affecting CEEDRW | Percentage Considered in Past CEEDRW | Weighted Average | RII | Standard Deviation |
|---|---|---|---|---|---|
| 1 | F 02.1a—Cost of structural engineering services | 85% | 4.52 | 0.90 | 0.98 |
| 2 | F 09.1—Changes required to final repair state—to meet statutory compliance | 95% | 4.45 | 0.89 | 0.87 |
| 3 | F 02.1b—Cost of geotechnical engineering services | 83% | 4.27 | 0.85 | 1.04 |
| 4 | F 08—Initially unforeseen damage | 86% | 4.22 | 0.84 | 1.15 |
| 5 | F 01—Consequential damage repair | 92% | 4.02 | 0.80 | 1.07 |
| 6 | F 07—Duration of repairs | 88% | 3.84 | 0.77 | 1.13 |
| 7 | F 06—Price fluctuations due to change in demand for resources caused by an earthquake | 78% | 3.82 | 0.76 | 1.19 |
| 8 | F 02.2—Cost of architectural services | 83% | 3.74 | 0.75 | 1.22 |
| 9 | F 02.1c—Cost of land surveying services | 57% | 3.73 | 0.75 | 1.17 |
| 10 | F 11—Substandard initial repair work | 65% | 3.71 | 0.74 | 1.28 |
| 11 | F 04—Restrictions during repair (e.g., Building being occupied during repair work) | 68% | 3.70 | 0.74 | 1.39 |
| 12 | F 10—Pre-earthquake state of the building | 75% | 3.67 | 0.73 | 1.39 |
| 13 | F 02.3—Cost of quantity surveying services | 79% | 3.23 | 0.65 | 1.33 |
| 14 | F 03—Varying profit margins depending on the type of building contract | 64% | 2.98 | 0.60 | 1.33 |
| 15 | F 09.2—Changes required to final repair state—to meet stakeholder requirements | 55% | 2.96 | 0.59 | 1.04 |
| 16 | F 05.1—Damage from aftershocks | 45% | 2.78 | 0.56 | 1.16 |
| 17 | F 05.3—Damage from weather conditions | 64% | 2.77 | 0.55 | 0.97 |
| 18 | F 05.2a—Damage from earthquake-induced hazards—flood | 68% | 2.67 | 0.53 | 0.78 |
| 19 | F 05.2b—Damage from earthquake-induced hazards—fire | 60% | 2.59 | 0.52 | 1.27 |
| 20 | F 02.4a—Cost of lawyers’/advocates’ legal services | 20% | 2.46 | 0.49 | 1.23 |
| 21 | F 02.4b—Cost of dispute resolution facilitators’/dispute resolvers’ services | 16% | 2.46 | 0.49 | 1.58 |
| Initial Eigenvalues | Extraction Sums of Squared Loadings | Rotation Sums of Squared Loadings | ||||||
|---|---|---|---|---|---|---|---|---|
| Total | % of Variance | Cumulative % | Total | % of Variance | Cumulative % | Total | % of Variance | Cumulative % |
| 6.325 | 30.120 | 30.120 | 6.325 | 30.120 | 30.120 | 3.236 | 15.408 | 15.408 |
| 2.213 | 10.537 | 40.657 | 2.213 | 10.537 | 40.657 | 2.892 | 13.771 | 29.179 |
| 1.803 | 8.588 | 49.245 | 1.803 | 8.588 | 49.245 | 2.213 | 10.538 | 39.717 |
| 1.434 | 6.830 | 56.075 | 1.434 | 6.830 | 56.075 | 2.060 | 9.810 | 49.527 |
| 1.304 | 6.209 | 62.284 | 1.304 | 6.209 | 62.284 | 2.001 | 9.528 | 59.055 |
| 1.073 | 5.108 | 67.392 | 1.073 | 5.108 | 67.392 | 1.751 | 8.337 | 67.392 |
| 0.974 | 4.639 | 72.031 | ||||||
| 0.852 | 4.057 | 76.088 | ||||||
| Component (Factor) | Eigenvalues from Actual Data Using PCA (A) | Random Order Eigenvalues from Parallel Analysis (B) | (A–B) | Decision on Factor |
|---|---|---|---|---|
| 1 | 6.33 | 2.15 | 4.17 | Accepted |
| 2 | 2.21 | 1.88 | 0.33 | Accepted |
| 3 | 1.80 | 1.75 | 0.05 | Accepted |
| 4 | 1.43 | 1.62 | −0.18 | Rejected |
| 5 | 1.30 | 1.50 | −0.19 | Rejected |
| 6 | 1.07 | 1.41 | −0.33 | Rejected |
| Variable | Component | |||||
|---|---|---|---|---|---|---|
| F10 | F02 | F13 | F03 | F01 | F06 | |
| F 05.2b—Damage from earthquake-induced hazards—fire | 0.902 | |||||
| F 05.2a—Damage from earthquake-induced hazards—flood | 0.879 | |||||
| F 05.3—Damage from weather conditions | 0.847 | |||||
| F 05.1—Damage from aftershocks | 0.682 | |||||
| F 02.1a—Cost of structural engineering services | 0.859 | |||||
| F 02.1b—Cost of geotechnical engineering services | 0.838 | |||||
| F 02.2—Cost of architectural services | 0.689 | 0.463 | ||||
| F 02.3—Cost of quantity surveying services | 0.621 | 0.407 | ||||
| F 02.1c—Cost of land surveying services | 0.606 | 0.424 | ||||
| F 10—Pre-earthquake state of the building | 0.696 | |||||
| F 11—Substandard initial repair work | 0.666 | |||||
| F 09.1—Changes required to final repair state—to meet statutory compliance | 0.631 | 0.380 | ||||
| F 08—Initially unforeseen damage | 0.526 | |||||
| F 06—Price fluctuations due to change in demand for resources as a result of an earthquake | 0.417 | 0.382 | ||||
| F 04—Restrictions during repair | 0.690 | |||||
| F 07—Duration of repairs | 0.685 | 0.405 | ||||
| F 01—Consequential damage repair | 0.428 | 0.567 | ||||
| F 02.4a—Cost of lawyers’/advocates’ legal services | 0.881 | |||||
| F 02.4b—Cost of dispute resolution facilitators’/dispute resolvers’ services | 0.806 | |||||
| F 03—Varying profit margins depending on the type of building contract | 0.772 | |||||
| F 09.2—Changes required to final repair state—to meet stakeholder requirements | 0.694 | |||||
Publisher’s Note: MDPI stays neutral with regard to jurisdictional claims in published maps and institutional affiliations. |
© 2021 by the authors. Licensee MDPI, Basel, Switzerland. This article is an open access article distributed under the terms and conditions of the Creative Commons Attribution (CC BY) license (https://creativecommons.org/licenses/by/4.0/).
Share and Cite
Kahandawa, R.K.A.V.D.; Domingo, N.D.; Chawynski, G.; Uma, S.R. Earthquake Damage Repair Loss Estimation in New Zealand: What Other Variables Are Essential Based on Experts’ Opinions? Buildings 2021, 11, 385. https://doi.org/10.3390/buildings11090385
Kahandawa RKAVD, Domingo ND, Chawynski G, Uma SR. Earthquake Damage Repair Loss Estimation in New Zealand: What Other Variables Are Essential Based on Experts’ Opinions? Buildings. 2021; 11(9):385. https://doi.org/10.3390/buildings11090385
Chicago/Turabian StyleKahandawa, Ravindu K. A. V. D., Niluka D. Domingo, Gregory Chawynski, and S. R. Uma. 2021. "Earthquake Damage Repair Loss Estimation in New Zealand: What Other Variables Are Essential Based on Experts’ Opinions?" Buildings 11, no. 9: 385. https://doi.org/10.3390/buildings11090385