Environmental Product Declarations of Structural Wood: A Review of Impacts and Potential Pitfalls for Practice

 and
and
Abstract
:1. Introduction
- What is the availability of data from third-party verified EN 15804 EPDs on structural wood?
- Which environmental impacts do the EPDs report, and what affects the comparability of the EPDs?
- How may the EPDs be used for informing the building design process, and which potential pitfalls should users be aware of?
2. Methods
2.1. Data Collection Process
2.2. Data Extraction Criteria
2.3. Exclusion Criteria
- Sawn timber: Timber cut from logs in different sizes, shapes, and different types of wood.
- Glued laminated timber (glulam): Glued laminated timber comprised of multiple layers of timber bonded together with an adhesive to form structural beams.
- Cross Laminated Timber (CLT): Cross laminated timber comprised of multiple layers of wood panel bonded together perpendicular to one another with an adhesive to form a uniform wood panel with structural properties.
- Laminated Veneer Lumber (LVL): Laminated veneer lumber comprised of multiple layers of thin wood bonded together with an adhesive to form structural elements, such as beams.
2.4. Data Normalization
2.5. Uncertainty Assessment
- Manufacturer specific.
- Facility specific.
- Product specific.
- Time specific.
- Supply chain specific.
3. Results
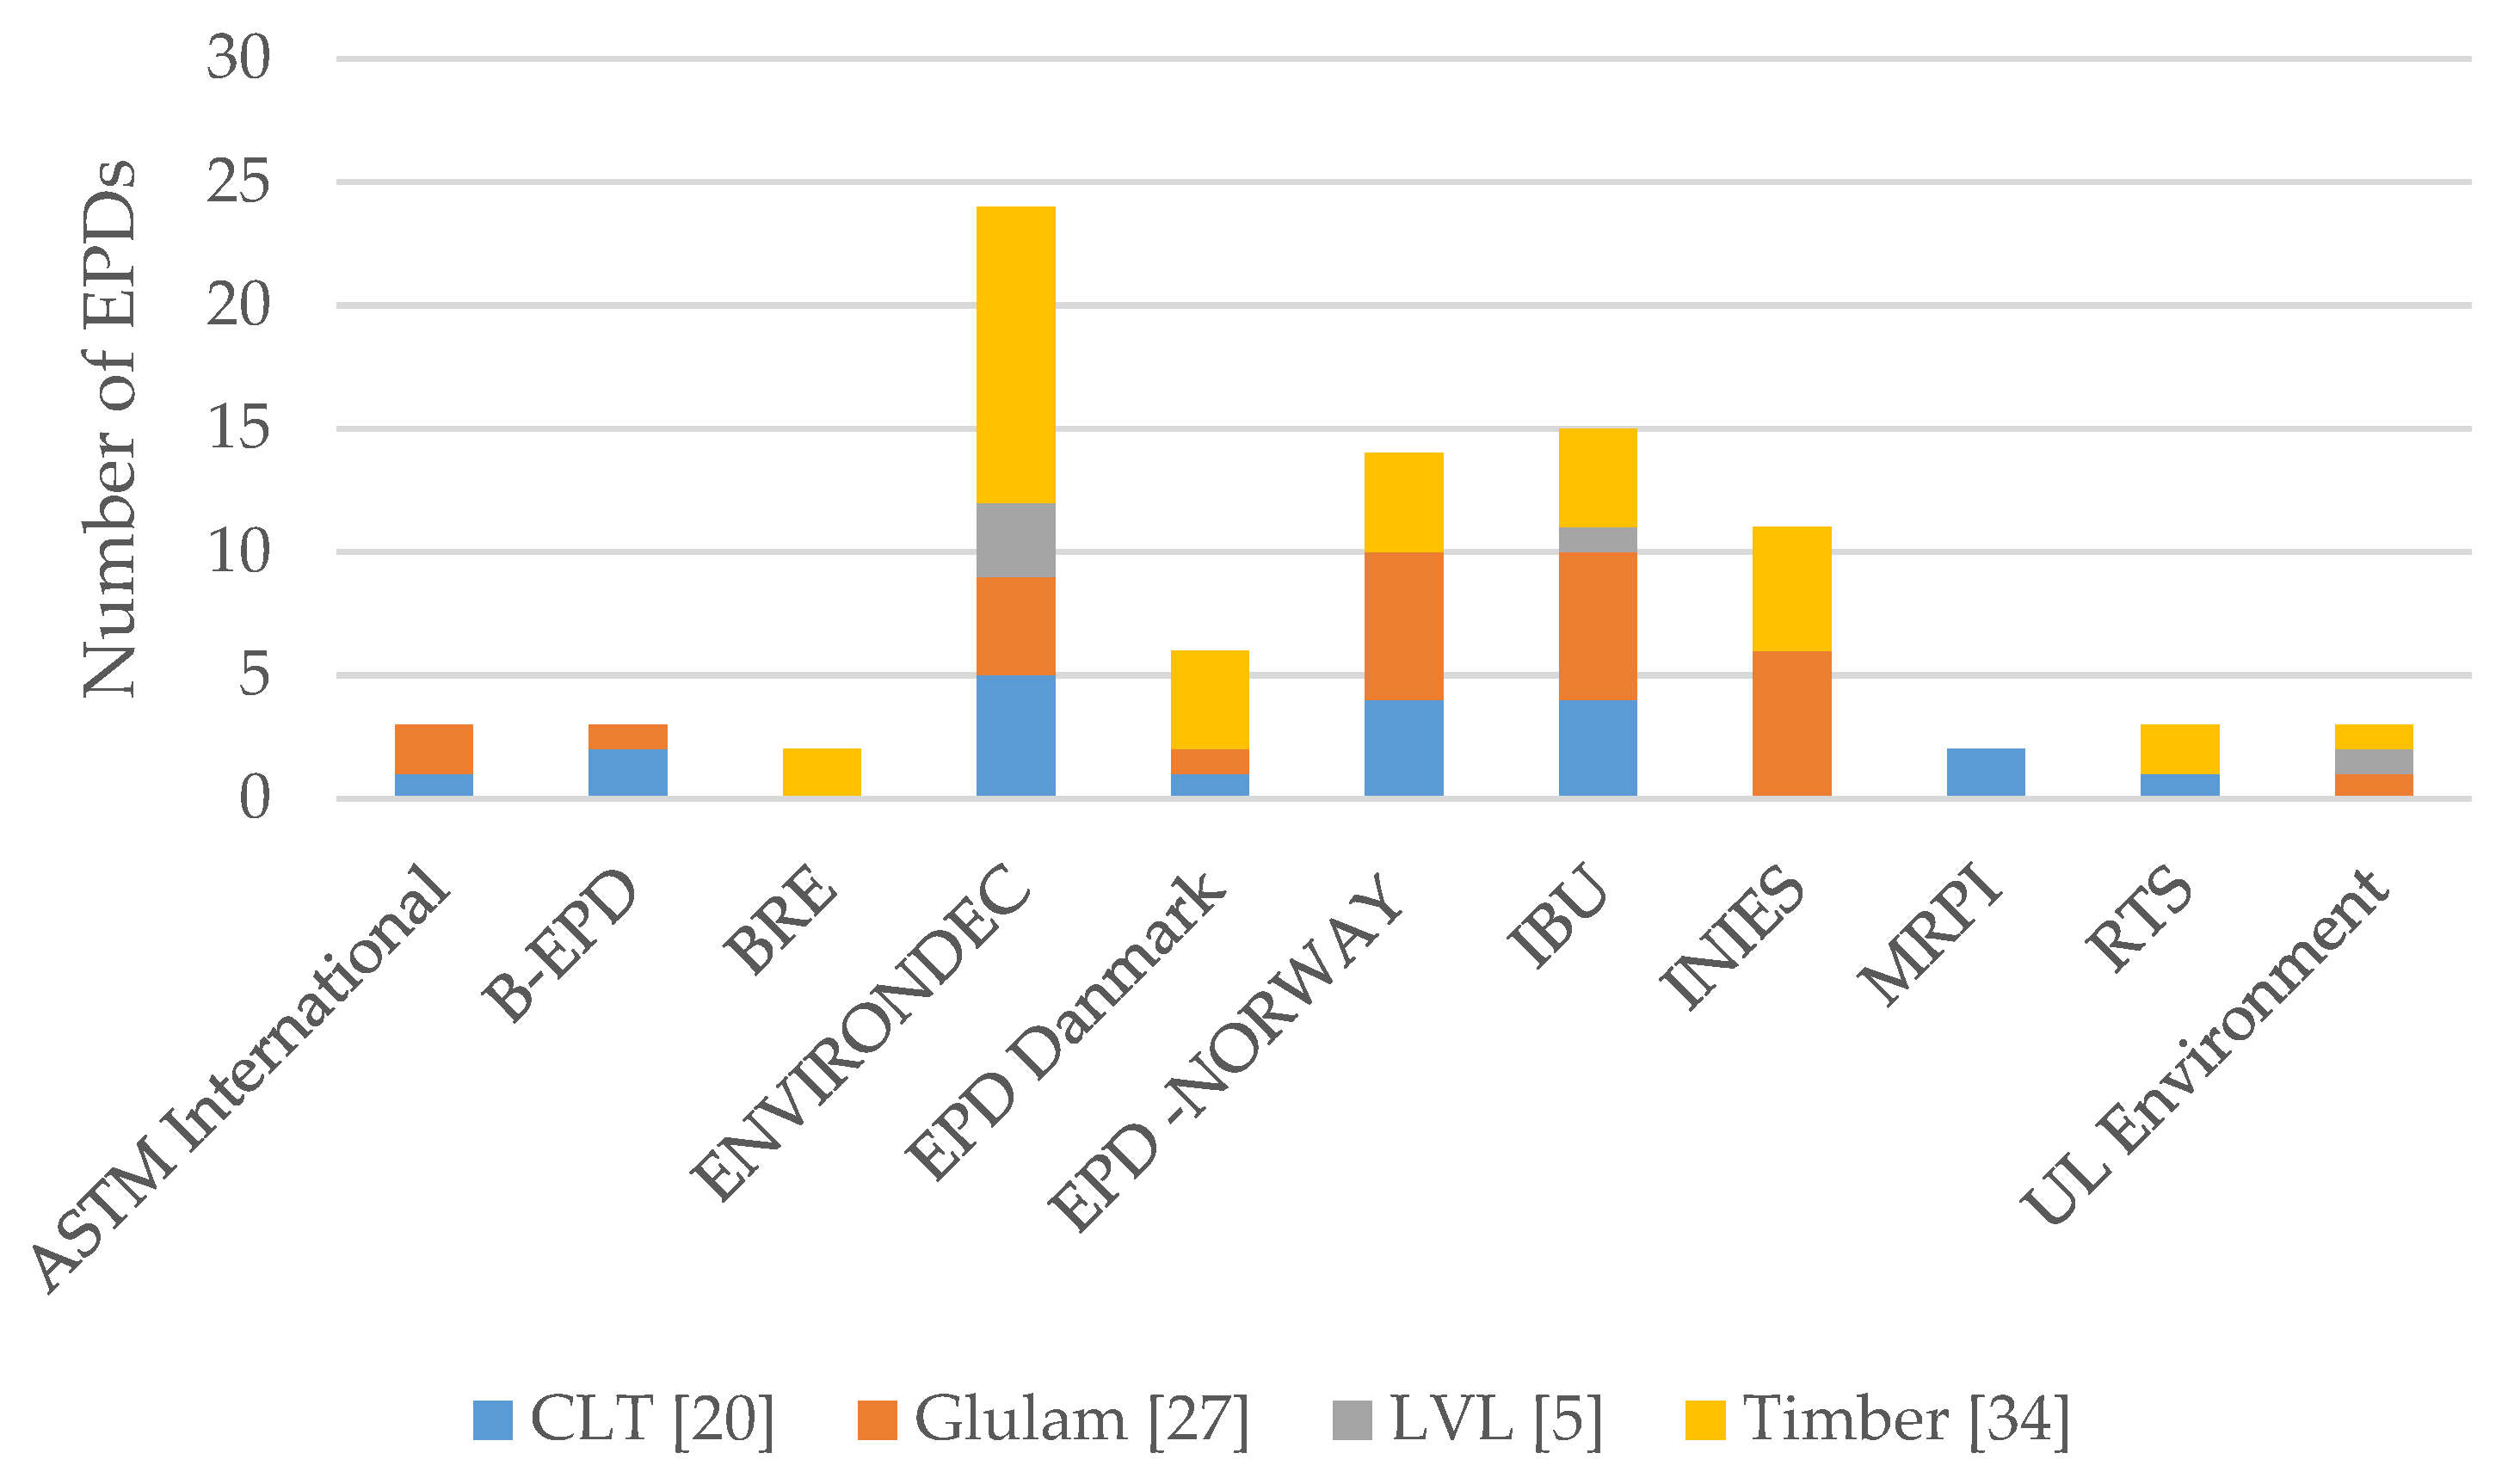
3.1. Characteristics of EPDs on Structural Wood
3.1.1. Validity of EPDs
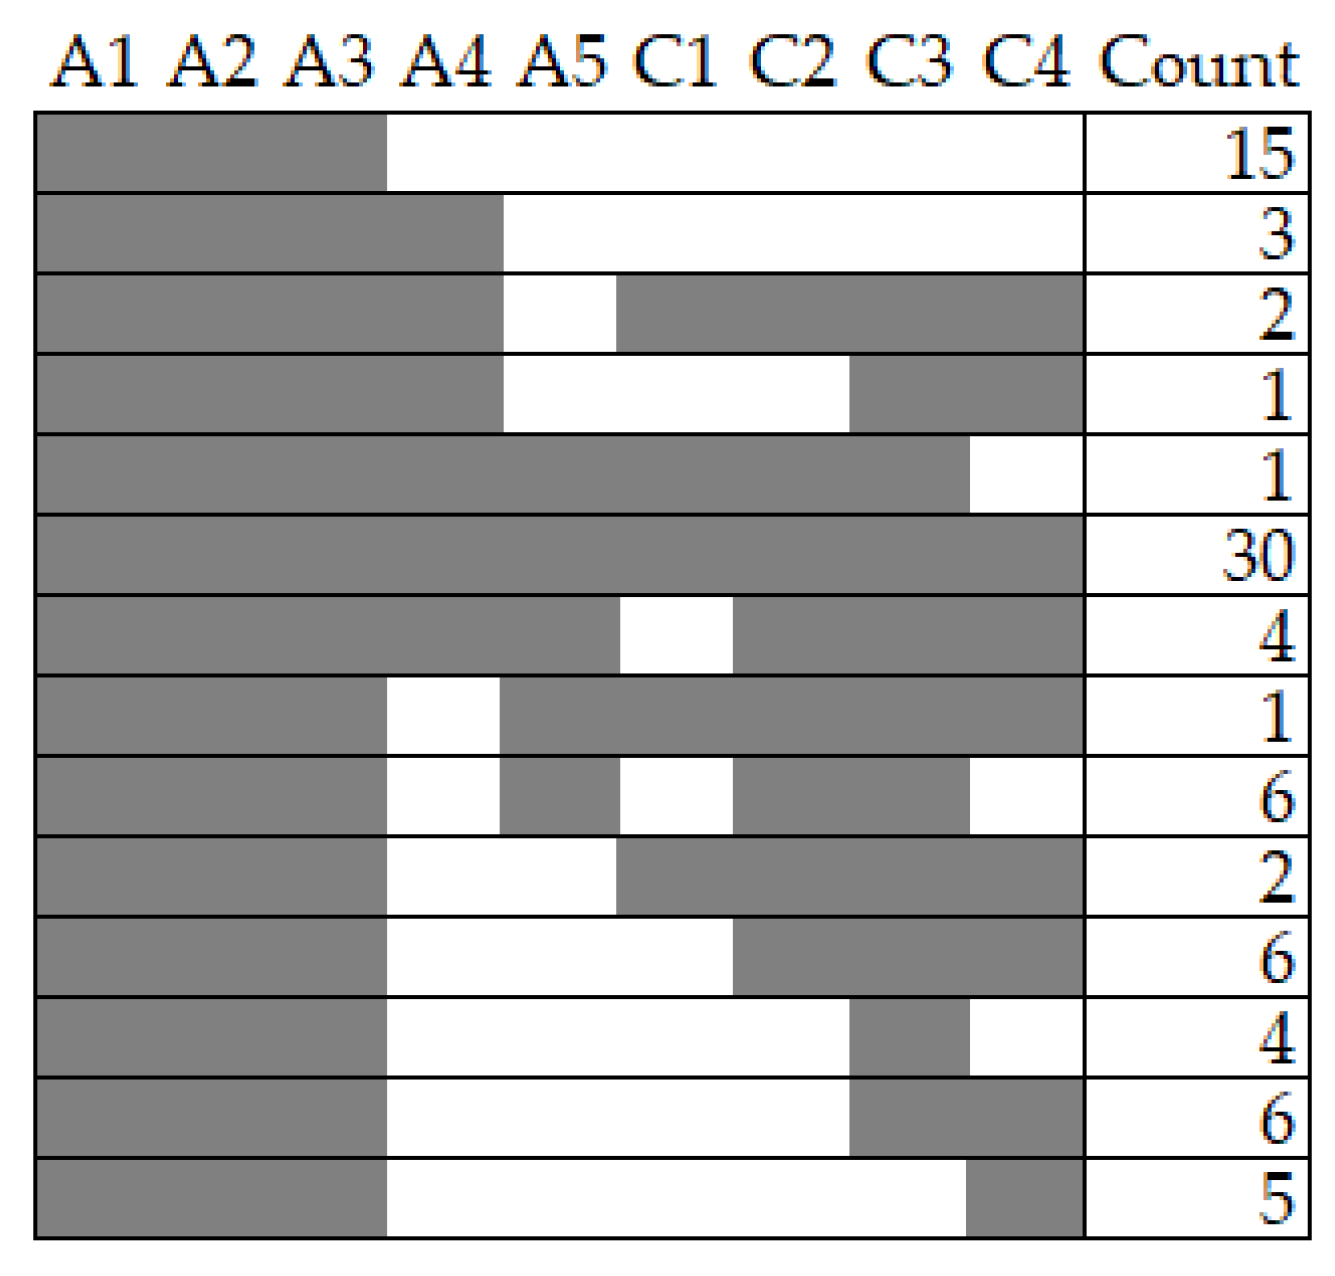
3.1.2. Scope of EPDs
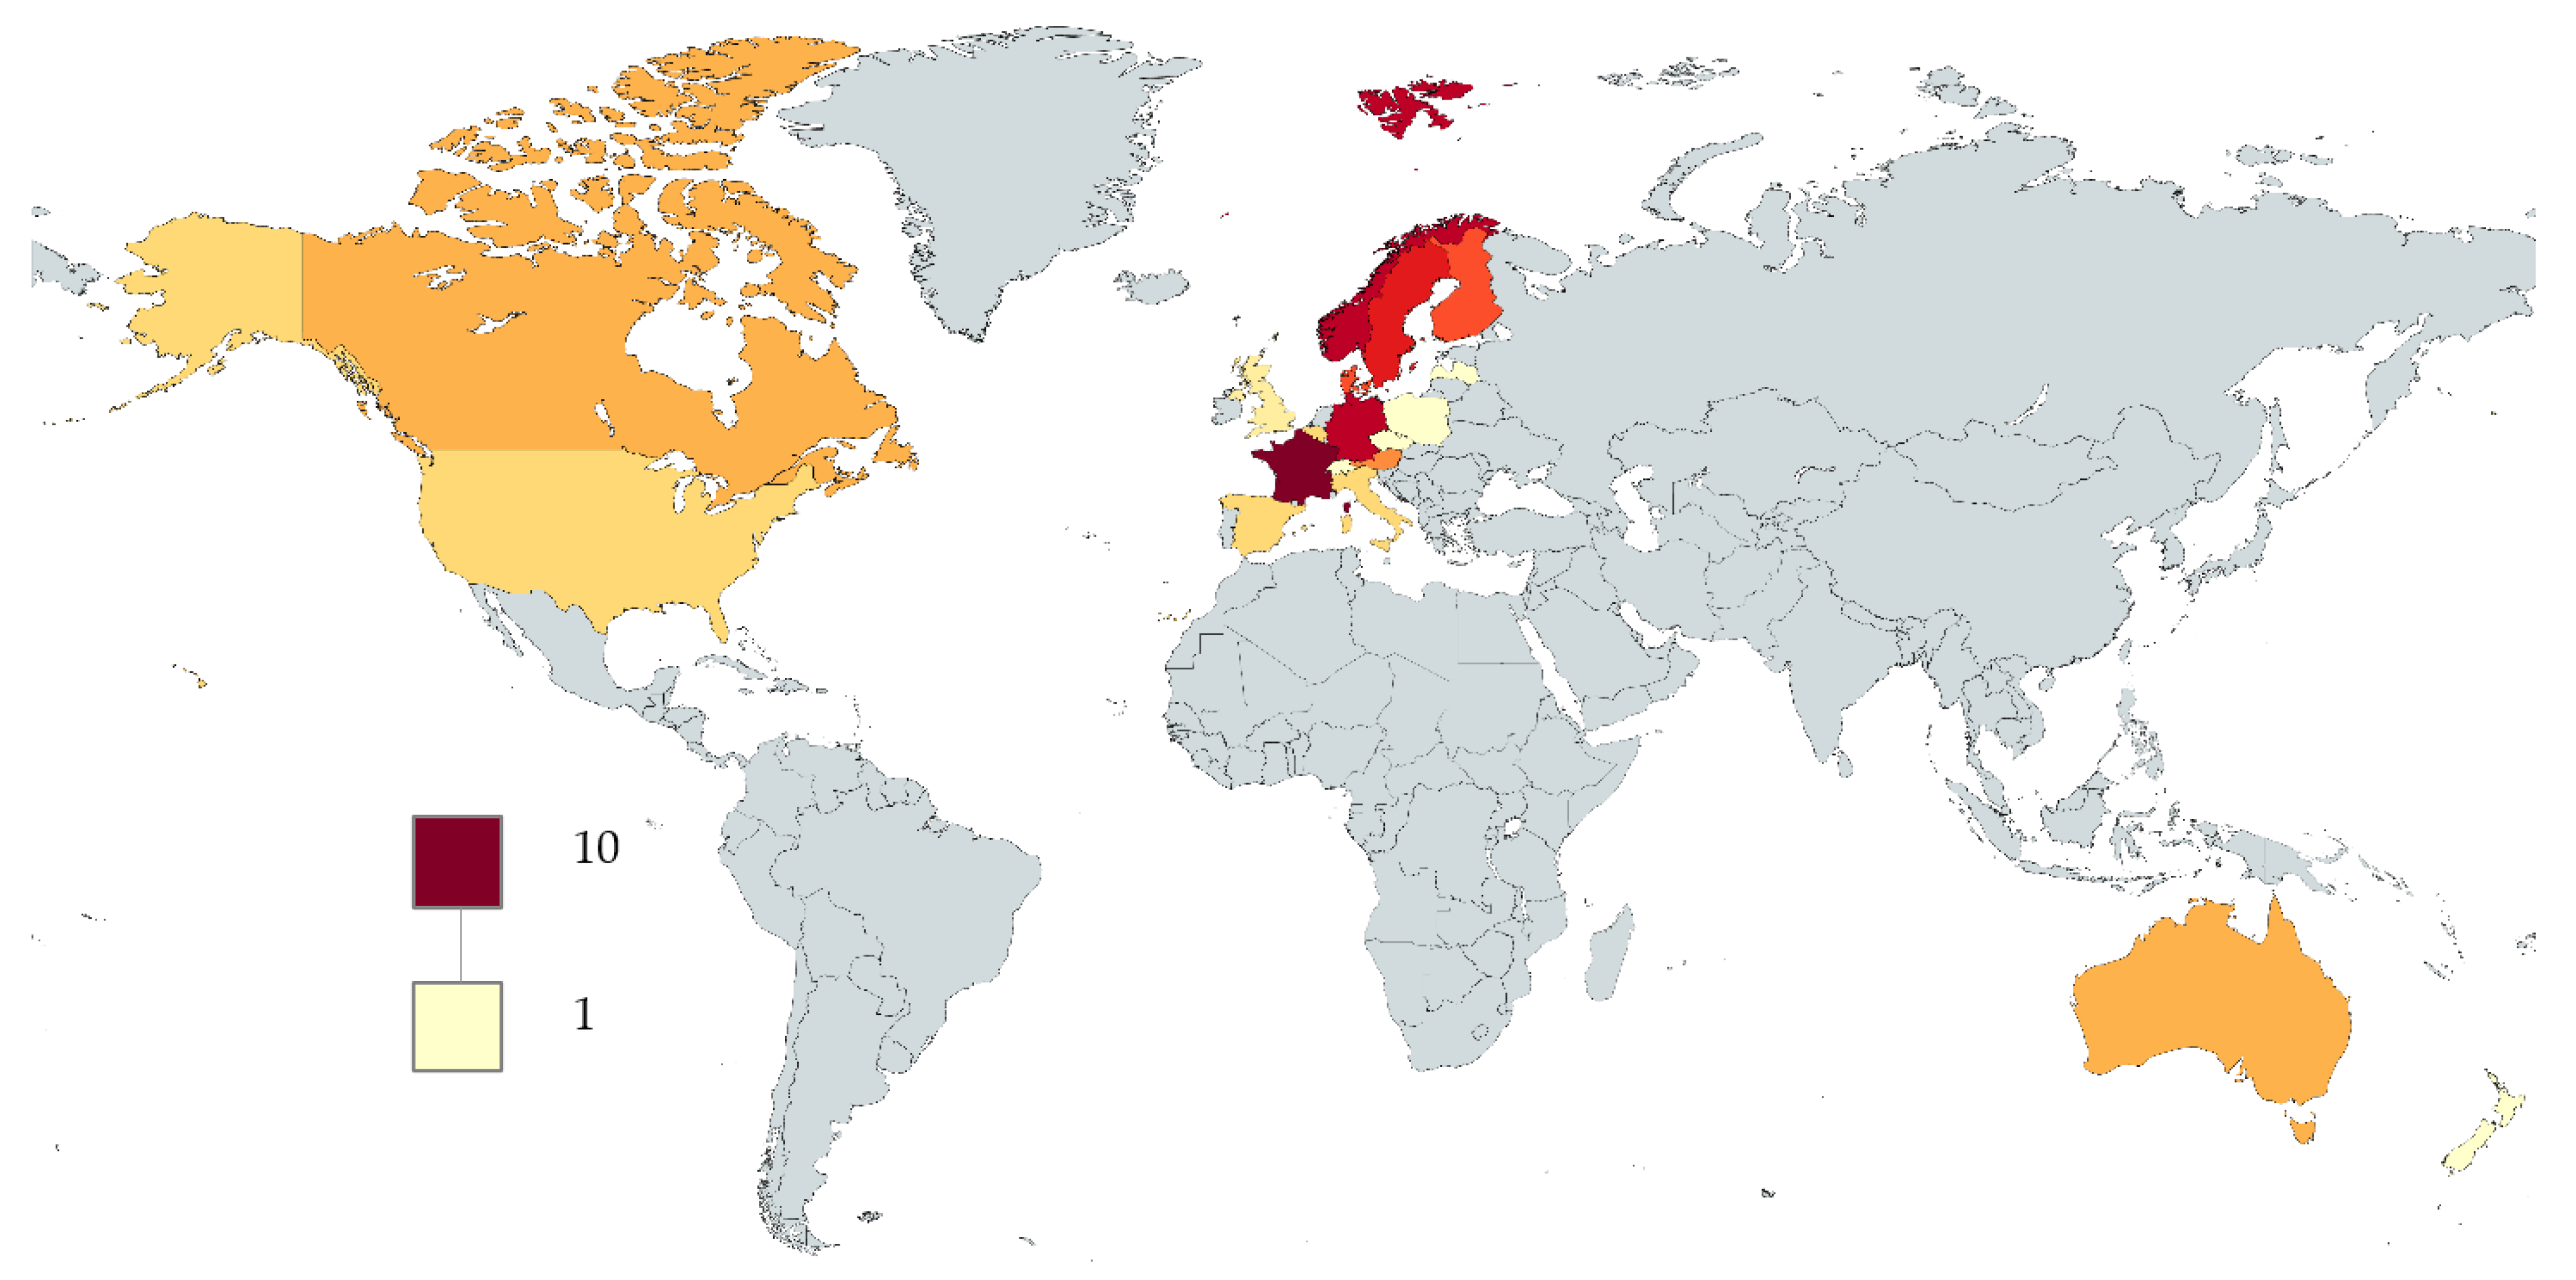
3.1.3. Geographical Coverage of EPDs
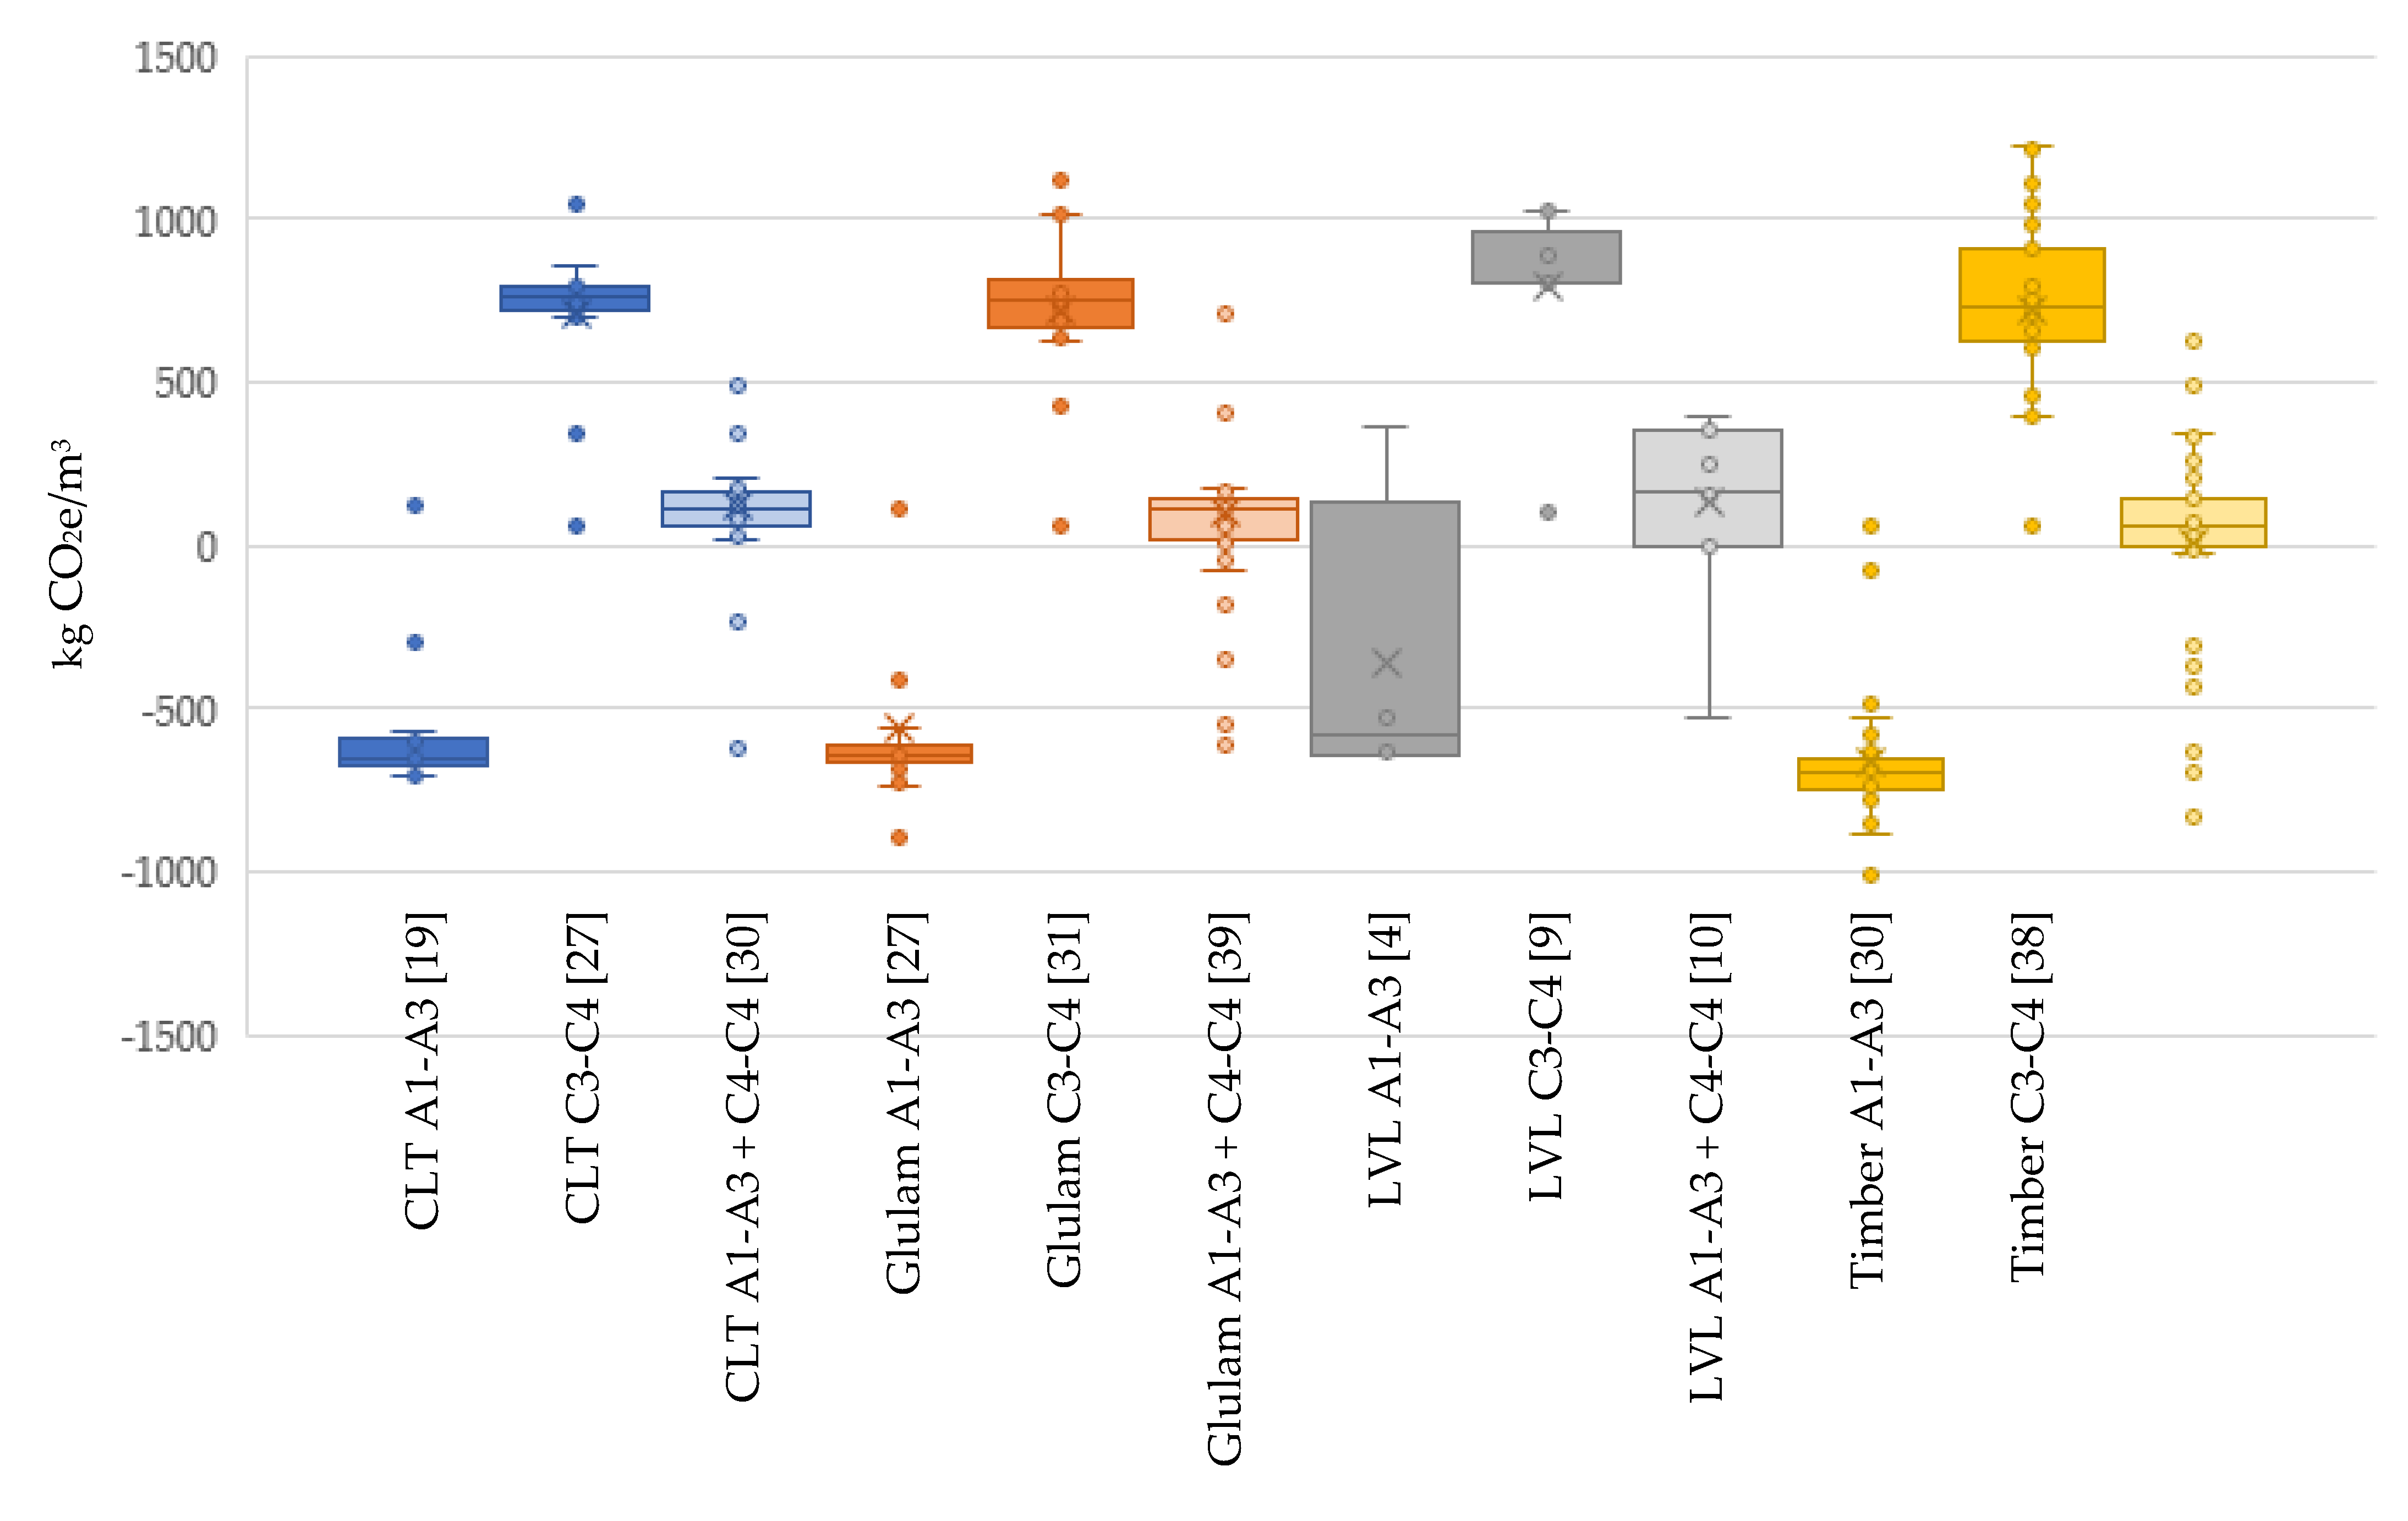
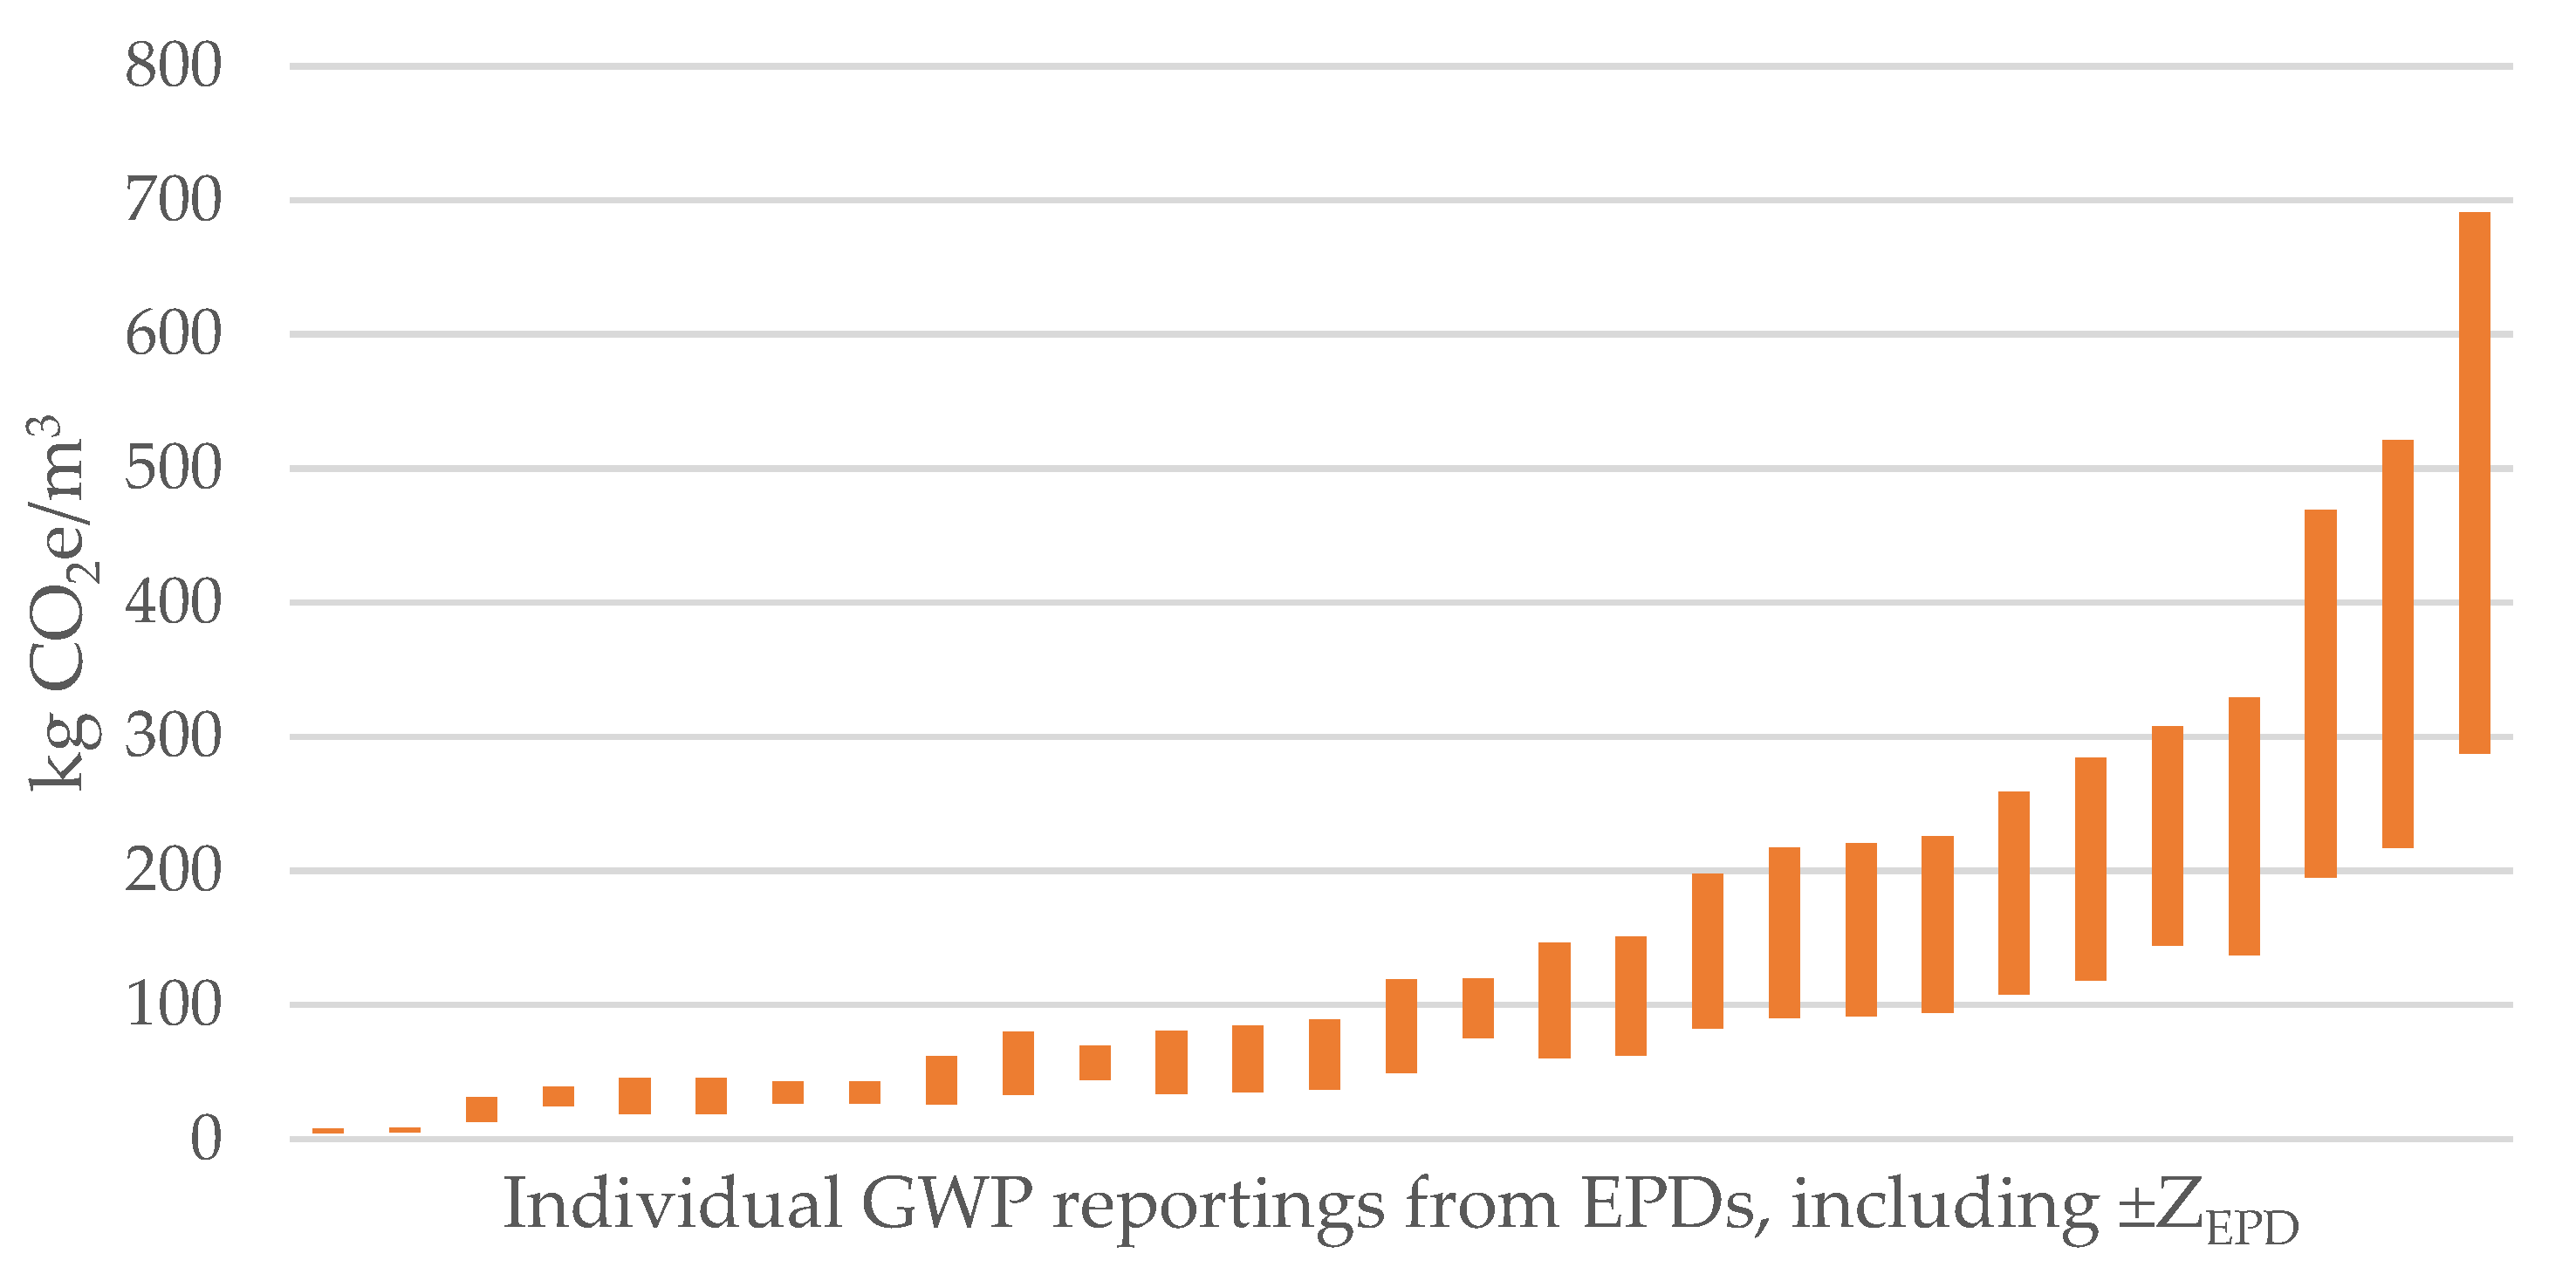
3.2. Reported Environmental Impacts—GWP
- For A1–A3: All unique products are included, i.e., unique production impacts reported by the EPD sample.
- For C3–C4: All individual scenarios for EoL are included. One unique product may have up to five EoL scenarios
- For A1–A3–C3–C4: All individual scenarios are included, confer C3–C4 above. In cases where only cradle-to-gate impacts are reported, including biogenic CO2, the biogenic CO2 is counterbalanced in a manual step based on the reported (or estimated) biogenic CO2. Details can be found in the methods section about data normalization.
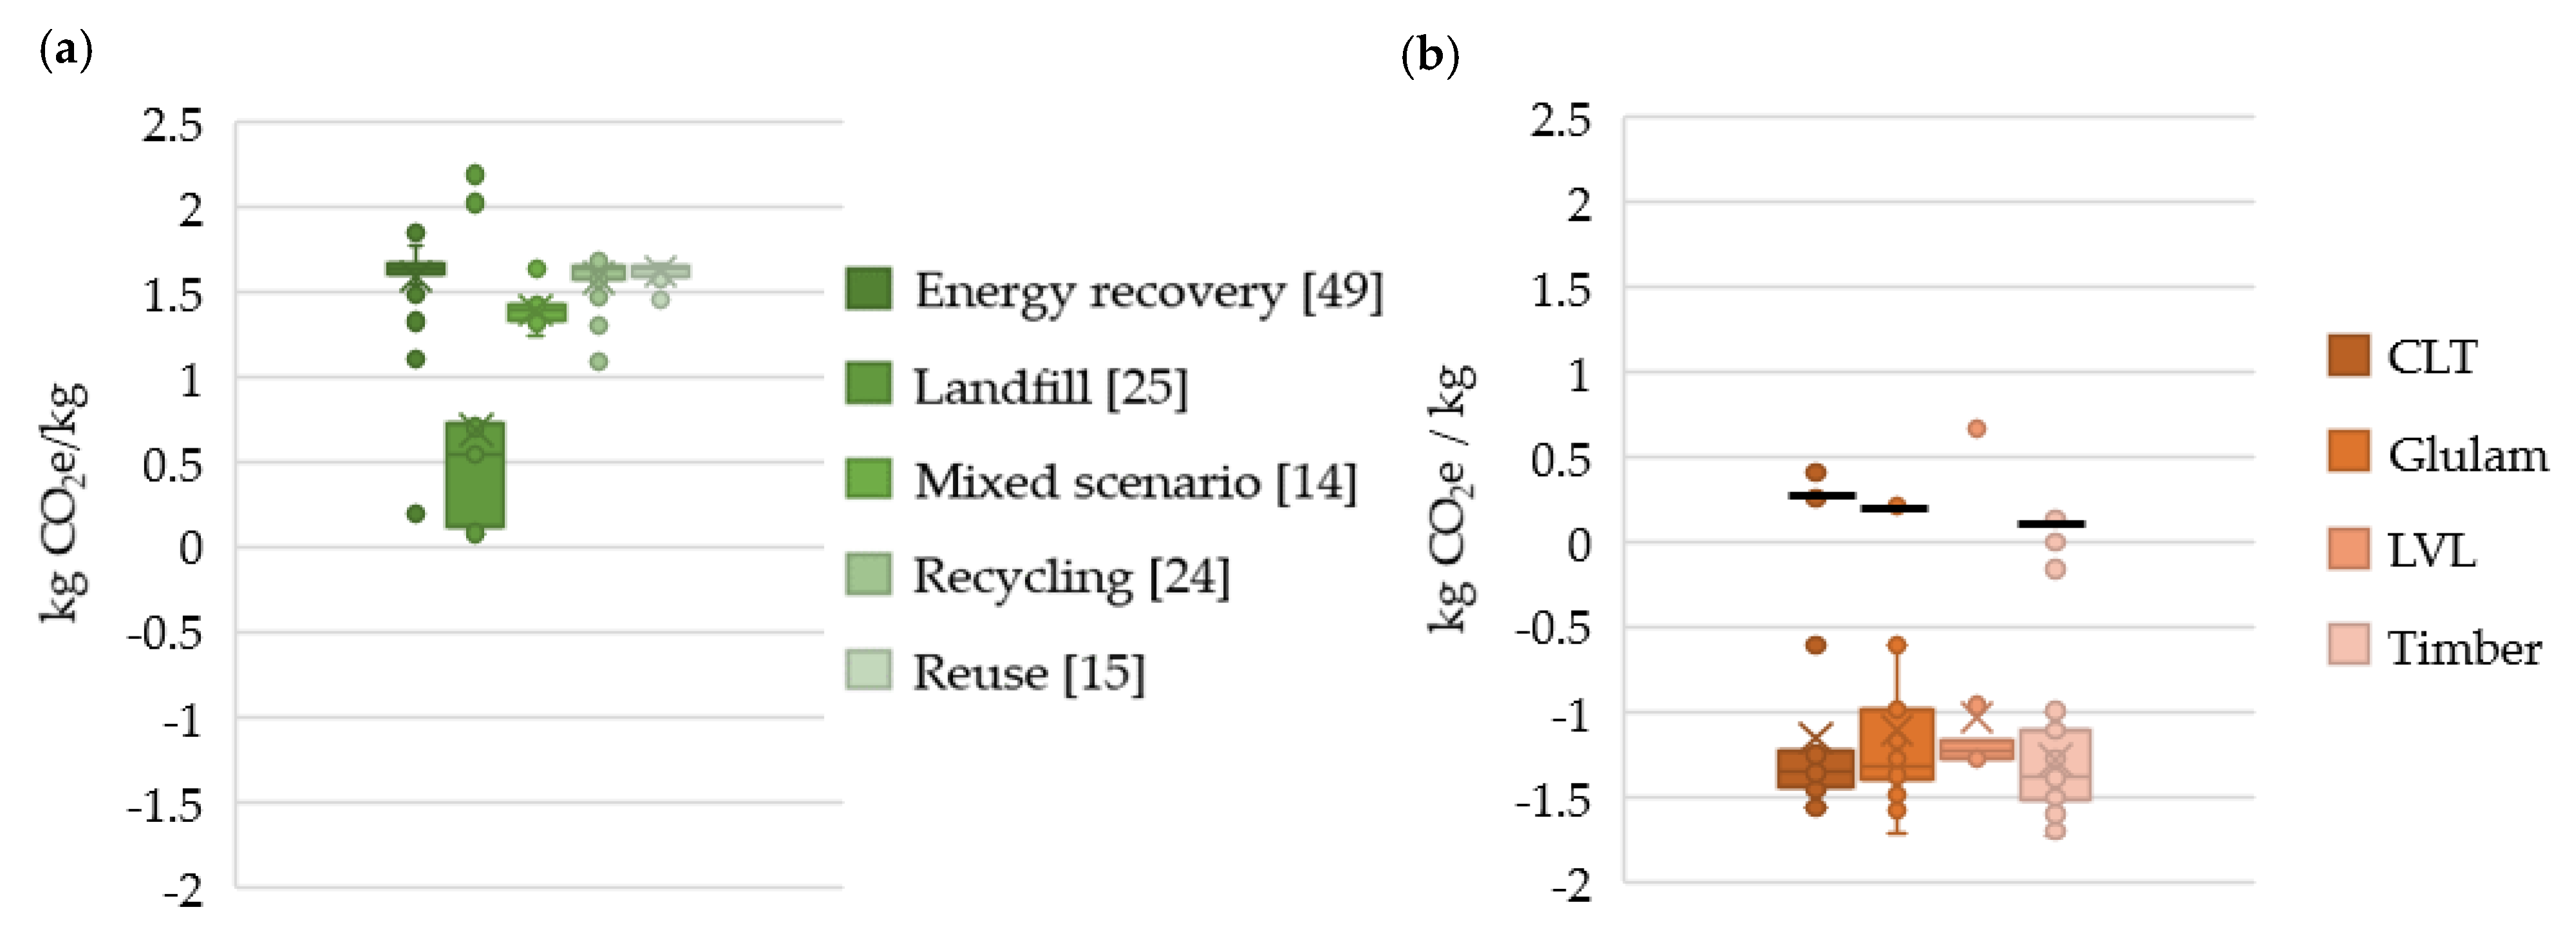
Variations Due to Density and EoL
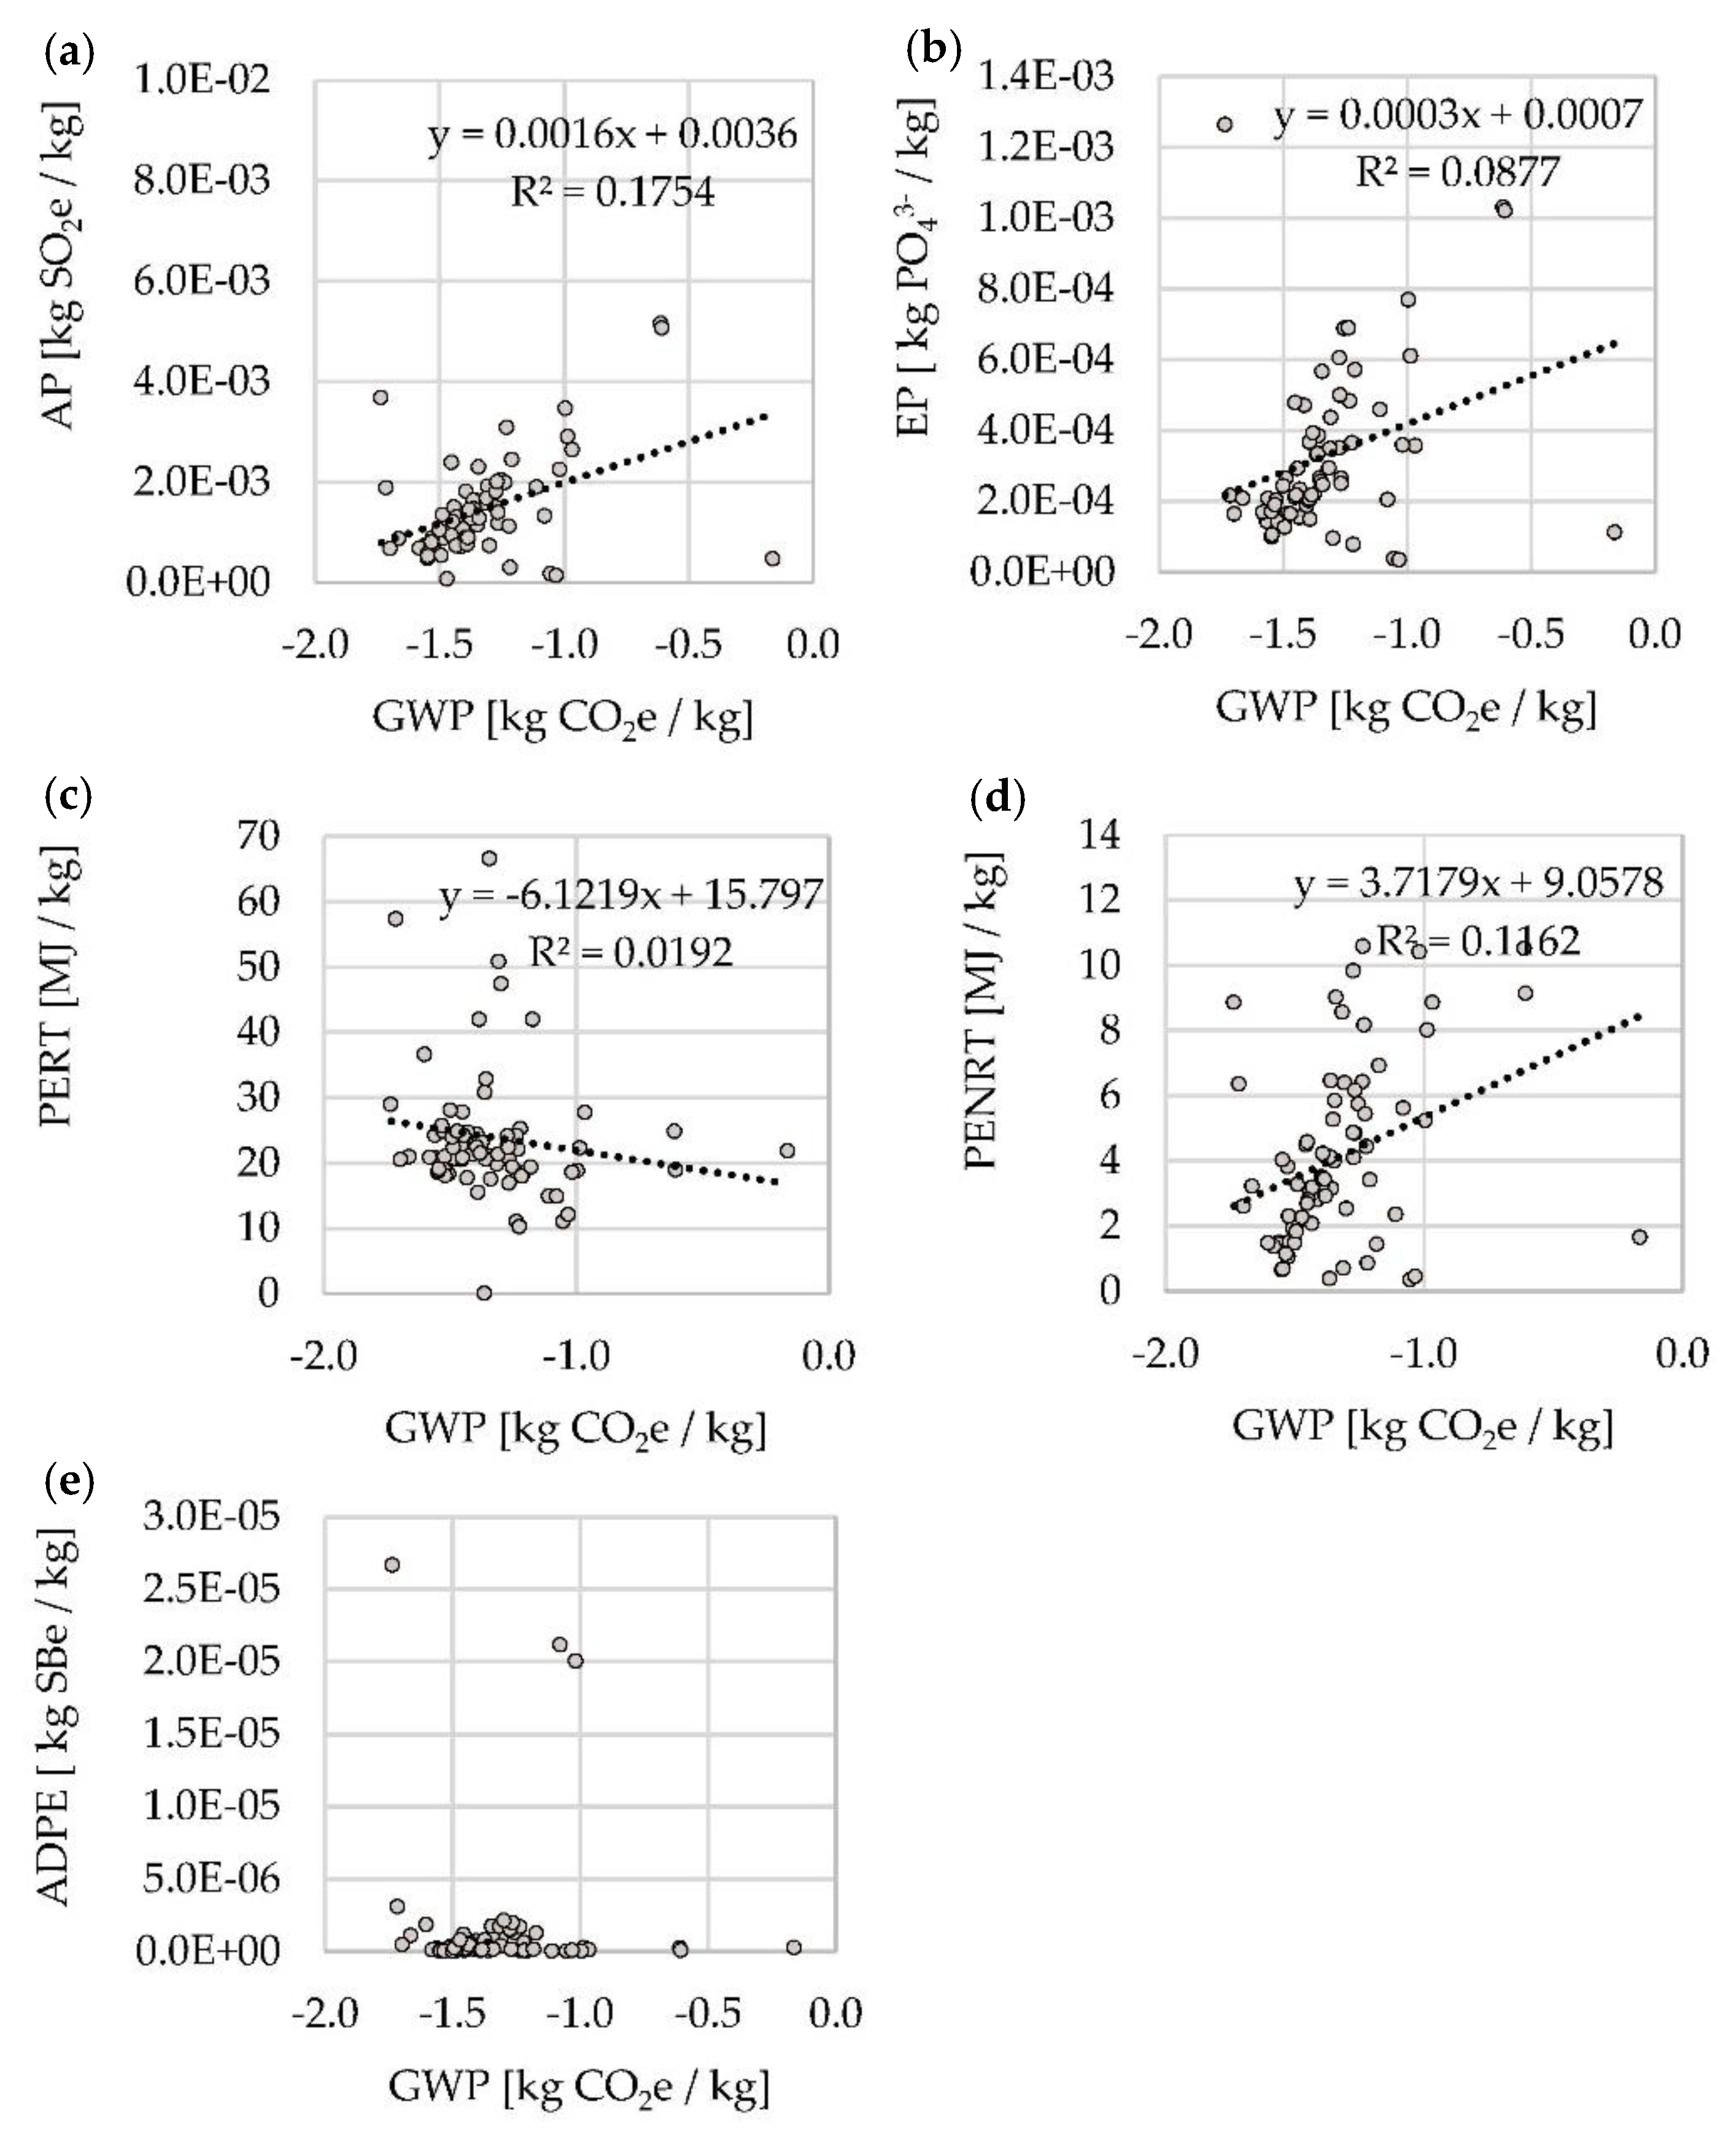
3.3. Reported Environmental Impacts—Other Than GWP
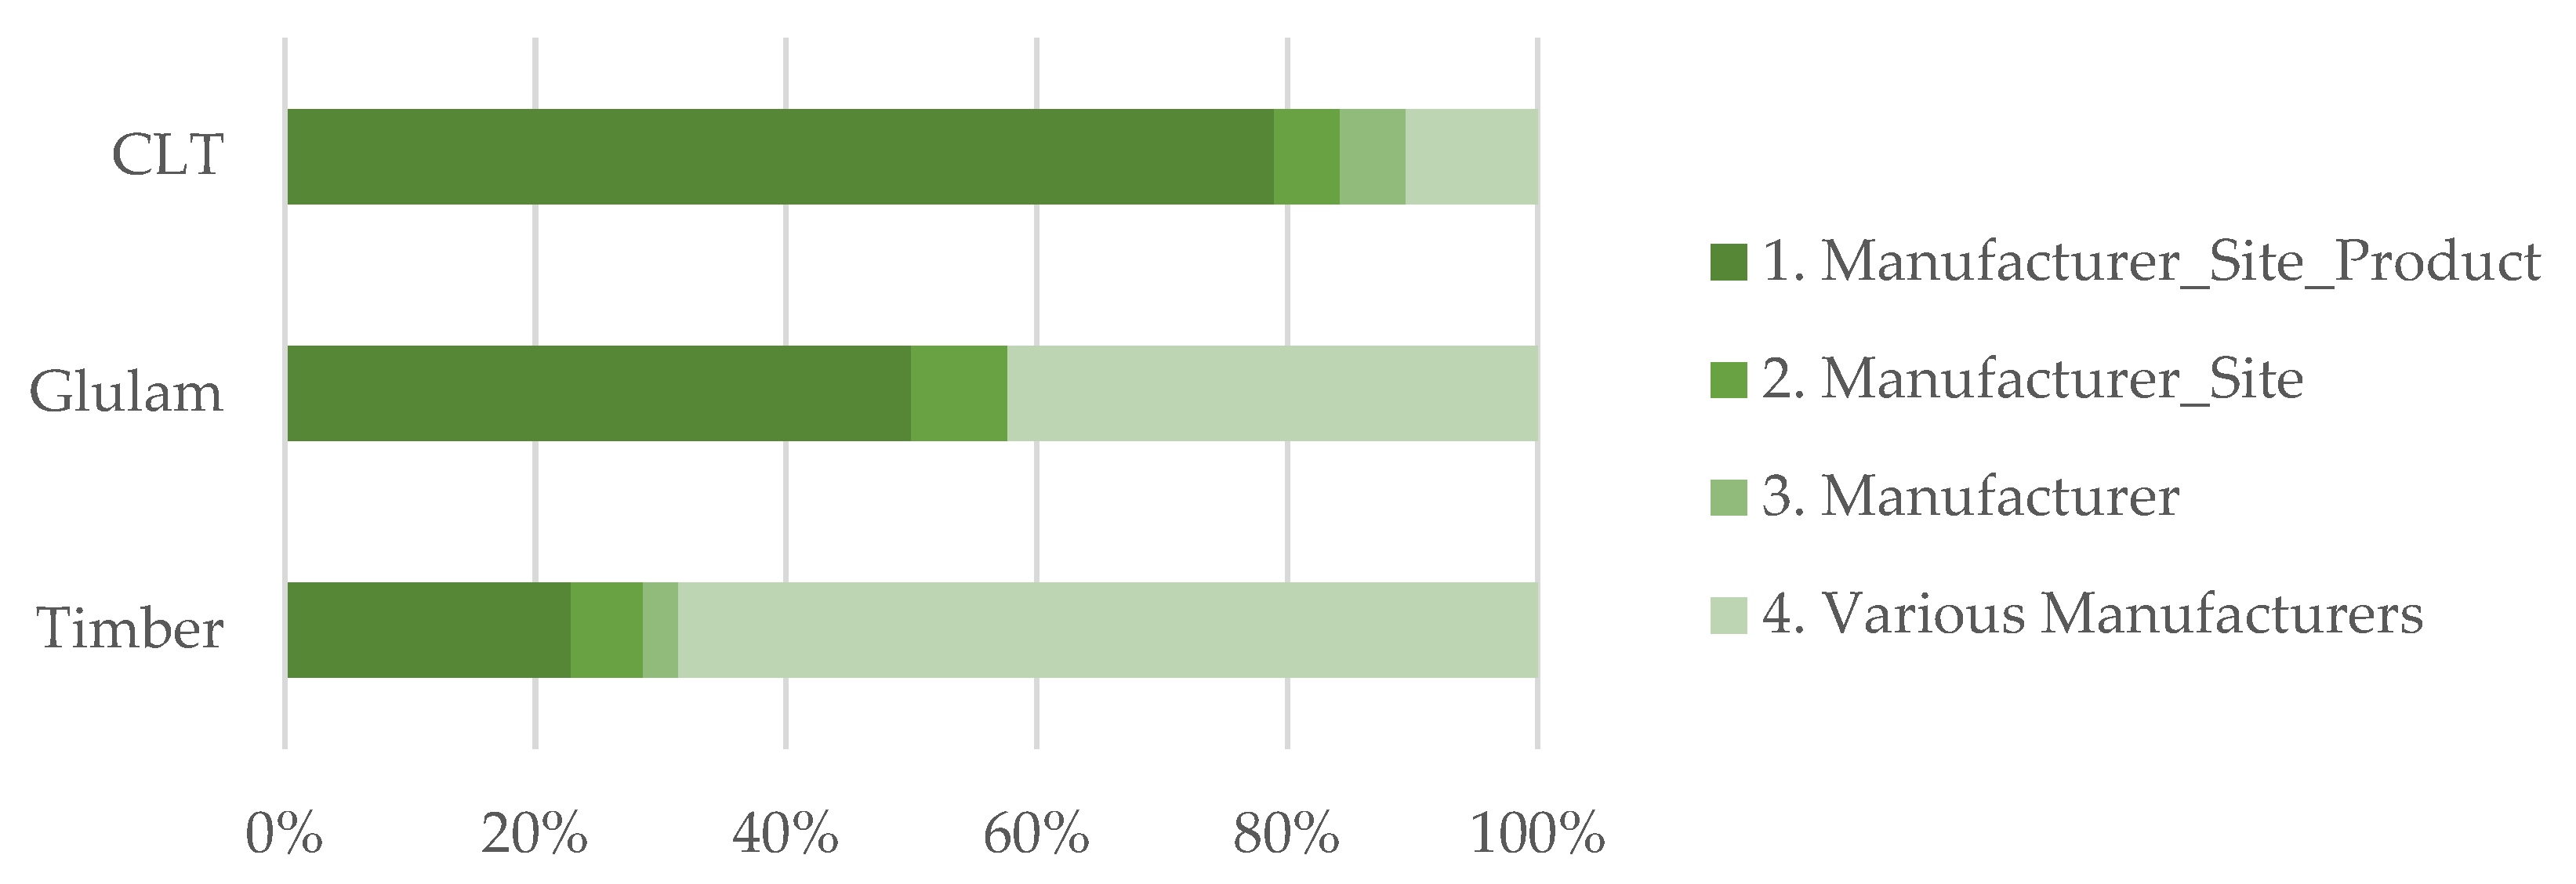
3.4. Uncertainty Assessment of EPD Sample
4. Discussion
4.1. Implications for Use and Development of EPDs
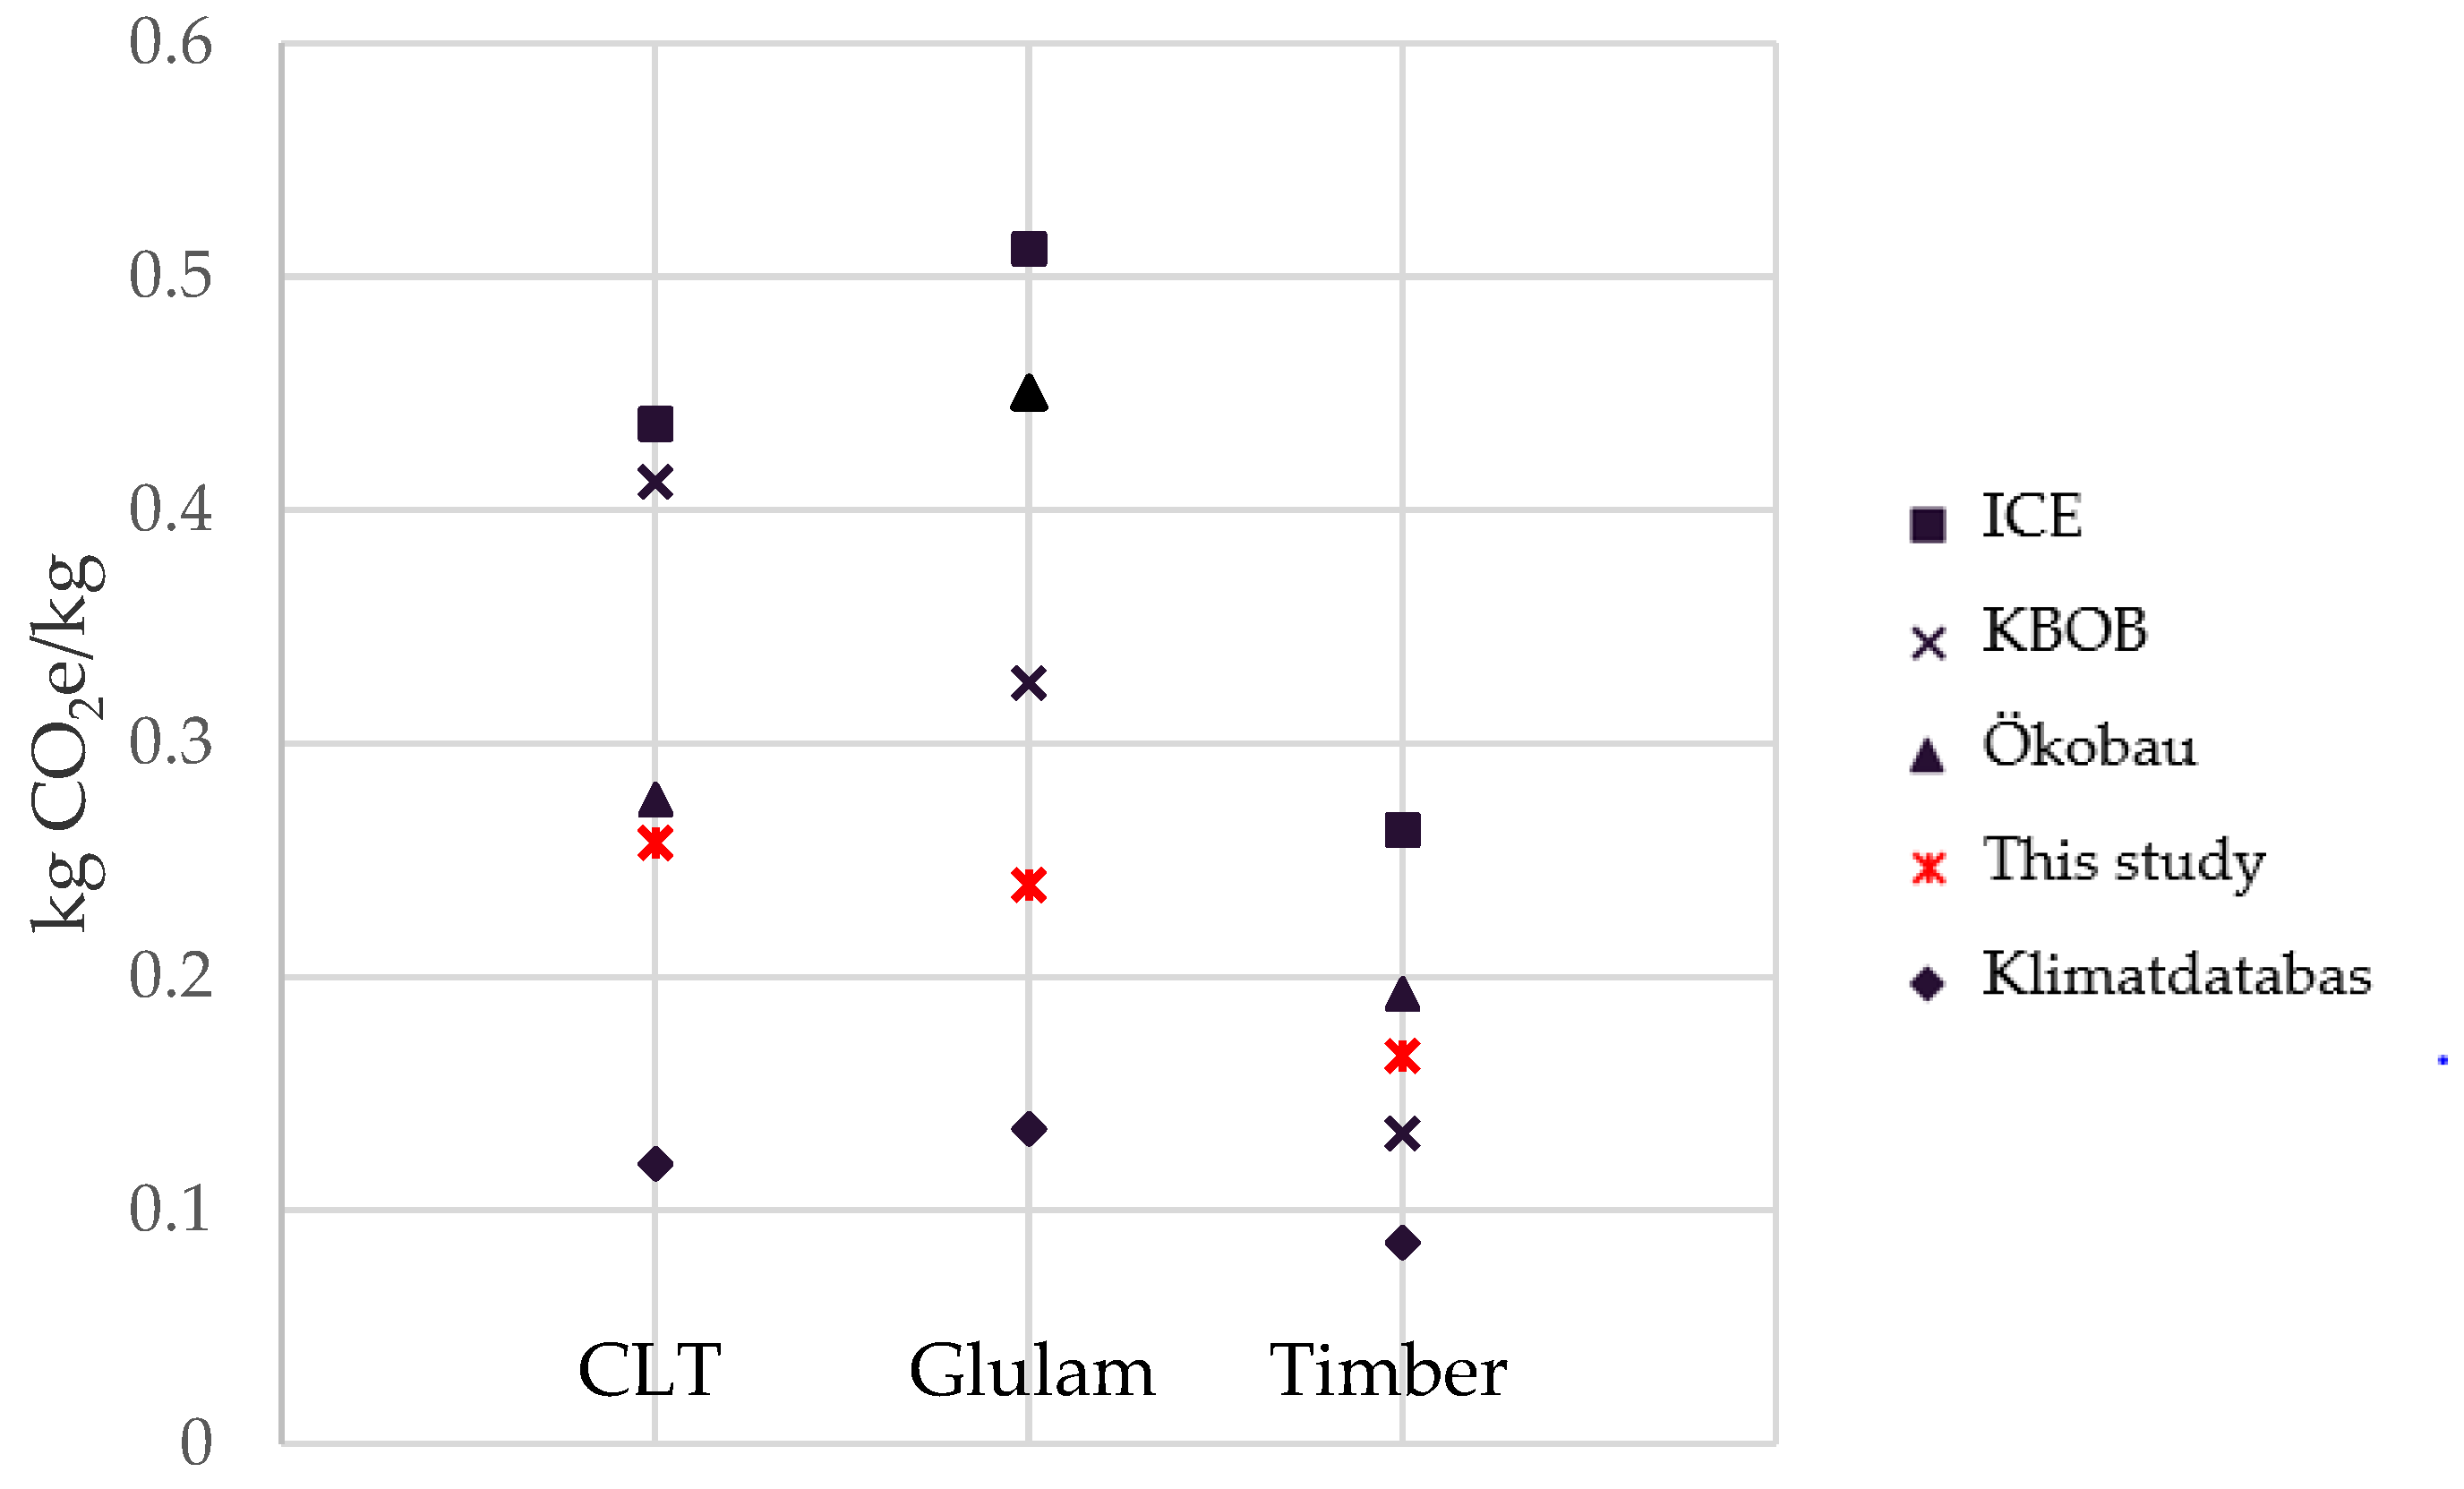
4.2. Comparison with Database Values
4.3. Potential Pitfalls in the Use of EPDs
4.4. Limitations of Study
5. Conclusions
Supplementary Materials
Author Contributions
Funding
Conflicts of Interest
References
- International Energy Agency; Global Alliance for Buildings and Construction. 2019 Global Status Report for Buildings and Constructi on Towards a Zero-Emissions, Efficient and Resilient Buildings and Constructi on Sector; United Nations Environment Programme: Nairobi, Kenya, 2019; ISBN 9789280737684. [Google Scholar]
- IEA. Material Efficiency in Clean Energy Transitions; IEA Publications: Paris, France, 2019. [Google Scholar] [CrossRef]
- Hertwich, E.; Lifset, R.; Pauliuk, S.; Heeren, N. Resource Efficiency and Climate Change: Material Efficiency Strategies for a Low-Carbon Future; United Nations Environment Programme: Nairobi, Kenya, 2020. [Google Scholar] [CrossRef]
- Hertwich, E.G.; Ali, S.; Ciacci, L.; Fishman, T.; Heeren, N.; Masanet, E.; Asghari, F.N.; Olivetti, E.; Pauliuk, S.; Tu, Q.; et al. Material efficiency strategies to reducing greenhouse gas emissions associated with buildings, vehicles, and electronics—A review. Environ. Res. Lett. 2019, 14, 4. [Google Scholar] [CrossRef] [Green Version]
- Röck, M.; Saade, M.R.M.; Balouktsi, M.; Rasmussen, F.N.; Birgisdottir, H.; Frischknecht, R.; Habert, G.; Lützkendorf, T.; Passer, A. Embodied GHG emissions of buildings—The hidden challenge for effective climate change mitigation. Appl. Energy 2019, 258, 114107. [Google Scholar] [CrossRef]
- Frischknecht, R.; Birgisdottir, H.; Chae, C.U.; Lützkendorf, T.; Passer, A. IEA EBC Annex 72—Assessing life cycle related environmental impacts caused by buildings—Targets and tasks. IOP Conf. Series Earth Environ. Sci. 2019, 323, 012042. [Google Scholar] [CrossRef]
- Lützkendorf, T. Assessing the environmental performance of buildings: Trends, lessons and tensions. Build. Res. Inf. 2017, 3218, 1–21. [Google Scholar] [CrossRef]
- Kuittinen, M.; Häkkinen, T. Reduced carbon footprints of buildings: New Finnish standards and assessments. Build. Cities 2020, 1, 182–197. [Google Scholar] [CrossRef]
- Boverket. Miljö-och Klimatanpassade Byggregler; Karlskrona. 2016. Available online: https://www.boverket.se/sv/om-boverket/publicerat-av-boverket/publikationer/2016/miljo--och-klimatanpassade-byggregler (accessed on 3 April 2021).
- Ministry of Business, Innovation & Employment. Whole-of-Life Embodied Carbon Emissions Reduction Framework—Building for Climate Change Programme. 2020. Available online: www.mbie.govt.nz (accessed on 12 July 2021).
- Francart, N.; Larsson, M.; Malmqvist, T.; Erlandsson, M.; Florell, J. Requirements set by Swedish municipalities to promote construction with low climate change impact. J. Clean. Prod. 2018, 208, 117–131. [Google Scholar] [CrossRef] [Green Version]
- Rasmussen, F.N.; Birkved, M.; Birgisdóttir, H. Low-carbon design strategies for new residential buildings—lessons from architectural practice. Arch. Eng. Des. Manag. 2020, 16, 374–390. [Google Scholar] [CrossRef]
- Nußholz, J.L.; Rasmussen, F.N.; Whalen, K.; Plepys, A. Material reuse in buildings: Implications of a circular business model for sustainable value creation. J. Clean. Prod. 2019, 245, 118546. [Google Scholar] [CrossRef]
- D’Amico, B.; Pomponi, F.; Hart, J. Global potential for material substitution in building construction: The case of cross laminated timber. J. Clean. Prod. 2020, 279, 123487. [Google Scholar] [CrossRef]
- Hildebrandt, J.; Hagemann, N.; Thrän, D. The contribution of wood-based construction materials for leveraging a low carbon building sector in europe. Sustain. Cities Soc. 2017, 34, 405–418. [Google Scholar] [CrossRef]
- Göswein, V.; Reichmann, J.; Habert, G.; Pittau, F. Land availability in Europe for a radical shift toward bio-based construction. Sustain. Cities Soc. 2021, 70, 102929. [Google Scholar] [CrossRef]
- Ramage, M.H.; Burridge, H.; Busse-Wicher, M.; Fereday, G.; Reynolds, T.; Shah, D.; Wu, G.; Yu, L.; Fleming, P.; Densley-Tingley, D.; et al. The wood from the trees: The use of timber in construction. Renew. Sustain. Energy Rev. 2017, 68, 333–359. [Google Scholar] [CrossRef]
- Churkina, G.; Organschi, A.; Reyer, C.P.O.; Ruff, A.; Vinke, K.; Liu, Z.; Reck, B.K.; Graedel, T.E.; Schellnhuber, H.J. Buildings as a global carbon sink. Nat. Sustain. 2020, 3, 269–276. [Google Scholar] [CrossRef]
- Hoxha, E.; Passer, A.; Saade, M.R.M.; Trigaux, D.; Shuttleworth, A.; Pittau, F.; Allacker, K.; Habert, G. Biogenic carbon in buildings: A critical overview of LCA methods. Build. Cities 2020, 1, 504–524. [Google Scholar] [CrossRef]
- Andersen, C.E.; Rasmussen, F.N.; Habert, G.; Birgisdóttir, H. Embodied GHG emissions of wooden buildings—Challenges of biogenic carbon accounting in current LCA methods. Front. Built Environ. 2021, in press. [Google Scholar]
- Rasmussen, F.N.; Malmqvist, T.; Birgisdóttir, H. Drivers, barriers and development needs for LCA in the Nordic building sector-a survey among professionals Drivers, barriers and development needs for LCA in the Nordic building sector-a survey among professionals. IOP Conf. Series Earth Environ. Sci. 2020, 588, 032022. [Google Scholar] [CrossRef]
- Balouktsi, M.; Lützkendorf, T.; Röck, M.; Passer, A.; Reisinger, T.; Frischknecht, R. Survey results on acceptance and use of Life Cycle Assessment among designers in world regions: IEA EBC Annex 72. IOP Conf. Series Earth Environ. Sci. 2020, 588, 032023. [Google Scholar] [CrossRef]
- Pomponi, F.; Moncaster, A. Scrutinising embodied carbon in buildings: The next performance gap made manifest. Renew. Sustain. Energy Rev. 2018, 81, 2431–2442. [Google Scholar] [CrossRef] [Green Version]
- Mengarelli, M.; Neugebauer, S.; Finkbeiner, M.; Germani, M.; Buttol, P.; Reale, F. End-of-life modelling in life cycle assessment—material or product-centred perspective? Int. J. Life Cycle Assess. 2016, 22, 1288–1301. [Google Scholar] [CrossRef]
- Frischknecht, R.; Althaus, H.J.; Bauer, C.; Doka, G.; Heck, T.; Jungbluth, N.; Nemecek, T. The Environmental Relevance of Capital Goods in Life Cycle Assessments of Products and Services. Int. J. Life Cycle Assess. 2007, 12, 7–17. [Google Scholar] [CrossRef]
- Martínez-Rocamora, A.; Solís-Guzmán, J.; Marrero, M. LCA databases focused on construction materials: A review. Renew. Sustain. Energy Rev. 2016, 58, 565–573. [Google Scholar] [CrossRef]
- Dixit, M.; Culp, C.H.; Fernández-Solís, J.L. System boundary for embodied energy in buildings: A conceptual model for definition. Renew. Sustain. Energy Rev. 2013, 21, 153–164. [Google Scholar] [CrossRef]
- Rasmussen, F.N.; Malmqvist, T.; Moncaster, A.; Wiberg, A.H.; Birgisdottir, H. Analysing methodological choices in calculations of embodied energy and GHG emissions from buildings. Energy Build. 2018, 158, 1487–1498. [Google Scholar] [CrossRef]
- EN ISO 14025. Environmental Labels and Declarations—Type III Environmental Declarations—Principles and Procedures; International Organization for Standardization: Geneva, Switzerland, 2006. [Google Scholar]
- Gelowitz, M.; McArthur, J. Comparison of type III environmental product declarations for construction products: Material sourcing and harmonization evaluation. J. Clean. Prod. 2017, 157, 125–133. [Google Scholar] [CrossRef]
- Ingwersen, W.; Stevenson, M.J. Can we compare the environmental performance of this product to that one? An update on the development of product category rules and future challenges toward alignment. J. Clean. Prod. 2012, 24, 102–108. [Google Scholar] [CrossRef]
- CEN. EN 15804:2013+A1—Sustainability of Constructions Works—Environmental Product Declarations—Core Rules for the Product Category of Construction Products; British Standards Institution: London, UK, 2012.
- Passer, A.; Lasvaux, S.; Allacker, K.; De Lathauwer, D.; Spirinckx, C.; Wittstock, B.; Kellenberger, D.; Gschösser, F.; Wall, J.; Wallbaum, H. Environmental product declarations entering the building sector: Critical reflections based on 5 to 10 years experience in different European countries. Int. J. Life Cycle Assess. 2015, 20, 1199–1212. [Google Scholar] [CrossRef] [Green Version]
- Gantner, J.; Lenz, K.; Horn, R.; Von Both, P.; Ebertshäuser, S. Ökobau.dat 3.0–Quo Vadis? Buildings 2018, 8, 129. [Google Scholar] [CrossRef] [Green Version]
- Herrero-Garcia, V. Whole-Building Life Cycle Assessment: Comparison of Available Tools. Technol. Des. 2020, 4, 248–252. [Google Scholar] [CrossRef]
- Hill, C.; Norton, A.; Dibdiakova, J. A comparison of the environmental impacts of different categories of insulation materials. Energy Build. 2018, 162, 12–20. [Google Scholar] [CrossRef]
- Welling, S.; Ryding, S.-O. Distribution of environmental performance in life cycle assessments—Implications for environmental benchmarking. Int. J. Life Cycle Assess. 2021, 26, 275–289. [Google Scholar] [CrossRef]
- Anderson, J.; Moncaster, A. Embodied carbon of concrete in buildings, Part 1: Analysis of published EPD. Build. Cities 2020, 1, 198–217. [Google Scholar] [CrossRef]
- Waldman, B.; Huang, M.; Simonen, K. Embodied carbon in construction materials: A framework for quantifying data quality in EPDs. Build. Cities 2020, 1, 625–636. [Google Scholar] [CrossRef]
- Božiček, D.; Kunič, R.; Košir, M. Interpreting environmental impacts in building design: Application of a comparative assertion method in the context of the EPD scheme for building products. J. Clean. Prod. 2020, 279, 123399. [Google Scholar] [CrossRef]
- CEN. EN 15804:2012+A2:2019—Sustainability of Construction Works—Environmental Product Declarations—Core Rules for the Product Category of Construction Products; British Standards Institution: London, UK, 2019.
- Anderson, J. ConstructionLCA’s 2021 Guide to Environmental Product Declarations (EPD). ECO PLATFORM AISBL. 2021. Available online: https://www.eco-platform.org/epd-facts-figures.html (accessed on 8 April 2021).
- Dias, A.; Silvestre, J.; de Brito, J. Comparison of the environmental and structural performance of solid and glued laminated timber products based on EPDs. Structures 2020, 26, 128–138. [Google Scholar] [CrossRef]
- Zimmermann, R.; Bruhn, S.; Birgisdóttir, H. BIM-Based Life Cycle Assessment of Buildings—An Investigation of Industry Practice and Needs. Sustainability 2021, 13, 5455. [Google Scholar] [CrossRef]
- Röck, M.; Hollberg, A.; Habert, G.; Passer, A. LCA and BIM: Visualization of environmental potentials in building construction at early design stages. Build. Environ. 2018, 140, 153–161. [Google Scholar] [CrossRef]
- Circular Ecology. Embodied Carbon—The ICE Database. Circ. Ecol. 2020. Available online: https://circularecology.com/embodied-carbon-footprint-database.html (accessed on 3 April 2021).
- Plattform Ökobilanzdaten im Baubereich. Available online: https://www.kbob.admin.ch/kbob/de/home/die-kbob/plattform-oekobilanzdaten-im-baubereich.html (accessed on 12 July 2021).
- ÖKOBAUDAT. Available online: https://www.oekobaudat.de/en.html (accessed on 12 July 2021).
- Boverkets Klimatdatabas-Boverket. Available online: https://www.boverket.se/sv/byggande/hallbart-byggande-och-forvaltning/klimatdeklaration/klimatdatabas/ (accessed on 12 July 2021).
- Hill, C.A.S.; Dibdiakova, J. The environmental impact of wood compared to other building materials. Int. Wood Prod. J. 2016, 7, 215–219. [Google Scholar] [CrossRef]
- Lauri, L.; Roope, H.; Atsushi, T.; Tuovi, V.; Olli, D. Environmental product declaration of timber products: The impact of allocation method to the impact categories. J. Clean. Prod. 2020, 256, 120386. [Google Scholar] [CrossRef]
- Tellnes, L.G.F.; Rønning, A.R. Modelling options for module C and D: Experiences from 50 EPD for wood-based products in Norway. IOP Conf. Series Earth Environ. Sci. 2019, 323, 012052. [Google Scholar] [CrossRef] [Green Version]
- Bare, J. TRACI 2.0: The tool for the reduction and assessment of chemical and other environmental impacts 2.0. Clean Technol. Environ. Policy 2011, 13, 687–696. [Google Scholar] [CrossRef]
- EPD International. Product Category Rules—Construction Products 2019:14 VERSION 1.11; The International EPD System: Stockholm, Sweden, 2019. [Google Scholar]


| Data Extraction Criteria | Description |
|---|---|
| EPD id | The unique id for every EPD. |
| EPD owner | The owner of the EPD. |
| Product identification | A short description of the product including wood type (for instance spruce, pine, or fir) and moisture content. |
| Product category | Structural wood within one of the four categories: sawn timber, glulam, cross laminated timber, and laminated veneer lumber. |
| Density | Average density for the product as stated in the EPD. |
| Validation from/to date | Dates from which the EPD is valid from and to. |
| Geographical representativeness | Geographical scope that the product in the EPD is valid for |
| Temporal representativeness | Temporal scope that the EPD represents. |
| European Standard | The European Standard that the EPD is based on, either EN15804:2012+A1:2013 or EN15804:2012 + A2:2019 [32,41] |
| Product Category Rules | Specific product category rules that the EPD is based on. |
| Functional Unit | Declared unit defined in the EPD, which serves as a basis for the calculations in the EPD. |
| LCA database | LCA database used for the calculation of the environmental impacts in the EPD. |
| LCA software | LCA software used for the calculation of the environmental impacts in the EPD. |
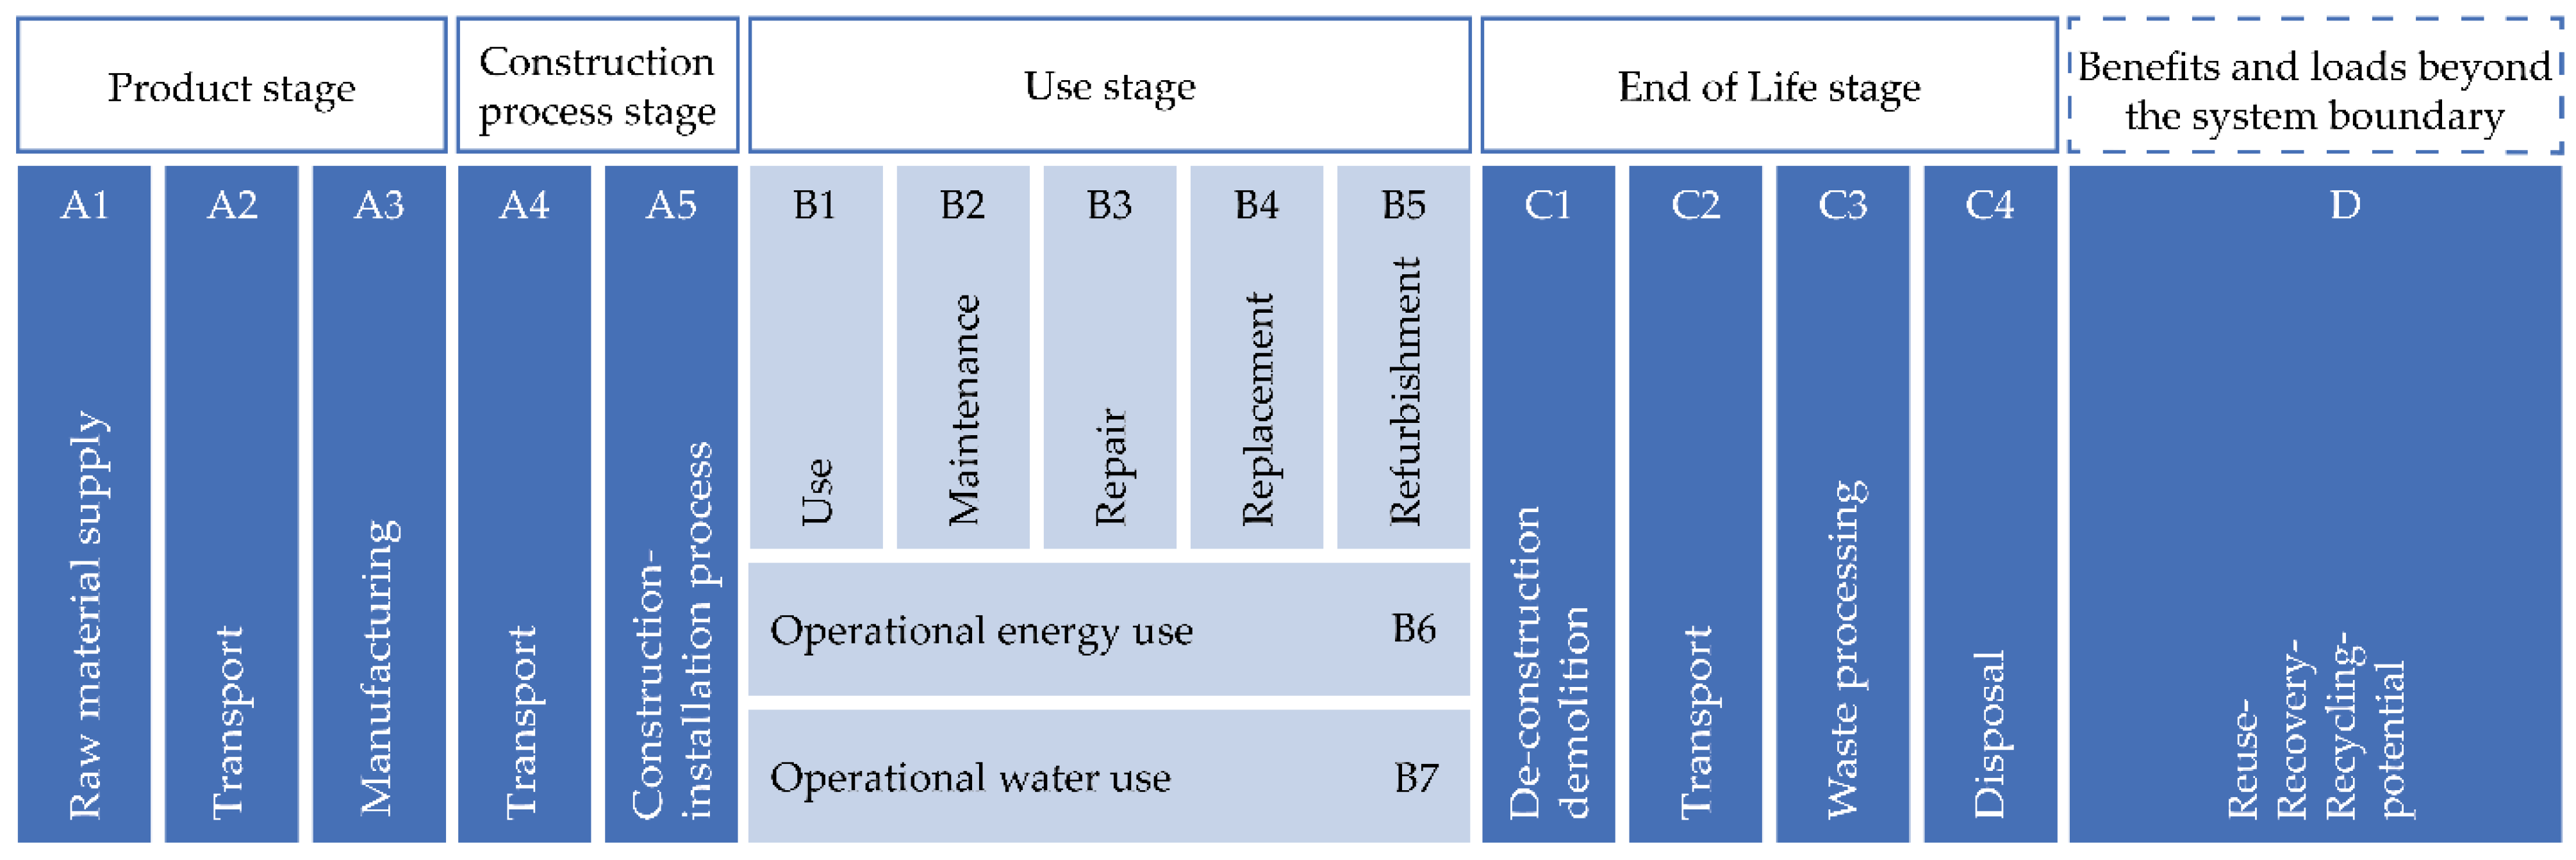
| System boundaries | System boundaries included in the EPD. The system boundaries are defined according to the European Standards, that is life cycle stages concerning the production stage (A1, A2, A3), the construction stage (A4, A5), the use stage (B1, B2, B3, B4, B5, B6, B7), the end-of-life stage (C1, C2, C3, C4), and finally benefits and loads beyond the system boundary (D) [32,41]. |
| End of life scenarios | End-of-life scenario examined in the EPD. In cases where the EPD entails several end-of-life scenarios (for instance, the landfill scenario, incineration scenario, recycling scenario), all end-of-life scenarios are registered. |
| Environmental impacts | Environmental impacts per functional unit as stated in the EPD. |
| Environmental Indicator | Unit | EN 15804 |
|---|---|---|
| Abiotic depletion potential of fossil resources (ADPE) | kg Sb-e | A1, A2 |
| Acidification potential of land and water (AP) | kg SO2e | A1, A2 |
| Eutrophication potential (EP) | kg PO43e | A1 |
| Eutrophication potential (EP)—freshwater | kg PO43e | A2 |
| Eutrophication potential (EP)—marine | kg N-e | A2 |
| Eutrophication potential (EP)—terrestrial | mol N-e | A2 |
| Global warming potential (GWP) | kg CO2e | A1, A2 |
| Global warming potential (GWP)—fossil | kg CO2e | A2 |
| Global warming potential (GWP)—biogenic | kg CO2e | A2 |
| Global warming potential (GWP)—Land use and land transformation | kg CO2e | A2 |
| Total use of non-renewable primary energy resources (PENRT) | MJ | A1, A2 |
| Total use of renewable primary energy resources (PERT) | MJ | A1, A2 |
Publisher’s Note: MDPI stays neutral with regard to jurisdictional claims in published maps and institutional affiliations. |
© 2021 by the authors. Licensee MDPI, Basel, Switzerland. This article is an open access article distributed under the terms and conditions of the Creative Commons Attribution (CC BY) license (https://creativecommons.org/licenses/by/4.0/).
Share and Cite
Rasmussen, F.N.; Andersen, C.E.; Wittchen, A.; Hansen, R.N.; Birgisdóttir, H. Environmental Product Declarations of Structural Wood: A Review of Impacts and Potential Pitfalls for Practice. Buildings 2021, 11, 362. https://doi.org/10.3390/buildings11080362
Rasmussen FN, Andersen CE, Wittchen A, Hansen RN, Birgisdóttir H. Environmental Product Declarations of Structural Wood: A Review of Impacts and Potential Pitfalls for Practice. Buildings. 2021; 11(8):362. https://doi.org/10.3390/buildings11080362
Chicago/Turabian StyleRasmussen, Freja Nygaard, Camilla Ernst Andersen, Alexandra Wittchen, Rasmus Nøddegaard Hansen, and Harpa Birgisdóttir. 2021. "Environmental Product Declarations of Structural Wood: A Review of Impacts and Potential Pitfalls for Practice" Buildings 11, no. 8: 362. https://doi.org/10.3390/buildings11080362