Article

A Social Network-Based Examination on Bid Riggers’ Relationships in the Construction Industry: A Case Study of China

1
School of Management Science and Real Estate, Chongqing University, Chongqing 400030, China
2
School of Architect and Construction Technology, Mbeya University of Science and Technology, Iyunga Street, Mbeya 53119, Tanzania
*
Author to whom correspondence should be addressed.
Buildings 2021, 11(8), 363; https://doi.org/10.3390/buildings11080363
Submission received: 21 July 2021 / Revised: 15 August 2021 / Accepted: 15 August 2021 / Published: 18 August 2021

Abstract

:
Collusive bidding has been an insidious issue in the construction industry. Bidders initiate collusive networks of various sizes to win market shares. The popularity of collusive bidding networks affects market fairness and erodes the interests of market players. Although considerable research efforts were made to diagnose collusive bidding networks, there remains a gap in knowledge regarding the relationships bid riggers use to engage in the networks. Therefore, this study used the social network method, where two hundred sixteen collusion cases were collected from China to test these relationships. The results show that collusive bidding networks were characterized by sparseness, a small scale, a high concentration, and strong randomness. Three types of collusive bidding networks were also detected: contractual, spontaneous, and shadow. Furthermore, these collusive bidding networks had discrepancies regarding participants’ identities, forms of collusive bids, and the determination of bid winners. It was found that the proposed social network model of deliberating bid riggers’ relationships lays a solid foundation for the detection of collusive bidding in the construction sector.

1. Introduction

The fundamental significance of the construction industry is illustrated by its enormous contributions to overall economic growth [1]. This industry provides a wide range of infrastructures, such as transportation, telecommunication, buildings, schools, and hospitals, to meet societal demands [2]. In the construction marketplace, where competitiveness takes the form of ventures, the occupation of market shares follows a competitive tendering mechanism, which is an extensively used method for awarding construction projects [3]. As a result, construction business competition has been fierce for a long time, facilitating the emergence of collusive cases in many developed and developing countries [4].
Collusion was deemed an insidious industrial issue as it undermines transparency and fairness and distorts market competition rules [5,6,7,8]. Its unscrupulous and anti-competitive nature draws intense criticism, and the antagonistic effect on the integrity of market players has become an obstacle to promoting the performance of construction projects [9]. In a broader sense, collusion is characterized by cartel bids, supervision difficulty, and social harms [10]. Thus, the dark side of collusive bidding also includes reducing resource allocation efficiency [11], disrupting market competition order [12], and impairing the interest of regular competitors [13]. The causes of such adverse side effects are potentially undermining the cornerstone of competitive tendering systems and weakening business competition rules [14]. By comparison, an open, transparent, and efficient tendering mechanism is instrumental in creating and ensuring that goods and services that are procured by governments offer value for money [15].
As one of the largest developing countries, China has had a massive construction market for decades [16]. Meanwhile, collusive bidding pervade the Chinese construction sector [8,14,16,17]. There were 3305 collusive bidding cases in the construction sector between 2009 and 2012, accounting for nearly 15.2% of all recognized criminal competition nationwide [18]. Furthermore, it was found that bidding alliances established by clients, bidders, and agents was a major cause of the accident of the Shanghai November 15 fire in 2010 [19]. China has evidence that thousands of unqualified bidders crowding the construction market can cause severe industrial problems, such as poor project quality, extensive market disorder, and malfunction of resource allocation [20]. Hence, the increase in collusive bidding nationwide calls for methods to properly recognize collusive bidding’s form and characteristics. This was the core issue that this study aimed to investigate.
It is indispensable to study the characteristics of collusive bidding networks and the forms of collusive bidding. Collusive bidding networks provide a carrier and shelter for the popularization of collusion [21], allowing for collusion to be organized secretly [22]. In the collusive bidding networks, bid riggers include the convenor and members. The convenor uses money and social relations to attract regular bidders to participate in the networks, forming criminal groups that are temporary, interdependent, and mutually restricted [23]. New members are invited to enter a collusive bidding group to promote their joint power of dominating the business competition. Existing members in a collusive bidding network are motivated to adopt flexible strategies and mobilize enterprise resources to conceal their collusive behaviors, enhancing collusion identification and supervision difficulty. The camouflage of collusion in the networks stems from the randomness of bid riggers and the complexity of the collusive bidding process [24]. Therefore, antitrust authorities are supposed to comprehend collusion’s subjects and relationships and detect bid riggers’ power, relationship network, and network organization [23].
In previous studies, researchers employed game theory reasoning and qualitative analysis to examine the mechanism of collusive bidding [4,25,26,27]. Despite the richness of research findings, collusive bidding networks and their evolution have not been explicitly explored. This study aimed to improve the awareness of bid riggers’ relationships by examining the social networks of bid riggers in 216 collusion cases. The specific objectives were to (1) explore the relationship information of collusive groups and participants in 216 collusion cases; (2) quantify the characteristics of collusive bidding networks’ structures; (3) identify the organizational pattern of collusive groups. Social networks provide quantitative tools for exploring the mechanism of collusion. Therefore, this study used social network analysis to examine collusive bidding networks, emphasizing the association of collusive behaviors. Based on relevant indexes, the relationships between bid riggers were uncovered regarding their features, structures, and types. The research findings can enrich collusion theories by presenting collusive bidding networks in the construction sector. Furthermore, the derivation of collusive bidding networks paves the way for the formulation of industrial policies to improve the efficiency of business competition.

2. Literature Review

2.1. Theory of Collusive Bidding

Collusive bidding is a crucial concept in the discipline of sociology and enterprise management. Sociologists stress that collusive bidding is a typical immoral behavior [4,28]. A cartel bidder is designated to win the bid in most collusive bidding practices and obtain the most significant benefits. As contract theory states, most collusive bids are private and extra-legal arrangements [29], violating the fair and free-market competition order and industrial norms and social norms. Furthermore, based on the market theory, Doree [22] argued that bid riggers have to design and enforce rules for three purposes, namely, (1) to divide markets and profits among their collusive members, (2) to prevent members from isolating from collusive groups, and (3) to prevent new firms entering the profitable market. Therefore, collusive bidding should have over two members and a secret agreement for distributing revenues.
The convenor attracts bidders to join a collusive group by utilizing social relations to obtain necessary information and qualifications [30]. The convenor is accustomed to developing a controllable collusive bidding network in which bid riggers attempt to maintain stable relationships or further collusive alliances [31]. As discussed above, the illegitimate, covert, and well-organized features of collusive bidding have been a hindrance to antitrust authorities regarding identifying, managing, and inhibiting collusive networks [5]. The accumulation of bidders is conducive to building a collusive bidding network to prevent collusive bidding from being detected [32]. Collusive bidding networks are instrumental in maintaining the flexibility of bidding strategies under different market conditions [21].
Collusive bidding is quite serious and extensive in the construction industry [16]. Several researchers have studied many aspects of collusive bidding. For example, the causes of collusion [18,33], the detection of collusion [4,9,34], and the governance of collusion [14,35,36] were often investigated. The existing research on the mechanisms of collusive bidding behavior mainly focused on the influence of the external environment on collusion behavior. For example, several researchers used interviews, questionnaire surveys, simulations, and other methods to study collusive bidding behavior. There seems to be general agreement in the literature that the motivation for collusion is related to institutional pressure and social influence (e.g., [12,37,38,39]). The incomplete national regulatory systems, imperfect laws, and a lack of a positive industry atmosphere (e.g., [8,25,38]) encourage conspiracies. There are few studies that revealed the behavior of bid riggers from the inside of a collusion network. Therefore, more efforts need to be devoted to researching the behavior of bid riggers, which is very helpful to the study on the causes, detection, and governance of collusive bidding.

2.2. Theory of Social Networks

A social network refers to a network connection that is composed of various social relationships, including working relationships in social organizations, family relationships in interpersonal networks, and competitive and cooperative relationships in economic markets [40]. Laumann et al. [41] defined a social network using nodes, such as individuals, groups, organizations, and countries, and connected them through specific social relations. Provan et al. [42] pointed out that a social network refers to the connection between a particular interest group’s member. Goodwin [43] viewed a social network as the social relations of grouped actors. While the above definitions are based on different focuses, the core of a social network is the relationship between individuals. The overall network structure is helpful for investigating individual members of social behaviors within a group.
The essence of social networks is the composition of nodes and their relationships in a networked group [44]. The nodes of a network mainly refer to individuals with “initiative” [45]. Social network analysis is extensively adapted to examine covert network organization relationships [46]. A clandestine network is a network where its nodes function secretly, and the nodes’ connections in the network cannot be traced easily, suggesting that obtaining relevant data is subject to an overwhelming challenge [47]. Thus, an underground network facilitates the survival of illegal behaviors and makes behaviors hidden [48]. Calderoni [49] used social network analysis to visualize the covert relationship of organized crime and proposed that this method could be extended to the mining of medical fraud, suspected suppliers, terrorists, and corrupt leaders. This means that social network analysis is helpful for discerning the networks of unfair business competition.

2.3. Social Networks in Collusive Bidding

In collusive bidding, social networks have the main interaction features between nodes in the network [50]. The interaction specifies active or passive contacts for the operation of collusive bidding. In effect, social networks involved in collusive bidding detail formal or informal relationships between participants in the collusion process. Participants and their behavioral relations represent the nodes and relationships of a social network, respectively. The participants interact to establish network relationships in different sizes [24]. Behavioral relations can be of the principal–agent form between the client and its agent and a supervisory interaction form between antitrust authorities and bid riggers [51].
Nodes of collusive bidding networks comprise the convenor, facilitators, and intermediaries [52]. The convenor is in charge of the initiation, organization, and coordination of the collusion process. The facilitators can be individuals who assist the convenor in operating the collusive bidding teams. The primary duties of the facilitators are to help prepare collusive bidding documents, find sufficient enterprise qualification certificates, and provide the convenors with bid security and other financial supports. Due to the risks of being punished by antitrust authorities, the convenor might not rent as many qualification certificates as expected. Therefore, some intermediaries need to build “bridges.” The intermediaries, as actors transporting resources to a location or buying resources from another site [53], can control enterprise resources, collusive information, and identities of bid riggers. Thus, intermediaries have rights and advantages in a collusive bidding network.
The relationship network of actors was discussed in the construction industry. Hosseini et al. [54] used the social network method to distinguish characteristics of corruption risks in Iranian construction projects. Padhi et al. [55] studied the effect of collusion in government procurement auctions by establishing a system dynamics network. Agranov and Yariv [56] demonstrated that the communication between bid riggers could promote collusion in auctions. In addition, Reeves-Latour and Morselli [24] used the core-periphery method to analyze the behavioral relationship network of bidders, such as corruption, collusion, and bribery, and concluded that the operators of bidding collusion are often long-term participants of the collusive organization. Previous research has rarely discussed collusive bidding networks. While some of the aforementioned studies have realized that bid riggers’ behavior mechanisms are critical to reducing collusive bidding, they failed to investigate collusive groups’ characteristics and organizational modes.

3. Research Design

3.1. Data Collection

The concealment of collusion makes it extremely difficult to map out collusive bidding networks and gather the relevant data. To improve the subjectivity of questionnaire surveys, scholars deemed it acceptable to compile network data from archives [57]. As an authoritative department, courts publish collusive bidding cases with detailed information, including participants’ identities and relationships. Therefore, collusive bidding cases in the official documents published by courts have credibility, and illegal cases in the judgment can be used to reveal the characteristics of collusive relationships and their networks.
The data for the study were extracted from collusive bidding cases over the period 2009–2018, as published on the Chinese Judgment Documents website. The keywords that were used to search the website were “collusive bidding and engineering and first-instance judgments.” A total of 1268 collusive bidding case judgments were finally retrieved. We used convenient sampling methods to collect quality samples. According to the nature of collusive bidding networks, we processed the original data following the criteria assumption of “there is only one collusion relationship network in a sample.” Moreover, the “multiple collusion behaviors of the same collusive group are regarded as multiple independent collusive networks” and “there is no connection between collusive networks.” Consequently, 216 cases were filtered from 254 judgment documents. The samples contained nine projects, including housing construction, municipal administration, roads, and water conservancy, and were distributed over eighteen provinces, such as Hubei, Anhui, Jiangxi, and Zhejiang.
As shown in Table 1, the average size of a collusive bidding group and number of participants in a network were 7.410 and 12.070, respectively. These two figures show that there were 1.630 individual participants behind a collusive group in a single case of collusive bidding. The standard deviation of these two indexes shows that the numbers of collusive bidding groups and participants involved in a collusion case were more discrete. The skewness and kurtosis of these two indexes indicate that the numbers of most collusive bidding groups and participants involved in a collusion case were below the mean.

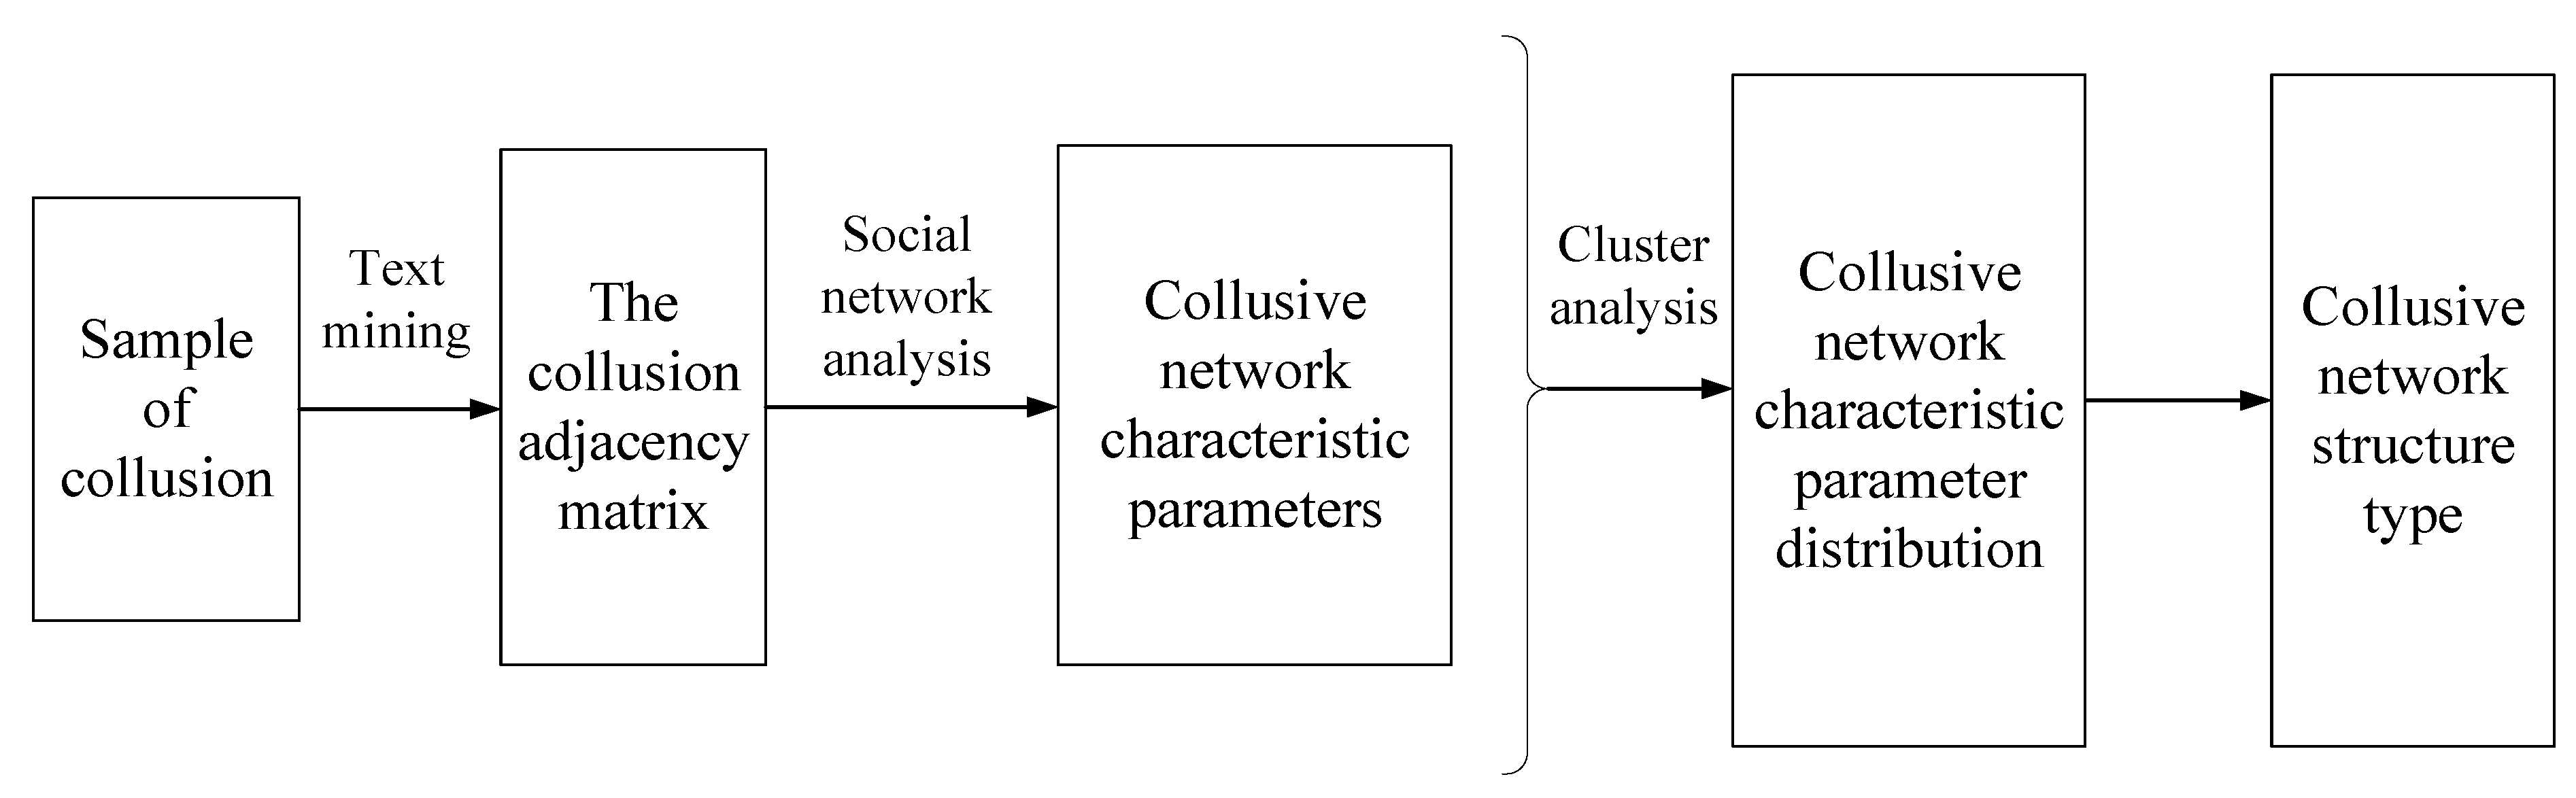
3.2. Steps for Data Analysis

In Figure 1, text mining was performed to extract data from the sample. Collusive networks in a sample were identified, and the related information matrix was constructed. Individuals and groups that directly promoted the collusion in the case were regarded as nodes, and actual collusive behaviors were considered network relationships.
The nodes were connected to form a network and further transformed into a relationship matrix A = { a i j } without weights, where a i j represents the collusive relationship between node i and node j . Any two nodes with collusive relationships were directly connected, say, a i j = 1 ( i j ) ; otherwise, a i j = 0 ( i j ) . Then, the conversion of a collusive network into an adjacency matrix took place, where the adjacency matrix contained collusion information from a collusive network.
Data of collusive bidding networks was feed into the UCINET package. Based on the overall network measurement index, we conducted a social network analysis to derive the characteristics and parameters of the overall network. Then, the topological structure of relational networks was obtained by inputting the adjacency matrix into the UCINET. Finally, we performed cluster analysis using the K-means clustering algorithm. Based on the six selected overall network parameters, three clustering centers and their structural characteristics were obtained.

3.3. Collusive Network Indexes

Social networks include two significant perspectives: individual and overall network perspectives [58]. The individual perspective details the characteristics of a single node in its networks, such as type, scale, and homogeneity. The overall perspective outlines the overall network and presents the organization’s network structure at the general level (i.e., density, node distance, and centrality). In line with our research purposes, we selected the overall network density, average path length, degree central potential index, intermediate central potential index, closeness to the central potential index, and cohesion coefficient, as shown in Table 2.

4. Results

4.1. Collusive Bidding Network Indexes

In this study, the overall network density and the average path length were selected to reflect the characteristics of the overall network, the degree central potential index and the intermediate central potential index were selected to reflect the characteristics of the network centrality, and the close central potential index and the condensation coefficient were selected to reflect the network cohesion.

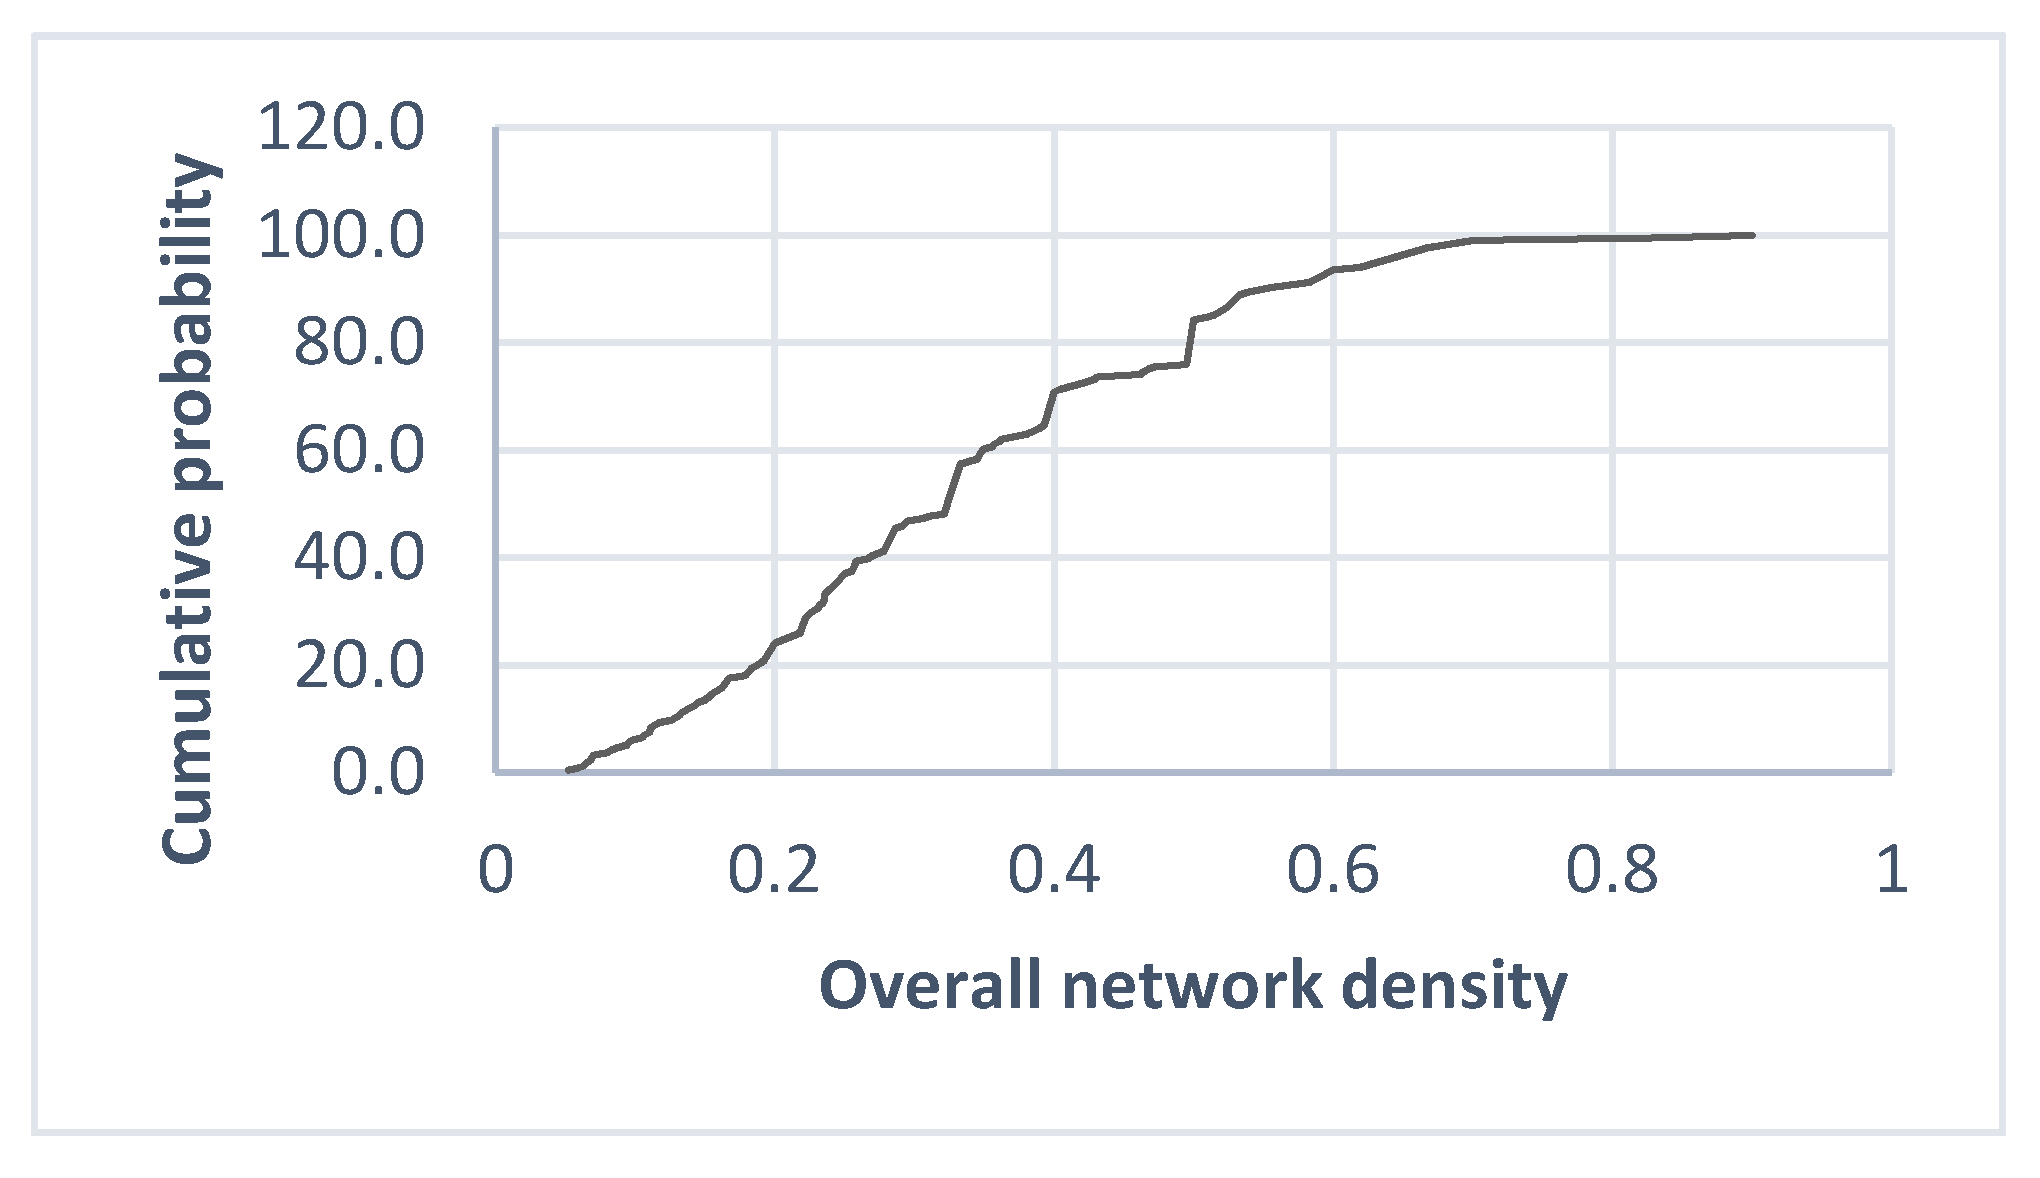
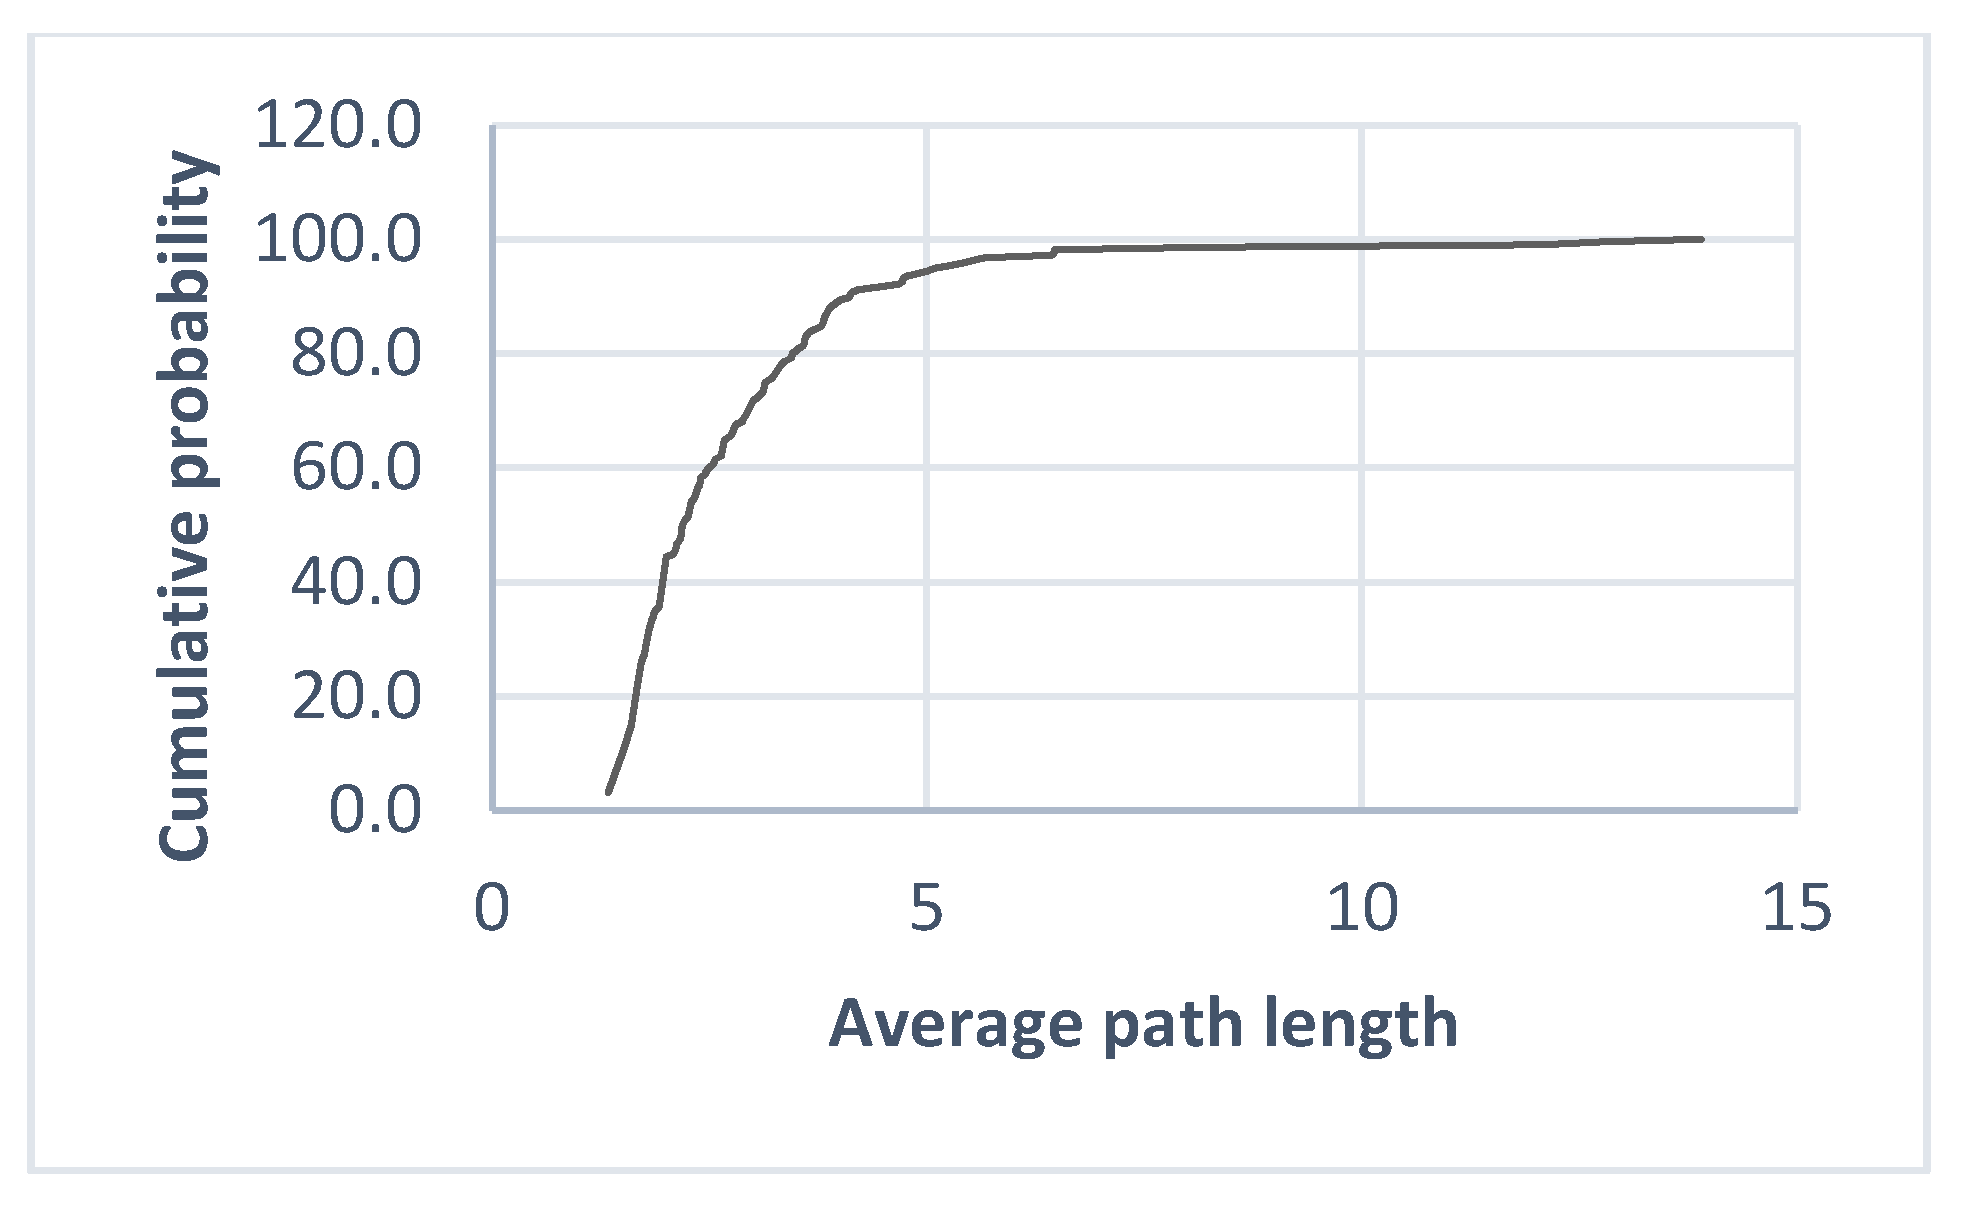
4.1.1. Overall Network Analysis

Overall network analysis can clearly reflect the characteristics of an overall network. In this study, the overall network density and the average path length were selected to study the characteristics of the overall network.
The overall network density is the ratio of the actual number of connections contained in the network to the theoretical maximum number of connections. In the collusive bidding networks, the overall network density reflects the degree of connection between nodes.
According to the indicator of the overall network density in Table 2, the results of the overall network density of the 216 cases are presented in Figure 2, which shows that the mean value of the overall network density was 0.337 and the standard deviation was 0.169. Wellman [59] pointed out that the network is considered to have a sparse structure if the standard deviation of overall network density is 0–0.25; as such, it was found that the collusive bidding network exhibited a sparse structure. Bid riggers had a low degree of interconnection and substantial heterogeneity, suggesting that the network had limited influence on its behavior. Therefore, bid riggers were more conducive to obtaining heterogeneous information and development opportunities outside their collusive bidding groups. The result of this distribution could be ascribed to the concealment of collusion. First, it helped with avoiding the supervision of collusion conduct. Second, the high mobility of collusion means that bid riggers had inadequate time to establish contacts with other groups or individuals, and new bid riggers were often at the network periphery.
The average path length, also known as the characteristic path length, is expressed as the mean of the shortest path distance between any two nodes. It reflects the connectivity between individuals in the collusive bidding networks.
Considering the indicator of the average path length in Table 2, the results of the average path length of the 216 cases are presented in Figure 3, which shows that the mean value of the average path length was 2.724 and the standard deviation was 1.67. These values indicate that an average of 2.724 mediators was needed to interact between any two bid riggers in the network. Previous studies showed that the average path length mirrors the network connectivity or information accessibility [60]. Thus, the connectivity between bid riggers was acceptable, where each one had high accessibility to other group members, and the communication between them was relatively easy. In addition, information transmission and resource allocation could be realized in bid-rigging groups, and the bid-rigging group had good stability.

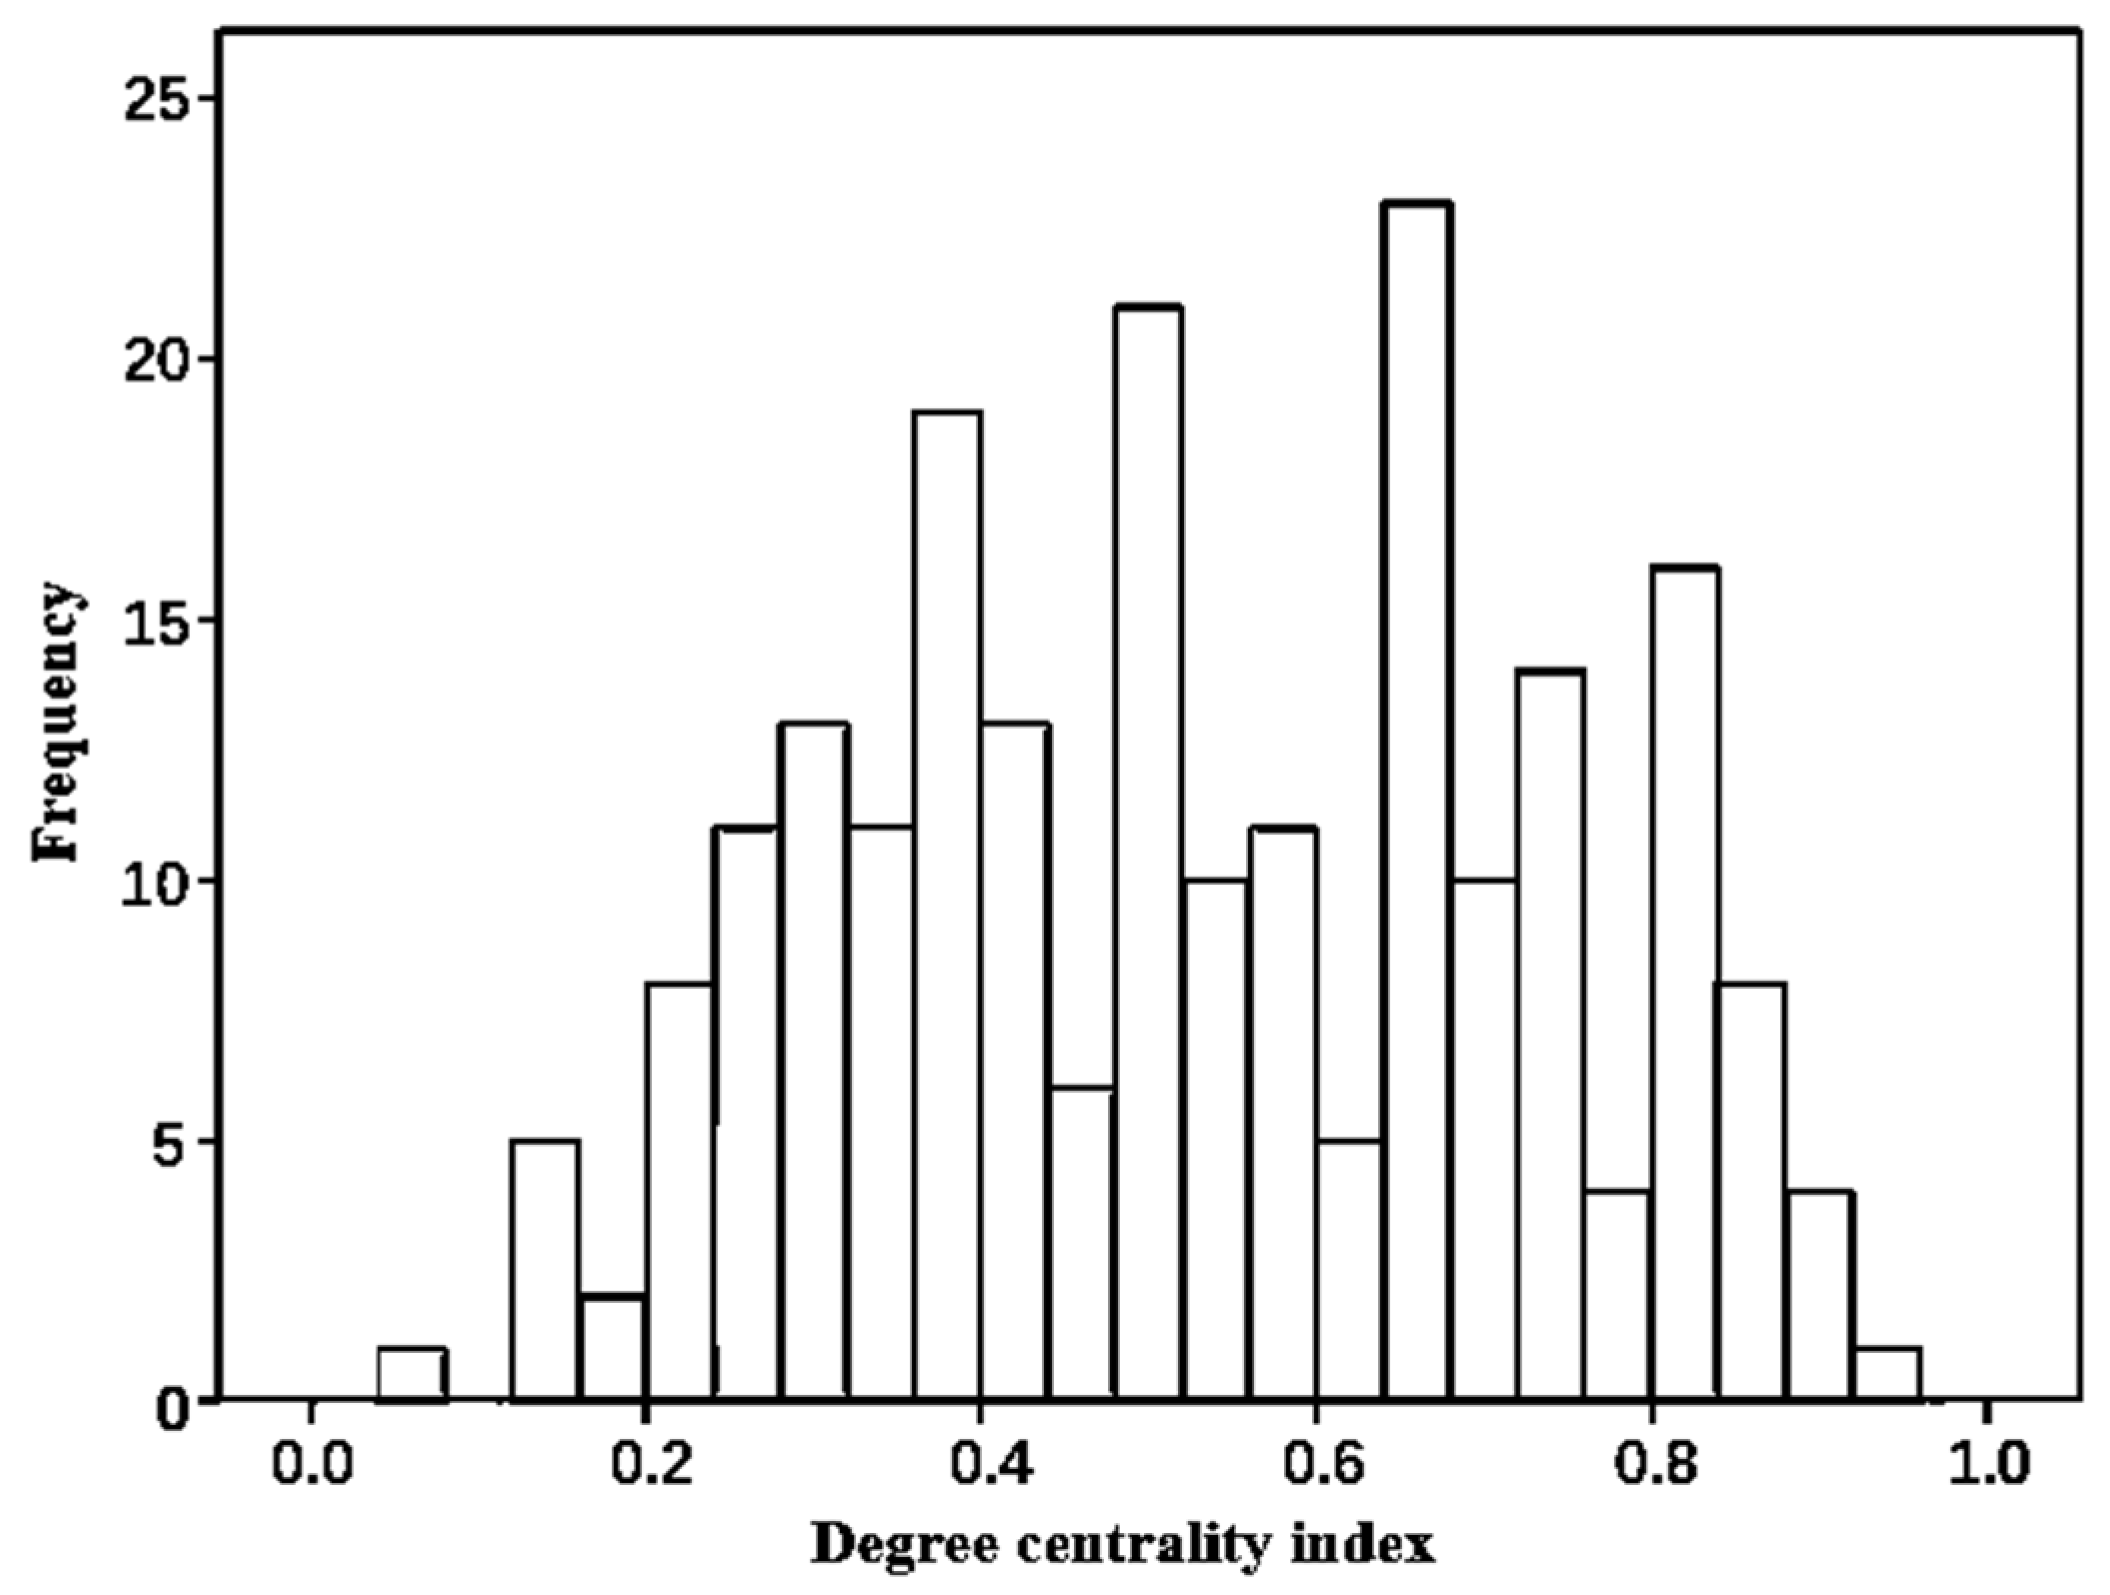
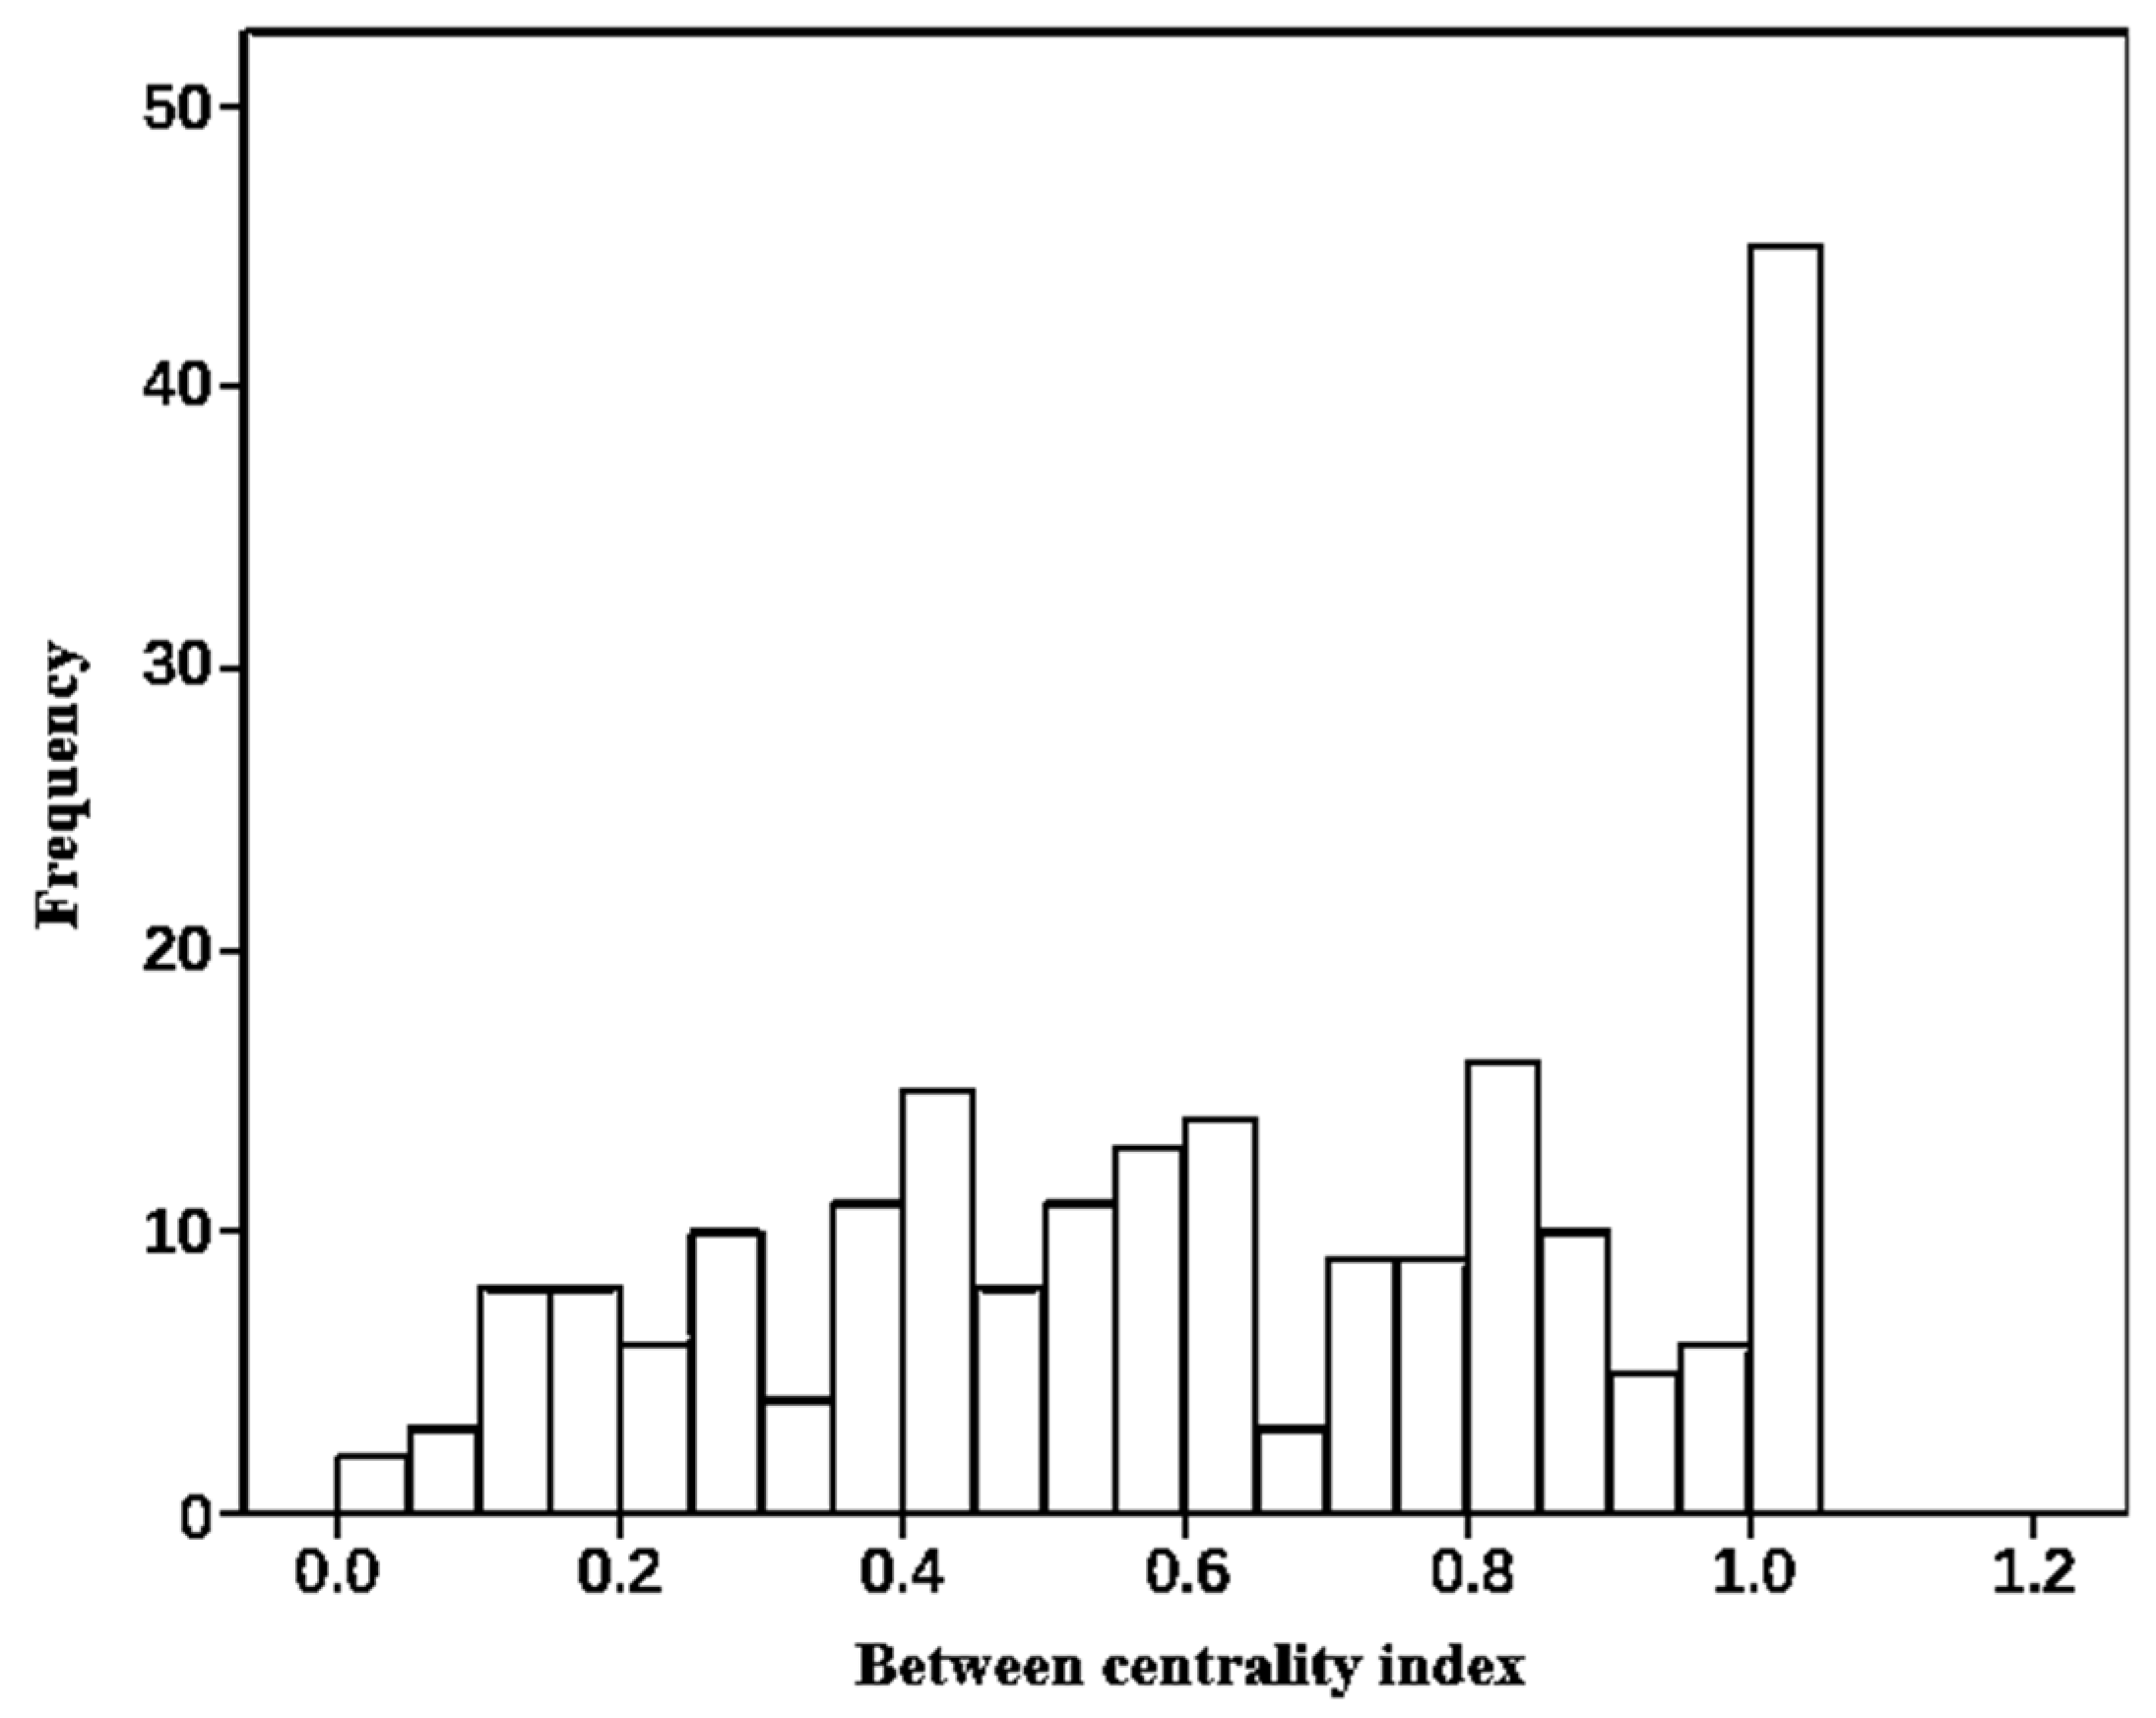
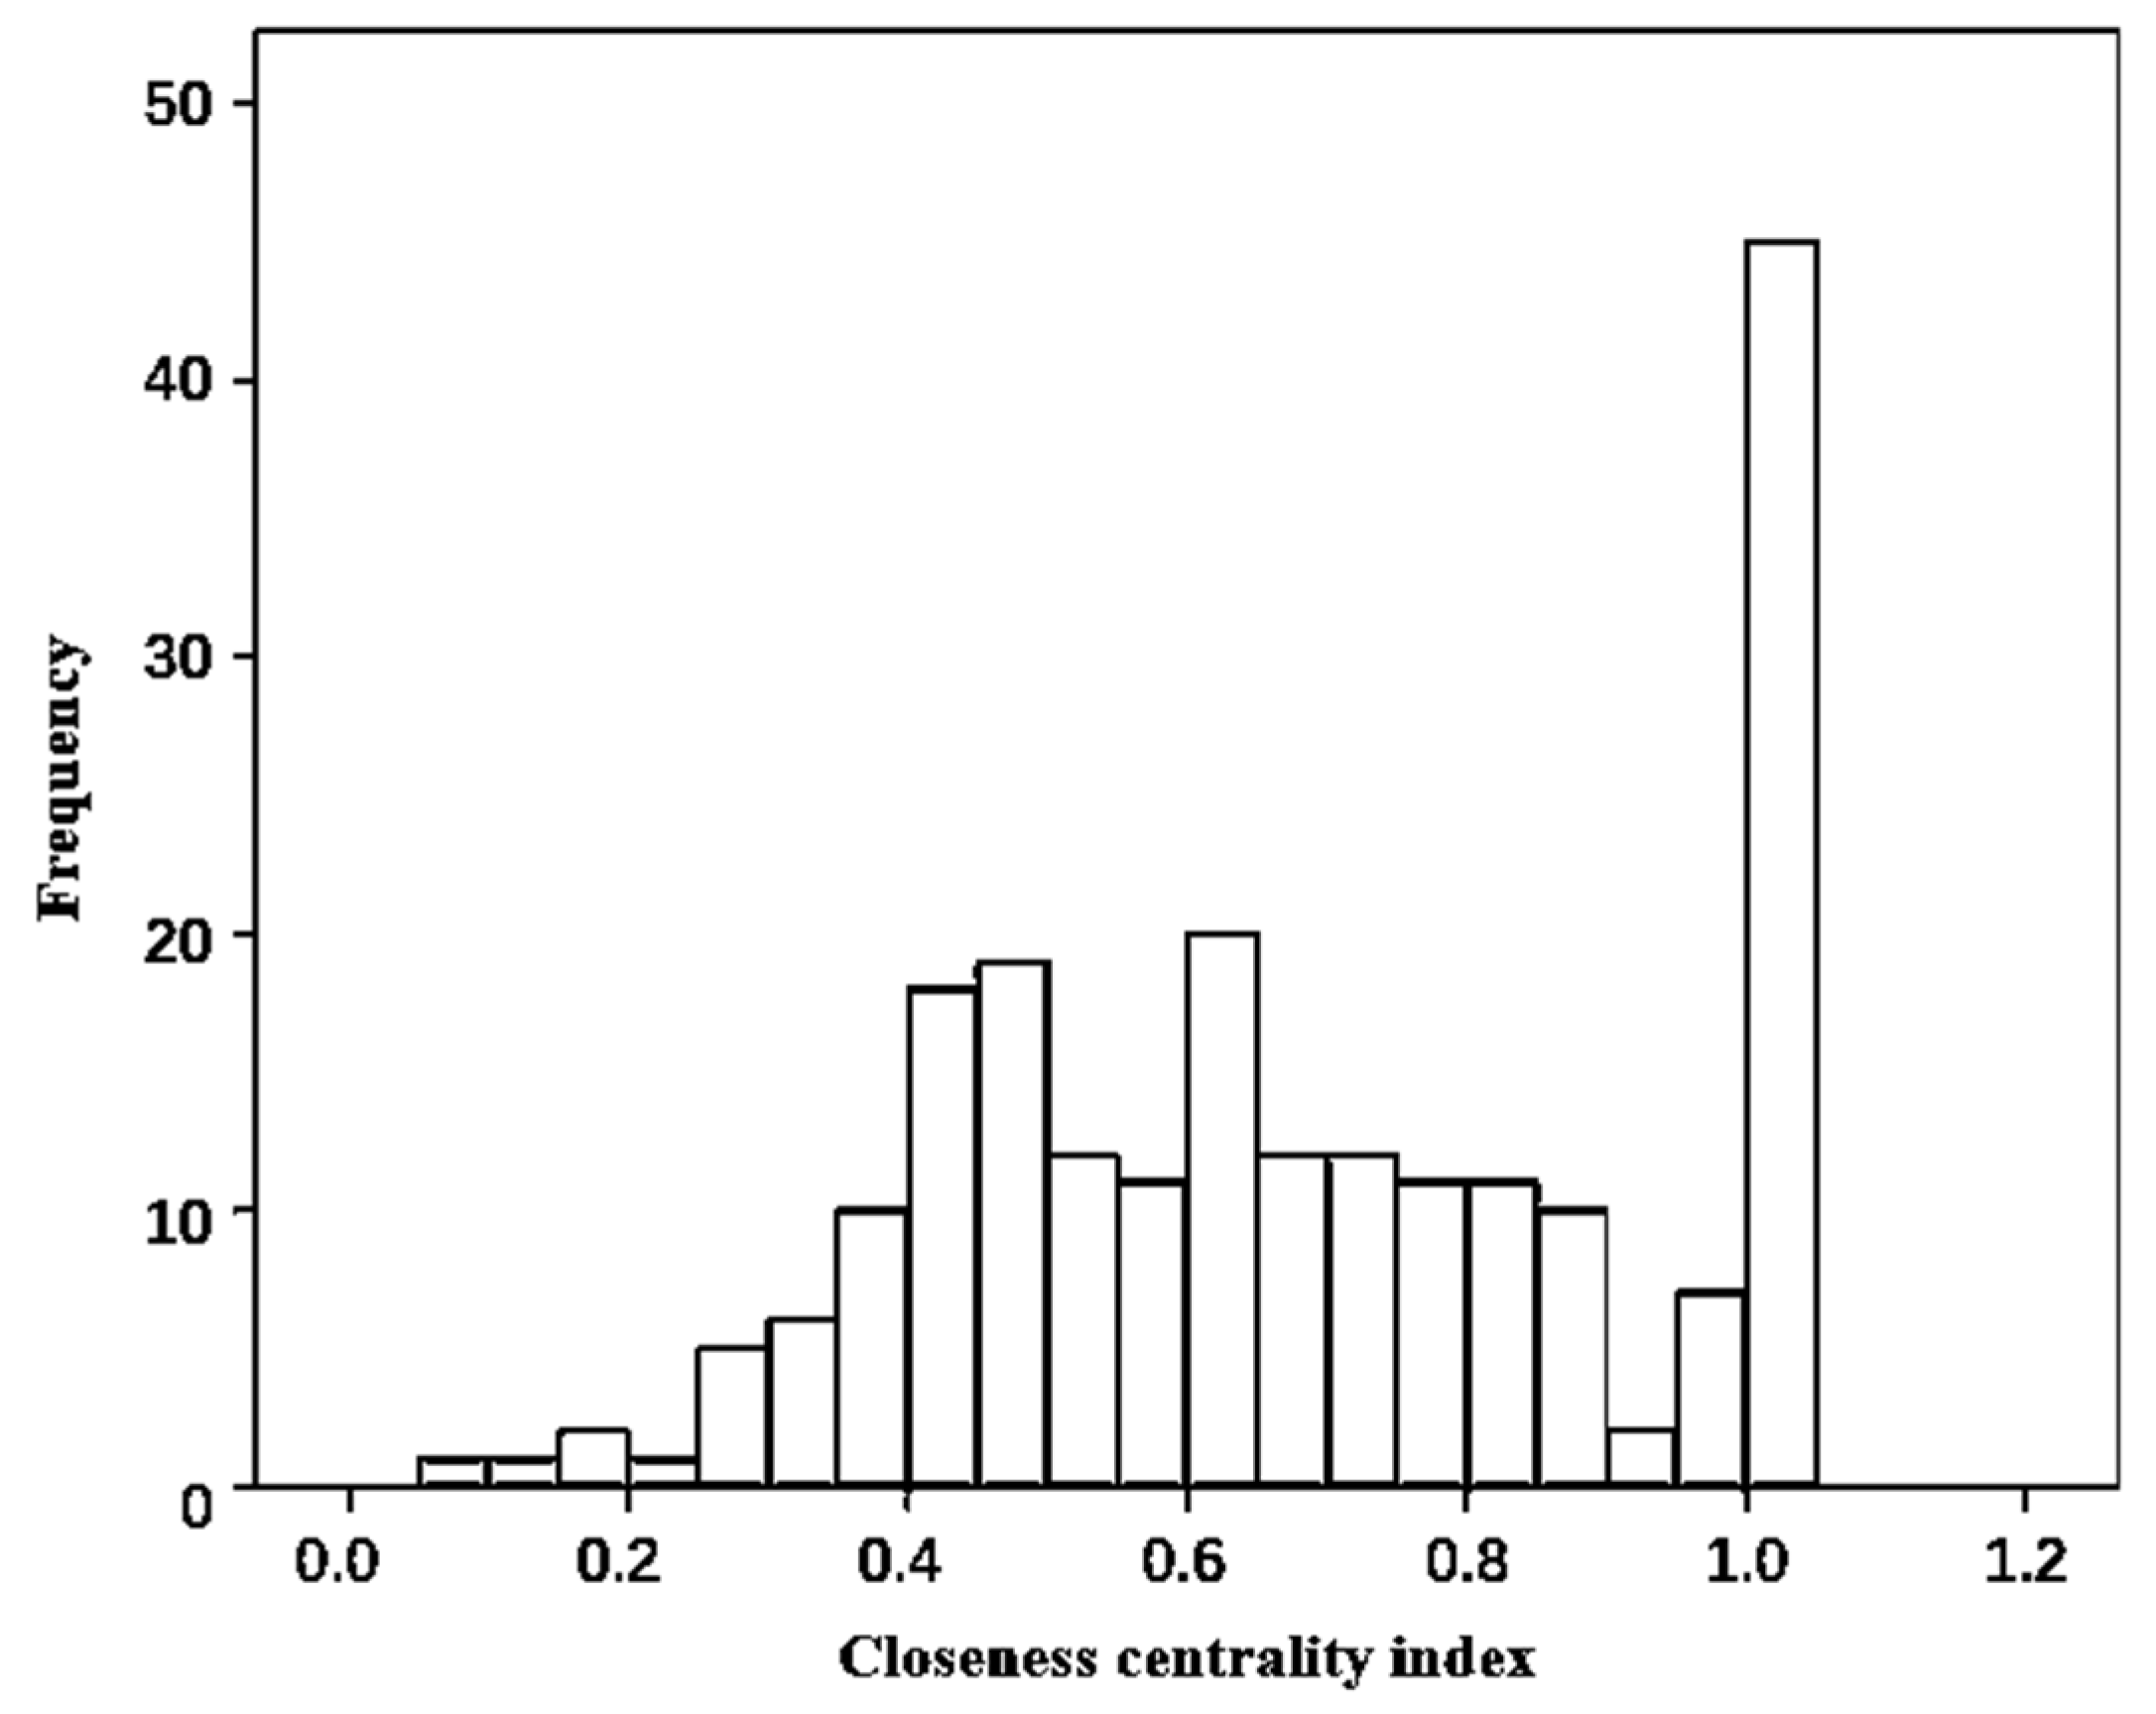
4.1.2. Network Centrality Analysis

Network centrality is a critical index for measuring the centralization degree of a network structure. The commonly used network centrality indexes include degree centrality, between centrality, and closeness centrality.
The degree centrality indicates the degree of concentration of individual behavior in the overall network. In the collusive bidding networks, a higher degree centrality means that the individual is located closer to the central position of the network and has more control power over the network.
In terms of the indicator of degree centrality in Table 2, the results of the degree centrality of the 216 cases are presented in Figure 4, which shows that the maximum value, minimum value, mean value, and standard deviation of the sample’s network degree centrality index were 0.929, 0.056, 0.527, and 0.205, respectively. The degree centrality represents the extent to which a network is concentrated to a point, that is, whether there is a convenor controlling the network [61]. There was a core actor in the bidders’ collusive network. The frequency distribution was relatively dispersed, and the collusive network of bidders presented diversity and complexity concerning the connection structure, which had the characteristics of a random network.
The between centrality measures the equilibrium degree between the centrality of all nodes in the network. In the collusive bidding network, the high between centrality indicated that there may be several small groups among the participants in the network. The central node was in a critical position in the collusive bidding network.
According to the indicator of between centrality in Table 2, the results of the between centrality of the 216 cases are presented in Figure 5, which shows that the maximum value, the minimum value, the mean value, and the standard deviation of the network between centrality index were 1, 0, 0.636, and 0.292, respectively. The results show that bid riggers had significant differences regarding the control of resources in the collusive network. The distribution was random, and the convenors with strong control power and weak control power existed together. The between centrality index of 45 samples was 1, accounting for 20.8% of the total sample. The frequency distribution of the between centrality index of the other regions was relatively uniform.
The data analysis further revealed that the between centrality index of the 45 samples was 1. The number of bid riggers in the sample was mostly 3–6, and the number of collusive bidding groups was 3–4. This was a typical star-shaped network structure in which only the core nodes related to other nodes. The suggestion is that small-scale collusion appears in project bidding: one convenor contacts several groups to associate or borrow qualifications to participate in the bidding. These participants have no relationship with each other. The convenor controls 100% of the participants and has absolute control power over the collusive bidding group.
The closeness centrality is a measure of an actor’s ability to be outside the control of others. In the collusive bidding network, participants with lower closeness centrality have higher accessibility to other participants. They are often at the center of networks and have a high anti-attack ability.
Considering the indicator of closeness centrality in Table 2, the results of the closeness centrality of the 216 cases are presented in Figure 6, which shows that the maximum value, the minimum value, the mean value, and the standard deviation of the sample network close to the central potential index were 1, 0.061, 0.679, and 0.239, respectively. A small number of samples in the frequency distribution were found in the range from 0.000 to 0.200, indicating that participants in the collusive network of bidders were affected by other groups or members. The group’s anti-attack ability was insufficient. The samples with the network near the central potential index of 1 accounted for 20.830%, reflecting that the bid riggers were not independent in the conspiracy. The interaction produced by the collusion relationship would impact the collusive decision-making behaviors.

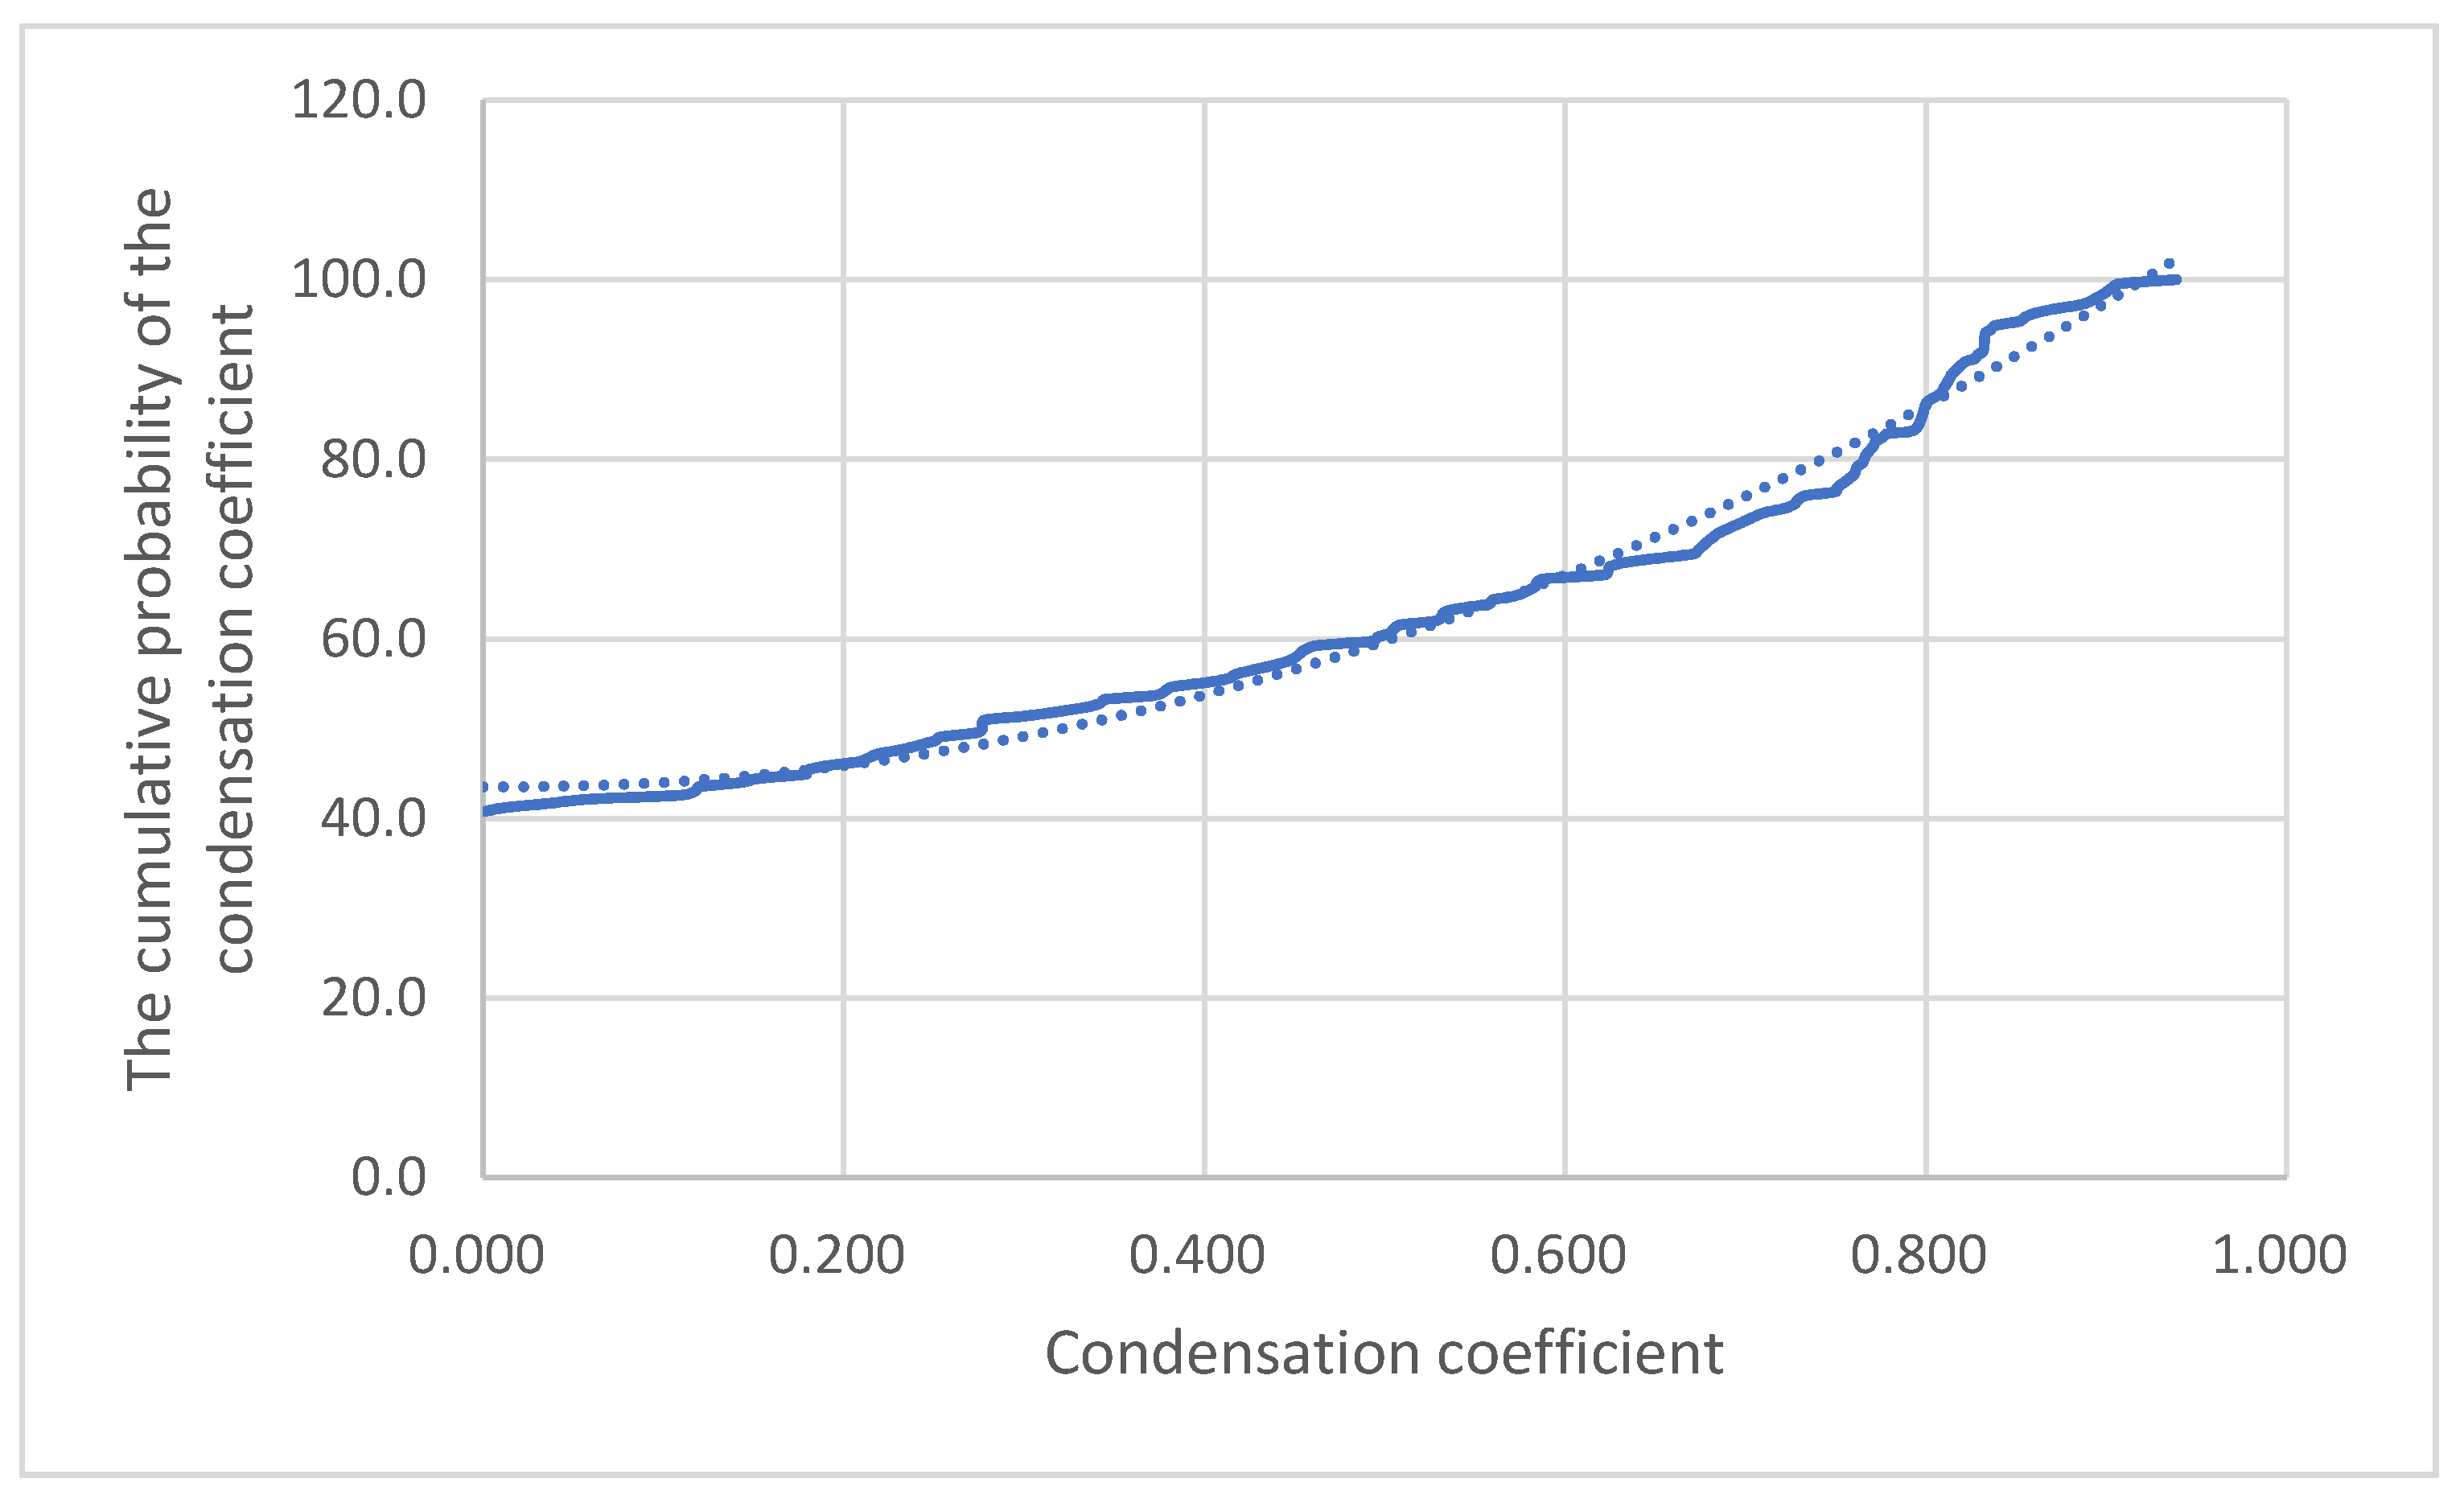
4.1.3. Condensation Analysis

The condensation coefficient reflects the cohesion between individuals in the collusive groups. The greater the condensation coefficient of the overall network, the closer the connection between adjacent nodes in the network, and consequently, the more intense the collusion relationship within collusive groups.
According to the indicator of the condensation coefficient in Table 2, the distribution of the statistical condensation coefficient is shown in Figure 7, with an average value of 0.352. The convenors tended to gather together, but they were not closely connected, and the group’s overall anti-strike ability was poor [60]. The condensation coefficient of 40.7% of the samples was 0, indicating that there was no collusion relationship between three or more actors in the network. There are two main kinds of network structures in which the condensation coefficient is 0: a star network and a linear network. In these two kinds of small-scale collusive groups, convenors have absolute control over resource allocation and information transmission, and an attack on convenors will lead to the collapse of collusive bidding networks.
At the same time, the convenor has limited control over the collusive network. As the scale of the group increases, two situations may occur: (1) The network structure stays unchanged, the convenors’ control over the facilitators of the marginal structure increases, and the degree centrality index of the overall network ascends. (2) To realize collusive purposes, the convenor needs to seek the help of external facilitators via intermediaries. Although the convenors’ resource allocation and information of the collusive network transmission play an essential role, the control power in the network is scattered, the control power of the convenor is weakened, and the close to central power index and the intermediate central power index decrease. In the actual governance of collusive bidding, attacks on the collusion intermediary will cause the partial failure of the collusive network, and an attack on the convenors will make the collusive network invalid. The network structure changes as the size of the group increases, as shown in Figure 8.

4.2. Clustering Analysis

Cluster analysis is also called system analysis [62]. It is a statistical analysis method that is used to study the classification problem (sample or index) using an essential data mining algorithm. Among the popular clustering algorithms, the K-means is the one that is simple, fast, and center-based [63]. In addition, Ma and Yong [64] also used the K-means algorithm for short text in social networks. Therefore, this study selected the K-means algorithm for cluster analysis.

4.2.1. Basic Principle

The K-means algorithm has had many changes over time, but the basic idea has not changed. The K-means algorithm randomly extracts K data from the original N data as the initial grouping center matches K data with other data according to the distance and then allocates them. For a pair, the algorithm compares them to the most similar group, then calculates the centers for all new groups, and repeats this step until the standard measure function converges [62]. The mean square error method is usually used to measure the standard measurement functions. K groups have the following characteristics: the data within each group is very similar but the data is far apart.

4.2.2. K-Means Clustering Analysis

The clustering variables were selected to determine the overall network density, average path length, cohesion coefficient, degree central potential index, middle central potential index, and near central potential index. According to the calculation results of these indicators in Section 4.1, the K-means clustering algorithm was used to perform the clustering analysis. K = 3 was determined using the elbow criterion [65]. After 11 iterations, the correlation distance function was chosen because it was more sensitive to the collusive bidding networks pattern, regardless of the magnitude [65]. Three clustering centers were obtained, as shown in Table 3.

5. Findings and Discussion

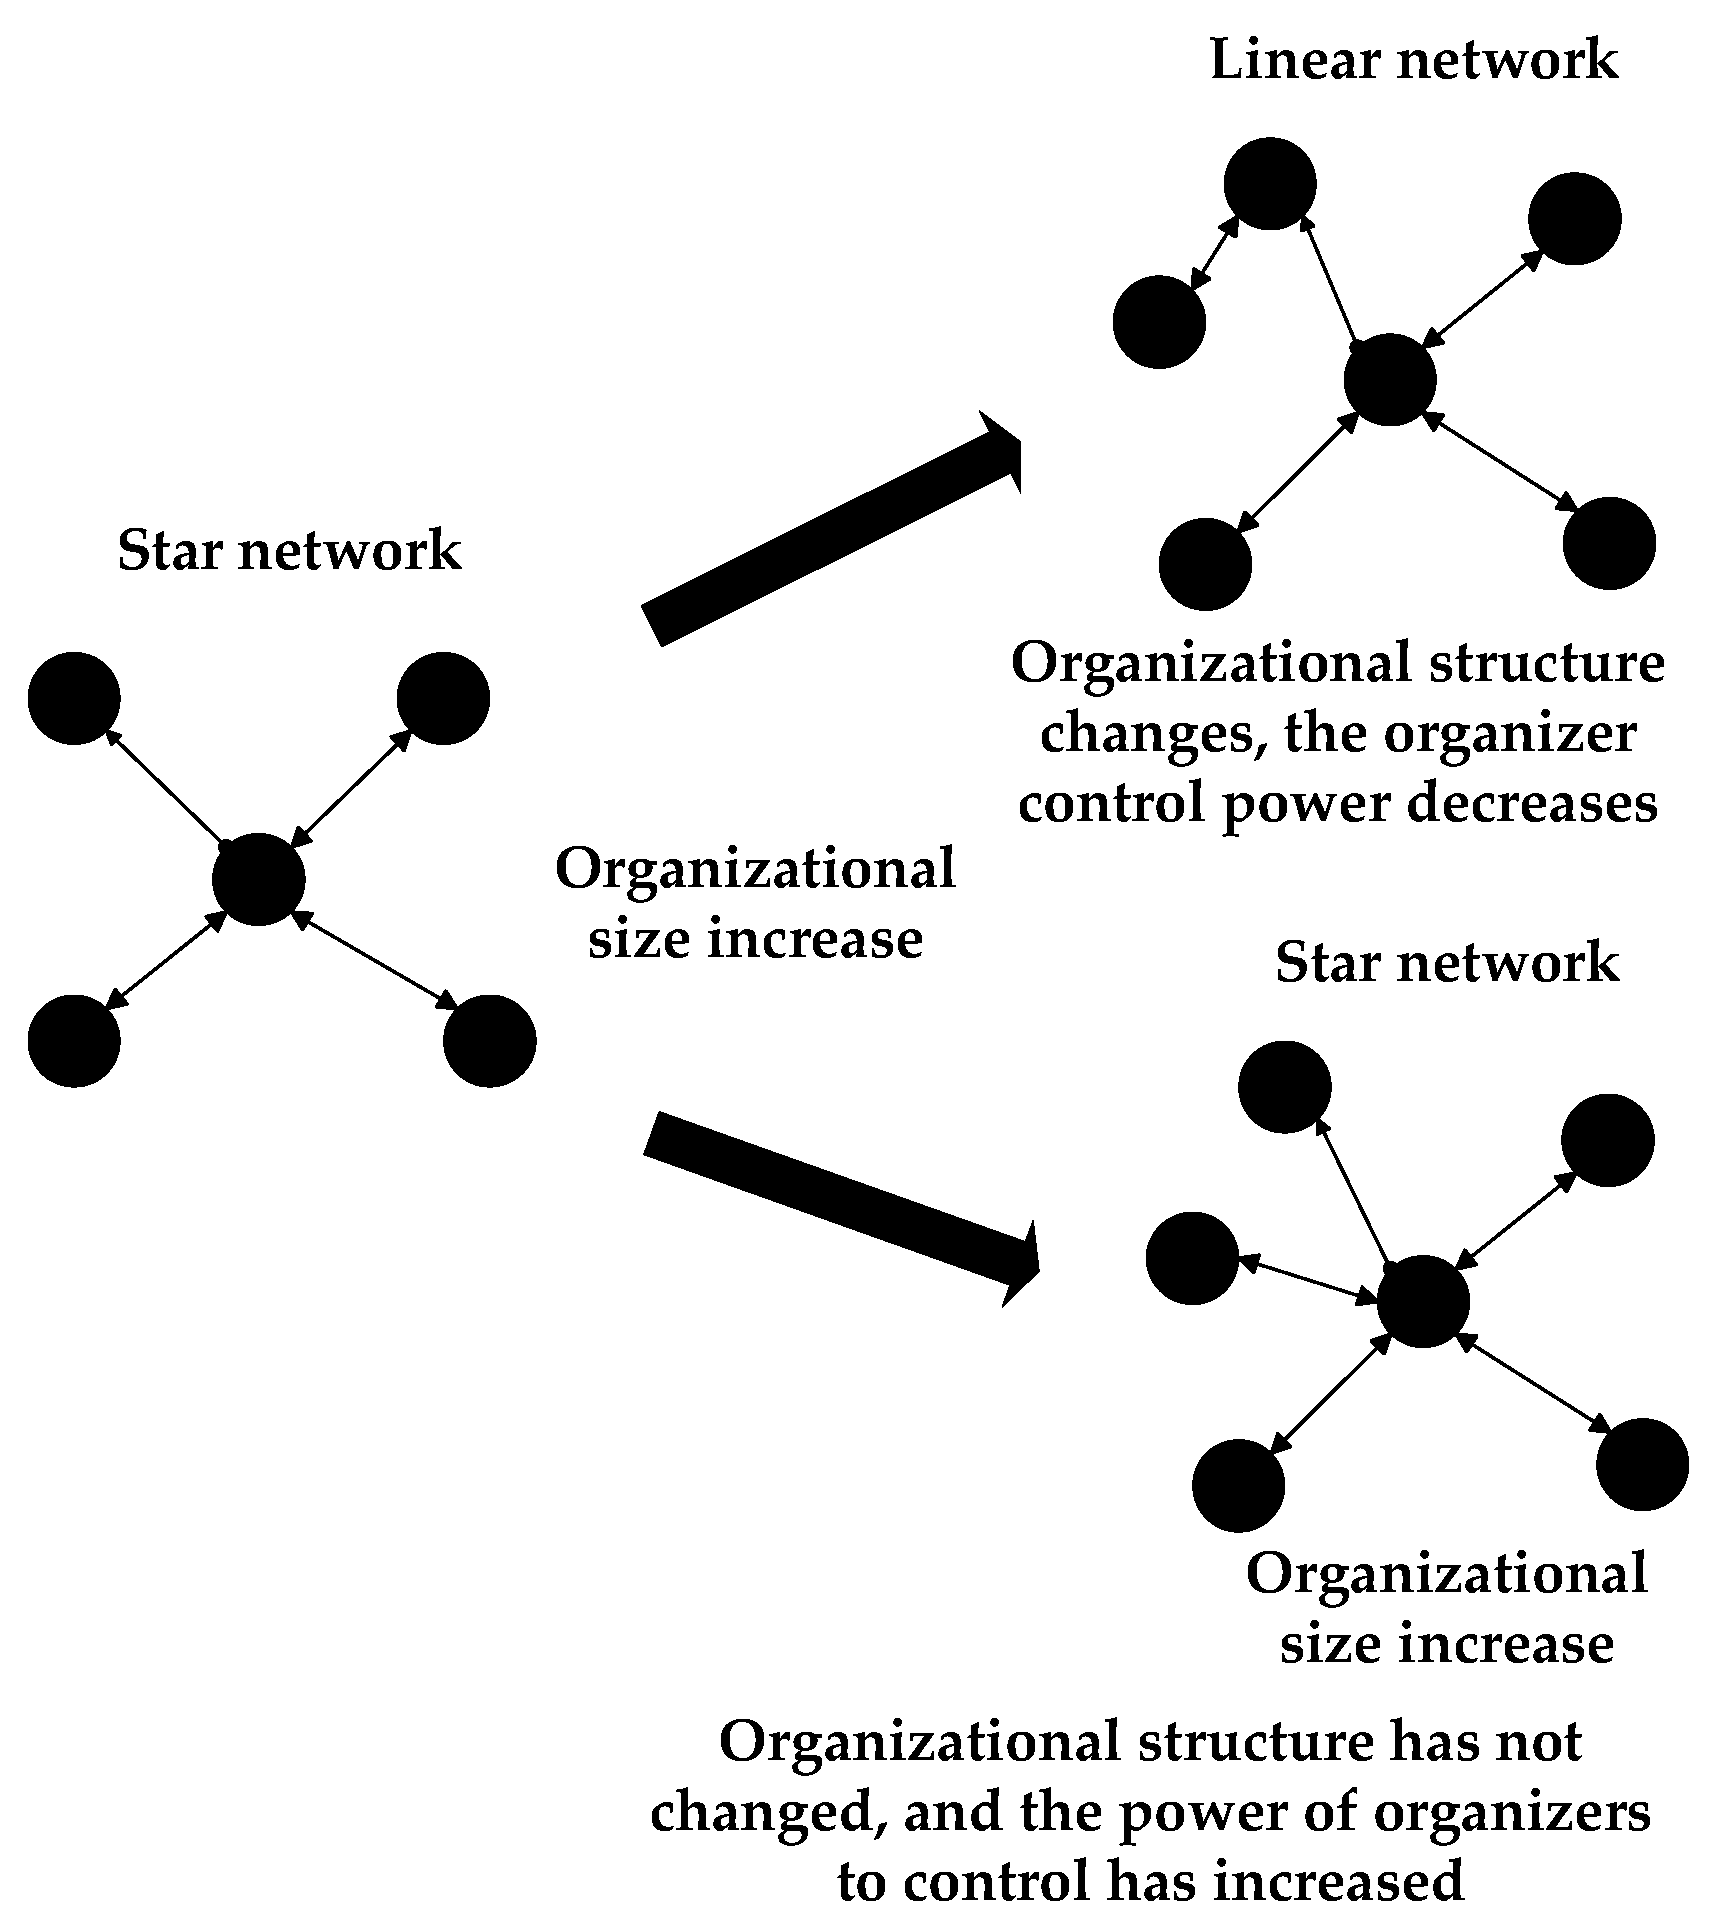
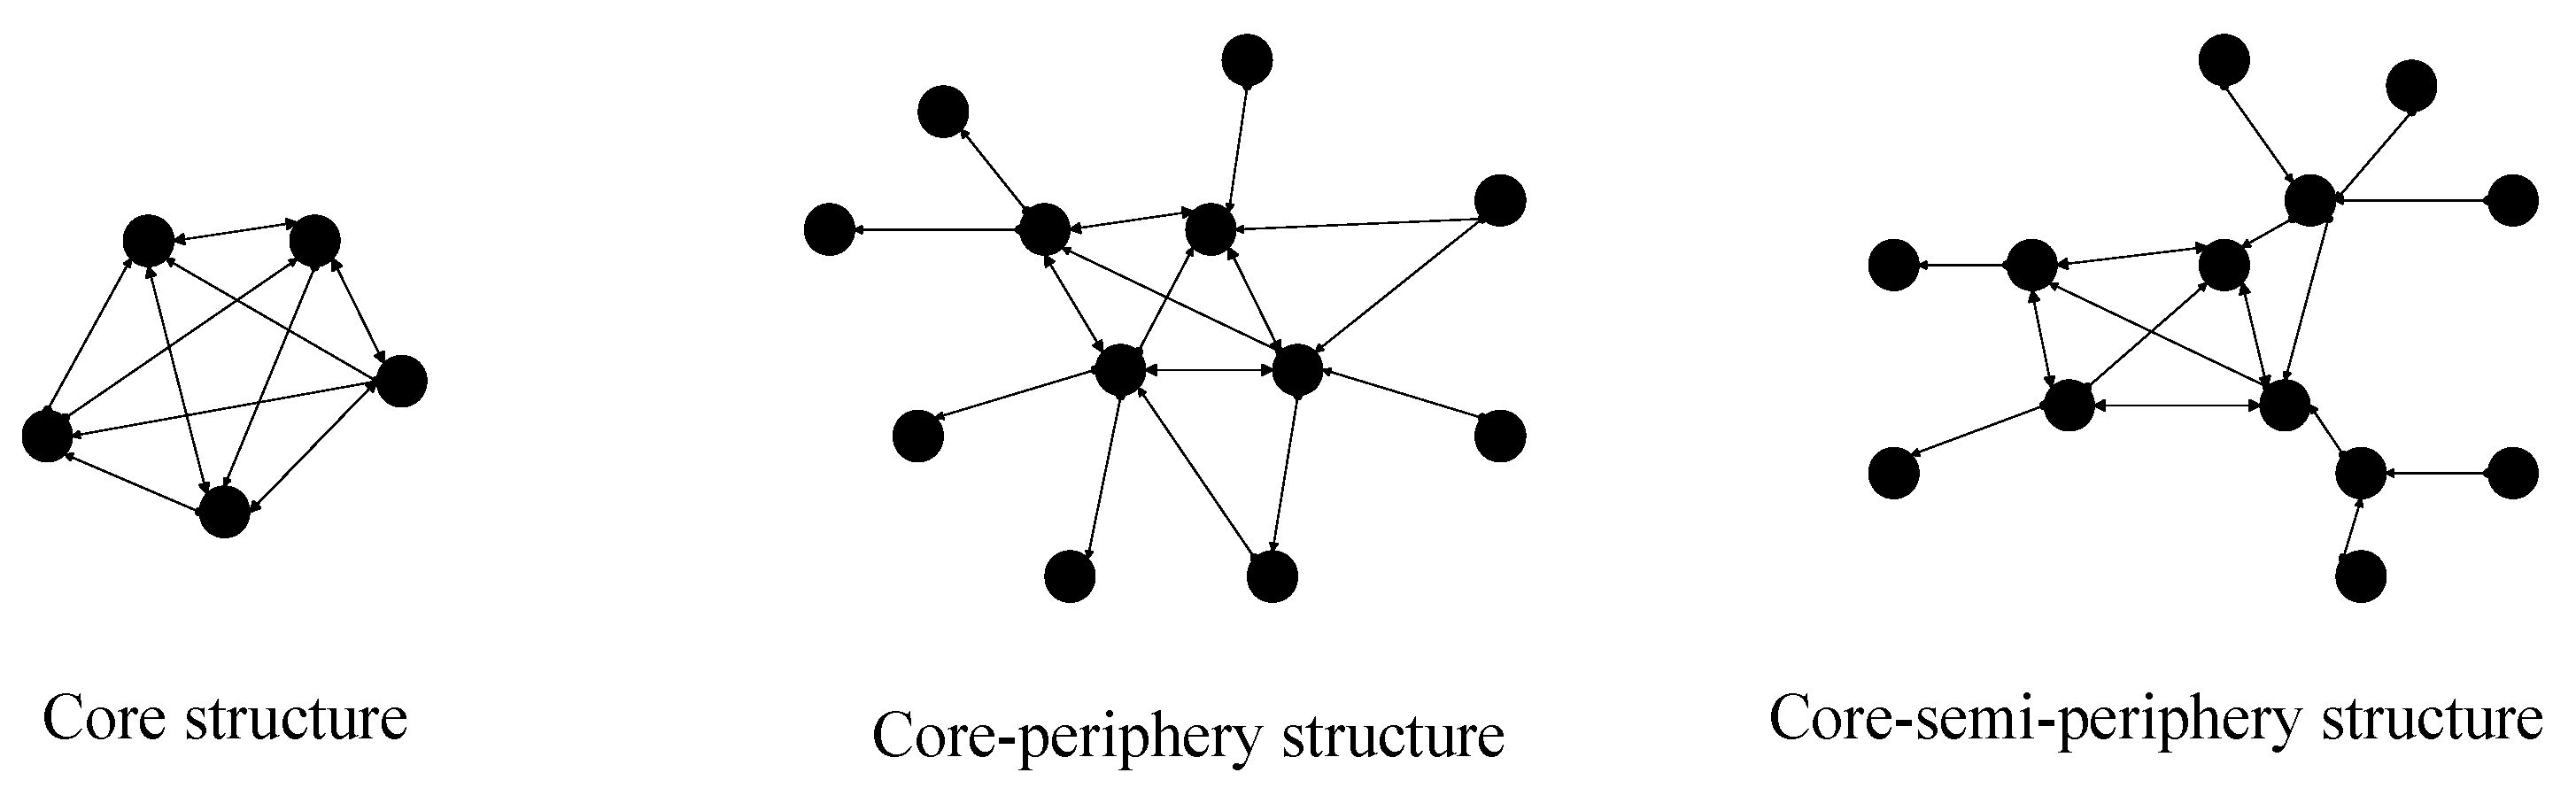
5.1. Collusive Network Structure

According to Table 3, the samples were divided into three clusters using calculations, corresponding to three types of bidder collusion structures. The number of members in each of the three types was 70, 90, and 56, respectively. As Figure 9 indicates, the network structure of the samples was near the three cluster centers.
In cluster 1, the overall network density, average path length, and cohesion coefficient were larger, and the bid riggers had more relationships. The information and resources in the network were accessible. However, the three centrality indexes were low, and the convenors had low power to control resources. In cluster 2, the overall network density and condensation coefficient were slightly lower than in cluster 1. The average path length was larger, and the three centrality indexes were at an intermediate level. There were apparent controllers of collusive relationships in the collusive network, and the transmission of collusive information and resources needed to be distributed or transmitted through convenors and intermediaries. Cluster 3 showed a higher potential index and potential index close to the center but had an overall low network density and condensation coefficient. The average path length was significantly lower than in clusters 1 and 2. The collusive control power was highly concentrated to a certain convenor. The convenor controlled the facilitators participating in the bid rigging but was not controlled by other facilitators.
Further, according to the role of individuals in the network and the degree of the collusive relationship between individuals, the collusive network was divided into three types: a core structure, a core–periphery structure, and a core–semi-periphery structure. These three types of collusive bidding networks are illustrated in Figure 10. The core structure was a small group composed of relatively stable individual organizations with a small number of people, a common purpose, and more mutual contact. The core–periphery structure comprised several individual contacts that were closely related to the center and sparse distributed peripheral structure. The characteristic was that nodes in the core region were not further divided into independent cohesive subgroups. The nodes at the periphery only maintained a close relationship with some connected core nodes, while the peripheral nodes were sparsely connected and presented a scattering periphery distribution. The core–semi-periphery structure was a kind of structure in which there was an intermediary individual acting within the core–periphery structure, which related to the core structure and other nodes of the periphery structure. Those in this structure used the relationship network to obtain benefits, but they were not completely connected with the core structure.
Using collusion cases in the Dutch construction industry, Le et al. [66] stressed that actors at the center of the collusive network dominated the project network during the construction period, thereby obtaining personal benefits. While our study concurred with this point of view, cluster 3 displays that the convenor had strong dominance. This finding complements the work by Reeves and Morselli [24], which proposed using the core–periphery social network method to track the emergence of such a conspiracy in the city of Laval (Canada) by illustrating the evolution of bid-rigging networks revolving around suspected and persistent acts of corruption, bid rigging, and bribery. Therefore, the study presented in this paper is an extension of the current work on collusive bidding.

5.2. Collusive Bidding Types

The nature of collusive bidding varies from one type to another. Lee et al. [67] argued that bid riggers generally utilize two types of bid schemes to collude, namely, rotating and complementary bid schemes. In contrast, the research is not comprehensive and detailed on the types and characteristics of collusion. In this study, based on the cases published by judicial institutions, we examined the overall characteristics of the disclosed collusion among bidders. The results suggest that collusive bidding can be classified into three categories based on an overall social network, as shown in Table 4.
The network accessibility, centrality, and stability of the three kinds of bidder collusion modes were different. Combined with the organization forms of collusion, the bidder collusion was divided into contractual, spontaneous, and shadow.
The first type, contractual collusion, comprises a relatively stable, small number of convenors with a common purpose and contact with each other. A relatively stable “bidding alliance” is formed to ensure that groups within the collusion organization win the bid through negotiated bid quotations and exclude other bidders [5]. These groups often occupy a particular market share, and the probability of winning the bid after colluding is relatively high. After winning the bid, the participants’ rewards are distributed through subcontracting or direct payment of profits following the contract.
The second type is spontaneous collusion. A few convenors first reach a contract to form a bidding alliance and invite other participants to “accompany the bid” to increase their winning probability [5]. The more “accompany bid” groups that are requested, the greater the winning probability. In this kind of collusive network, the nodes in the core region are closely connected and the periphery is sparsely scattered. In contrast, the nodes at the periphery are only closely related to some core nodes. Thus, the periphery nodes are sparsely connected and present a scattered periphery distribution.
The third type is shadow collusion. The idle social personnel are attached to several bidding groups simultaneously or participate in the bidding by borrowing their qualifications [5]. Several groups participate in the bidding on the surface, but a few people are manipulating events behind the scenes. This kind of collusion presents the characteristics of a star network; there is a core node and the periphery node is closely connected with the core node, but there is no relationship between them.
Existing studies have noted the collusive bidding types from participation scope and collusive content perspectives [7,23,68], but this classification is relatively incomplete and lacks support from data. From the social network standpoint, this study used the social network method to conduct a quantitative analysis of 216 cases and obtained the types and network characteristics of the collusive bidding. Considering the three types in the order presented in Table 4, the number of network species nodes decreased gradually, the network centrality increased, the number of triangles in the network structure diagram decreased, and the organizational stability was weakened. Quantitative research will fill the gap on the collusive network structure of bidders, which will help to understand the characteristics of the collusion network structure more clearly.

6. Conclusions

Collusive bidding is all-pervasive in the construction industry. It damages market fairness and brings engineering quality risks, thereby deserving strict regulations from antitrust authorities. Bid riggers form a complex network relationship. Behind a collusive bid is a social network, which provide the carrier and shelter to carry out bid-rigging plans. Therefore, it is necessary to understand the network of collusive bidding groups for the inhibition of collusive bidding. This study examined the characteristics of collusive bidding networks and the types of collusive bidding groups in construction using social network theory. It was found that the bidders’ collusive network model revealed the network characteristics and the main types of collusive relationships from the network structure of collusion groups. The findings show that: (1) The collusive network was sparse, small in scale, universal in concentration, and strong in randomness. Consequently, the interaction difficulty of collusive behaviors in the network was low, and the information in the organization spread rapidly. (2) The bidders’ collusion had three types of structure: contract, spontaneous, and shadow, each with a different centrality, connectivity degree, and stability.
The contribution of this study is three-faceted. First, from the research perspective, it constructed a network model of collusive bidding by using empirical data mining. Second, social network analysis was instrumental in exploring the essence of collusive bidding, which is significant in that it provides a reference for detecting the collusion between tenderers and bidders and collusion in other industries. Third, in terms of research content, empirical data of bidders’ collusion social network was obtained through data mining, which enriched the study of collusive networks to a certain extent and has significance as a reference for the understanding and governance of collusion behavior in China. However, this study took little account of the strength and direction of collusive relationships when constructing the bidders’ collusive networks. Future studies are recommended to consider the strength and direction of the relationships between the bid riggers in a collusive bidding network.

Author Contributions

L.X.: Conceptualization, Methodology, Analysis, Investigation, Writing—original draft, and writing—review and editing. K.Y.: Conceptualization, Analysis, Writing—review and editing, and Project administration. J.Z.: Conceptualization, Data collection, Methodology, and Visualization. X.Y.: Data collection, Methodology, and Visualization. R.S.T.: Conceptualization and Writing—review and editing. All authors have read and agreed to the published version of the manuscript.

Funding

This research was funded by the Humanities and Social Science Foundation of the Ministry of Education of China (grant no. 19YJC630065) and National Natural Science Foundation of China (grant no. 71871033).

Data Availability Statement

Data are available from the authors upon request.

Conflicts of Interest

The authors declare no conflict of interest.

References

  1. Nordin, R.M.; Takim, R.; Nawawi, A.H. Behavioural factors of corruption in the construction industry. Procedia Soc. Behav. Sci. 2013, 105, 64–74. [Google Scholar] [CrossRef] [Green Version]
  2. Le, Y.; Shan, M.; Chan, A.P.C.; Hu, Y. Overview of corruption research in construction. J. Manag. Eng. 2014, 30, 02514001. [Google Scholar] [CrossRef] [Green Version]
  3. Lengwiler, Y.; Wolfstetter, E.G. Auctions and corruption: An analysis of bid rigging by a corrupt auctioneer. J. Econ. Dyn. Control. 2010, 34, 1872–1892. [Google Scholar] [CrossRef]
  4. Chotibhongs, R.; Arditi, D. Analysis of collusive bidding behaviour. Constr. Manag. Econ. 2012, 30, 221–231. [Google Scholar] [CrossRef]
  5. Brown, J.S.; Loosemore, M. Behavioural factors influencing corrupt action in the Australian construction industry. Eng. Constr. Arch. Manag. 2015, 22, 372–389. [Google Scholar] [CrossRef]
  6. Ameyaw, E.E.; Pärn, E.; Chan, A.P.; Manu, D.-G.O.; Edwards, D.J.; Darko, A. Corrupt practices in the construction industry: Survey of Ghanaian experience. J. Manag. Eng. 2017, 33, 05017006. [Google Scholar] [CrossRef]
  7. Ballesteros-Pérez, P.; González-Cruz, M.C.; Cañavate-Grimal, A.; Pellicer, E. Detecting abnormal and collusive bids in capped tendering. Autom. Constr. 2013, 31, 215–229. [Google Scholar] [CrossRef] [Green Version]
  8. Le, Y.; Shan, M.; Chan, A.P.C.; Hu, Y. Investigating the causal relationships between causes of and vulnerabilities to corruption in the Chinese public construction sector. J. Constr. Eng. Manag. 2014, 140, 05014007. [Google Scholar] [CrossRef]
  9. Oke, A.; Aigbavboa, C.; Mangena, Z. Prevention of collusion for innovative construction. Procedia Eng. 2017, 196, 491–497. [Google Scholar] [CrossRef]
  10. Padhi, S.; Mohapatra, P.K. Detection of collusion in government procurement auctions. J. Purch. Supply Manag. 2011, 17, 207–221. [Google Scholar] [CrossRef]
  11. Zarkada-Fraser, A. A classification of factors influencing participating in collusive tendering agreements. J. Bus. Ethic. 2000, 23, 269–282. [Google Scholar] [CrossRef]
  12. Bowen, P.A.; Edwards, P.J.; Cattell, K. Corruption in the South African construction industry: A thematic analysis of verbatim comments from survey participants. Constr. Manag. Econ. 2012, 30, 885–901. [Google Scholar] [CrossRef]
  13. Graafland, J.J. Collusion, reputation damage and interest in codes of conduct: The case of a Dutch construction company. Bus. Ethics A Eur. Rev. 2004, 13, 127–142. [Google Scholar] [CrossRef] [Green Version]
  14. Ming, S.; Yun, L.; Yiu, K.; Chan, A.; You, Z. Assessing collusion risks in managing construction projects using artificial neural network. Technol. Econ. Dev. Econ. 2018, 24, 2003–2025. [Google Scholar]
  15. Ratshisusu, H. Limiting collusion in the construction industry: A review of the bid-rigging settlement in South Africa. J. Econ. Financ. Sci. 2014, 7, 587–606. [Google Scholar] [CrossRef]
  16. Wang, X.; Ye, K.; Arditi, D. Embodied cost of collusive bidding: Evidence from China’s construction industry. J. Constr. Eng. Manag. 2021, 147, 04021037. [Google Scholar] [CrossRef]
  17. Zou, P. Strategies for minimizing corruption in the construction industry in China. J. Constr. Dev. Ctries. 2006, 11, 15–29. [Google Scholar]
  18. Zhang, B.; Le, Y.; Xia, B.; Skitmore, M. Causes of business-to-government corruption in the tendering process in China. J. Manag. Eng. 2017, 33, 05016022. [Google Scholar] [CrossRef] [Green Version]
  19. Encyclopedia, B. 11.15 High-Rise Residential Fires in Jing’an District, Shanghai. Available online: https://baike.baidu.com/item/11%C2%B715%E4%B8%8A%E6%B5%B7%E9%9D%99%E5%AE%89%E5%8C%BA%E9%AB%98%E5%B1%82%E4%BD%8F%E5%AE%85%E5%A4%A7%E7%81%AB/8608055?fr=aladdin (accessed on 15 November 2010).
  20. Xing, J.; Ye, K.; Zhu, W.; Tang, P. The formation of construction bid-rigging: An analysis based on the theory of planned behavior. In Construction Research Congress 2020: Project Management and Controls, Materials, and Contracts; American Society of Civil Engineers: Reston, VA, USA, 2020; pp. 1239–1246. [Google Scholar] [CrossRef]
  21. Morselli, C.; Ouellet, M. Network similarity and collusion. Soc. Netw. 2018, 55, 21–30. [Google Scholar] [CrossRef]
  22. Dorée, A.G. Collusion in the Dutch construction industry: An industrial organization perspective. Build. Res. Inf. 2004, 32, 146–156. [Google Scholar] [CrossRef]
  23. Heuvel, G.V.D. The Parliamentary enquiry on fraud in the Dutch construction industry collusion as concept between corruption and state-corporate crime. Contemp. Crises 2005, 44, 133–151. [Google Scholar] [CrossRef]
  24. Reeves-Latour, M.; Morselli, C. Bid-rigging networks and state-corporate crime in the construction industry. Soc. Netw. 2017, 51, 158–170. [Google Scholar] [CrossRef]
  25. Porter, R.H. Detecting collusion. Rev. Ind. Organ. 2005, 26, 147–167. [Google Scholar] [CrossRef]
  26. Ling, F.Y.Y.; Tran, P.Q. Effects of interpersonal relations on public sector construction contracts in Vietnam. Constr. Manag. Econ. 2012, 30, 1087–1101. [Google Scholar] [CrossRef]
  27. Tabish, S.; Jha, K.N. The impact of anti-corruption strategies on corruption free performance in public construction projects. Constr. Manag. Econ. 2012, 30, 21–35. [Google Scholar] [CrossRef]
  28. Zarkada-Fraser, A.; Skitmore, M. Decisions with moral content: Collusion. Constr. Manag. Econ. 2000, 18, 101–111. [Google Scholar] [CrossRef] [Green Version]
  29. Alutu, O.E.; Udhawuve, M.L. Unethical practices in nigerian engineering industries: Complications for project management. J. Manag. Eng. 2009, 25, 40–43. [Google Scholar] [CrossRef]
  30. Bresson-Cartier, J. Corruption networks, transaction security and illegal social exchange. Political Stud. 1997, 45, 463–476. [Google Scholar] [CrossRef]
  31. Herrera, A.M.; Rodriguez, P. Bribery and the Nature of Corruption; Working Paper; Michigan State University: East Lansing, MI, USA, 2003; Available online: http://citeseerx.ist.psu.edu/viewdoc/download;jssionid=14140BCD2ECC1B12946200126DE37931?doi=10.1.1.381.3203&rep=rep1&type=pdf (accessed on 31 May 2001).
  32. Bergman, M.A.; Lundberg, J.; Lundberg, S.; Stake, J.Y. Interactions across firms and bid rigging. Rev. Ind. Organ. 2020, 56, 107–130. [Google Scholar] [CrossRef] [Green Version]
  33. Yao, Y.; Martek, I.; Hosseini, M.R.; Chen, C. Demographic variables of corruption in the chinese construction industry: As-sociation rule analysis of conviction records. Sci. Eng. Ethics 2019, 25, 1147–1165. [Google Scholar]
  34. Hu, A.; Offerman, T.; Onderstal, S. Fighting collusion in auctions: An experimental investigation. Int. J. Ind. Organ. 2011, 29, 84–96. [Google Scholar] [CrossRef] [Green Version]
  35. Uytsel, S.V. Artificial intelligence and collusion: A literature overview. Robot. AI Future Law 2018, 2018, 155–182. [Google Scholar]
  36. Roux, C.; Thoeni, C. Collusion among many firms: The disciplinary power of targeted punishment. J. Econ. Behav. Organ. 2015, 116, 83–93. [Google Scholar] [CrossRef]
  37. Gupta, S. Competition and collusion in a government procurement auction market. Atl. Econ. J. 2002, 30, 13–25. [Google Scholar] [CrossRef]
  38. Sohail, M.; Cavill, S. Accountability to prevent corruption in construction projects. J. Constr. Eng. Manag. 2008, 134, 729–738. [Google Scholar] [CrossRef] [Green Version]
  39. Tabish, S.; Jha, K.N. Analyses and evaluation of irregularities in public procurement in India. Constr. Manag. Econ. 2011, 29, 261–274. [Google Scholar] [CrossRef]
  40. Arney, C. Networks: An introduction. Math. Comput. Educ. 2012, 46, 214. [Google Scholar]
  41. Laumann, E.O.; Marsden, G. Community structure as interorganizational linkages. Annu. Rev. Sociol. 1978, 4, 455–484. [Google Scholar] [CrossRef]
  42. Provan, K.G.; Brinton, M.H. Institutional-level norms and organizational involvement in a service-implementation network. J. Public Adm. Res. Theory 1991, 4, 391–418. [Google Scholar]
  43. Goodwin, E.J. Network analysis, culture, and the problem of agency. Am. J. Sociol. 1994, 99, 1411–1454. [Google Scholar]
  44. Guimerà, R. Networks: An. Introduction; Oxford University Press: Oxford, MS, USA, 2012; ISBN 978-0-19-920665-0. [Google Scholar]
  45. Kitsak, M.; Gallos, L.; Havlin, S.; Liljeros, F.; Muchnik, L.; Stanley, H.E.; Makse, H.A. Identification of influential spreaders in complex networks. Nat. Phys. 2010, 6, 888–893. [Google Scholar] [CrossRef] [Green Version]
  46. Tichy, N.M.; Tushman, M.L.; Fombrun, C. Social network analysis for organizations. Acad. Manag. Rev. 1979, 4, 507–519. [Google Scholar] [CrossRef]
  47. Carley, K.M.; Lee, J.S.; Krackhardt, D. Destabilizing networks. Connections 2002, 24, 79–92. [Google Scholar]
  48. Choi, J.-W. Governance structure and administrative corruption in Japan: An organizational network approach. Public Adm. Rev. 2007, 67, 930–942. [Google Scholar] [CrossRef]
  49. Calderoni, F. Social Network Analysis of Organized Criminal Groups; Springer: Berlin/Heidelberg, Germany, 2014; pp. 4972–4981. [Google Scholar] [CrossRef]
  50. Roldan, F. Collusive networks in market-sharing agreements in the presence of an antitrust authority. J. Econ. Manag. Strat. 2012, 21, 965–987. [Google Scholar] [CrossRef] [Green Version]
  51. Cheng, T.; Liu, T.; Meng, L.; Wang, C. The Analysis of Water Project Bid Rigging Behavior Based on Complex Network. In Proceedings of the 2017 International Conference on Applied Mathematics, Modeling and Simulation (AMMS2017), Shanghai, China, 26–27 November 2017; pp. 417–421. [Google Scholar]
  52. Peyrache, E.; Quesada, L. Intermediaries, credibility and incentives to collude. J. Econ. Manag. Strat. 2011, 20, 1099–1133. [Google Scholar] [CrossRef]
  53. Burt, R.S. Structural holes: The social structure of competition. Econ. J. 1994, 40, 779–781. [Google Scholar]
  54. Hosseini, M.R.; Martek, I.; Banihashemi, S.; Chan, A.P.C.; Darko, A.; Tahmasebi, M. Distinguishing characteristics of corruption risks in Iranian construction projects: A weighted correlation network analysis. Sci. Eng. Ethics 2019, 26, 205–231. [Google Scholar] [CrossRef] [PubMed]
  55. Padhi, S.S.; Wagner, S.M.; Mohapatra, P.K.J. Design of auction parameters to reduce the effect of collusion. Decis. Sci. 2015, 47, 1016–1047. [Google Scholar] [CrossRef]
  56. Agranov, M.; Yariv, L. Collusion through communication in auctions. Games Econ. Behav. 2018, 107, 93–108. [Google Scholar] [CrossRef]
  57. Samuel, S.; Ray, K.; Larry, D. Data mining and collusion resistance. Lect. Notes Eng. Comput. 2009, 2176, 283–288. [Google Scholar]
  58. Paola, T.; Louise, R.; Casilli, A.A.; Alessio, D.A. Social network analysis: New ethical approaches through collective reflexivity. Introduction to the special issue of Social Networks. Soc. Netw. 2021, 67, 1–8. [Google Scholar]
  59. Wellman, B. The community question: The intimate networks of East Yorkers. Am. J. Sociol. 1979, 84, 1201–1231. [Google Scholar] [CrossRef] [Green Version]
  60. Dong, X.; Wang, J.; Hu, B.; Liu, X. Female sex workers in HIV/AIDS prevention: A social network analysis perspective. Phys. A Stat. Mech. Appl. 2019, 523, 570–582. [Google Scholar] [CrossRef]
  61. Chen, C.; Matzdorf, B.; Zhen, L.; Schröter, B. Social-network analysis of local governance models for China’s eco-compensation program. Ecosyst. Serv. 2020, 45, 101191. [Google Scholar] [CrossRef]
  62. Jing, J.; Ke, S.; Li, T.; Wang, T. Energy method of geophysical logging lithology based on K-means dynamic clustering analysis. Environ. Technol. Innov. 2021, 23, 101534. [Google Scholar] [CrossRef]
  63. Karthik, J.; Tamizhazhagan, V.; Narayana, S. Data leak identification using scattering search K Means in social networks. Mater. Today Proc. 2021, in press. [Google Scholar] [CrossRef]
  64. Ma, P.; Yong, Z. MAKM: A MAFIA-Based k-Means Algorithm for Short Text. In Social Networks; Springer: Berlin/Heidelberg, Germany, 2013. [Google Scholar]
  65. Allen, E.A.; Damaraju, E.; Plis, S.; Erhardt, E.B.; Eichele, T.; Calhoun, V.D. Tracking whole-brain connectivity dynamics in the resting state. Cereb. Cortex 2012, 24, 663–676. [Google Scholar] [CrossRef]
  66. Le, Y.; Zhang, B.; Guan, X.; Li, Y. Study on collusion relationship of government investment projects from the perspective of S.N.A. J. Public Manag. 2013, 10, 29–40. [Google Scholar]
  67. Lee, I.K.; Hahn, K. Bid-rigging in auctions for korean public-works contracts and potential damage. Rev. Ind. Organ. 2002, 21, 73–88. [Google Scholar] [CrossRef]
  68. Che, Y.-K.; Condorelli, D.; Kim, J. Weak cartels and collusion-proof auctions. J. Econ. Theory 2018, 178, 398–435. [Google Scholar] [CrossRef] [Green Version]
Figure 1. The collusive network analysis procedure.
Buildings 11 00363 g001
Figure 2. Cumulative probability distribution of the overall network density.
Buildings 11 00363 g002
Figure 3. Cumulative probability distribution of the average path length.
Buildings 11 00363 g003
Figure 4. Frequency distribution of the degree centrality index.
Buildings 11 00363 g004
Figure 5. Frequency distribution of the between centrality index.
Buildings 11 00363 g005
Figure 6. Frequency distribution of the closeness centrality index.
Buildings 11 00363 g006
Figure 7. The probability distribution of the condensation coefficient.
Buildings 11 00363 g007
Figure 8. The change of network structure with the increase of organizational scale.
Buildings 11 00363 g008
Figure 9. The network structure of the cluster centers.
Buildings 11 00363 g009
Figure 10. Types of collusive network structures.
Buildings 11 00363 g010
Table 1. Descriptive statistics of the number of collusive groups and participants.
IndexNumber of SamplesMeanStandard DeviationMinimumMaximumSkewnessKurtosis
Scale of collusive groups2167.416.4242452.6278.843
Number of individual participants21612.079.3123602.1995.972
Table 2. Collusive network indicators.
IndicatorsExpressionCollusion Connotation
Overall network density σ = i = 1 n k i n ( n 1 ) = k ¯ n 1 The degree of contact and mutual influence between members of collusive bidding groups.
Average path length L = 2 d i j N ( N 1 )   ( i j ) The mean value of the number of intermediaries required for any two members to interact in the collusive network.
Degree centrality C D = i = 1 n ( C D max C D i ) n 2 3 n + 2 The degree of concentration of power control distribution in the collusive network.
Between centrality C B = i = 1 n ( C B max C B i ) n 3 4 n 2 + 5 n 2 The degree of concentration of members of the collusive network at the location of the information and resource control intermediary.
Closeness centrality C C = i = 1 n ( C C max C C i ) ( n 2 ) ( n 1 ) ( 2 n 3 ) The degree to which the collusive network is not controlled by power and the difficulty of member interaction.
Condensation coefficient C i = 2 k i m i ( m i 1 )   C = 1 n i = 1 n C i The cohesion and anti-attack ability of the collusive network.
Note: n is the number of participants in a network; k i is the number of relationships connected to node i ; k ¯ is the average number of connections of all individuals in the network; d i j is the number of sides of the shortest path connecting the point i and point j ; C D i is the degree centrality of point i ; C B i is the middle centrality of point i ; C C i is the closeness centrality of point i ; C max is the maximum centrality value of each point in the network; C i is the condensation coefficient of node i ; m i is the number of nodes adjacent to the node i .
Table 3. Clustering analysis of network structure parameters.
Cluster CenterCluster 1Cluster 2Cluster 3
Overall network density0.5330.3330.132
Average path length3.0222.8891.567
Condensation coefficient0.8060.4600.002
Degree central potential index0.4930.3240.705
Intermediate central potential index0.2680.5660.918
Near central potential index0.6150.4510.896
Number of cluster members709056
Table 4. Three types of collusive bidding.
First TypeSecond TypeThird Type
Strong accessibilityStrong accessibilityWeak accessibility
Weak centralityStrong centralityStrong centrality
High stabilityHigh stabilityLow stability
Publisher’s Note: MDPI stays neutral with regard to jurisdictional claims in published maps and institutional affiliations.

