
Seismic Hazard Assessment of Shigo Kas Hydro-Power Project (Khyber Pakhtunkhwa, Pakistan)

 , ,
, ,  ,
, 
Abstract
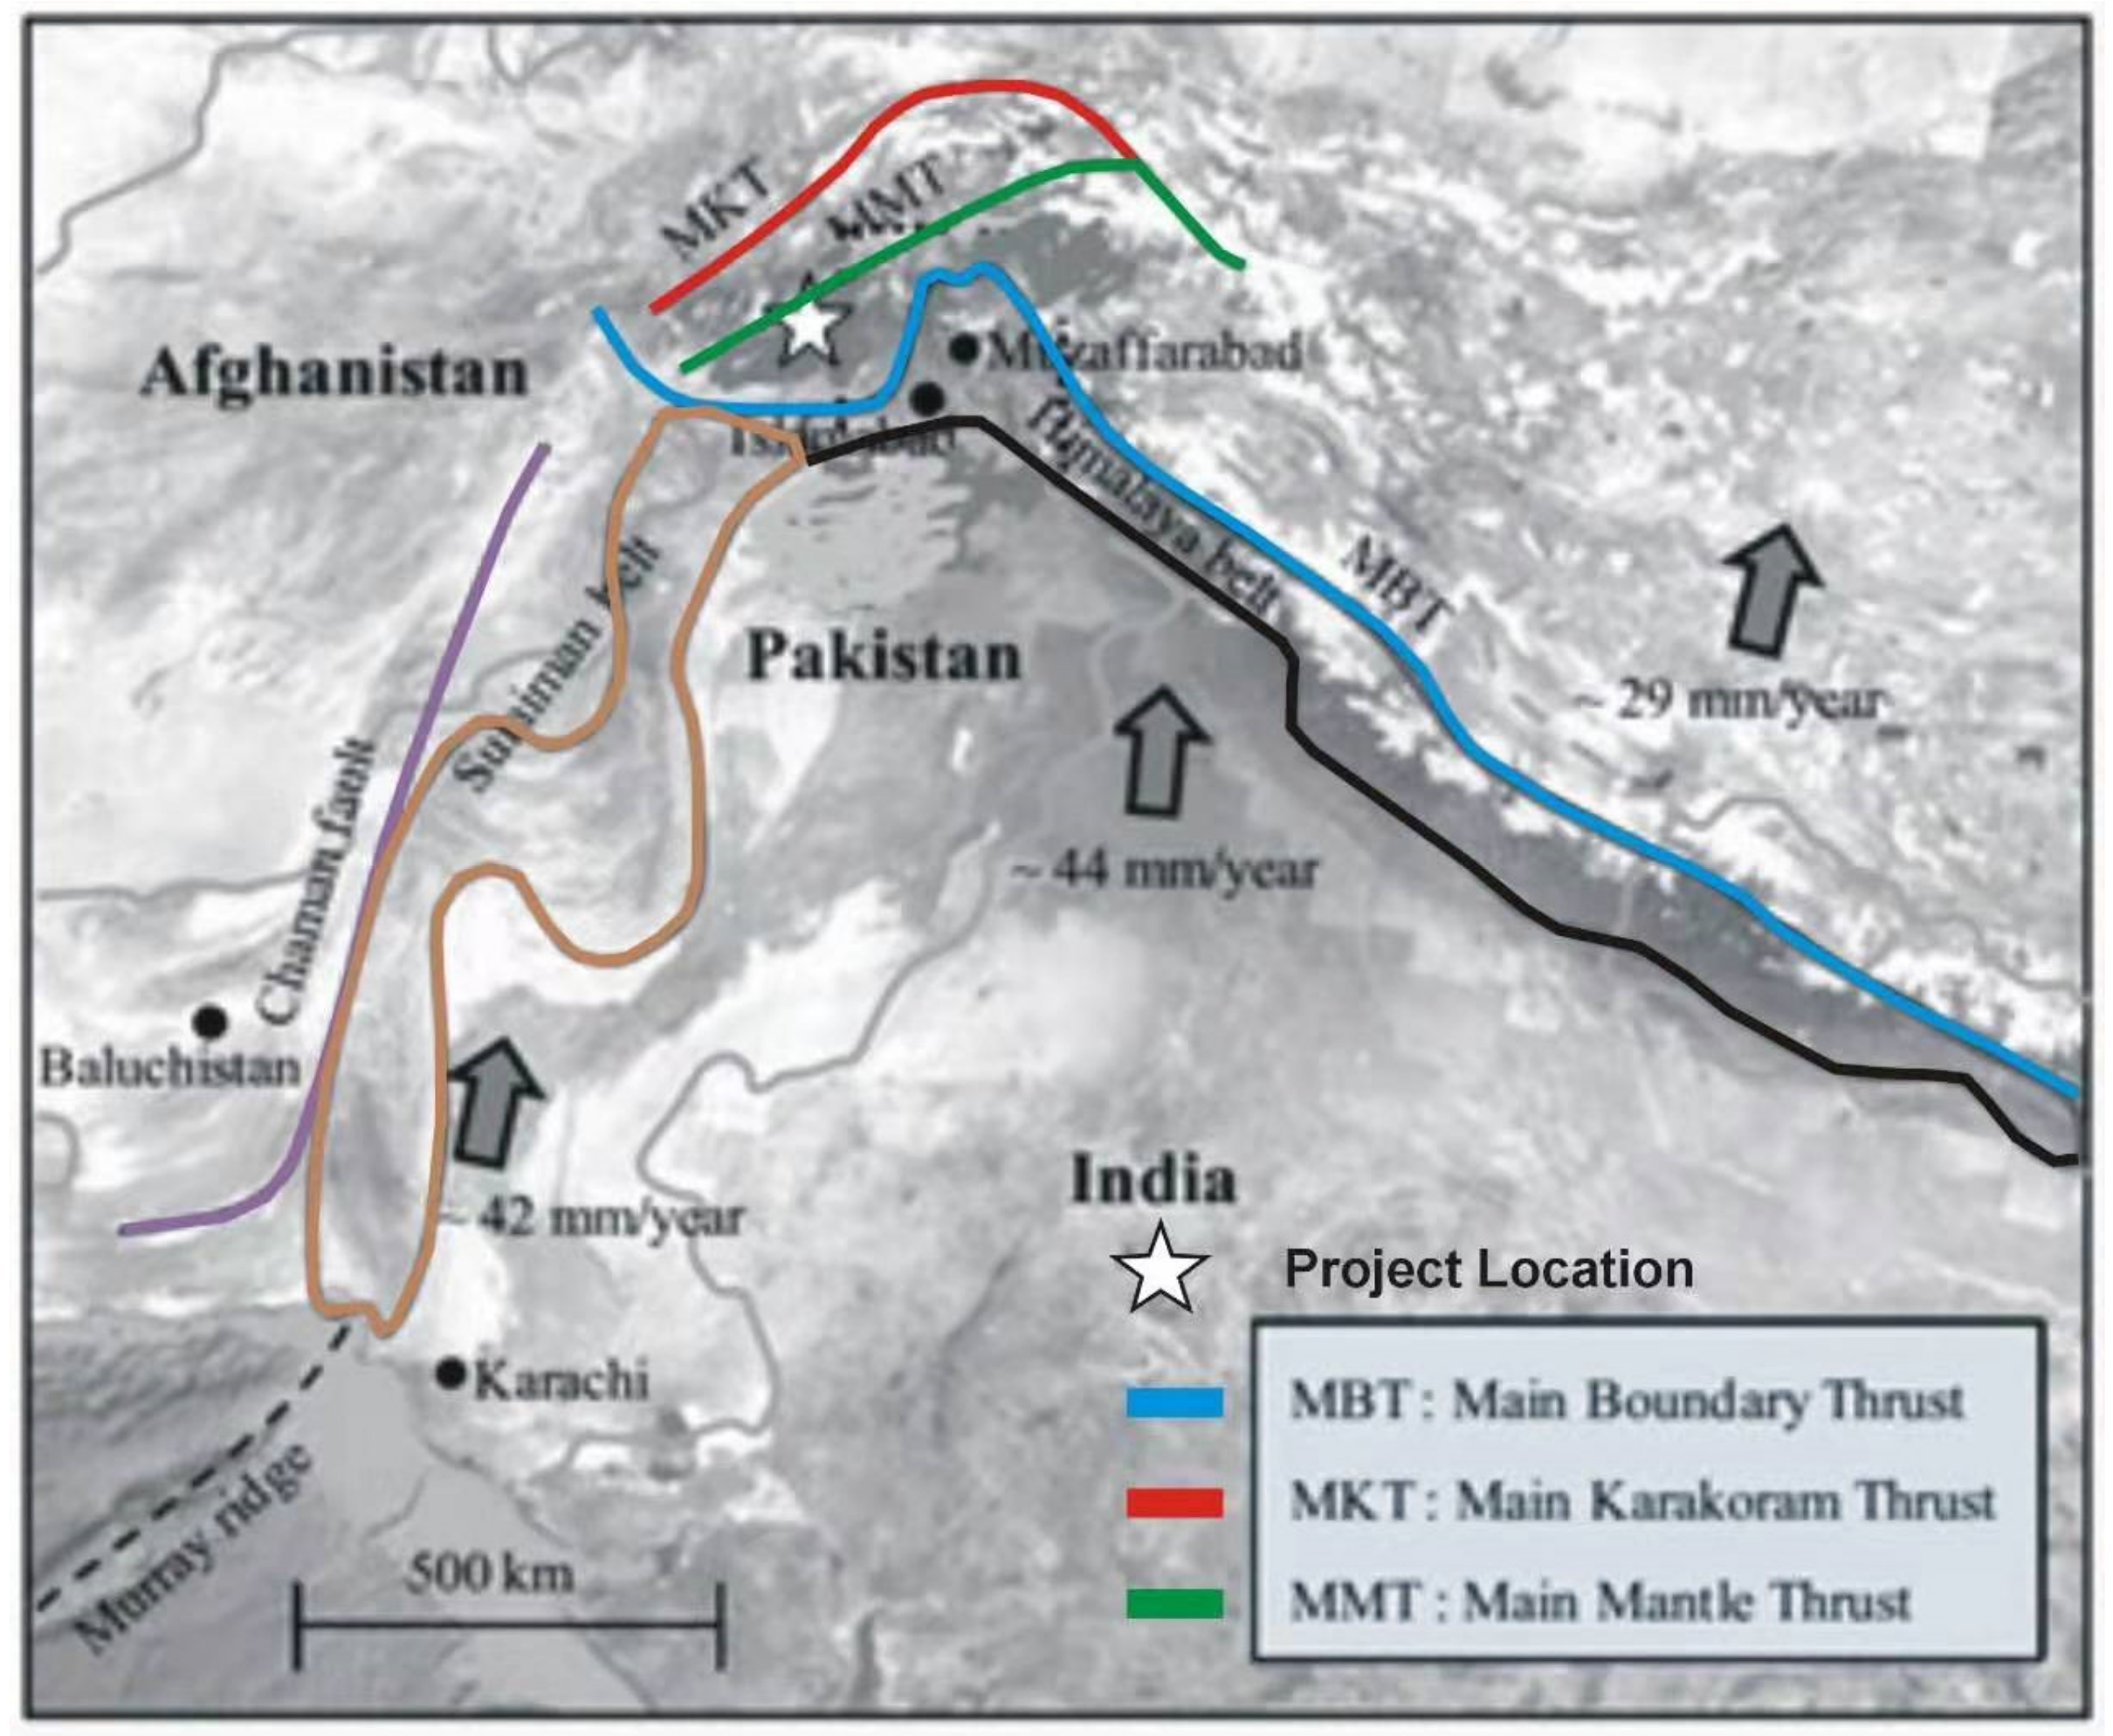
:1. Introduction
2. Earthquake Catalogues
3. Modeling of Earthquake Sources
3.1. Crustal Faults Source Model
3.2. Area Source Models
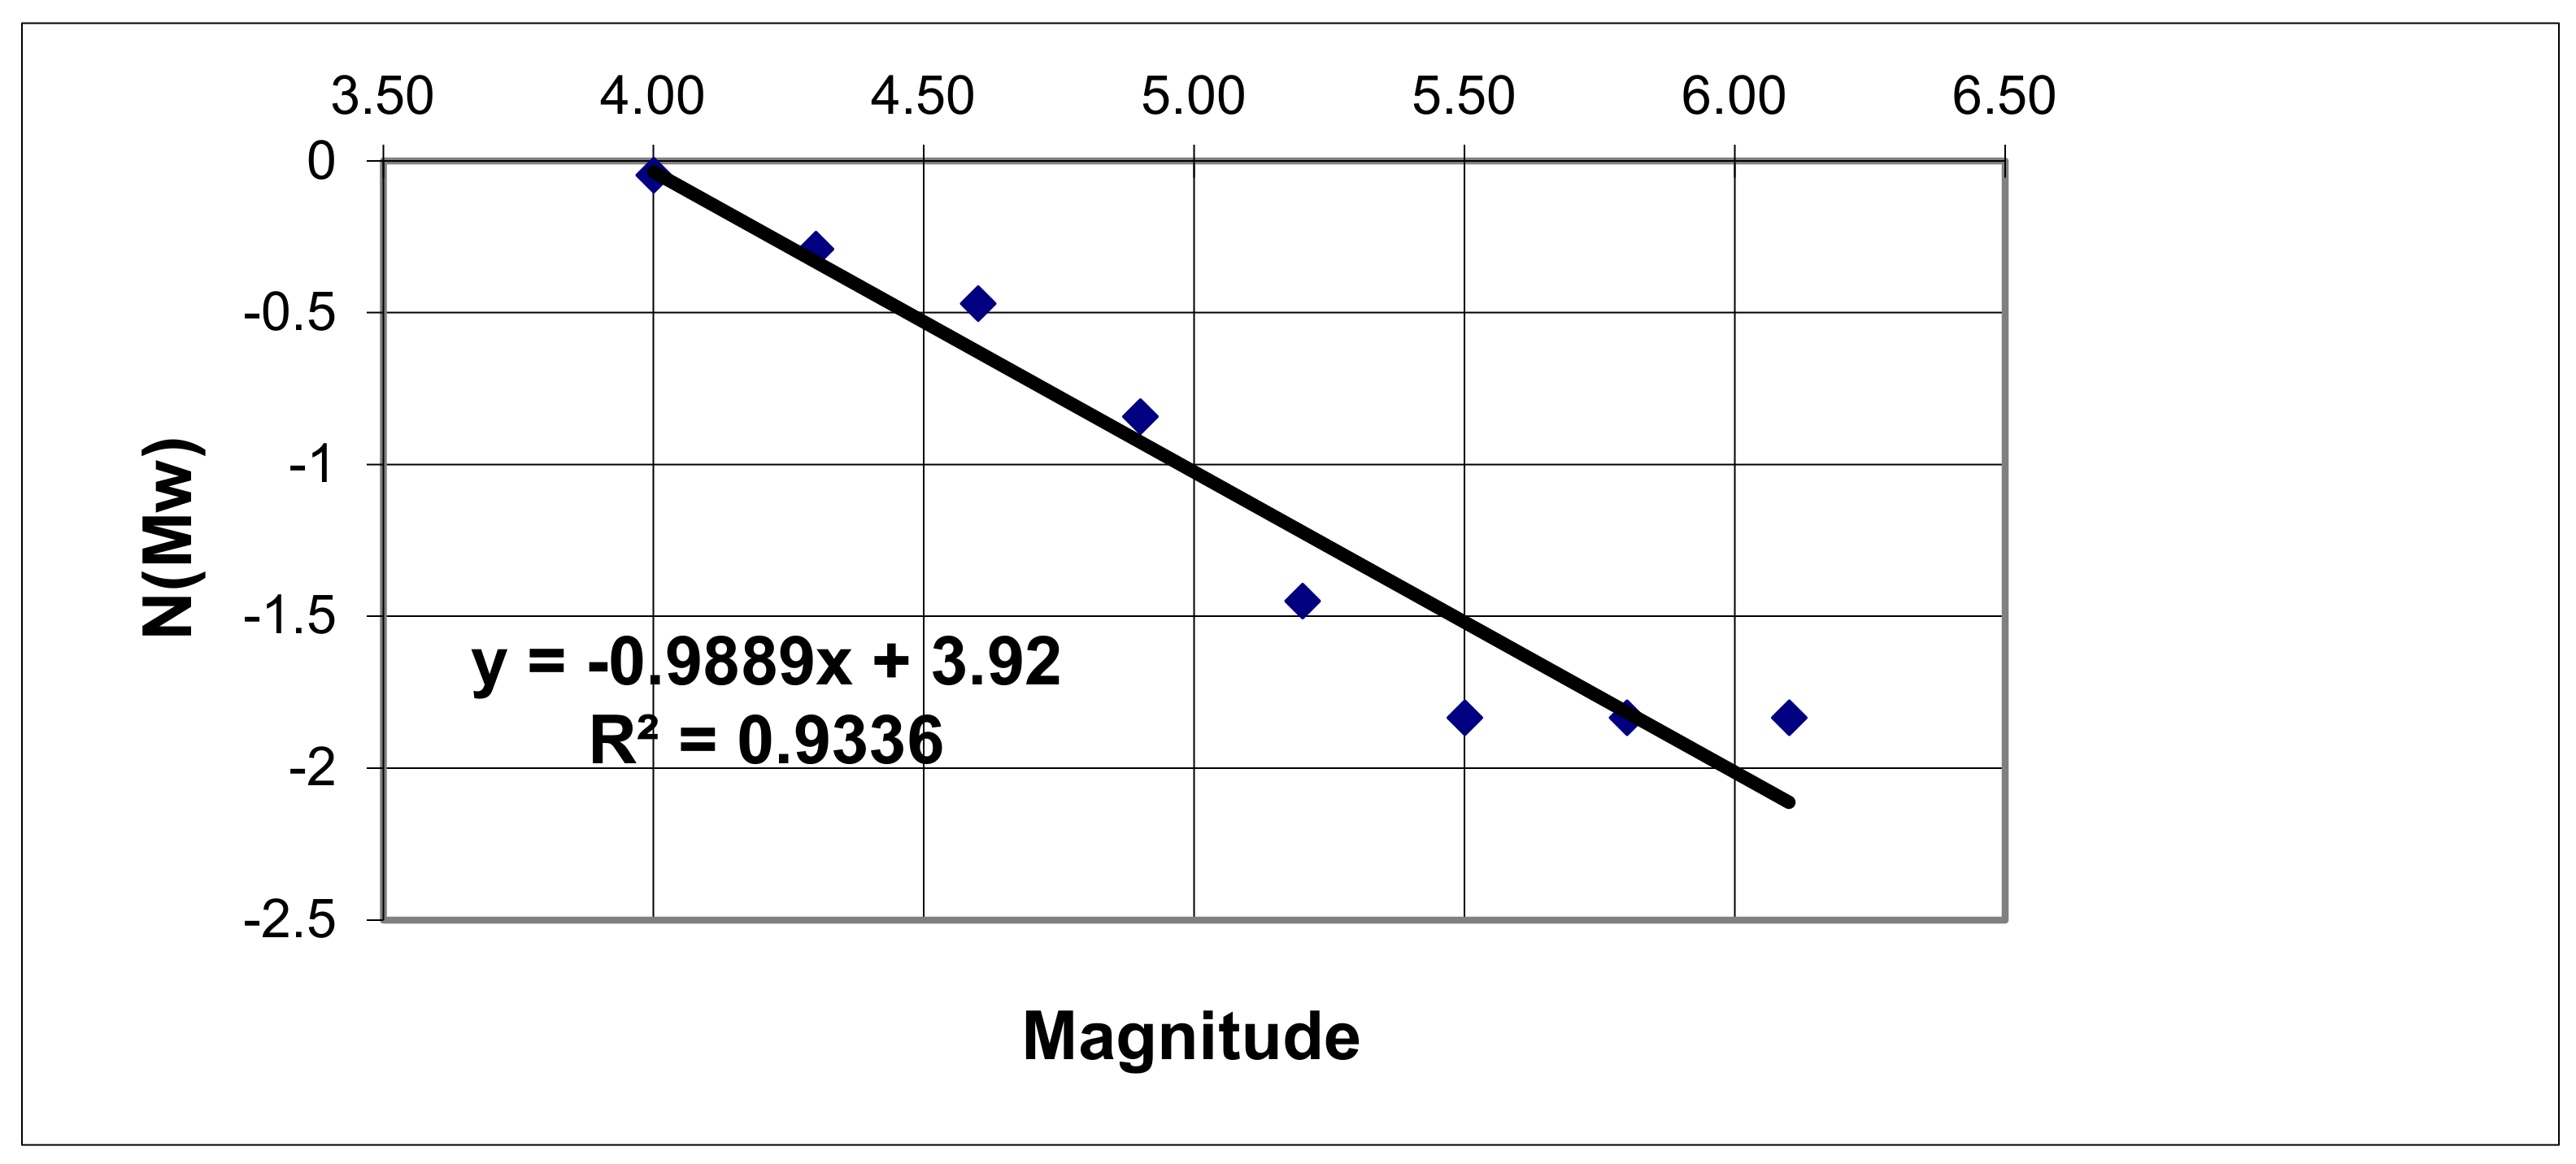
4. Development of Earthquake Recurrence Relationship
5. Seismic Design Criteria for Hydropower Structures
5.1. The Maximum Credible Earthquake (MCE)
5.2. Safety Evaluation Earthquake (SEE)
5.3. The Design Basis Earthquake (DBE)
5.4. The Operating Basis Earthquake (OBE)
6. Seismic Hazard Analysis
6.1. Ground Motion Prediction Equations
6.2. Geophysical and Geotechnical Investigations
6.3. Site Response Analysis
6.4. Deterministic Seismic Hazard Analysis
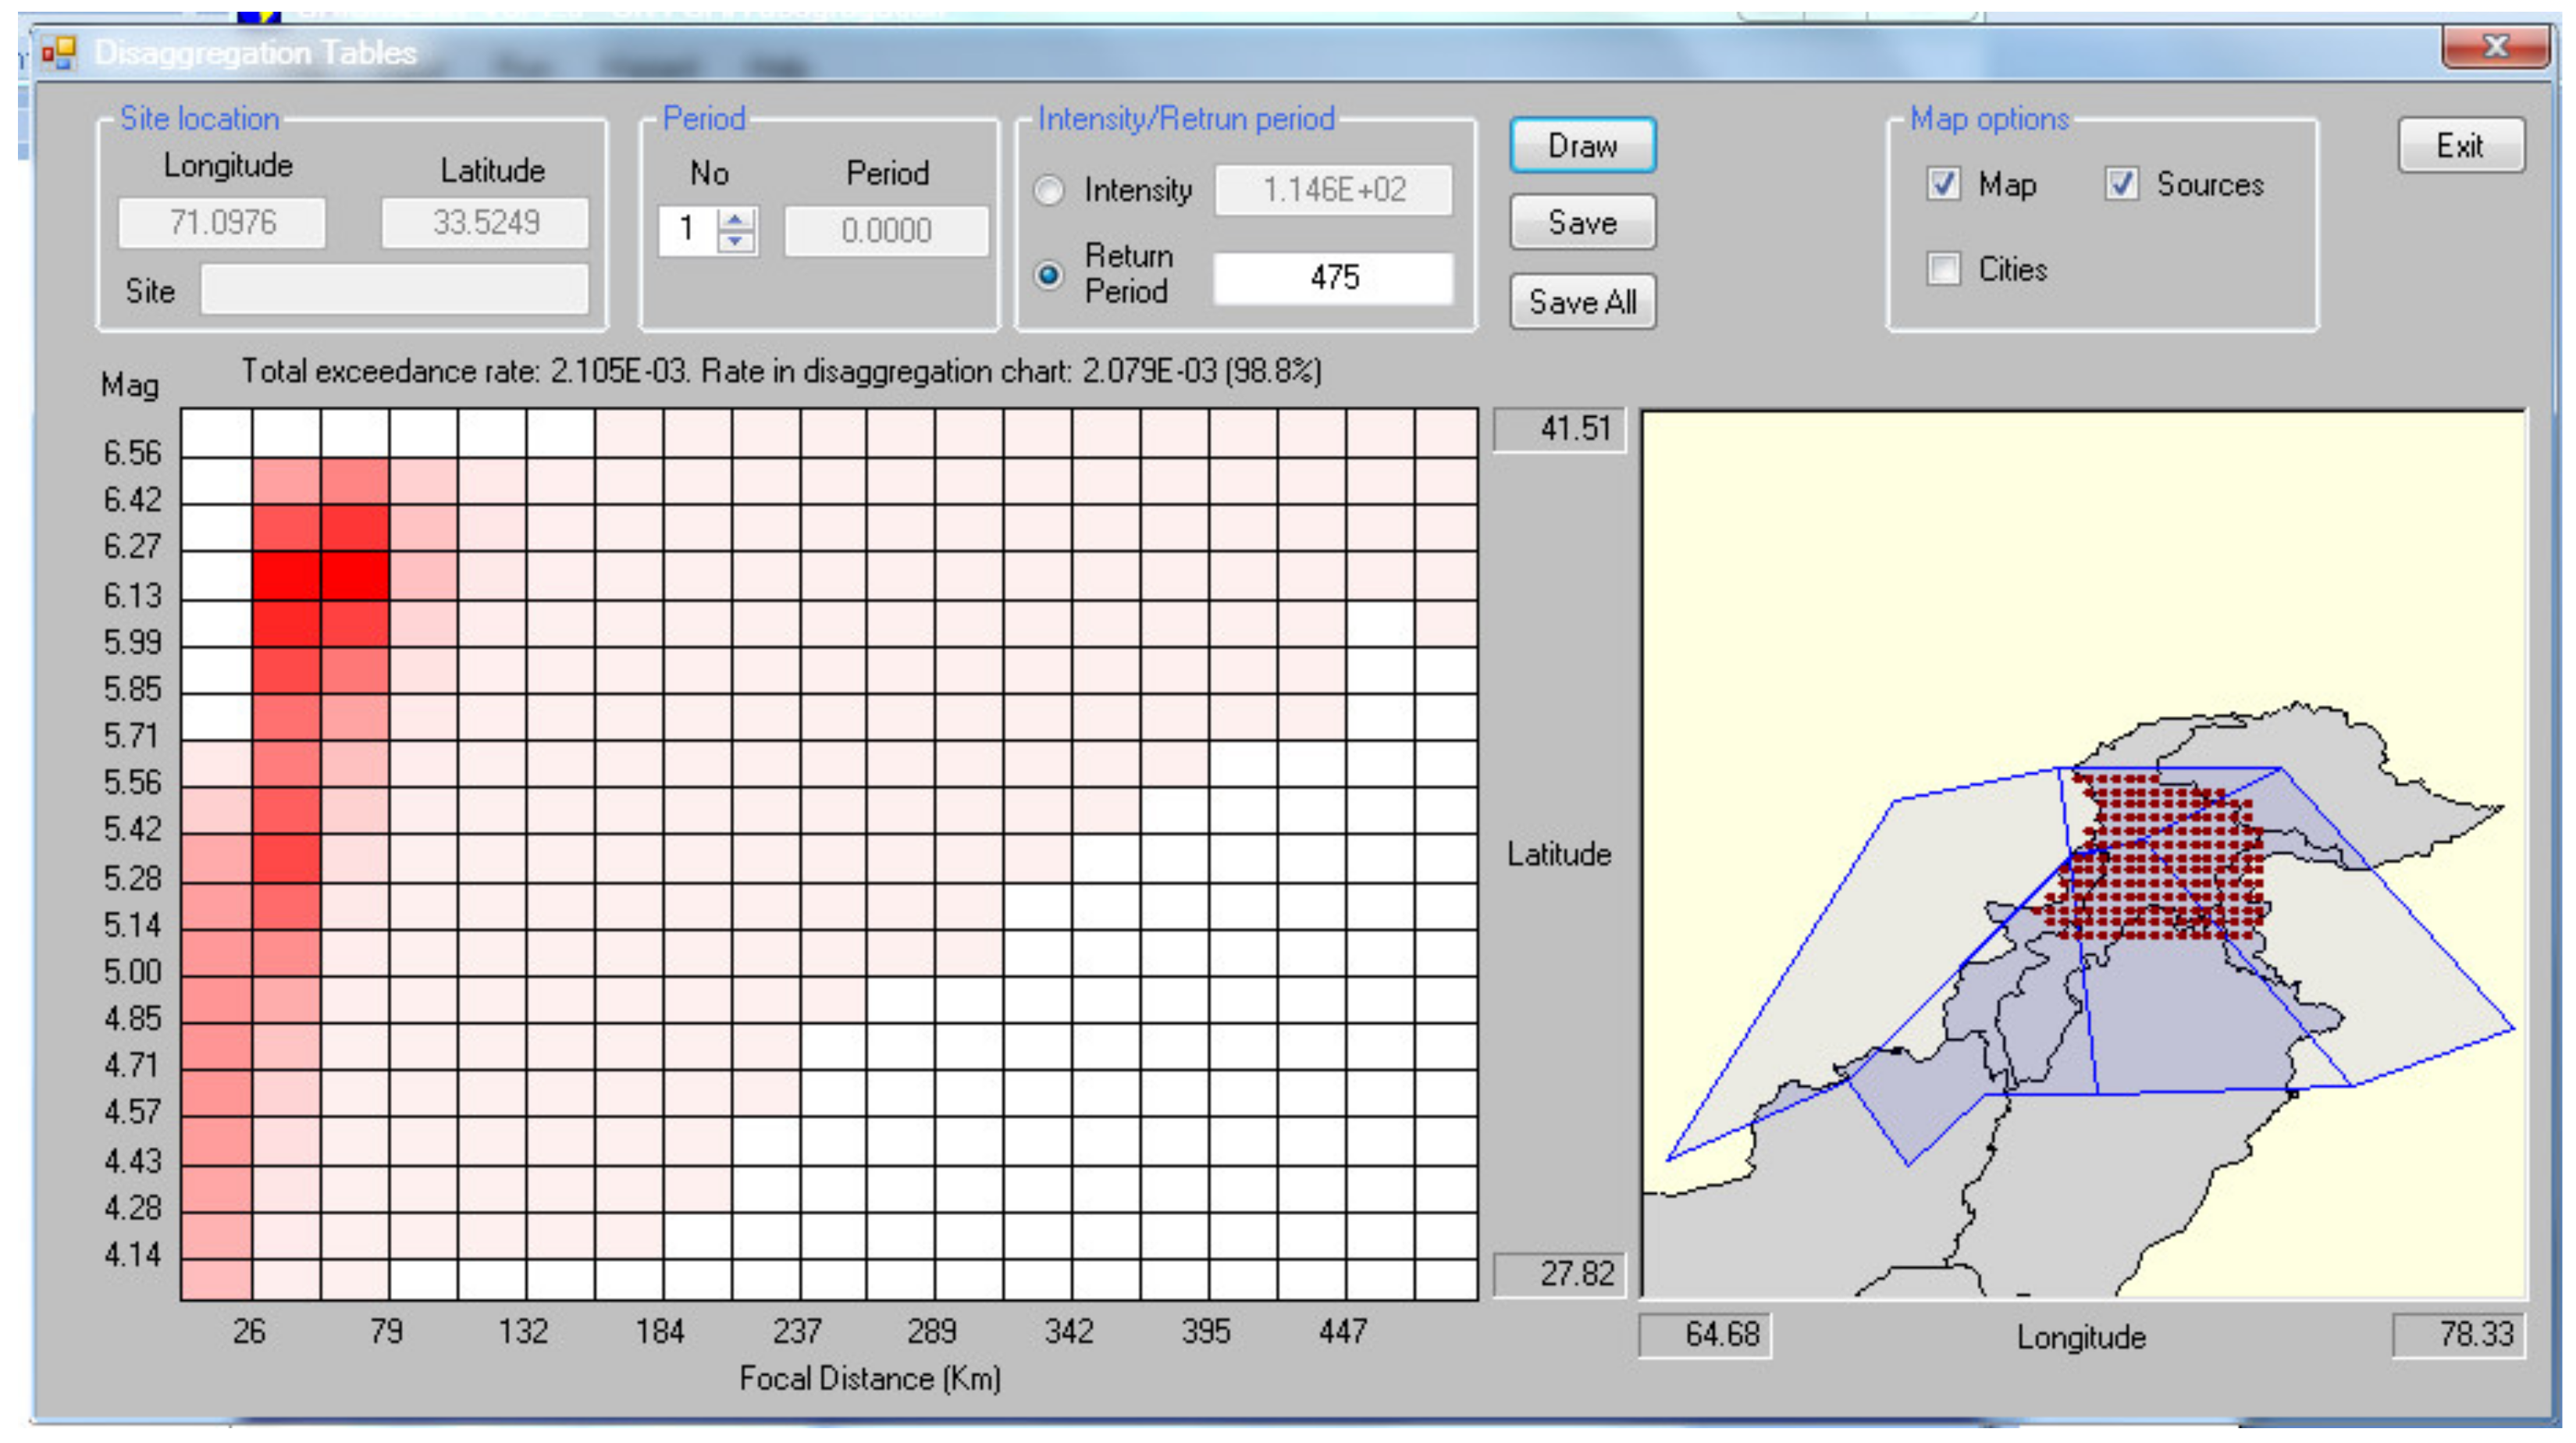
6.5. Probabilistic Seismic Hazard Analysis
7. Conclusions and Discussions
Author Contributions
Funding
Institutional Review Board Statement
Informed Consent Statement
Data Availability Statement
Acknowledgments
Conflicts of Interest
Appendix A

| Earthquake | Year | Estimated Mw | Estimated Max. MMI | Details | Source |
|---|---|---|---|---|---|
| Paghman, Afghanistan (34.60° N, 68.93° E) | 1505 | 7.0–7.8 | IX-X | Region north of Kabul totally destroyed. In Kabul, many houses collapsed and fortress damaged. | [41] |
| Kashmir, Pakistan (33.50° N, 75.50° E) | 1555 | 7.6 | n/a | The intensity report is limited | [40] |
| Attock, Pakistan | 1669 | 6.3 | VIII-IX | The earthquake felt at Attock caused a fissure of 50 m long in the ground. | [41] |
| Alingar Valley, Afghanistan (34.83° N, 70.37° E) | 1842 | n/a | VIII-IX | Felt at Peshawar and Kabul, lasted for 3 min, several shocks, rocked the fort in frightful manner. | [41] |
| Kashmir, Pakistan (34.60° N, 74.38° E) | 1885 | 6.3 | VIII-IX | Destructive shocks in Kashmir (Sopor, Gulmarg, Srinagar almost totally ruined and 3000 people killed), Muzaffarabad heavily damaged. Felt at Peshawar, Lahore, Simla, Leh, Kapalu and Gilgit in a radius of 650 km. | [41] |
| Chitral, Pakistan | 1927 | 6.3 | VIII-IX | Destructive earthquake, ruined Skorzor and Drosh. Damage was equally heavy in USSR at Kulyab. | [23] |
| Date | Time | Latitude | Longitude | Depth | Magnitude |
|---|---|---|---|---|---|
| 5 September 1927 | 20:10:00 | 34.2 | 72 | NA | 5.6 |
| 30 September 1927 | 18:40:00 | 34.2 | 72 | NA | 5.9 |
| 14 November 1928 | 4:33:09 | 35 | 72.5 | 110 | 6.1 |
| 15 May 1969 | 20:39:49 | 34.62 | 70.82 | 49 | 5.6 |
| 27 August 1969 | 22:35:55 | 35.36 | 71.13 | 76 | 5.5 |
| 9 May 1971 | 26:34.20 | 35.54 | 71.06 | 81.7 | 5.7 |
| 27 August 1969 | n/a | 35.33 | 71.59 | 33 | 5.5 |
| 26 February 2005 | n/a | 35.5 | 71.5 | NA | 6.2 |
| 6 May 2008 | 23:38:02 | 35.59 | 72.23 | 33 | 5.5 |
| 11 February 2008 | 20:56:59 | 35.57 | 71.96 | 217.2 | 5.8 |
| 24 April 2018 | 14:25:30 | 34.50 | 70.18 | 71 | 6.2 |
| 27 February 2015 | 02:59:07 | 34.76 | 73.36 | 32 | 5.8 |
References
- Liu, H.; Masera, D.; Esser, L. World Small Hydropower Development Report; United Nations Industrial Development Organization: New York, NY, USA, 2013. [Google Scholar]
- Wessel, M.; Madlener, R.; Hilgers, C. Economic feasibility of semi-underground pumped storage hydropower plants in open-pit mines. Energies 2020, 13, 4178. [Google Scholar] [CrossRef]
- Hashash, Y.M.; Kim, B.; Olson, S.M.; Ahmad, I. Seismic hazard analysis using discrete faults in Northwestern Pakistan: Part I–methodology and evaluation. J. Earthq. Eng. 2012, 16, 963–994. [Google Scholar] [CrossRef]
- Hashash, Y.M.; Kim, B.; Olson, S.M.; Ahmad, I. Seismic Hazard Analysis Using Discrete Faults in Northwestern Pakistan: Part II–Results of Seismic Hazard Analysis. J. Earthq. Eng. 2012, 16, 1161–1183. [Google Scholar] [CrossRef]
- Jon, I.; Lindell, M.; Prater, C.; Huang, S.-K.; Wu, H.-C.; Johnston, D.; Becker, J.; Shiroshita, H.; Doyle, E.; Potter, S. Behavioral Response in the Immediate Aftermath of Shaking: Earthquakes in Christchurch and Wellington, New Zealand, and Hitachi, Japan. Int. J. Environ. Res. Public Health 2016, 13, 1137. [Google Scholar] [CrossRef] [Green Version]
- Katona, T.J. Safety of Nuclear Power Plants with Respect to the Fault Displacement Hazard. Appl. Sci. 2020, 10, 3624. [Google Scholar] [CrossRef]
- Pavlou, K.; Kaviris, G.; Chousianitis, K.; Drakatos, G.; Kouskouna, V.; Makropoulos, K. Seismic hazard assessment in Polyphyto Dam area (NW Greece) and its relation with the” unexpected” earthquake of 13 May 1995 (M s= 6.5, NW Greece). Nat. Hazards Earth Syst. Sci. 2013, 13, 141–149. [Google Scholar] [CrossRef] [Green Version]
- Papadopoulou-Vrynioti, K.; Bathrellos, G.D.; Skilodimou, H.D.; Kaviris, G.; Makropoulos, K. Karst collapse susceptibility mapping considering peak ground acceleration in a rapidly growing urban area. Eng. Geol. 2013, 158, 77–88. [Google Scholar] [CrossRef]
- Kassaras, I.; Kalantoni, D.; Benetatos, C.; Kaviris, G.; Michalaki, K.; Sakellariou, N.; Makropoulos, K. Seismic damage scenarios in Lefkas old town (W. Greece). Bull. Earthq. Eng. 2015, 13, 3669–3711. [Google Scholar] [CrossRef]
- Gupta, I. The state of the art in seismic hazard analysis. ISET J. Earthq. Technol. 2002, 39, 311–346. [Google Scholar]
- Pitilakis, K.D.; Anastasiadis, A.I.; Kakderi, K.G.; Manakou, M.V.; Manou, D.K.; Alexoudi, M.N.; Fotopoulou, S.D.; Argyroudis, S.A.; Senetakis, K.G. Development of comprehensive earthquake loss scenarios for a Greek and a Turkish city: Seismic hazard, geotechnical and lifeline aspects. Earthq. Struct. 2011, 2, 207–232. [Google Scholar] [CrossRef]
- Cheng, H.-T.; Tsou, K.-W. Mitigation policy acceptance model: An analysis of individual decision making process toward residential seismic strengthening. Int. J. Environ. Res. Public Health 2018, 15, 1883. [Google Scholar] [CrossRef] [PubMed] [Green Version]
- Chi, P.; Dong, J.; Tian, W.; Cao, D. Nonlinear Seismic Response of Multistory Steel Frames with Self-Centering Tension-Only Braces. Appl. Sci. 2020, 10, 1819. [Google Scholar] [CrossRef] [Green Version]
- Harirchian, E.; Lahmer, T.; Kumari, V.; Jadhav, K. Application of Support Vector Machine Modeling for the Rapid Seismic Hazard Safety Evaluation of Existing Buildings. Energies 2020, 13, 3340. [Google Scholar] [CrossRef]
- Wang, Y.-K.; Chai, J.-F.; Chang, Y.-W.; Huang, T.-Y.; Kuo, Y.-S. Development of seismic demand for chang-bin offshore wind farm in taiwan strait. Energies 2016, 9, 1036. [Google Scholar] [CrossRef] [Green Version]
- Durrani, A.J.; Elnashai, A.S.; Hashash, Y.; Kim, S.J.; Masud, A. The Kashmir earthquake of October 8, 2005: A Quick Look Report; Mid-America Earthquake Center: Urbana, IL, USA, 2005. [Google Scholar]
- Norsar, P. Seismic Hazard Analysis for the Cities of Islamabad and Rawalpindi; Pakistan Meteorological Department: Islāmābād, Pakistan, 2006.
- Ullah, R.; Ahmad, I. Seismic hazard analysis of islamabad. J. Eng. Appl. Sci. 2010, 29, 468–478. [Google Scholar]
- Dhakal, Y.P.; Kubo, H.; Suzuki, W.; Kunugi, T.; Aoi, S.; Fujiwara, H. Analysis of strong ground motions and site effects at Kantipath, Kathmandu, from 2015 Mw 7.8 Gorkha, Nepal, earthquake and its aftershocks. Earth Planets Space 2016, 68, 1–12. [Google Scholar] [CrossRef] [Green Version]
- Asian Development Bank and World Bank. Preliminary Damage and Needs Assessment, Pakistan 2005; World Bank Group: Washington, DC, USA, 2005. [Google Scholar]
- Shahzada, K.; Khan, A.N.; Lin, S.-L.; Naseer, A.; Javed, M.; Fahad, M. Seismic hazard assessment of Abbottabad City. Int. J. Earth Sci. 2012, 4, 212–215. [Google Scholar]
- Bilham, R.; Ambraseys, N. Apparent Himalayan slip deficit from the summation of seismic moments for Himalayan earthquakes, 1500–2000. Curr. Sci. 2005, 88, 1658–1663. [Google Scholar]
- Building Code of Pakistan (BCP) by NESPAK. Building Code of Pakistan Seismic Hazard Evaluation Studies; Ministry of Housing and Works, Government of Pakistan: Islamabad, Pakistan, 2007.
- Looi, D.T.; Tsang, H.; Hee, M.; Lam, N.T. Seismic hazard and response spectrum modelling for Malaysia and Singapore. Earthq. Struct. 2018, 15, 67–79. [Google Scholar]
- Fan, C.; An, R.; Li, J.; Li, K.; Deng, Y.; Li, Y. An Approach Based on the Protected Object for Dam-Break Flood Risk Management Exemplified at the Zipingpu Reservoir. Int. J. Environ. Res. Public Health 2019, 16, 3786. [Google Scholar] [CrossRef] [PubMed] [Green Version]
- Cirillo, D. Digital Field Mapping and Drone-Aided Survey for Structural Geological Data Collection and Seismic Hazard Assessment: Case of the 2016 Central Italy Earthquakes. Appl. Sci. 2020, 10, 5233. [Google Scholar] [CrossRef]
- Yang, C.; Zhang, J.; Liu, F.; Bi, J.; Jun, Z. Analysis on two typical landslide hazard phenomena in the Wenchuan earthquake by field investigations and shaking table tests. Int. J. Environ. Res. Public Health 2015, 12, 9181–9198. [Google Scholar] [CrossRef] [PubMed] [Green Version]
- He, X.; Wu, J.; Wang, C.; Ye, M. Historical Earthquakes and Their Socioeconomic Consequences in China: 1950–2017. Int. J. Environ. Res. Public Health 2018, 15, 2728. [Google Scholar] [CrossRef] [PubMed] [Green Version]
- Wieland, M. Seismic design and performance criteria for large storage dams. In Proceedings of the 15th World Conference on Earthquake Engineering, Lisbon, Portugal, 24–28 September 2012; pp. 24–28. [Google Scholar]
- Lacassin, R.; Lavelle, S. The crisis of a paradigm. A methodological interpretation of Tohoku and Fukushima catastrophe. Earth-Science Reviews 2016, 155, 49–59. [Google Scholar] [CrossRef] [Green Version]
- HINKS, J. Dams & Earthquakes. In Proceedings of the SECED 2015 Conference: Earthquake Risk and Engineering towards a Resilient World, Cambridge UK, 9–10 July 2015. [Google Scholar]
- Baker, J.W. An introduction to probabilistic seismic hazard analysis (PSHA). White Pap. Version 2008, 1, 72. [Google Scholar]
- Rafi, Z.; Lindholm, C.; Bungum, H.; Laghari, A.; Ahmed, N. Probabilistic seismic hazard of Pakistan, Azad-Jammu and Kashmir. Nat. Hazards 2012, 61, 1317–1354. [Google Scholar] [CrossRef]
- Monalisa Khwaja, A.A.; Jan, M.Q. Seismic hazard assessment of the NW Himalayan fold-and-thrust belt, Pakistan, using probabilistic approach. J. Earthq. Eng. 2007, 11, 257–301. [Google Scholar] [CrossRef]
- Rafi, Z.; Haider, A. Seismic Hazard Analysis and Zonation for the Northern Areas of Pakistan and Kashmir; Pakistan Meteorological Department: Islāmābād, Pakistan, 2006.
- Waseem, M.; Lai, C.G.; Spacone, E. Seismic hazard assessment of northern Pakistan. Nat. Hazards 2018, 90, 563–600. [Google Scholar] [CrossRef]
- Sella, G.F.; Dixon, T.H.; Mao, A. REVEL: A model for recent plate velocities from space geodesy. J. Geophys. Res. Solid Earth 2002, 107, ETG 11-11–ETG 11-30. [Google Scholar] [CrossRef]
- Armbruster, J.; Seeber, L.; Jacob, K. The northwestern termination of the Himalayan mountain front: Active tectonics from microearthquakes. J. Geophys. Res. Solid Earth 1978, 83, 269–282. [Google Scholar] [CrossRef]
- Kaneda, H.; Nakata, T.; Tsutsumi, H.; Kondo, H.; Sugito, N.; Awata, Y.; Akhtar, S.S.; Majid, A.; Khattak, W.; Awan, A.A. Surface rupture of the 2005 Kashmir, Pakistan, earthquake and its active tectonic implications. Bull. Seismol. Soc. Am. 2008, 98, 521–557. [Google Scholar] [CrossRef]
- Ambraseys, N.; Douglas, J. Magnitude calibration of north Indian earthquakes. Geophys. J. Int. 2004, 159, 165–206. [Google Scholar] [CrossRef]
- Quittmeyer, R.; Jacob, K. Historical and modern seismicity of Pakistan, Afghanistan, northwestern India, and southeastern Iran. Bull. Seismol. Soc. Am. 1979, 69, 773–823. [Google Scholar]
- Scordilis, E. Empirical global relations converting M S and m b to moment magnitude. J. Seismol. 2006, 10, 225–236. [Google Scholar] [CrossRef]
- Sipkin, S.A. A correction to body-wave magnitude mb based on moment magnitude Mw. Seismol. Res. Lett. 2003, 74, 739–742. [Google Scholar] [CrossRef]
- Heaton, T.H.; Tajima, F.; Mori, A.W. Estimating ground motions using recorded accelerograms. Surv. Geophys. 1986, 8, 25–83. [Google Scholar] [CrossRef]
- Gardner, J.; Knopoff, L. Is the sequence of earthquakes in Southern California, with aftershocks removed, Poissonian? Bull. Seismol. Soc. Am. 1974, 64, 1363–1367. [Google Scholar]
- Tinti, S.; Mulargia, F. Completeness analysis of a seismic catalog. Ann. Geophys. 1985, 3, 407–414. [Google Scholar]
- Wells, D.L.; Coppersmith, K.J. New empirical relationships among magnitude, rupture length, rupture width, rupture area, and surface displacement. Bull. Seismol. Soc. Am. 1994, 84, 974–1002. [Google Scholar]
- Wieland, M. ICOLD’s Revised Seismic Design and Performance Criteria for Large Storage Dams. Water Energy Int. 2016, 59, 47–53. [Google Scholar]
- Boore, D.M.; Atkinson, G.M. Ground-motion prediction equations for the average horizontal component of PGA, PGV, and 5%-damped PSA at spectral periods between 0.01 s and 10.0 s. Earthq. Spectra 2008, 24, 99–138. [Google Scholar] [CrossRef] [Green Version]
- Campbell, K.W.; Bozorgnia, Y. NGA ground motion model for the geometric mean horizontal component of PGA, PGV, PGD and 5% damped linear elastic response spectra for periods ranging from 0.01 to 10 s. Earthq. Spectra 2008, 24, 139–171. [Google Scholar] [CrossRef]
- Cotton, F.; Scherbaum, F.; Bommer, J.J.; Bungum, H. Criteria for selecting and adjusting ground-motion models for specific target regions: Application to central Europe and rock sites. J. Seismol. 2006, 10, 137. [Google Scholar] [CrossRef]
- Carroll, R.D. The determination of the acoustic parameters of volcanic rocks from compressional velocity measurements. Int. J. Rock Mech.Min. Sci. Geomech. Abstr. 1967, 6, 557–559. [Google Scholar] [CrossRef]
- Hashash, Y. DEEPSOIL v5. 1–Tutorial and User Manual. 2002–2012; University of Illinois at Urbana-Champaign: Urbana, IL, USA, 2012. [Google Scholar]
- Schnabel, P.; Seed, H.B.; Lysmer, J. Modification of seismograph records for effects of local soil conditions. Bull. Seismol. Soc. Am. 1972, 62, 1649–1664. [Google Scholar]
- Chiou, B.; Darragh, R.; Gregor, N.; Silva, W. NGA project strong-motion database. Earthq. Spectra 2008, 24, 23–44. [Google Scholar] [CrossRef] [Green Version]
- Kim, S.J.; Elnashai, A.S. Characterization of shaking intensity distribution and seismic assessment of RC buildings for the Kashmir (Pakistan) earthquake of October 2005. Eng. Struct. 2009, 31, 2998–3015. [Google Scholar] [CrossRef]
- Lin, S.-L.; Li, J.; Elnashai, A.S.; Spencer, B.F., Jr. NEES integrated seismic risk assessment framework (NISRAF). Soil Dyn. Earthq. Eng. 2012, 42, 219–228. [Google Scholar] [CrossRef]
- Holzer, T.L.; Padovani, A.C.; Bennett, M.J.; Noce, T.E.; Tinsley, J.C. Mapping NEHRP VS30 site classes. Earthq. Spectra 2005, 21, 353–370. [Google Scholar] [CrossRef]
- Anbazhagan, P.; Sitharam, T. Spatial variability of the depth of weathered and engineering bedrock using multichannel analysis of surface wave method. Pure Appl. Geophys. 2009, 166, 409–428. [Google Scholar] [CrossRef]
- Ornthammarath, T.; Douglas, J.; Sigbjörnsson, R.; Lai, C.G. Assessment of ground motion variability and its effects on seismic hazard analysis: A case study for Iceland. Bull. Earthq. Eng. 2011, 9, 931–953. [Google Scholar] [CrossRef] [Green Version]
- Ordaz, M.; Aguilar, A.; Arboleda, J. CRISIS2007–Ver. 1.1: Program for Computing Seismic Hazard; Instituto de Ingenieria, UNAM: Mexico City, Mexico, 2007. [Google Scholar]


| S.No | EQ Magnitude Range | Completeness Year |
|---|---|---|
| 1 | Mw ≥ 4.0 | 1997–2019 |
| 3 | Mw ≥ 4.5 | 1991–2019 |
| 4 | Mw ≥ 5.0 | 1968–2019 |
| 5 | Mw ≥ 5.5 | 1959–2019 |
| 6 | Mw ≥ 6.0 | 1928–2019 |
| 7 | Mw ≥ 6.5 | 1927–2019 |
| S.No | Fault Name | Type | Joyner and Boore Distance from Shigo Kas HPP (RJB) | Mw | Length (km) | Dip Value (Degree) |
|---|---|---|---|---|---|---|
| 1 | Darband Fault | Normal | 121.00 | 7.1 | 47 | 60 |
| 2 | Himalayan Frontal Thrust | Reverse | 149.43 | 7.8 | 225 | 30 |
| 3 | Hissaratang Thrust | Reverse | 95.44 | 7.7 | 160 | 60 |
| 4 | Khairabad Fault | Reverse | 86.17 | 7.8 | 205 | 60 |
| 5 | Manshera Thrust | Reverse | 111.40 | 7.0 | 48 | 30 |
| 6 | MBT | Reverse | 149.70 | 8.1 | 353 | 30 |
| 7 | MMT | Reverse | 1.50 | 7.8 | 340 | 30 |
| 8 | MKT | Reverse | 95.41 | 8.1 | 450 | 35 |
| 9 | Nowshera Fault | Strike Slip | 85.64 | 7.2 | 80 | 60 |
| 10 | Punjal Thrust | Reverse | 133.23 | 7.4 | 98 | 30 |
| 11 | Puran Fault | Strike Slip | 97.42 | 7.3 | 99 | 60 |
| 12 | Raikot Fault | Reverse | 104.34 | 7.1 | 63 | 60 |
| Zone Number | Regions |
|---|---|
| 1 | Afghanistan border; having low seismicity. |
| 8 | Pattan Kohistan area; the seismicity of this region is high. |
| 14 | Malakand and Islamabad Lahore, etc., a very active region. |
| 15 | Chitral and Drosh active region. |
| 16 | Koh-e-Sulaiman low seismicity. |
| S.No | Zone No. | Total Events (Mw ≥ 4.0) | Zone Name | G–R Relations | a | b | mo | mmmax |
|---|---|---|---|---|---|---|---|---|
| 1 | zone 1 | 49 | Kohistan–Kashmir | log λm = 3.92 − 0.98 m | 3.92 | 0.98 | 4 | 6.6 |
| 2 | zone 8 | 80 | Eastern Afghanistan | log λm = 4.37 − 1.02 m | 4.37 | 1.02 | 4 | 6.2 |
| 3 | zone 14 | 267 | Upper Punjab–KPK | log λm = 5.66 − 1.23 m | 5.66 | 1.23 | 4 | 6.4 |
| 4 | zone 15 | 192 | Chitral | log λm = 5.17 − 1.13 m | 5.17 | 1.13 | 4 | 6.7 |
| 5 | zone 16 | 25 | Koh-e-Sulaiman | log λm = 5.8 − 1.48 m | 5.80 | 1.48 | 4 | 5.5 |
Publisher’s Note: MDPI stays neutral with regard to jurisdictional claims in published maps and institutional affiliations. |
© 2021 by the authors. Licensee MDPI, Basel, Switzerland. This article is an open access article distributed under the terms and conditions of the Creative Commons Attribution (CC BY) license (https://creativecommons.org/licenses/by/4.0/).
Share and Cite
Abid, M.; Isleem, H.F.; Shahzada, K.; Khan, A.U.; Kamal Shah, M.; Saeed, S.; Aslam, F. Seismic Hazard Assessment of Shigo Kas Hydro-Power Project (Khyber Pakhtunkhwa, Pakistan). Buildings 2021, 11, 349. https://doi.org/10.3390/buildings11080349
Abid M, Isleem HF, Shahzada K, Khan AU, Kamal Shah M, Saeed S, Aslam F. Seismic Hazard Assessment of Shigo Kas Hydro-Power Project (Khyber Pakhtunkhwa, Pakistan). Buildings. 2021; 11(8):349. https://doi.org/10.3390/buildings11080349
Chicago/Turabian StyleAbid, Muhammad, Haytham F. Isleem, Khan Shahzada, Afed Ullah Khan, Muhammad Kamal Shah, Salman Saeed, and Fahid Aslam. 2021. "Seismic Hazard Assessment of Shigo Kas Hydro-Power Project (Khyber Pakhtunkhwa, Pakistan)" Buildings 11, no. 8: 349. https://doi.org/10.3390/buildings11080349