Article

Quantification of Air Change Rate by Selected Methods in a Typical Apartment Building

1
Department of Building Structures, Institute of Architectural Engineering, Faculty of Civil Engineering, Technical University of Kosice, Vysokoskolska 4, 042 00 Kosice, Slovakia
2
Building Services Department, Institute of Architectural Engineering, Faculty of Civil Engineering, Technical University of Kosice, Vysokoskolska 4, 042 00 Kosice, Slovakia
*
Author to whom correspondence should be addressed.
Buildings 2021, 11(4), 174; https://doi.org/10.3390/buildings11040174
Submission received: 12 March 2021 / Revised: 13 April 2021 / Accepted: 15 April 2021 / Published: 18 April 2021
(This article belongs to the Section Building Energy, Physics, Environment, and Systems)

Abstract

:
An important parameter that affects indoor climate of buildings and also ventilation heat losses and gains is the speed of air change between the outdoor environment and the interior of buildings. Indoor air quality is therefore significantly associated with ventilation. Quantification of air change rate is complicated, because it is impacted by many parameters, the most variable of which is air flow. This study focuses on the determination and comparison of air change rate values in two methods by quantification of the aerodynamic coefficient Cp = Cpe − Cpi, so-called “aerodynamic quantification of the building” and the methodology based on “experimental measurements of carbon dioxide”. The study describes and takes into account the effect of wind, building parameters and air permeability for the building using “aerodynamic quantification of the building”. The paper compares these calculated results with the values obtained from experimental measurements method of carbon dioxide in a selected reference room in apartment building and evaluates the accuracy of the prediction of the air exchange rate obtained by these methods. At higher wind speeds the values of air change rate with considering the effect of openings are closer to the values obtained based on experimental measurements of carbon dioxide and the difference between the values without considering the effect of openings increases significantly.

1. Introduction

Buildings are currently built and modified to minimize energy losses and maximize efficiency of heating. Efforts to reduce the ventilation heat loss reduce the air change rate. Many studies on ventilation and health have concluded that lower air change rates can have a negative effect on people’s health and low ventilation may result in an increase in allergic diseases [1,2,3]. Nowadays people spend up to 90% of their life indoors. The windows enable natural ventilation and energy savings are ensured, are they obtained not only by increasing the thermal technical properties of the perimeter walls but also by the design and implementation of quality and tight windows. However, this often leads to a conflict between energy requirements and hygiene criteria. The air change rate is undersized and causes changes in humidity conditions up to the limit of hygienic requirements with possible subsequent adverse hygienic errors and the formation of mold. Therefore, it is necessary to ensure an increase in the air exchange through regular and intensive ventilation by apartment users or by means of micro-ventilation.
People spend more time at apartments, in living spaces more than anywhere else, it is about 70%. Air change rate has a significant impact on energy consumptions and indoor quality. Proper use of natural ventilation can improve the indoor environment and reduce energy consumption.
Thus, the quality of indoor air has received an increased attention in recent years. In study [4], the authors try to establish the number of European residences that do not meet ventilation standards. They conclude that up to 40% of European residences can be considered under ventilated. This number varies too by the age of the building stock. The Slovak standard also considers this number [5].
Air change rate—n—represents the amount of filtered air through leakage openings structures (gaps, connections, etc.) with natural ventilation due to the action of total differential pressure of air. Air change rate, n, is a measure of the air volume added to or removed from the space in one hour, divided by the volume of the space and can be expressed as formula (1) (according to [6]):
n = 3600 V i n f V m = 3600   ( i l , v . l ) Δ p c n V m
where:
  • Vinf—volume of infiltrated air in the room with natural airflow (m3),
  • Vm—room volume (m3),
  • il,v—gap permeability coefficient (m3/(m·s·Pa0.67)),
  • l—length of the gap (m),
  • Δpc—total air pressure difference (Pa).
The value of air change rate for living rooms in residential buildings as set by the Slovak national standard STN [5] nN ≥ 0.5 (1/h) does not correspond with real values of air change rate. In reality, the air change rate is very variable because it is affected by a number of parameters and depends mainly on the total air pressure difference Δpc—the most difficult measurable value. More accurate analysis and calculations can be done using simulation methods, quantifying the total aerodynamic coefficient Cp = Cpe − Cpi—the so-called “aerodynamic quantification of building”—where it is necessary to know the pressure distribution in interior and therefore requires aerodynamic quantification expressed by the total aerodynamic coefficient Cp = Cpe − Cpi (-), or by methodology based on experimental measurements of carbon dioxide where the measured data of CO2 concentration makes it possible to calculate the air change rate in the room.
The air change rate values given in this article were determined and compared using two methods:
-
by quantification of total aerodynamic coefficient Cp = Cpe − Cpi—“aerodynamic quantification of building”, which accepts the variability of climatic parameters, takes into account the wind influence with building parameters and the air permeability of the building;
-
based on experimental measurements of carbon dioxide in the selected reference room in an apartment building.

1.1. Aerodynamic Quantification of Building

1.1.1. Quantification of Total Aerodynamic Coefficient Cp

Ventilation is the air change that ensures the supply of fresh outdoor air to ventilated/air-conditioned spaces and the removal of degraded air from ventilated spaces [7,8]. Depending on how the ventilation of buildings is ensured, we distinguish natural ventilation, forced ventilation and combined ventilation [9,10]. In our climatic conditions, natural ventilation is still one of the most common methods of ventilation. Especially in residential buildings it is mostly a natural air change-natural ventilation, which arises due to leaks in window and door openings, windowsills, various transitions, etc.—infiltration, or as a result of the homeowner behavior—by opening windows. Natural ventilation is a type of ventilation in which the movement and air change is induced by natural motor forces. These forces are the temperature difference and the wind. The basic precondition for natural ventilation is thus the total air pressure difference Δpc (Pa) [11,12] determined as the sum of the air pressure difference from different temperatures Δpθ (Pa) and air pressure difference from wind effect Δpw (Pa) wherein the two components act on the building envelope in parallel in overtime [10]. For total air pressure difference can be applied (2) [6]:
Δ p c = Δ p θ + Δ p w = h 0 g ( ρ a e ρ a i ) + C p ( v 2 ρ a e ρ a e 2 )
where:
  • h0—height from the neutral pressure plane NPP (m),
  • ρae, ρai—outdoor and indoor air density (kg/m3),
  • Cptotal aerodynamic coefficient (-),
  • v—wind speed (m/s).
The value of the total pressure difference Δpc is strongly influenced primarily by wind effects Δpw. It varies during the day and depends primarily on wind direction, air flow speed above the ground and many other factors. Different investigators found a dependence on the square of the wind speed. In formula (2), the determination of total pressure aerodynamic coefficient Cp is very important [13,14].
For prediction of air change rate by simulation methods it is necessary to obtain knowledge of pressure distribution on buildings’ facades. Therefore, it is necessary that aerodynamic quantification be expressed by total aerodynamic coefficient Cp (-), which takes into account the variable wind effects with the parameters of the building. Knowledge of external and internal aerodynamic coefficients Cpe and Cpi is a basic prerequisite for aerodynamic quantification of buildings [15,16,17].
C p = C p e C p i
where:
  • Cptotal aerodynamic coefficient (-),
  • Cpecoefficient of external pressure (-),
  • Cpicoefficient of internal pressure (-).

1.1.2. External Aerodynamic Coefficient

The aerodynamic coefficient of external pressure is a dimensionless, highly variable quantity, which is influenced by large number of parameters—building geometry, details and position on the facade, wind speed and wind direction [18,19]. When determining the external aerodynamic coefficient not all parameters need to be taken.
Aerodynamic coefficients of external pressure can be expressed by calculations according to national standards [20], experimental measurements in–situ [21,22], experimental measurements in the aerodynamic tunnel [23,24,25,26], simulations using CFD calculation software. Amin and Ahuja (2013) [26] performed a series of measurements on high-rise building models with a rectangular floor plan, in which they investigated the effect of the aspect ratio on the values of the external aerodynamic coefficients. Similar measurements were performed by Amin and Ahuja (2011) [23] on buildings with L and T-shaped floor plans. Between 2003 and 2007 a series of experimental measurements were performed at Tokyo Polytechnic University on 116 models of low-rise buildings and 22 high-rise buildings models with rectangular floor plans and different ratios of width, length and height. The results were summarized in aerodynamic databases (TPU Aerodynamic Database).
Since the building modifies the air flow mainly by its shape, it is necessary to define the buildings under consideration geometrically. The spatial geometric classification is at present defined only for rectangular buildings (square and rectangular shape) and for buildings with a circular floor plan. Based of building height are divided the buildings according to [11] into three groups: low buildings (up to 15 m high), medium-sized buildings (15 m to 50 m high) and tall buildings (with height over 50 m).
For simple buildings, with a rectangular ground plan, with the height to width ratio of h:b = 3 and the height to length ratio of h:l = 2, a typical value is Cpe = +0.7 to +0.8 on the windward side and Cpe = −0.1 to −0.5 on the leeward and side walls [20,27]. The aerodynamic coefficients in the standards are the values that respect only strong winds and represent the maximum value for the façade. If the external aerodynamic coefficient is uneven, the extreme value is significantly different from the average value, and at windward side there may be a difference of up to 50%.

1.1.3. Internal Aerodynamic Coefficient

In addition to very variable external climatic factors, pressure difference is affected by the air permeability of the peripheral structures. The facade shows a certain degree of air permeability, which causes the changes of external and internal pressure. The wind load on the building envelope always depends on the pressure difference between two surfaces of this structural surface and therefore external and internal pressures need to be known. Research on the determination of internal pressures has received much less attention, despite the fact that the load of buildings with internal pressure contributes significantly to the overall load of the building envelope.
Aynsley et al. investigated the effect of wall porosity on internal pressures and found that the internal pressure is uniform, and its value does not depend on where it is measured. Ginger and Ginger et Letchford [15,28] studied external and internal pressures and their interrelationships along with the effect of a dominant opening on a low-rise building on a real scale. They concluded that the pressure inside the building depends on the distribution of external pressures and the location and size of the openings in the facade. The measured values of the internal pressure coefficients agreed with the values obtained by theoretical analysis of the steady flow through the opening.
Chen et al. [16] performed measurements on an acrylic model of a low-rise building with openings located in all four walls and the roof. They found that the angle of the acting wind is an important factor and hypothesized that by multiple openings the internal pressure value is affected by the opening located on the windward side and that the porosity of the building is not a major factor in internal pressure changing.
It is very important for the engineering practice to know the value of internal aerodynamic coefficient, because infiltration can cause a change in the value of aerodynamic coefficients of positive total pressure (pressure) to negative (suction) value [27,29].
Knowledge of external and internal aerodynamic coefficients is a basic prerequisite for aerodynamic quantification of buildings using the total aerodynamic coefficient [11,27]. The approximate influence of the facade air permeability on the pressure and suction distribution on windward and leeward side for a tall building with a rectangular ground plan is shown in Figure 1.
In the calculation of the internal aerodynamic coefficient Cpi it is necessary to know the modification of the building that affects changes of internal and external pressures. Due to the fact that at present there are no legislative requirements for quantification of air permeability of all dividing structures of buildings (partitions, door panels, etc.) it is possible to fully deal only with aerodynamic coefficients of internal pressure in buildings without inner dividing by partitions [11,30].
The internal aerodynamic coefficient is a function of the dimensionless parameter a (-) and therefore, the value has to be quantified only proportionally [30] according to Equation (4):
C p i = f ( a ) = f [ ( A ( + ) A ( ) ]
where:
  • Cpi—the aerodynamic coefficient of internal pressure (-),
  • A(+)the real equivalent area of openings on the windward side of the building (m2),
  • A(−)the real equivalent area of openings on the other sides of the building (m2).
To determine the parameter a (-) there are several assumptions by which the air permeability can be applied [11,27,30]. To determine the parameter a (-) for selected reference building it was assumed that it is possible for the façade air permeability to be applied only with filler windows with different dimensions and with the same gap permeability coefficient iLV (m2/(s·Pan)).
Then applies Formula (5):
a = L ( + ) L ( )
where:
  • L(+)—the sum of the lengths of the openings’ gaps on the windward side of a building (m),
  • L(−)—the sum of the lengths of the openings gaps on the leeward and lateral sides of a building (m).

1.2. Measurement of Carbon Dioxide Concentration Values

In order to evaluate actual air change rate, gas tracing dilution methods have been developed and standardized EN ISO 12,569 [31]. Standard [31] describes among other method to the tracer gas concentration decay method which were used in this paper. According to [32,33,34,35,36], the tracer gas method may be used for determination of air change rate. The CO2 is used as a tracer gas in our case.
The method was used by Weining et al. [37] in a study to determine the dependence of ventilation intensity by infiltration on wind speed. The research team Cui et al. [38] performed several experimental measurements in the laboratory in order to determine the error of measuring the air change rate in the building during cross-ventilation using the tracer gas decay method.
It can be determined the concentration of CO2 by experimental measurements. In our case measurements were carried out predominantly during winter in one selected room. We conducted 24 measurements. From the measured data of CO2 concentration, it was possible to calculate the air change rate in room.
In the room was produced CO2 only by people. The continuing increase of CO2 concentration was caused from the presence of people. Throughout the time of stay in the room air exchange was caused by infiltration. If no person is present in the room, we assume a zero production of CO2. The tracer gas (CO2) concentration is monitored over time and the air change rate is determined from the rate of concentration decay. Therefore, the air change rate caused by the infiltration can be calculated from the function of decrease of CO2 concentration depending on time [34], where the influence of the CO2 concentration of the outdoor air CSUP is considered by Laussmann and Helm [39]. The issue of airtightness of buildings is addressed also in paper [40]. The air change rate n caused by infiltration can be expressed as:
n = 1 t l n C I D A , S C S U P C I D A , E C S U P
where:
  • n—air change rate (1/s),
  • CIDA,S—CO2 concentration in the room at the start of the decrease of concentration (mg/m3);
  • CIDA,E—CO2 concentration in the room at the end of the decrease of concentration (mg/m3);
  • CSUP—CO2 concentration in the outdoor air at time t; t (s) is duration of the decrease of CO2 concentration (mg/m3).
Several contributions have been devoted to this issue, focused on natural air exchange, in the recent period [41,42,43,44]. In paper [45], the focus is on air exchange in the summer when considering energy savings. Posts [46,47,48,49] are devoted to the issue of air exchange in various types of buildings, the increase in CO2 and its impact on users.

2. Materials and Methods

The subject of the paper is a living room-bedroom located in a flat on the third floor in reference apartment building. This reference apartment building is located in the northern part of town Kosice (see Figure 2a,b). Košice is the second largest city in the eastern part of Slovakia.
Views of the building from the exterior side can be seen in Figure 3, as well as floorplan of the reference apartment and selected room.

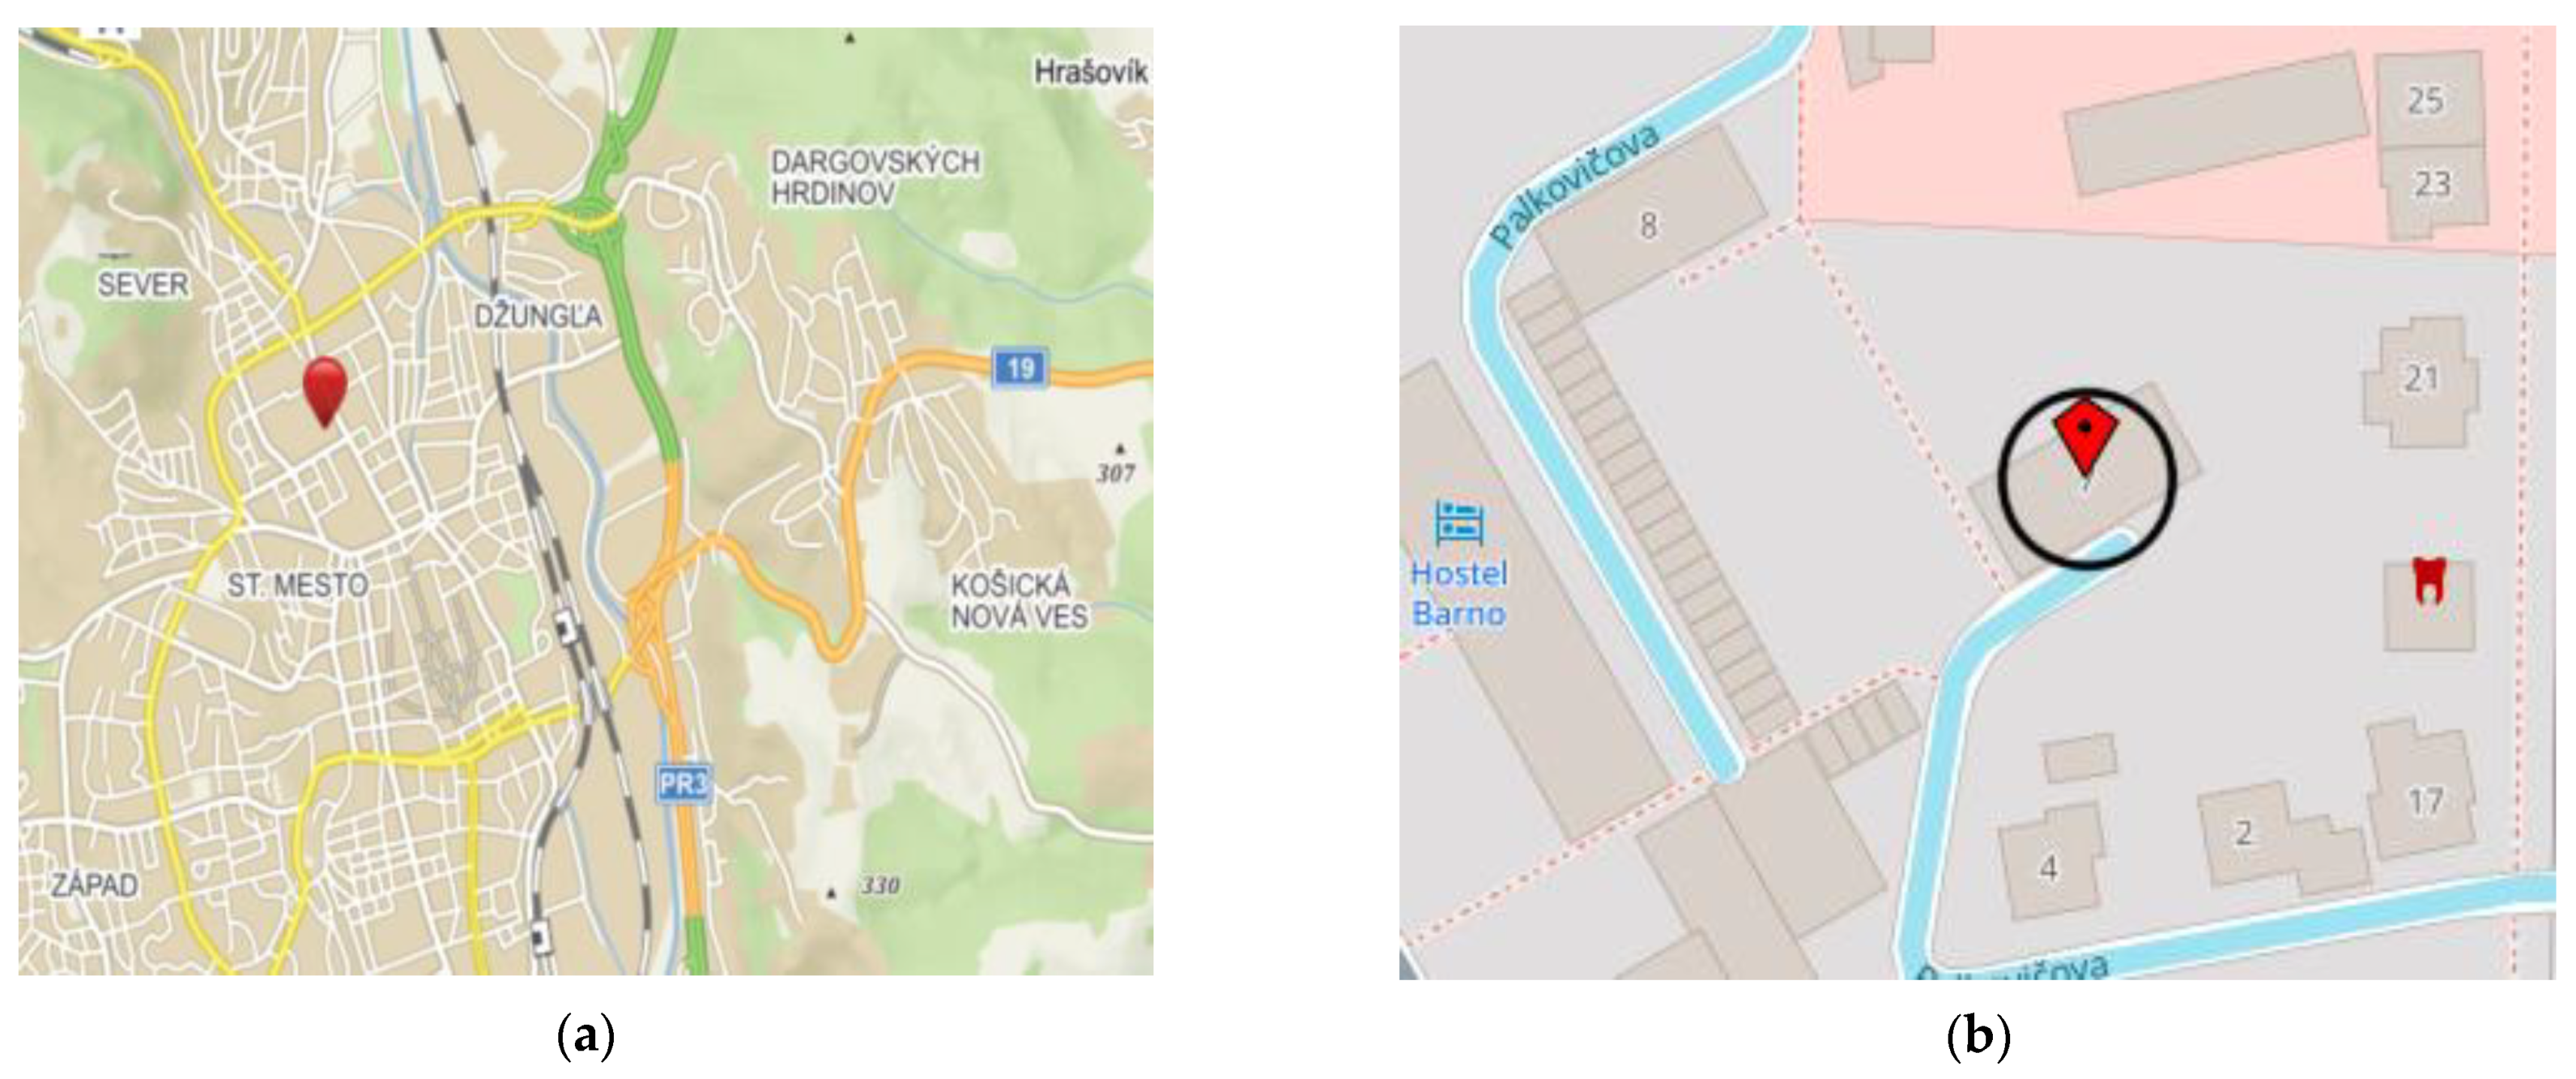
2.1. Description of the Reference Building

The reference building is situated (located) in the center of the city Kosice–North. It is a high-rise apartment building with 12 + 1 floors (total height 36.4 m), shaft type of building—a building with a vertical elevator shaft—position of the neutral pressure plane is determined in the range of 1/2–2/3 a height of the building—24 m. The reference building has rectangular ground plan with dimensions: length l = 25.2 m, width b = 12.3 m, height h = 36.4 m and 2 gable walls—see Figure 3. The reference building can be classified according to [11,30] as:
the medium height building with a height 15 m < h = 36.4 m < 50 m → buildings to 15 floors
the geometry is of the ground plan l/b = 25.2/12.3 ≈ 2—the plate type building with spatial proportionality: 1.5 ≤ h/b = 36.4/12.3 = 2.9 ≤ 6.0 and with area proportionality: 1.5 ≤ l/b = 25.2/12.3 = 2.04 ≤ 4.0
The building is insulated with a contact thermal insulation system and all apartments have the same types of windows.

2.2. Reference Room in Selected Apartment Building

The reference room is situated on the third floor, at a height above ground of approximately 8.4 m, oriented 315° NW, on windward wall. The reference room–bedroom is with internal dimensions 4 m × 3.55 m × 2.6 m. Volume of the room is 36.92 m3. The window system consists of a plastic frame, with insulating double glazing and a length of gaps l = 12.1 m. Floorplan of the reference apartment and selected reference room can be seen in Figure 4.

2.3. Research Flowchart

The aim is to determine and compare the values of air change rate in two methods-using quantifying of total aerodynamic coefficient Cp = CpeCpi—taking into account the variable influence of the wind with the parameters of the building and accepting the air permeability of the façade and by the methodology based on experimental measurements of carbon dioxide in the selected reference building.
The methodology is focused on in situ measurements, calculations, confrontation of measured and calculated values and determination of the effects of selected parameters.
As already mentioned, in this article, the following methodology is applied:
Calculation of air change rate without considering of openings
Calculation of air change rate with considering of openings
Calculation of air change rate on the basis of measured concentrations of carbon dioxide
Comparison and verification of individual two methods
The subject, goal and methodology of the research can be seen in flowchart in Figure 5.

3. Measurement and Calculation Analysis

3.1. Measurement and Description of the External Climatic and Internal Parameters

External climatic parameters influencing the pressure difference Δpc are outdoor air temperature θe, wind speed w and wind direction. On selected days the wind speed measured was at hydro-meteorological station of 10 m above the open ground, but data on wind speed measured at hydro-meteorological stations are not always identical to the actual speed characteristic of a particular site of urban form. Because the reference building is located in the center of city, values of wind speed measured in open terrain were reduced by [27]:
v z = k · v 10 , m e t
where:
  • v10,met—wind speed measured at hydro-meteorological stations at 10 m height (m/s),
  • k—coefficient-indicating the impact of terrain categories and the height above the ground (-).
Coefficient indicating the impact of terrain for reference building in the center of cities 10 m above the ground is k = 0.65.
We measured indoor parameters: indoor air temperature, internal air flow speed, internal air pressure and relative air humidity using equipment Testo 435-4 (SE & CO KGaA, Lenzkirch, Germany). For this purpose, a Testo 435-4 measuring instrument with a Testo 0632 sensor was used. Based on experimental measurements were assessed CO2 concentration of the indoor air. Measurements were carried out predominantly during winter. The range of CO2 concentration measurement of the instrument is from 0 to 10,000 ppm, while the sensitivity is 1 ppm, and the accuracy is ±3%. The range of temperature measurement is from 0 °C to +50 °C, with a sensitivity of 0.1 °C and accuracy of ±0.3 °C. The range of relative humidity is from 0 to +100% RH, the instrument sensitivity is 0.1% RH and the accuracy is ±1.8% RH
To enable a mathematical description of the variation of CO2 concentration according to the measured data, it was important to ensure stable conditions during the measurements-room windows and doors were kept closed. A total of 24 experimental measurements were performed, recording the CO2 concentration, indoor air temperature, relative humidity and air pressure in the room. The devices were placed close at a height of 1.0 m. During the measurement, a person was at least one meter or more away from the device, to prevent local influences on measurements.
The individual access of occupants was not allowed, entering or exiting was done simultaneously by the in the given time. In addition to the measured indoor parameters, hourly outdoor data of air temperature and wind speed were also recorded, since these have an impact on the air exchange rate caused by infiltration. External and internal parameters in selected days and hours are in Table 1.
During all experimental measurements we recorded the CO2 concentration, indoor air temperature, relative humidity and air pressure in the room. The course of one experimental measurement from 3 February 2019–No 15 in the reference room is shown in Figure 6.
In Figure 6 the course of indoor air parameters is documented. The red arrow shows the selected section of decreased CO2 concentration. During this period, the room was closed and without any people. The CO2 concentration decreased only due to a leak in the building structure. From the record it is possible to observe that the air pressure was constant, temperature difference was minimal and the relative humidity copied the course of the CO2 concentration. The detail of the course of CO2 concentration for the selected time period is documented in Figure 7.
It can be seen from Figure 7 that the maximum achieved CO2 concentration in the room was 1728 ppm at 8:03. After the person leaves from the room and closes the door to the room, the CO2 concentration began to decrease. The starting decline was intense, but later, at 8:30, it stabilized. The initial sharper decrease of CO2 concentration was caused by leaks in building structures and at the same time by the opening and closing of the door, which was caused by the person leaving the room. From the record it is possible to see that from 8:30, when the CO2 concentration was CIDA,S = 1671 ppm, the decrease in CO2 concentration was regular. It can be assumed that from 8:30, the air change rate was caused only by the leaks in building structures. The CO2 concentration range in the outdoor air was from 392 to 428 ppm.
A total of 24 experimental measurements were carried out. On some days, three measurements were performed and on some days only one measurement. All measurements were carried out during the normal use of the apartment so that the inhabitants were not limited. The only limitation was a time period when the person had to close the door to the room after leaving the room and was not allowed to re-enter for about one hour.

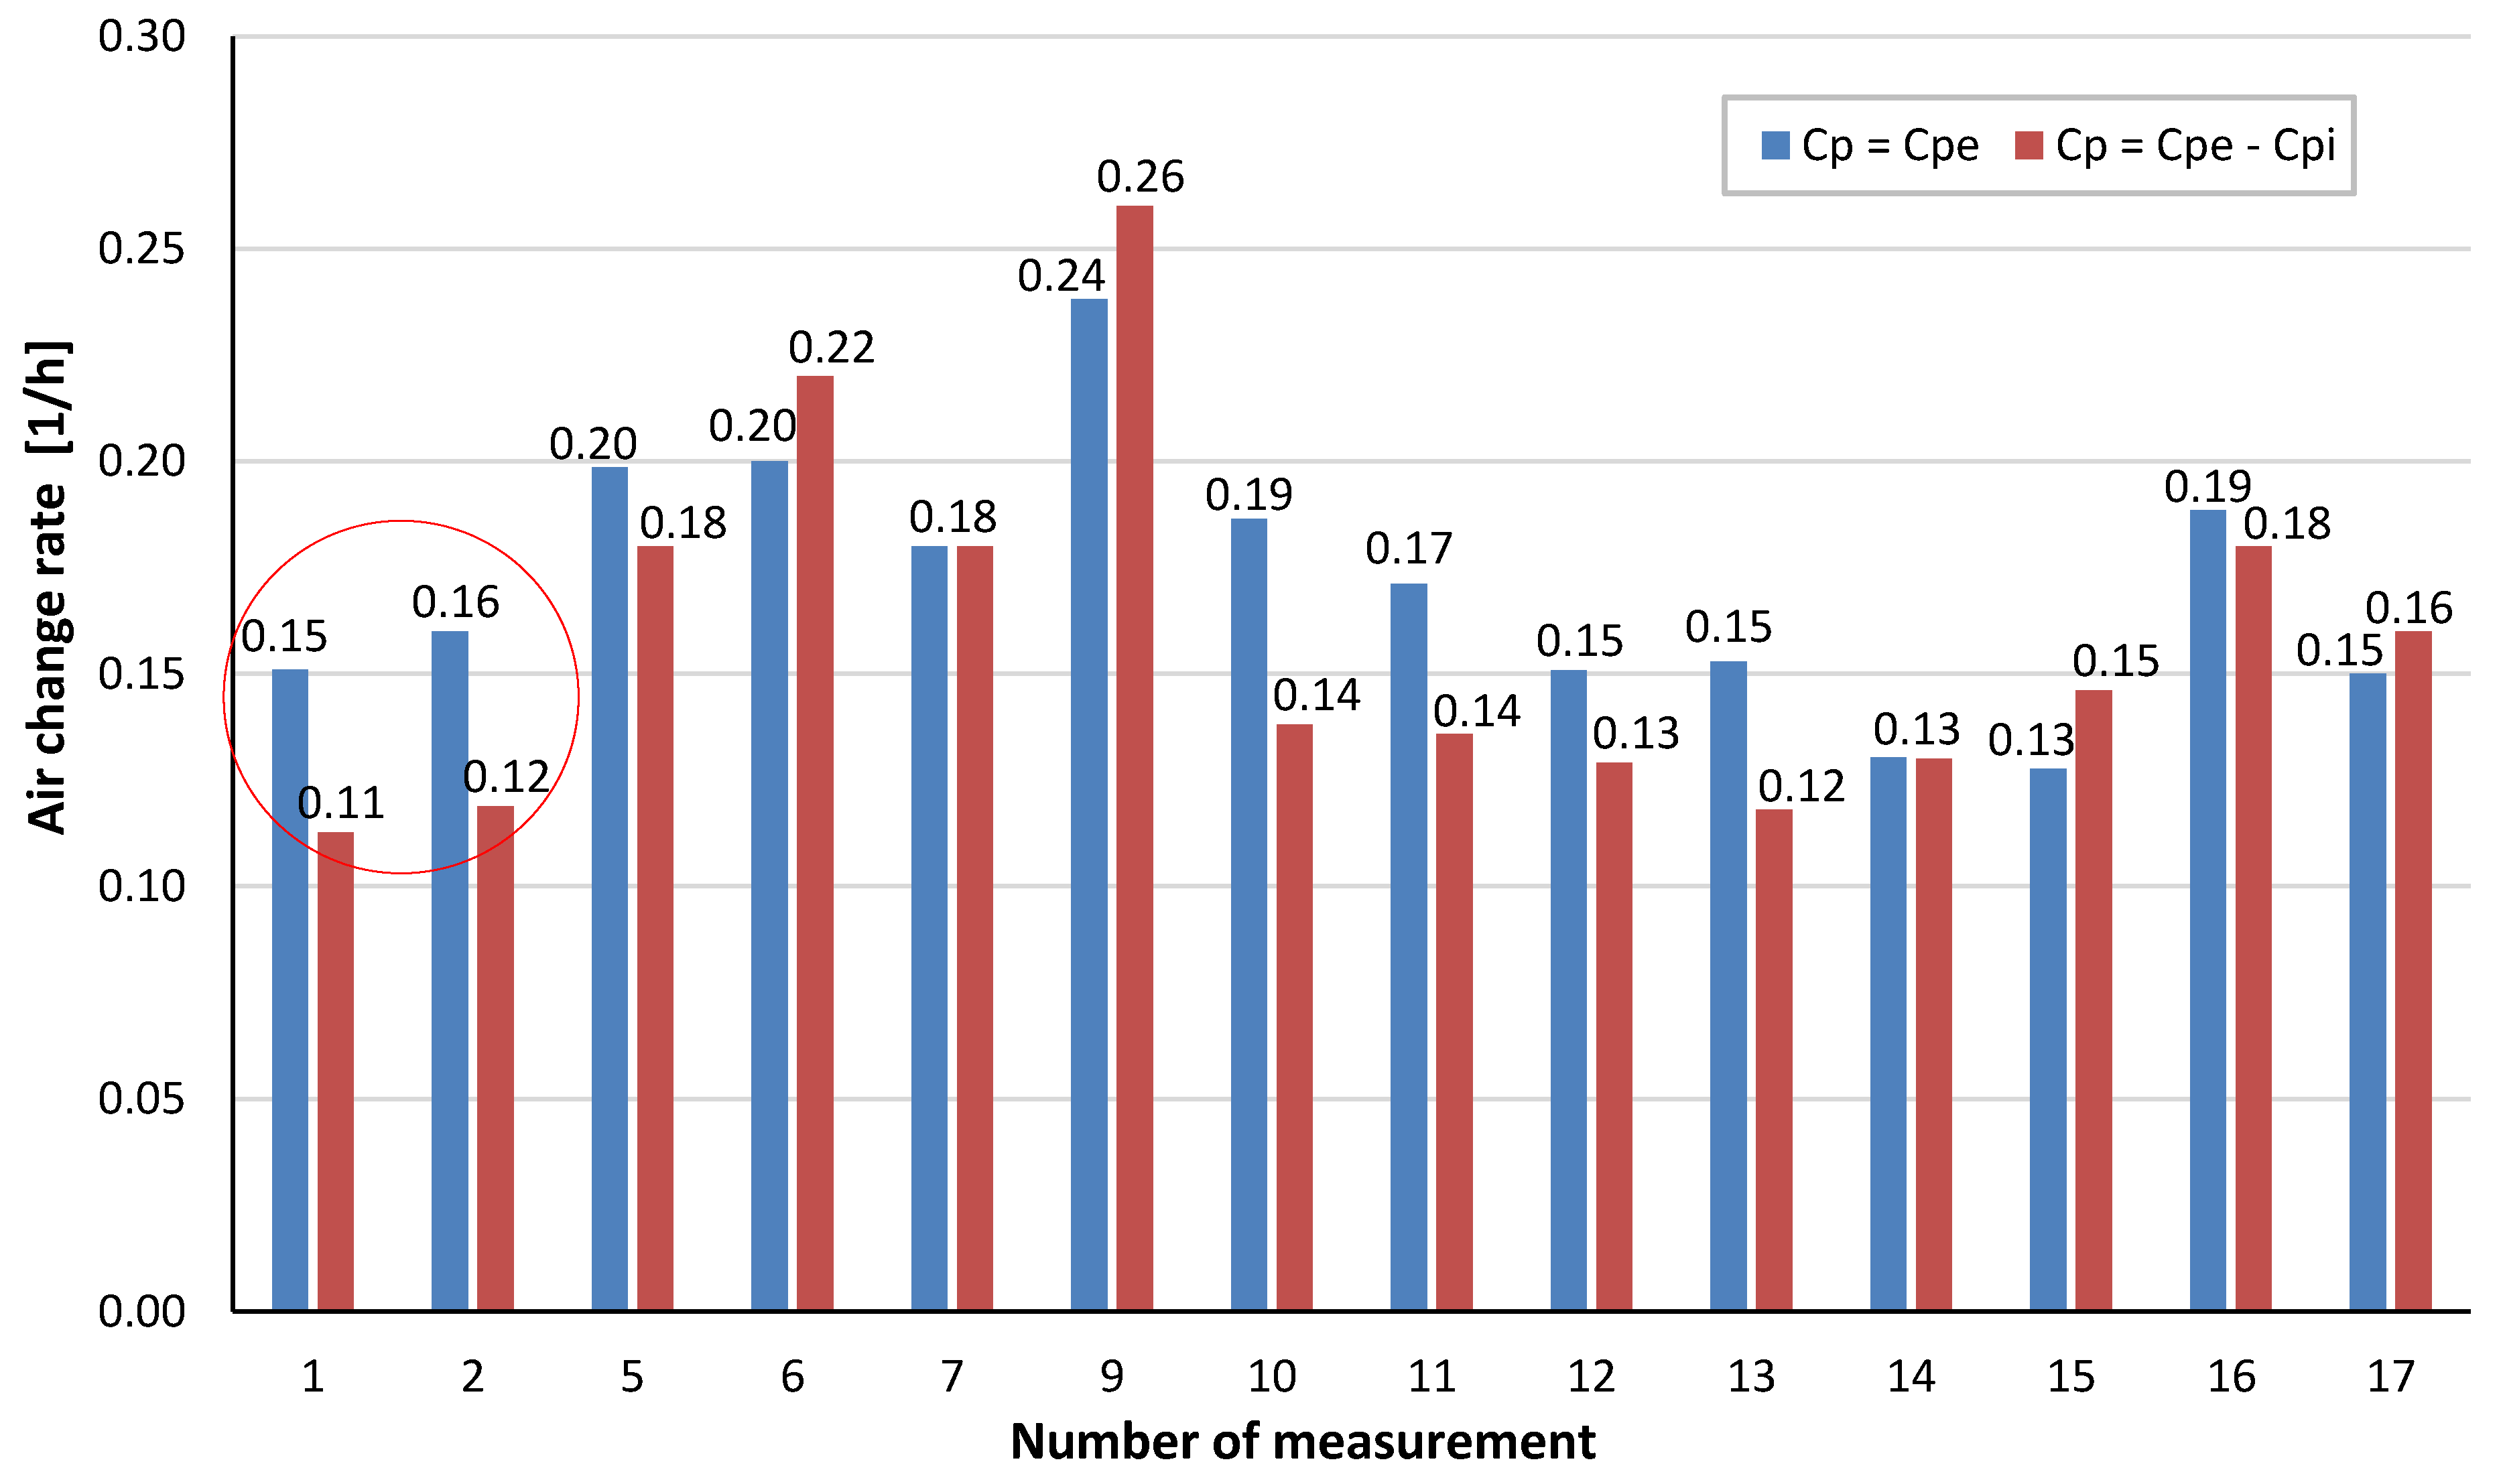
3.2. Prediction of Air Change Rate Using Quantifying of Total Aerodynamic Coefficient Cp

Calculations of air change rate in the reference room were processed for selected days and hours with wind direction N, NNE-360°, 22,5° (accurate to 22.5°). Because the reference room is oriented NW, the values of external aerodynamic coefficient for different wind direction are Cpe,N = +0.35 and Cpe,NNE = +0.525, internal aerodynamic coefficient Cpi were determined for building with two gable walls graphically according [27,30]. External and internal pressure act at the same time. The values of air change rate were calculated for building without considering the influence of openings Cp = Cpe and when considering the effect of openings Cp = Cpe − Cpi.
The values of air change rate for reference building with two gable walls for higher and lower wind speed are in Figure 8 and Figure 9.
At higher wind speeds can see from Figure 8 a significant effect of the openings, which causes a decrease in the values of the air change rate n. The difference between the values is in the range 0.05–0.137 1/h, i.e., by 20.6–41.2%, which is on average 25.1%. At the same time can be stated from Figure 9 that the influence of the openings at lower wind speeds does not play a significant role–the difference of air change rate n = 0.00–0.048, i.e., 0.00–29.4%, on average 8.3%, except two measurements—on 5 March 2018 at 8:30 a.m. (No 1) and 9:30 a.m. (No 2) where the difference was up to 35%.

3.3. Determination of Air Change Rate on the Basis of Measured Values of Carbon Dioxide Concentration

CO2 was produced only by people in the room. The increase of CO2 concentration was caused by the continued presence of people. Throughout the time of their stay in the room, air change was caused by infiltration.
For each experiment, CO2 concentration measurements were made at time intervals of 1 min. In order to calculate of air change rate, the duration of CO2 concentration decrease was considered as a multiple of several 1 min time intervals. As an example, for measurements carried out on 3 February 2019, the first interval was 1 min and the last (31st time interval) was 31 min, resulting in 31 calculated CO2 air change rates (Figure 10).
From these results, the extreme values were excluded (the first four), and from the remainder of 27 values, the air change rate for that experiment was calculated as the arithmetic mean. A final value 0.11 (1/h) was obtained.
Calculated differences and margin of error of the air change rate established by calculations according to measurements of CO2 are given in the Table 2.
Based on the calculated differences listed in Table 2 it can be concluded that the average margin of error is approximately 3.23%.

4. Results and Discussion

This case study examines the effect of the wind direction and size and position of windows on the facade on interior air pressure. It points out the redistribution of these pressures and confronts the calculated results with experimentally measured values of carbon dioxide. It is used to find solutions in order to specify the air change rate, which significantly affects the thermal regime and comfort of the indoor environment. To determine the values of the air change rate, we used the calculation by aerodynamic quantification of buildings to account for the influence of the wind with the parameters of the building and accepting the air permeability of the facade, and the actual measurements by means of the instrument, on the basis of which the experimental measurements of carbon dioxide was used. The results were evaluated and compared with each other. The values of the air change rate can be seen in Figure 11 and Figure 12 where they are shown and compared values of air change rate for higher and lower wind speed.
At higher wind speeds v = 4.4–10.3 m/s (see Figure 11) is the effect of openings much more pronounced. At higher wind speeds v = 4.4–10.3 m/s the values of air change rate with considering the effect of openings (Cp = CpeCpi) are closer to the values obtained based on experimental measurements of carbon dioxide and the difference between the values without considering the effect of openings (Cp = Cpe) increases significantly. The difference between the values of air change rate taking into account the influence of openings (Cp = CpeCpi) and the values based on experimental measurements of carbon dioxide was in the range 0.00–0.09 (1/h), which is from 0.00% to 20.2% (Table 3, Figure 13). The big difference 34.6% was only during one measurement No 18 on 25 March 2019 (Figure 11). Calculations of air change rate values without considering the effect of openings (Cp = Cpe) differed significantly from the values obtained based on experimental measurements of carbon dioxide in range 0.04–0.16 (1/h), i.e., in the range 7.0–53.3% (Table 4).
As can be seen from Figure 12 (values for lower wind speed), the values obtained using quantifying of total aerodynamic coefficient Cp = Cpe − Cpi are comparable to the values obtained by calculation based on experimental measurements of carbon dioxide. At the same time can be stated, that at such low wind speeds, the effect of openings does not play a significant role. At lower wind speeds there was a smaller difference between the values obtained by quantifying of total aerodynamic coefficient Cp and the methodology based on experimental measurements of carbon dioxide (see Table 3 and Figure 12). In 11 measurements, closer to the values obtained by the carbon dioxide method, was the value of the air change rate calculated with considering the openings (Cp = Cpe − Cpi). The difference was in the range 0.01–0.043 (1/h) thus by 0.0–35.6%.
The calculations without considering the openings were more pronounced—up to 52.1%. In three measurements 26 January 2019 (No 10), 27 January 2019 (No 11) and 3 February 2019 (No 15) indicated in Figure 12 it was the value without considering the effect of openings Cp = Cpe closer to the value based on experimental measurements of carbon dioxide.
The calculated differences and percentage differences in air change rate determined by different methods for each measurement day can be seen in Figure 13. This figure is illustrative only and shows the percentage differences according to Table 3 and Table 4.
It can be seen also the interaction of wind effects and different temperatures. On 2 December 2018 (No 7) and 1 April 2019 (No 19) was calculated the same change rate n = 0.19 (1/h) at different wind speeds v = 1.6 m/s and 6.3 m/s, however, the outside air temperature was θe = −3 °C and θe = +8.3 °C.
The difference between the values of the air exchange rate taking into account the influence of the holes Cp = Cpe − Cpi and the values based on experimental measurements of carbon dioxide for a higher wind speed v = 4.4–10.3 m/s is shown in Figure 14. In the figure, there are differences in the results obtained according to the individual methods only in those measurements where a high wind speed was recorded. There are ten measurements.
However, these results also indicate that the value of air change rate is at high wind speeds significantly lower than the value set by STN [5] n = 0.5 (1/h), except for one measurement on 17 March 2018 (No 3, No 4) at wind speed v = 9.4 m/s and 10.3 m/s and external temperature θe = −12.3 °C and θe = −14.1 °C.

5. Conclusions

The aim of the study was to evaluate the accuracy of the predictive value of determining the of air change rate by comparing two methods using quantifying of total aerodynamic coefficient Cp (aerodynamic quantification of buildings) and the method based on experimental measurements of carbon dioxide. Based on the calculations and measurements used in this study on different days (as shown in the tables and graphs), the results were compared and evaluated.
As already mentioned, the results obtained by specifying the aerodynamic coefficient Cp = Cpe − Cpi when accepting the air permeability of the building facade and the values based on experimental measurements of carbon dioxide are comparable and can be accepted. This comparison can be generally applied for following conditions: living room with the exterior wall to the windward direction, no impact of interior restrictions to air movement, all leakage is due to window leakage, no air entering room from lower unit.
At present, when manufacturers are trying to produce windows with almost zero joint air permeability, it is not possible to ensure natural air exchange with the windows closed. This problem must be solved by acknowledging micro-ventilation joints in the window construction. The eternal problem is to maintain a balance between hygiene and energy requirements. Hygienists, doctors would like a natural exchange of fresh air several times an hour, not only twice but three to four times. This is unacceptable for creators of artificial material environments, building architects who want to save energy for heating. When designing, they consider very small values of n (natural air exchange number) to predict low energy consumption for heating or cooling.
The current situation in the world, where infectious diseases (such as COVID-19) are spreading, people in Slovakia have to spend most of their time at home because it is forbidden to leave home. Children learn at home using computers in conjunction with the teacher via the Internet. With very tight windows, there is an increase in the amount and multiplication of bacteria in the indoor air. Therefore, the natural exchange of air for human health is very much needed. The whole process of such evaluation is based on very unstable methods, into which a number of unknowns enter. The building design process today requires completely different approaches than in the past. Everything leads to a certain virtual reality, simulation methods, where it is necessary to consider reference values for the calculation. Therefore, the value of air change when considering simulation tools requires that it be determined and verified by measurement. This study points to the possibilities of verifying the air change rate.
The results of measurements and calculations show that the values of the air change rate at both lower and higher wind speeds are below the standard level. This means that they differ significantly from the value for living rooms in residential buildings specified by the standard, which is n = 0.5 (1/h). At higher wind speeds, the air permeability of the building facade plays an important role. The resulting values obtained taking into account the effect of openings (considered total aerodynamic coefficient Cp = CpeCpi are comparable with the values obtained based on experimental measurements of carbon dioxide.

Author Contributions

Conceptualization, I.B.; data curation, I.B. and P.K.; formal analysis, D.K.; investigation, D.K.; methodology, I.B.; project administration, D.K.; resources, I.B. and P.K.; software, I.B. and P.K.; supervision, D.K.; writing—original draft, I.B. and P.K.; writing—review and editing, D.K. All authors have read and agreed to the published version of the manuscript.

Funding

This publication is the part of the Project implementation: University Science Park TECHNICOM for Innovation Applications Supported by Knowledge Technology, ITMS: 26220220182, supported by the Research & Development Operational Programme funded by the ERDF.

Institutional Review Board Statement

Not applicable.

Informed Consent Statement

Not applicable.

Acknowledgments

This paper was elaborated with the financial support of the research project VEGA 1/0674/18 of the Scientific Grant agency, the Ministry of Education, Science, Research, and Sport of the Slovak Republic and the Slovak Academy of Sciences.

Conflicts of Interest

The authors declare no conflict of interest.

References

  1. Bornehag, C.G.; Sundell, J.; Hagerhed-Engman, L.; Sigsgaard, T. Association between ventilation rates in 390 Swedish homes and allergic symptoms in children. Indoor Air 2005, 15, 275–280. [Google Scholar] [CrossRef] [PubMed]
  2. Sundell, J.; Levin, H.; Nazaroff, W.W.; Cain, W.S.; Fisk, W.J.; Grimsrud, D.T.; Gyntelberg, F.; Li, Y.; Persily, A.K.; Pickering, A.C.; et al. Ventilation rates and health: Multidisciplinary review of the scientific literature. Indoor Air 2011, 21, 191–204. [Google Scholar] [CrossRef] [PubMed]
  3. Wargocki, P.; Sundell, J.; Bischof, W.; Brundrett, G.; Fanger, P.O.; Gyntelberg, F.; Hanssen, S.O.; Harrison, P.; Pickering, A.; Seppanen, O.; et al. Ventilation and health in non-industrial indoor environments: Report from a European Multidisciplinary Scientific Consensus Meeting (EUROVEN). Indoor Air 2002, 12, 113–128. [Google Scholar] [CrossRef]
  4. Asikainen, A.; Hänninen, O.; Brelih, N.; Bischof, W.; Hartmann, T.; Carrer, P.; Wargocki, P. The Proportion of Residences in European Countries with Ventilation Rates below the Regulation Based Limit Value. Int. J. Vent. 2013, 12, 129–134. [Google Scholar] [CrossRef]
  5. Slovak Republic Office of Standards, Metrology and Testing. STN 73 4301—Dwelling Buildings; Slovak Republic Office of Standards, Metrology and Testing: Bratislava, Slovakia, 2005.
  6. Chmúrny, I. Tepelná Ochrana Budov; JAGA: Bratislava, Slovakia, 2003. [Google Scholar]
  7. Aynsley, R.M.; Melbourne, W.; Vickery, B.J. Architectural Aerodynamics; Applied Science Publishers Ltd.: London, UK, 1977; ISBN 0-85334-698-4. Available online: https://www.worldcat.org/title/architectural-aerodynamics/oclc/569295778 (accessed on 12 January 2021).
  8. Meroney, R.N.; Neff, D.E.; Birdsall, J.B. Wind-tunnel simulation of infiltration across permeable building envelopes: Energy and air pollution exchange rates. In Proceedings of the 7th International Symposium on Measurement and Modeling of Environmental Flows International Mechanical Enginnering Conference, San Francisco, CA, USA, 12–17 November 1995; Available online: https://www.osti.gov/biblio/435757 (accessed on 12 January 2021).
  9. Székyová, M.; Bodo, R.; Ihradský, J. Vetranie; STU Bratislava: Bratislava, Slovakia, 2002; ISBN 80-227-1681-2. [Google Scholar]
  10. Kleiven, T. Natural Ventilation in Buildings; Norwegian University of Science and Technology: Trondheim, Norway, 2003; Available online: https://ntnuopen.ntnu.no/ntnu-xmlui/handle/11250/231090 (accessed on 20 January 2021).
  11. Bielek, M.; Bielek, B. Vplyv stavebných materiálov a konštrukcií na kvalitu života. Parametrizovanie energeticko-environmentálneho hodnotenia stavebných konštrukcií a budov. In Aerodynamika Budov pre Kvantifikáciu ich Prirodzeného Vetrania; PROFING: Bratislava, Slovakia, 2005. [Google Scholar]
  12. Drkal, F.; Lain, M.; Schwarzer, J.; Zmrhal, V. Vzduchotechnika; Evropský Sociální Fond: Praha, Czech Republic, 2009. [Google Scholar]
  13. Katunsky, D.; Katunská, J.; Bullová, I. Solution of the air flow in the ventilated facade and its effect on the thermal characteristics of the peripheral wall. In Proceedings of the 18th International Multidisciplinary Scientific GeoConference, SGEM 2018, Albena, Bulgaria, 2–8 July 2018; ISBN 978-619-7408-52-2. [Google Scholar] [CrossRef]
  14. Muehleisen, R.T.; Patrizi, S. A new parametric equation for the wind pressure coefficient for low-rise buildings. Energy Build. 2013, 57, 245–249. [Google Scholar] [CrossRef]
  15. Ginger, J.D. Internal Pressures and Cladding Net Wind Loads on Full-Scale Low-Rise Building. J. Struct. Eng. 2000, 126, 538–543. [Google Scholar] [CrossRef]
  16. Chen, J.H.; Chen, C.H. A Study on the Wind Pressures of the Partial Enclosed Buildings in the View of Net Pressures. In Proceedings of the Seventh Asia-Pacific Conference on Wind Engineering 2009, Taipei, Taiwan, 8–12 November 2009; Available online: http://14.139.190.172/cgi-bin/koha/opac-detail.pl?biblionumber=6583&shelfbrowse_itemnumber=6583 (accessed on 21 January 2021).
  17. Thampi, H.; Dayal, V.; Sarkar, P.P. Finite Element Modeling of Interaction of Tornado with a Low-Rise Timber Building. In Proceedings of the Fifth International Symposium on Computational Wind Engineering, Chapel Hill, NC, USA, 23–27 May 2010; Available online: https://www.researchgate.net/profile/Vinay_Dayal/publication/267545369_Finite_element_modeling_of_interaction_of_tornado_with_a_low-rise_timber_building/links/5464bb840cf2a8cf007bffed.pdf (accessed on 15 January 2021).
  18. Cóstola, D.; Blocken, B.; Hensen, J.L.M. Overview of pressure coefficient data in building energy simulation and airflow network programs. Build. Environ. 2009, 44, 2027–2036. [Google Scholar] [CrossRef] [Green Version]
  19. Montazeri, H.; Blocken, B. CFD simulation of wind-induced pressure coefficients on buildings with and without balconies: Validation and sensitivity analysis. Build. Environ. 2013, 60, 137–149. [Google Scholar] [CrossRef]
  20. STN EN 1991-1-4: 2007, Eurocode 1: Actions on Structures. Part 1–4: General Actions. Wind Actions. Available online: https://www.phd.eng.br/wp-content/uploads/2015/12/en.1991.1.4.2005.pdf (accessed on 25 January 2021).
  21. Richards, P.; Hoxey, R. Wind loads on the roof of a 6 m cube. J. Wind. Eng. Ind. Aerodyn. 2008, 96, 984–993. [Google Scholar] [CrossRef]
  22. Bitsuamlak, G.; Tecle, A.S. Full-Scale External and Internal Pressure Measurements for a Low-Rise Building. Florida Internation-al University. 2009. Available online: http://www.ihrc.fiu.edu/wpcontent/uploads/2012/05/HLMP (accessed on 11 January 2021).
  23. Doudak, G.; McClure, G.; Smith, I.; Stathopoulos, T. Comparison of Field and Wind Tunnel Pressure Coefficients for a Light-Frame Industrial Building. J. Struct. Eng. 2009, 135, 1301–1304. [Google Scholar] [CrossRef]
  24. Al Zoubi, F.; Li, Z.; Wei, Q.; Sun, Y. Wind tunnel test and numerical simulation of wind pressure on a high-rise building. J. Chongqing Univ. 2010. Available online: http://www.cnki.com.cn/Article/CJFDTotal-CQDX201001008.htm (accessed on 12 February 2021).
  25. Amin, J.; Ahuja, A. Experimental study of wind-induced pressures on buildings of various geometries. Int. J. Eng. Sci. Technol. 2011, 3, 68562. Available online: https://www.ajol.info/index.php/ijest/issue/view/8314 (accessed on 12 January 2021). [CrossRef]
  26. Amin, J.A.; Ahuja, A.K. Effects of Side Ratio on Wind-Induced Pressure Distribution on Rectangular Buildings. J. Struct. 2013, 2013, 1–12. [Google Scholar] [CrossRef] [Green Version]
  27. Bielek, M.; Černík, P.; Tajmír, M. Aerodynamika Budov. Fyzikálne Problémy Účinkov Vetra na Budovy a Ich Okolie; ALFA: Bratislava, Slovakia, 1990; ISBN 80-05-00632-2. [Google Scholar]
  28. Ginger, J.; Letchford, C. Net pressures on a low-rise full-scale building. J. Wind. Eng. Ind. Aerodyn. 1999, 83, 239–250. [Google Scholar] [CrossRef]
  29. Holmes, J. Mean and fluctuating internal pressures induced by wind. In Proceedings of the Wind Engineering; Elsevier BV: Amsterdam, The Netherlands, 1980; pp. 435–450. Available online: https://www.aivc.org/sites/default/files/members_area/medias/pdf/Airbase/airbase_00824.pdf (accessed on 10 February 2021).
  30. Bielek, M.; Bielek, B. Aerodynaická kvantifikácia budovy pre určenie prietoku vzduchu a energetického režimu prirodzeného fyzikálního medzipriestoru. In Proceedings of the 7th Vedecká Konferencia Budova a Energia 2007, Podbanské, Slovakia, 5–7 December 2007. [Google Scholar]
  31. EN ISO 12569: Thermal Performance of Buildings and Materials—Determination of Specific Airflow Rate in Buildings—Tracer Gas Dilution Method 2017. Available online: https://www.iso.org/standard/69817.html (accessed on 10 February 2021).
  32. Benedettelli, M.; Naticchia, B.; Carbonari, A.; Pascucci, M. Testing of a Tracer Gas Based Measurement Procedure to Assess Air Change Rates in Buildings. ISARC Proc. Int. Symp. Autom. Robot. Constr. 2015, 32, 1–7. [Google Scholar]
  33. Sherman, M. Tracer-gas techniques for measuring ventilation in a single zone. Build. Environ. 1990, 25, 365–374. [Google Scholar] [CrossRef]
  34. Persily, A.K. Evaluating Building IAQ and Ventilation with Indoor Carbon Dioxide; ASHRAE Transactions: Boston, MA, USA, 1997; Volume 103, Part 2; Available online: https://www.aivc.org/sites/default/files/airbase_10530.pdf (accessed on 12 January 2021).
  35. Kisilewicz, T.; Nowak-Dzieszko, K. Low airflow measurements by means of gas tracing method. IOP Conf. Ser. Mater. Sci. Eng. 2018, 415, 012030. [Google Scholar] [CrossRef]
  36. Nowak, K.; Nowak-Dzieszko, K.; Marcinowski, A. Analysis of ventilation air exchange rate and indoor air quality in the office room using metabolically generated CO2. IOP Conf. Ser. Mater. Sci. Eng. 2018, 415, 012028. [Google Scholar] [CrossRef]
  37. Zhang, W.; Wang, L.; Ji, Z.; Ma, L.; Hui, Y. Test on Ventilation Rates of Dormitories and Offices in University by the CO2 Tracer Gas Method. Procedia Eng. 2015, 121, 662–666. [Google Scholar] [CrossRef] [Green Version]
  38. Cui, S.; Cohen, M.; Stabat, P.; Marchio, D. CO2 tracer gas concentration decay method for measuring air change rate. Build. Environ. 2015, 84, 162–169. [Google Scholar] [CrossRef]
  39. Laussmann, D.; Helm, D. Air Change Measurements Using Tracer Gases: Methods and Results. Significance of air change for indoor air quality. Chemistry, Emission Control, Radioactive Pollution and Indoor Air Quality; SP. ED1—Nicolas Mazzeo: Rijeka, Croatia, 2011. [Google Scholar] [CrossRef] [Green Version]
  40. Katunský, D.; Nemec, M.; Kamenský, M. Airtightness of Buildings in Slovakia. Adv. Mater. Res. 2013, 649, 3–6. [Google Scholar] [CrossRef]
  41. Ferdyn-Grygierek, J.; Baranowski, A.; Blaszczok, M.; Kaczmarczyk, J. Thermal Diagnostics of Natural Ventilation in Buildings: An Integrated Approach. Energies 2019, 12, 4556. [Google Scholar] [CrossRef] [Green Version]
  42. Weerasuriya, A.; Zhang, X.; Gan, V.J.; Tan, Y. A holistic framework to utilize natural ventilation to optimize energy performance of residential high-rise buildings. Build. Environ. 2019, 153, 218–232. [Google Scholar] [CrossRef]
  43. Craig, S. The optimal tuning, within carbon limits, of thermal mass in naturally ventilated buildings. Build. Environ. 2019, 165, 106373. [Google Scholar] [CrossRef]
  44. Conceição, E.; Gomes, J.; Awbi, H. Influence of the Airflow in a Solar Passive Building on the Indoor Air Quality and Thermal Comfort Levels. Atmosphere 2019, 10, 766. [Google Scholar] [CrossRef] [Green Version]
  45. Raji, B.; Tenpierik, M.J.; Bokel, R.; van den Dobbelsteen, A. Natural summer ventilation strategies for energy-saving in high-rise buildings: A case study in the Netherlands. Int. J. Vent. 2019, 19, 25–48. [Google Scholar] [CrossRef] [Green Version]
  46. Alomirah, H.F.; Moda, H.M. Assessment of Indoor Air Quality and Users Perception of a Renovated Office Building in Manchester. Int. J. Environ. Res. Public Health 2020, 17, 1972. [Google Scholar] [CrossRef] [Green Version]
  47. Tam, C.; Zhao, Y.; Liao, Z.; Zhao, L. Mitigation Strategies for Overheating and High Carbon Dioxide Concentration within Institutional Buildings: A Case Study in Toronto, Canada. Buildings 2020, 10, 124. [Google Scholar] [CrossRef]
  48. Lu, C.-Y.; Lin, J.-M.; Chen, Y.-Y.; Chen, Y.-C. Building-Related Symptoms among Office Employees Associated with Indoor Carbon Dioxide and Total Volatile Organic Compounds. Int. J. Environ. Res. Public Health 2015, 12, 5833–5845. [Google Scholar] [CrossRef] [PubMed]
  49. Stabile, L.; Massimo, A.; Canale, L.; Russi, A.; Andrade, A.; Dell’Isola, M. The Effect of Ventilation Strategies on Indoor Air Quality and Energy Consumptions in Classrooms. Buildings 2019, 9, 110. [Google Scholar] [CrossRef] [Green Version]
Figure 1. The approximate influence of the facade air permeability on the pressure and suction distribution on windward and leeward side for tall building with rectangular ground plan, A—zero air permeability building, B—air permeability building, (source authors, processed according to [11]).
Buildings 11 00174 g001
Figure 2. (a,b) The situation of a case study (according to https://mapa.zoznam.sk/, accessed on 21 January 2021).
Buildings 11 00174 g002
Figure 3. External view of selected apartment building, (source authors).
Buildings 11 00174 g003
Figure 4. Ground plan: floorplan of the reference apartment.
Buildings 11 00174 g004
Figure 5. The subject, goal and methodology of the research: flowchart of research.
Buildings 11 00174 g005
Figure 6. Recording of indoor air quality courses from experimental measurements No 15 (3 February 2019).
Buildings 11 00174 g006
Figure 7. Recording of concentration of CO2 for selected day 3 February 2019 No 15.
Buildings 11 00174 g007
Figure 8. The values of air change rate without considering the influence of the openings Cp = Cpe and when considering the effect of the openings Cp = Cpe − Cpi for higher wind speed v = 4.4–10.3 m/s.
Buildings 11 00174 g008
Figure 9. The values of air change rate without considering the influence of openings–Cp = Cpe and when considering the influence of openings Cp = Cpe − Cpi for lower wind speed v = 1.1–4.1 m/s.
Buildings 11 00174 g009
Figure 10. The screening of the calculated values of air change rate for 3 February 2019 (No 15).
Buildings 11 00174 g010
Figure 11. Comparison of the values of air change rate without considering the influence of openings Cp = Cpe, with considering the effect of openings Cp = CpeCpi and calculation based on experimental measurements of carbon dioxide for higher wind speed v = 4.4–10.3 m/s.
Buildings 11 00174 g011
Figure 12. Comparison of air change rate values without considering the influence of openings Cp = Cpe with considering the effect of openings Cp = Cpe − Cpi and calculation based on experimental measurements of carbon dioxide for lower wind speed v = 1.1–4.1 m/s.
Buildings 11 00174 g012
Figure 13. Calculated differences and percentage differences in air change rate determined by different methods.
Buildings 11 00174 g013
Figure 14. The difference between values of air change rate taking into account the influence of openings Cp = Cpe − Cpi and the values based on experimental measurements of carbon dioxide for higher wind speed v = 4.4–10.3 m/s.
Buildings 11 00174 g014
Table 1. External and internal parameters in selected days and hours.
Number of MeasurementDate and Hours
of Measurement
CO2 ConcentrationAir TemperatureReduced Wind Speed
v
Starting CIDA,S Ending
CIDA,E
The Time of
Decrease t
IndoorOutdoor
(-)(d. m. y)(h:m)(ppm)(ppm)(min)(°C)(°C)(m/s)
15 March 2018 8:40115110646923.1−5.03.9
25 March 201810:30107610196923.1−6.03.9
317 March 201818:0011338915225.5−12.39.4
417 March 201821:00144011703126.4−14.110.3
51 December 201821:009458744223.0−4.02.7
62 December 20189:00132612152824.4−3.01.6
72 December 201814:009648963823.2−3.01.6
825 January 201920:10120010245922.9−4.06.7
926 January 20199:10134612062924.4−5.03.4
1026 January 201920:00135312304223.0−6.01.1
1127 January 201915:108417715723.0−2.01.6
122 February 20199:30205219074524.24.02.3
132 February 201913:30177816983223.65.02.7
142 February 201920:30140012796123.14.00.7
153 February 20199:30165415256024.07.02.0
164 February 201919:00137512146024.02.03.6
175 February 201910:00130711806024.12.02.0
1825 March 201920:30174016862525.08.04.4
191 April 201920:30132212761525.18.36.3
208 April 201919:10175116824524.619.05.4
2110 April 201920:10131012103024.510.08.3
2211 April 201920:00112109915023.96.09.4
2317 April 201920:20191817894524.111.04.7
246 May 201918:40125110776024.06.06.6
Table 2. Calculated differences and margin of error of the air change rate established by calculations according to measurements of CO2.
No.
(-)
n
(1/h)
U
(%)
No.
(-)
n
(1/h)
U
(%)
No.
(-)
n
(1/h)
U
(%)
No.
(-)
n
(1/h)
U
(%)
10.104.1070.193.79130.112.07190.191.55
20.084.4780.281.89140.132.74200.084.03
30.461.0290.302.50150.114.70210.242.42
40.592.12100.202.50160.183.96220.235.24
50.185.85110.191.76170.164.74230.110.88
60.261.93120.111.94180.098.63240.231.62
No.—measurement number; n—the air change rate (1/h); U—the uncertainty (%).
Table 3. Calculated differences and percentage differences in air exchange rate determined by different methods—higher wind speeds.
Number of MeasurementsThe Air Change Rate, nDifference between
Cp = CpeCp = Cpe − CpiCarbon Dioxide Method
ABCB–CA–C
(-)(1/h)(1/h)(1/h)(1/h)(%)(1/h)(%)
30.570.450.460.023.50.1017.9
40.630.500.590.0918.20.04 7.0
80.320.250.280.0310.5 0.04 12.8
180.180.140.090.0534.60.09 49.5
190.250.170.190.0210.00.06 23.4
200.160.100.080.0220.20.09 53.3
210.330.210.240.0314.00.09 26.8
220.390.250.230.028.60.16 40.7
230.180.130.110.0214.30.07 37.6
240.270.230.230.0419.60.04 15.9
Table 4. Calculated differences and percentage differences in air exchange rate determined by different methods for lower wind speeds.
Number of MeasurementsThe Air Change Rate, n Difference between
Cp = CpeCp = Cpe − CpiCarbon Dioxide Method
ABCB–CA–C
(-)(1/h)(1/h)(1/h)(1/h)(%)(1/h)(%)
20.160.120.080.04235.60.08352.1
50.200.180.180.0031.90.0157.6
60.200.220.260.04420.00.06432.0
70.180.180.190.0094.70.0094.7
90.240.260.300.04416.80.06627.6
100.190.140.200.06244.80.0147.3
110.170.140.190.05742.20.02212.9
120.150.130.110.01914.80.04127.1
130.150.120.110.0086.90.04328.0
140.130.130.130.0000.00.0000.3
150.130.150.110.03624.70.01813.8
160.190.180.180.0050.00.0094.5
170.150.160.160.0000.00.0106.7
Publisher’s Note: MDPI stays neutral with regard to jurisdictional claims in published maps and institutional affiliations.

