Article

Change Detection in Unmanned Aerial Vehicle Images for Progress Monitoring of Road Construction

1
Department of Civil Engineering, Chonnam National University, 77 Yongbongro, Bukgu, Gwangju 61186, Korea
2
Department of Civil Engineering, Gyeongsang National University, 33 Dongjin-ro, Jinju-si, Gyeongsangnam-do 52725, Korea
3
Korea Expressway Corporation Research Institute, 208-96, Dongbu-daero 922 beon-gil, Dongtan-myeon, Hwaseong-si, Gyeonggi-do 18489, Korea
*
Author to whom correspondence should be addressed.
Buildings 2021, 11(4), 150; https://doi.org/10.3390/buildings11040150
Submission received: 24 February 2021 / Revised: 30 March 2021 / Accepted: 30 March 2021 / Published: 2 April 2021
(This article belongs to the Section Construction Management, and Computers & Digitization)

Abstract

:
Currently, unmanned aerial vehicles are increasingly being used in various construction projects such as housing developments, road construction, and bridge maintenance. If a drone is used at a road construction site, elevation information and orthoimages can be generated to acquire the construction status quantitatively. However, the detection of detailed changes in the site owing to construction depends on visual video interpretation. This study develops a method for automatic detection of the construction area using multitemporal images and a deep learning method. First, a deep learning model was trained using images of the changing area as reference. Second, we obtained an effective application method by applying various parameters to the deep learning process. The application of the time-series images of a construction site to the selected deep learning model enabled more effective identification of the changed areas than the existing pixel-based change detection. The proposed method is expected to be very helpful in construction management by aiding in the development of smart construction technology.

1. Introduction

The fields where drones can be applied are very diverse, such as terrain information construction, cadastral surveying, disaster management, environmental monitoring, inspection of various facilities, and exploration (mineral and gas) [1,2]. The field of construction involves the merging of design and construction information, visualization using the overlay of orthoimages and two-dimensional (2D) drawings, digital work, three-dimensional (3D) modeling and process comparison based on the process progress, construction quantity confirmation, and workload distribution; in this field, unmanned aerial vehicle (UAV) images and products are being used [3,4]. The life cycle of a road can be divided into four stages: planning, design, construction, and maintenance. In the planning, design, and maintenance stages, the use of drone images has developed, and drones can be used in a less time-consuming and a cost-effective manner in the construction stage [5].
In drone-based construction management, construction supervisors can additionally check whether the construction site has been constructed according to the design specification using a drone [6]. If drone technology is applied to the advanced payment tasks that are performed every month in construction projects, more accurate constructions can be achieved, and construction progress can be recorded through construction history management, which can be used for future maintenance or accident analysis.
UAV images are being used for point cloud extraction, digital surface and terrain model production, orthoimages, topographic mapping, and 3D model production on construction sites [4,7]. Airsight’s UAV-based next-generation airport road safety inspection technology uses orthoimages that can be reused at any time for maintenance activities, quantity surveying, computer-aided design planning, or compliance inspections [8]. Drone orthoimages and 3D terrain models enable periodic construction management at road construction sites [4]. Various types of environmental management using orthoimages, individual photos, and videos enable rapid observation, process management, and change detection, while ensuring the safety of a wide construction section [9,10,11,12,13], and unattended construction materials can be monitored through time-series images [14].
The progress map of construction work depicts the details of the construction performed during the construction period on the floor plan. For drone construction management, a 2D or 3D design plan is developed for the corresponding monthly period, and the progress status chart is used for a time-series comparison of the corresponding work section. However, the preparation of the status quo is costly and time-consuming; therefore, it cannot be applied immediately to obtain the approximate status [15,16].
It is difficult for managers to survey a construction site that covers a large area using traditional inspection methods. At the construction site, if managers can observe areas of change using time-series images during the construction stage, they can conveniently use them for environmental management such as construction management, safety management in vulnerable areas, and waste management. When a manager or supervisor is unable to visit a construction site, the image-based history can be provided to present the construction progress accurately and quickly. The use of a UAV supported by a high-level computing device and an artificial neural network makes this inspection method more efficient and more cost-effective than traditional methods.
Change detection using an image aims to detect the changed areas by utilizing images of the same region captured at different points in time [17]. Many change detection methods have been proposed to detect changing areas, with machine learning being used in recent years [18,19,20,21,22,23,24]. Guo et al. proposed a convolutional neural network (CNN) architecture that measures changes in a region using an implicitly learned metric with a contrastive loss threshold [20]. To detect precise temporal changes in a region, a superpixel segmentation method that integrates CNN features has been introduced [21]. Zhan et al. proposed a novel model for change detection in UAV images based on a supervised deep Siamese CNN [22]. Shi et al. introduced an object-based change detection method that uses multitemporal UAV images [23]. Change detection in urban areas is performed by finding an elevation difference based on point cloud data from the aerial images acquired at different times [24].
In this study, a change detection method that considers construction management has been developed using high-resolution UAV images acquired for road construction progress. A convolutional Siamese network was proposed to identify the changed region using time-series images, in which the contrastive loss function was used to minimize the distance between the two feature vectors in the areas with no change [22]. A convolutional Siamese network is effective for change detection using high-resolution images, even when problems such as a difference in viewpoints, shadows, and inaccurate image registration occur [25]. However, at road construction sites, noises, such as vegetation changes and vehicles, which are not related to the road construction, exist. A convolutional Siamese network detects only the areas of significant change. In this study, we used deliberate training samples to overcome this issue and monitor the progress of road construction. In addition, an experiment was conducted using an appropriate image resolution for effective processing. The remainder of this paper is structured as follows. The methodology is described in Section 2. The experiment is presented in Section 3. The results and discussion are described in Section 4. Finally, the conclusions of this study are drawn in Section 5.

2. Methodology

2.1. Orthoimage Generation

For construction management using drones, a 3D model must be developed by periodically photographing the road construction process with a UAV and then recorded in a time series. To analyze the road construction process through the time series, a standard image is required. In the case of an area with trees, the ground cannot be analyzed using a UAV photo, and accurate ground shape data cannot be obtained. If the beehive removal process and the earthmoving process are sequentially performed at the construction site, the overall process flow must be properly managed to ensure that the drone photography is performed after the removal of beehives and before the earthwork process.
Individual photos, orthoimages, and videos can be utilized as a basic output for UAV-based time-series monitoring. Individual photos are single photos taken by a UAV, which can be used to check the condition of an object. When an image is acquired with the same path and geometry by the same sensor during a subsequent acquisition, the site change can be estimated through comparison between individual photos. The digital cameras, global navigation satellite systems, and inertial measurement units currently used in UAVs generally have similar performances; however, if real-time kinematic positioning is supported by a UAV [26], differences between multitemporal images for detecting changes can be diminished in photographs acquired using the same flight path. The ground sampling distance (GSD) in a UAV photo is the most important setting factor in UAV photogrammetry for understanding the construction situation, and it is deeply related to the UAV flight altitude. It is necessary for the appropriate GSD of an image to be identified according to the road facilities and for characteristics to be distinguished at the construction site.
An orthoimage refers to an image in which orthogonal projection has been performed, and the geometric distortion of the terrain caused by elevation in the image acquired by a UAV is corrected. In addition, all topographic features are converted into the image with a vertical view using a digital surface model (DSM). In a DSM, regular grid data represent the height of the ground surface and the artificial features of buildings, trees, and vegetation. The orthoimages are produced through differential rectification using commercial software and can be georeferenced and used to obtain the current status map of topographical features [27]. In particular, even when there are differences in the camera, flight path, and acquisition geometry between images, the image is converted into the same field of view for more comprehensive use in the detection of changes.

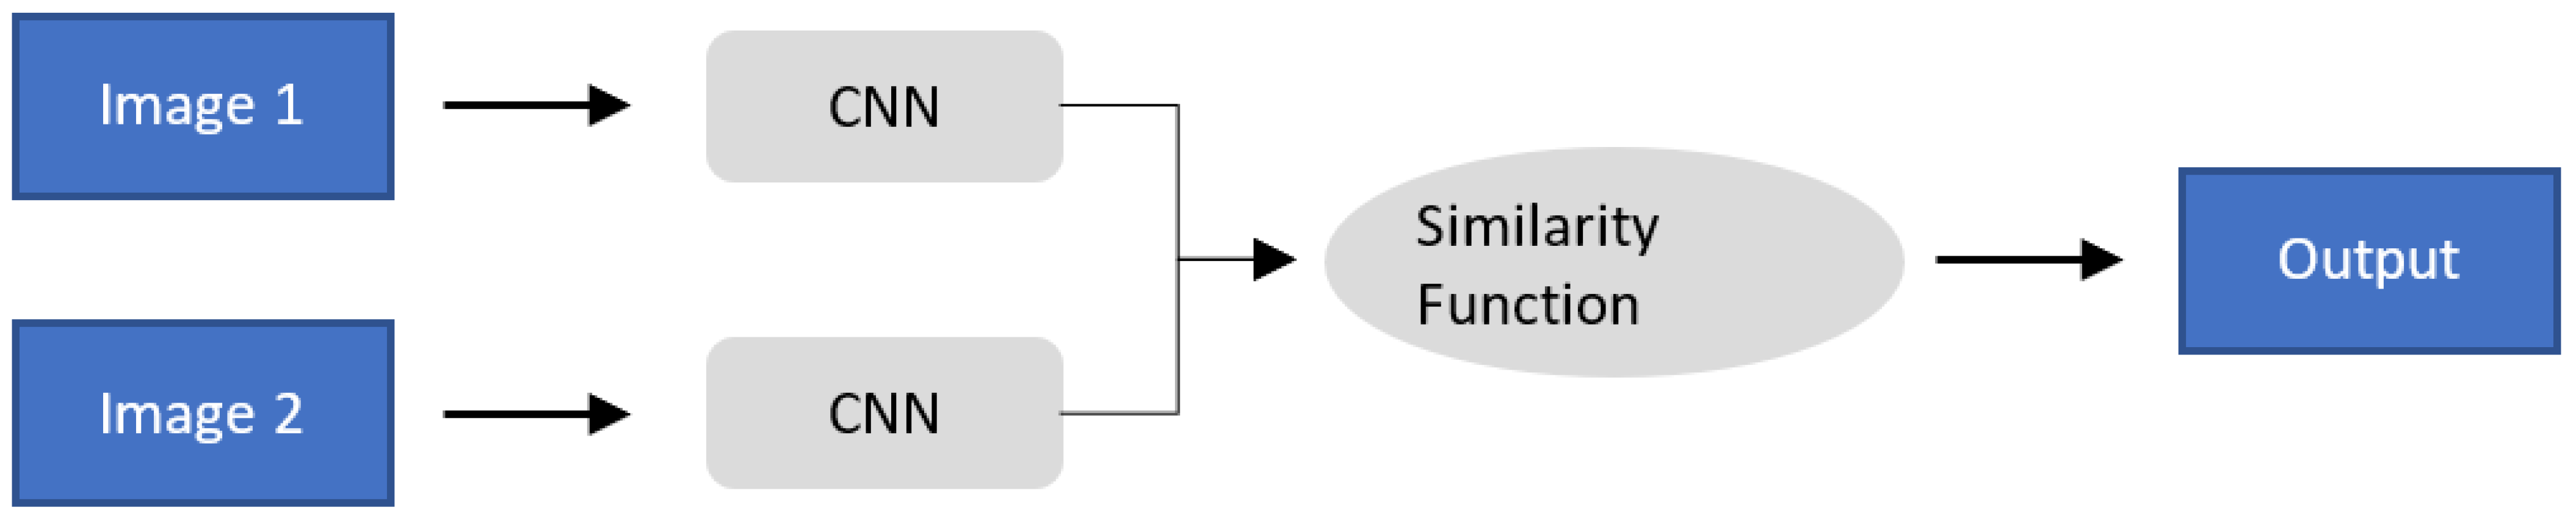
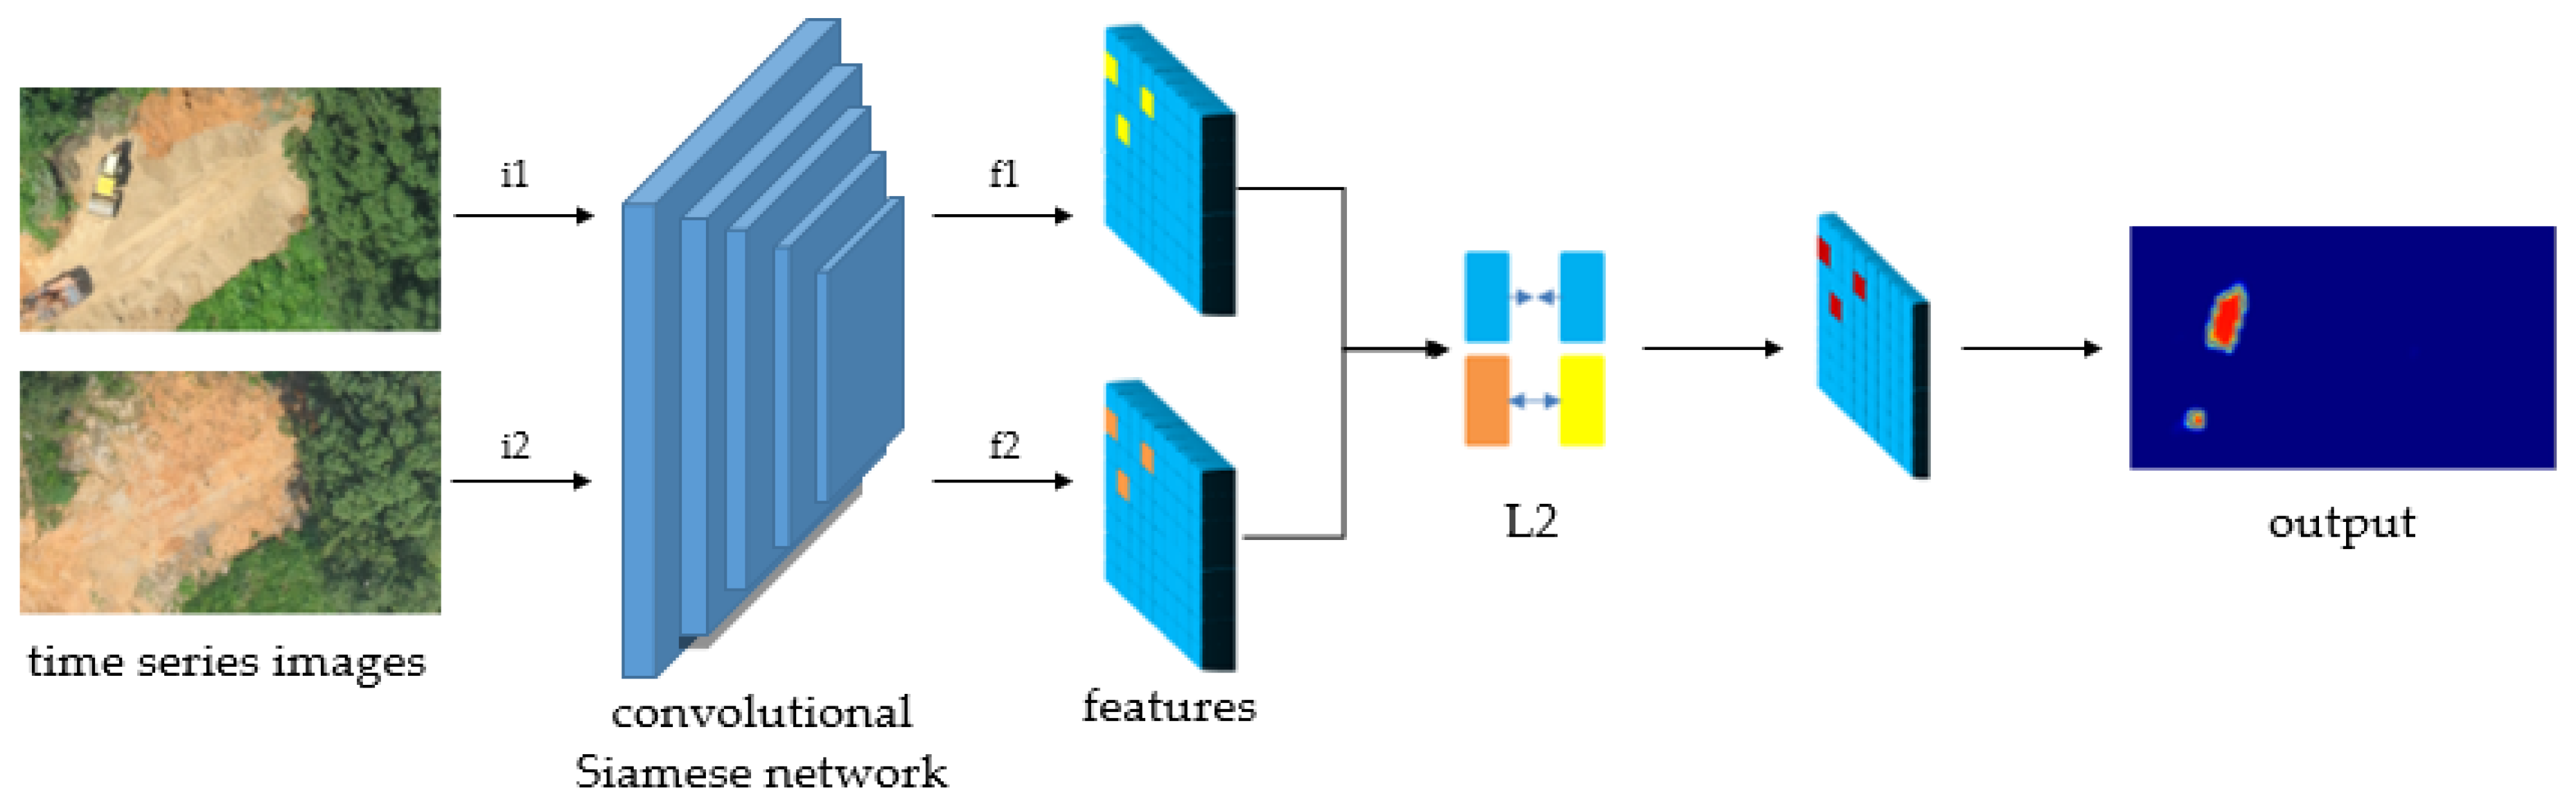
2.2. Introduction to Convolutional Siamese Metric Networks

Machine learning enables computers to learn and act like humans by providing data and information in the form of observations and real-world interactions and learning improves autonomously over time. Deep learning is a form of machine learning, wherein a model is trained based on a considerable amount of data and then data are classified. In recent years, deep learning has been performing better than previously in various fields, and it is particularly useful in image-based applications [28]. In particular, time-series analysis for image classification and change detection is a promising area of application for deep learning. Unsupervised deep learning change detection can be performed using a deep learning model that is generally used for semantic segmentation. Some existing studies were conducted by converting the networks applied to image classification, such as SegNet, U-Net, Deeplab-V3+, and Siamese networks [29].
Siamese networks are a type of neural network, and they contain multiple identical subnetwork components, as shown in Figure 1 [30]. The networks have the same model characteristics, such as configuration, parameters, and weights. There are convolutional, pooling, and fully connected layers in a conventional CNN. The convolutional layers extract the hierarchical features from the input image. The functions of the pooling layers are receptive field enlargement and dimensionality reduction to reduce the size of the output feature maps. The objective of a fully connected layer is to use the results of the convolution/pooling layers to predict the input image for each class.
The similarity between the feature vectors of the input images can be measured using distance metrics, such as those induced by the norms, or with a similarity function such as cosine similarity [31]. In this study, we used the Euclidean distance and the contrastive loss function introduced by Chopra et al. during the training phase of the convolutional Siamese network [22,32]. Let X = { x ( i , j ) | 1 i h ,   1 j w } be an image, and X1 and X2 be two input images, which each having a size of h × w × c, where w and h are spatial dimensions and c is the channel dimension of the input image. The parameterized distance function to be learned, DW, between X1 and X2 is defined as the Euclidean distance between the outputs of GW:
  D W ( X 1 , X 2 ) i , j =   | | G W ( X 1 ) i , j G W ( X 2 ) i , j | | 2
Here, G W ( X 1 ) and G W ( X 2 ) are the output vector tensors, and G W ( X 1 ) i , j and G W ( X 2 ) i , j are the feature vectors of the pixel with location (i, j) in image X. D W ( X 1 , X 2 ) i , j is written as D i , j for simplicity. During the training phase, we use the contrastive loss function, which can be defined as follows:
L ( W , ( Y , X 1 , X 2 ) k ) = i , j ( 1 y i , j k ) 1 2 ( D i , j k ) 2 + y i , j k 1 2 { max ( 0 , m D i , j k ) 2 }
where Y is the binary ground-truth map assigned to the input image pair, and y ( i , j ) = 0 if the corresponding pixel pair is considered to be similar; otherwise, y ( i , j ) = 1 if it is considered different. ( Y , X 1 , X 2 ) k is the kth training sample pair with labeling. m > 0 is a constant called a margin, and it was set to two in the experiment. Changed pairs contribute to the loss function only if their parameterized distance is within this margin.

2.3. Image Change Detection

To perform change detection, a pair of images from two periods are input into the convolutional Siamese network. The data for each feature pair are obtained for the input images. We calculate the dissimilarity of the data of a feature pair using a predefined distance metric (Euclidean distance function L2 in this study). At this time, the contrast loss function is applied to differentiate between the unchanged pairs and the changed pairs. Change distance images—which are converted from the different distances between the feature pairs—were enhanced for visualization contrast. As visible in the last column, “output,” in Figure 2, the detected area is exhibited using various colors such as green, yellow, orange, and red. Blue represents the unchanged area. Depending on the training data, the change detection result may not match the actual changed area; therefore, it is important to specify the range of the changed area well. The flowchart of the proposed method is presented in Figure 2.
When the change detection was performed using simply the Siamese network model from the general training data, satisfactory results were obtained; however, detection errors owing to the construction equipment, automobiles, and shadows were observed in some images (Figure 3). To address such errors caused by automobiles, we can use a technology that can properly remove automobiles while generating orthoimages, or not consider automobiles as an example of a changed area during change detection training. Small-scale shadows were not recognized as change areas, but large-scale shadows were incorrectly detected as change areas. In particular, the change due to the growth of vegetation is the type of change considered in this study. To reduce such false positives, it is important to reflect the changes caused by construction correctly during the creation of training data.

2.4. Evaluation Metrics

We evaluate our network based on the test data by computing the F-measure, which is calculated using the precision and recall [18].
Recall :   R e   =   T P T P + F N Precision :   P r   =   T P T P + F P F - measure :   F   =   2 P r × R e P r + R e
where T P is the number of true positives, F P is the number of false positives, and F N is the number of false negatives.

3. Experiment

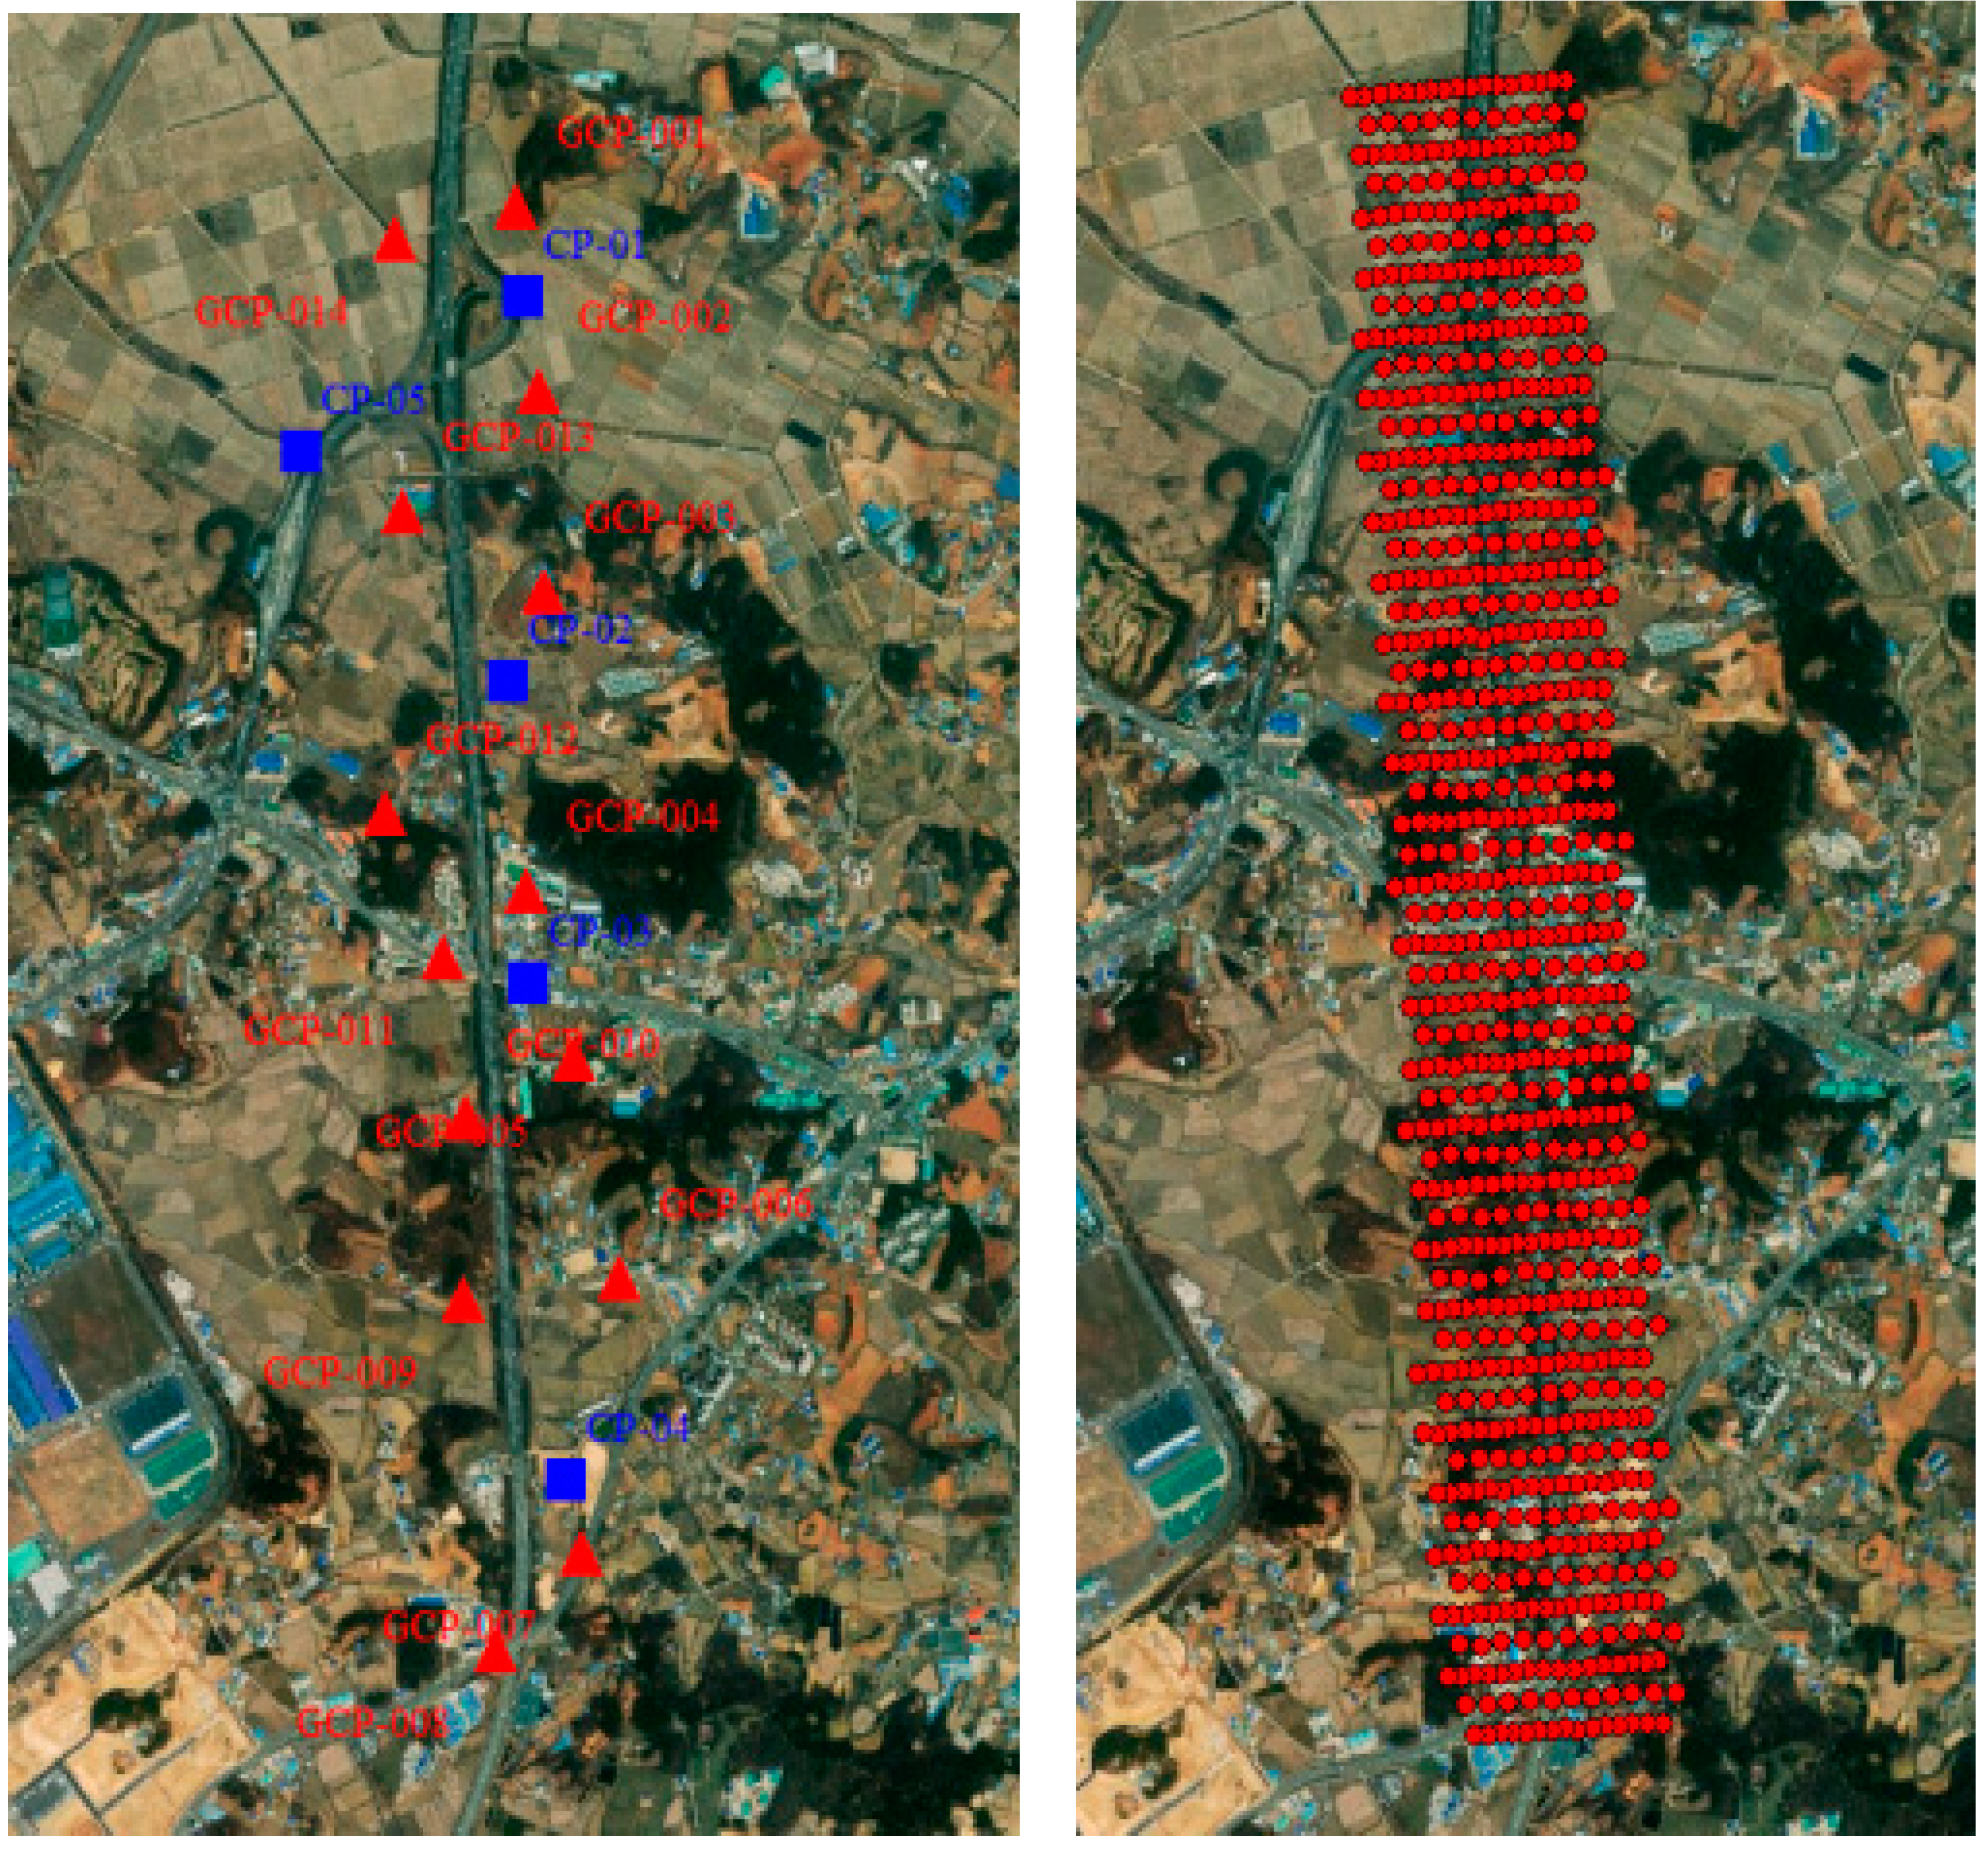
3.1. Study Area and Devices

The study area is the construction site of Pyeongtaek-West Pyeongtaek Road, Gyeonggi-do, South Korea. The site contains earthworks, drainage, and a structure (bridge), and some paving works are also in progress. The slopes within the site are changing owing to construction, and there are areas that require safety management, such as the slopes and roads to and from the construction site. The placement of construction equipment and materials around the construction site was confirmed. It is possible to identify materials or construction waste other than those involved in current construction processes, during UAV image acquisition.
To detect site changes, data were taken at different times using an eBee Plus (Table 1). The eBee Plus, a fixed-wing drone, weighs 1.1 kg and is 110 cm long, with a maximum flight time of 59 min. Fixed-wing drones use manual take-off and automatic landing methods, and the flight type follows an automatic route during flight based on route information generated in advance through eMotion. This drone supports various positioning accuracy correction functions, such as the real-time kinematic method.

3.2. Data Acquisition

It is necessary to establish the flight plan well to obtain high-quality field data. We set the acquisition area, check the construction control point, preempt the take-off and landing sites, preempt the ground control point (GCP), and set the flight path before flight. In a field survey, the flight checklist established at the planning stage is confirmed through a field visit, and the key points to be considered are the flight restriction factors (high-rise buildings, radio wave interference factors, flight obstacles, etc.) and the safety of the UAV. The image parameters were checked to ensure that image acquisition could be performed effectively by checking other important factors such as the flight height, image overlap, and image ground resolution. Three time-series images were acquired using the planned route when the target area was first photographed in subsequent photography.
The study site was confirmed by superimposing the blueprint provided by the road construction corporation on the satellite image and photographed by setting a width of 50 m based on the road center line and the outline of the road plan. The width of the test section is approximately 450 m, and the length is 3500 m.
When the flight area was selected, 14 GCPs and 5 check points (CPs) were surveyed by checking the location of the construction control point, leveling point, and integrated control point located in the study area. The GCPs were selected such that they were evenly distributed across the left and right sections of the construction site, and the control points were selected as far outside as possible because the road was in operation. The GCP survey was divided into a plane control point survey and an elevation control point survey. Figure 4 shows the study area, layout of the GCPs and CPs, and the imaging position. The ground spatial resolution was approximately 4 cm/pixel, the forward overlap was 80%, and the lateral overlap was 70%.
The photographs were taken three times on 17 July, 22 August, and 29 September 2019. On 17 July, 731 images were obtained in the first flight, 698 images in the second flight, and 747 images in the third flight.

3.3. Creation of an Orthoimage

To create an orthoimage using the captured images, “Pix4D mapper” with a concise user interface was used. The processing sequence of Pix4D mapper is divided into a total of six steps: photo input, GCP selection, tie point creation and aerotriangulation, point densification, DSM, and orthoimage production.
The orientation accuracy obtained using 14 GCPs demonstrated that the root mean square errors in the X, Y, and Z directions were 2.7 cm, 3.3 cm, and 10.6 cm, respectively, with a total error of 11.4 cm. At a GSD of approximately 4 cm, the orthoimages were generated by processing point clouds (Figure 5).

3.4. Change Detection Implementation

Changed areas were extracted using a full convolutional Siamese network, which is a network that can learn different images through deep learning and has a structure comprising two CNNs that share weights. The network model is refined based on the pretrained model using the CDnet dataset [33]. The CDnet dataset consists of 91,595 image pairs from 31 indoor and outdoor scene videos. The CDRnet dataset that we created was used to train the pretrained network. The CDRnet dataset consists of 134 image pairs from multitemporal road construction orthoimages and was created with a size of 720 × 480 pixels in part of the test area, including the visually interpreted reference change detection data.
The proposed network was processed using Facebook’s PyTorch framework in a Linux environment. All of our experiments were performed on a Xeon 20-core CPU and two NVidia Tesla V100 GPUs. The learning rate, weight decay, momentum, and batch size were 0.00001, 0.00005, 0.9, and 32, respectively. These parameters were set by conducting several experiments. The change detection accuracy was calculated by inputting independent image pairs for the optimal model generated in training. As the processing time for change detection varies according to the size of the input image, the accuracy based on the image size was investigated.

4. Results

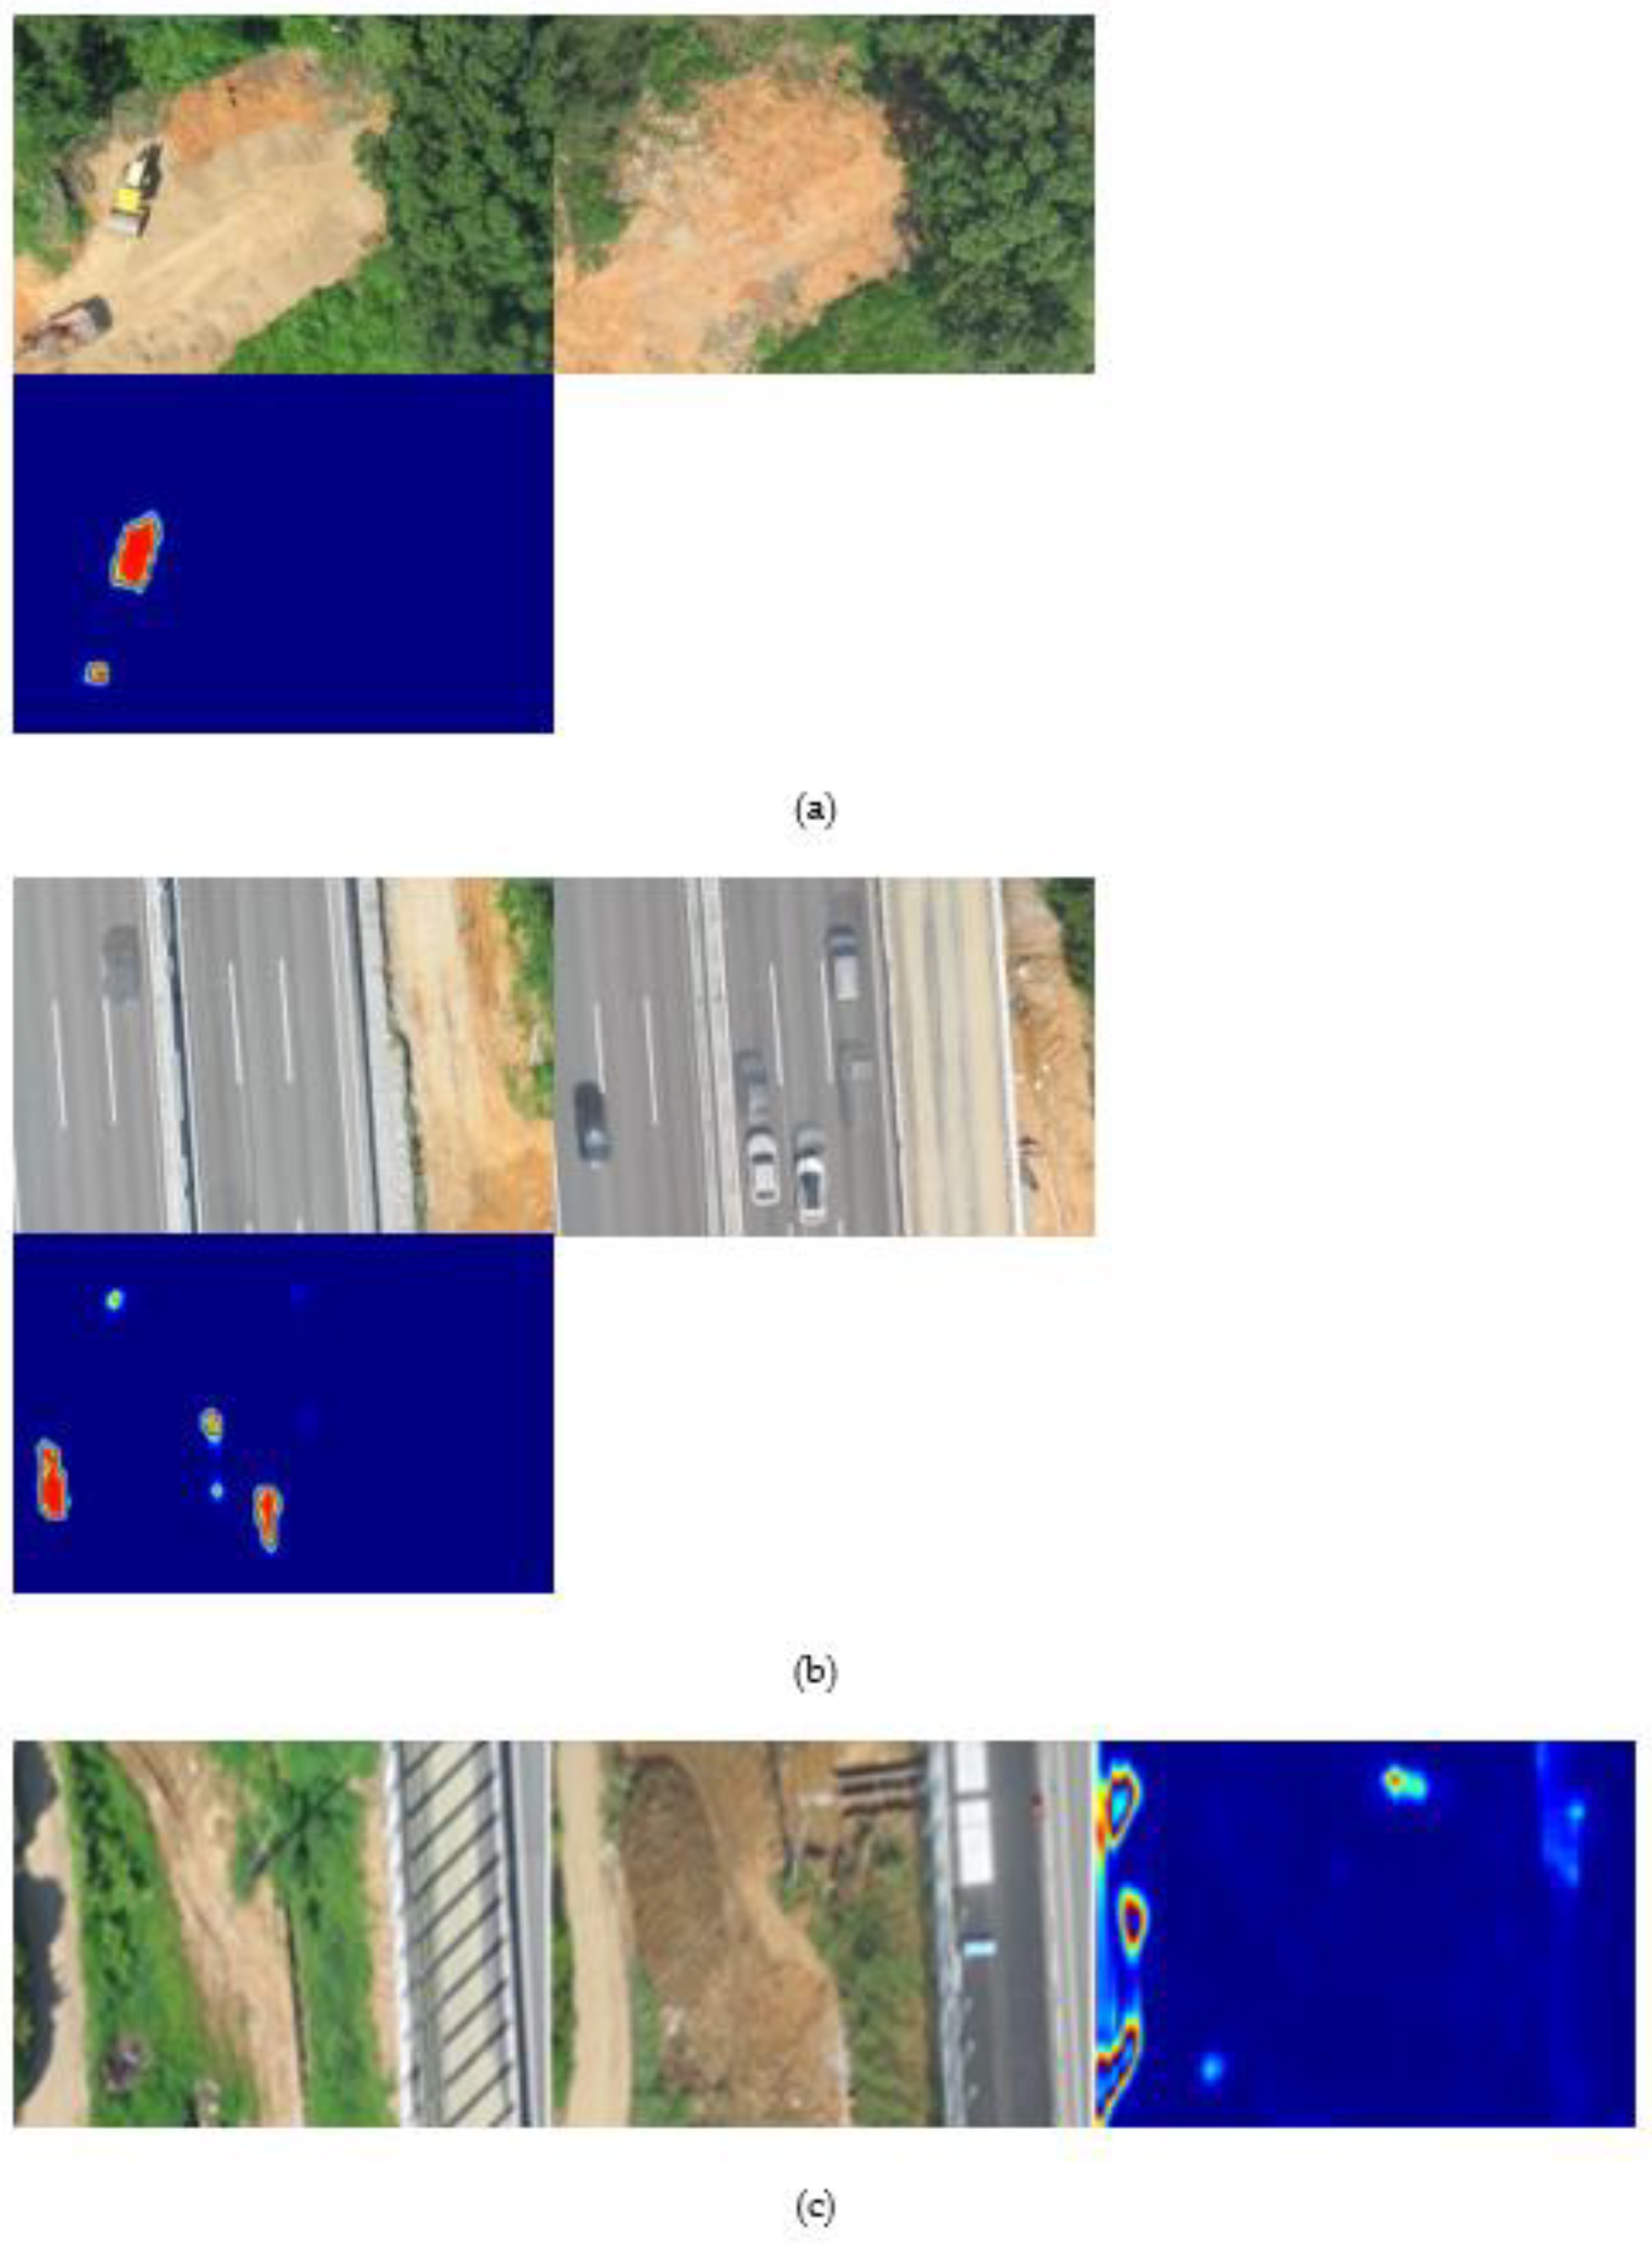
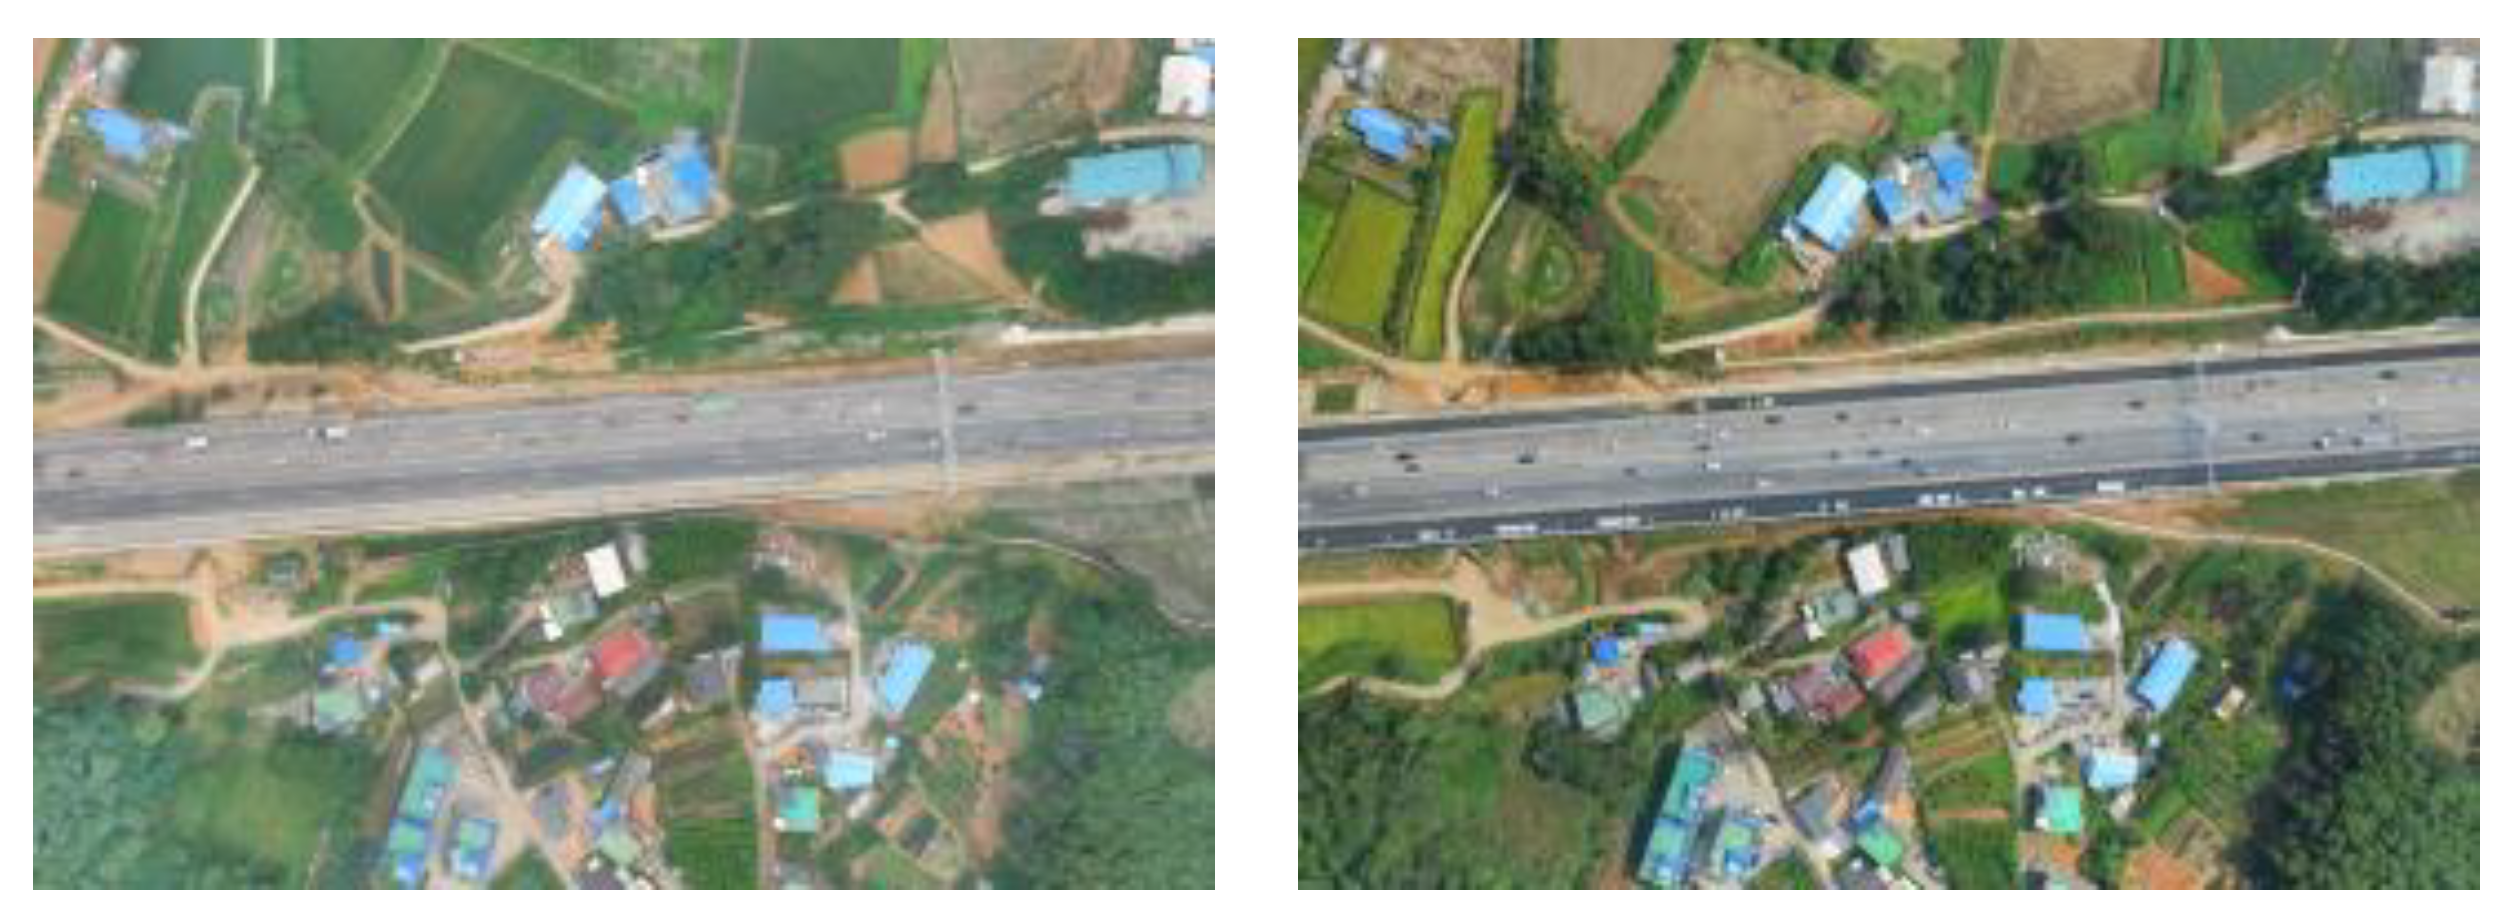
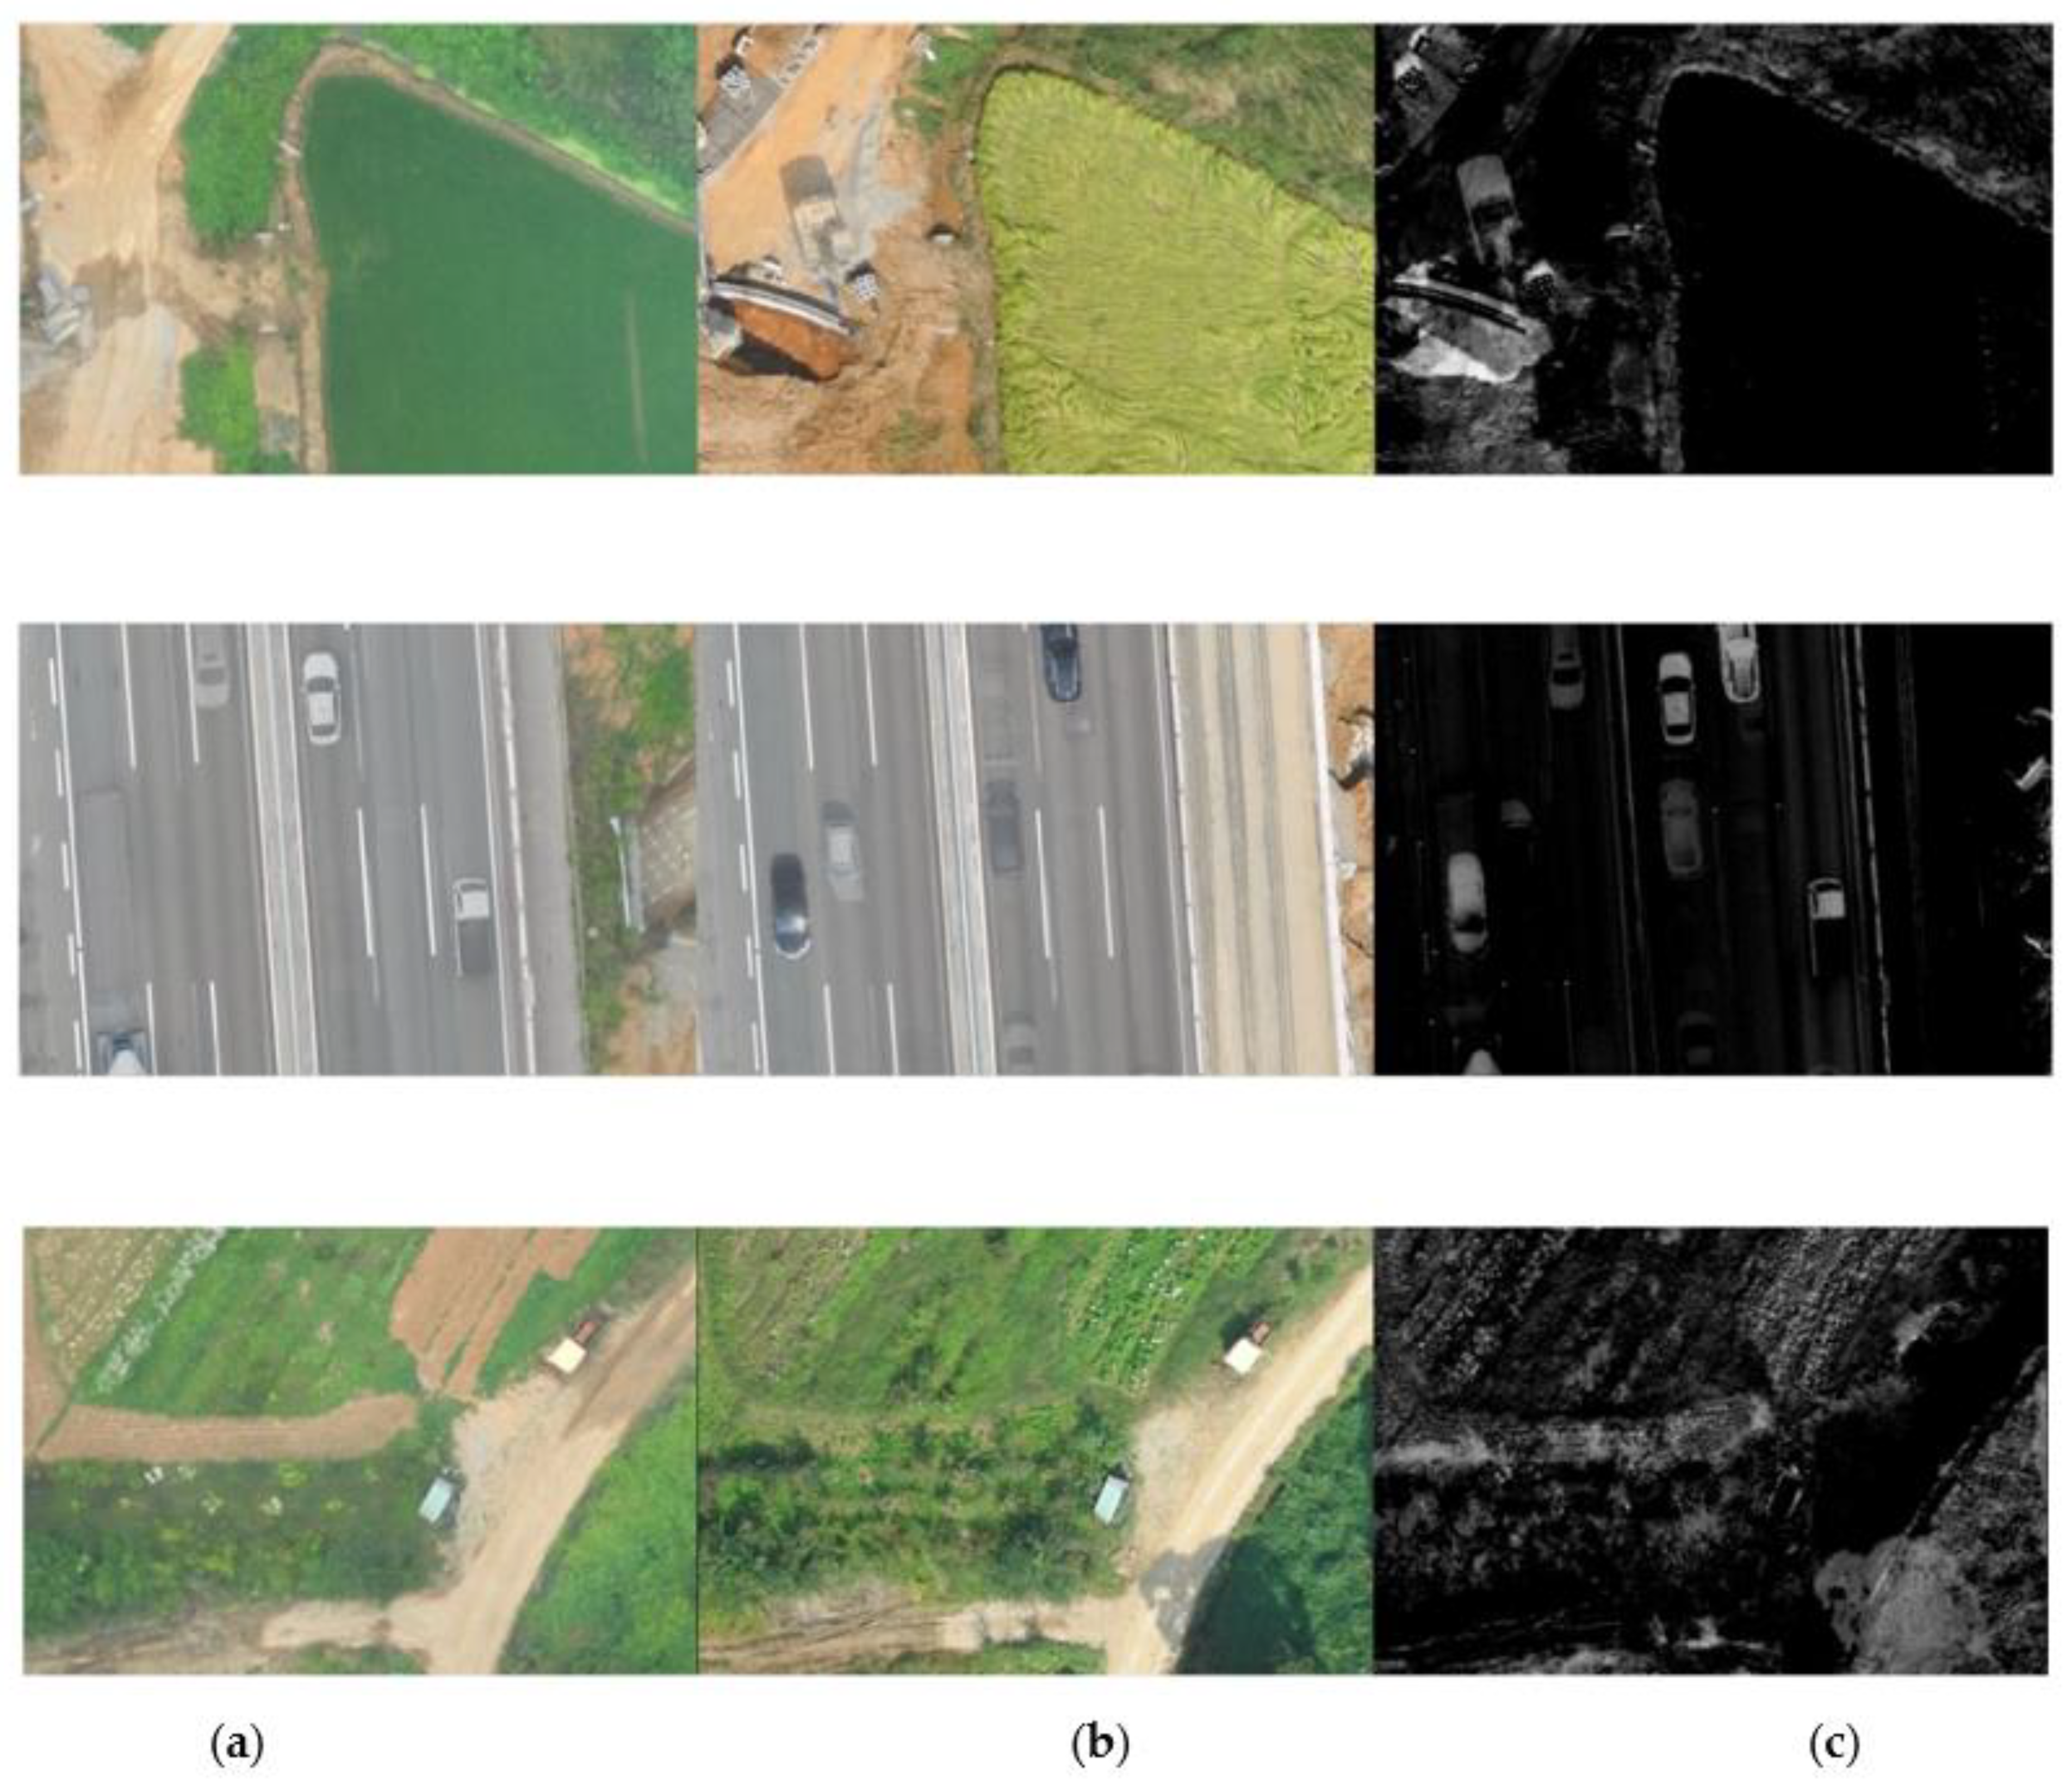
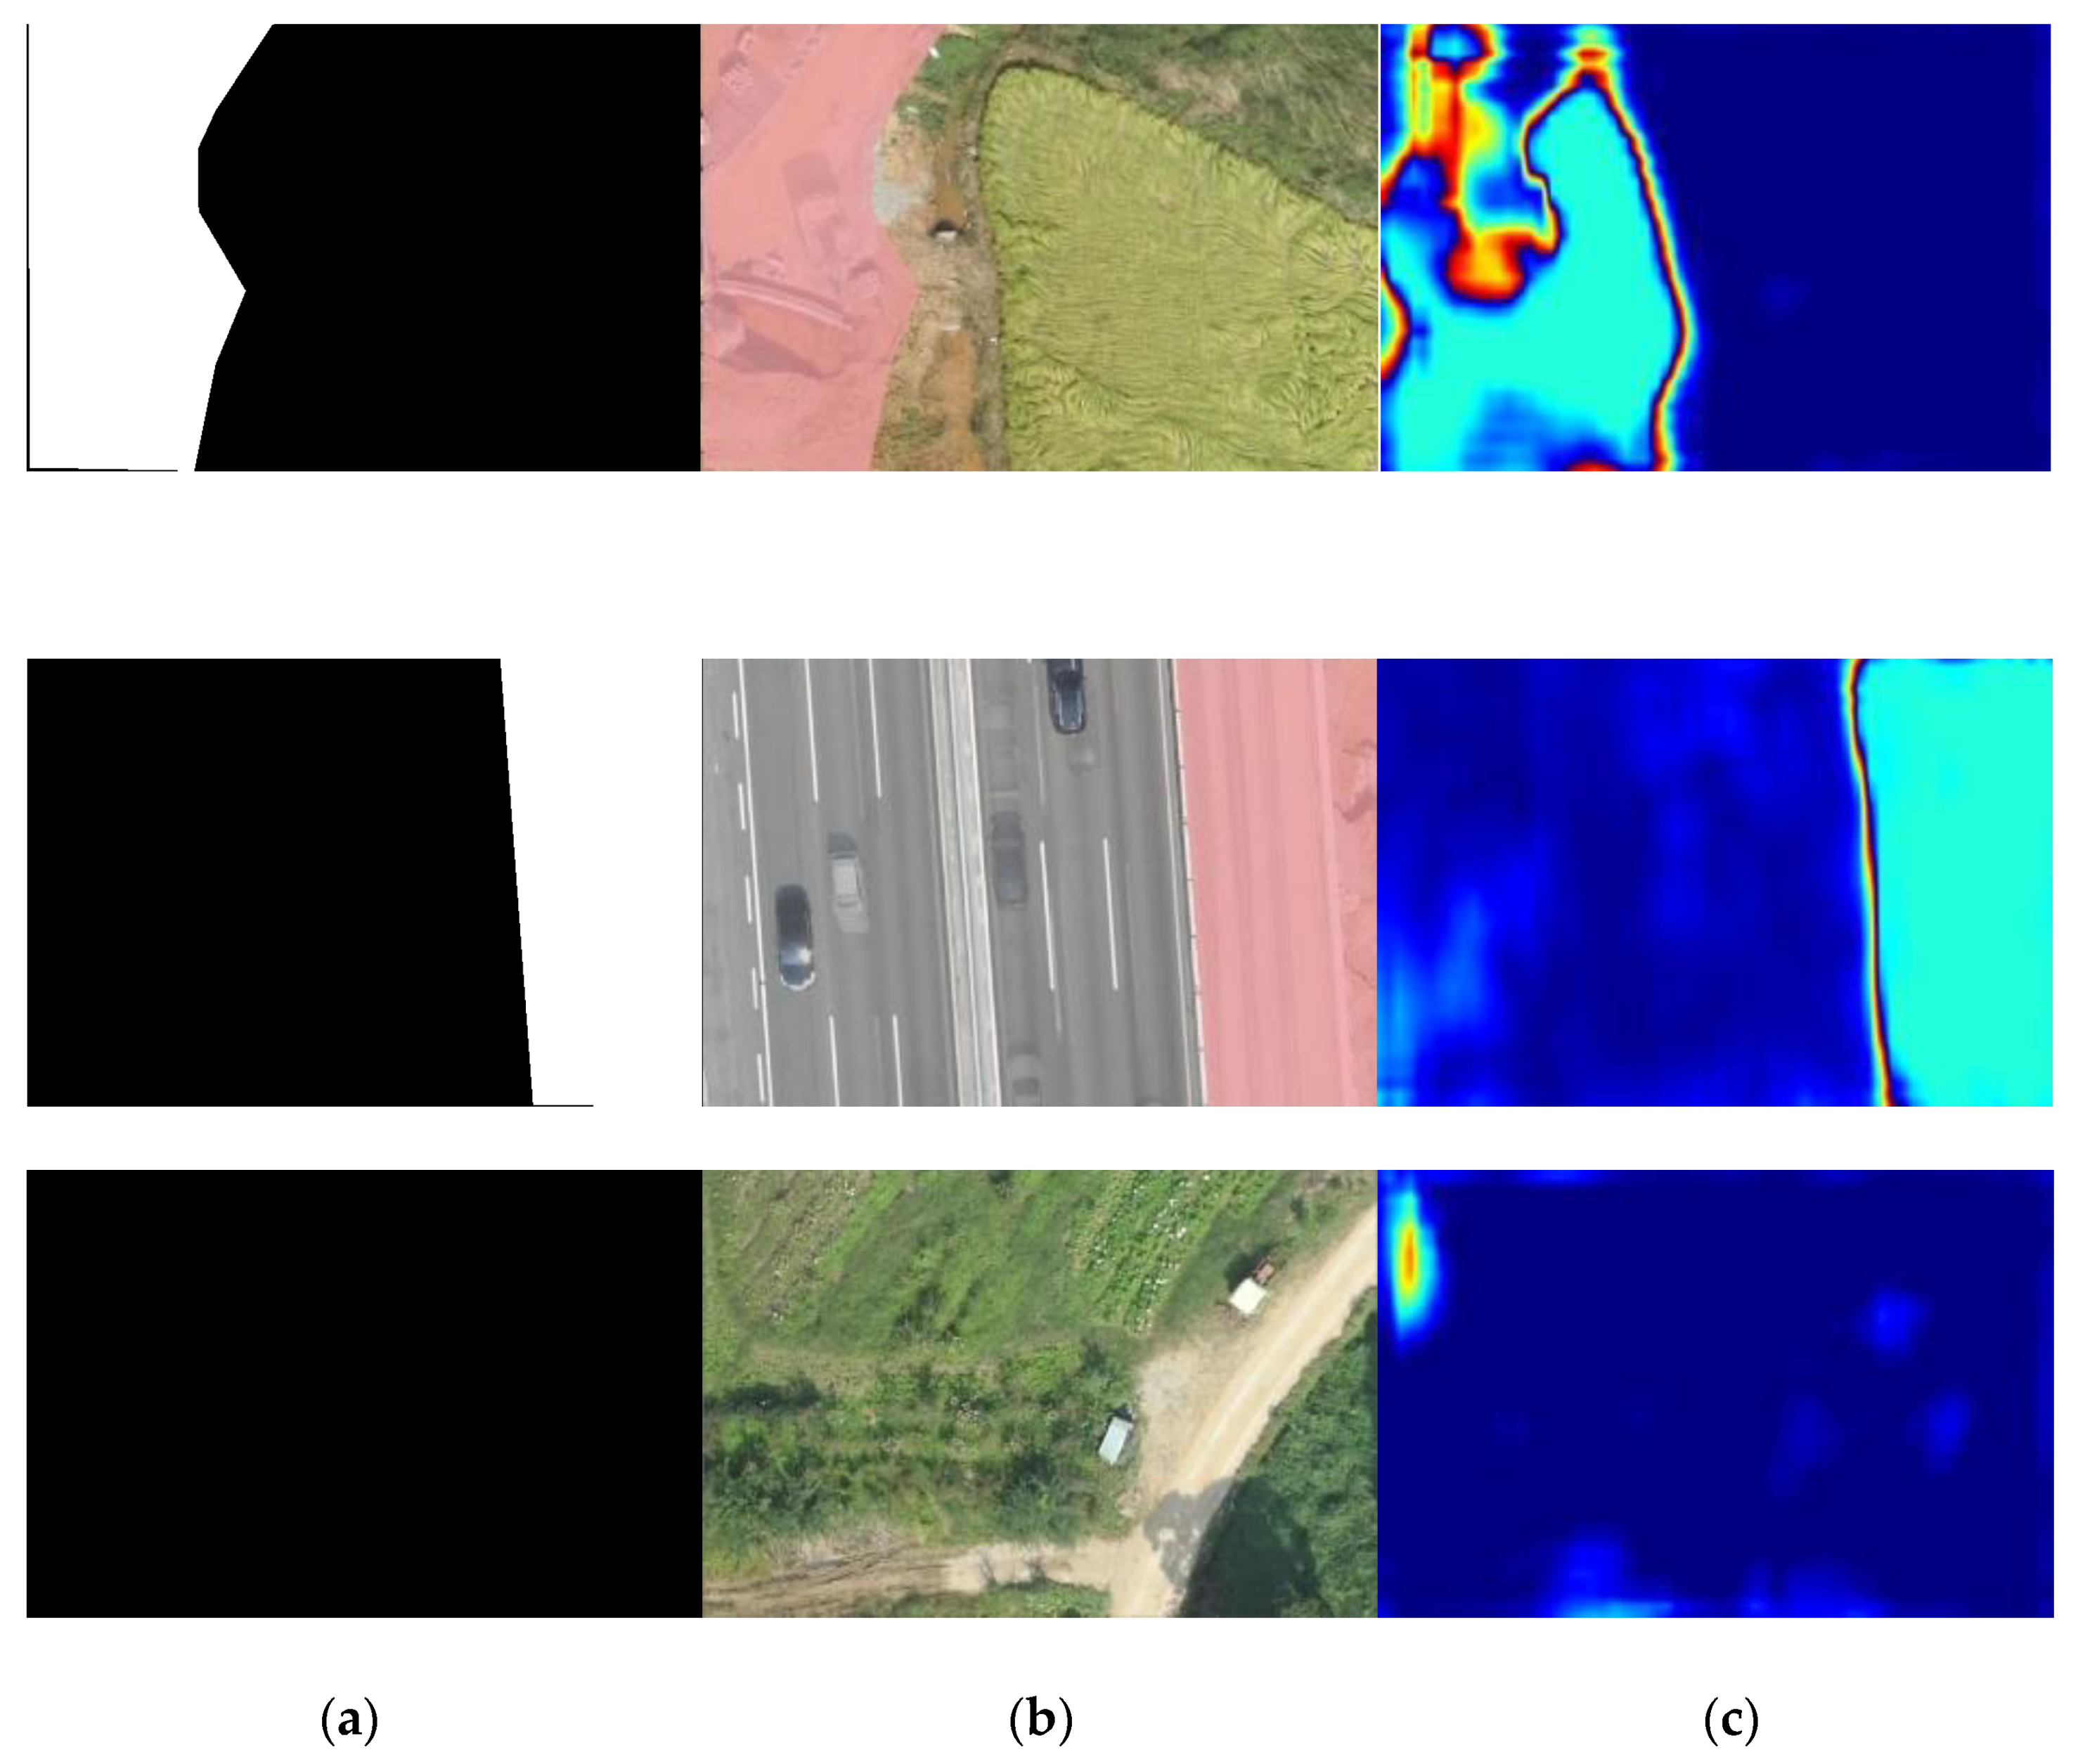
4.1. Change Detection

The change detection accuracy of the proposed method was evaluated for the training image pair using the original image resolution. The quantitative results reveal the comparatively good results obtained using our method because it achieves a higher F-measure of 85.98%, Re of 89.70%, and Pr of 82.57%.
To evaluate the proposed method, we compared it to the conventional image difference. A few qualitative change detection examples are presented in Figure 6 and Figure 7. In Figure 6, the surrounding area under construction and roads under construction can be observed. Through the image difference method shown in Figure 6, it can be confirmed that there is a high possibility of misclassification in areas with differences owing to shadows, vegetation, and cars. There is also difficulty in determining a pixel value difference to obtain the change detection area. Figure 7 shows the true changed area with the white value, the overlay of the true changed area and the image for the same area as in Figure 6, and the change detection result obtained using the proposed method. Unlike the image difference result, the proposed method yields change detection results similar to the true changed area, and misclassifications owing to vehicles, shadows, and vegetation rarely occur.
Binary images in first column of Figure 7 represent the true changed area. The white and black areas represent the changed and unchanged areas, respectively. As visible in the last column of Figure 7, the various colors represent different distances between the feature pairs of the bitemporal images. The change distance images were enhanced using a rainbow color map ranging from blue to red for visualization clarity. In the result of the change detection for the last column, the blue area represents the unchanged area, whereas the area extending from the sky blue to red color represents the changed area. The proposed method demonstrates the detection of road surface changes, such as asphalt construction, and the detection of changes owing to road slope construction. However, errors may occur in some small areas rather than large areas, as shown in the last row of Figure 7, and the need for future improvements remains.

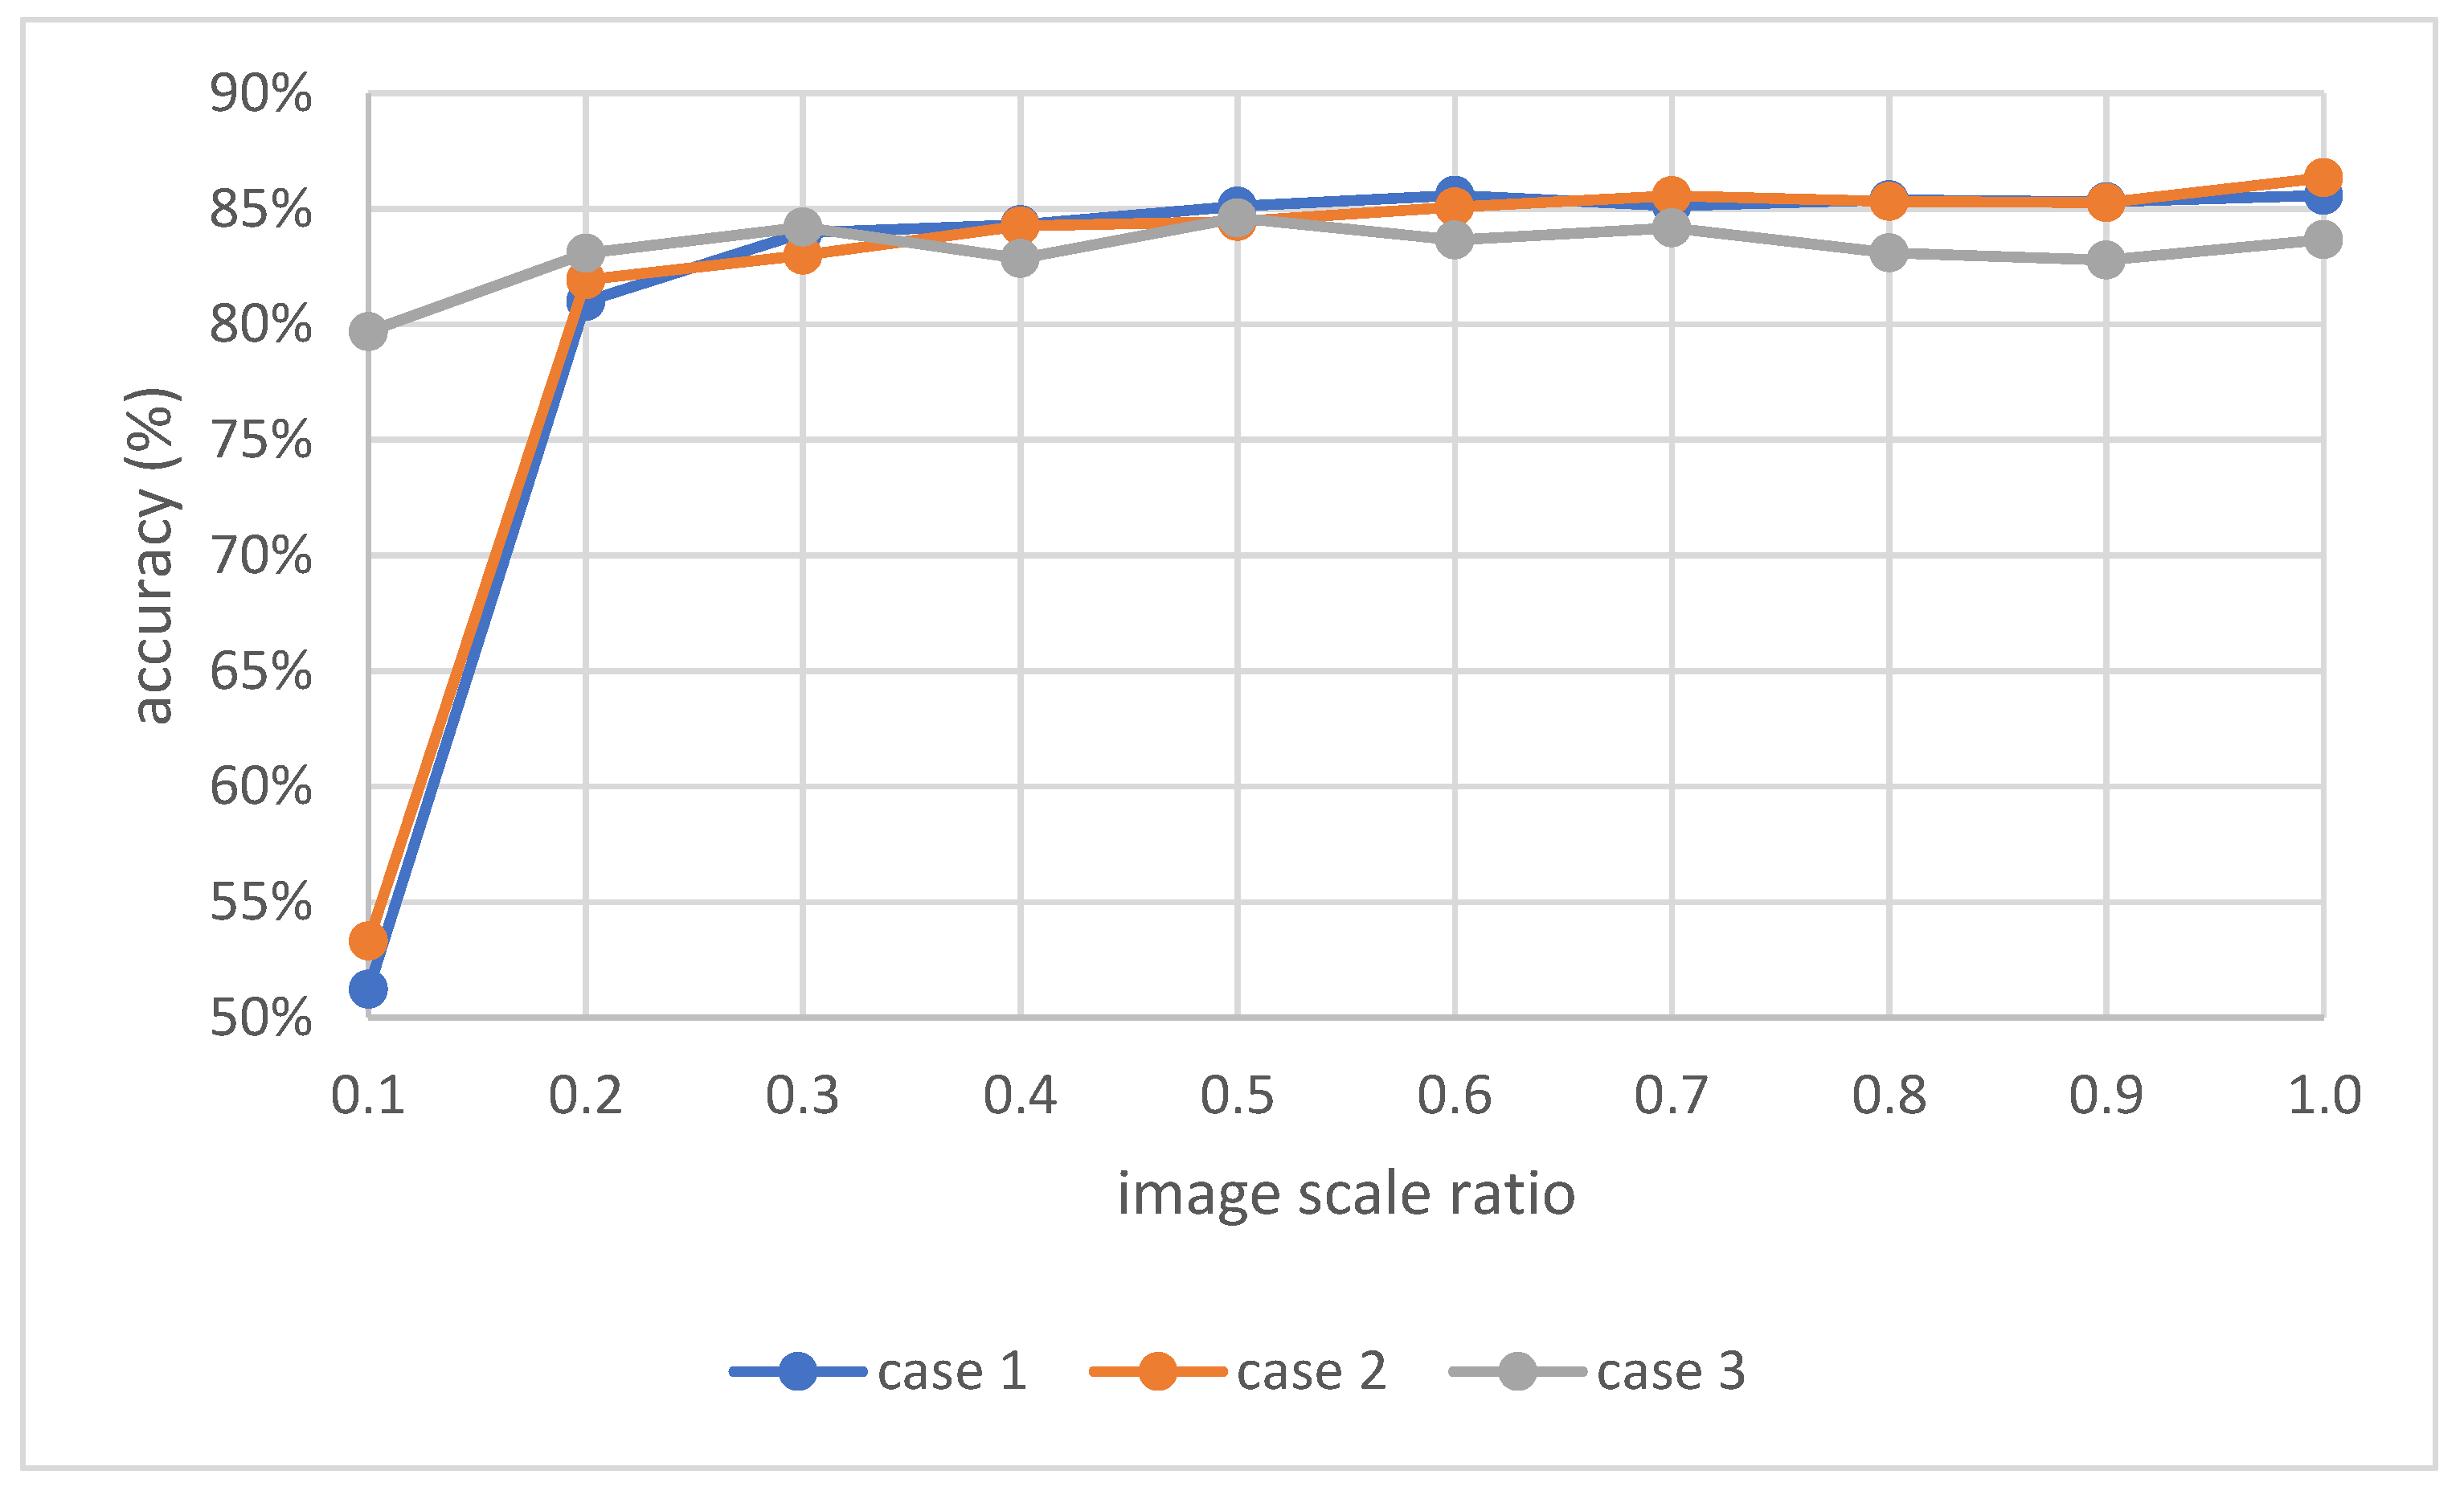
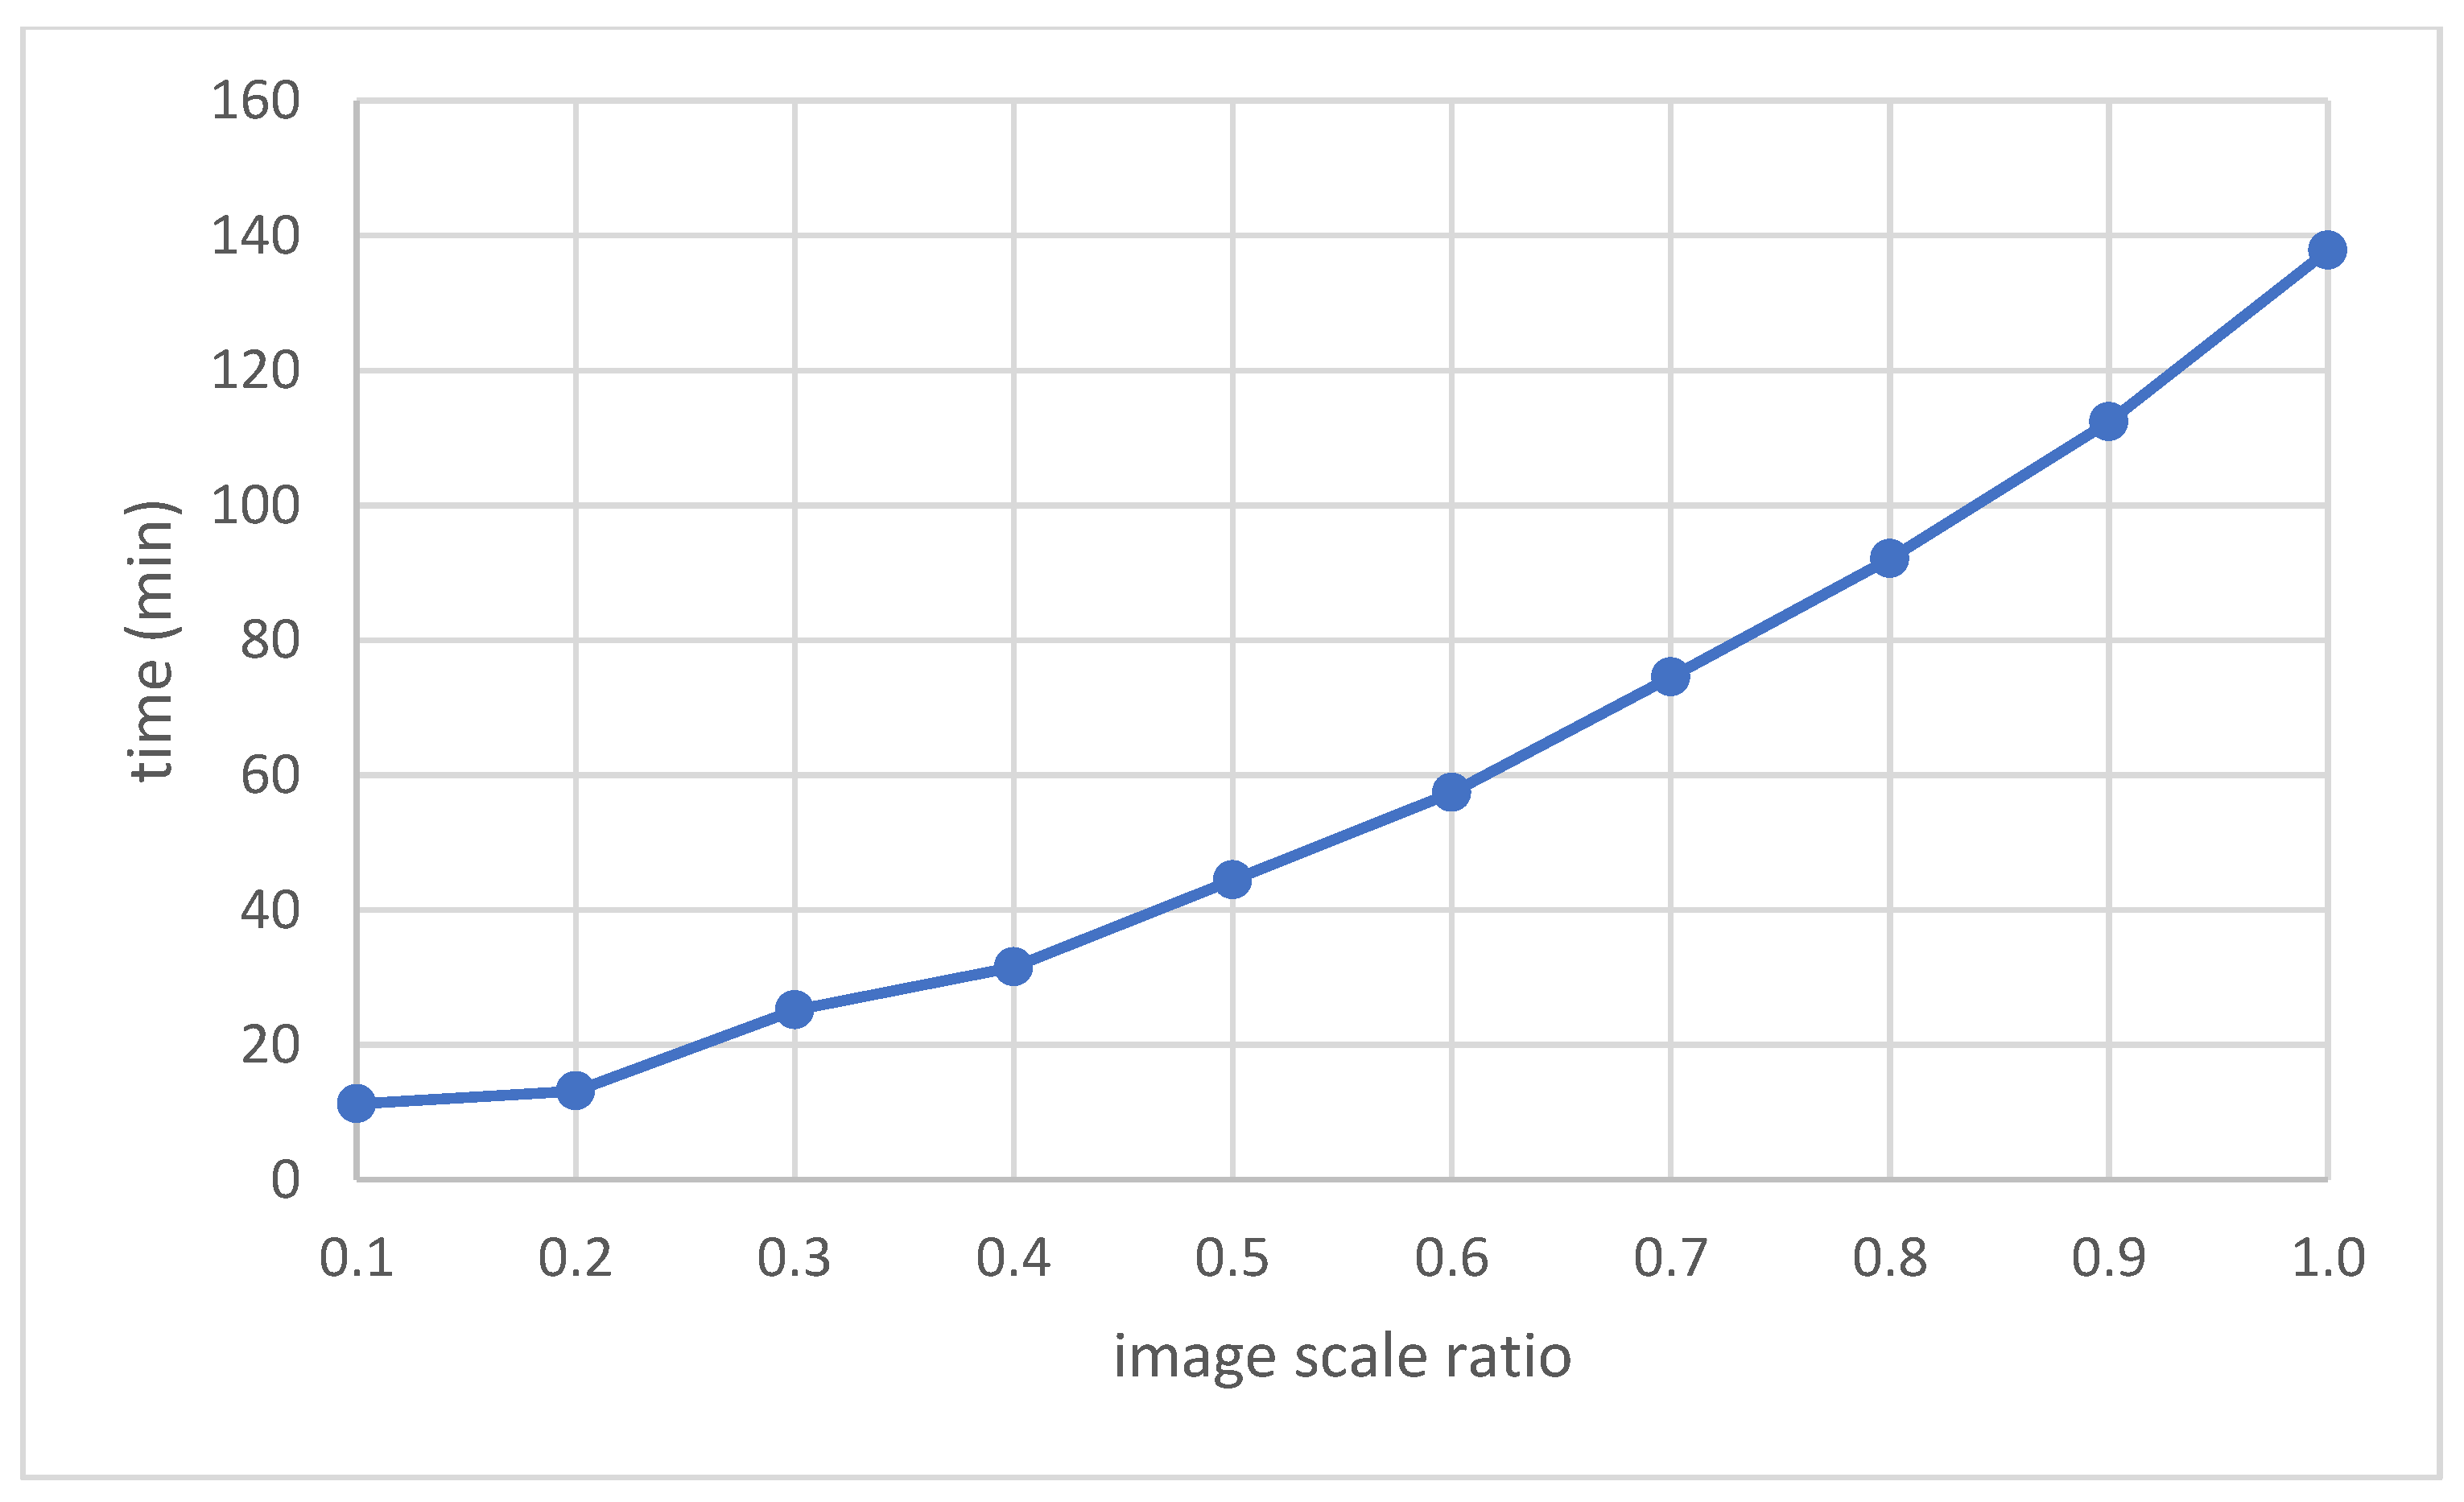
4.2. Image Size Effect

To apply the proposed method efficiently, the accuracy was examined based on the image size. Road construction sites are usually several kilometers long or more. Although this varies depending on the purpose, the GSDs of images taken using UAVs are approximately several centimeters. In other words, there are a considerable number of images to process. It is necessary to find an effective image resolution such that a large number of construction images can be rapidly processed for change detection. In this experiment, we evaluated the change detection accuracy of the proposed method while reducing the image size. Starting with the original image, the image scale was changed by 0.1 to 0.1 times the image and processed in a total of 10 steps.
Furthermore, to observe the effect of normalization of the image pixel values, the accuracy of the proposed method was compared by changing the range of the image pixel values. Case 1 uses the original image, case 2 uses the image after subtracting 127.5, which is the middle of the 8-bit image pixel value, from each image, and case 3 subtracts the average value of each image from the image.
As shown in Figure 8, the average accuracy for the three cases, from scale 0.5 to 1.0, is 84.5–85.2%. The accuracy is the highest in the original image with a scale of 1.0, but the difference in accuracy is not as large as 1%. The image scale is slightly off from 0.3 and 0.4, but the difference in accuracy is not significant. As shown in Figure 9, as the image size increases, the execution time has a linear relationship that increases proportionally. Therefore, if the execution time is important, change detection can be performed by decreasing the image scale to 0.3. Moreover, the change detection accuracy based on the image pixel range was not significantly different in the three cases. Instead, the accuracy of the image where the average value of the pixels has been subtracted is not good, even though its difference is not large.

5. Conclusions

The purpose of this study was to develop a methodology to help in smooth construction management by acquiring the changes caused by construction through images taken at the construction site. The study presented a method for producing orthoimages of a construction site using a UAV and a method for automatically detecting the changes in the images using a convolutional Siamese network. The proposed method can detect color changes, such as for asphalt construction, and the presence or absence of changes owing to the construction of facilities. It is possible to provide reliable information regarding the construction progress by removing the effects of shadows, vegetation, automobiles, and work equipment, which act as false positives in the existing image change detection technique. Furthermore, to apply change detection efficiently, the detection accuracy based on the image size was analyzed to select the image size that should be applied according to the processing time.
At the construction site, videos are mainly taken using a UAV, and the construction status is checked manually by site managers or supervisors while viewing the video by eye. Simply viewing the video makes it difficult to accumulate construction progress records or to analyze the construction status quantitatively. Therefore, further research is necessary to develop a method capable of performing quantitative analysis by producing a video-based orthoimage so that it can be easily used for identifying and recording changes in the construction site. Video-based analysis is expected to be more applicable to straight or gently curved road sections than to structures. Using the ground control points, an accurate combination of adjacent sections is possible. Conversely, owing to the complex shape of the structure section, data are acquired by securing visibility for several parts of the structure; the difficulty in detecting changes in such structures is greater. If the detection model of the proposed method is updated using detailed changed objects for the road construction site, the change type can be determined in the future. To achieve this, it will also be necessary to build and train time-series images of various construction sites.

Author Contributions

Conceptualization, D.H.; methodology, D.H.; software, D.H.; validation, D.H., S.B.L. and M.S.; formal analysis, D.H.; investigation, D.H.; resources, D.H. and S.B.L.; data curation, D.H.; writing—original draft preparation, D.H.; writing—review and editing, D.H.; visualization, D.H.; supervision, M.S.; project administration, S.B.L.; funding acquisition, J.S.C. All authors have read and agreed to the published version of the manuscript.

Funding

This research was supported by the Basic Science Research Program through the National Research Foundation of Korea (NRF), which is funded by the Ministry of Education (NRF-2016R1A6A3A11930130). And this work was supported by the Korea Expressway Corporation Research Institute as a 2019–2020 research project with the name “A Study on the Plan Establishment of Standard Work and Pilot Operation for Use of Drones in Construction Field”.

Institutional Review Board Statement

Not applicable.

Informed Consent Statement

Not applicable.

Data Availability Statement

The data presented in this study are available on request from the corresponding author.

Acknowledgments

Thanks are due to Geospatial Information Ltd. for supporting materials used for experiments.

Conflicts of Interest

The authors declare no conflict of interest.

References

  1. Yao, H.; Qin, R.; Chen, X. Unmanned aerial vehicle for remote sensing applications—A review. Remote Sens. 2019, 11, 1443. [Google Scholar] [CrossRef] [Green Version]
  2. Sepasgozar, S.M.; Davis, S. Digital construction technology and job-site equipment demonstration: Modelling relationship strategies for technology adoption. Buildings 2019, 9, 158. [Google Scholar] [CrossRef] [Green Version]
  3. Moon, D.; Chung, S.; Kwon, S.; Seo, J.; Shin, J. Comparison and utilization of point cloud generated from photogrammetry and laser scanning: 3D world model for smart heavy equipment planning. Autom. Constr. 2019, 98, 322–331. [Google Scholar] [CrossRef]
  4. Lee, S.B.; Song, M.; Kim, S.; Won, J.H. Change Monitoring at Expressway Infrastructure Construction Sites Using Drone. Sens. Mater. 2020, 32, 3923–3933. [Google Scholar]
  5. Fan, J.; Saadeghvaziri, M.A. Applications of drones in infrastructures: Challenges and opportunities. Int. J. Mech. Mechatron. Eng. 2019, 13, 649–655. [Google Scholar]
  6. Li, Y.; Liu, C. Applications of multirotor drone technologies in construction management. Int. J. Constr. Manag. 2019, 19, 401–412. [Google Scholar] [CrossRef]
  7. Ajayi, O.G.; Salubi, A.A.; Angbas, A.F.; Odigure, M.G. Generation of accurate digital elevation models from UAV acquired low percentage overlapping images. Int. J. Remote Sens. 2017, 38, 3113–3134. [Google Scholar] [CrossRef]
  8. Airsight NextGen Airfield Inspections. Available online: https://www.airsight.de/fileadmin/airsight/templates/public/flyers/airsight-uav-pavement-inspections-en-web.pdf (accessed on 21 November 2020).
  9. Liu, D.; Chen, J.; Hu, D.; Zhang, Z. Dynamic BIM-augmented UAV safety inspection for water diversion project. Comput. Ind. 2019, 108, 163–177. [Google Scholar] [CrossRef]
  10. Lin, J.J.; Han, K.K.; Golparvar-Fard, M. A framework for model-driven acquisition and analytics of visual data using UAVs for automated construction progress monitoring. In Proceedings of the 2015 International Workshop on Computing in Civil Engineering, Austin, TX, USA, 21–23 June 2015; pp. 156–164. [Google Scholar]
  11. Irizarry, J.; Costa, D.B. Exploratory study of potential applications of unmanned aerial systems for construction management tasks. J. Manag. Eng. 2016, 32, 05016001. [Google Scholar] [CrossRef]
  12. Howard, J.; Murashov, V.; Branche, C.M. Unmanned aerial vehicles in construction and worker safety. Am. J. Ind. Med. 2018, 61, 3–10. [Google Scholar] [CrossRef]
  13. Kim, S.; Irizarry, J.; Costa, D.B. Field Test-Based UAS Operational Procedures and Considerations for Construction Safety Management: A Qualitative Exploratory Study. Int. J. Civ. Eng. 2020, 18, 919–933. [Google Scholar] [CrossRef]
  14. Wang, X.; Al-Shabbani, Z.; Sturgill, R.; Kirk, A.; Dadi, G.B. Estimating earthwork volumes through use of unmanned aerial systems. Transp. Res. Rec. 2017, 2630, 1–8. [Google Scholar] [CrossRef]
  15. Ham, Y.; Han, K.K.; Lin, J.J.; Golparvar-Fard, M. Visual monitoring of civil infrastructure systems via camera-equipped Unmanned Aerial Vehicles (UAVs): A review of related works. Vis. Eng. 2016, 4, 1. [Google Scholar] [CrossRef] [Green Version]
  16. Nooraldeen, Y.; Puripanda, N.; Bandla, K.; Derbas, Z.; AlNowakhda, A. November. Implementation of Tatweer’s Spatial Data Infrastructure and Utilization of Uav’s for Day-to-day Operations in the Bahrain Field. In Proceedings of the Abu Dhabi International Petroleum Exhibition & Conference, Abu Dhabi, UAE, 11–14 November; Society of Petroleum Engineers: Dubai, UAE, 2019. [Google Scholar]
  17. Radke, R.; Andra, S.; Al-Kofahi, O.; Roysam, B. Image change detection algorithms: A systematic survey. IEEE Trans. Image Process. 2005, 14, 294–307. [Google Scholar] [CrossRef] [PubMed]
  18. Makuti, S.; Nex, F.; Yang, M.Y. Multi-temporal classification and change detection using UAV images. ISPRS-Int. Arch. Photogramm. Remote. Sens. Spat. Inf. Sci. 2018, 42, 651–658. [Google Scholar] [CrossRef] [Green Version]
  19. Alcantarilla, P.F.; Stent, S.; Ros, G.; Arroyo, R.; Gherardi, R. Street-view change detection with deconvolutional networks. Auton. Robot. 2018, 42, 1301–1322. [Google Scholar] [CrossRef]
  20. Guo, E.; Fu, X.; Zhu, J.; Deng, M.; Liu, Y.; Zhu, Q.; Li, H. Learning to measure change: Fully convolutional Siamese metric networks for scene change detection. arXiv 2018, arXiv:1810.09111. [Google Scholar]
  21. Sakurada, K.; Okatani, T. Change detection from a street image pair using CNN features and superpixel segmentation. In Proceedings of the 2015 British Machine Vision Conference, Swansea, UK, 7–10 September 2015. [Google Scholar]
  22. Zhan, Y.; Fu, K.; Yan, M.; Sun, X.; Wang, H.; Qiu, X. Change detection based on deep Siamese convolutional network for optical aerial images. IEEE Geosci. Remote. Sens. Lett. 2017, 14, 1845–1849. [Google Scholar] [CrossRef]
  23. Shi, J.; Wang, J.; Xu, Y. Object-based change detection using georeferenced UAV images. ISPRS-Int. Arch. Photogramm. Remote Sens. Spat. Inf. Sci. 2012, 38, 177–182. [Google Scholar] [CrossRef] [Green Version]
  24. Altuntas, C. Urban area change detection using time series aerial images. ISPRS-Int. Arch. Photogramm. Remote Sens. Spat. Inf. Sci. 2018, 42, 29–34. [Google Scholar] [CrossRef] [Green Version]
  25. Jiang, H.; Hu, X.; Li, K.; Zhang, J.; Gong, J.; Zhang, M. PGA-SiamNet: Pyramid feature-based attention-guided Siamese network for remote sensing orthoimagery building change detection. Remote Sens. 2020, 12, 484. [Google Scholar] [CrossRef] [Green Version]
  26. Ekaso, D.; Nex, F.; Kerle, N. Accuracy assessment of real-time kinematics (RTK) measurements on unmanned aerial vehicles (UAV) for direct geo-referencing. Geo-Spat. Inf. Sci. 2020, 23, 165–181. [Google Scholar] [CrossRef] [Green Version]
  27. Agisoft Metashape User Manual. Available online: https://www.agisoft.com/pdf/metashape-pro_1_6_en.pdf (accessed on 21 November 2020).
  28. Ma, L.; Liu, Y.; Zhang, X.; Ye, Y.; Yin, G.; Johnson, B.A. Deep learning in remote sensing applications: A meta-analysis and review. ISPRS J. Photogramm. Remote Sens. 2019, 152, 166–177. [Google Scholar] [CrossRef]
  29. Wang, S.; Hou, X.; Zhao, X. Automatic building extraction from high-resolution aerial imagery via fully convolutional encoder-decoder network with non-local block. IEEE Access 2020, 8, 7313–7322. [Google Scholar] [CrossRef]
  30. Bromley, J.; Bentz, J.W.; Bottou, L.; Guyon, I.; LeCun, Y.; Moore, C.; Sackinger, E.; Shah, R. Signature verification using a “SIAMESE” time delay neural network. Int. J. Pattern Recognit. Artif. Intell. 1993, 7, 669–688. [Google Scholar] [CrossRef] [Green Version]
  31. Figueroa-Mata, G.; Mata-Montero, E. Using a convolutional siamese network for image-based plant species identification with small datasets. Biomimetics 2020, 5, 8. [Google Scholar] [CrossRef] [PubMed] [Green Version]
  32. Chopra, S.; Hadsell, R.; Le Cun, Y. Learning a similarity metric discriminatively, with application to face verification. In Proceedings of the 2005 IEEE Computer Society Conference on Computer Vision and Pattern Recognition (CVPR’05), San Diego, CA, USA, 20–25 June 2005; Volume 1, pp. 539–546. [Google Scholar]
  33. Wang, Y.; Jodoin, P.-M.; Porikli, F.; Konrad, J.; Benezeth, Y.; Ishwar, P. CDnet 2014: An expanded change detection benchmark dataset. In Proceedings of the IEEE Conference on Computer Vision and Pattern Recognition Workshops, Columbus, OH, USA, 23–28 June 2014. [Google Scholar]
Figure 1. Siamese neural network architecture using convolutional neural networks (CNN).
Buildings 11 00150 g001
Figure 2. Overview of the proposed change detection method.
Buildings 11 00150 g002
Figure 3. Cases of errors while detecting changes based on general change detection data: (a) Construction equipment, (b) automobile, (c) shadow. The left figures are time 1 images, the middle figures are time 2 images, and the right figures show the results obtained using change detection.
Buildings 11 00150 g003
Figure 4. (left) Ground control points (GCPs), represented by the red triangles, and check points (CPs), represented by the blue squares, (right) image acquisition position.
Buildings 11 00150 g004
Figure 5. Orthoimages of some areas using (left) the first flight data and (right) third flight data.
Buildings 11 00150 g005
Figure 6. Results obtained using the image difference method; (a) and (b) display bitemporal images. (c) Result obtained using the image difference method.
Buildings 11 00150 g006
Figure 7. Experiment results for some test samples. (a) True changed area with visual interpretation, (b) overlay of true changed area and image, and (c) result obtained using the proposed method. The images from the original two periods shown in Figure 6 were used in this experiment.
Buildings 11 00150 g007
Figure 8. F-measure accuracy of change detection according to the image size and image pixel value range. Case 1—original image, case 2—image minus 127.5, case 3—image minus average pixel value.
Buildings 11 00150 g008
Figure 9. Processing time according to the image size.
Buildings 11 00150 g009
Table 1. SenseFly eBee Plus specifications.
ParameterValue
Wingspan110 cm
WeightApprox. 1.1 kg
Maximum flight time59 min
Oblique imagery0 to −50°
Global navigation satellite systemsReal-time and post-processed kinematic
CameraSenseFly S.O.D.A. 20 MP (5472 × 3648)
Ground sampling distance (100 m)Down to 2.3 cm/pixel
Publisher’s Note: MDPI stays neutral with regard to jurisdictional claims in published maps and institutional affiliations.

