1. Introduction
In 2019, the United States constructed 352,000 units of multi-family housing, exceeding the number built ten years ago (274,000) by more than 28% [
1]. Given an approximate U.S. population of 328.2 million, the rate of building implies one new apartment unit is being constructed for every 932 residents in each passing year.
As the number of multifamily buildings change (and land and construction prices increase), the methods and approaches used to build such buildings are also changing. Multifamily buildings are getting taller and denser. For example, in 2009, 56% of new apartment units were constructed in buildings of three floors or fewer. By 2019, this number had been reduced to 42% [
1]. In 2009, only 43% of new construction multi-family units were built in buildings with greater than 50 total apartments. In 2019, such units had become a majority, with 56% of new units built in fifty-plus unit buildings. Cumulatively, these statistics point towards a general growth in both the number of multifamily buildings and their size. Despite this growth, housing affordability at the household level continues to decline in the United States [
2].
In 2015, fully half of U.S. households were paying more than 30% of their income in rent or equivalent ownership cost [
3]. Housing expenses have risen faster than incomes in much of the urbanized world due to the tripartite of “accelerated (re)urbanization of capital and people, the provision of cheap credit, and the rise of social inequality” [
4]. In the aftermath of the 2008 recession, the pinch has been particularly acute, with nominal rents growing at 3.6% per year, far outpacing inflation [
5].
According to the Bureau of Labor Statistics, from 1984 to 2021, prices for all urban consumer goods have risen 162%. In the same timeframe, rental costs of primary residences for urban consumers have grown 244% [
6]. In some cities, the problem is even more extreme. For example, in San Francisco, the nominal cost of rent has increased by 367% from 1984 to 2019, growing at a rate of more than double inflation during the same time period [
7].
The problem is also evident among homeowners. In 80% of United States housing markets, housing costs have grown at a rate greater than incomes; on average, home price appreciation has seen an annualized 6.7% growth rate across the nation, while real wage growth was only 3.5% over a similar time period (2018) in the U.S. [
8].
Intuitively, at least some of this increase may be driven by the rising cost of construction in the United States. According to Historical Building Cost Indexes, the year over year growth in building costs from 2018 to 2019 varied from 3.0% to 6.2%, depending on region and construction type [
9]. Contrast this with the inflation rate as reported by the Bureau of Labor Statistics over the same time period, 1.5% [
10]. Even if one were to assume the least costly type of construction in the least costly region, the cost of construction still grew at double the rate of inflation.
Occurring simultaneously with the global housing crisis is the ongoing environmental crisis associated with climate change. For example, Lawrence Livermore National Labs reports that, as of 2020, residential energy use accounts for 11.9 quadrillion British Thermal Units (BTUs) of energy consumption, representing 11.87% of total consumption [
11]. Perhaps more troubling than the sectors gross consumption is the trendline in residential consumption. The Energy Information Administration reports that residential sector energy use is more than twice as high as it was in 1950. While the early 1970s represent something of an inflection point, total residential energy consumption has continued to grow incrementally in recent years [
12]. While per unit energy expenditures have been declining since at least 1980, the total per-unit decline has amounted to less than 20% of expenditures [
13].
For multi-family buildings with more than five units, a substantial share of this energy is used in space heating and cooling. In 2015, such buildings used 724 trillion BTUs of energy. One hundred eighty-three trillion BTUs were attributed to space heating while 51 trillion BTUs were attributed to air conditioning. Collectively, providing human thermal comfort accounted for 32% of site energy expenditures in large apartment buildings. The vast majority of the energy utilized in homes is generated either by the direct combustion of natural gas or via the combustion of fossil fuels in the electricity generation process [
11].
The primary channel for heat exchange in residential buildings is via their envelope [
14]. Thus, reducing energy consumption and the associated adverse environmental impacts in multifamily buildings can be accomplished via improving energy performance. Each of the four variables considered in this study (building height, number of buildings, building width, and building floor area) have a direct impact on envelope area, and, thus, performance.
Survey of Existing Literature
There has been no shortage of studies that have investigated the relationship between building massing and energy consumption. Perhaps the best known means of quantifying envelope geometric proportions is provided by Depecker et al., who developed “shape factor” via the combination of several envelope measures and found this factor to be associated with building energy use [
15]. These findings were corroborated for Nordic climates by Danielski et al., demonstrating the robustness of such measures across different weather conditions [
16]. Shape factor, which is primarily a measure of compactness, has remained important in recent studies that attempt to evaluate the energy performance of large samples of buildings [
14].
Shortly after, Pessenlehner and Mahdavi evaluated the performance of compactness measures using energy simulation, finding that, while measures such as “shape factors” were accurate as approximations, they lacked sufficient nuance to account for a variety of factors that impacted building performance, such as orientation and solar gain [
17]. More recently, more complex measures have been developed to account for a greater share of the factors impacting building energy performance. Granadeiro et al., for example, develop Envelope Related Energy Demand [
18]. This measure accounts for not only compactness, but also solar heat gain coefficient and site-specific factors that are not included in the calculation of shape factor.
Other research has evaluated the effects of shape on building energy consumption without the use of any specific numeric metric. Drew et al., for example, consider a number of different residential typologies and associated shapes, seeking to quantify lifecycle energy consumption for each type [
19]. Their findings indicate that relatively dense, low-rise courtyard buildings offer the best energy performance of the shapes investigated. Choi et al. compare “plate type” and “tower type” shapes, finding the former to be more efficient than the latter in terms of thermal performance [
20].
Still others have focused on the impact of a single design variable, such as plan aspect ratio, as it relates to building energy consumption. Wang et al. investigate the impact of aspect ratio, suggesting that a ratio of east/west facing façade to north/south facing façade is optimized in the range of 0.702 to 0.986. McKeen and Fung focus specifically on the aspect ratio of multifamily buildings in Canada, finding that energy performance is optimized at aspect ratios of 1:1 to 1:1.5, depending on location within the country [
21].
More recently, building-shape-related investigations have focused on how shape might be used to create net-zero buildings and complexes of buildings. Savvides et al. consider the massing variables of residential buildings [
22], but they appear primarily interested in the availability of building-integrated solar, rather than the performance of the buildings themselves. Ndiaye investigates a variety of more complex building shapes for their suitability for net zero construction, finding that energy consumption varied by between 10 and 20 percent between the best performing and worst performing massing solutions [
23]. It is perhaps worth noting that this study focused on office buildings rather than on multifamily residential buildings.
While the impacts of shape on energy performance have been well investigated, the relationship between massing variables and cost is less well understood. Chau et al. investigate the optimal height of residential buildings in Hong Kong [
24], but their investigation is more concerned with rent prices demand than actual construction costs. It also does not take place in the context of the United States. Barr investigates optimal building height in the United States, but his investigation is concerned with tall buildings in New York City [
25] rather than the more common low-to-midrise building stock in the United States.
Few studies have been found that consider both thermal performance and building cost simultaneously. Capuleto et al. investigate how units within multifamily housing are grouped, accounting for both energy performance and building cost [
26]. However, the cost estimation in this study is driven primarily by the areas of rooftop and exterior walls and does not explicitly consider how costs might vary with building type over multiple heights. Wang et al. use a multi-objective genetic algorithm to optimize envelope related design variables for energy performance and first costs [
27]. Once again, their method of cost estimating is parametric, and their design variables consider both massing variables and other envelope variables (e.g., shading).
Within the context of the United States, it does not appear as though the effects of massing variables on building cost and thermal performance have been investigated simultaneously. This paper attempts to conduct just such an endeavor. It also seeks to build on the above presidents by creating a more thorough first cost model that accounts for the variable in building construction costs across multiple heights.
Four massing variables are evaluated: height in stories, width in feet, number of buildings, and total complex floor areas. Each possible solution is evaluated in two ways: via envelope thermal performance and building construction costs. In
Section 2, we discuss the forms of multifamily building common to the United States to establish height and width limitations. We also discuss the development of the models used to evaluate cost and envelope thermal performance.
Section 3 explores the results of our analysis, seeking to determine the relationship between each of the four design variables and each of the two design objectives.
Section 4 seeks to validate the validity of our approach using quantitative methods and to explore where our findings sit within the body of literature.
It is worth noting that the variables considered represent a drastic simplification of the architectural design process. In reality, decisions about building massing will be affected by many variables. What follows is not a substitute for architectural design, but rather represents an attempt to hold some design variables in isolation to create some “rules of thumb” that may be of value to designers early in the schematic design process.
2. Materials and Methods
Creating a model to investigate how architectural massing variables affect affordability and envelope performance necessitates some degree of architectural understanding of how low-to-midrise multi-family residential buildings are typically, currently constructed. In the following, we discuss typical construction practices for one to ten story apartment buildings and develop a method for assessing their cost and envelope performance.
2.1. Investigating Building Height
Industry standard construction practices for residential, multifamily buildings have long involved the use of (light) wood framing techniques. Mimicking traditional single-family residential construction, these techniques are faster and cheaper than traditional commercial building approaches. In fact, in a survey of 352,000 new apartment units from 2019, 71% of the units were identified as “wood framed” [
1]. The transition to wood framing approaches has had some industry wide repercussions.
In an article entitled “Why America’s New Apartment Buildings All Look the Same”, journalist Justin Fox identifies a proliferation of “stick-built” (light wood framing) mid-rise apartment buildings across the U.S. as the main culprit [
28]. Fox notes that this type of framing is much less expensive in terms of both materials and labor costs. It also requires less skilled labor to erect, making it attractive in poorer labor markets. Azoff [
29] concurs, noting that the use of light wood framed construction in multifamily building is proliferating because it is more economically feasible than traditional concrete and steel approaches.
Wood-framed construction is classified by the 2015 international building code in three types:
Type III: Exterior walls are of non-combustible material (e.g., fire-retardant-treated wood or masonry) and interior walls are of any material permitted by code (in this case, light wood framing)
Type IV: Exterior walls are of non-combustible material and interior building elements are of solid or laminated wood (i.e., heavy timber construction)
Type V: Exterior walls and building elements are made of any material permitted by code (in this case, light wood framing without fire-retardant-treated wood).
Type V construction is familiar as the typical single-family home construction method. These buildings are built with 2 × 4 or 2 × 6 studs and load-bearing walls, wood floor trusses, or wood floor joist and wood roof framing. There are no requirements for non-combustible materials [
30].
According to Chapter 5 of the International Building Code, for fully sprinklered (typically a requirement) buildings of construction Type V with residential occupancy, the maximum building height varies from three floors (up to 40 ft) to four floors (up to 70 feet), depending on specific construction details. Generally, this limits the popular Type V light wood frame construction to four floors above grade. Wood-framed constructions of greater than four floors must be Type III, having fire-retardant exterior wall elements, which allows for a maximum height from four floors (up to 55 feet) to five floors (up to 85 feet).
Beginning with the 2012 edition of the International Building Code, it became possible to “stack” light frame buildings (Type III or Type V) atop non-combustible podiums (Type I) [
31]. In this way, the height (and number of stories) could be increased. This led to the development of the “five over one” buildings, with five floors of wood framing built above a single floor of concrete or steel (non-combustible) framing. Starting in 2015, the code was further modified to allow for greater than one podium floor, provided that the wood framing did not exceed 65 feet and the entire project did not exceed 85 feet in height. This made it possible to have five floors of wood framing over multiple floors of Type IA podium. Photos of two “mixed” projects, with light wood framing above non-combustible framing, are shown in
Figure 1.
For the purpose of this paper, it is assumed that the net-to-gross floor area ratios are relatively comparable across buildings of one to ten stories. It is worth noting that this may not be the case. As building height increases, so too does the amount of the floor plate that is used for vertical circulation and increased structure. Because the comparison is of double-loaded corridor buildings, the difference between the net-to-gross ratio of a nine-story vs. a ten-story building is possibly quite small. However, the difference between a building that requires staircases and elevators vs. a single-story building that requires neither is likely more substantial. This may have the effect of making taller buildings more “attractive” than might otherwise be expected.
It is perhaps worth noting that, while model codes such as the International Building Code are incorporated in the construction of many local codes, local amendments and unique situations within certain municipalities do arise. For example, in Chicago, combustible construction on a non-combustible plinth is not allowed [
32]. If applying this model to a building in Chicago, more expensive light-gauge steel framing would be necessitated for much shorter buildings.
Assuming a typical floor-to-floor height of 9–10 feet, one can imagine an eight-story building with five floors of light wood framing atop a three-story non-combustible podium. If light wood is the most economical construction type, then the most economical configuration would be wood framing alone for buildings of one to five stories in height. Between five and eight stories, five floors of wood framing would be placed atop a podium of one to three stories. For buildings above eight stories in height, all non-combustible construction (with its unlimited height and building area) would be required.
Based on the above limitations, we consider heights ranging from one to ten stories using such systems. The specific systems selected and which floors of construction they apply to are discussed in greater detail in
Section 2.3, below.
2.2. Investigating Building Width
In the context of high-rise buildings, Clark et al. [
33] suggest a depth from the curtain wall to the interior core face of between 20 and 30 feet. For a double-loaded corridor, this implies a building width of between 40 and 60 feet. To investigate the maximum and minimum possible depths for apartment units, a plan investigation was conducted (
Figure 2, below). Two simple two bedroom plans were prepared, borrowing liberally from the Fair Housing Act Design Manual [
34] and
Architect’s Data [
35] for standard room sizes, kitchen and bathroom layouts, etc. The results of the exercise suggest that, including the width of the interstitial corridor, a minimum floor plate width of 40 feet and a maximum floor plate width of 70 feet is needed. It is likely that an architect skilled in residential space planning could improve substantially on the ergonomics of the proposed plans, which are provided only to illustrate the possibility of accommodating residential units in the given floor plate widths.
To be sure, the use of a double-loaded corridor is not the only method by which a multifamily residential building can be created. Particularly in low rise buildings, direct entry to the exterior, intermediate breezeways, enclosed staircases, and row-house-type configurations may offer better floor area efficiency. To ensure an “apples-to-apples” comparison, double-loaded corridors are assumed for buildings of all heights.
It is worth noting that code per-floor building allowable area is based on a more complicated formula, even when accounting for construction type and the presence of fire-sprinklers. The 2015 International Building Code allows for increased areas based on “frontage” or proximity to public open space and/or rights-of-way of certain dimensions [
30]. As detailed site planning is not considered in this investigation, no upper bound on per-floor area is considered. That being said, multifamily occupancies require a maximum common path of egress travel of no more than 125 feet. Allowing 125 feet from any unit to one of two egress stairs would imply a maximum floor plate of 500 linear feet (i.e., 4 × 125′). However, this would account only for the required distance to reach the stair, which does not necessarily imply reaching the envelope of the building. Therefore, a more conservative maximum floor plate length of 400 feet is used for the purpose of this investigation.
At the opposite end of the spectrum, no minimum floor area is provided by the code. Instead, what can be constructed is limited by feasibility. Considering that the minimum floor plate width considered is forty feet, it makes little sense to evaluate any building length under forty feet, as to do so would allow for buildings that were wide enough to accommodate two units, but not long enough to accommodate them. Therefore, the minimum building length that is considered is forty feet.
To analyze performance and for the purpose of this paper, possible widths studied will vary between 40 feet and 70 feet in increments of five feet. This is, by necessity, a simplification of actual building layouts. It does not account for vertical circulation and/or mechanical space. It also does not account for non-rectangular building shapes.
2.3. Cost Estimating
Cost estimation was conducted using the RS Means Assembly Method [
36]. RS Means is an industry-standard cost estimating database that aggregates the real construction costs of many projects around the country to make generalizations about the costs of specific units and assemblies. Because the database is reliant on having real-world project costs, it is generally limited to common assemblies and may be less suitable for estimating more complex or unique building elements. Generally, estimating by assembly is most suitable for new construction projects. More granular unit estimates can produce more specific values but are much more cumbersome to negotiate.
Where assembly costs were not available or were not suitable for the proposed method of construction, some unit estimation was utilized. Some Square Foot estimation was also utilized for mechanical, electrical, and plumbing trades. Not all systems applied to buildings of all heights. For example, a one-story building would not have an elevator. Therefore, for each assembly, information is provided regarding what height of building it applies to. Only hard costs were considered. Figures include overhead and profit but do not include design, insurance, permitting, general requirements, or general conditions.
Because land was not a fixed quantity across all proposed solutions, no land costs were included. The model is also agnostic to the other benefits of preserving open land. For example, it may be wiser to build a taller building with a smaller footprint to preserve open land for recreation space, preservation, carbon sequestration, renewable energy generation, and a host of other possible reasons. These reasons may have their own economic value, which cannot accurately be accounted for using the construction cost method. The proposed model does not have the sophistication to make more nuanced recommendations about land use.
Sizing of columns and footings was based on RS Means axial loading and is based on a structural bay size of 25′-0″ by 25′-0′. Live loads were assumed to be 40 pounds per square foot for floors and 20 PSF for roofs, in line with RS Means recommendations. Dead loads included 7.5 PSF for ceilings, 25 PSF for partitions, 6 PSF for mechanicals, 100 PSF for concrete floors, and 7 PSF for wood-framed floors. Self-weight of columns was also included on a per-linear-foot basis. Columns were further assumed to be uniformly loaded. In reality, an interior column would have a tributary area of 625 square feet (25′ × 25′). “Edge” Columns would have only half of this load, and “Corner” columns would have only one quarter. For simplicity, an average figure of 312.5 SF was used, as designing column layouts was outside the scope of this project.
It should be mentioned that considering construction cost is not an exhaustive means of considering building financial performance. A real-estate developer would likely be more interested in return on equity, which would necessitate an understanding of land costs, soft costs, and the entitlement process. A potential renter would likely be more concerned with the total cost of ownership, which may be influenced by construction costs but is also influenced by market conditions, location, utility expenses, and a multitude of other factors not considered here.
2.3.1. Substructure and Foundations
Substructure was composed of concrete slab-on-grade, concrete pad footings, and concrete continuous perimeter strip footings. The size of pad footings varied based on column loads, with a design soil bearing capacity of 6000 pounds per square inch. It was assumed that slabs-on-grade could be ground supported. Excavation to the depth of 48” stem walls was assumed. Substructural systems, their cost, and their use by building height is shown in
Table 1.
2.3.2. Structure and Shell
Structures of two floors and below are assumed to have bearing walls alone. Wood columns are included for wood construction of three stories or greater, as semi-balloon framing is assumed for these heights. Wood joist floors bearing on wood columns or walls are utilized at Type VA and Type IIIA construction, while flat-plate concrete floors bearing on square, cast-in-place columns are utilized at Type IA construction. A wood flat rafter roof is assumed, except at heights of nine and ten stories, where wood framing is not allowed and a flat-plate concrete roof is substituted. Fourty linear feet of interior shear wall is assumed to surround the elevator, while each of two staircases is assumed to be surrounded with 60 linear feet of shear wall. At one to two stories, wood framed shear walls are utilized. At three to five stories, concrete unit masonry shear walls are utilized. For all Type IA construction, cast-in-place concrete shear walls are utilized. Design of structural elements, particularly lateral elements, is outside the scope of this paper.
The building shell is composed of light framed walls, which are wood framed at Type III and V construction and framed with cold-formed steel studs at Type I construction. Exterior cladding is fiber-cement siding. Punched openings consist of vinyl-clad wood casement windows, with a window-wall-ratio of 24% (implying two (2) windows per 100 SF of exterior wall area). Roofing consists of a single-ply Polyisobutylene (PIB) membrane over tapered rigid insulation. Slab insulation is provided by 2′-0″ of polyisocyanurate below grade insulation, as prescribed by ASHRAE 90.1 (q.v.
Section 2.4 infra). Each building is said to have two entrance/exit doors, which are fully glazed aluminum panels in aluminum frames. Structural and Shell systems utilized are shown by cost and building height in
Table 2.
2.3.3. Interiors
As in exterior walls, interior partitions are wood at wood-framed conditions and cold-formed steel at concrete conditions. Wall and ceiling cladding in both cases is painted gypsum wall board. At low-rise conditions, interior stairs are wood-box type, while at mid- and high-rise conditions, cast-in-place stairs are utilized. Interior millwork includes particle core wood entry doors in hollow metal frames, hollow core interior doors in pine frames, and hard-wood base and wall cabinets with plastic laminate countertops. Interior flooring is split between vinyl tile and broadloom carpet. Toilet specialties include a medicate cabinet, towel bar, and toilet tissue dispenser. Interior fittings along with their costs are shown in
Table 3.
2.3.4. Services
Buildings of three stories or fewer are assumed to be walk-ups, in accordance with the Americans with Disabilities Act Technical Assistance Manual, which exempts buildings of three floors or fewer from elevator requirements [
37]. Elevators in three and four floor buildings are assumed to be of hydraulic character, while elevators in taller buildings are electric traction, based on the standard elevator types provided for in RS Means Unit Estimating Method [
36], with additions for additional floors and linear feet of elevator run. Similarly, it is assumed that manual trash removal is only feasible in a walk-up setting, so a trash chute is specified for all buildings of greater than three stories.
The number of elevators is calculated using the Round-Trip Time/Percentage Handling Capacity method explained in Grondzik and Kwok [
38]. When calculated for a 2500-pound passenger elevator in a multi-family building, this system suggests a minimum number of elevators based on the number of units, with taller buildings having a lower number of units before requiring a second elevator. The maximum number of units in a single elevator building ranged from 880 for a four-story building to 597 for a ten-story building. Practically, this means that a second elevator is required only for the largest buildings considered.
Mechanical, electrical, and plumbing system costs are based on median per-unit-floor-area construction costs for each system: low-rise (one to three floors), mid-rise (two to seven floors), and high-rise (eight to ten floors) construction. Wet-pipe sprinklers are included for all light framed buildings. Municipal water pressure is assumed to be adequate for low-rise buildings, with a fire-pump included for buildings of greater than three stories. All units are assumed to require three wired smoke detectors, with each building managed by an addressable alarm panel with up to 200 connections. Plumbing, electrical, fire protection, conveying, and mechanical systems are show in
Table 4.
2.3.5. Equipment
Equipment includes standard residential appliances, which are constant across building geometries and based on unit numbers. In-unit laundry is included. Twelve square feet of aluminum interior blinds are included for each window. Equipment is shown in
Table 5.
2.3.6. Sitework
Site costs are based on the mean site costs per unit floor area for low, mid, and high-rise apartment buildings from RS Means. This accounts for a widely variable set of site conditions while maintaining agnosticism to any specific location. Sitework cost assumptions are given in
Table 6.
2.4. Envelope Evaluation
In order to preserver applicability across locations, site plans, and mechanical configurations, environmental evaluation will be based on envelope configuration at one single locational (for consistent and uniform weather inputs). While this discounts several important uses of residential energy (e.g., lighting, plug load), these latter uses are largely static across building massing. Envelope thermal qualities, however, are variable based on height, width, length, and number of buildings.
Envelope will be evaluated by using the method outlined in the ASHRAE Standard 90.1 Prescriptive Compliance Path [
39]. This method prescribes maximum U-factors for exterior walls, windows, doors, and roof elements. These U-factors can be multiplied by an assembly’s area to calculate a weighted UA value, heretofore referred to as a “Thermal Loss Factor.” Ground contact slabs are also accounted for, albeit by an F-Factor and a slab perimeter rather than a U-factor and assembly area. Therefore, the thermal loss value of a given solution is to be defined as follows:
where:
E is the calculated Thermal Loss Factor;
N is the total number of identical buildings proposed;
UR, UW, UN, and UD are the assembly U-Values for Roofs, Walls, Windows, and Doors, respectively;
AR, AW, AN, and AD are the per-building areas of Roofs, Walls, Windows, and Doors, respectively;
P is the per building perimeter of the ground-contact slab;
F is the slab F-factor, as described in ASHRAE 90.1.
Required U-Values vary by ASHRAE Climate Zone. For the purpose of this investigation, Climate Zone 5 was selected for its national centrality. Required U and F values for Climate Zone 5 A are provided in
Table 7, below:
Areas are calculated based on a 10′-0″ floor-to-floor height. While a 3′-0″ parapet is included in calculating the cost of the wall, it is not included in the wall area in the calculation of Thermal Loss Factor, as it is entirely outside of the weather envelope of a given building. In all cases, slab insulation is assumed to consist of 24” of rigid polyisocyanurate with an R-Value of 15, meeting the required minimum for F-Value.
For context, consider that the units for thermal loss value (E) will be in BTU per hour per foot-squared degree Fahrenheit. If one assumes an average difference between indoor and outdoor temperature of 20 degrees, then one increment in thermal loss value can be thought of as 438 BTUs per year per square foot of envelope area. 438 BTUs per year represents the amount of energy in 0.0438 therms of natural gas or 2.567 kilowatt hours of electricity. Of course, the actual amount of natural gas or electricity consumed at the site would also have to account for losses in equipment efficiency and site-to-source factor.
Thermal loss value represents a simplification of the dynamics of building heat loss/gain. While ASHRAE standards are written to account for an envelope’s resistance to conductance, this is not the only way in which heat can be lost or gained through a building. A given portion of envelope will also be profoundly affected via its exposure to sun, particularly as it relates to fenestration. Because this model does not include site planning or orientation, only conductive heat loss is considered. In reality, any more complete accounting of energy performance will necessitate an understanding of orientation and surroundings to which this model is agnostic.
According to Sachs et al. [
40], vertical transportation accounts for between one third and one half of one quadrillion BTUs of primary energy use in the United States each year, equivalent to about 2–5% of the energy required for buildings covered by ASHRAE 90.1. The share of this energy used by relatively low-rise residential buildings is unclear. However, as this investigation has focused on the effects of massing on envelope thermal performance, elevator energy is not considered.
3. Results
The model constructed has four straightforward variables: total complex floor area, number of buildings, building height, and building width. Given these four values, a fifth value, building length, can be calculated. For example, if one assumes a 50,000 square foot floor area, a single building, ten floors in height, and a fifty-foot width, one inevitably arrives at a building length of 100 feet. This structure allows for the isolation of each variable to measure its effect on building cost and thermal loss value. First, we can hold the complex total floor area constant and measure the effects of height, width, and number of buildings. We can also assume a static number of buildings, width, and building footprint (i.e., first floor area) and measure the effects of changing height with a fungible gross floor area. Finally, we can consider five total floor areas and endeavor to find the optimal width, number of buildings, and height for each scenario.
3.1. Building Width
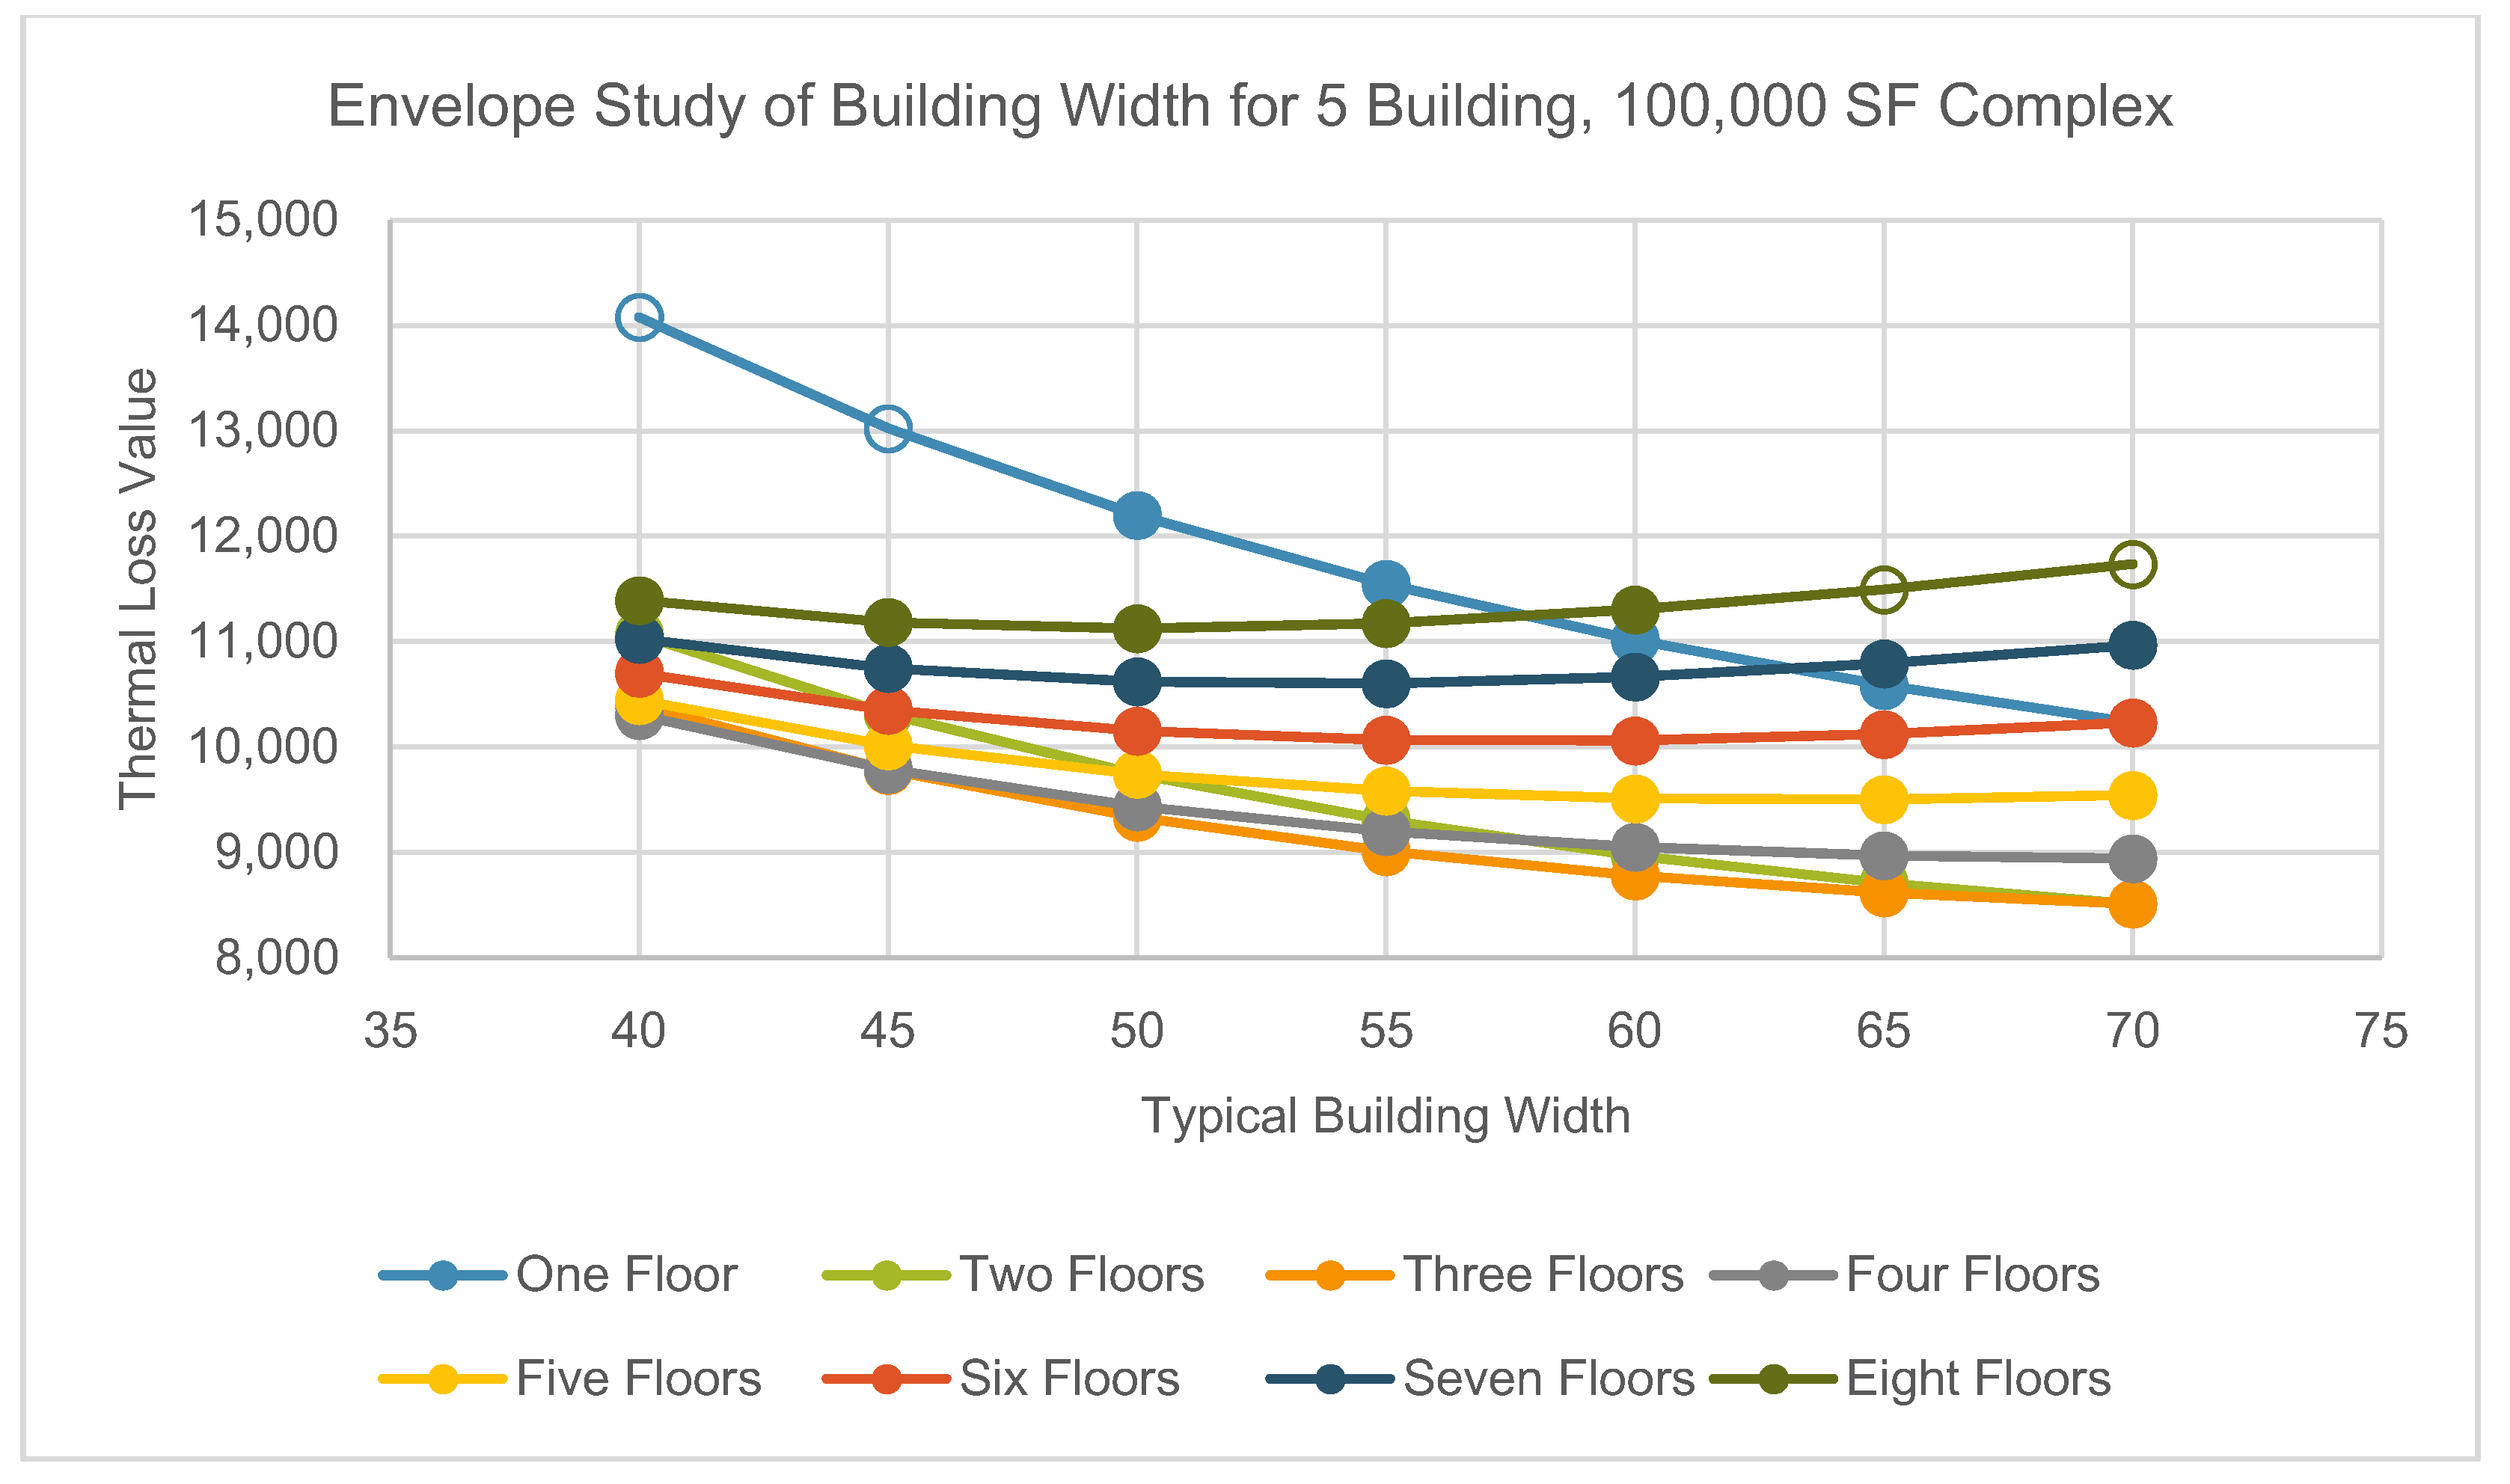
To find the optimal building width for both energy and cost purposes, we elected to hold the model square footage constant at 100,000 square feet and the count of buildings constant at five. Arithmetically, this offers essentially the same results as considering a single building of 20,000 gross square feet. The per unit floor area costs for buildings of varying floor counts by width in shown in
Figure 3. The thermal loss values for these configurations are shown in
Figure 4. Please note that, in both figures, some floor plates are “non-viable” in that they result in building lengths of greater than 400 feet or less than 40 feet, as discussed above. In these cases (e.g., for an eight-floor building of 70 foot width), nodes on the graphs are shown with an “open” circle rather than a “shaded” circle. For heights in which no width is viable (i.e., at nine floors, no buildings of the width considered result in suitable lengths), lines are omitted entirely.
Generally, wider floor plates are shown to be more economical. This is especially true for single-story buildings. This is consistent with cost fluctuating with perimeter area. With the floor area constant, it is least costly to build as few walls as possible to enclose the proposed volume. Only at a higher number of floors, where building widths start to become so small that they increase perimeter length, does building narrower buildings become less costly.
In terms of thermal performance, the worst performing viable solution is a single-story building of 50-foot width. Such a solution maximizes the perimeter area and has no additional floors to share the thermal impact of the roof and slab. As the building becomes wider and the surface-to-volume ratio decreases, a single-story building becomes more thermally efficient. This is likely because the opaque roof and slabs are more thermally resistant than the walls, which have openings for doors and windows and are therefore less thermally efficient.
It is also worth noting that, for most widths, a three-story building has the lowest thermal loss value, with greater numbers for both taller and shorter buildings. The most thermally efficient solutions are buildings with wide floor plates and medium heights. These balance the desire to share the roof and slab between as many stories as possible while simultaneously limiting the height of the inefficient walls and their windows.
Considering the effects of width alone, it appears that, for the vast majority of viable length and height combinations, a wider floor plate is more thermally efficient.
3.2. Number of Buildings
To consider the effect of the number of buildings, total floor area is once again held constant at 100,000 square feet. In this scenario, height is also held constant at three floors, and only the number of buildings is allowed to vary. The segmented costs of each complex of buildings is shown in
Figure 5. The segmented contributors to thermal loss value are show in
Figure 6. One building configuration did not result in a solution of viable dimensions and was dropped from the analysis.
The findings here are unambiguous. The greater the number of buildings, the greater the cost of construction. The cost of interiors, services, equipment, and sitework are largely static across building counts (due to the nature of this analysis), the cost of the shell and, to a lesser extent, the substructure increase with the number of buildings. This would conform to our intuitive expectations that, for a given square footage, it is more economical to building a single building than multiple buildings.
The effect is even more dramatic when considering envelope. Because the number of windows is proportional to the area of the walls, increasing the total perimeter length by adding more buildings increases heat transfer for both the windows and walls. Logically, a greater perimeter length with more buildings will increase envelope energy.
3.3. Building Height
There are two ways to isolate the effect of building height. The first holds the total project square footage, number of buildings, and building width constant to measure the effect of height. The second allows the total square footage to vary, instead holding the area of the building footprint (or per-floor area) constant.
Figure 7 shows the cost of the static total square footage scenario, while
Figure 8 shows the envelope for this scenario.
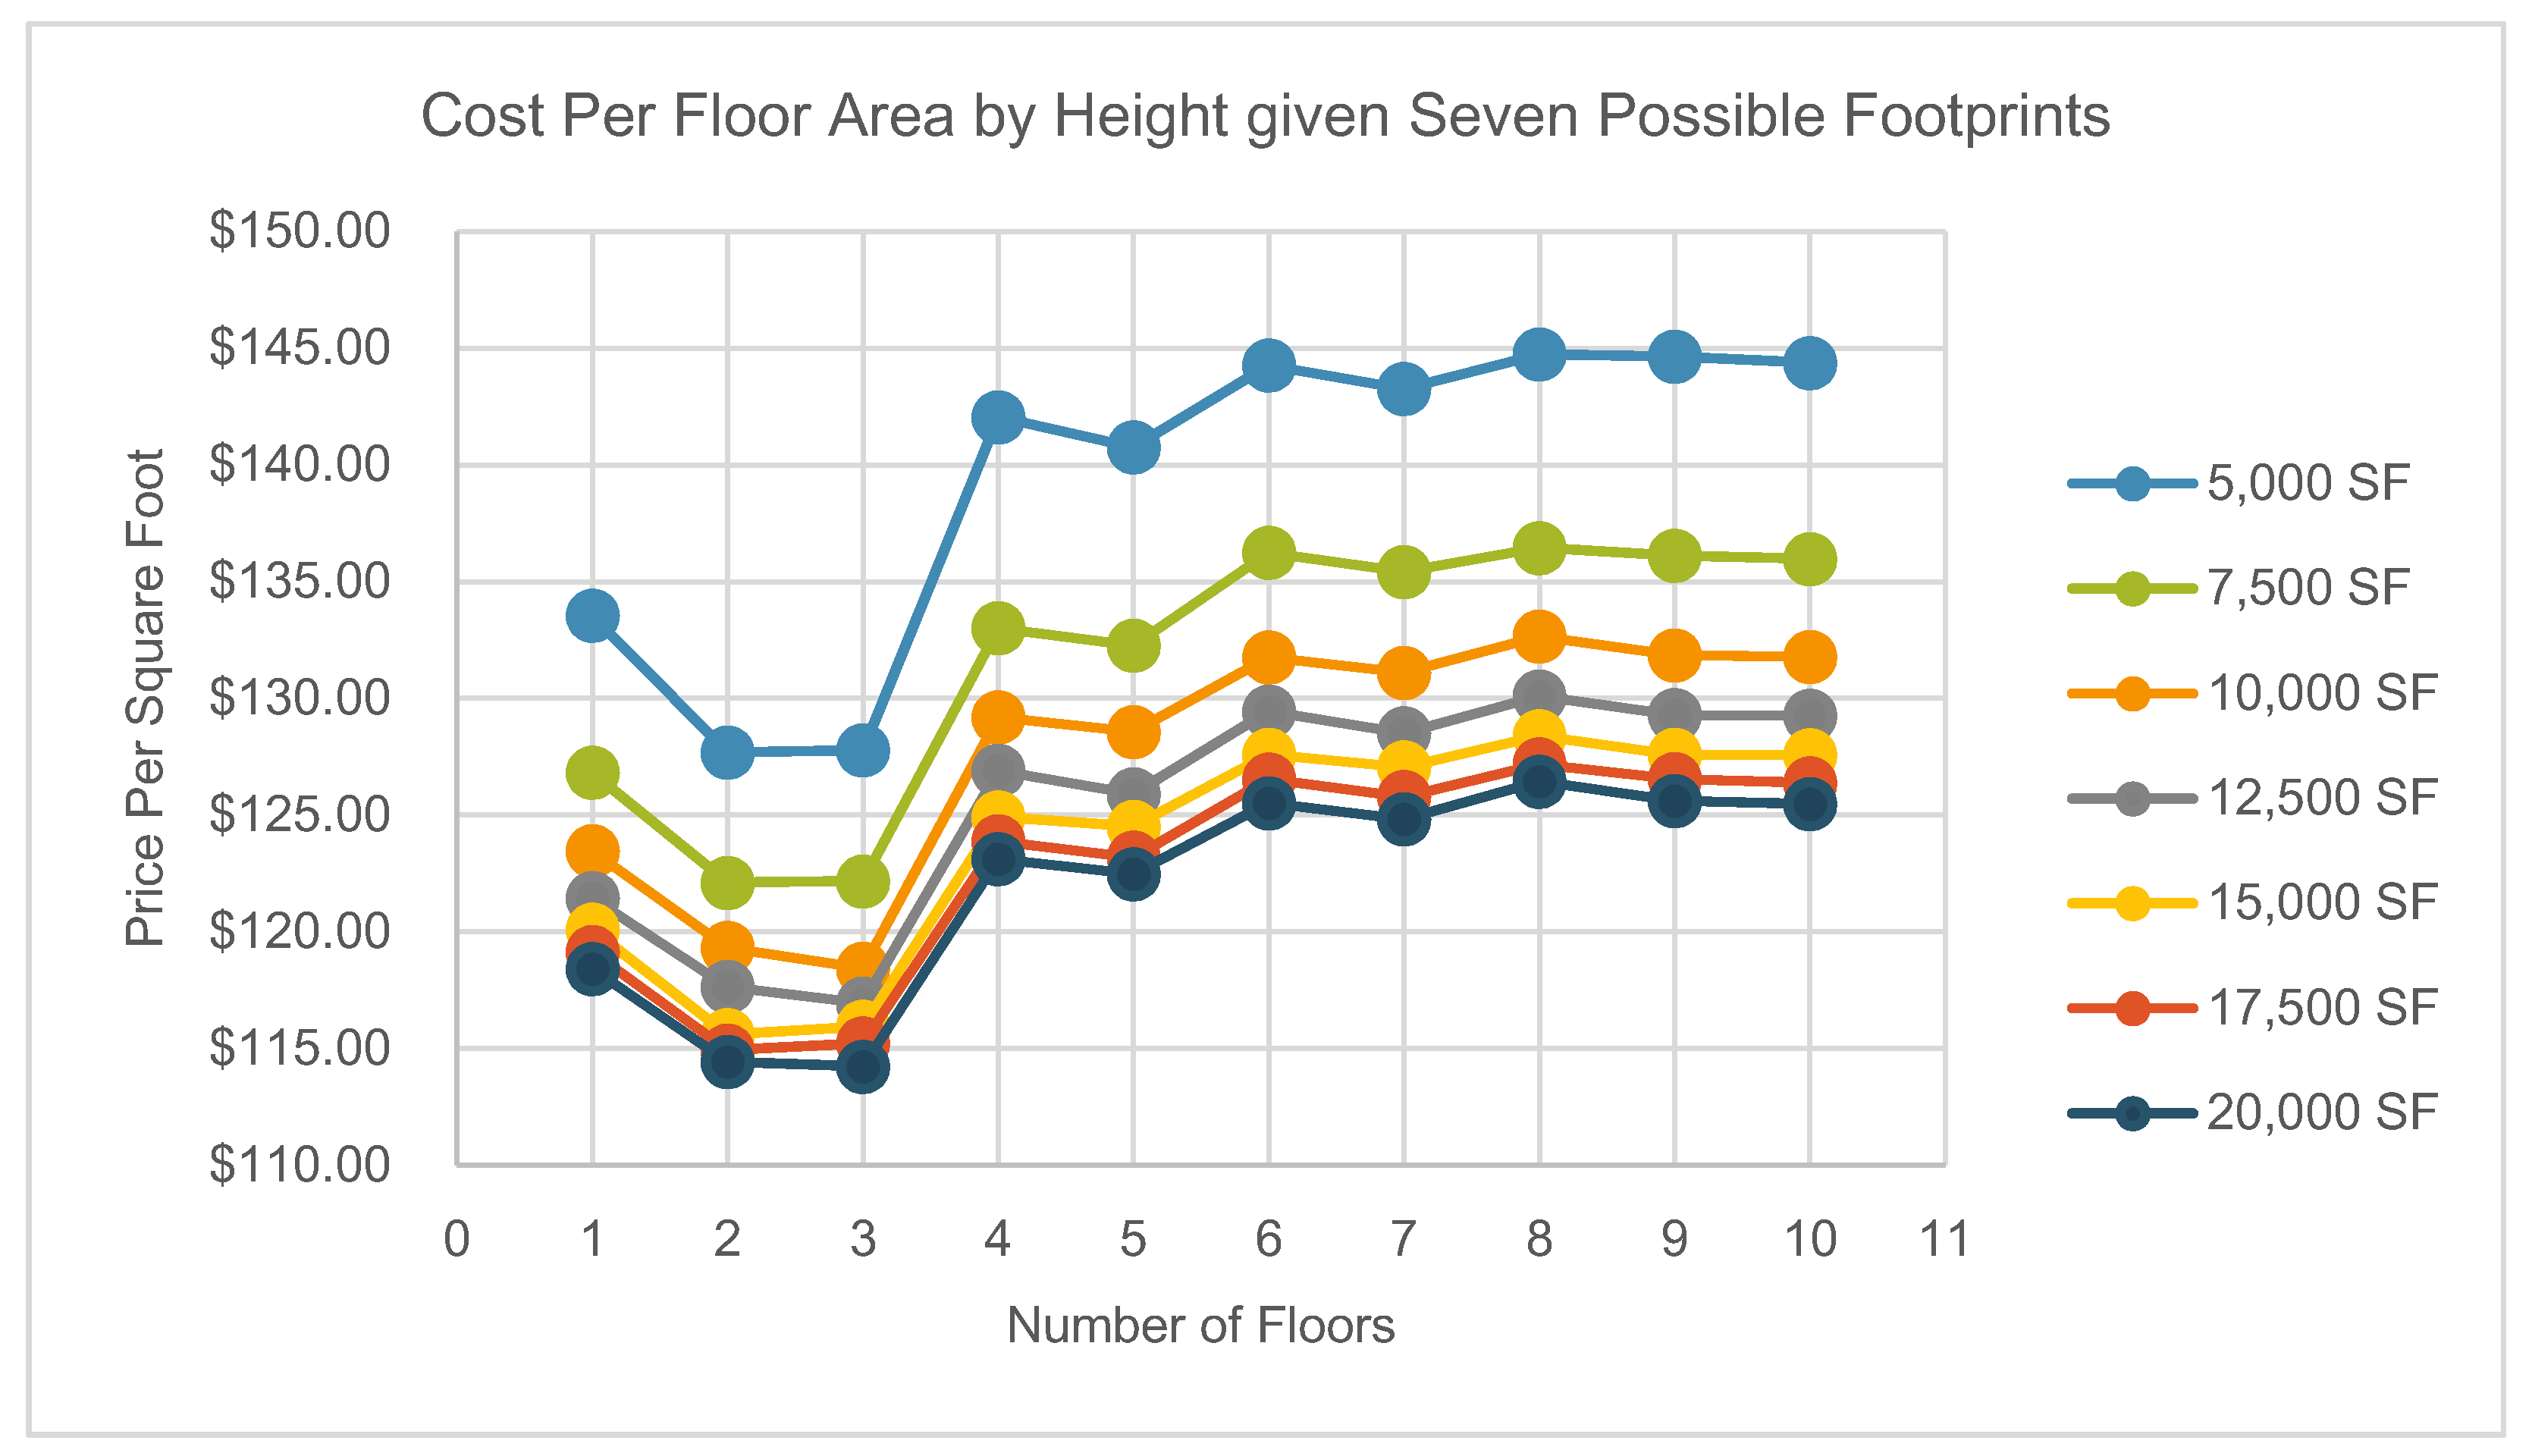
Figure 9 shows the cost of a static footprint scenario (with various footprints), while
Figure 10 shows the thermal loss value of this scenario. Dimensionally non-viable solutions are shown with open circles.
When the footprint of the entire building is held constant, costs make a slightly U-shaped curve for viable solutions. Generally, building a shorter building is more economical. This stands to reason, given that taller buildings require additional structure and vertical circulation equipment. Note that it is difficult to find a square footage in which all building heights are dimensionally viable. This problem is mitigated in the “static footprint” model below.
The case with thermal loss value shows a more U-shaped distribution, with greater envelope performance in buildings of moderate height. As total square footage increases, taller and taller buildings become more and more optimal. This suggests that, to minimize envelope heat transfer, taller buildings are optimal for large square footages while mid-size buildings are optimal for smaller square footages. Viability across floors is limited for each square footage. This can be managed by holding the size of each floor plate constant, rather than the size of the entire building, as shown below.
Cost per floor area by height reflects costs when operating with a constant floor plate. That is, where a one-story building is 5000 SF, a two-story building is 10,000 SF (5000 SF per floor), and so on. In this scenario, the effects of height can be seen more clearly because all solutions are viable. This method demonstrates a clear U-shaped curve for each proposed footprint. This suggests that neither one-story buildings nor buildings taller than three-stories are generally economical. As with the previous example, the difficulty with taller buildings continues to be the additional cost of structure and conveying. However, in this example, we can see clearly the problem with single-floor buildings that have only one floor to share the cost of the roof and foundation.
With a static footprint, optimal solutions for envelope emerge as height increases for all floor plate sizes. While holding the total complex floor area constant produces mid-rise solutions, holding the individual floor areas constant produces high-rise solutions. This is likely because, as building get taller, their exterior envelope to floor area ratios decline. This makes taller buildings more thermally efficient, but also makes this effect subject to the law of diminishing returns. That is to say, the efficiency increase realized from moving from a one to a two-story building is intrinsically less than the increase realized from moving from a nine to a ten-story building.
3.4. Combined Effects
Massing as part of schematic design can be a both highly and loosely constrained variable. For example, a small site constrained on all four sides may allow for only an adjustment in height. However, in many other scenarios, height, number of buildings, and width may be unconstrained. A multi-building complex of similar use buildings, for example. In the following exercise, we explore the lowest cost and thermal loss value solutions for four possible total project square footages: 62,500, 125,000, 250,000, and 500,000. We do this to address the question: What is the optimal massing configuration (for each total square footage)? A summary of our findings is shown in
Figure 11. Information for thermal loss value is shown in
Figure 12.
Solutions are evaluated based on their total cost or thermal loss value. In
Figure 10, “greener” solutions represent a lower total cost. In
Figure 12, “greener” solutions represent a lower thermal loss value. Therefore, in both tables, green solutions are preferable to red solutions.
When evaluating costs (
Figure 11) the “greenest” and therefore most preferable (i.e., least costly) solutions are found when building a greater number of shorter buildings. For example, for a theoretical complex with a total gross floor area of 250,000 square feet, the least expensive solution is for there to be three (3) three-story buildings.
This appears to show an economic trade-off associated with height. While taller buildings are more expensive because they require additional structure and vertical circulation, very short buildings are also expensive because they don’t “share” the cost of the foundation and substructure between multiple floors. Intuitively, it then stands to reason that the model seeks to find a balance between being uneconomically short and uneconomically tall.
While optimal costs were achieved with a high number of short buildings, optimal envelope thermal efficiency is achieved with a low number of taller structures. For example, for 250,000 square feet of complex floor area, the optimal envelope configuration is a one (1), nine-floor building. This contrasts with the three (3) three-story buildings that were optimal from a cost perspective.
Once again, the conclusion of the model confirms the importance of compactness when considering envelope thermal efficiency. The model prefers small numbers of large buildings because these solutions result in the lowest surface-to-volume ratios, meaning they have the smallest amount of envelope on a per-unit basis. Decreasing the height of the buildings would increase the number of buildings, thus increasing envelope area per unit.
The first group of solutions represents a theoretical 62,500 square foot complex. Such a complex might be constructed of a single three-story building or of multiple one-story buildings. The row of the table represents the number of buildings while the column represents the total height of each building.
Of course, architects and designers are not permitted to consider only cost or only envelope performance. They must instead try simultaneously to balance these competing objectives within the project. If we plot all possible combinations by cost (on an X-Axis) and thermal loss value (on a Y-axis), we can compare solutions to find a compromise for any given square footage (
Figure 13). From
Figure 13, we see our least expensive configuration consists of three buildings of three stories each. The solution with the most thermally efficiency envelope, however, consists of one building with nine stories.
Between these two solutions is a third, ‘pareto’ optimal solution: two buildings of five floors. While this solution is not optimal for either variable, it is non-dominated in that improvement on one axis cannot be achieved without harming the other. The solution, therefore, represents a fair compromise.
The general rule that a larger number of shorter buildings is more economical while a smaller number of taller buildings is more thermally efficient holds true across the square footages considered. For any given square footage, there exists a compromise between prioritizing cost and prioritizing a thermally efficient envelope. Generally, these compromise solutions exist between the high number of buildings dictated by cost and the low number of buildings dictated by thermal performance. Similarly, they suggest a mediation of the short building heights that are most economically viable and the tall building heights that are most thermally efficient.
4. Discussion
When considering how the four variables of width, number of buildings, building floor height, and total square footage affect cost and thermal loss value, we have observed the following:
For a given height and area, a wider building corresponding to a deeper floor plate can produce less costly solutions and a more thermally efficient envelope. If given a choice between selecting a building fifty feet wide and a building seventy feet wide, designers would do well to opt for the latter;
For a given total complex area, height, and width, fewer large buildings are both less costly and more efficient than a greater number of smaller buildings;
For a given total floor area and width, shorter buildings are generally more economical while mid-rise buildings have better environmental performance;
For a given single-floor footprint area and with, two- and three-story buildings are generally the most economical while taller buildings have the best performing envelopes;
When considering both cost and envelope holistically for a given square total project square footage, building multiple short building is the most economical while building fewer taller buildings has the best envelope performance. A compromise can be found in building a medium number of mid-height buildings.
4.1. Regression Analysis
For the analysis explained in
Section 3 and the “bottom lines” listed above, certain expectations were necessitated. For example, to investigate optimal width, a given height and area had to be selected for variable control. It is possible that selection of different values for height and area could have unforeseen effects on building width.
Therefore, to test the internal validity of this method, a series of regression analyses were conducted using the sum of least squares method. A series of 500 dimensionally viable solutions was populated using random values for total floor area (between 50,000 and 1,000,000 square feet), building height (between 1 and 10 stories), number of buildings (between 1 and 10 buildings), and width (between 50 and 70 feet). The performance of these solutions was then evaluated on the basis of per-square-foot cost and per-square-foot envelope loss factor.
For the first analysis, height, width, number of buildings, and total floor represented the dependent variables, while cost per square foot represented the independent variable. The resultant coefficients are found in
Table 8. All variables were statistically significant at a
p = 0.05 threshold. The combined R-squared value of 0.738 suggested that approximately 74% of the variation in cost could be explained by these four independent variables. Regression coefficients are shown in
Table 8.
Because the units of measurement are not consistent across all variables (i.e., story height is measured by floor count, width is measured by linear feet), the magnitude of the coefficients are not directly comparable. What is significant is the sign (e.g., positive or negative) association of the variables.
According to this analysis, building a greater amount of total square footage will result in lower per-unit-floor-area costs. Building a greater number of buildings, conversely, is associated with higher costs. Taller buildings are also found to be generally more expensive than shorter buildings. Wider buildings are suggested to be more economical than narrower buildings.
These results are consistent with the observations in
Section 3 of this report, with one possible exception. The findings in
Section 3.3 suggest that while shorter buildings are more economical than taller buildings generally, two- and three-story buildings can be more economical than their single-story counterparts for a given footprint (q.v.
Table 9 infra). This nuance is lost in linear regression.
For the second analysis, height, width, number of buildings, and total floor represented the dependent variables, while envelope efficient per square foot floor area represented the independent variable. The resultant coefficients are found in
Table 9. Once again, all variables with statistically significant at a
p = 0.05 threshold. An R-squared value of 0.759 suggested that approximately 76% of the variation in envelope performance could be explained by the four dependent variables.
Once again, the magnitudes of the coefficients cannot be compared with one another or with the coefficients in the previous regression analysis due to the dissimilarity of their units. However, the magnitude of the coefficients suggests that, as total complex area rises, so too does envelope thermal performance. However, as the number of buildings rises, thermal performance worsens. Adding additional stories also appears to worsen environmental performance, while wider buildings are found to have better performance than narrower buildings.
Once again, our findings are generally consistent with those enumerated in
Section 3, with the possible exception of height. For a given total complex area, we found in
Section 3.3 that environmental performance and height have a U-shaped relationship, with the shortest and tallest buildings having less desirable envelopes (q.v.
Table 8). We also found that taller buildings can have better envelopes as total complex square footages rises (q.v.
Table 9). Again, the nuance of this relationship is obfuscated by linear regression.
4.2. Relation to Existing Literature
Generally, our research supports the ideas of compactness of form as the optimum way to improve envelope performance, with the model opting to generally build fewer buildings and minimize overall envelope area. This is in line with our pre-study expectations, informed by Depecker [
15], Pessenlehner [
17], and Granadeiro [
41].
In terms of floorplate width, Clark et al. suggested a distance from the interior wall of the core or corridor to the exterior wall of 20 to 30 feet within the context of high-rise residential buildings [
33]. Within this low-to-midrise context, our analysis suggests that the upper end of that range is more appropriate from a cost and thermal performance standpoint. Because our model generally selected the widest floor plate available, it is possible that even deeper floorplates could be viable, if they can be planned in such a way to provide adequate light and space.
Previous literature on building aspect ratio suggested an optimum aspect ratio of between 1.01 and 1.42 [
27] or between 1 and 1.5 [
21], depending on the study. Because our width was limited to a maximum of 70 feet, our model produced outcomes that had much higher aspect ratios than those previous studies. Generally, we found it preferable to have one 200-foot-long building over two 100-foot-long buildings. We expect that, if we allowed both width and length to vary more broadly, our results would be more in line with previous studies.
In terms of optimum height, we found that taller buildings were viable from an energy perspective for projects with large total gross floor areas, but shorter buildings were more economically appropriate. This appears consistent with the findings of Drew et al., who also end up finding the optimal residential form somewhere in the middle of the density spectrum [
19].
Considering both energy and cost, Capeluto et al. found that there existed a trade-off between the two factors of initial building cost and initial energy consumption [
26]. Our findings would seem to confirm that this is also true within the context of the United States for some building variables (e.g., height). We find it to be less true for other building variables (e.g., building width), for which the aims of first cost and envelope performance were more closely aligned.
4.3. Limitations and Future Research
These results suggest that it is possible to find a balance between economics and energy when considering residential multi-family buildings.
There are some limitations to this work. First, only rectangular buildings were considered. There are an infinite number of possible floor plate shapes, from circles to ellipses and entirely irregular shapes. Likewise, buildings need not be simple repeating floor plates. Shapes in section/elevation can take on much more complicated, even wedding-cake-like shapes. More research is necessary to understand how more complex forms are affected by the underlying variables in this exercise.
Architectural design is also limited by a seemingly infinite number of interrelated demands on the designer. The sheer volume of these dependencies makes them exceptionally difficult to quantify. What is presented here is not intended to be an exhaustive guide to design, but rather to suggest some general rules or best practices for a specific building type.
For example, this study is predicated on the assumption that 1000 square feet in a 70′ wide floor plate will make for the same number of units as it would in a 40′ floor plate. Even putting aside the circulation efficiency issues discussed above, this may not necessarily be the case. An ergonomic one-bedroom solution may require only 750 square feet at a given depth while requiring 1000 square feet at another depth. More research is needed to understand how internal configuration of units can be more completely considered within the proposed formwork.
Similarly, this exercise is intentionally devoid of a specific site and location. Real projects, conversely, are limited by their sites. More research is necessary to learn how such an optimization method would be modified by a constrained site. Likewise, it is likely that variable weather conditions and construction types associated with a specific region will have effects on solution outputs. A more complex model is needed to take into account specific locational effects for any single project.
The results provided may not be generalizable to wider contexts, as typical construction assemblies and building costs would be expected to vary with country. While the International Building Code utilized is, by its nature, international, more research is necessary to investigate to what extent these findings are generalizable to a wider context.
Even within the United States, costs can be averaged, but thermal performance will vary substantially by region. While the ASHRAE Climate Zone 5A values were used for the calculation of thermal loss factor, using the values for a different climate zone may produce different outcomes. More research is necessary to add climatic nuance to the evaluation of thermal performance.
Finally, per square footage cost and thermal loss value are rough measuring sticks for economic and environmental viability. Economics are affected by more than cost, being modified by factors including sale/rent price, construction time-frame, and others. Similarly, building energy performance and climate impact should include such other factors as hourly energy consumption, transportation energy associated with certain densities, and water consumption (to name only a few).
These limitations notwithstanding, the proposed method provides general guidance to designers seeking to configure multi-family housing developments. It is most useful in suggesting some “rules of thumb” for designers to use when evaluating potential massing solutions early in the schematic design process. It also lays a foundation for future, more nuanced research on building massing for specific sites and climates. What is more, the proposed method suggests balance between first cost and envelope performance, suggesting that, while a trade-off may exist between these two factors, the least expensive solution is not always the correct one.
The method viably selects solutions that are best configured to treat the twin problems of housing affordability and climate change. This is important polemically because it encourages designers to think in terms of designing not only for the developers’ bottom line, but for buildings that quantitatively encourage economic, social, and environmental sustainability simultaneously.


