Article

Properties of Cementitious Materials with Recycled Aggregate and Powder Both from Clay Brick Waste

1
School of Civil Engineering, Shaoxing University, Shaoxing 312000, China
2
Department of Structural Engineering, Tongji University, Shanghai 200092, China
3
College of Civil Science and Engineering, Yangzhou University, Yangzhou 225127, China
*
Authors to whom correspondence should be addressed.
Buildings 2021, 11(3), 119; https://doi.org/10.3390/buildings11030119
Submission received: 8 February 2021 / Revised: 14 March 2021 / Accepted: 15 March 2021 / Published: 17 March 2021
(This article belongs to the Collection Advanced Concrete Materials in Construction)

Abstract

:
The utilization of recycled brick aggregate (RBA) and recycled brick powder (RBP) in cementitious materials helps the reclamation of clay brick waste in construction and demolition waste. This work studied the properties of cementitious materials with RBA as aggregate and RBP as supplementary cementitious material. The RBA has lower apparent density and higher water absorption than natural aggregate, and RBP with an irregular micro-structure contains high content of silicon and aluminum oxides and possesses excellent pozzolanic activity. Incorporating RBP decreases the fluidity and increases the setting time, but the incorporated RBP improves the pore structure and decreases the average pore diameter of cementitious materials, thereby decreasing the permeability. Utilizing RBA increases the drying shrinkage, while the incorporated RBP decreases the drying shrinkage of cementitious materials; the mortar with 50% RBA and 30% RBP has the lower drying shrinkage than the common mortar without RBA and RBP. Incorporating RBA and high-volume RBP decreases the mechanical strength, while there is no obvious decrease in the mechanical strength for the mortar with 50% RBA and 30% RBP. Moreover, the flexural strength to compressive strength ratio increases with RBA and RBP incorporating. Utilizing RBA increases the water transport, while the water transport properties decrease with the RBP incorporation; incorporating appropriate content of RBA and RBP can obtain the cementitious materials with low permeability. Particularly, a significant decrease in chloride ingress occurs with the substitution of RBP.

1. Introduction

Rapid urbanization has been resulting in the massive output of construction and demolition waste (CDW), and the CDW amount will still be at a high level in the next decade [1,2,3]. CDW occupies a lot of urban land and contains some pollutants, so it has been the burden for human society and natural environment; therefore, developing an effective approach to recycling CDW has been a challenge for civil and environmental engineering [4,5]. The concrete and clay brick wastes account for the majority proportion of CDW, and thus, these wastes are currently crushed into recycled materials and then utilized in new cementitious materials [6,7,8]. Properties of recycled aggregate and powder from concrete waste in CDW have been investigated systematically by previous investigations, showing that the incorporation of recycled concrete aggregate and powder generally had an adverse impact on the micro-structure and macro-properties [9,10], early-age performance [11,12], mechanical strength [13,14] and durability performance [15,16,17] of the prepared mortar and concrete. In recent years, the scholars worldwide have been attempting to use the recycled materials from clay brick waste in preparing cementitious materials, which can help the reclamation and reduction in clay brick waste in CDW. Currently, the clay brick waste can be recycled into recycled brick aggregate (RBA) and recycled brick powder (RBP) and then utilized in cementitious materials.
For the cementitious materials with RBA from clay brick waste, the RBA is utilized as aggregate to replace the natural aggregate. Most previous investigations reported that the utilized RBA decreased the mechanical strength and durability performance of cementitious materials, and high replacement ratios of RBA were not recommended. For example, Cachim [18] found that the RBA could be utilized as natural aggregate, and there was a reduction in concrete strength with the RBA incorporation; a similar phenomenon was also reported by Zheng et al. [19] and Debieb and Kenai [20]. Zong et al. [21] reported that mixing RBA in increased the permeability of concrete. In addition, the pre-soaking treatment of RBA has an obvious impact on the concrete properties; the mortar with dry RBA has a higher mechanical strength and lower water transport property than that with pre-soaking RBA, and this is because the absorbed free water releasing from RBA into the cementitious materials provides an internal curing condition [22]. Ge et al. [23] further found that it was feasible to use pre-wetting RBA as an internal curing agent for cementitious materials, because RBA had higher water absorption than the natural aggregate.
For the cementitious materials prepared with RBP from clay brick waste, the RBP is frequently utilized as supplementary cementitious material (SCM), and the cement is replaced with the same mass RBP, which makes the water to binder (w/b) ratios of cementitious materials with various RBP substitution rates the same. The utilized RP does not change the types of hydration production in cement-based materials [24]; moreover, incorporating high-fineness RP promotes the pozzolanic activity, thereby refining the micro-structure of cement-based materials [25,26]. The mixed RBP up to 15% has less impact on the mechanical strength of cementitious materials, but a significant reduction in mechanical strength occurs when high-volume RP is incorporated [27]. Because the RBP has excellent pozzolanic and filler effects, the utilization of RBP improves the permeability resistance. Ortega et al. [28] stated that the water absorption coefficient of cementitious materials incorporating 20% RBP was approximately 19.2% lower than that without RBP, and Schackow et al. [29] reported a similar phenomenon. Yang et al. [30] further utilized RBP as SCM in producing foam concrete, and some satisfactory results were observed. However, some investigations reported that the incorporated RBP decreased the carbonation resistance of concrete, because the alkali content decreased with the recycled powder incorporation [24,31].
Although many scholars have investigated the properties of cementitious materials with RBA or RBP, there is a lack of studies on the properties of cementitious materials incorporating both RBA and RBP. The utilization of RBA as aggregate and RBP as SCM in concrete helps the recycling and reclamation of clay brick waste from CDW, which is eco-friendlier. Therefore, this work focused on the properties of cementitious materials with both RBA and RBP, and the micro-structure, early-age performance, mechanical strength and transport properties were mainly measured. The authors hope the findings in this work may help the further application and studies on the concrete with recycled materials from clay brick waste.

2. Materials and Experiments

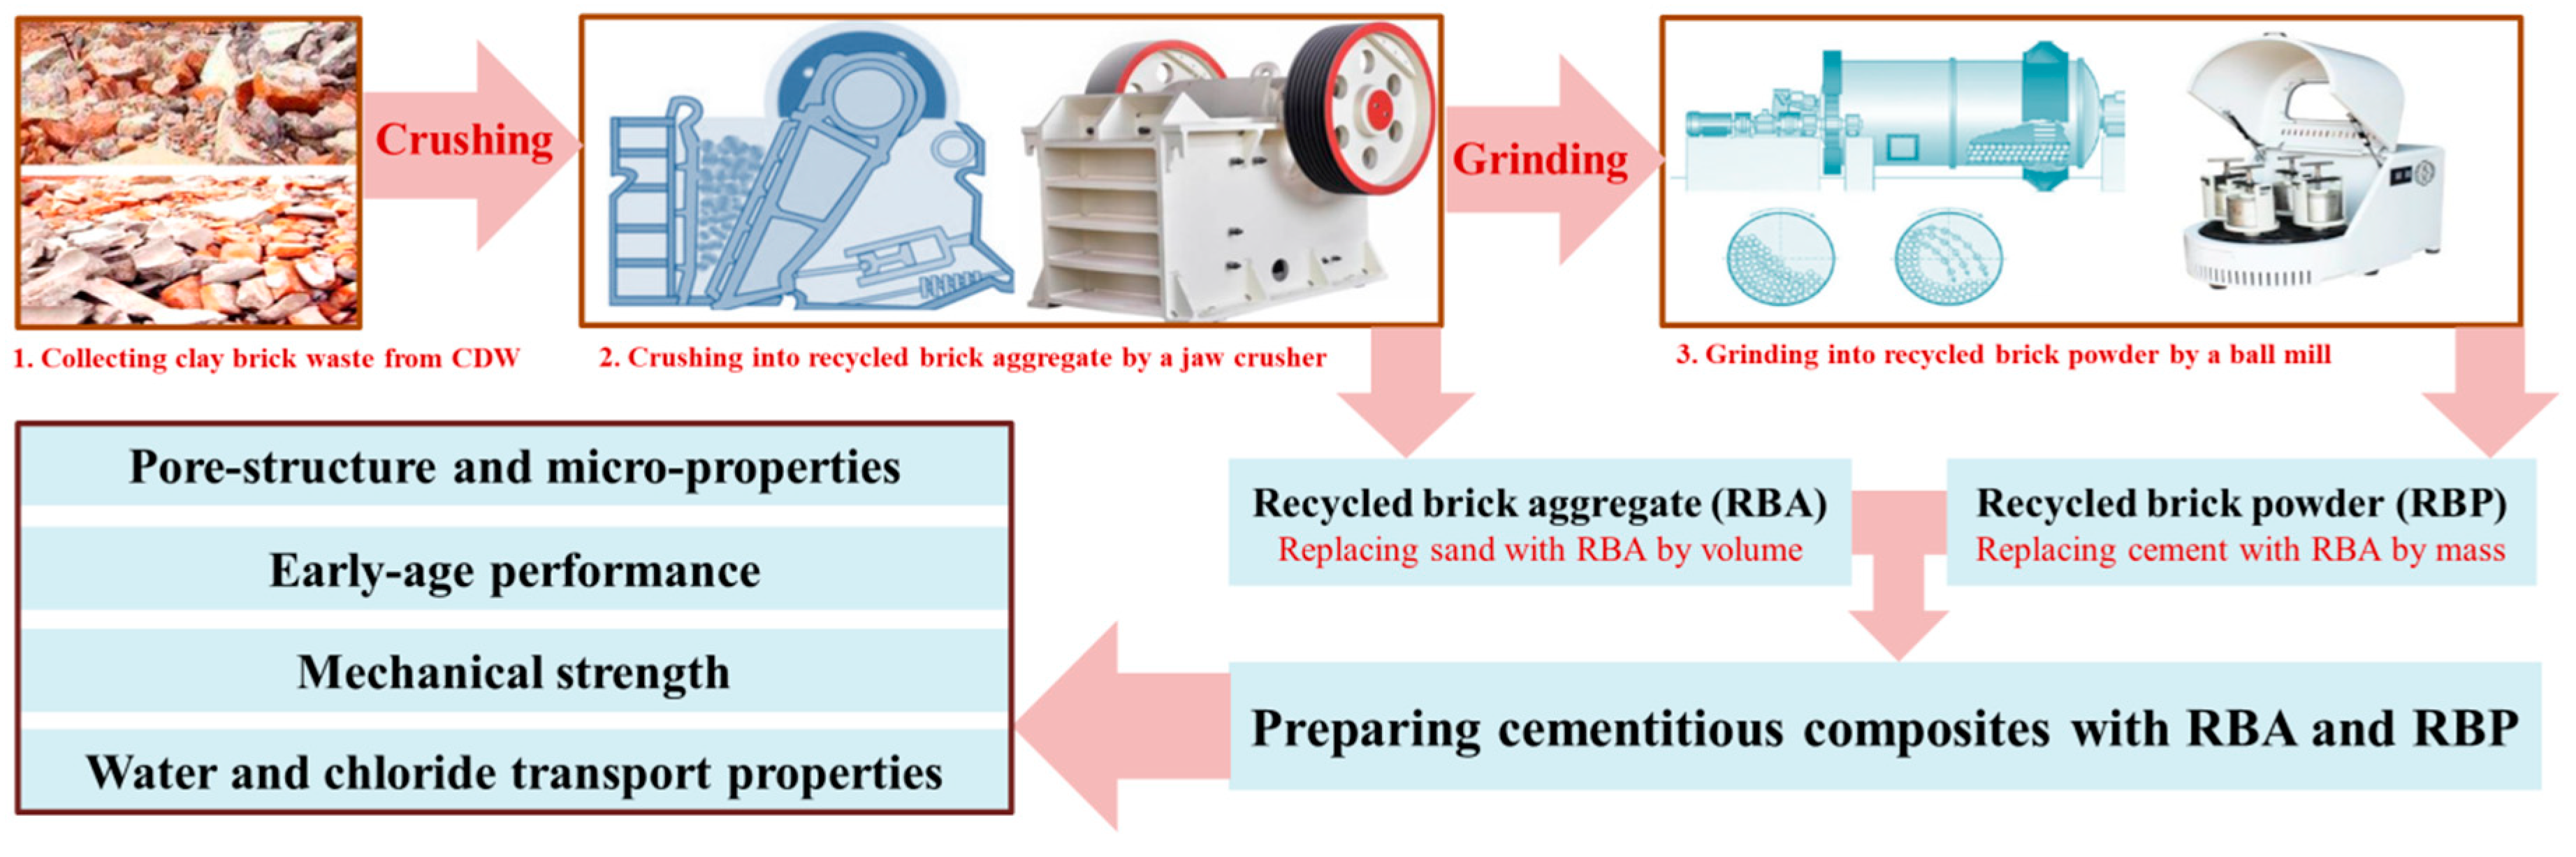
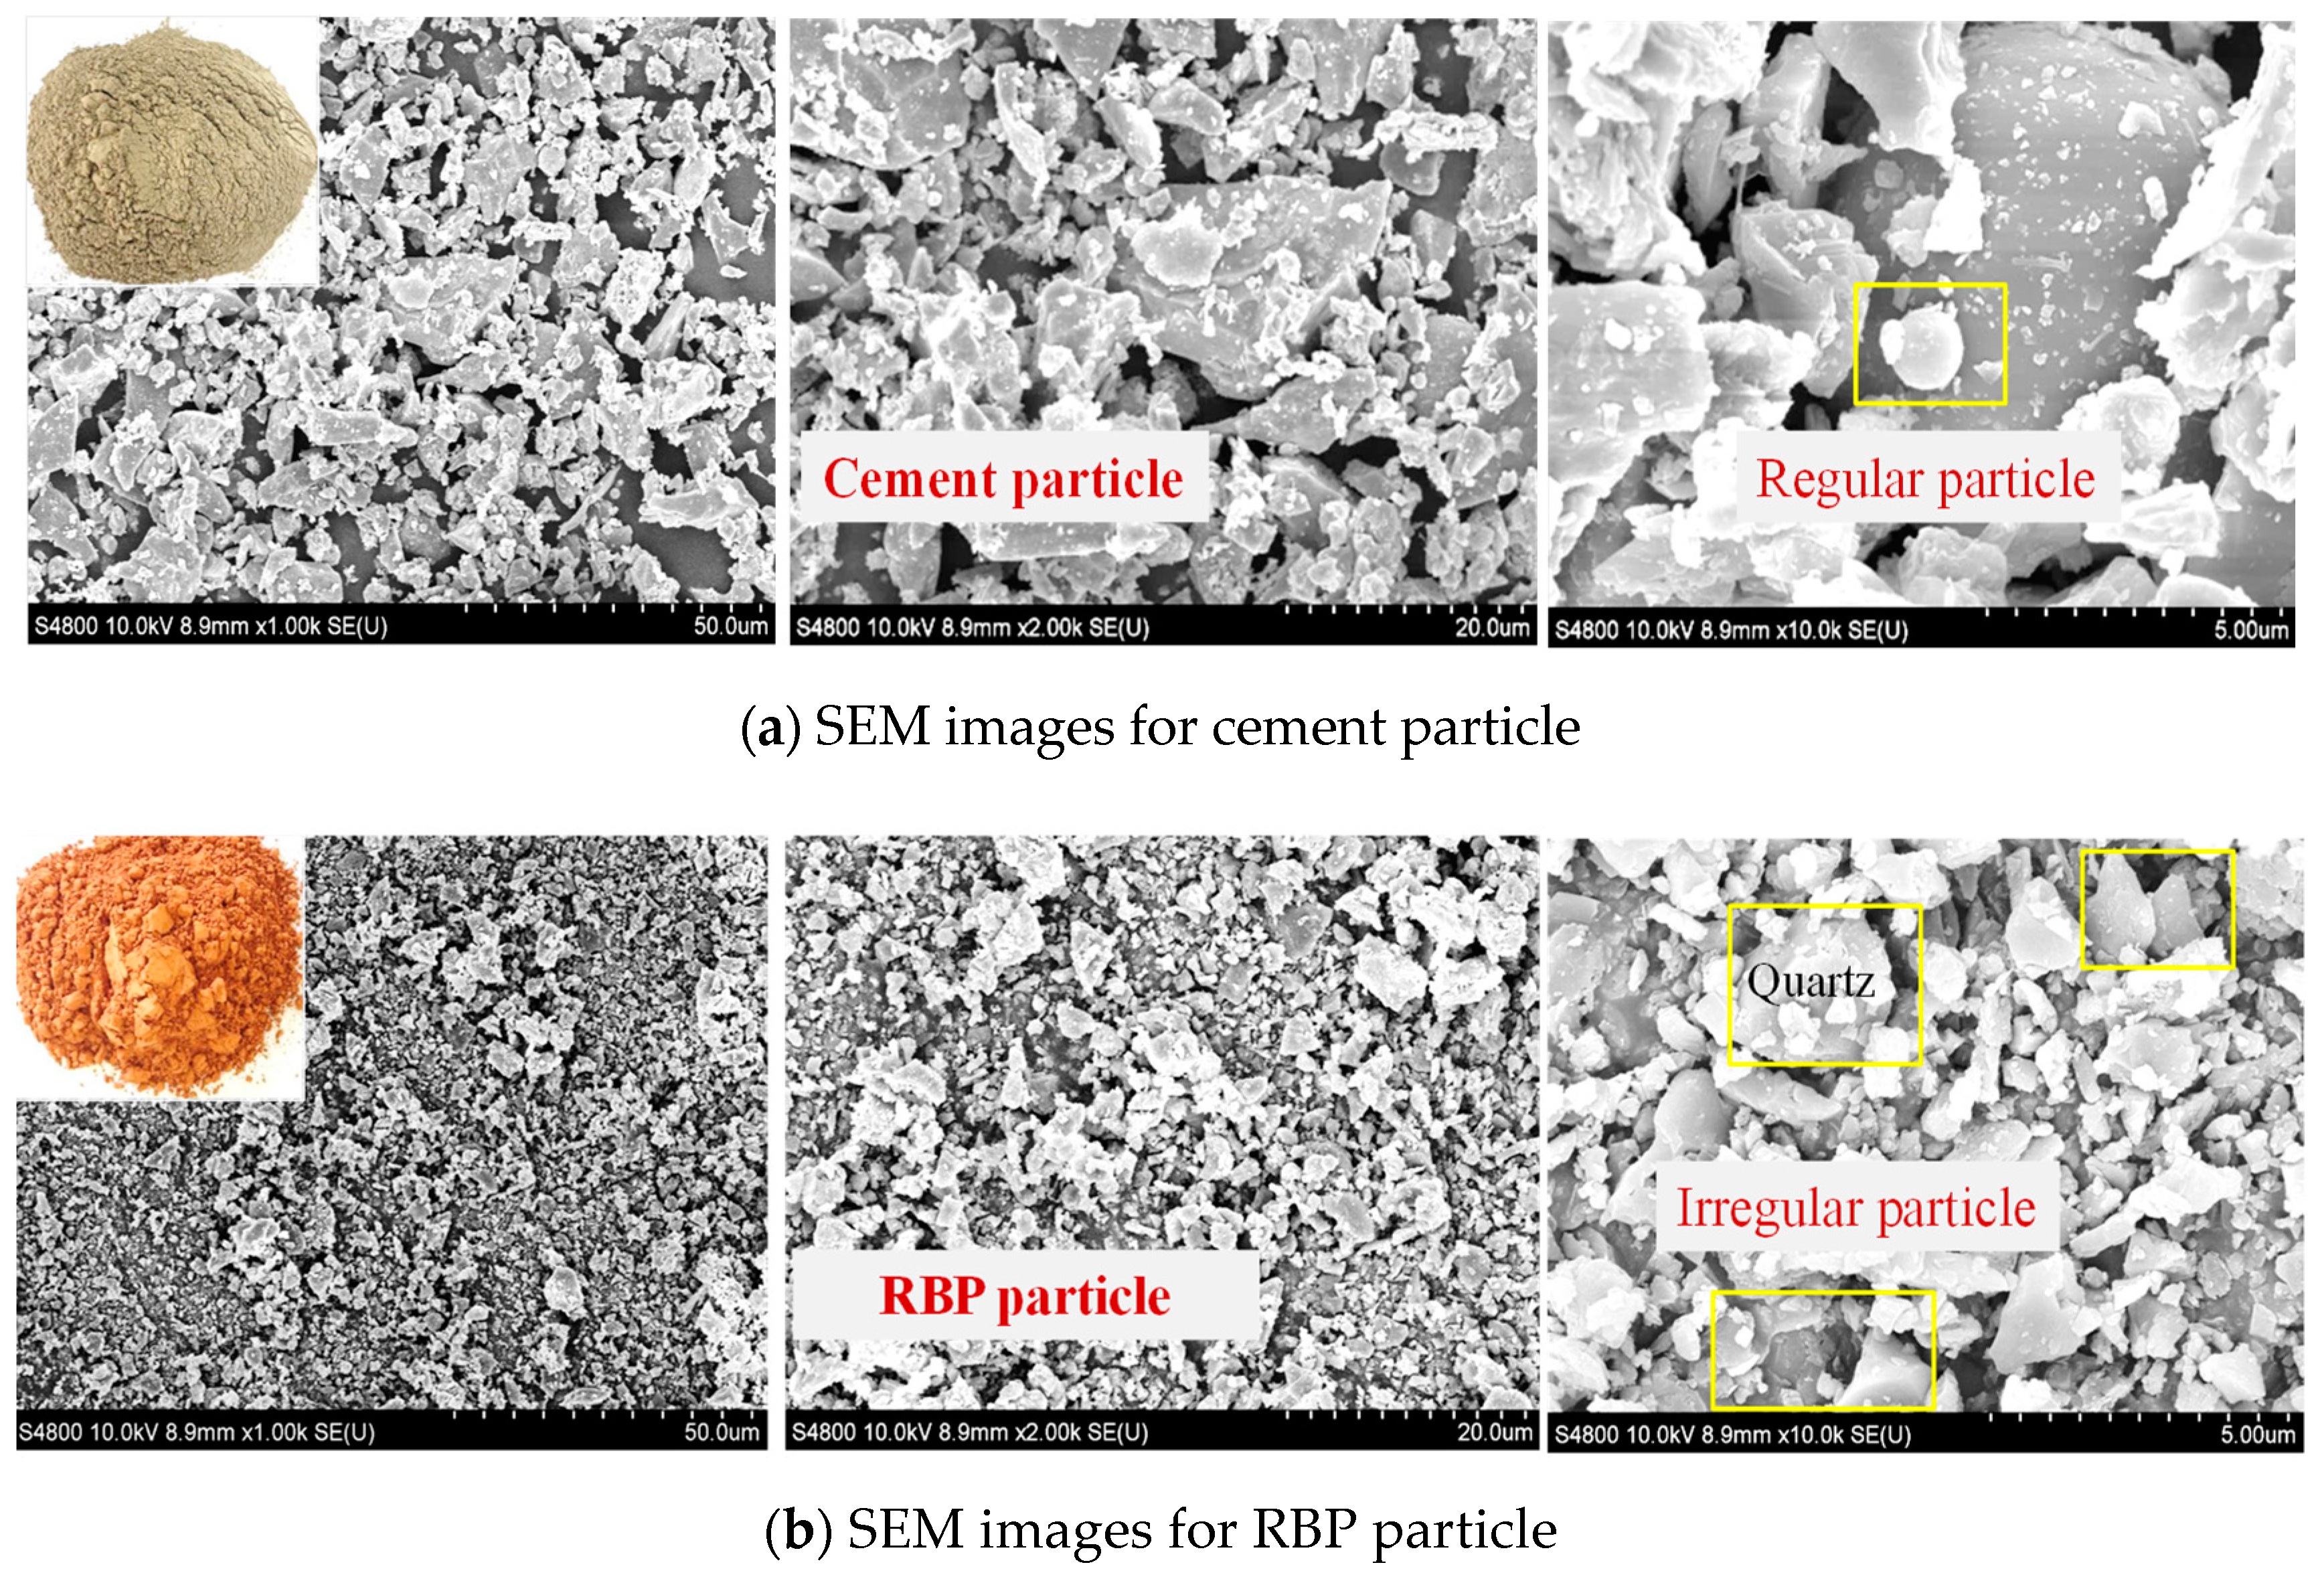
2.1. Fundamental Characteristics of RBA and RBP from Clay Brick Waste

Figure 1 shows the testing process of this work. The clay brick waste was first separated and collected from CDW, and then, the clay brick waste was dried in a drying oven until reaching a constant weight. Second, a jaw crusher was employed to crush the dried clay brick waste into RBA (≤5 mm). One part of RBA was utilized in preparing RBA mortar, and the other part of RBA was further ground into active RBP with a maximum size of 75 μm by ball grinding mill (QM3SP2L, Chishun Science & Technology CO., Ltd, Nanjing, China), and a prolonged grinding duration decreased the RBP particle size and helped its pozzolanic activity. Finally, the cement mortar containing RBA and RBP was prepared, and the micro-properties, early-age performance, mechanical strength and transport properties were measured to evaluate the properties of it.
Table 1 shows the properties of natural sand and RBA with the particle size up to 2.36 mm. Because the fired clay brick has high porosity, the porosity and water absorption of RBA are higher than these of natural sand. The determined water absorption of natural sand and RBA is 0.6 and 17.0%, respectively. The apparent density of RBA is lower than that of natural sand, approximately 19.1% lower than that of natural sand. Figure 2 shows the appearance and scanning electron microscope (SEM; Equipment: S-4800 II, Hitachi, Tokyo, Japan) images of cement and RBP. The RBP presents a red color because the initial clay brick waste is red; in this case, the red color of the prepared mortar and concrete increases as RBP incorporates. The SEM images show that the micro-structure of an RBP particle is more irregular than that of a cement particle, and more edges and corners can be seen from the SEM images of RBP. The main crystal phase in the RBP is quartz and also includes albite, calcite, anorthite and sanidine [26].
Tang et al. [24] suggested that the RBP fineness should be lower than the cement fineness when RBP is utilized as SCM in cementitious materials. Figure 3a gives the particle size of cement and RBP, and the particle size of RBP utilized in this work is lower than that of cement in this work. The measured median particle size of RBP and cement is approximately 11.0 and 20.0 μm, respectively. Figure 3b gives the elemental components of RBP, and the RBP contains high content of oxygen, silicon and aluminum elements; the existence of silicon oxide and aluminum oxide promotes the pozzolanic activity and helps the properties of the prepared cementitious materials [32,33,34]. Figure 3c and Table 2 further shows the oxide composition of RBP and cement by an X-ray fluorescence (XRF; Equipment: Center XRF-1800, Shimadzu, Kyoto, Japan) test. The content of silicon dioxide and alumina in RBP is higher than that in cement, and the calcium oxide content of RBP is much lower than that of cement. Therefore, incorporating RBP promotes the pozzolanic effect, while the decrease in calcium oxide content results in the reduction in hydration products in cementitious materials with the high-volume RBP incorporation. The oxide types of RBP are similar to those of fly ash, which further proves the feasibility of utilizing RBP as SCM. Figure 3d shows the mineral component of RBP and cement by X-ray diffraction (XRD; Equipment: D8 Advance, Bruker AXS, Karlsruhe, Germany) test, and the quartz content of RBP is much higher than that of cement because of the high quartz content in the initial clay brick waste.

2.2. Mix Proportions and Samples Preparation

This work aims at investigating the influence of RBA and RBP incorporation on the properties of the prepared cementitious materials. Table 3 shows the mix proportion of cement mortar with RBA and RBP. First, the mortar samples with various RBA substitution rates were prepared, and the natural sand was substituted with the same volume of RBA because of the great difference in the apparent density between RBA and natural sand; for example, the M-50RBA sample presents that 50% natural sand in mortar is replaced with RBA by volume. Second, the mortar samples incorporating various RBP substitution rates were prepared, and the cement in mortar was substituted with RBP in the same mass; for instance, the M-50RBP sample represents that the 50% cement in mortar is substituted with RBP by mass. Finally, the mortar samples incorporating both RBA and RBP were prepared. Considering that high RBA substitution rates are not recommended in preparing new cementitious materials because of the high water absorption of RBA, the RBA substitution rate is kept at 50% in this work, and meanwhile, the RBP substitution rates range from 0 to 50%, which may help achieve the durable cementitious materials with both RBA and RBP. For example, the M-50RBA+50RBP sample presents that 50% natural sand was substituted with the same volume of RBA, and 50% cement was substituted with the same mass of RBP.
For the RBA-prepared mortar, the high water absorption of RBP frequently results in the decrease in the effective w/b ratio and workability of prepared mixture, and thus, the extra water is added in preparing RBP mortar. The amount of extra water can be calculated based on the water absorption of RBP, as shown in Table 1. The obtained extra water is first mixed with RBP for 15 min to achieve a state of saturated surface dry, and then, the other mixtures in Table 3 were mixed to prepare the RBA mortar. For the RBP-prepared mortar, the incorporation of RBP with irregular micro-structure leads to the reduction in the fluidity of prepared mixture, and thus, the dosage of water reducer mixed is increased with the increase in RBP substitution rates [24]; in this case, the adverse impact of RBP incorporation on the workability of mixture is decreased. After sample preparation and 24 h hardening, all the samples were cured for 28 d (T = 20 ± 2 °C), and then, the micro- and macro-properties of mortar with RBA and RBP were measured.

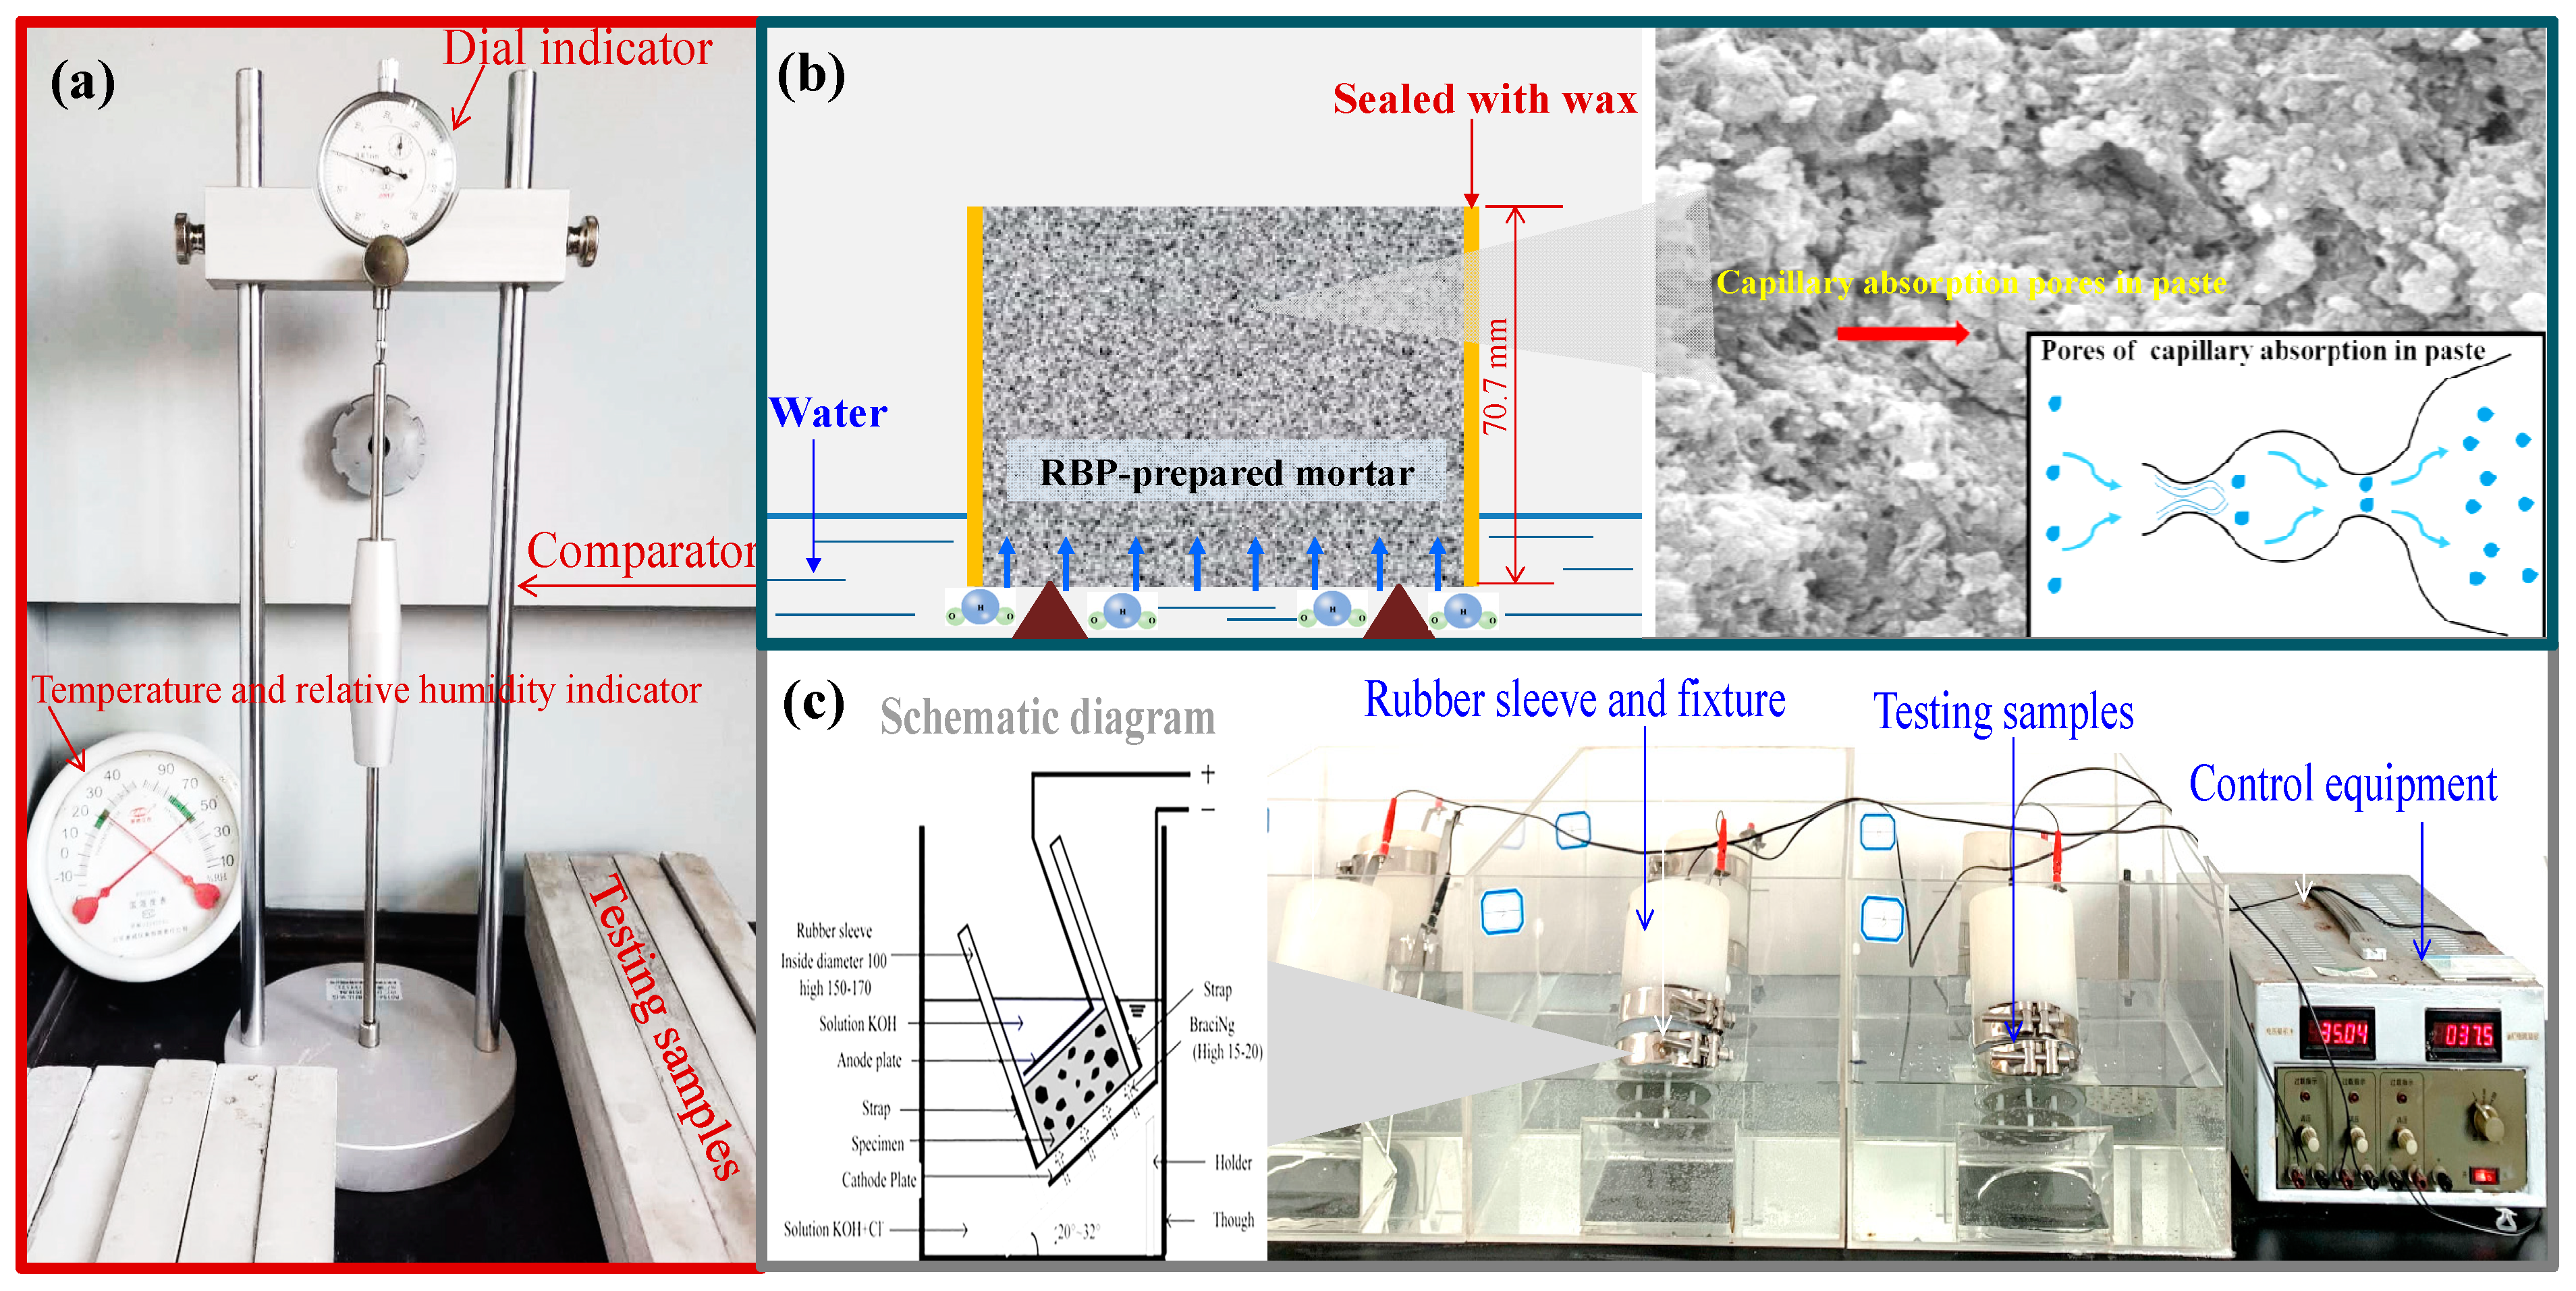
2.3. Micro-Properties Determination

The micro-properties were measured to achieve a better understanding of the water transport in cementitious materials. The micro-structure and elemental composition were measured by a SEM test, and the determined sample was first dried at 50 °C for 48 h before SEM test. The mineral composition was analyzed via XRD test, and the XRD equipment is equipped with a Cu anode (40 kV, 40 mA); the powder samples were first dried and then sieved through 75 μm, scanned from 10 to 60° at 2θ angle position. The thermogravimetric analysis (TG; Equipment: Pyris 1 TGA, PerkinElmer, Norwalk, CT, USA), and Fourier transform infrared spectroscopy (FTIR; Equipment: Cary 610, Varian, Palo Alto, CA, USA) tests were conducted to quantify the impact of RBP incorporation on the hydration products in cementitious materials. This work mainly focused on the pore size distribution, and the test of mercury intrusion porosimetry (MIP; Equipment: Auto Pore IV 9500, Micromeritics Instrument Corporation, Norcross, GA, USA) was conducted to quantify the pore characteristics of cementitious materials incorporating various RBP substitution rates. Moreover, the MIP test can further classify the pores into gel pores (0–10 nm), mesopores (10–100 nm), capillary pores (10–1000 nm) and macropores (>1000 nm), and the pores below 100 nm are frequently considered as harmless and less harmful pores for cementitious materials [25,35]. The parameters such as pore size distribution, total porosity and average pore diameter can be obtained by MIP test.
The porosity is defined as the ratio of the pore volume to the apparent volume, and the total porosity measured by MIP test is the ratio of the accumulative mercury volume under maximum pressure to the total sample volume [36]. In the MIP test, the pore size distribution can be described by Equation (1), where ψ(r) is the function of pore size distribution, and it is the percentage of the pore volume with r radius to the total volume of the opened pore; V is the total volume of the opened pore with radius below r; VT0 is the total volume of the opened pore; p is the pressure required to press mercury into the pore with the radius of r; σ is the surface tension, and θ stands for the wetting angle between the porous material and mercury. The average pore diameter can be further obtained from Equation (2) when supposing the pore shape is an opened cylinder; where dmean is the average pore diameter, and S is the total surface area for the pores. Furthermore, the pore diameter d can be related to the applied pressure P, using the Washburn equation [37,38]; as shown in Equation (3), r is the surface tension of mercury (0.485 N/m), and θ is the contact angle between mercury and pore wall (130°).
ψ r = P 2 2 σ c o s θ V T 0 × d V T 0 V d p
d mean = 4 V S
d = 4 r cos θ P
Although the MIP test is commonly utilized to characterize the pore size distribution of porous material, the pore size measured by MIP refers to percolation size of pores (size of pore neck) corresponding to the intruded pressure rather than a real diameter of cylinder tubes [38]. This size notion is different from the real geometry size of pores, such as directly observed by SEM or optical microscopy [38,39].

2.4. Early-Age Performance and Mechanical Strength Determination

The fluidity of cementitious material with various substitution rates of RBP was measured in accordance with Chinese standard GB/T 8077. The initial and final setting time of the RBP-prepared paste were measured referring to Chinese standard GB/T 1346; a Vicat apparatus was employed in testing the setting time, and the w/b ratio of the RBP-prepared paste is designed as 0.5, which is the same with the w/b ratio of the RBP-prepared mortar, as shown in Table 3. The sample with a size of 25 × 25 × 280 mm was employed in measuring the drying shrinkage behavior of the RBP-prepared mortar. The drying shrinkage test was conducted and measured referring to Chinese standard JC/T 603. A comparator was utilized in drying shrinkage test, and the sample length was determined by a dial indicator. The samples after 24 h hardening were placed in the water (20 ± 1 °C) for two days, and then, these samples were taken out from water and the initial length was measured by a comparator. Subsequently, the samples were placed in a curing condition (T = 20 °C ± 3 °C, RH = 50% ± 4%). The drying shrinkage test lasted for 56 d, and the sample length was measured after various drying duration; in this case, the drying shrinkage rate of cementitious materials with various RBP substitution rates can be calculated. The samples with the size of 40 × 40 × 160 mm and 70.7 × 70.7 × 70.7 mm were utilized in determining the flexural and compressive strength of the RBP-prepared mortar, respectively, and an universal mechanical testing machine was employed in mechanical strength determination; moreover, the flexural strength to compressive strength ratio was utilized to evaluate the ductility of cementitious materials with RBA and RBP.

2.5. Water Transport and Chloride Ingress Test

The water transport behavior is a major parameter in evaluating the properties of porous cementitious materials, and it is frequently characterized by a capillary absorption experiment [40,41,42]. The capillary absorption test lasted for 48 h, and the utilized sample was a cube with the side length of 70.7 mm. Equations (4) and (5) show the computational formulas to quantify the water transport in cementitious materials, where ΔW is the mass of absorbed water (g/m2), and Aw is the coefficient of water absorption; t is the duration for water absorption (h); m1 and m0 are the mass of sample before and after water penetration; S is the contact area with water (m2) [43,44]. Moreover, the higher value of Aw manifests the higher water transport rate in cementitious materials.
W = m 1 m 0 / S
W = A W t
Water distribution can be further quantified based on the unsaturated capillary absorption theory [27]. Equations (6)–(9) show the relationship between the relative water content and the water transport depth in cementitious materials, where x stands for the water transport depth; θ is the relative water content with the value of 0–1; s is the relative absorption rate of cementitious materials; A and λ(θ) are the undetermined coefficient; D0 and n are the regression parameter of testing data, and n is generally defined as the value of 4 [45,46].
x = φ t = s + s 2 + 4 A λ θ A t
D 0 = 1 + n 2 + n s 2 3 + 2 n
A = 1 2 2 + n
λ θ = D 0 n 1 θ n
The chloride ingress behavior is evaluated by the test of rapid chloride migration (RCM), and a cylinder sample with 100 mm diameter and (50 ± 2) mm thickness is employed. The RCM test is conducted according to “Standard for test methods of long-term performance and durability of ordinary concrete” (GB/T 50082-2009), as shown in Figure 4c. The used cathode solution is 10% NaCl solution, and the anode solution is 0.3 mol/L NaOH solution; moreover, the temperature of testing environment keeps at 20–25 °C, and the applied voltage ranges up to 60 V [36]. The chloride penetration depth was measured, and chloride diffusion coefficient could be calculated by Equation (10), where Dnssm is the chloride diffusion coefficient (10−12 m2/s); T is the measuring temperature (°C); L is the thickness of the sample (mm); xd is the chloride ingress depth (mm); E is the applied voltage (V); t is the testing duration (h) [47,48].
D nssm = 0.0239 273 + T L E 2 t ( x d 0.0238 273 + T L x d E 2 )

3. Results and Discussion

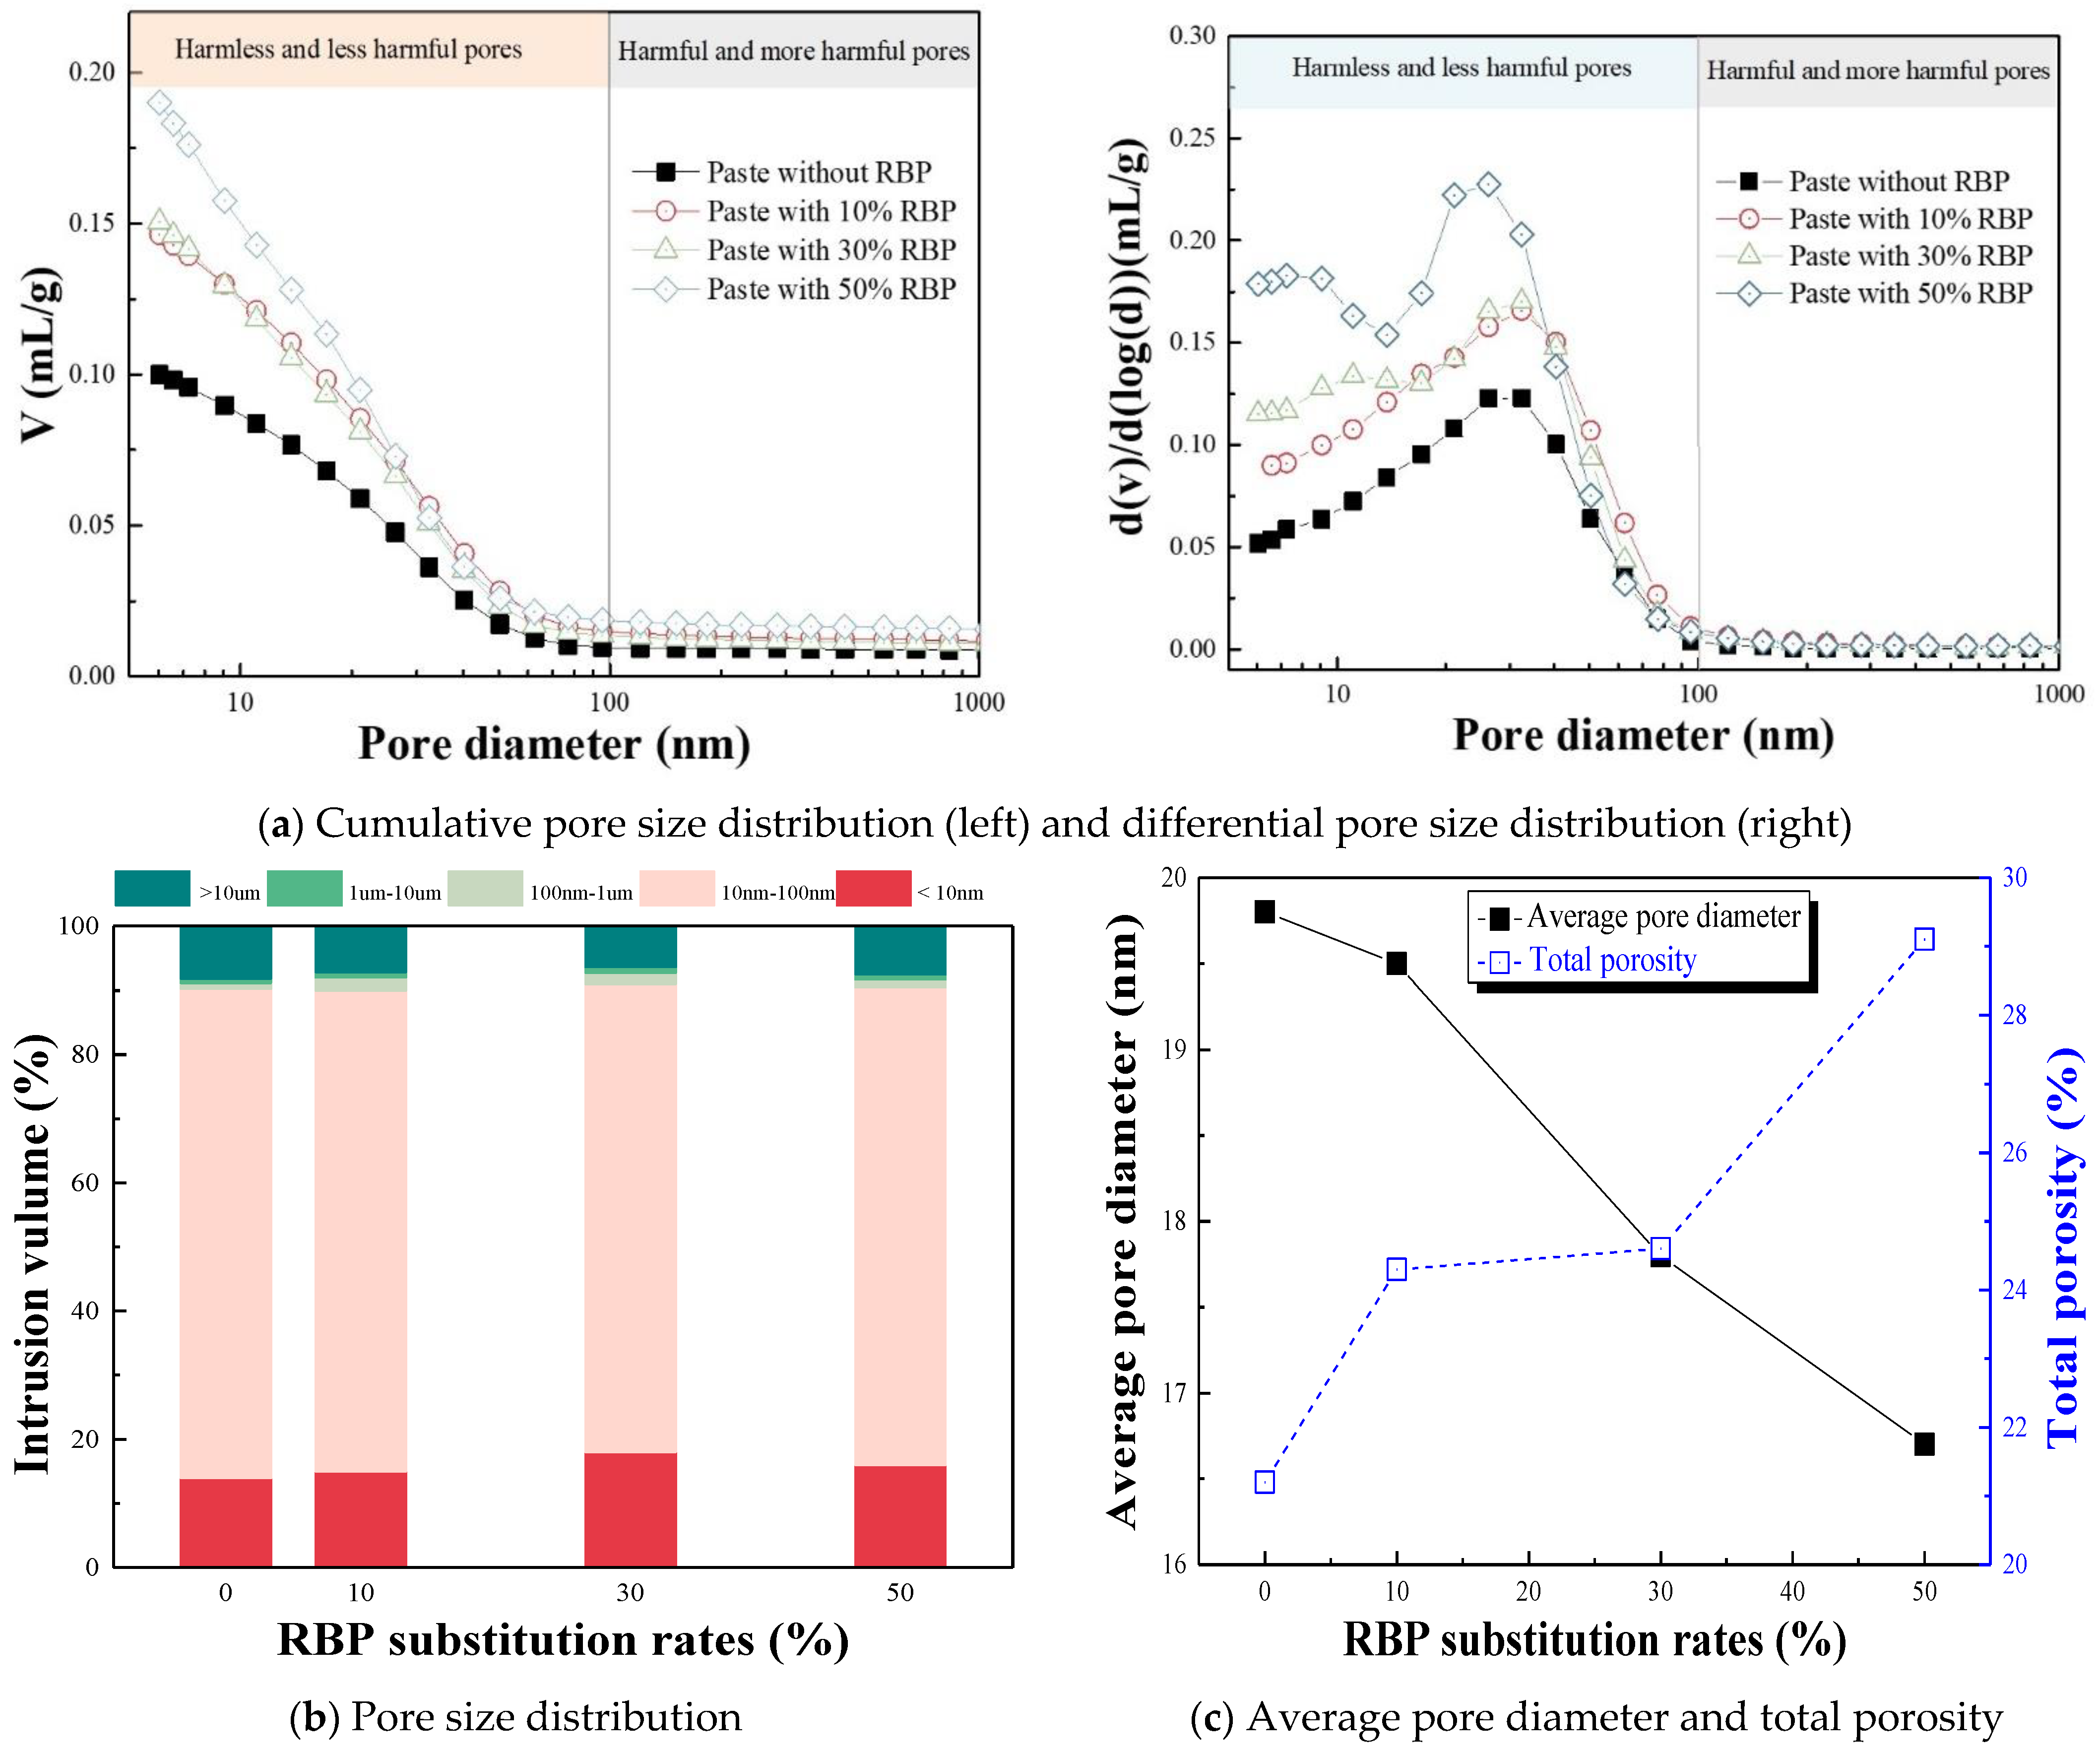
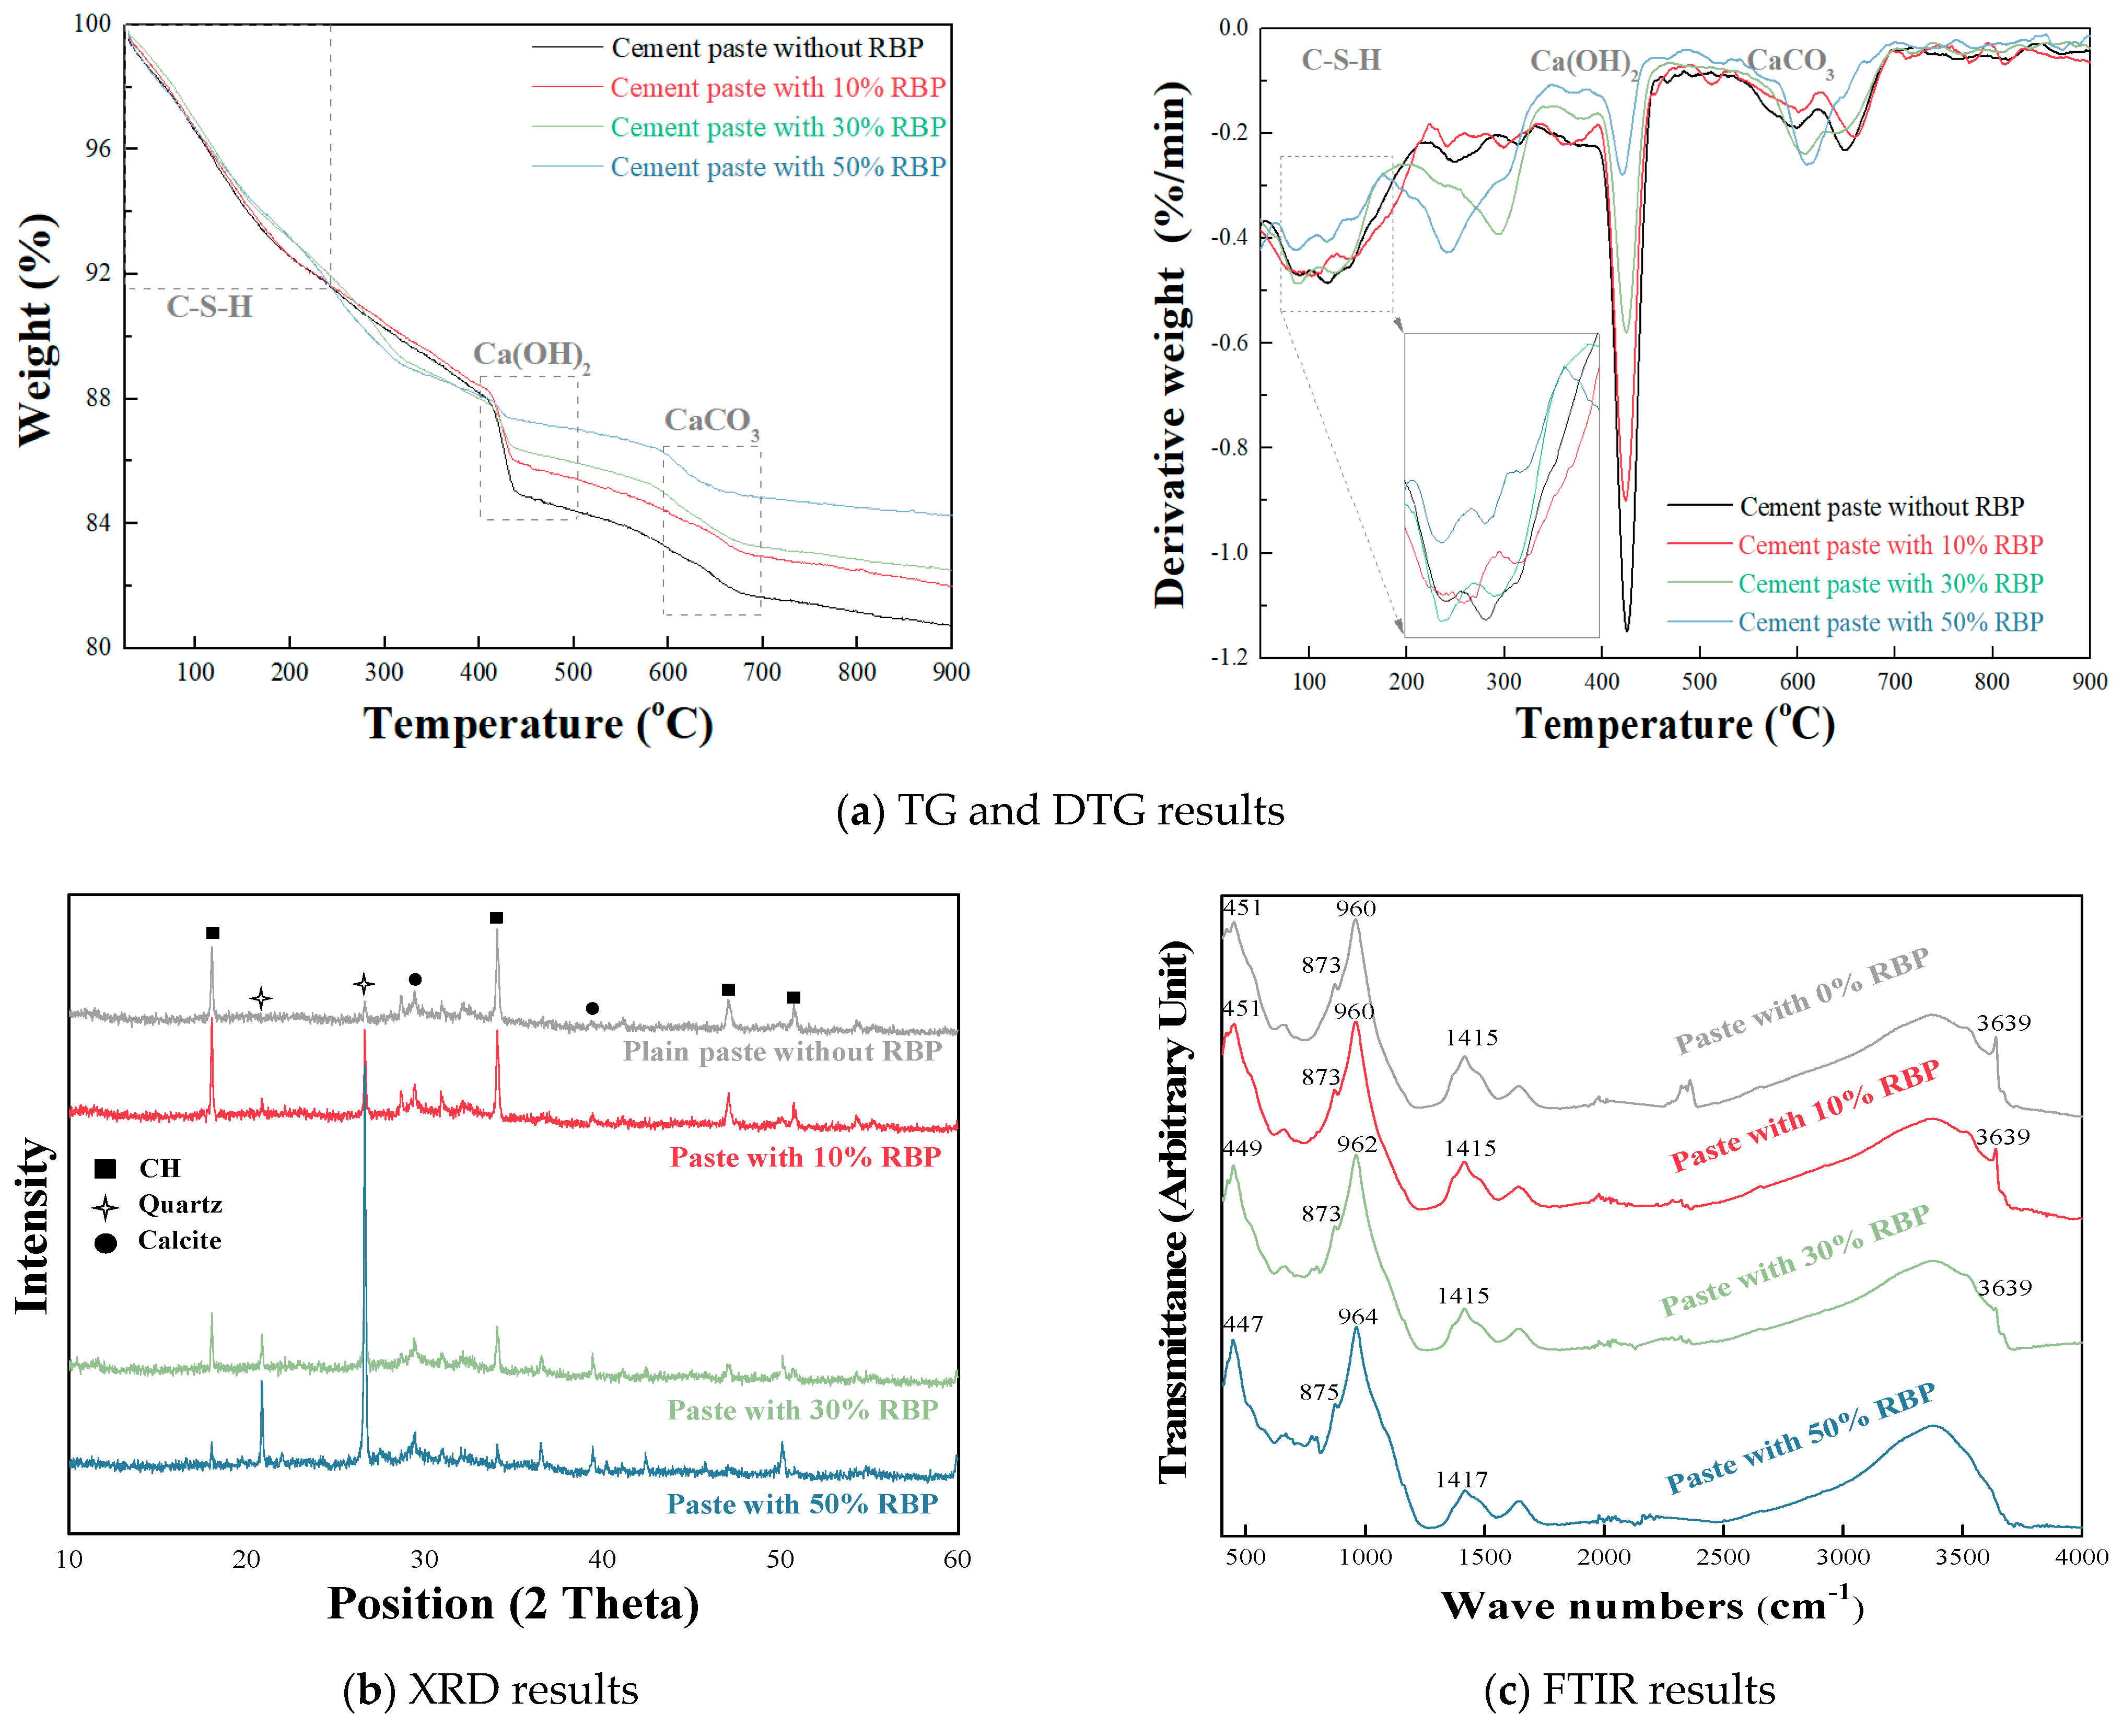
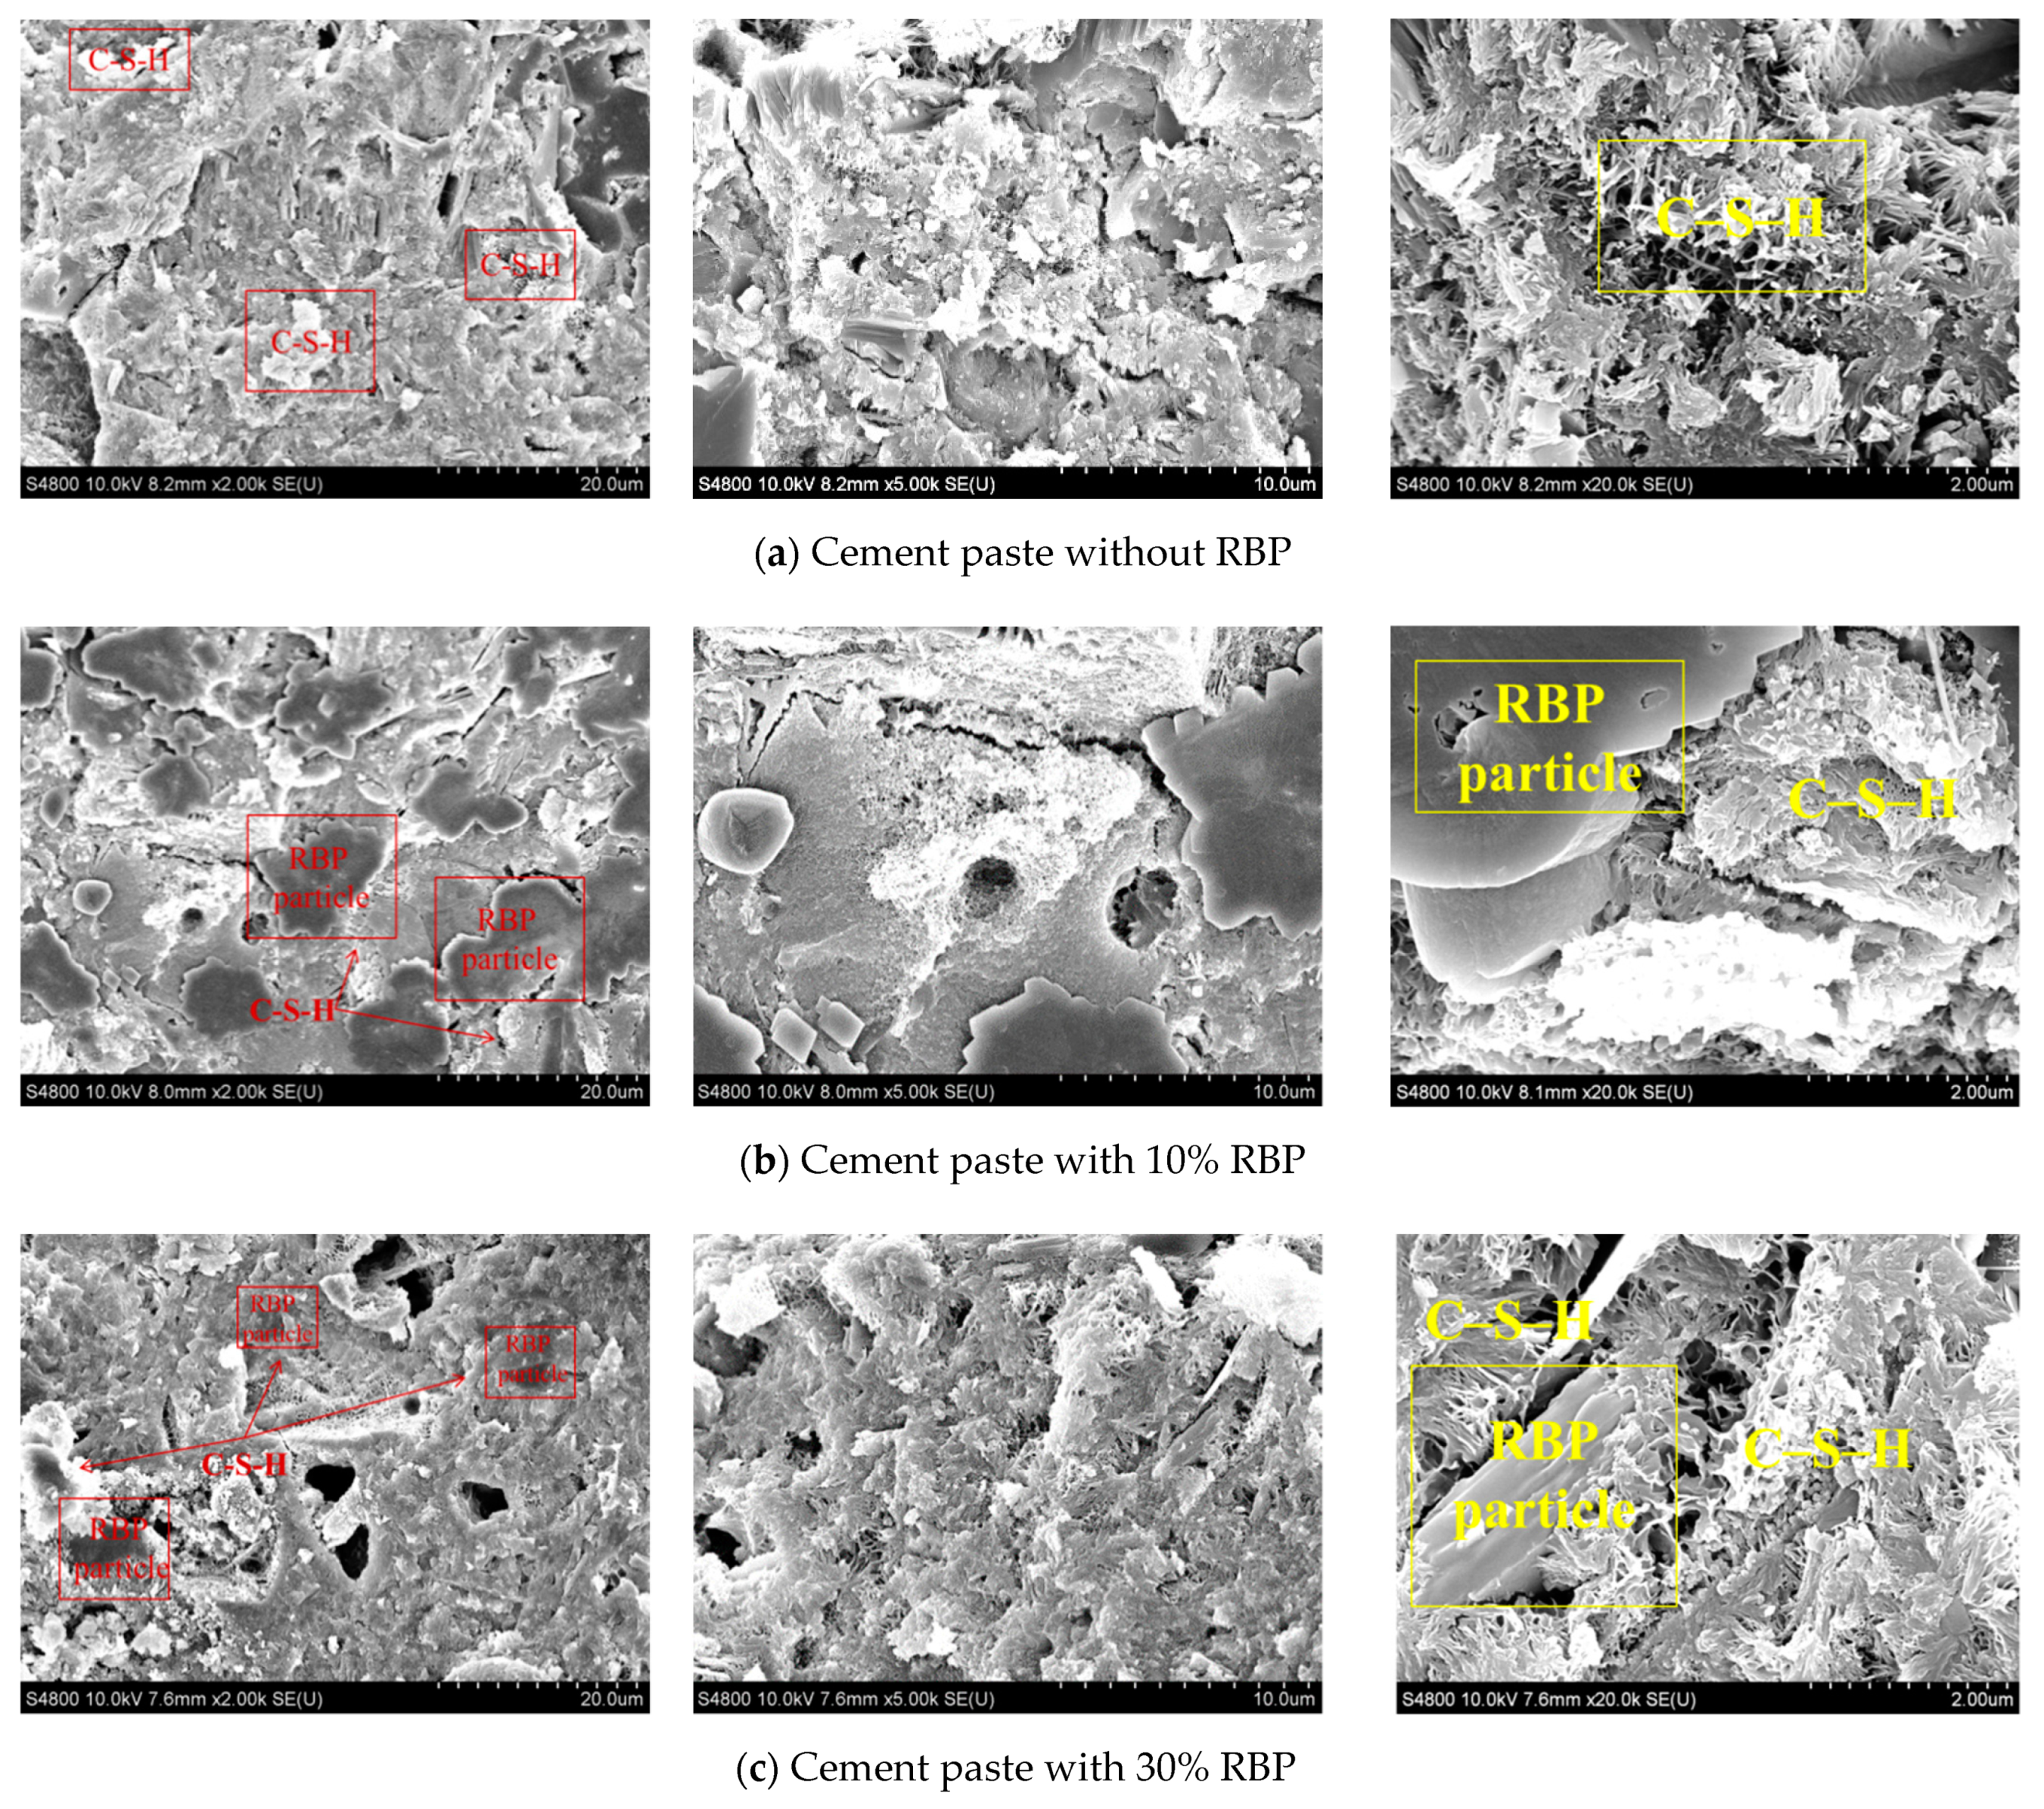
3.1. Pore Structure and Micro-Properties of Cementitious Materials with RBP

The pore structure corresponds to the mechanical strength and transport properties of cementitious materials; therefore, the pore structure of cementitious materials with various RBP substitution rates was determined by MIP test. Figure 5a displays the cumulative and differential pore size distribution of the paste containing various RBP substitution rates by MIP test. The incorporated RBP increases the number of harmless pores and less harmful pores in the prepared paste, which highlights that the utilized RBP refines the pore structure of cementitious materials; moreover, a similar phenomenon was also reported by Ortega et al. [26] and Ma et al. [27]. For one thing, the particle size of RBP is lower than that of cement, and incorporating high fineness RBP promotes the filler effect and refines the pore structure of cementitious composites. For another thing, the high content of silicon oxide and aluminum oxide in RBP promotes the pozzolanic activity, which further improves the pore structure of cementitious composites [24,27]. Compared with the cumulative and differential pore size distribution of cement paste with various substitution rates of fly ash, the effects of RBP and fly ash substitution rates on the pore size distribution curves of cementitious materials are similar, as reported by Zeng et al. [38].
Figure 5b gives the pore size distribution of the RBP-prepared paste by MIP test. The results show that the percentages of harmless pores and less harmful pores increase, while the percentages of harmful pores and more harmful pores decrease with RBP substitution. Further, the utilized RBP refines the pore structure and improves the permeability resistance. In particular, the percentage of capillary pores (10–100 nm) in cementitious materials is decreased as RBP incorporates, and thus, it can be expected that the utilized RBP improves the water absorption resistance of cementitious materials. Zhao et al. [25] and Ortega et al. [26] also found that more pores were refined for the cementitious materials as RBP incorporated, and the utilized RBP increased the relative percentage of the pore below 100 nm.
Figure 5c further shows the average pore diameter and total porosity by the MIP test. The utilized RBP leads to the reduction in average pore diameter; for instance, the average pore diameter of paste with 0, 10, 30 and 50% RBP is 19.8, 19.5, 17.8 and 16.7 nm. This is because the utilized RBP refines the pore structure of cementitious materials. However, Figure 5c also manifests that the incorporated RBP increases the total porosity of cementitious materials, resulting from the reduction in the hydration products amount with RBP incorporation; a similar phenomenon characterized by MIP test was also reported by Zhao et al. [25] and Ortega et al. [26]. Furthermore, previous findings show that both the increased fineness of RBP and the prolonged curing duration can improve the filler and pozzolanic activity, and thereby, pore structure is better refined, and the adverse impact of the reduction in hydration products is alleviated after a long-time curing [24,25,26,27].
Figure 6a shows the TG and DTG results to characterize the hydration reaction of cementitious materials with RBP. The C–S–H gel and ettringite begin to decompose when the temperature reaches 200 °C, and the peak value of C–S–H gel in cement paste decreases with increasing the substitution rate of RBP because the RBP contains much lower content of calcium oxide than cement. When the temperature ranges from 350 to 500 °C, the content of portlandite in the RBP-prepared paste has a similar phenomenon, that is, the content of portlandite decreases with the incorporation of RBP. When the temperature ranges from 700 to 800 °C, the peak value of calcite of the RBP-prepared paste is lower than that of common paste without RBP. Therefore, the utilized RBP decreases the amount of hydration products in cementitious materials, and the decrease is obvious with high-volume RBP incorporating.
Figure 6b shows the mineral composition of paste with various RBP contents by XRD test. An obvious increase in the quartz content occurs with the RBP substitution. However, the content of CH and calcite decreases with the increasing substitution rates of RBP, and an obvious reduction in CH and calcite occurs when the RBP substitution rate is above 30%, which further proves that the substituting RBP decreases the amount of hydration products in cementitious materials. Figure 6c further shows the FTIR results for the paste with various substitution rates of RBP. A slight increase in the stretching vibration frequency of C–S–H occurs with the increasing substitution rates of RBP, which highlights that the mixed RBP increases the hydration degree of cementitious materials [49,50]. Furthermore, the stretching vibration area of CH decreases with the RBP incorporation, and the reduction in CH content is significant when the RBP content is 50%.
Figure 7 shows the micro-structure of the paste containing various substitution rates of RBP, and the hydration degree of the paste with RBP is higher than that of common paste without RBP. This is because the pozzolanic activity of RBP makes more hydratable components (such as calcium hydroxide) react further with RBP, and in this case, the hydration degree of cementitious materials is promoted as RP substitution rates increase. Seeing the SEM images for the RBP-prepared paste, the RBP particles are surrounded with C–S–H gel, and these quartz micro-particles have relatively high micro-hardness and dense micro-structure; in this case, the filler effect is promoted [25,51].

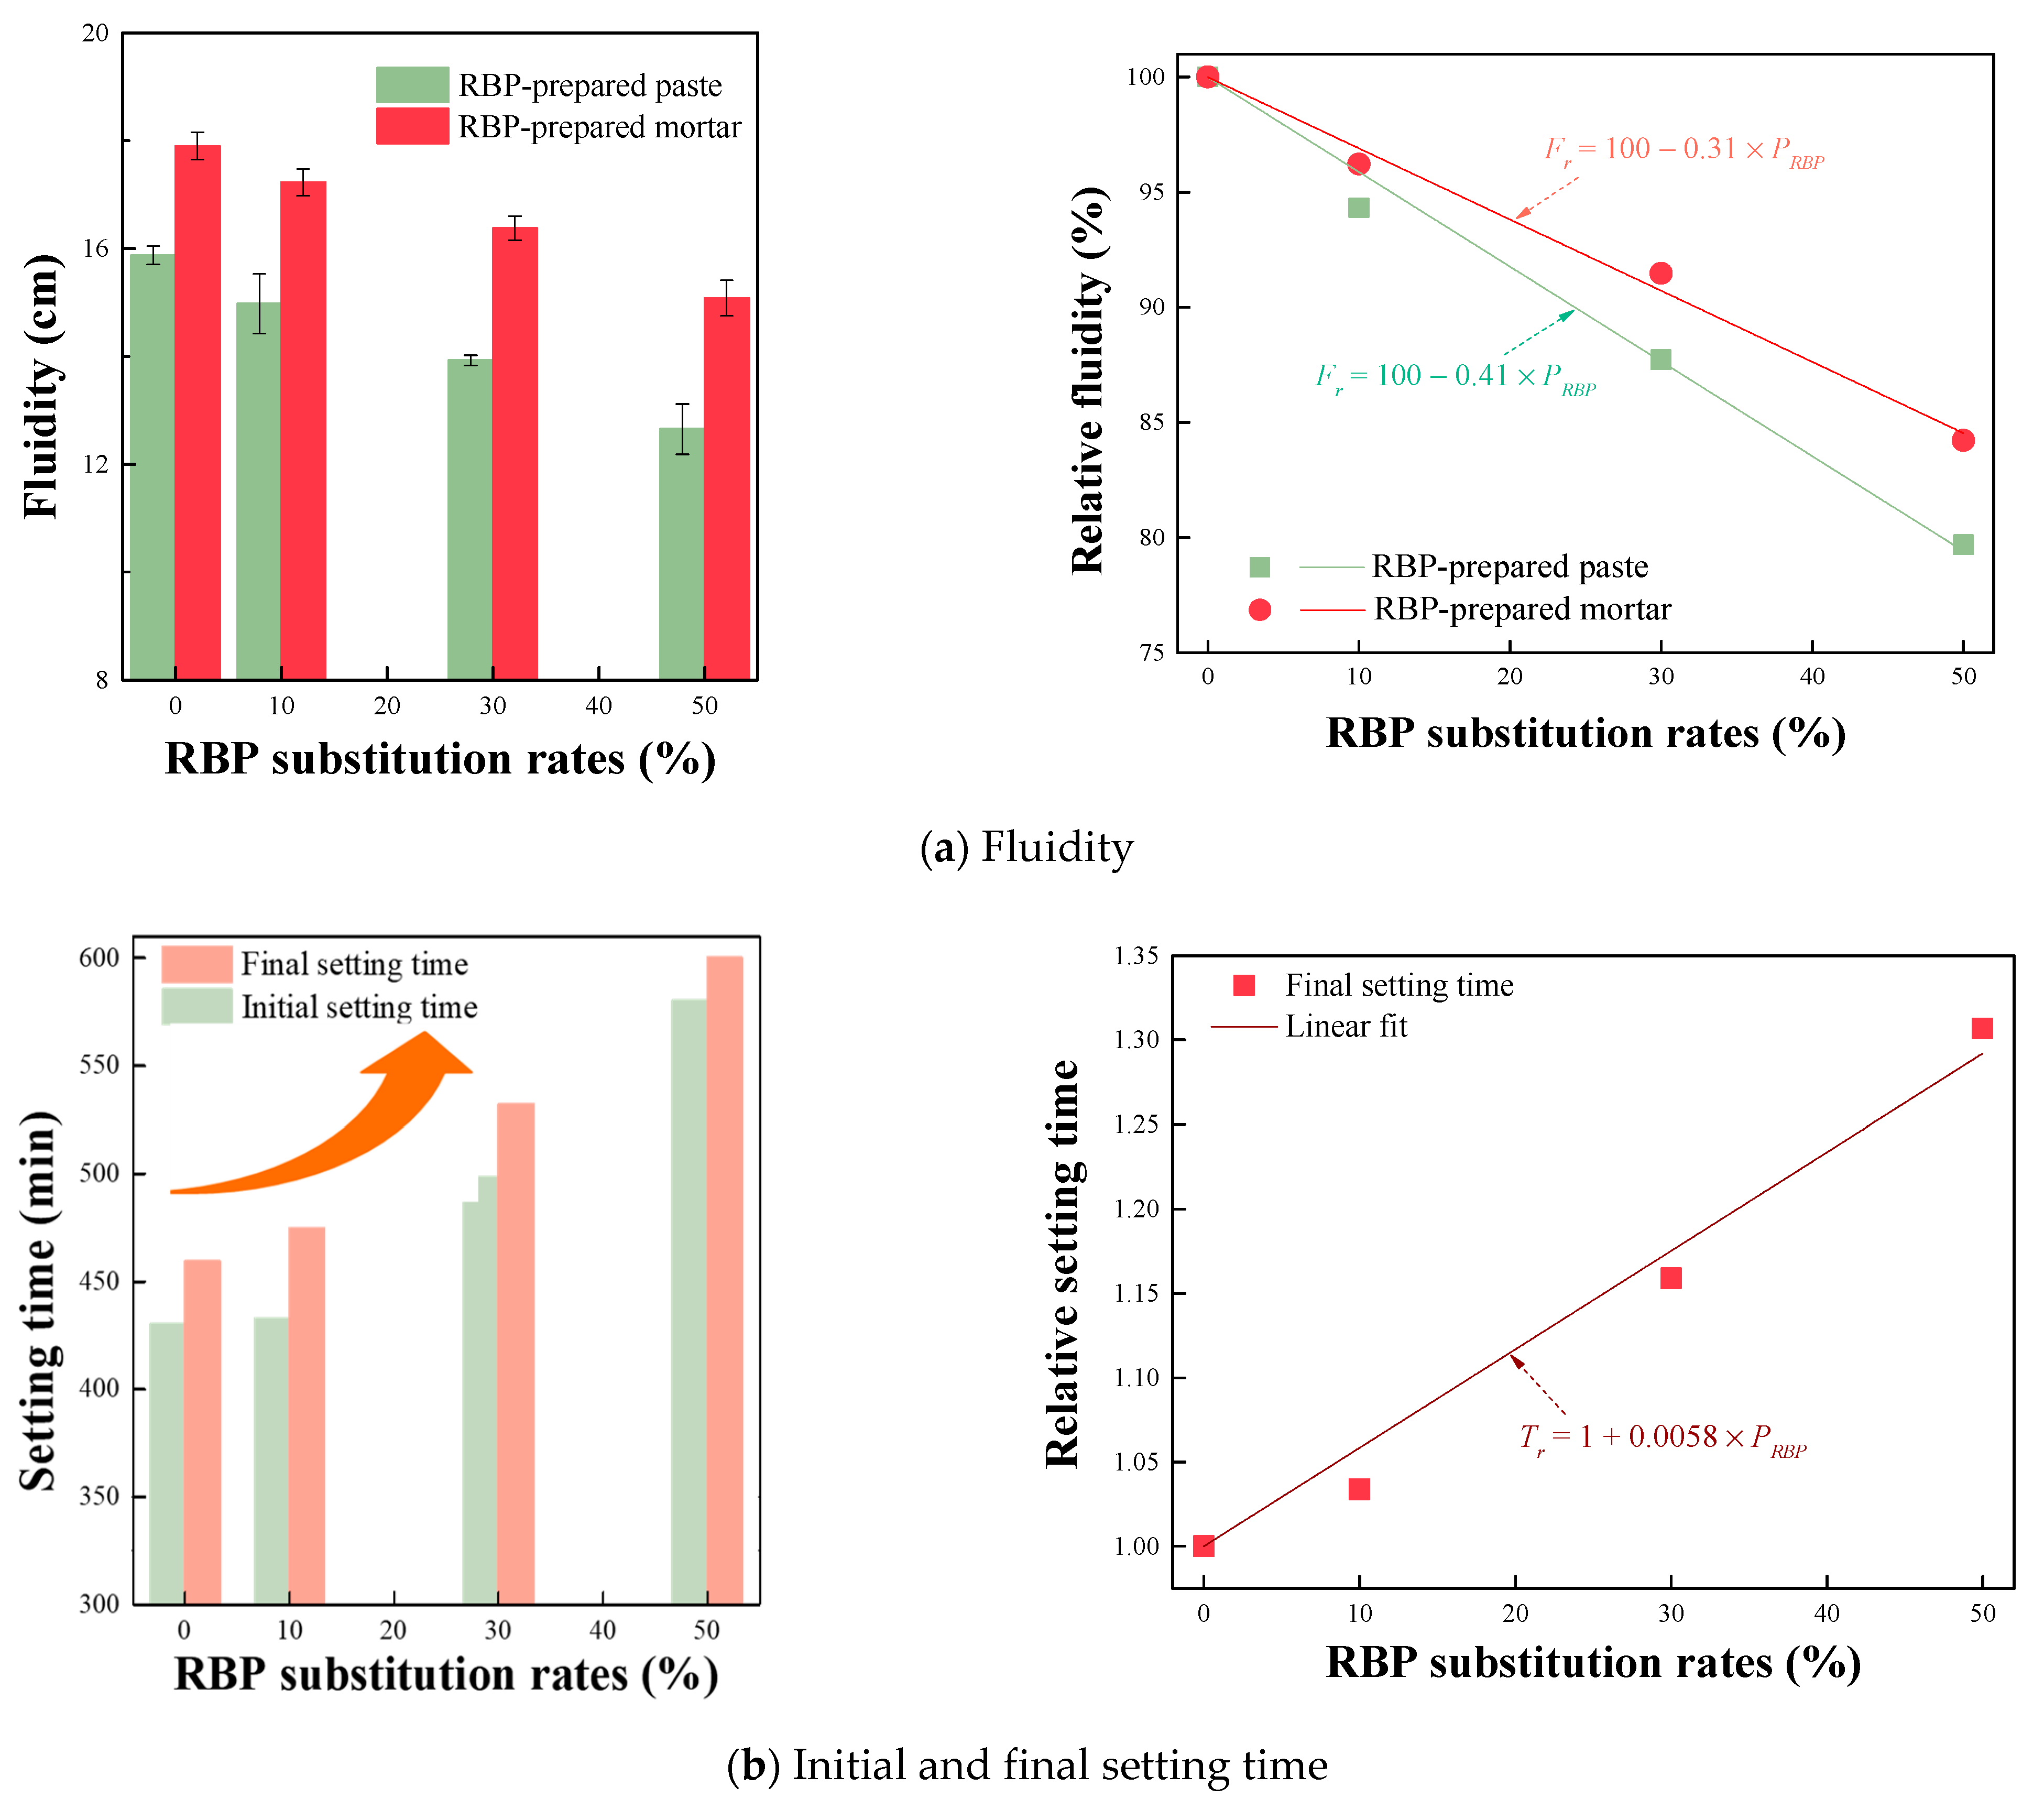
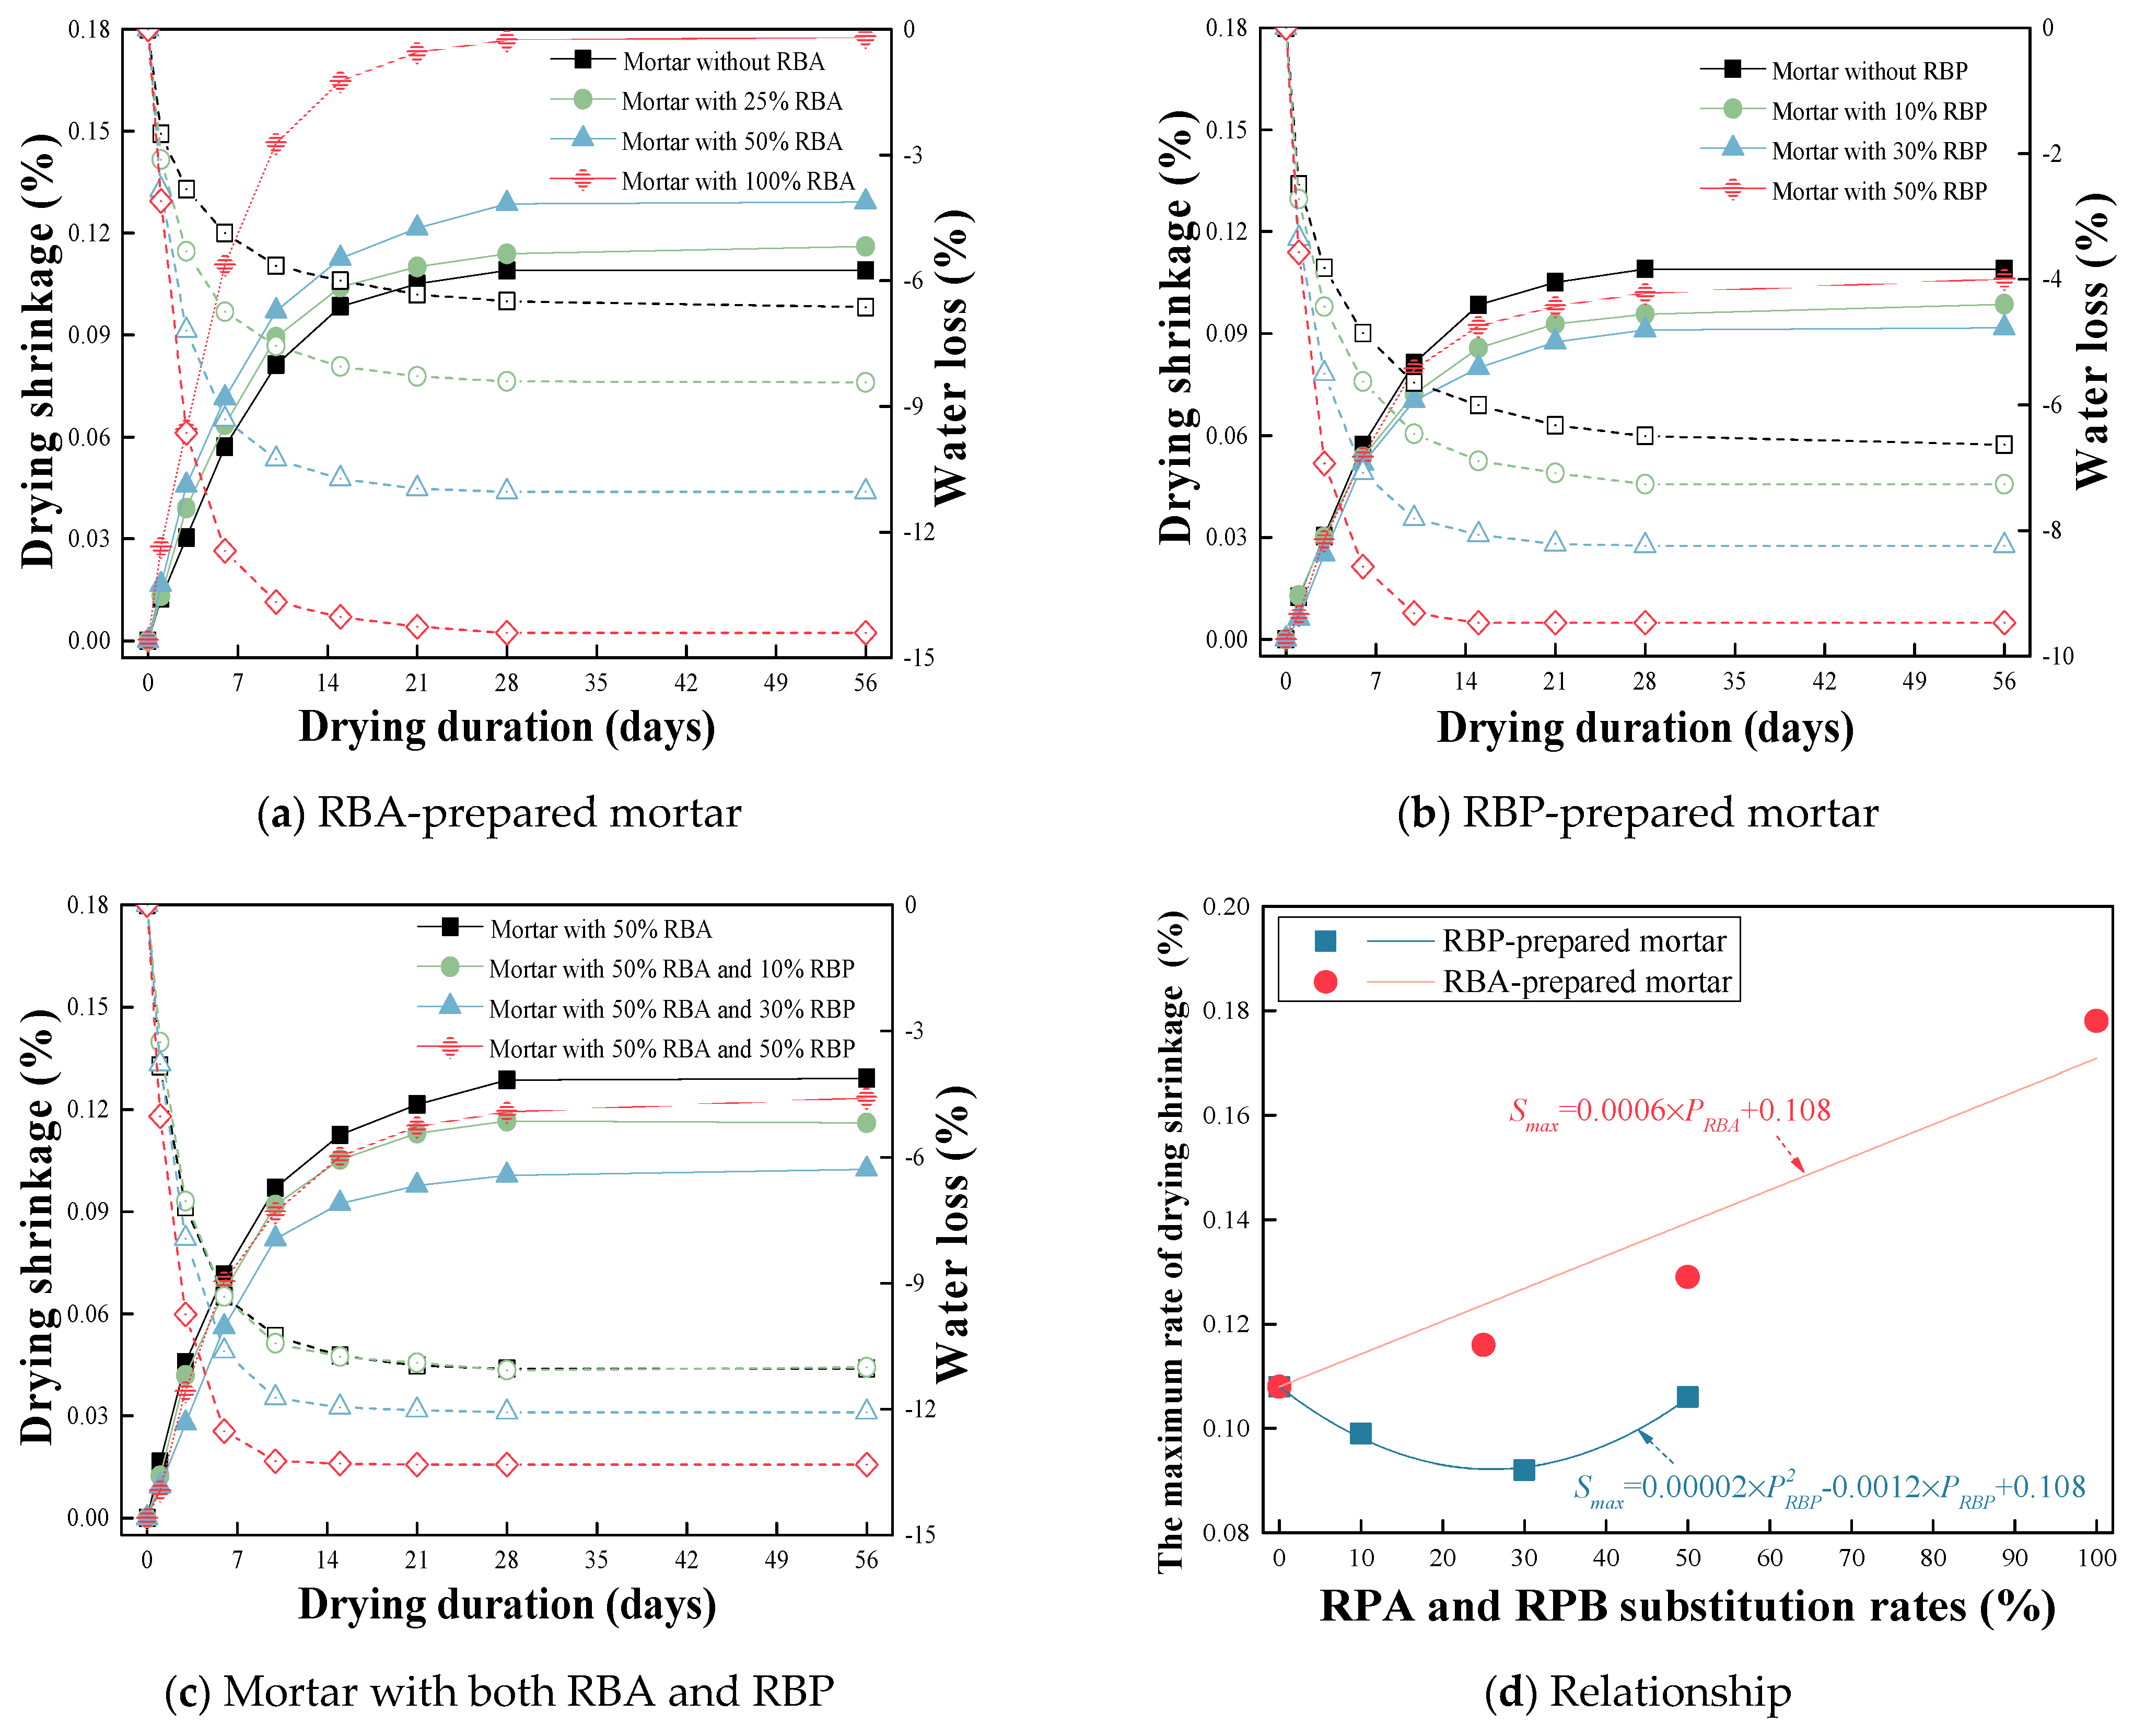
3.2. Early-Age Performance of Cementitious Materials with RBA and RBP

Fluidity is a key parameter in evaluating the workability of cementitious materials, and Figure 8a gives the fluidity of cementitious materials with various substitution rates of RBP. The results show that the fluidity of cementitious materials decreases with the increased substitution rates of RBP. For instance, the fluidity of cement paste with 10, 30 and 50% RBP is 5.7, 12.3 and 20.3% lower than that of common paste without RBP, and the fluidity of cement mortar with 10, 30 and 50% RBP is 3.8, 8.5 and 15.8% lower than that of common mortar without RBP. This is because the RBP has irregular micro-structure and high water absorption, causing more free water to be absorbed and fluidity to decrease [27,52]. Moreover, the particle size of RBP is lower than that of cement, and the increased specific surface area further decreases the fluidity of the prepared mixture. Figure 8a further shows a correlation between the relative fluidity of cementitious materials and the RBP substitution rates, and a linear relationship exists between them. The fitting slope for the RBP-prepared paste is greater than that for the RBP-prepared mortar, and it manifests that the impact of RBP substitution rates on the fluidity of cement paste is more obvious than that of cement mortar, and this is because the RBP proportion in cement paste is higher than that in cement mortar. The equation in detail is also displayed in Figure 8a, where Fr stands for the relative fluidity of cement paste and mortar (%), and PRBP is the substitution percentage of RBP (%).
Figure 8b shows the setting time of cement paste with various substitution rates of RBP, and incorporating RBP increases the initial and final setting time. For example, the initial setting time of cement paste with 10, 30 and 50% RBP is 0.6, 15.8 and 34.8% higher than that without RBP, and the final setting time of cement paste with 10, 30 and 50% RBP is 3.4, 15.9 and 30.7% higher than that without RBP, respectively. This is because the utilized RBP decreases the content of hydratable oxide (such as CaO, C2S and C3S) in cement paste, and more free water is provided for hydration reaction in cementitious materials with the RBP incorporation, then prolonging the setting time of cementitious materials. Figure 8b further shows a correlation between the relative final setting time and the RBP substitution rates of cementitious materials, and a linear relationship exists between them. The detailed equation is also described in this figure; where Tr is the relative final setting time of cementitious materials, and PRBP is the substitution rate (%).
Drying shrinkage behavior is the main parameter for evaluating the early-age performance of cementitious materials, and Figure 9 gives the drying shrinkage curves of cement mortar with RBA and RBP. Figure 9a shows the drying shrinkage and water loss of the RBA-prepared mortar, the incorporated RBA increases the drying shrinkage of cement mortar, and a significant increase occurs when the RBA substitution rate is 100%; for example, the maximum drying shrinkage of mortar with 25, 50 and 100% RBA is 6.5 %, 18.6 and 63.1% higher than that of common mortar without RBA, respectively. A similar conclusion can also be drawn from the water loss results of the RBA-prepared mortar, and the maximum water loss of mortar with 25–100% RBA is 27.1–117.1% higher than that of common mortar without RBA. This is because RBA with high water absorption can obtain more free water, which leads to an increase in the drying shrinkage of the prepared mortar. Additionally, the existence of aggregate helps restrict the drying shrinkage of cementitious materials; however, the hardness of RBA is lower than that of natural sand, and thus, the decreased hardness of RBA further increases the drying shrinkage of the prepared mortar.
Since Figure 9b displays the drying shrinkage of cement mortar with RBP, the drying shrinkage behavior of the RBP-prepared mortar is lower than that of common mortar, and the mortar incorporating 30% RBP has the lowest drying shrinkage. For example, the drying shrinkage of mortar with 10, 30 and 50% RBP is 9.5, 15.9 and 2.7% lower than that of common mortar. This is because the incorporated RBP decreases the drying shrinkage by improving the pore structure of cementitious materials. In addition, the hydration reaction and its products decease with RBP incorporating, which results in the reduction in the autogenous shrinkage of cementitious materials; therefore, the total drying shrinkage further decreases. Yu et al. [53] found that the autogenous shrinkage of cementitious materials with 50% recycled powder was 50.6% lower than that without recycled powder. However, incorporating high-volume RBP leads to a significant reduction in mechanical strength and an obvious increase in the total porosity, which further decreases the drying shrinkage resistance; therefore, the drying shrinkage of mortar with 50% RBP becomes higher than that of mortar with 30% RBP and the common mortar without RBP. Figure 9b also gives the water loss of the RBP-prepared mortar, and the water loss increases with the RBP substitution; for instance, the water loss of mortar with 10, 30 and 50% RBP is 9.5, 24.2 and 42.7% higher than that without RBP. This is because the utilized RBP decreases the hydratable oxide in cementitious materials, and free water content increases and evaporation loss from the mortar increases with RBP incorporation.
Figure 9c gives the drying shrinkage and water loss of mortar incorporating both RBA and RBP. Although the RBA incorporation increases the drying shrinkage, the utilized RBP decreases the drying shrinkage of mortar. It can be expected that the cementitious materials with appropriate RBA and RBP substitution rates may have the lower drying shrinkage than plain cementitious materials without RBA and RBP. For example, the maximum drying shrinkage of mortar with 50% RBA and 30% RBP is 6.0% lower than that of common mortar without RBA and RBP. Figure 9d further shows the relationship between the maximum drying shrinkage and the RBA (or RBP) substitution rates. A linear relationship exists between the maximum drying shrinkage and RBA replacement ratios, and a binomial relationship exists between the maximum drying shrinkage and RBP substitution rates. The detailed equation is also displayed in this figure, where the Smax is the maximum drying shrinkage, and the PRBA and PRBP are the substitution percentages of RBA and RBP (%).

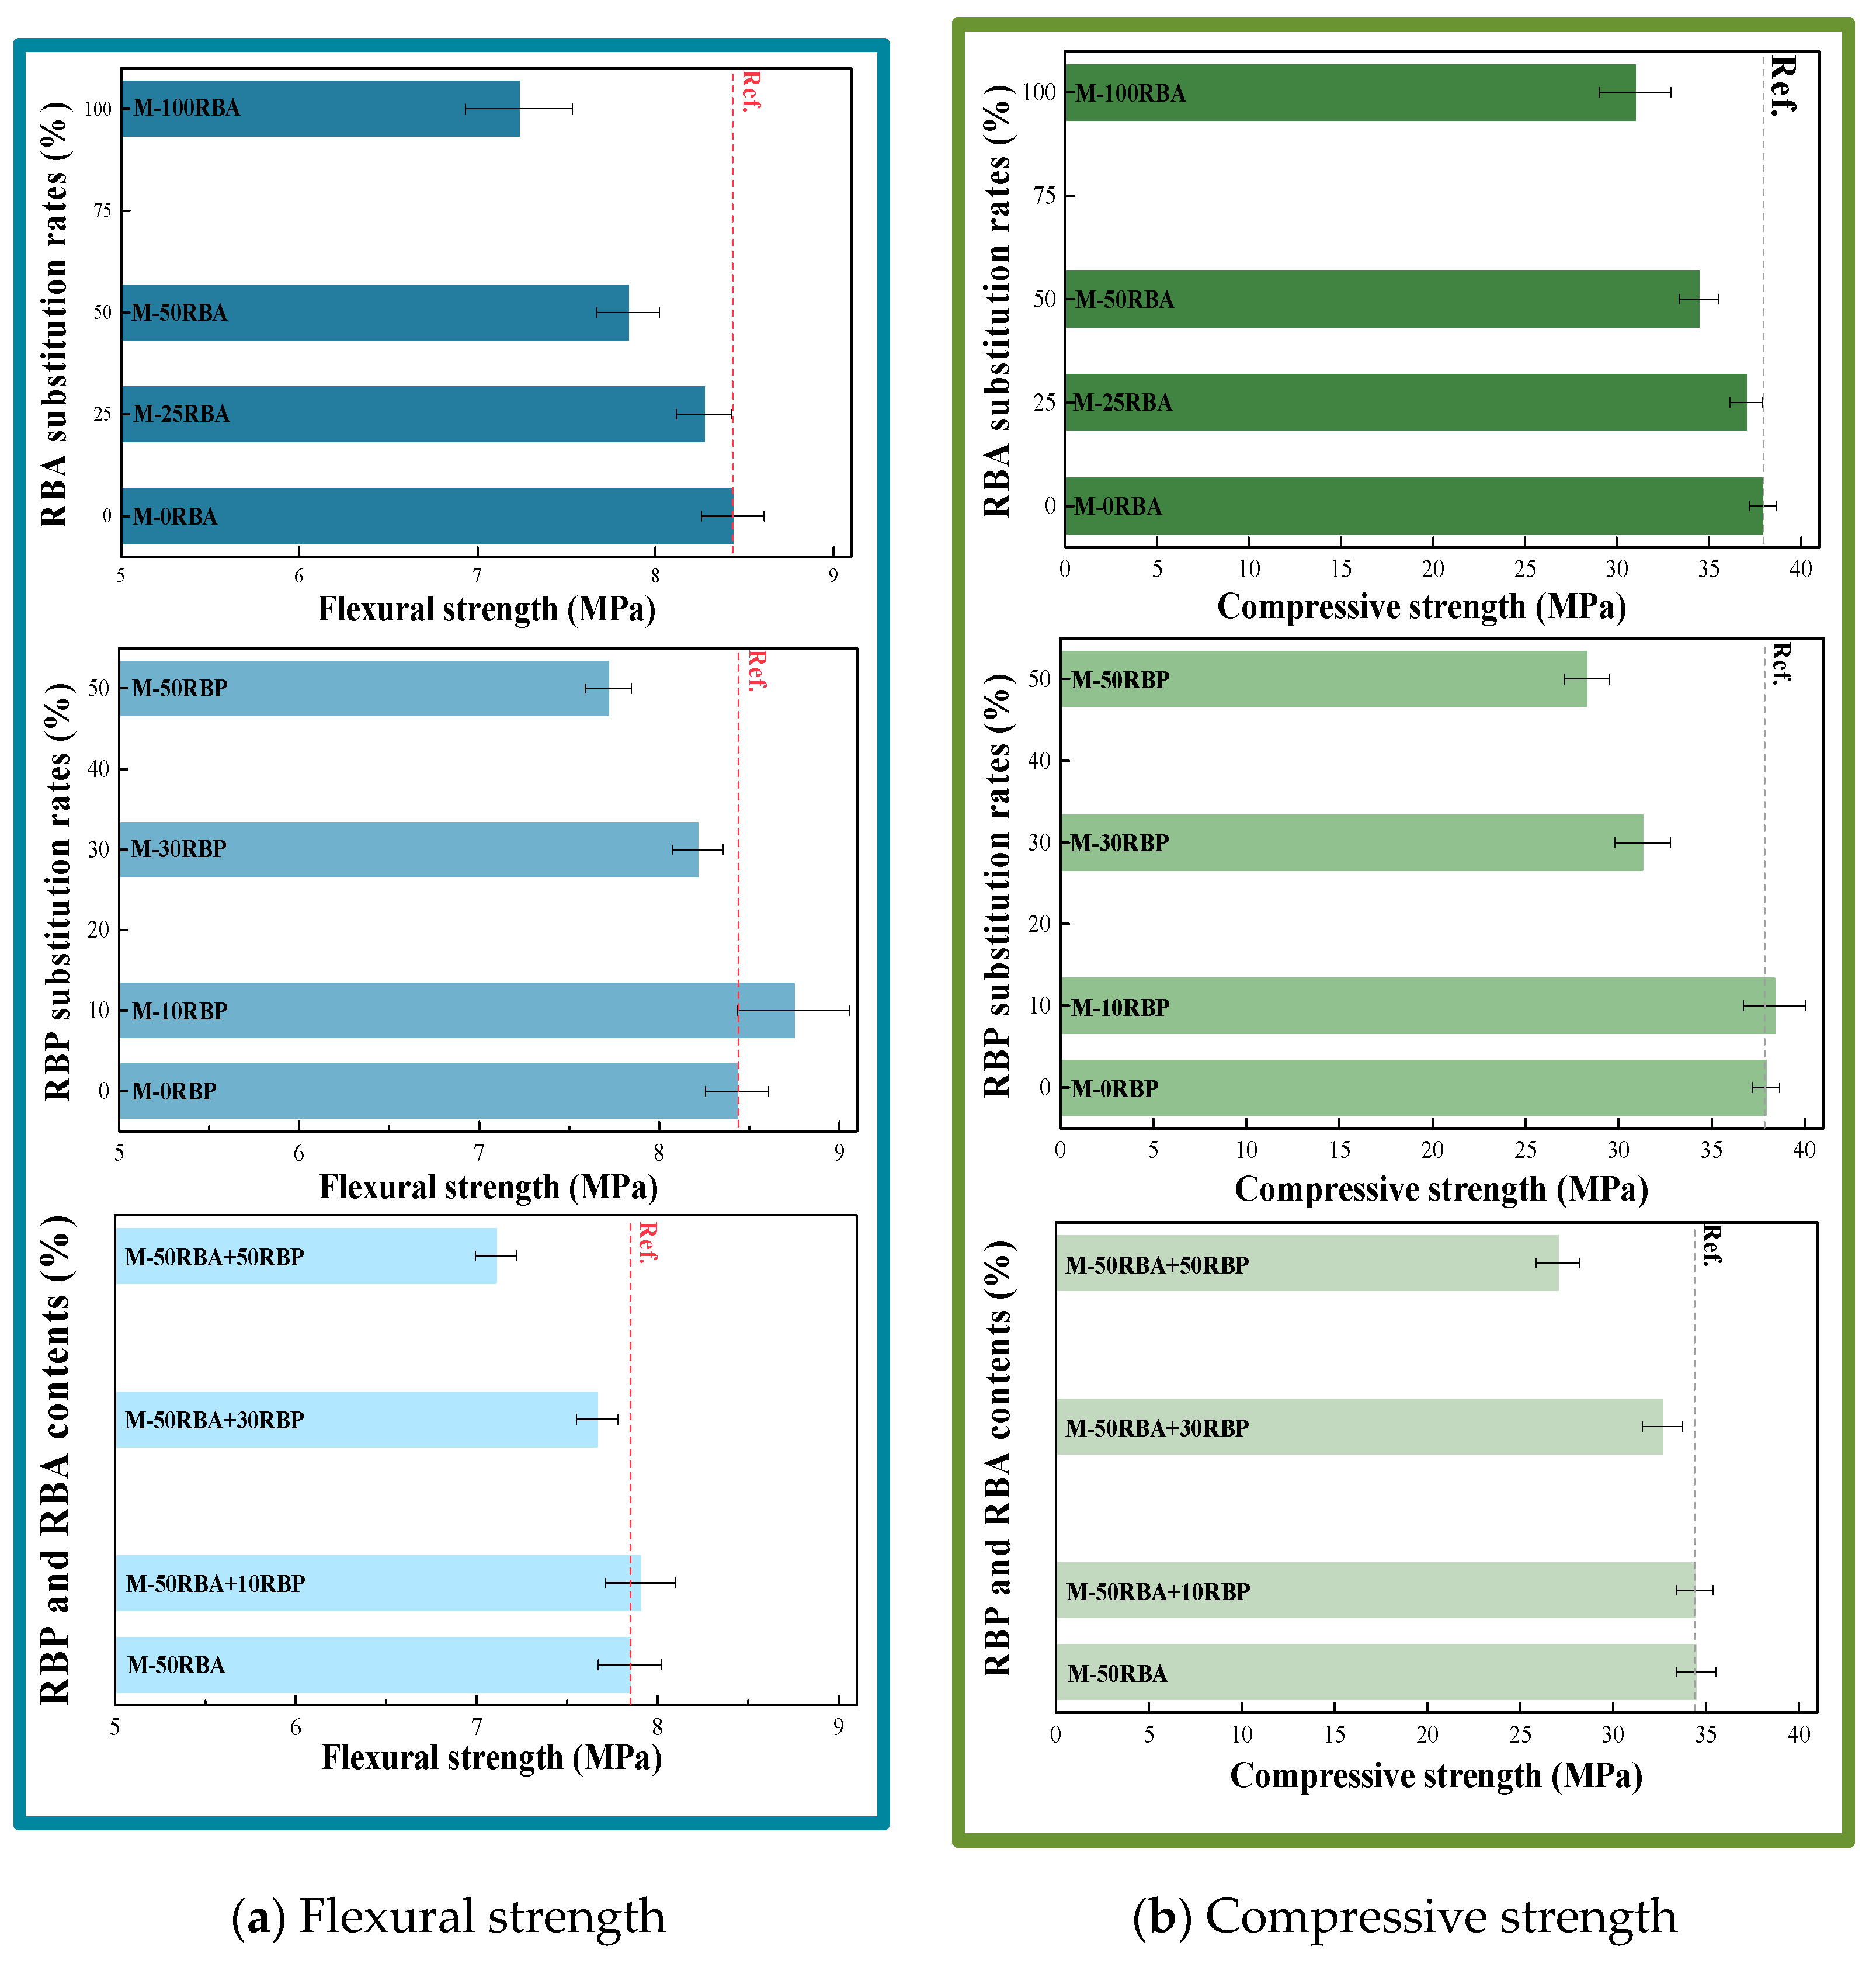
3.3. Mechanical Properties of Cementitious Materials with RBA and RBP

This section investigates the effects of RBA and RBP incorporating on the mechanical strength of the prepared mortar. Figure 10 shows the mechanical strength of mortar with various RBA substitution rates. The incorporated RBA decreases the flexural and compressive strength, and a similar conclusion is also obtained by some previous scholars [54,55,56]. For example, the flexural strength of M-25RBA, M-50RBA and M-100RBA is 1.9, 6.9 and 14.2% lower than that of M-0RBA, and the compressive strength of M-25RBA, M-50RBA and M-100RBA is 2.4, 9.1 and 18.3% lower than that of M-0RBA. This is because the RBA properties are lower than the natural aggregate properties. However, because the RBA with saturated surface dry contains some free water, the free water provides an internal curing effect and helps the ITZ properties [23]; therefore, the reduction in mechanical strength is not significant with RBA incorporation.
Figure 10 also shows the mechanical strength of mortar with various RBP substitution rates. There is a slight increase in the flexural strength and compressive strength when the RBP substitution rate is 10%; for example, the flexural strength and compressive strength of M-10RBP is 3.7 and 1.2% higher than these of M-0RBP. The active RBP promotes the pozzolanic and filler effects of cementitious materials, which helps the mechanical strength. However, the mechanical strength of the RBP-prepared mortar is lower than that of common mortar when RBP substitution rates are above 30%. For instance, the flexural strength of M-30RBP and M-50RBP is 2.6 and 8.5% lower than that of M-0RBP, and the compressive strength of M-30RBP and M-50RBP is 17.5 and 25.4% lower than that of M-0RBP. Incorporating high-volume RBP leads to a significant reduction in hydration products, and the adverse effect of the decreased hydration products is greater than the positive effect of the improved pozzolanic effect in cementitious materials with RBP incorporation, eventually decreasing the mechanical strength. Figure 10 further shows the mechanical strength of mortar with both RBA and RBP. Although the incorporation of RBA and RBP decreases the mechanical strength, there is no significant decrease in the mechanical strength of the mortar with 50% RBA and 30% RBP, and the decrease in the flexural strength is less than that in the compressive strength. For example, the flexural strength of M-50RBA, M-50RBA+10RBP, M-50RBA+30RBP and M-50RBA+50RBP is 6.9, 6.3, 9.1 and 15.7% lower than that of M-0RBA, and the compressive strength of M-50RBA, M-50RBA+10RBP, M-50RBA+30RBP and M-50RBA+50RBP is 9.1, 9.3, 13.9 and 28.8% lower than that of M-0RBA.
Figure 11 shows flexural strength to compressive strength ratio for the mortar with RBA and RBP. The results show that the flexural strength to compressive strength ratio is in direct proportion to the RBA (or RBP) substitution rates, which highlights that the utilized RBA and RBP improve the toughness of cementitious materials. However, the fitting straight slope for the RBP-prepared mortar is higher than that for the RBA-prepared mortar, and thus, the improvement of toughness with RBP incorporation is greater than that with RBA incorporation. The detailed equation is also described in Figure 11, where the ft/fc is the flexural strength to compressive strength ratio, and the PRBA and PRBP are the substitution percentages of RBA and RBP in cementitious materials.

3.4. Water and Chloride Transport into Cementitious Materials with RBA and RBP

This section studied the influence of RBA and RBP incorporation on the transport properties of cementitious materials. Figure 12a gives the capillary absorption curves of cement mortar containing various RBA substitution rates. The incorporated RBA increases the water transport in cementitious materials, and a significant increase in the water transport occurs when the RBA substitution rate is above 50%; for example, the capillary absorption coefficient of M-25RBA, M-50RBA and M-100RBA is 10.9, 67.0 and 161.9% higher than that of M-0RBA, and the maximum absorbed water of M-25RBA, M-50RBA and M-100RBA is 5.5, 49.1 and 98.2% higher than that of M-0RBA. This is because the porosity and water absorption of RBA are much higher than these of natural sand, leading to the increase in the water transport behavior with RBA incorporation. Figure 12b shows the water transport in cement mortar with various RBP substitution rates. When the RBP substitution rate is below 30%, the utilized RBP decreases the water transport in cementitious materials; for example, the capillary absorption coefficient of M-10RBP and M-30RBP is 13.4 and 35.5% lower than that of M-0RBP. Ma et al. [27] reported a similar phenomenon, and the improved RBP fineness further helps decrease the water absorption of cementitious materials. Because of the pozzolanic and filler effects of RBP, the utilized RBP refines the pore structure of cementitious materials, which further decreases the water transport behavior. However, the water transport behavior of mortar with 50% RBP becomes higher than that of common mortar; for instance, the capillary absorption coefficient and the maximum absorbed water of M-50RBP are 26.1 and 7.3% higher than these of M-0RBP. This is because incorporating high-volume RBP is adverse to the hydration reaction and increases the total porosity of cementitious materials; in this case, the adverse effect of the decreased hydration products is greater than the positive effects of the pozzolanic activity with high-volume RBP incorporating, which results in the higher water transport behavior of M-50RBP compared with M-0RBP.
Figure 12c shows the absorption curves of mortar with both RBA and RBP. Although the mortar with 50% RBA has the higher water transport behavior than the common mortar, the water transport behavior of mortar with 50% RBA and 30% RBP becomes slightly lower than that of the common mortar. However, the water absorption behavior of mortar with 50% RBA and 50% RBP becomes higher than that of the common mortar. For example, the capillary absorption coefficient of M-50RBA, M-50RBA+10RBP, M-50RBA+30RBP and M-50RBA+50RBP is 67.0% higher, 18.9% higher, 2.9% lower and 94.1% higher than that of M-0RBA. Therefore, incorporating appropriate substitution rates of RBA and RBP causes the water absorption behavior of mortar with both RBA and RBP to be close to or even lower than that without RBA and RBP. Figure 12d further shows the correlation between the water transport behavior and the substitution percentages of RBA (or RBP). The capillary absorption coefficient increases linearly as the RBA substitution rate increases; however, there exists a binomial relationship between the capillary absorption coefficient and the RBP substitution rates, and the cement mortar containing approximately 30% RBP has the lowest capillary absorption coefficient among the mortar with other RBP replacement ratios. The detailed equation is displayed in this figure, where Aw is the capillary absorption coefficient of mortar with RBA and RBP (g/m2h1/2), and the PRBA and PRBP are the substitution percentages of RBA and RBP (%).
Based on the Equations (3)–(6), the water distribution in cement mortar with various RBA and RBP substitution rates was calculated, and the results are displayed in Figure 13. The results of water distribution in Figure 13 correspond to the results of capillary absorption in Figure 12. The utilized RBP up to 30% decreases the water penetration depth of mortar, while the water penetration of mortar with 50% RBP increases and becomes close to that of the common mortar. For instance, the water penetration depth of M-10RBP, M-30RBP and M-50RBP is 7.4, 17.9 and 1.9% lower than that of M-0RBP, respectively. Although the utilized RBA increases the water penetration depth, while the water penetration depth with 50% RBA and 30% RBP is lower than that without RBA and RBP. For example, the water penetration depth of M-50RBA+10RBP, M-50RBA+30RBP and M-50RBA+50RBP is 7.3% lower, 22.9% lower and 3.3% higher than that of M-50RBA, respectively.
Chloride ingress is the key reason that leads to the steel corrosion in reinforced concrete, and thus, the chloride ingress in cementitious materials with RBA and RBP was determined by RCM test. Since Figure 14a shows the chloride diffusion coefficient of the mortar with various substitution rates of RBP, the utilized RBP decreases the chloride diffusion coefficient. For example, the chloride diffusion coefficient of M-10RBP, M-30RBP and M-50RBP is 25.3, 75.5 and 91.5% lower than that of M-0RBP. In addition, Figure 14a shows the actual chloride penetration depth of the RBP-prepared mortar, and the mixed RBP decreases the chloride penetration depth. This is because the incorporated RBP refines the pore structure of cementitious materials, due to its high activity and pozzolanic effect [57]; for instance, the measured average pore diameter decreases from 19.8 to 16.7 nm when the RBP substitution rate ranges from 0 to 50%, as shown in Figure 5. Figure 14b further shows the chloride diffusion coefficient and penetration depth of the mortar with both RBA and RBP, and the results show that the incorporated RBP decreases the chloride ingress in the RBA-prepared mortar. For instance, the chloride diffusion coefficient of M-50RBA+10RBP, M-50RBA+30RBP and M-50RBA+50RBP is 24.8, 68.7 and 85.0% lower than that of M-50RBA. Therefore, utilizing the appropriate content of RBA and RBP can prepare the cementitious materials with a good chloride resistance. In this work, the traditional test methods were utilized in evaluating the properties of cementitious materials with RBA and RBP; hence, some advanced test technologies (such as CT and sensors) can be utilized in further investigation, which helps achieve a better understanding on the micro and macro properties of cementitious materials incorporating both RBA and RBP [58,59,60]. Although the MIP test is the common approach to evaluating the pore size distribution of cementitious materials, there is a difference between the measured pore size based on Washburn equation and the actual pore size; thus, the pore size distribution of cementitious materials with RBP should be calculated and evaluated more accurately in further investigations by the Kelvin equation and relevant pore theoretical models [61,62].

4. Conclusions

This work gives an investigation on the effects of RBA and RBP incorporation on the cementitious materials in terms of the micro-structure, early-age performance, mechanical strength and transport properties. The following conclusions can be drawn based on the experimental analysis and discussion.
  • Utilizing RBA and RBP in cementitious materials helps the recycling of clay brick waste in CDW, which are eco-friendly building materials. The RBA has lower apparent density and higher water absorption than the natural sand. The RBP contains a high content of silicon oxide and aluminum oxide and possesses irregular micro-structure.
  • Incorporating RBP refines the pore structure of cementitious materials because of its pozzolanic and filler effects, and the measured average pore diameter decreases from 19.8 to 16.7 nm when the RBP substitution rate ranges from 0 to 50%. However, the utilized RBP reduces the hydration products amount in cementitious materials, and an obvious reduction in hydration products occurs when the RBP substitution rate is 50%.
  • Incorporating RBP decreases the fluidity and increases the setting time of cementitious materials. Incorporating RBA increases the drying shrinkage, while the drying shrinkage decreases as RBP incorporates and 30% RBP substitution rate is recommended. In particular, the mortar with 50% RBA and 30% RBP has the lower drying shrinkage than the common mortar without RBA and RBP.
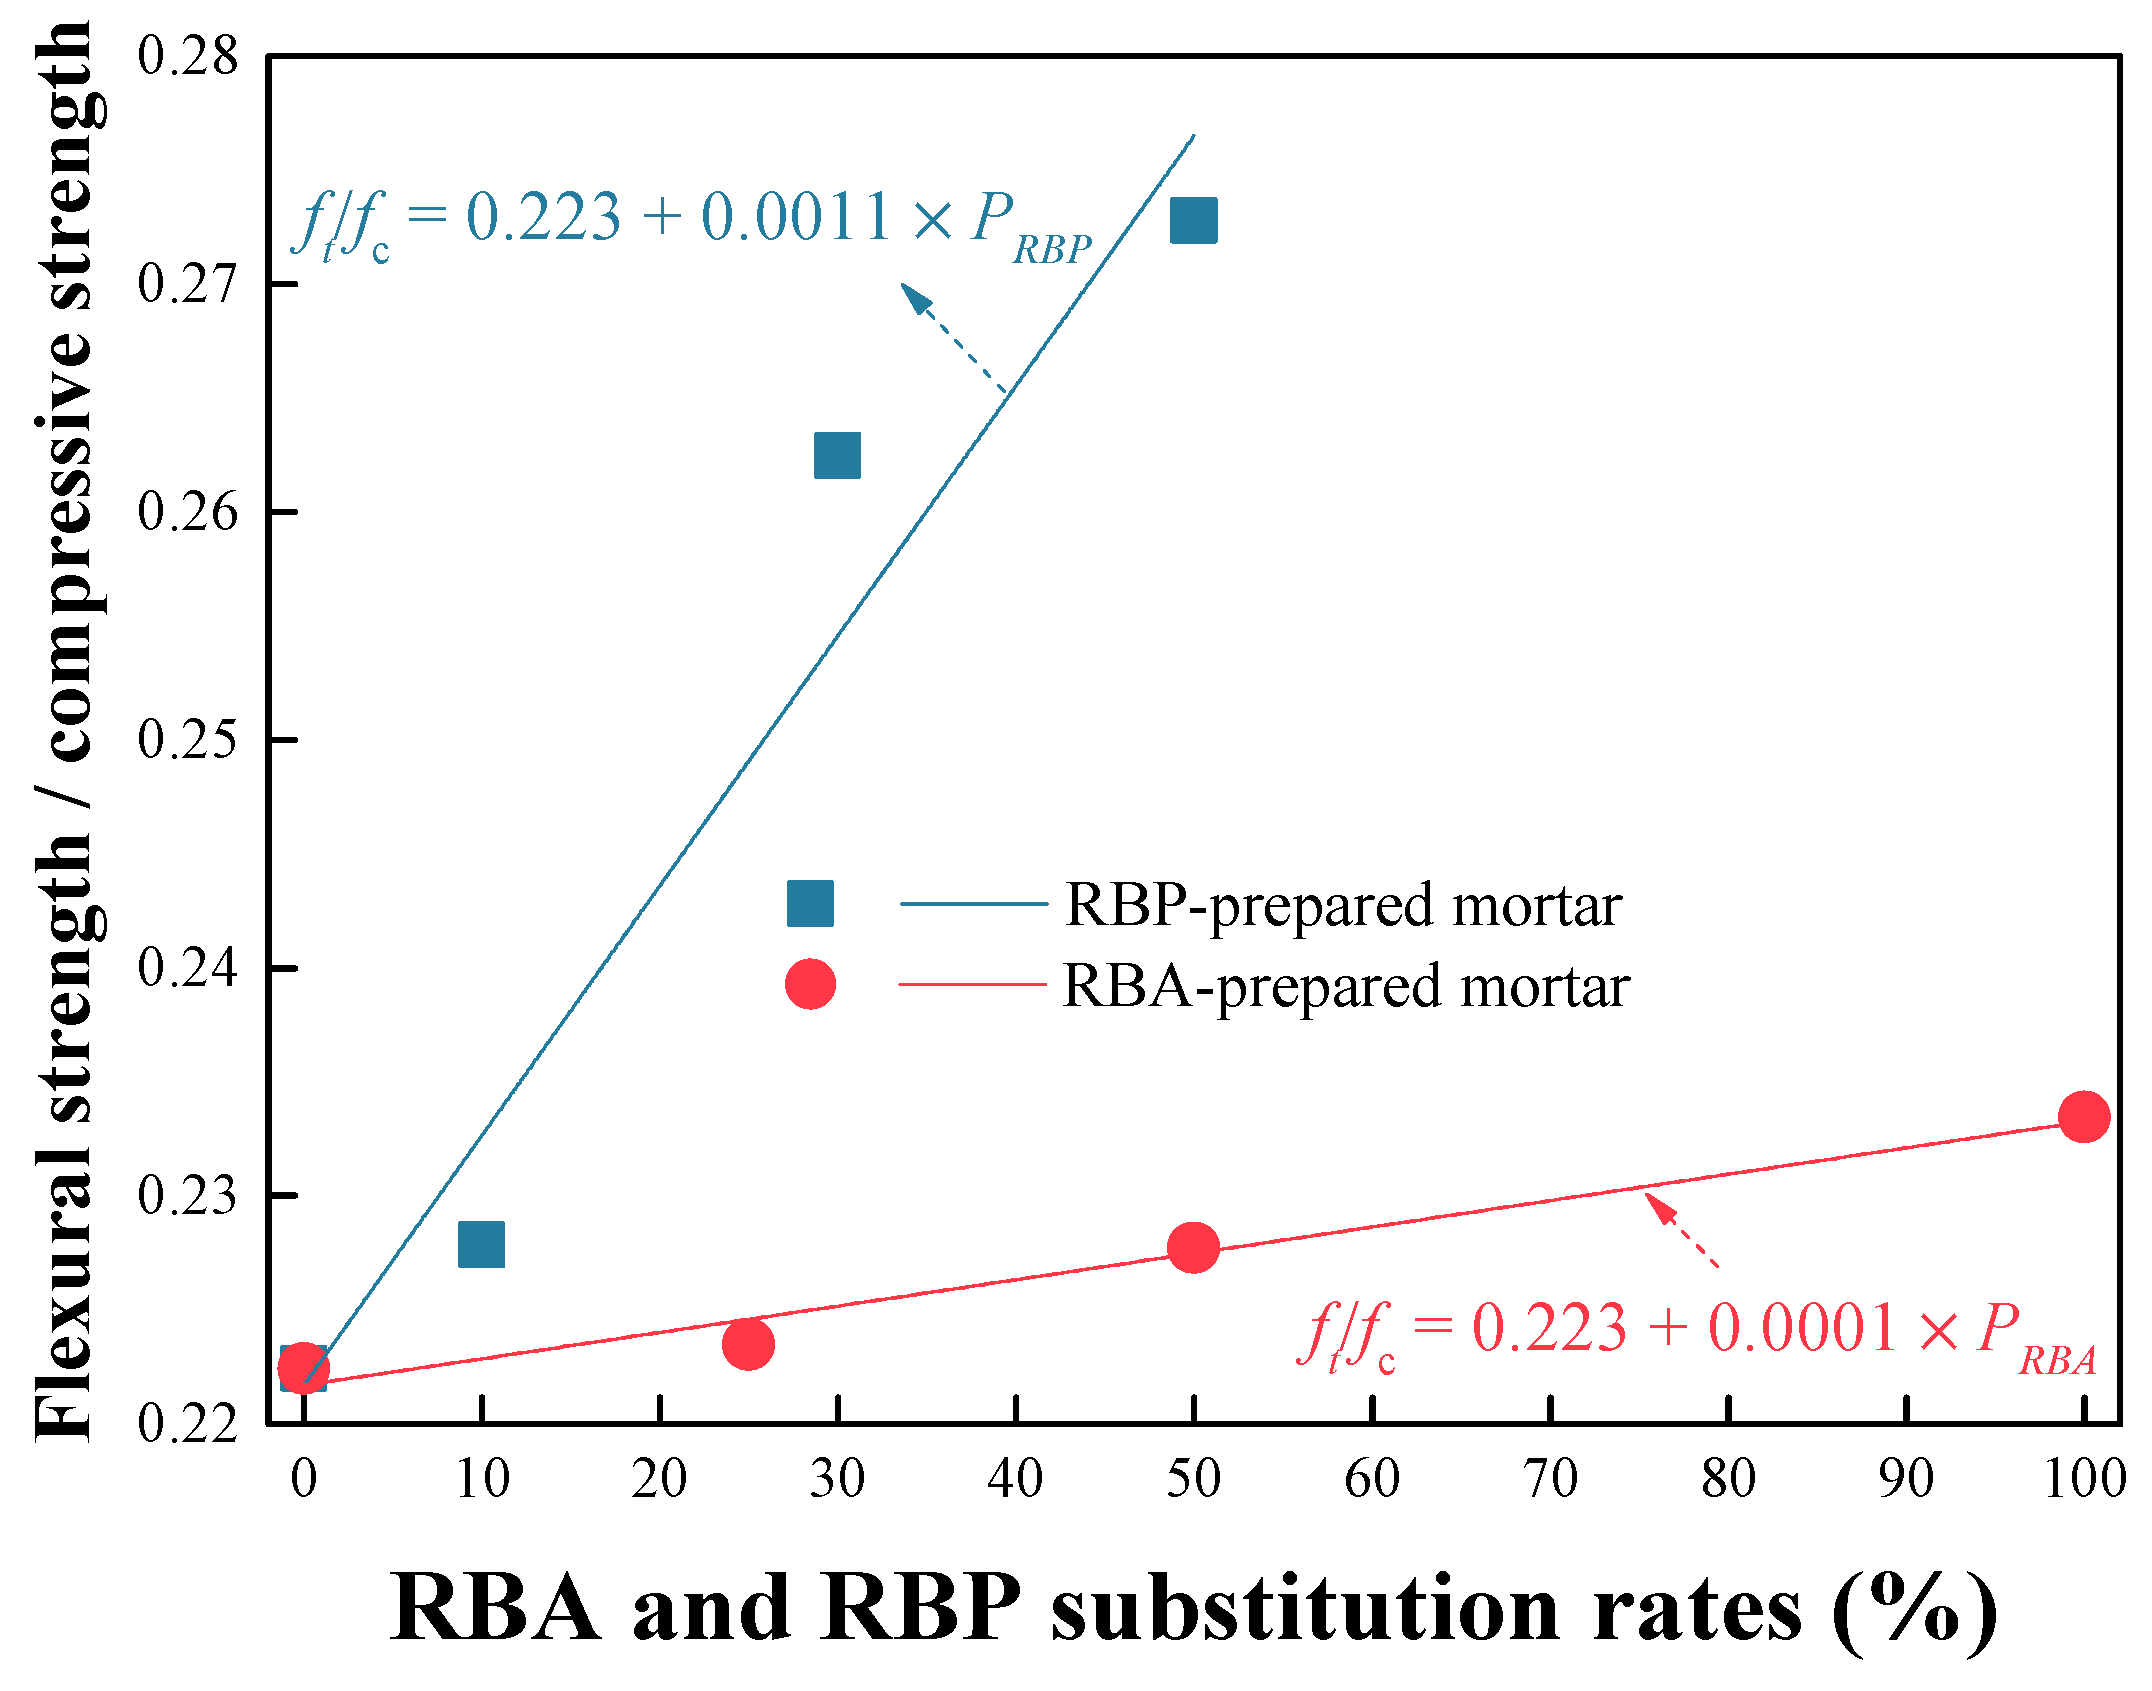
  • Incorporating RBA decreases the mechanical strength of cementitious materials. A slight increase in the mechanical strength occurs when the RBP substitution rate is 10%, while the mechanical strength decreases when the RBP substitution rate is above 30%. Incorporating appropriate proportion of RBA and RBP has no significant adverse impact on the mechanical strength; moreover, the flexural strength to compressive strength ratio increases with RBA and RBP incorporation.
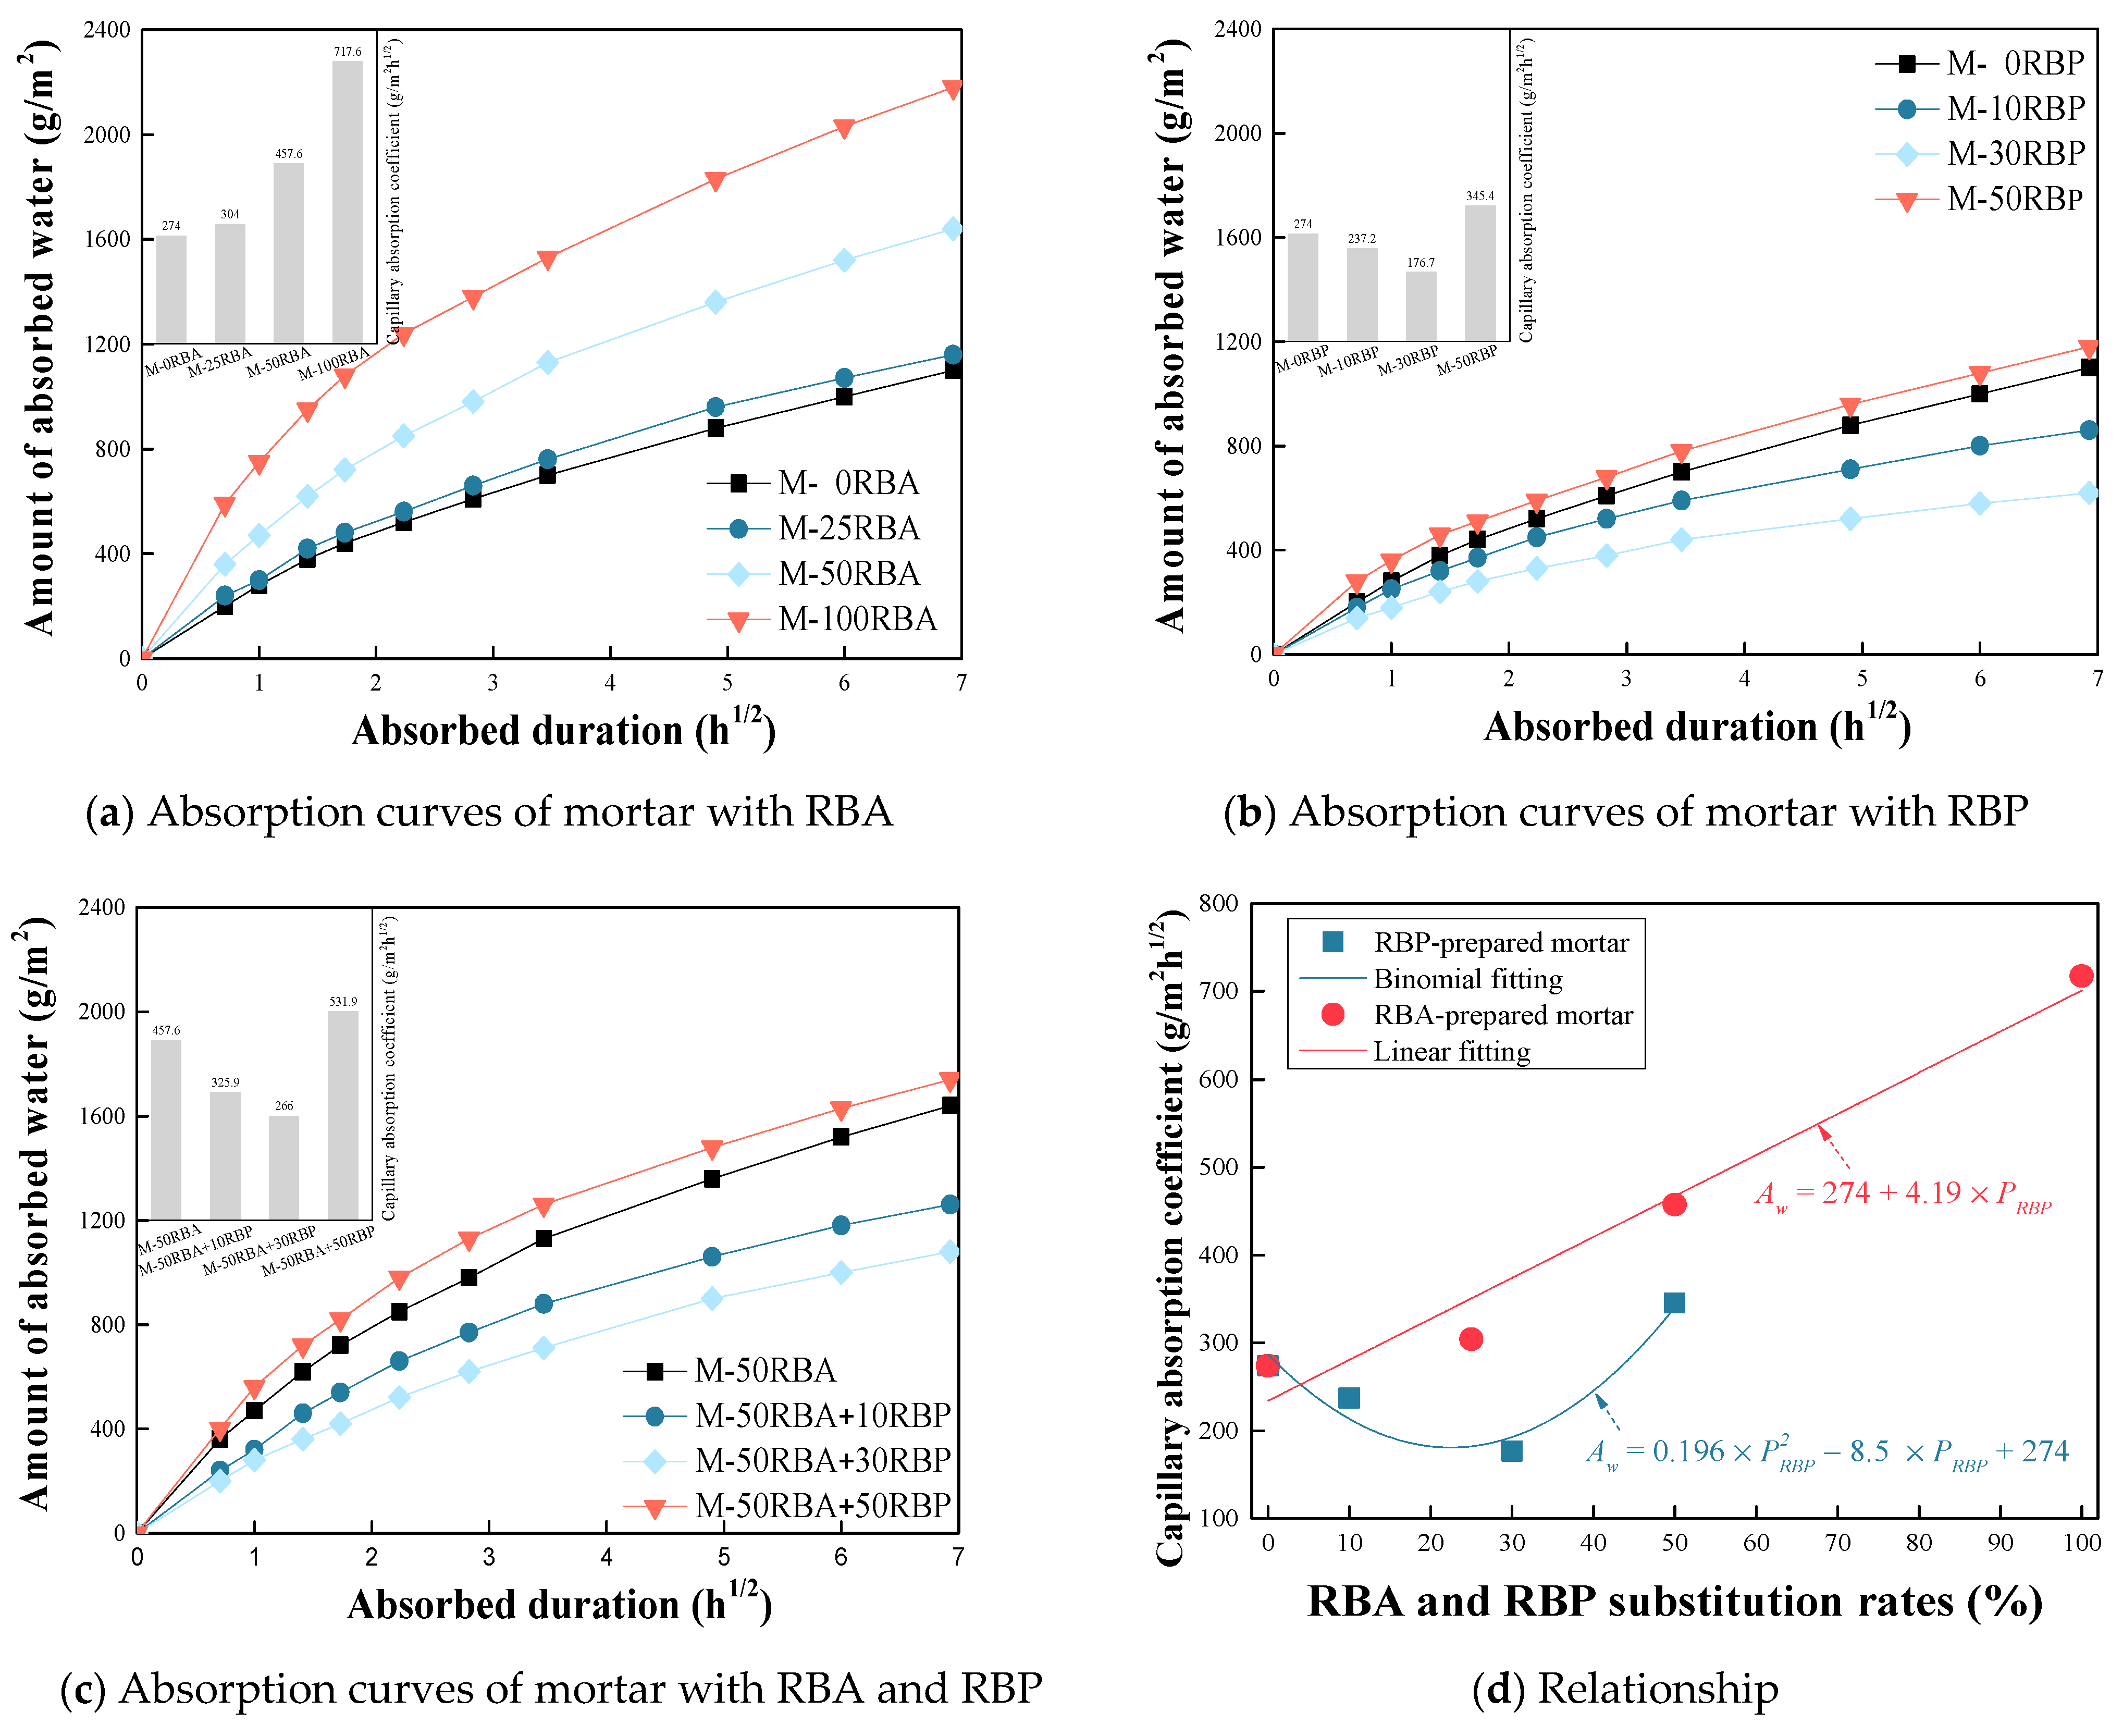
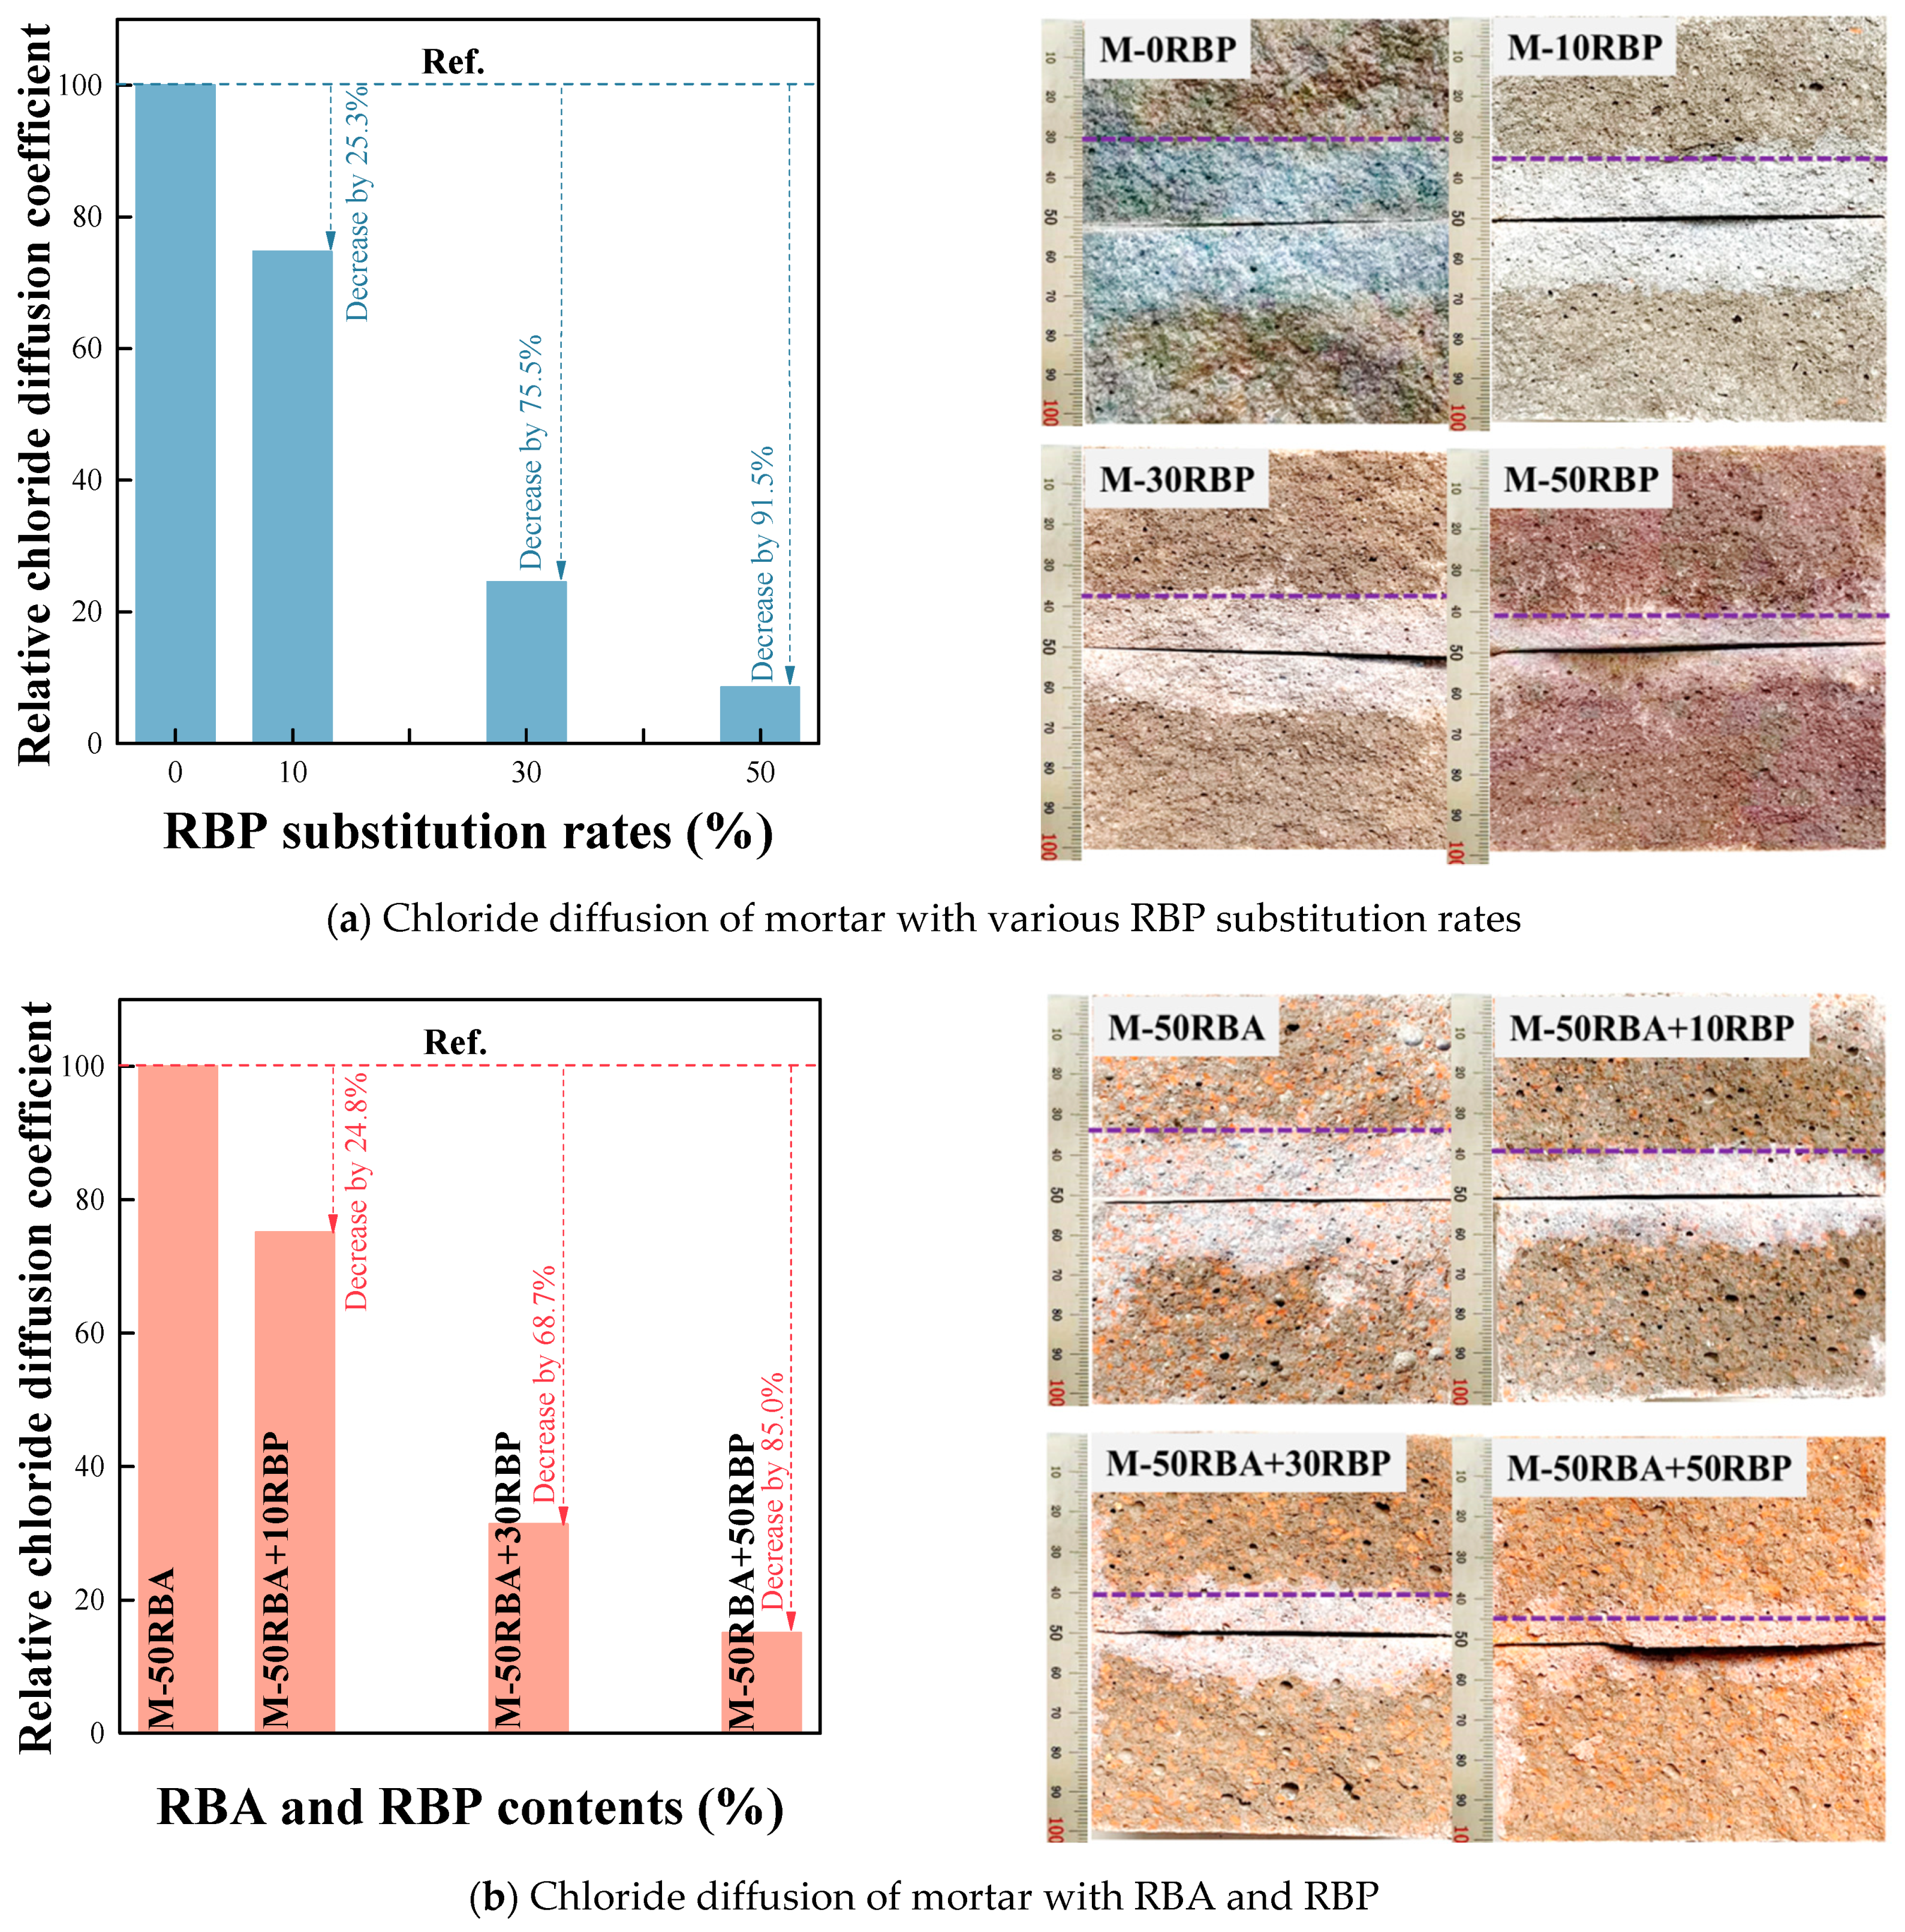
  • Incorporating RBA increases the water transport, while the utilized RBP decreases the water transport and the mortar with 30% RBP has the lowest water transport behavior. Utilizing RBA and RBP can obtain the cementitious materials with low water transport, and the capillary absorption coefficient of M-50RBA+30RBP is 3.0% lower than that of common mortar without RBA and RBP. Utilizing both RBA and RBP can also achieve the cementitious materials with a low chloride transport.
  • Incorporating RBA is frequently adverse to the properties of cementitious materials; however, the utilized RBP improves micro-structure and decreases the drying shrinkage and transport properties. Therefore, utilizing both RBA and RBP can achieve durable cementitious materials without a significant reduction in mechanical strength.

Author Contributions

Conceptualization, Z.M. and J.X.; methodology, Z.M.; validation, H.W. and C.L.; formal analysis, H.W. and C.L.; investigation, H.W. and C.L.; writing—original draft preparation, Z.M., H.W. and C.L.; writing—review and editing, Z.M., H.W., C.L. and J.X.; project administration, Z.M. and J.X.; funding acquisition, Z.M. All authors have read and agreed to the published version of the manuscript.

Funding

The authors gratefully acknowledge substantial support of ongoing projects titled National Natural Science Foundation of China (52008364) and Natural Science Foundation for Youths of Jiangsu Province (BK20200957).

Institutional Review Board Statement

Not applicable.

Informed Consent Statement

Not applicable.

Data Availability Statement

Not applicable.

Conflicts of Interest

The authors declare no conflict of interest.

References

  1. Jin, R.; Yuan, H.; Chen, Q. Science mapping approach to assisting the review of construction and demolition waste Manag.ent research published between 2009 and 2018. Resour. Conserv. Recyl. 2019, 140, 175–188. [Google Scholar] [CrossRef]
  2. Islam, R.; Nazifa, T.H.; Yuniarto, A.; Asm, S.U.; Salmiati, S.; Shahid, S. An empirical study of construction and demolition waste generation and implication of recycling. Waste Manag. 2019, 95, 10–21. [Google Scholar] [CrossRef]
  3. Liu, T.; Wang, Z.; Zou, D.; Zhou, A.; Du, J. Strength enhancement of recycled aggregate pervious concrete using a cement paste redistribution method, Cem. Concr. Res. 2019, 122, 72–82. [Google Scholar] [CrossRef]
  4. Xiao, J.; Ma, Z.; Ding, T. Reclamation chain of waste concrete: A case study of Shanghai. Waste. Manag. 2016, 48, 334–343. [Google Scholar] [CrossRef]
  5. Liang, C.; Ma, H.; Pan, Y.; Ma, Z.; Duan, Z.; He, Z. Chloride permeability and the caused steel corrosion in the concrete with carbonated recycled aggregate. Constr. Build. Mater. 2019, 218, 506–518. [Google Scholar] [CrossRef]
  6. Tam, V.W.; Soomro, M.; Evangelista, A.C.J. A review of recycled aggregate in concrete applications (2000–2017). Constr. Build. Mater. 2018, 172, 272–292. [Google Scholar] [CrossRef]
  7. Akhtar, A.; Sarmah, A.K. Construction and demolition waste generation and properties of recycled aggregate concrete: A global perspective. J. Clean. Prod. 2018, 186, 262–281. [Google Scholar] [CrossRef]
  8. Behera, M.; Bhattacharyya, S.K.; Minocha, A.K.; Deoliya, R.; Maiti, S. Recycled aggregate from C&D waste & its use in concrete—A breakthrough towards sustainability in construction sector: A review. Constr. Build. Mater. 2014, 68, 501–516. [Google Scholar]
  9. Yue, G.; Ma, Z.M.; Liu, M.; Liang, C.F.; Ba, G.Z. Damage behavior of the multiple ITZs in recycled aggregate concrete subjected to aggressive ion environment. Constr. Build. Mater. 2020, 245, 118419. [Google Scholar] [CrossRef]
  10. Thomas, C.; De Brito, J.; Cimentada, A.; Sainzaja, J. Macro-and micro-properties of multi-recycled aggregate concrete. J. Clean. Prod. 2020, 245, 118843. [Google Scholar] [CrossRef]
  11. Zhang, H.; Wang, Y.Y.; Lehman, D.E.; Geng, Y. Autogenous-shrinkage model for concrete with coarse and fine recycled aggregate. Cem. Concr. Compos. 2020, 111, 103600. [Google Scholar] [CrossRef]
  12. González-Taboada, I.; González-Fonteboa, B.; Martínez-Abella, F.; Seara-Paz, S. Analysis of rheological behaviour of self-compacting concrete made with recycled aggregates. Constr. Build. Mater. 2017, 157, 18–25. [Google Scholar] [CrossRef]
  13. Xie, T.; Gholampour, A.; Ozbakkaloglu, T. Toward the Development of Sustainable Concretes with Recycled Concrete Aggregates: Comprehensive Review of Studies on Mechanical Properties. J. Mater. Civ. Eng. 2018, 30, 04018211. [Google Scholar] [CrossRef]
  14. Xiao, J.; Li, W.; Poon, C.S. Recent studies on mechanical properties of recycled aggregate concrete in China-A review. Sci. China Tech. Sci. 2012, 55, 1463–1480. [Google Scholar] [CrossRef]
  15. Ma, Z.M.; Liu, M.; Tang, Q.; Liang, C.; Duan, Z. Chloride permeability of recycled aggregate concrete under the coupling effect of freezing-thawing, elevated temperature or mechanical damage. Constr. Build. Mater. 2020, 237, 117648. [Google Scholar] [CrossRef]
  16. Liang, C.F.; Cai, Z.D.; Wu, H.X.; Xiao, J.Z.; Zhang, Y.M.; Ma, Z.M. Chloride transport and induced steel corrosion in recycled aggregate concrete: A review. Constr. Build. Mater. 2020, 282, 122547. [Google Scholar] [CrossRef]
  17. Guo, H.; Shi, C.; Guan, X.; Zhu, J.; Ding, Y.; Ling, T.C. Durability of recycled aggregate concrete-a review. Cem. Concr. Compos. 2018, 89, 251–259. [Google Scholar] [CrossRef]
  18. Cachim, P.B. Mechanical properties of brick aggregate concrete. Constr. Build. Mater. 2009, 23, 1292–1297. [Google Scholar] [CrossRef]
  19. Zheng, C.; Lou, C.; Du, G.; Li, X.; Liu, Z.; Li, L. Mechanical properties of recycled concrete with demolished waste concrete aggregate and clay brick aggregate. Results Phys. 2018, 9, 1317–1322. [Google Scholar] [CrossRef]
  20. Debieb, F.; Kenai, S. The use of coarse and fine crushed bricks as aggregate in concrete. Constr. Build. Mater. 2008, 22, 886–893. [Google Scholar] [CrossRef]
  21. Zong, L.; Fei, Z.; Zhang, S. Permeability of recycled aggregate concrete containing fly ash and clay brick waste. J. Clean. Prod. 2014, 70, 175–182. [Google Scholar] [CrossRef]
  22. Huang, Q.; Zhu, X.; Xiong, G.; Wang, C.; Liu, D.; Zhao, L. Recycling of crushed waste clay brick as aggregates in cement mortars: An approach from macro-and micro-scale investigation. Constr. Build. Mater. 2021, 274, 122068. [Google Scholar] [CrossRef]
  23. Ge, Z.; Feng, Y.; Zhang, H.; Xiao, J.; Liu, X. Use of recycled fine clay brick aggregate as internal curing agent for low water to cement ratio mortar. Constr. Build. Mater. 2020, 264, 120280. [Google Scholar] [CrossRef]
  24. Tang, Q.; Ma, Z.; Wu, H.; Wang, W. The utilization of eco-friendly recycled powder from concrete and brick waste in new concrete: A critical review. Cem. Concr. Compos. 2020, 114, 103807. [Google Scholar] [CrossRef]
  25. Zhao, Y.; Gao, J.; Liu, C.; Chen, X.; Xu, Z. The particle-size effect of waste clay brick powder on its pozzolanic activity and properties of blended cement. J. Clean. Prod. 2020, 242, 118521. [Google Scholar] [CrossRef]
  26. He, Z.; Shen, A.; Wu, H.; Wang, W.; Wang, L.; Yao, C.; Wu, J. Research progress on recycled clay brick waste as an alternative to cement for sustainable construction materials. Constr. Build. Mater. 2021, 274, 122113. [Google Scholar] [CrossRef]
  27. Ma, Z.M.; Tang, Q.; Wu, H.; Xu, J.; Liang, C. Mechanical properties and water absorption of cement composites with various fineness and contents of waste brick powder from C&D waste. Cem. Concr. Compos. 2020, 114, 103758. [Google Scholar]
  28. Ortega, J.M.; Letelier, V.; Solas, C.; Moriconi, G.; Climent, M.Á.; Sánchez, I. Long-term effects of waste brick powder addition in the microstructure and service properties of mortars. Constr. Build. Mater. 2018, 182, 691–702. [Google Scholar] [CrossRef] [Green Version]
  29. Schackow, A.; Stringari, D.; Senff, L.; Correia, S.L.; Segadães, A.M. Influence of fired clay brick waste additions on the durability of mortars. Cem. Concr. Compos. 2015, 62, 82–89. [Google Scholar] [CrossRef]
  30. Yang, D.; Liu, M.; Ma, Z. Properties of the foam concrete containing waste brick powder derived from construction and demolition waste. J. Build. Eng. 2020, 32, 101509. [Google Scholar] [CrossRef]
  31. Sabina, R.; Joana, S.C. Construction and demolition waste as partial cement replacement. Adv. Cem. Res. 2019, 31, 411–422. [Google Scholar]
  32. Xiao, J.; Ma, Z.; Sui, T.; Akbarnezhad, A.; Duan, Z. Mechanical properties of concrete mixed with recycled powder produced from construction and demolition waste. J. Clean. Prod. 2018, 188, 720–731. [Google Scholar] [CrossRef]
  33. Zhang, J.; Zhou, Z.H.; Cheng, X. Formation kinetics of regenerated cement clinker calcined by using wasted recycling concrete powders as raw meals. Adv. Mater. Res. 2015, 1073, 1309–1312. [Google Scholar] [CrossRef]
  34. Zhao, K.Y.; Zhang, P.; Xue, S.B.; Han, S.B.; Müller, H.S.; Xiao, Y.G.; Hu, Y.; Hao, L.J.; Mei, L.W.; Li, Q.B. Quasi-Elastic Neutron Scattering (QENS) and its application for investigating the hydration of cement-based materials: State-of-the-art. Mater. Charact. 2021, 172, 110890. [Google Scholar] [CrossRef]
  35. Lv, S.H.; Ma, Y.J.; Qiu, C.C.; Ju, H.B. Study on reinforcing and toughening of graphene oxide to cement-based composites. J. Funct. Mater. 2013, 44, 2227–2231. [Google Scholar]
  36. Shi, C.J.; Yuan, Q. Testing and Analysis Methods for the Cementitious Materials; China Building Industry Press: Beijing, China, 2017; ISBN 978-7-112-21658-1. [Google Scholar]
  37. Washburn, E.W. Note on a method of determining the distribution of pore sizes in a porous material. Proc. Natl. Acad. Sci. USA 1921, 7, 115–116. [Google Scholar] [CrossRef] [Green Version]
  38. Zeng, Q.; Li, K.; Fen-Chong, T.; Dangla, P. Pore structure characterization of cement pastes blended with high-volume fly-ash. Cem. Concr. Res. 2012, 42, 194–204. [Google Scholar] [CrossRef]
  39. Diamond, S. Mercury porosimetry: An inappropriate method for the measurement of pore size distributions in cement-based materials. Cem. Concr. Res. 2020, 30, 1517–1525. [Google Scholar] [CrossRef]
  40. Bao, J.W.; Zhang, P.; Li, S.G.; Xue, S.B.; Cui, Y.F.; Zhao, T.J. Influence of exposure environments and moisture content on water repellency of surface impregnation of cement-based materials. J. Mater. Res. Tech. 2020, 9, 12115–12125. [Google Scholar] [CrossRef]
  41. Bao, J.W.; Li, S.G.; Zhang, P.; Ding, X.; Xue, S.; Cui, Y.; Zhao, T. Influence of the incorporation of recycled coarse aggregate on water absorption and chloride penetration into concrete. Constr. Build. Mater. 2020, 239, 117845. [Google Scholar] [CrossRef]
  42. Zhang, P.; Wittmann, F.H.; Vogel, M.; Müller, H.S.; Zhao, T. Influence of freeze-thaw cycles on capillary absorption and chloride penetration into concrete. Cem. Concr. Res. 2017, 100, 60–67. [Google Scholar] [CrossRef]
  43. Ma, Z.; Liu, M.; Duan, Z.; Liang, C.; Wu, H. Effects of active waste powder obtained from C&D waste on the microproperties and water permeability of concrete. J. Clean. Prod. 2020, 257, 120518. [Google Scholar]
  44. Wang, D.; Yang, P.; Hou, P.K.; Zhang, L.; Zhou, Z.; Cheng, X. Effect of SiO2 oligomers on water absorption of cementitious materials. Cem. Concr. Res. 2016, 87, 22–30. [Google Scholar] [CrossRef]
  45. Wang, L.; Ueda, T. Mesoscale modeling of water penetration into concrete by capillary absorption. Ocean. Eng. 2011, 38, 519–528. [Google Scholar] [CrossRef]
  46. Liu, S.; Liu, H.Q.; Xing, S. Prediction of water transport and distribution of the gaugue concrete. Bull. Chin. Ceram. Soc. 2018, 37, 787–791. [Google Scholar]
  47. Xiao, L.; Ren, Z.; Shi, W.; Wei, X. Experimental study on chloride permeability in concrete by non-contact electrical resistivity measurement and rcm. Constr. Build. Mater. 2016, 123, 27–34. [Google Scholar] [CrossRef]
  48. Liu, J.; Wang, X.; Qiu, Q.; Ou, G.; Xing, F. Understanding the effect of curing age on the chloride resistance of fly ash blended concrete by rapid chloride migration test. Mater. Chem. Phys. 2017, 196, 315–323. [Google Scholar] [CrossRef]
  49. Navrátilová, E.; Rovnaníková, P. Pozzolanic properties of brick powders and their effect on the properties of modified lime mortars. Constr. Build. Mater. 2016, 120, 530–539. [Google Scholar] [CrossRef]
  50. Pereira-de-Oliveira, L.A.; Castro-Gomes, J.P.; Santos, P.M.S. The potential pozzolanic activity of glass and red-clay ceramic waste as cement mortars components. Constr. Build. Mater. 2012, 31, 197–203. [Google Scholar] [CrossRef]
  51. Mehdizadeh, H.; Ling, T.C.; Cheng, X.; Mo, K.H. Effect of particle size and CO2 treatment of waste cement powder on properties of cement paste. Can. J. Civ. Eng. 2020, 0574. [Google Scholar] [CrossRef]
  52. Zeghad, M.; Mitterpach, J.; Safi, B.; Amrane, B.; Saidi, M. Reuse of refractory brick wastes (RBW) as a supplementary cementitious material in a concrete, Period. Polytech. Civ. 2017, 61, 75–80. [Google Scholar]
  53. Yu, K.Q.; Zhu, W.J.; Ding, Y.; Lu, Z.D.; Yu, J.T.; Xiao, J.Z. Micro-structural and mechanical properties of ultra-high performance engineered cementitious composites (UHP-ECC) incorporation of recycled fine powder (RFP). Cem. Concr. Res. 2019, 124, 105813. [Google Scholar] [CrossRef]
  54. Bazaz, J.B.; Khayati, M. Properties and performance of concrete made with recycled low-quality crushed brick. J. Mater. Civ. Eng. 2012, 24, 330–338. [Google Scholar] [CrossRef]
  55. Dang, J.T.; Zhao, J.; Hu, W.Y.; Du, Z.H.; Gao, D.Y. Properties of mortar with waste clay bricks as fine aggregate. Constr. Build. Mater. 2018, 166, 898–907. [Google Scholar] [CrossRef]
  56. Lin, K.L.; Chen, B.Y.; Chiou, C.S.; Cheng, A. Waste brick’s potential for use as a pozzolan in blended Portland cement. Waste. Manag. Res. 2010, 28, 647–652. [Google Scholar] [CrossRef]
  57. Gonçalves, J.P.; Tavares, L.M.; Toledo Filho, R.D.; Fairbairn, E.M.R. Performance evaluation of cement mortars modified with metakaolin or ground brick. Constr. Build. Mater. 2009, 23, 1971–1979. [Google Scholar] [CrossRef]
  58. Wang, W.; Zhao, K.; Zhang, P.; Bao, J.; Xue, S. Application of three self-developed ECT sensors for monitoring the moisture content in sand and mortar. Constr. Build. Mater. 2021, 267, 121008. [Google Scholar] [CrossRef]
  59. Tian, Y.P.; Zhang, P.; Zhao, K.Y.; Du, Z.X.; Zhao, T.J. Application of Ag/AgCl sensor for chloride monitoring of mortar under dry-wet cycles. Sensors 2020, 20, 1394. [Google Scholar] [CrossRef] [PubMed] [Green Version]
  60. Al Ajmani, H.; Suleiman, F.; Abuzayed, I.; Tamimi, A. Evaluation of concrete strength made with recycled aggregate. Buildings 2019, 9, 56. [Google Scholar] [CrossRef] [Green Version]
  61. Dambrauskas, T.; Baltakys, K.; Eisinas, A.; Kitrys, S. The specific surface area and porosity of synthetic and calcined α-c2sh, kilchoanite and hydroxyledgrewite. Powder Technol. 2019, 355, 504–513. [Google Scholar] [CrossRef]
  62. Rocha, J.V.; Barrera, D.; Sapag, K. Improvement in the pore size distribution for ordered mesoporous materials with cylindrical and spherical pores using the Kelvin equation. Top. Catal. 2011, 54, 121–134. [Google Scholar] [CrossRef]
Figure 1. Investigating and testing process of this work.
Buildings 11 00119 g001
Figure 2. Micro-structure of cement and recycled brick powder (RBP) particles.
Buildings 11 00119 g002
Figure 3. Particle size and mineral component of RBP and cement.
Buildings 11 00119 g003
Figure 4. Test (a) drying shrinkage test; (b) water absorption test; (c) Chloride diffusion test.
Buildings 11 00119 g004
Figure 5. Pore size distribution of cementitious materials with various RBP contents.
Buildings 11 00119 g005
Figure 6. Hydration products and mineral composition of paste with various RBP substitution rates.
Buildings 11 00119 g006
Figure 7. SEM results of cementitious materials with various RBP contents.
Buildings 11 00119 g007
Figure 8. Fluidity and setting time of cementitious materials with various RBP substitution rates.
Buildings 11 00119 g008
Figure 9. Drying shrinkage of cementitious materials with RBA and RBP.
Buildings 11 00119 g009
Figure 10. Mechanical strength of cement mortar with RBA and RBP.
Buildings 11 00119 g010
Figure 11. Flexural strength to compressive strength of mortar with RBA and RBP.
Buildings 11 00119 g011
Figure 12. Water absorption of cement mortar with RBA and RBP.
Buildings 11 00119 g012
Figure 13. Water distribution in cement mortar with RBA and RBP.
Buildings 11 00119 g013
Figure 14. Chloride ingress in cement mortar with RBA and RBP.
Buildings 11 00119 g014
Table 1. Properties of natural sand and recycled brick aggregate (RBA).
SamplesParticle SizeApparent DensityWater Absorption
Natural sand0.15–2.36 mm2510 kg/m30.6%
RBA0.15–2.36 mm2030 kg/m317.0%
Table 2. Chemical composition of RBP, cement and fly ash.
BindersMain Oxide Content (%)
SiO2CaOAl2O3Fe2O3MgO
RBP76.11.311.84.81.7
Cement21.958.66.13.12.1
Fly ash48.33.7528.54.70.7
Table 3. Mix proportion of cement mortar with RBA and RBP (kg/m3).
SamplesWaterCementRBPSandRBA
M-0RBA225450013500
M-25RBA22545001013273
M-50RBA2254500675546
M-100RBA225450001092
M-0RBP225450013500
M-10RBP2254054513500
M-30RBP22531513513500
M-50RBP22522522513500
M-50RBA2254500675546
M-50RBA+10RBP22540545675546
M-50RBA+30RBP225315135675546
M-50RBA+50RBP225225225675546
Publisher’s Note: MDPI stays neutral with regard to jurisdictional claims in published maps and institutional affiliations.

