Article

Building Drainage System Design for Tall Buildings: Current Limitations and Public Health Implications

Institute for Sustainable Building Design, Heriot-Watt University, Edinburgh EH14 4AS, UK
*
Author to whom correspondence should be addressed.
Buildings 2021, 11(2), 70; https://doi.org/10.3390/buildings11020070
Submission received: 23 December 2020 / Revised: 5 February 2021 / Accepted: 9 February 2021 / Published: 16 February 2021

Abstract

:
National design guides provide essential guidance for the design of building drainage systems, which primarily ensure the basic objectives of preventing odor ingress and cross-transmission of disease through water-trap seal retention. Current building drainage system design guides only extend to buildings of 30 floors, while modern tall buildings frequently extend to over 100 floors, exceeding the predictive capability of current design guides in terms of operating system conditions. However, the same design guides are being used for tall buildings as would be used for low-rise buildings. A complicating factor is the historic roots of current design guides and standards (including the interpretation of the governing fluid mechanics principles and margins of safety), causing many design differences to exist for the same conditions internationally, such as minimum trap seal retention requirements, stack-to-vent cross-vent spacing, and even stack diameter. The design guides also differ in the size and scale of the systems they cover, and most make no allowance for the specific building drainage system requirements of tall buildings. This paper assesses the limitations of applying current building drainage system design guides when applied to the case of tall buildings. Primarily, the assessments used in this research are based on codes from Europe, the USA and Australia/New Zealand as representative of the most common approaches and from which many other codes and standards are derived. The numerical simulation model, AIRNET, was used as the analysis tool. Our findings confirm that current design guides, which have been out of date for a number of decades, are now in urgent need of updating as code-compliant systems have been shown to be susceptible to water-trap seal depletion, a risk to cross-transmission of disease, which is a major public health concern, particularly in view of the current COVID-19 pandemic.

1. Introduction

National design guides provide essential guidance for the design of building drainage systems, which aim to ensure the safe removal of wastewater from the building appliances [1,2,3,4,5]. Discharged wastewater is a variable multiphase mixture of liquids, solids, and entrained air with significant odor and pathogenicity [6]. The safety and integrity of the system rely on functional water-trap seals to provide a barrier between the foul air within the system and the occupied space in order to safeguard against potential cross-transmission of disease. Ensuring system integrity requires careful design, and robust design guides, in order to avoid excessive water or airflow rates and the generation of air pressure transients, which may otherwise compromise the water-trap seal.
However, there are currently no design guides that cover the design of building drainage systems for tall buildings, nor is there sufficient underpinning science or understanding of how building drainage systems in tall buildings operate upon, which to base design guides. Furthermore, most current design guides available globally base system design on an over-simplified steady-state probabilistic approach that disregards the inherent unsteady, transient nature of discharging wastewater flow. Without adequate guidance, engineers and designers can only extrapolate the requirements and design methods for single-story and low-rise buildings (of around 20 stories) when designing building drainage systems for tall buildings. For example, UK design guides currently only mention 5, 10, and 20 story examples. While the height of the building does not necessarily affect the velocity of the wastewater falling in the vertical stack (due to the phenomenon of terminal velocity), there are significant other issues at play [7].
The historical development of international design guides and standards shows that many design parameters differ between them, such as required water-trap seal depth and cross-vent floor intervals. Discussions on design guide applications often involve anecdotal evidence or semantics rather than scientific evidence. The implications of applying current design guides to the design of building drainage systems for tall buildings are investigated in this paper. The methodology uses a numerical simulation model to assess the operational performance of four common system configurations based on the current UK design guide (BS EN 12056-2:2000) [2] for both a 10 story and 20 story building. The numerical simulation model allows the assessment of water-trap seal integrity in response to simulated unsteady and turbulent wastewater discharge.

1.1. The Growing Trend of Tall Buildings

The number of tall buildings being constructed around the world is growing rapidly, driven by the need for increased population density, efficiency, and restricted inner-city space. Tall buildings are usually defined as those more than 50 m (or about 14 floors). Buildings, which reach over 300 m (about 84 floors) are described as “supertall”, and those over 600 m (about 168 floors) are “megatall” [8]. In 2018, a total of 18 supertall buildings existed. By the end of 2019, this grew to almost two hundred buildings, with three of them being megatall. The number of supertall and megatall buildings is expected to grow each year, with an additional 126 supertall buildings due to be completed by 2025 [9].

1.2. Current Design Guides

The applied physics principles governing the gravity-driven flow of building drainage systems have been well described, from the early pre-19th century design developments to the more recent forensic failure analysis [10,11]. It is the advances made in the past two centuries that form the basis of our modern systems. The water-trap seal was invented in the UK in 1775 by Cummings (an engineer and watchmaker) [12], using a flushing WC originally invented by Harrington in the 17th century. In 1842, Edwin Chadwick published his “Report into the Sanitary Conditions of the Laboring Population of Great Britain” [13]. It was in the 1940s that Hunter [14] proposed a simplified, usable approach based on probability to derive the discharge unit method, and a variant of this is still in use today despite known shortcomings. Gormley [15] summarizes the innovation of safe and practical building drainage and plumbing from the 19th century onwards. In the UK and internationally, the research was still underpinned by exhaustive empirical steady-state experiments utilizing clean, cold, fresh water in clean pipes with no sedimentation or fouling. This legacy is evident in building drainage system design guidance today [16,17].
In addition to growing building heights, other factors such as the use of detergents and hotter discharging wastewater were growing without associated design guide upgrades, despite these factors significantly modifying the building drainage system performance. Investigations by Campbell and Gormley [16,17] have shown that the inclusion of detergents, and consideration of hotter water temperatures, cause divergence from design expectations by up to 40%, a finding which is still to be addressed in design guides and standards. These modifying factors on how the building drainage system operates also impact the main function of the system in safely transporting solid waste from the building [18,19]. The significant impacts on system performance by factors such as these highlights the additional implications of using outdated building drainage system design guidance. The more recent innovations in building drainage system design, such as air admittance valves (AAVs) [20] and positive air pressure attenuators (PAPAs) [21], are now specifically mentioned in design guides in some jurisdictions.
The introduction of components with moving parts to alleviate pressure fluctuations in building drainage systems, such as AAVs and PAPAs, has led to a naming convention whereby these systems are said to have “active ventilation” and systems where air pressure fluctuations are alleviated by a collection of ventilation pipes only are said to be “passive ventilation” systems [7].
Although beyond the scope of this paper, it should also be noted that sedimentation in horizontal building drainage pipes has also been found to modify the depth and velocity of wastewater within the main drain pipes leaving the building, impacting solid transport capability and increasing the risk of system blockages [22].

1.3. Implications of Building Tall

The management of wastewater in tall buildings is a unique and complex issue. Basic building drainage system dynamics are now well established [10]. Building drainage systems reach a terminal velocity within two floors, with the formation of annular water flow and an entrained airflow core. Gravity is the only driving force, and all the water, air, and air-to-water frictional forces balance the gravity force, together producing the familiar pressure recovery curve shown in Figure 1, which also depicts the pressure effects on the water-trap seals. However, some studies [7,23], as well as anecdotal evidence, have shown special cases of anomalous results in the building drainage systems of tall buildings, which are difficult to account for.
All pressure phenomena in the air propagate at the local speed of sound, adequately approximated to 340 ms−1. This is the speed at which a pressure change (transient) will propagate an appropriate air movement to or from the source. In the most extreme case of an event near the bottom of an open stack, a transient will travel to the open-top, reflect with opposite sign (−1 reflection coefficient) and travel back down again, giving rise to the pipe period, tp, which is the time taken for a generated transient to travel to a reflecting boundary and return to the source, defined by Equation (1):
t p = 2 L c
where L is the pipe length and c is the wave propagation speed. For example, in a supertall building, most national design guides will require stack pipe diameters of 100–150 mm, but with a wide range of recommended vent arrangements, depending on which guide is used. In this simplistic case, 125 floors and 125 mm diameter has a pipe period of around 3 s. If the transient comes from a toilet flush, the volume of air will only be a few liters. However, if the event is sustained and the entire stack carries an established airflow, around 4 m3 of air will be entrained weighing around 5 kg, traveling at around 3 ms−1 and representing appreciable kinetic energy: much greater than encountered in a high-rise building. With a pipe period of 3 s, events at either extreme of the stack may even unfold unaffected by each other: only after they have stopped will their transients interact and travel around the system reflecting from boundaries with +1 or −1 reflection coefficient and agitating traps on the journey.
Despite these obvious gaps in guidance, existing design guides have been refined through empirical adjustments over recent decades and are generally effective when observed and as long as building height does not exceed around 20 stories. The limited scope of current national design guides must all but prohibit their extrapolation for the design of building drainage systems for tall, supertall, and megatall buildings.
There are obvious implications for inappropriate building drainage system design in tall buildings; ranging from anecdotal evidence of frequently depleting water-traps seals, undesirable odors, alarming toilet trap excursions, and system noises; to more severe public health implications and their role in the cross-transmission of disease such SARS and COVID-19 [24,25,26]. These types of events are becoming more frequent with growing building height and inappropriate design guides, thereby requiring an urgent need for action.

2. Methods

To assess the impact of current design guides on building drainage system design for tall buildings, the numerical model, AIRNET, was used to simulate the operational performance of the building drainage system of a 10 story and 20 story building for four common system configurations based on the current UK design guide (BS EN 12056-2:2000). A 20 story building was selected as this is the current upper limit of the AIRNET model.

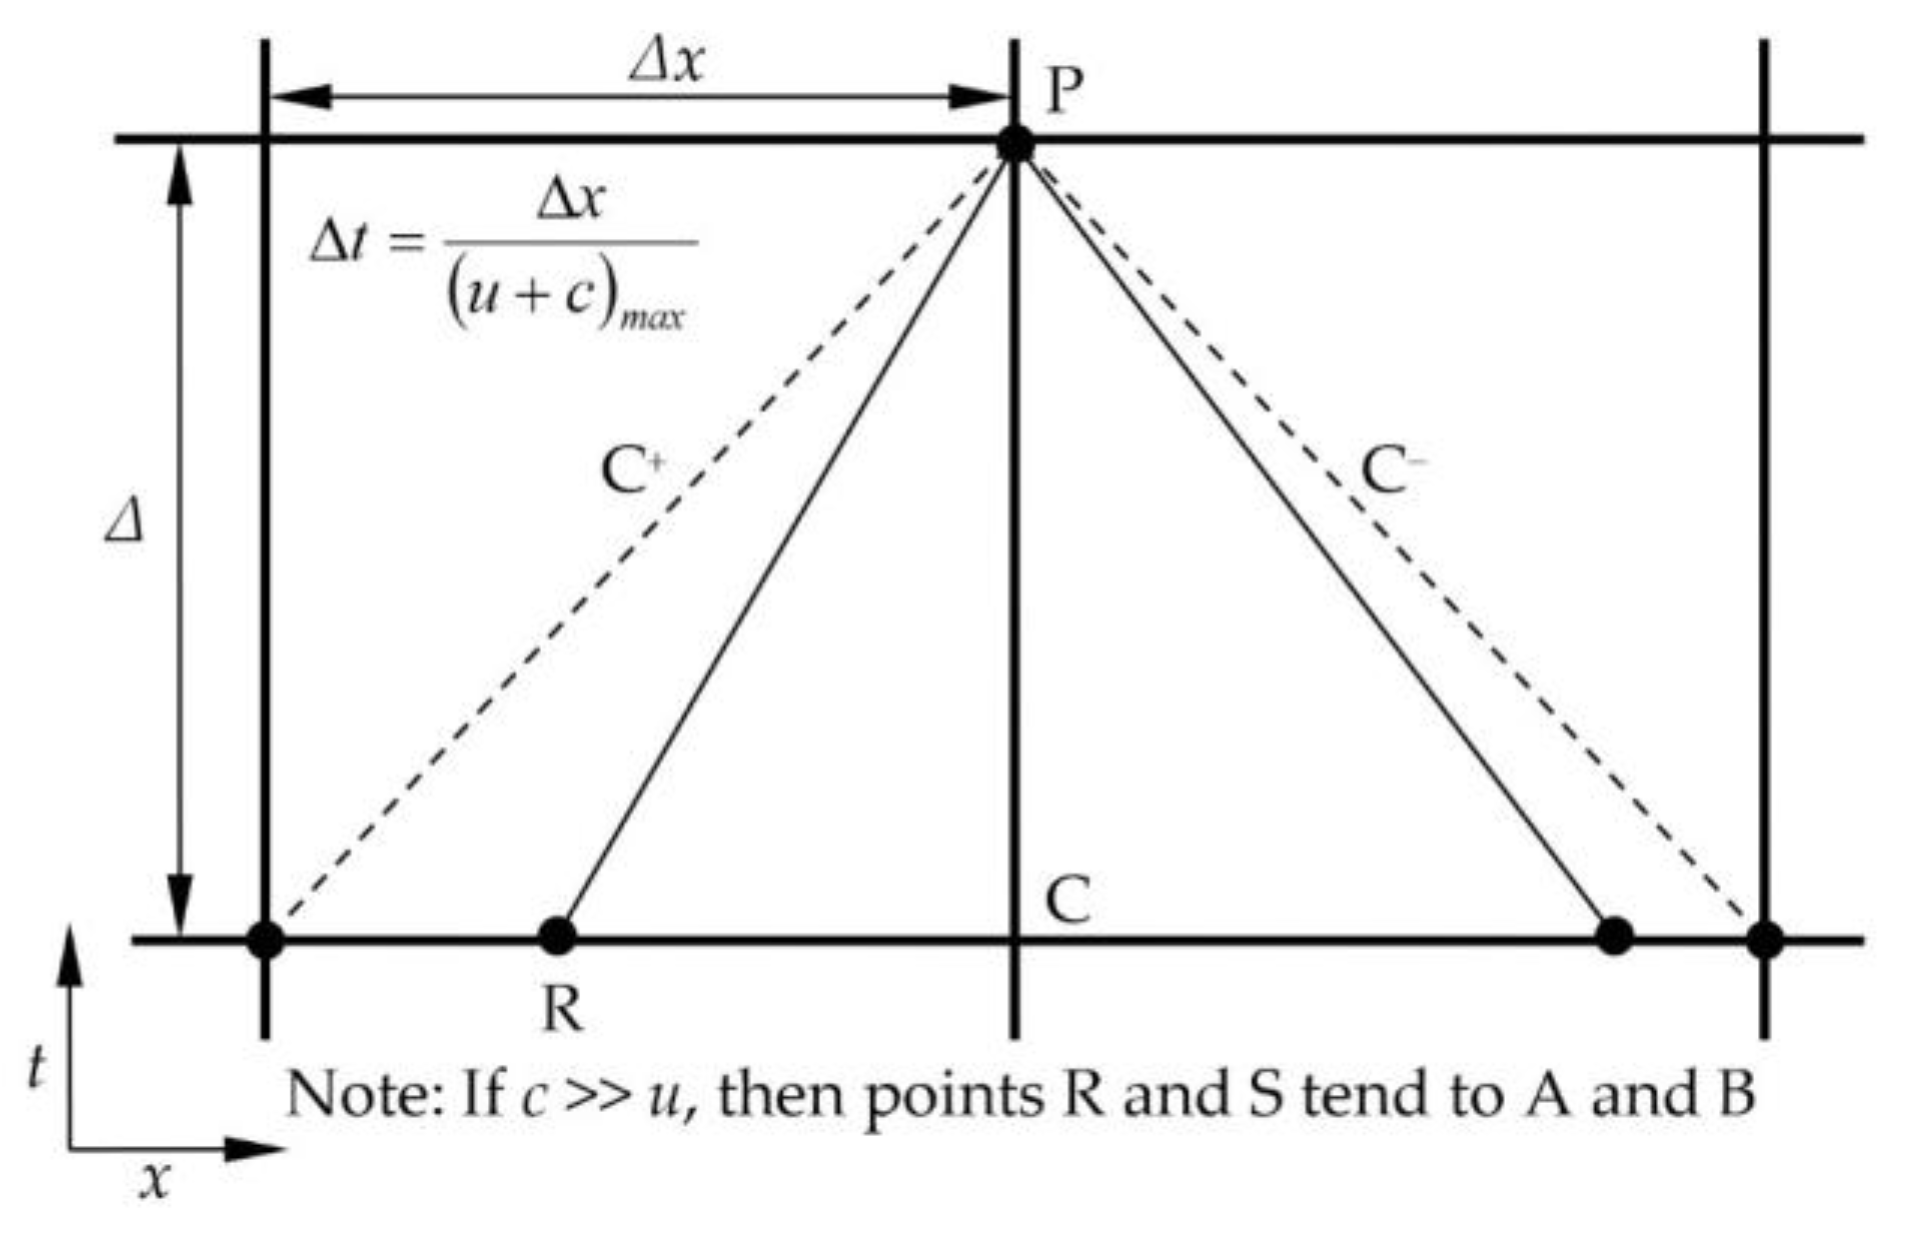
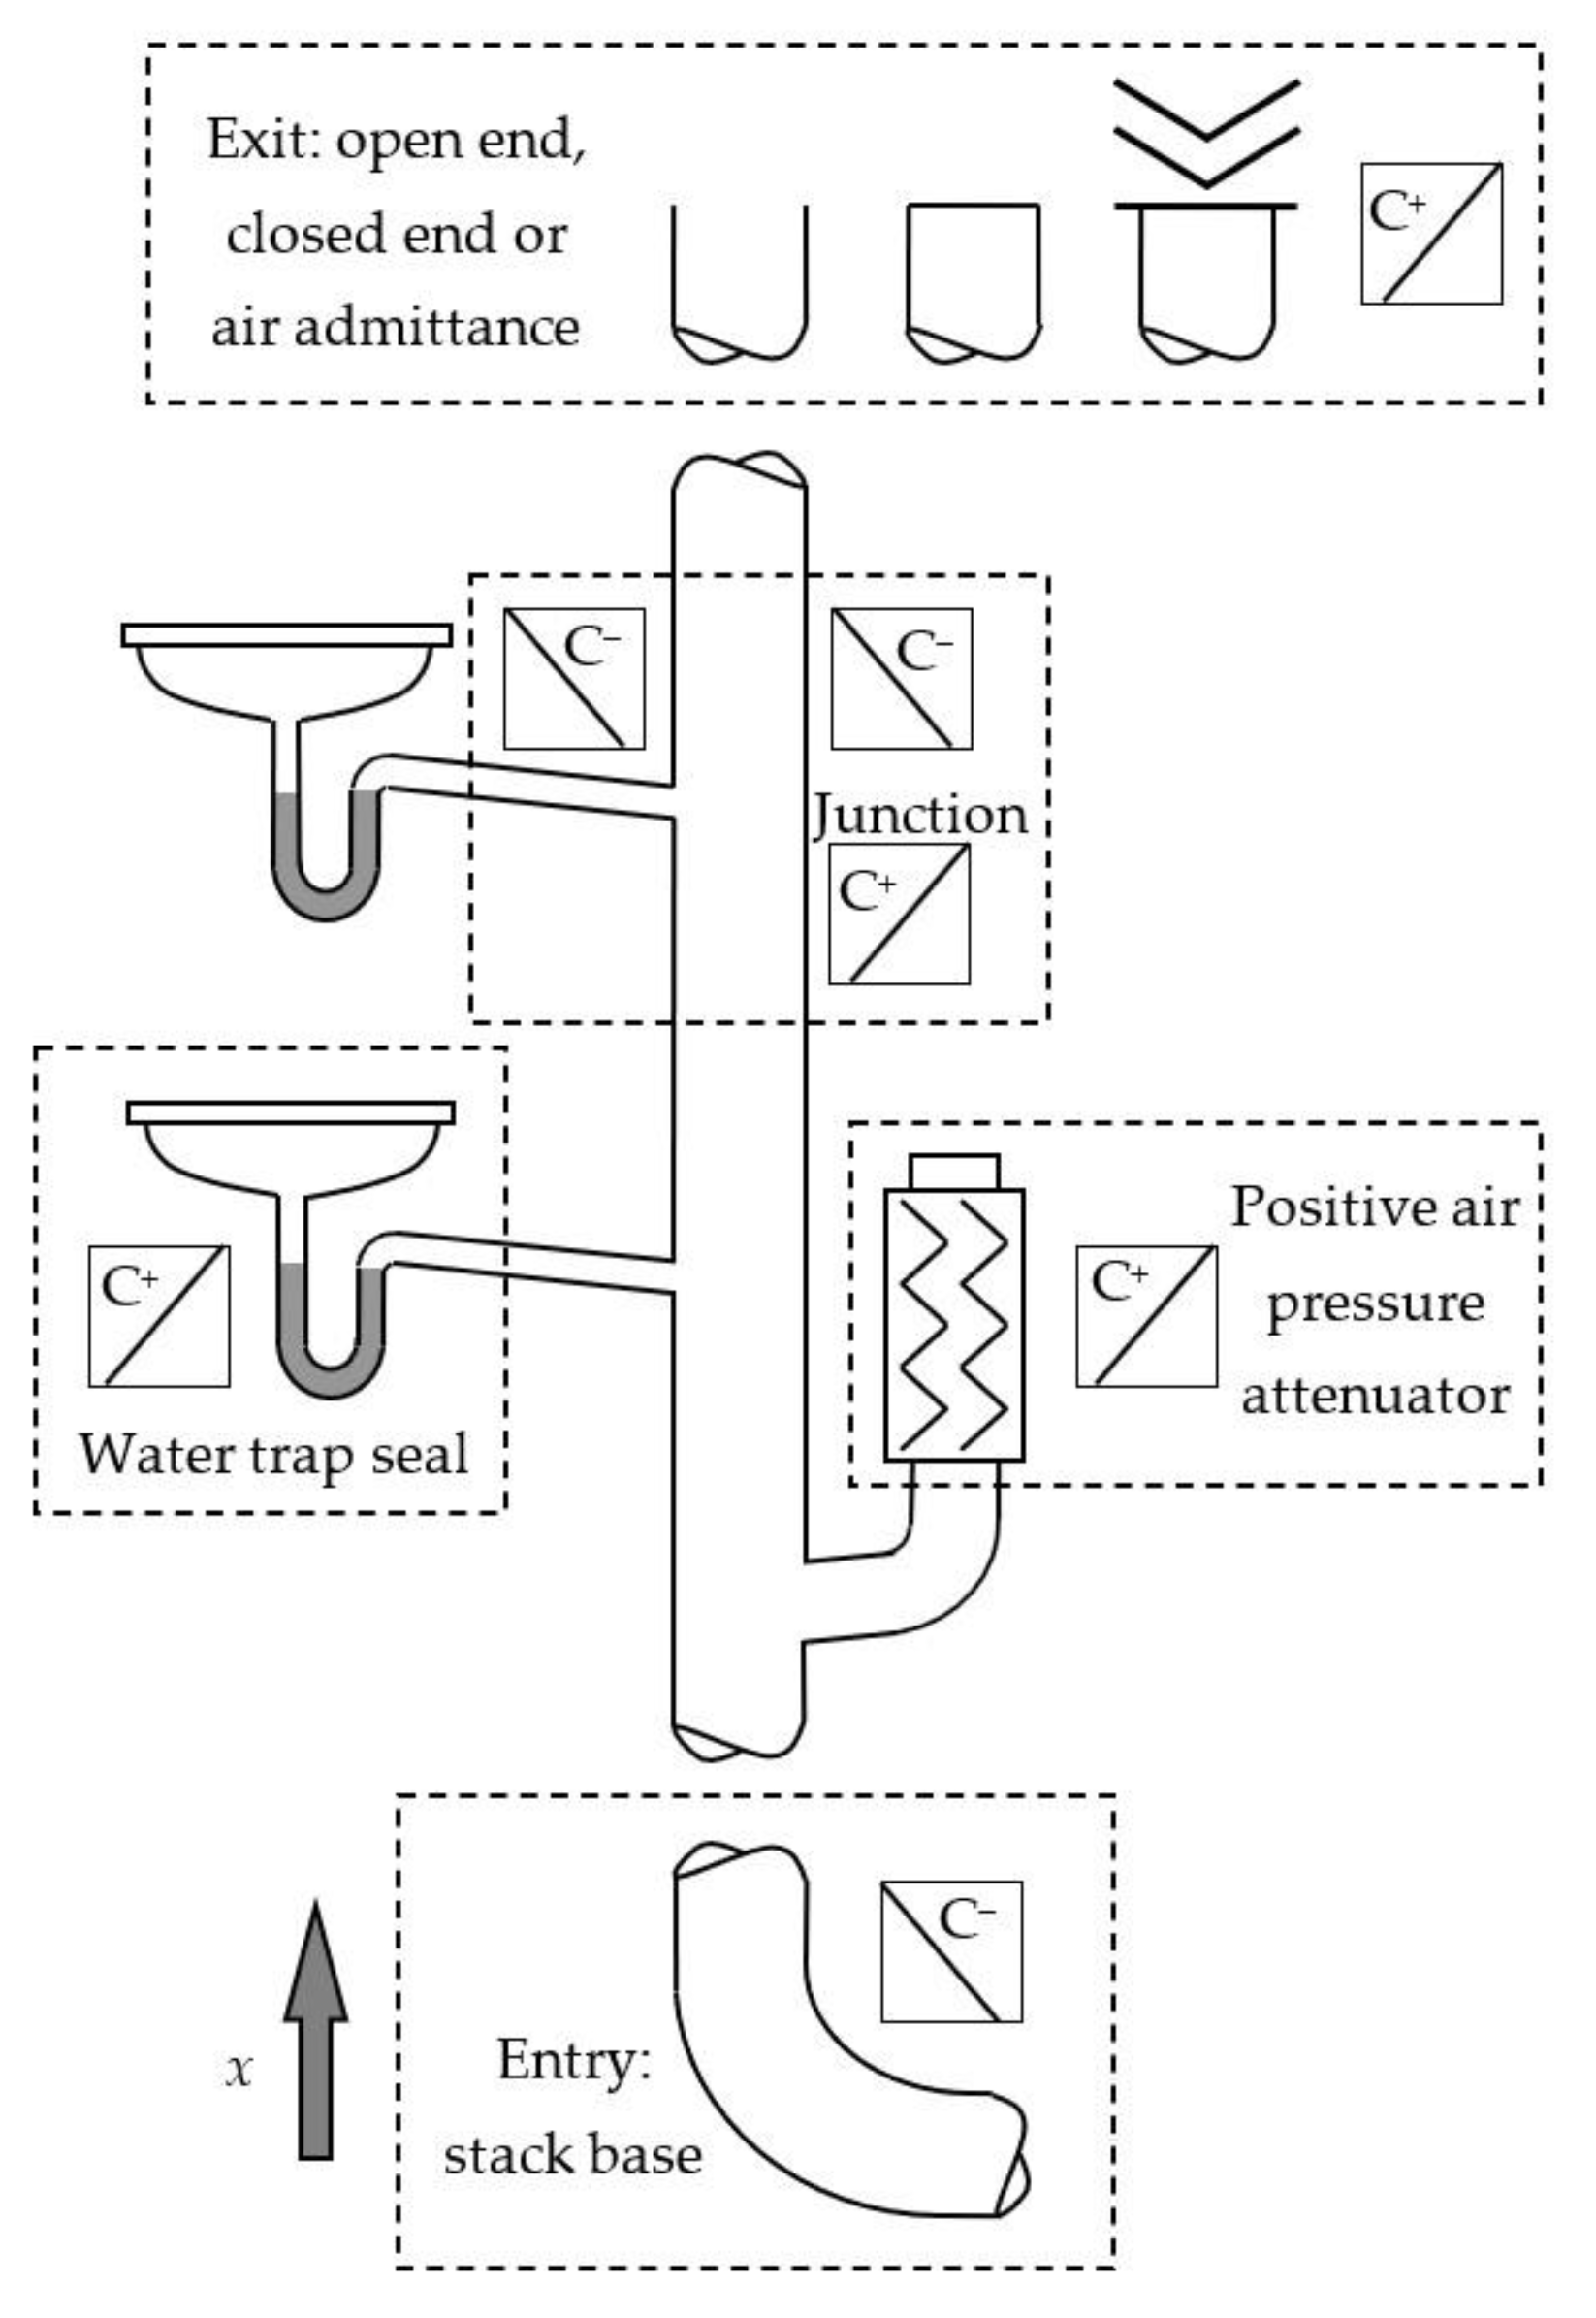
2.1. Numerical Method (AIRNET)

AIRNET is a method of characteristics based finite difference numerical model developed through extensive research at Heriot-Watt University [12]. By applying the method of characteristics solution to the fundamental St Venant equations of continuity and momentum, AIRNET simulates whole system responses to water flow and air pressure transients in a building drainage system.
Modeling air pressure wave propagation in a bounded conduit is suited to numerical techniques applicable to full bore fluid flow. Previous research [27] has developed the simulation techniques used extensively in this research to evaluate the risk associated with the generation and propagation of air pressure transients resulting from the presence of falling solids in drainage flows in vertical stacks. The program simulates the propagation of low amplitude air pressure transients using the fundamental St. Venant equations of momentum and continuity and by the numerical solution of these equations via the method of characteristics. The method is used to yield air pressure and velocity within a bounded duct system subjected to air pressure transient propagation [12,20].
The basic principles governing the airflow and air pressure regime in a building drainage system are defined in Figure 1. As water enters the stack from a branch and enters as an annular flow, an airflow is entrained into the network and leads to a suction pressure in the vertical stack. Pressure drops are experienced at the upper termination of the stack due to separation losses as the airflow passes through an AAV or open end. Frictional losses in the dry stack lead to a further pressure drop and can be calculated from an application of D’Arcy’s equation. A further pressure drop is evident as the entrained airflow passes through the unsteady water curtain found at the discharging branch. Figure 1 shows the positive pressure at the base of the stack as the airflow is forced through the water curtain formed at the bend at the base of the stack. These pressure losses in the stack may be combined as shown in Equation (2):
Δ p t o t a l = Δ p e n t r y + Δ p d r y _ p i p e f r i c t i o n + Δ p b r a n c h j u n c t i o n + Δ p b a c k p r e s s u r e
The “motive force” to entrain this airflow and compensate for these “pressure losses” is derived from the shear force between the annular terminal velocity water layer and the air in the wet portion of the stack. This can be considered as a “negative” friction factor, which generates an equal pressure rise—the equivalent to a fan characteristic drawing air through the stack. Ongoing research has identified the form and relationships governing this shear force representation and allows the prediction of the transient response of the stack network to variations in applied water downflows.
Of particular relevance is a more detailed investigation of the water annulus by particle imaging velocimetry [28], which arose as a result of the anecdotal observations of other workers of the persistent presence of water in the annular air core. Even at the time of these investigations almost two decades ago, it was clear that the isolation of unique terms to describe these factors in a way that could be used as a framework for inclusion in future design guide upgrades was required: a need that is now pressing.
The method of characteristics provides a flexible mathematical model, which can deal well with the representation of pressure transients in complex pipe and duct networks, and has become the standard solution technique applied to their analysis throughout the field [10,29].
The progression of calculations through the system can be represented by a two-dimensional grid, representing time, t and distance, x. The conditions at one point in the grid are based on the conditions at adjacent nodes upstream and downstream, one time step in the past and require a definition of the characteristic slope as a basis for calculation. From the grid in Figure 2, R and S represent points where conditions are known by interpolation between A, C, and B. The characteristic lines between R and P and S and P represent equations used to calculate the condition at point P. The line of communication formed by the characteristic slopes allows information regarding air velocity and wave speed and hence the pressure to be propagated throughout the network.
The characteristic slopes, PR, PS, are given by 1/u+c. If the velocity of the fluid is much less than the wave speed, then u << c and the variation in the slope of the characteristic line may be assumed negligible, and AR and BS are two points, removing the need to interpolate for conditions at R and S.
The basic equations of transient propagation, the St. Venant equations of momentum and continuity, may be shown to be a pair of quasilinear hyperbolic partial differential equations that may be transformed into a pair of total derivative equations, via the method of characteristics, which can be solved by a finite difference scheme.
The transformation of the St. Venant equations of continuity and momentum into the total derivatives required by the method of characteristics has been shown to be:
For C+, line PR is defined by Equation (3):
u P u R + 2 γ 1 ( c P c R ) + 4 f R u R | u R | Δ t 2 D = 0
when (Equation (4)):
d x d t = u + c
and for C line PS is defined in Equataion (5):
u P u S 2 γ 1 ( c P c S ) + 4 f S u S | u S | Δ t 2 D = 0
when (Equation (6)):
d x d t = u c
In the case of a building drainage system, fS and fR are functions of time, location and annular water downflow and hence act as drivers in the simulation by generating the entrained airflow within the wet stack or as determinants of the frictional losses in the dry stack. The expression in Equation (7) is know as the Courant criterion and must be adhered to to ensure stability:
d x d t = u ± c
The definitions in Equations (3) and (5) may be reduced such that the resultant expressions are based around two simultaneous first-order equations linking wave speed and flow velocity. For the C+ characteristic, the relationship is defined in Equation (8):
u P = K 1 K 2 c P
and for the C characteristic, the relationship is defined by Equation (9):
u P = K 3 + K 4 c P
where K1–4 are defined in Equations (10)–(12):
K 1 = u R + 2 γ 1 c R 4 f R u R | u R | Δ t 2 D
K 2 = K 4 = 2 γ 1
K 3 = u S ( 2 γ 1 ) c S 4 f u S | u | Δ t 2 D
The pressure can then be calculated from the gas laws using the expression in Equation (13):
P p = [ ( P o ρ o γ ) ( γ c 2 ) γ ] 1 ( 1 γ )
The time steps between calculations are critical and depend upon the Courant criterion, as defined in Equation (14):
Δ t Δ x ( u + c ) max
Although the time step will vary with wave speed, the variations will be minimal, dependent only on variations in air pressure—itself minimal. For the simulation to begin, conditions throughout the network at time zero must first be defined. For the analysis to progress, theoretical or empirical relationships describing the physical conditions at system boundaries are required. The use of such equations, commonly referred to as boundary conditions, allows the continuation of the model into subsequent time steps. Common boundary conditions within the building drainage system include; pipe junctions, water-trap seals, open terminations, and air admittance valves, see Figure 3.

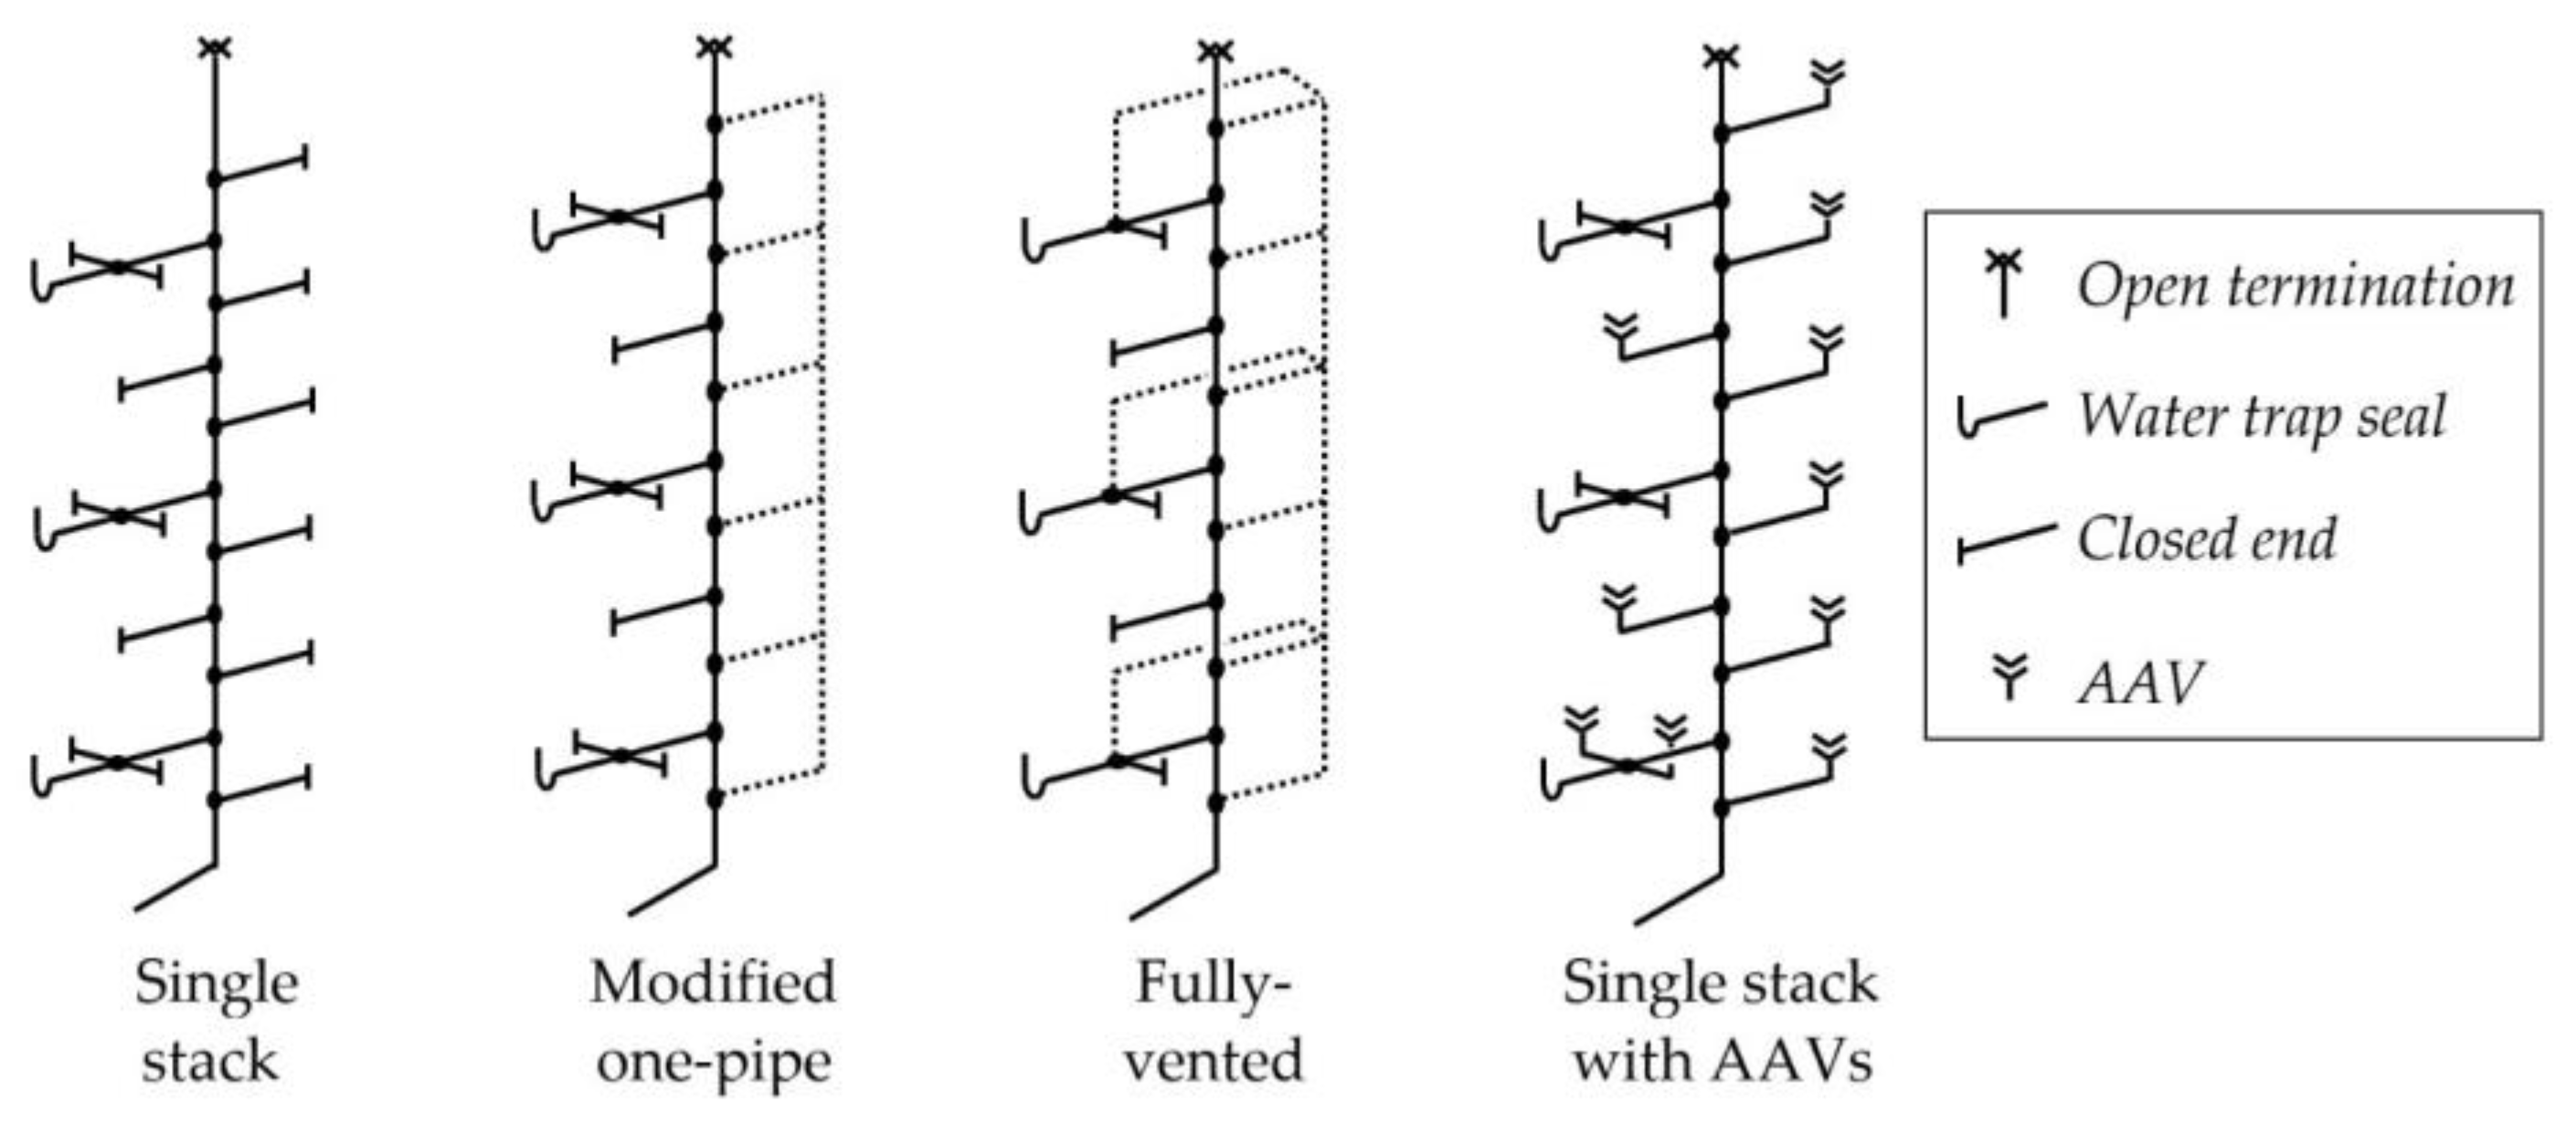
2.2. System Configurations

To examine the effect of different design approaches on the performance of building drainage systems, numerical simulations were prepared based on four of the main system configurations outlined in the UK’s current design guide (BS EN 12056-2:2000). These include: (i) the single-stack system; (ii) the modified one-pipe system; (iii) the fully-vented system; and (iv) the single-stack system incorporating air admittance valves (AAVs), see Figure 4. The first three systems are referred to as having passive ventilation because, during appliance water discharge, the required airflow enters and moves around the system via the fixed pipework, while the fourth system is referred to as having active ventilation because the required airflow enters the system at the AAV.
Two building heights were used: 36 m (equivalent to a 10 story building) and 72 m (equivalent to a 20 story building). The system configurations were simplified so that pipe branches with active water-trap seals were located only at the bottom, middle, and top of each system. For the 10 story building, these branches were located on floors 2, 6, and 10; and for the 20 story building, the branches were located on floors 4, 12, and 20. The connections at intermittent floors were either designated as closed ends or incorporated into the venting arrangements depending on the system configuration.
Table 1 summarizes the pipe dimensions used in each of the system configuration simulations. Most of the relevant pipes for each system were standardized. The only differences were between the stack pipes and vent pipes for the 10 story and 20 story, increasing from 3 m to 6 m, and 6 m to 12 m, respectively. The only other difference was that the 10 story building was simulated with a 100 mm diameter stack and then a 150 mm diameter stack to look at the effect of stack diameter, while the 20 story building was simulated with a 150 mm diameter stack only.
In each case, an appliance water discharge flow profile was applied along the height of the stack to simulate the accumulation of flow from adjoining branch flows. Figure 5 shows the distribution of inflow for both the 100 mm and 150 mm diameter stacks. The flow increases incrementally towards the base of the stack, simulating a realistic flow scenario until the maximum flow rate for each stack diameter is reached: 5.2 L/s for a 100 mm diameter stack and 12.4 L/s for a 150 mm diameter stack (as recommended in BS EN 12056-2:2000). We have chosen the water profiles given above to represent a maximum flow rate allowed for the pipe dimensions adopted to measure the response of the system to transient flows. The profile is ramped up to the maximum in order to represent a compromise between assessing the response of the system to both steady and unsteady (transient) conditions.

2.3. Model Setup

For each simulation, the numerical model parameters were set as follows: the pipe length step, dx, was set to 0.25 m; the time step, dt, was set to 0.05 s; and the pipe friction factor, f, was set to 0.03. All simulations were set to run for a duration of 10 s.
The water-trap seal depth, as illustrated in Figure 1, was set to 50 mm, which is the minimum permitted in the UK’s current design guide (BS EN 12056-2:2000) and also that stated in the Australian/New Zealand design guide, and similar to the 2 inches (equivalent to 50.8 mm) recommended by the UPC and IPC in the United States.

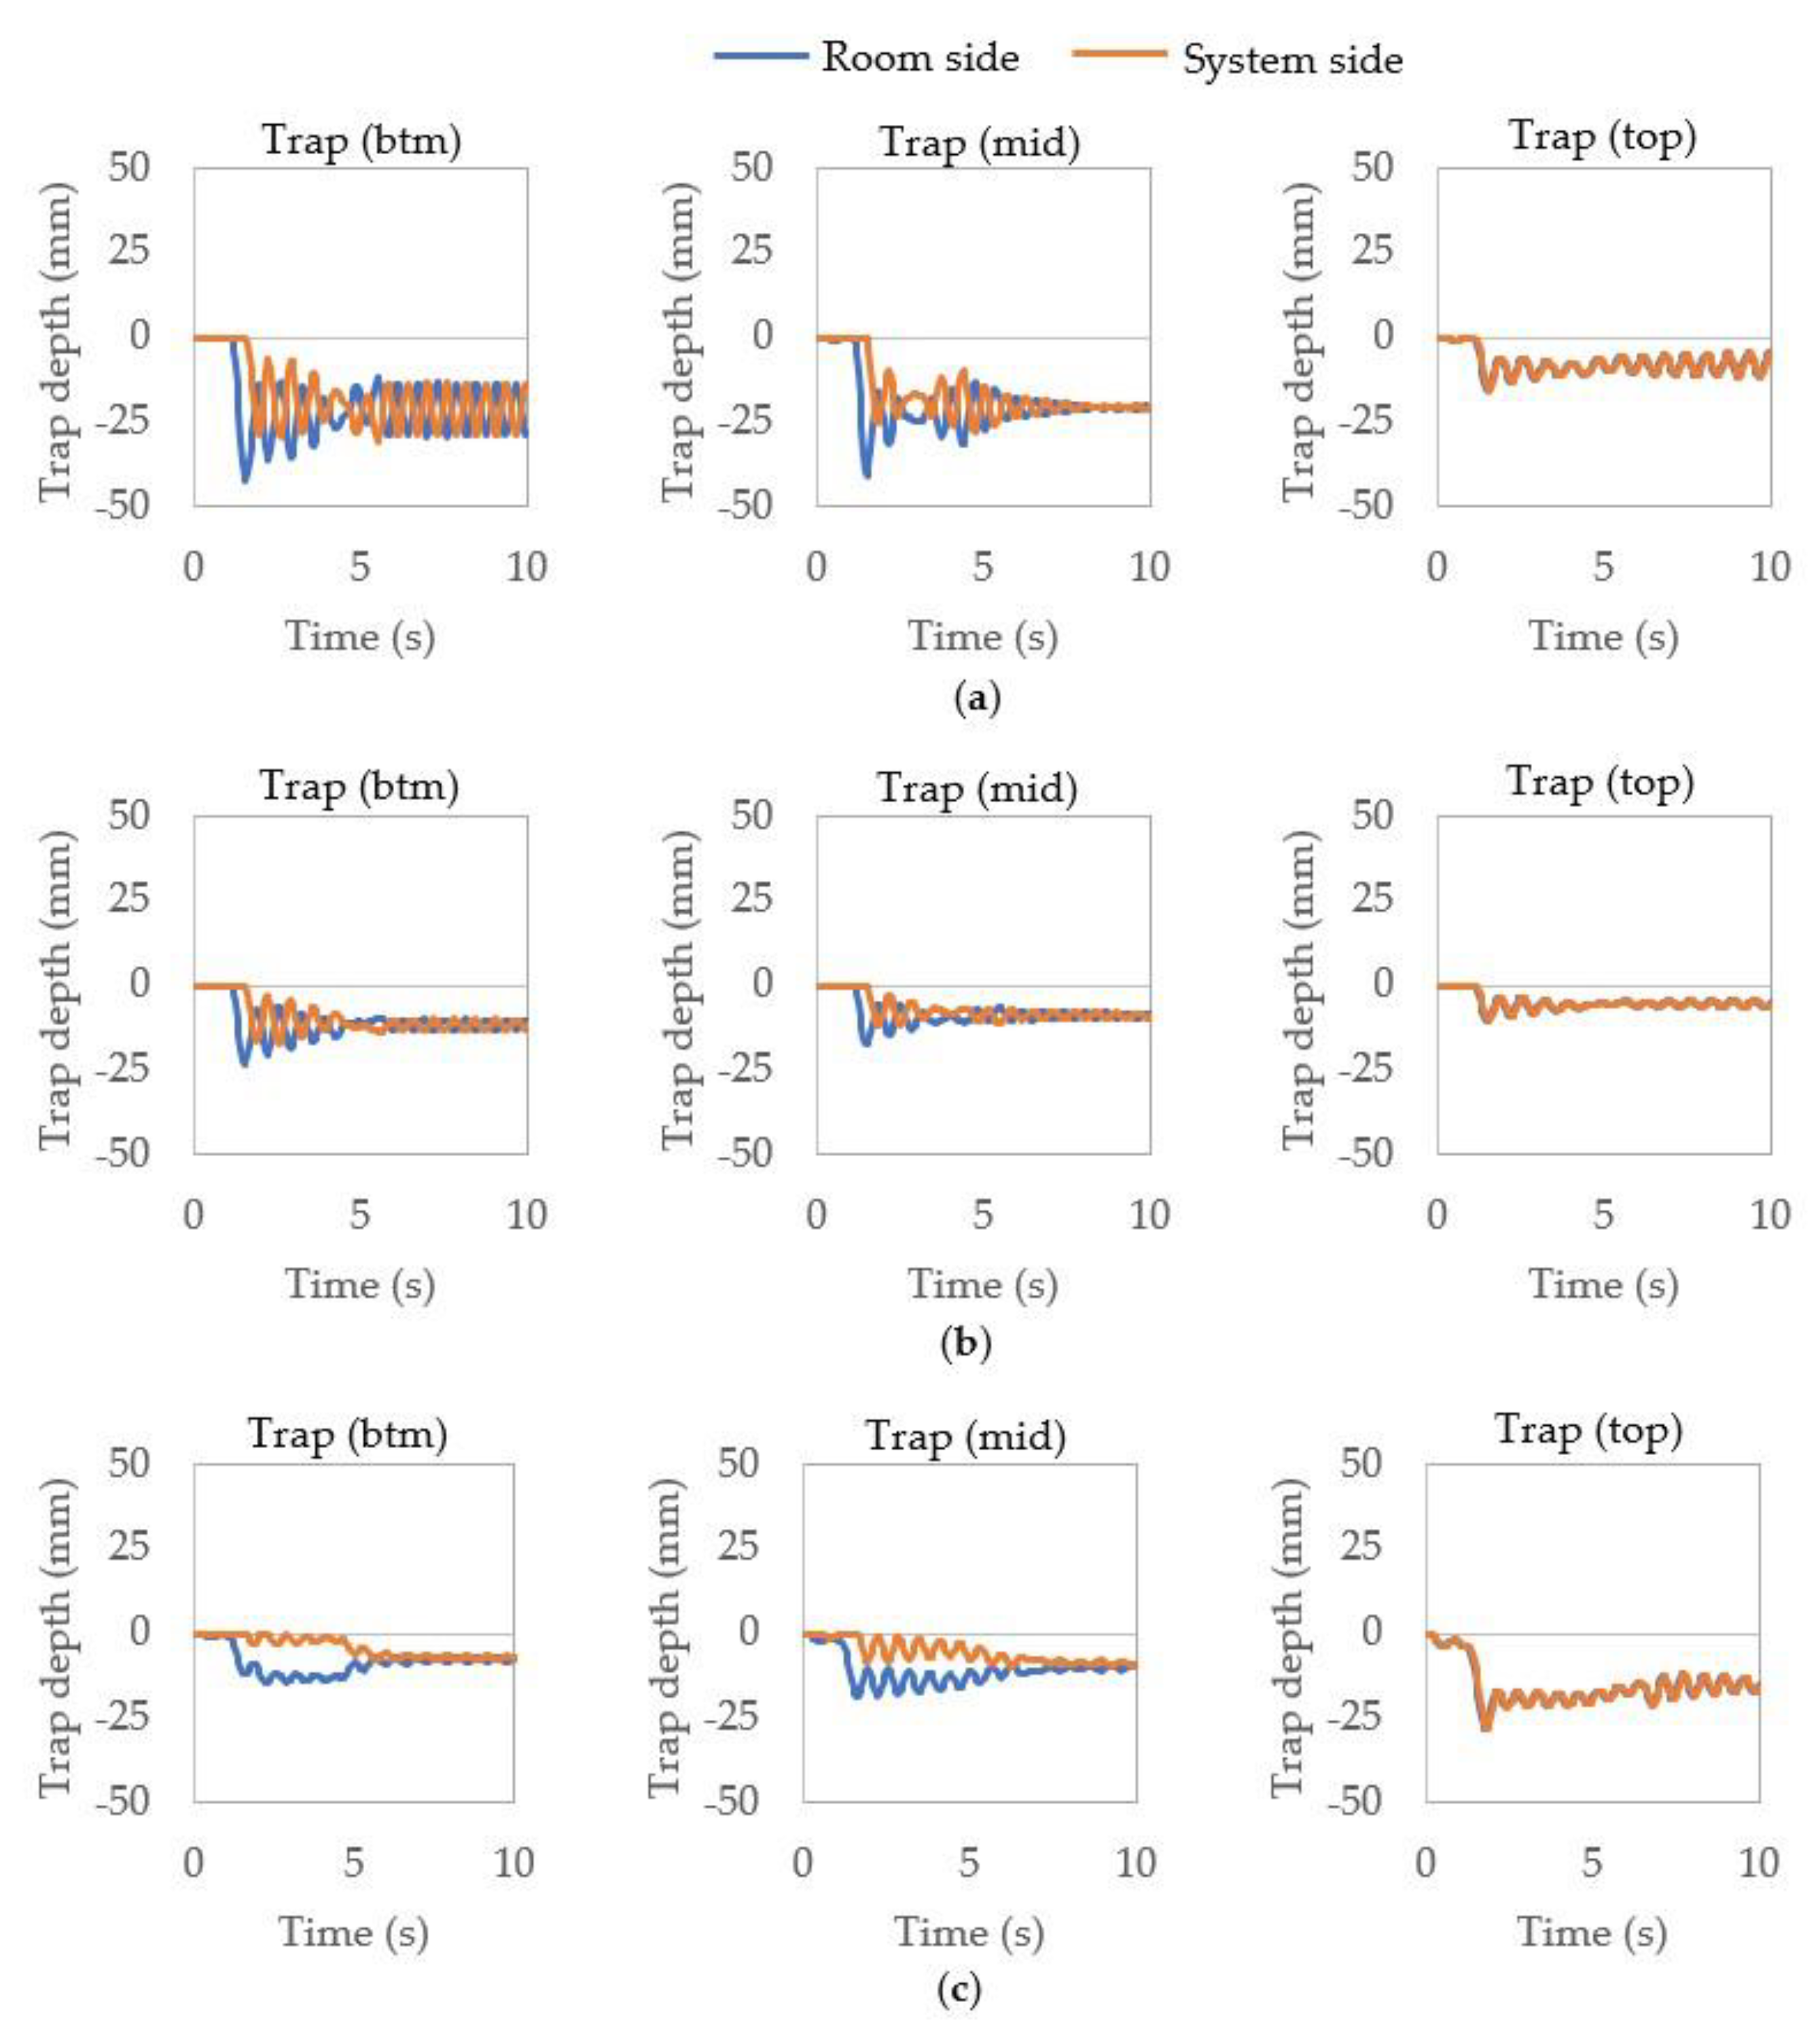
3. Results and Discussion

The operational performance of each system configuration and building height was simulated using AIRNET. This enabled an accurate assessment and comparison of systems designed to the UK’s current design guide (BS EN 12056-2:2000) to be made.
An important parameter of assessment was the response of the system’s water-trap seals during the maximum permitted appliance water discharge flows, as this provided a measure of the system’s ability to retain its integrity and safeguard the building against the cross-transmission of foul air from within the system. The additional parameters of the stack pressure profile and system airflows (which both have an effect on the water-trap seal response) were also assessed.

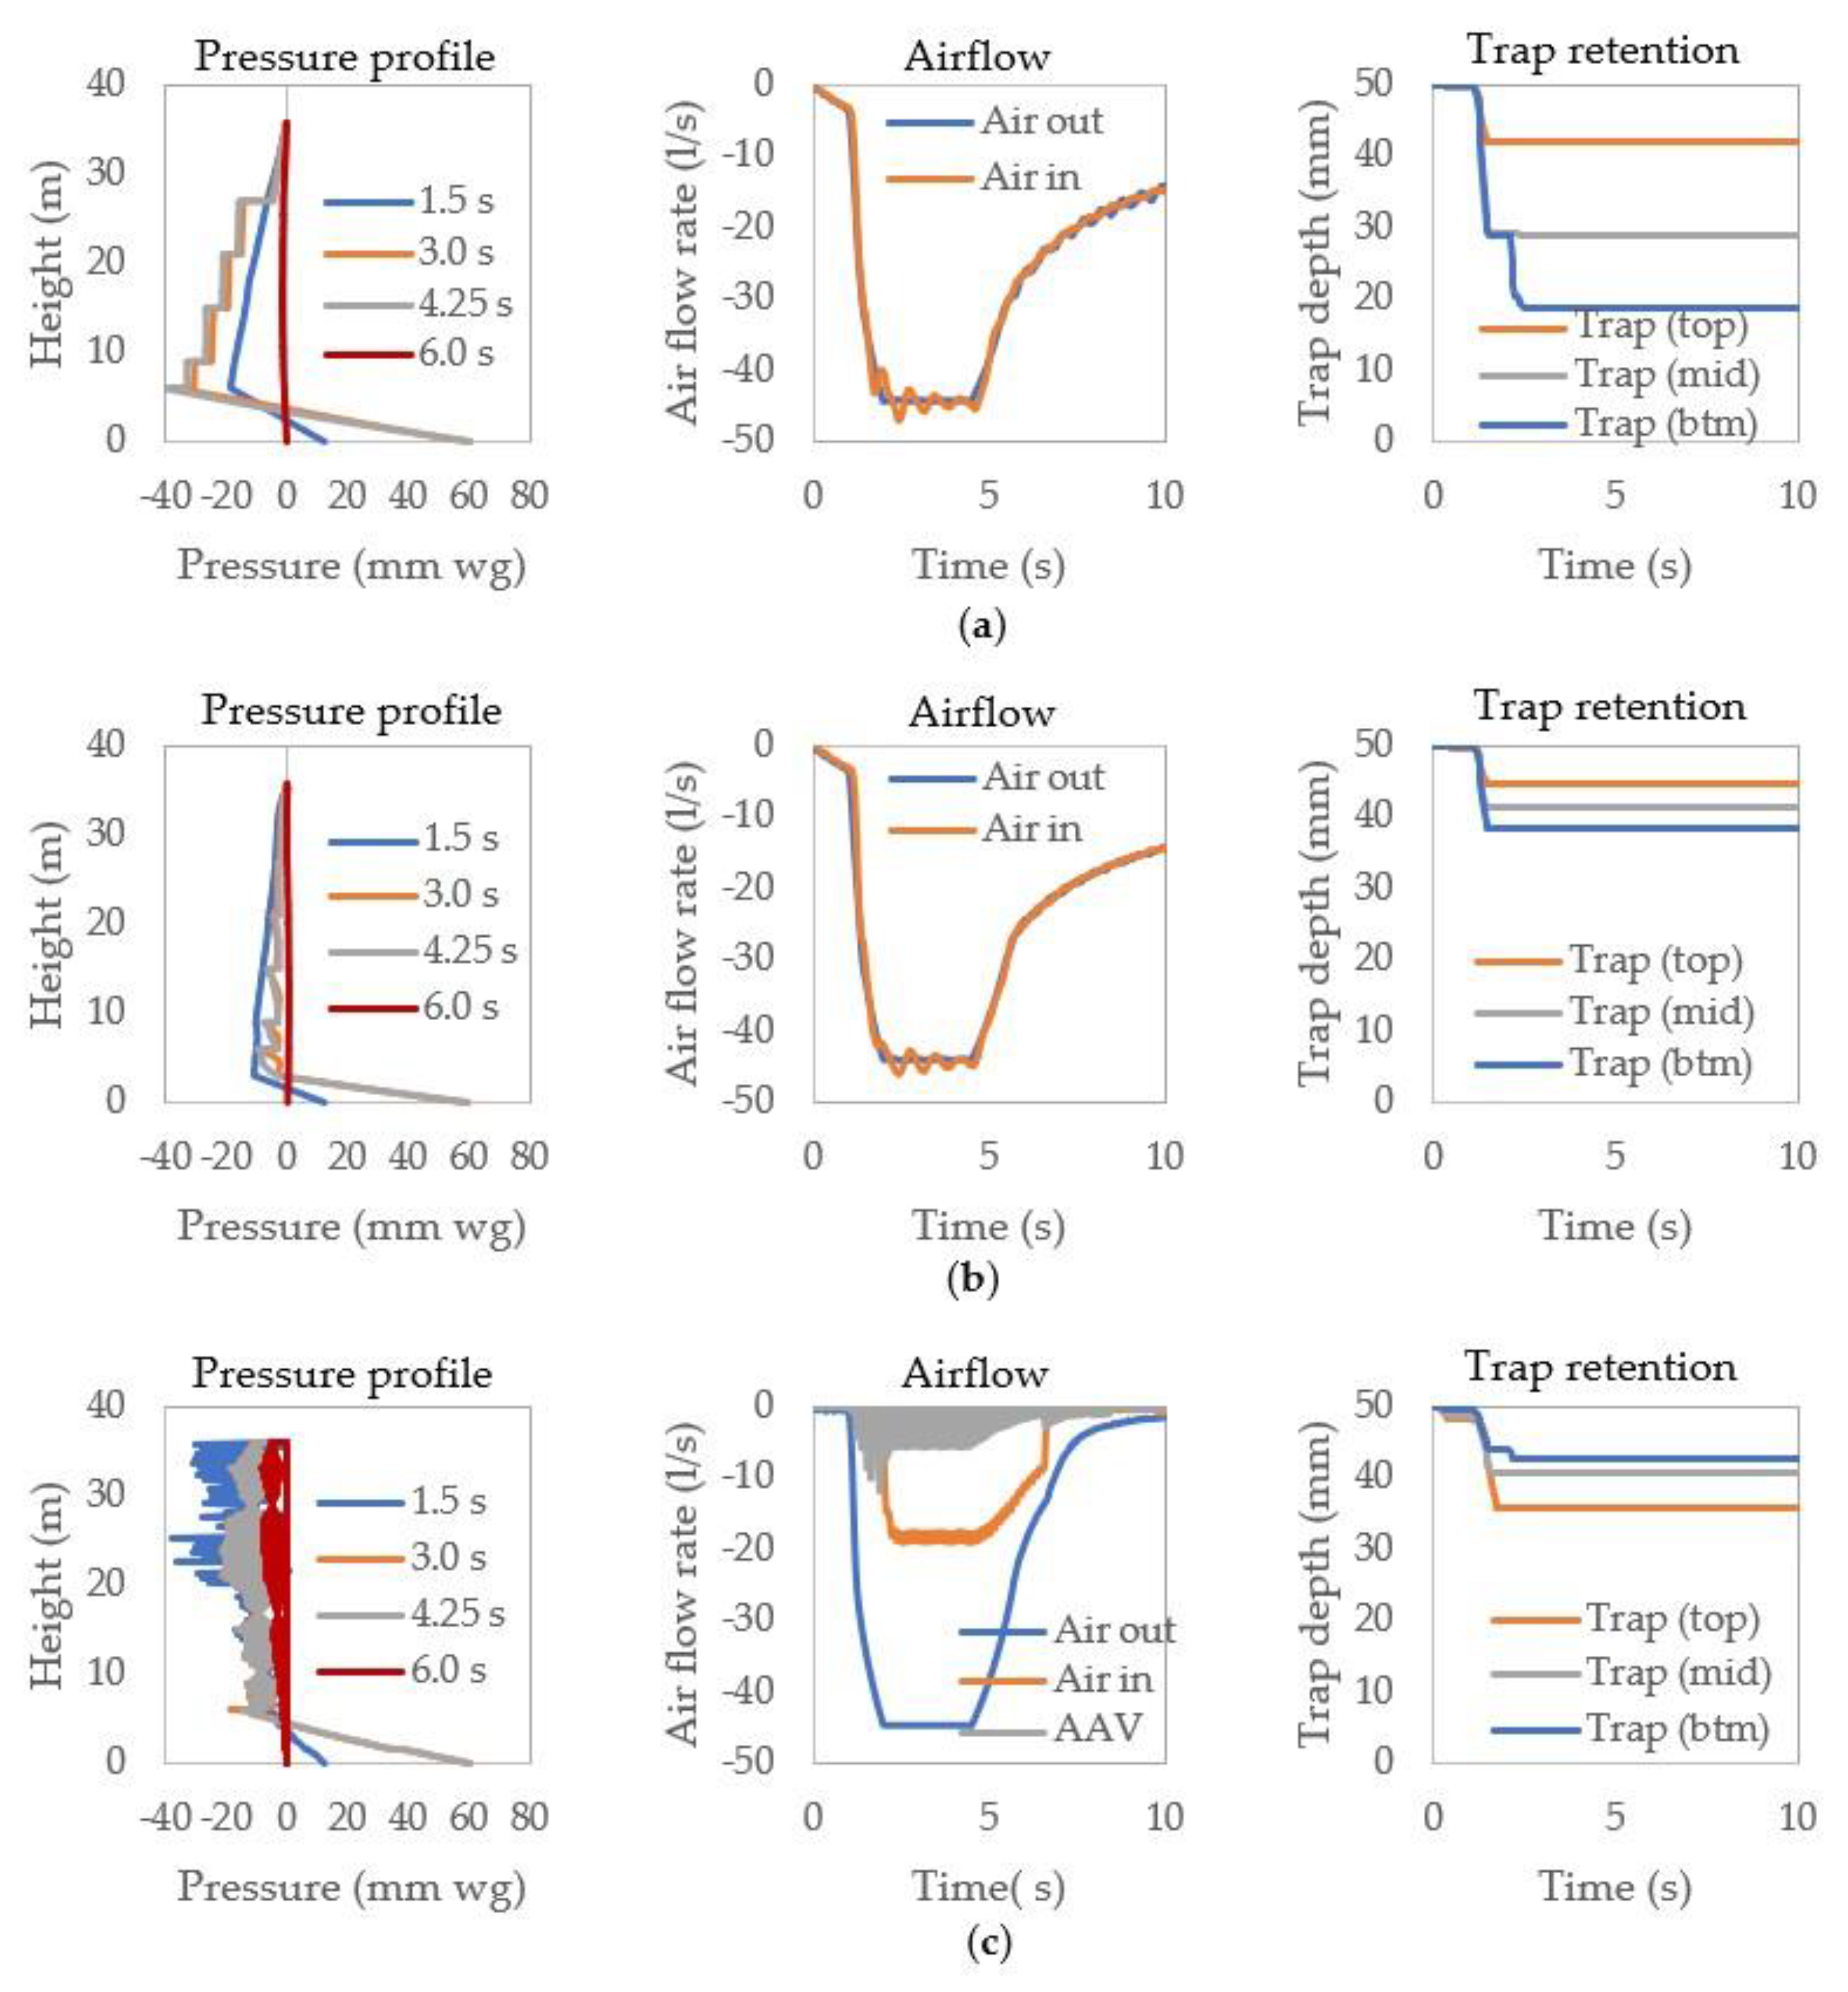
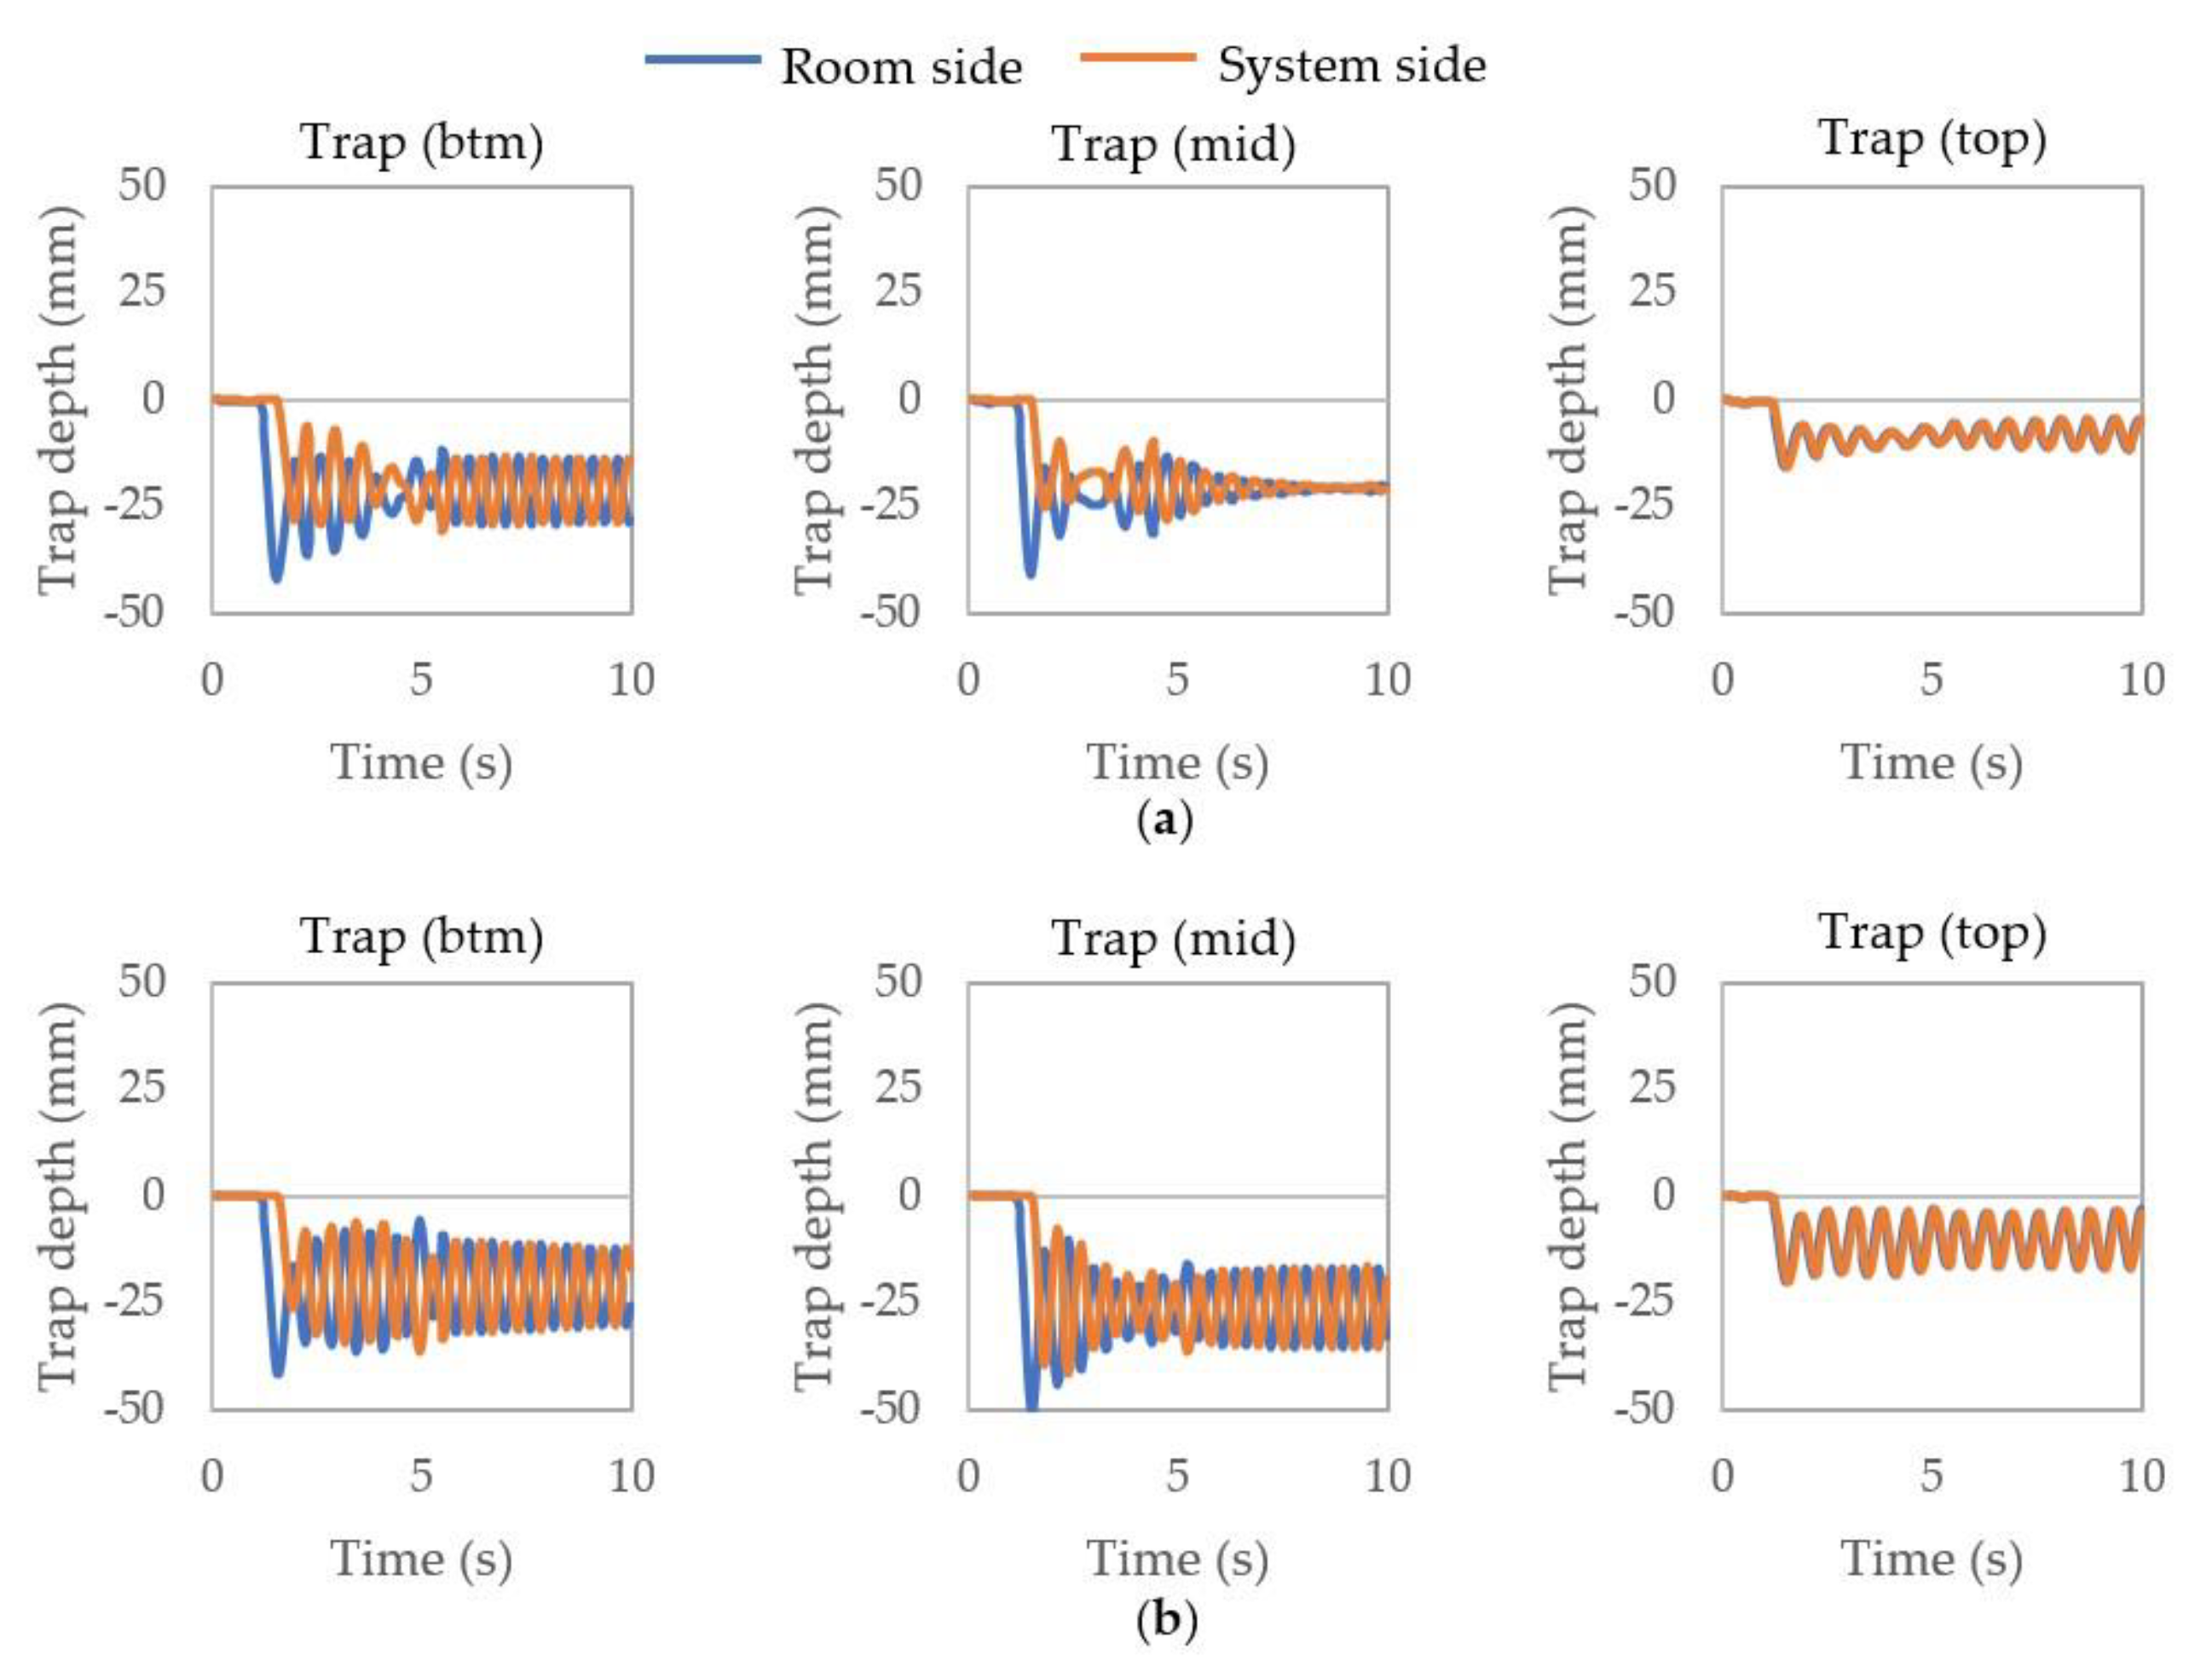
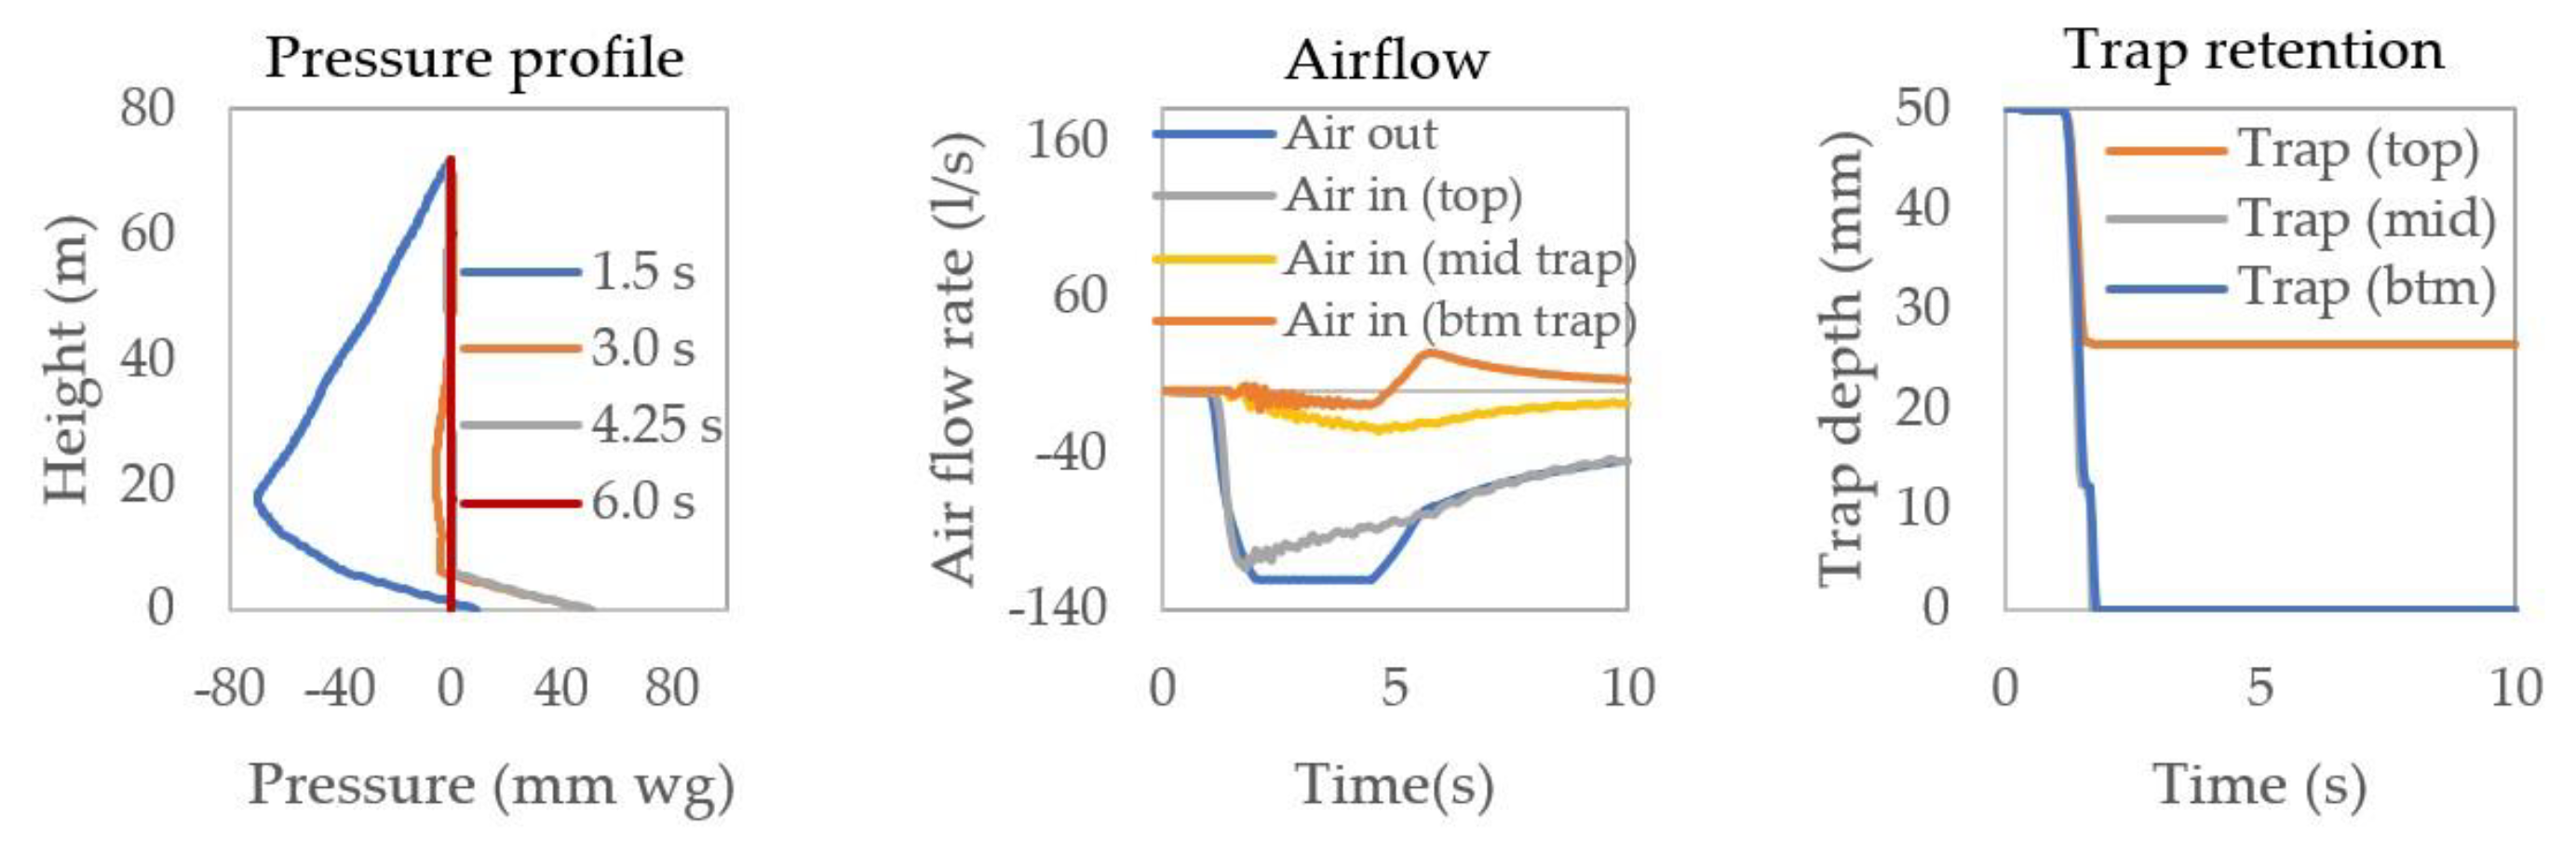
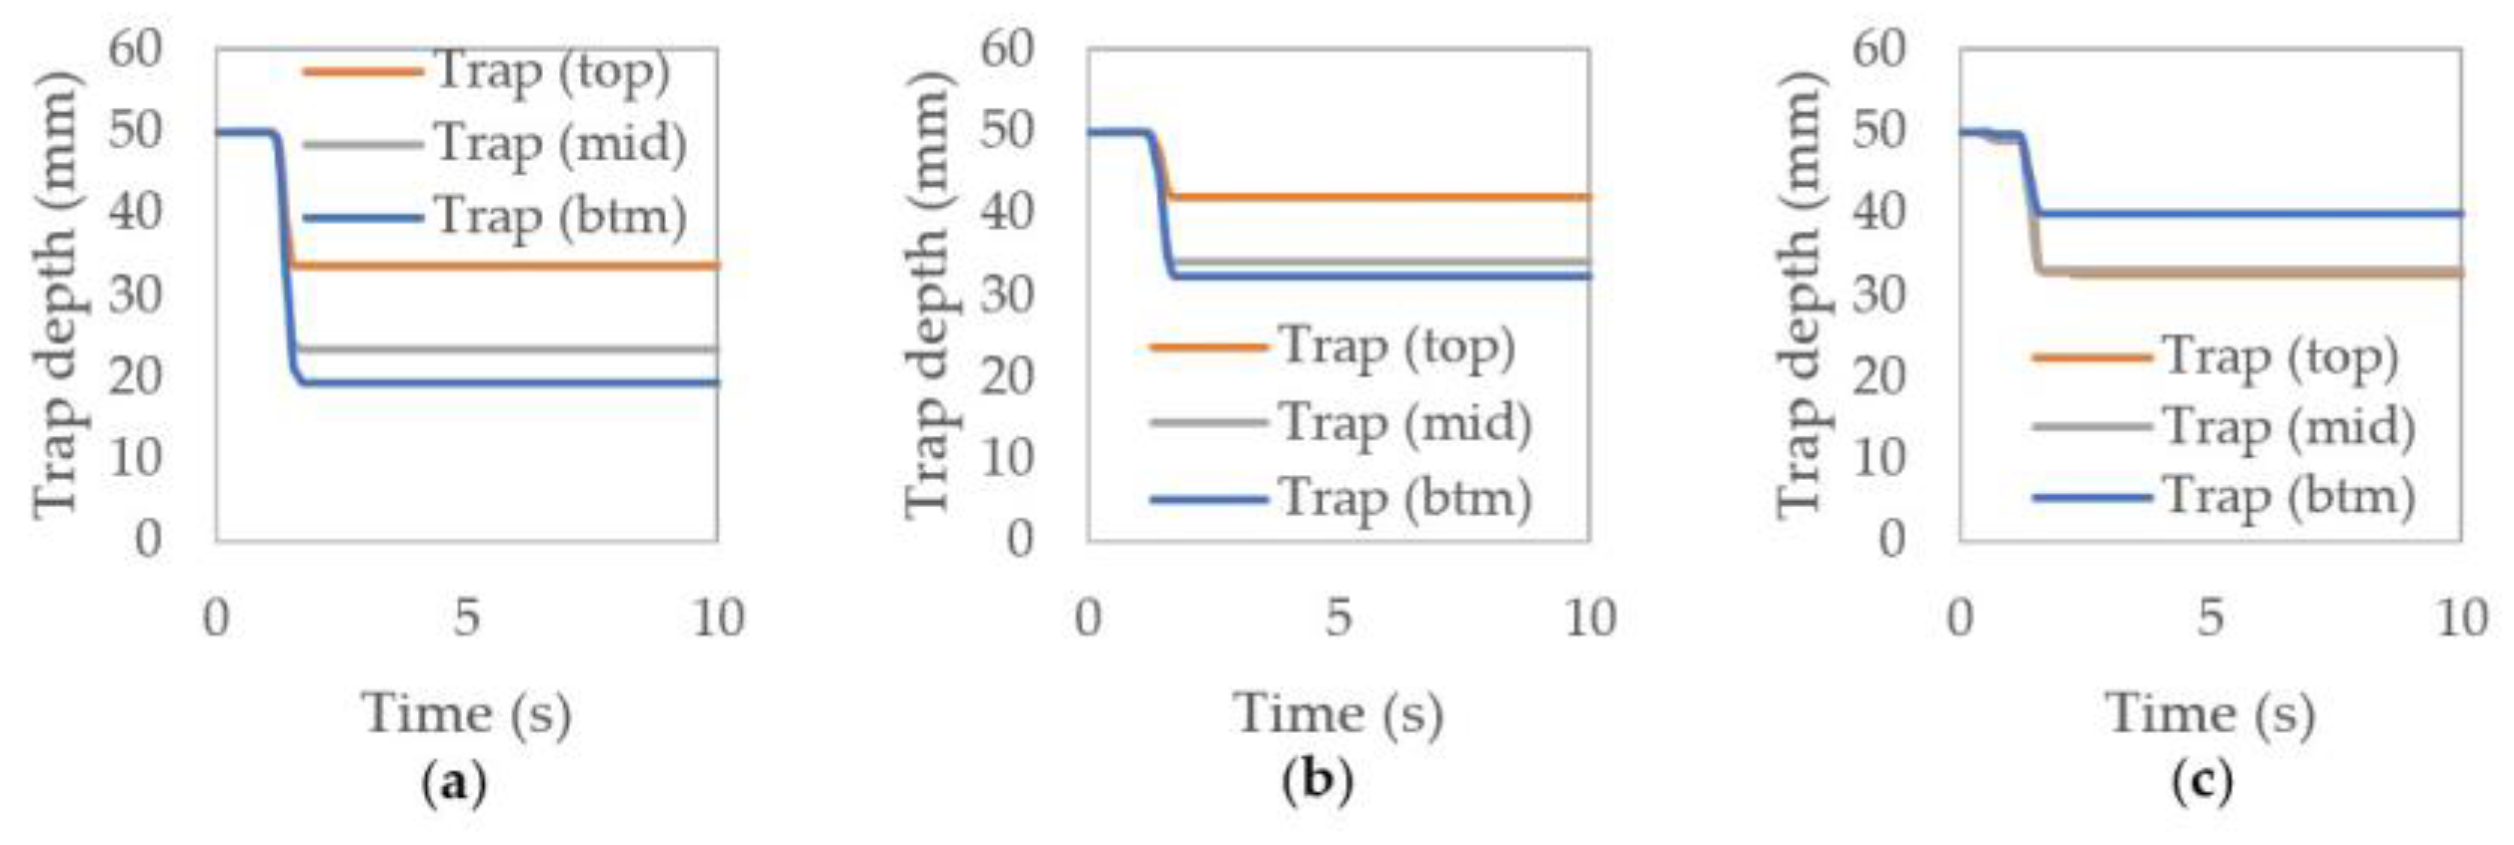
3.1. System Configuration (Passive vs. Active)

The impact of system configuration on operational performance is illustrated in Figure 6, which compares the water-trap seal fluctuations during appliance wastewater discharge for the 10 story single-stack, fully-vented, and single-stack with AAVs (each with a 100 mm stack diameter). For each system, the response of the water-trap seals located at the bottom (btm), middle (mid), and top of the stack are presented and depict the fluctuations in water seal depth on both the room side and system side of the trap.
The water-trap seal at the bottom of the single-stack system can be seen to be the most affected with initial fluctuations of around 42 mm, which, while beginning to attenuate, continue to fluctuate throughout the 10 s duration of the simulation. The water-trap seal at the middle of that stack has an initial fluctuation of around 41 mm but attenuates more quickly, whereas the trap at the top of the stack has lower fluctuations of around 16 mm. As the appliance water discharge flow is achieved incrementally down the stack height and reaches maximum flow at the bottom of the stack (as shown previously in Figure 5), the traps lower down the stack are, therefore, more affected and, as a result, can be seen to have a lower retained water level (not returning to the 0 mm datum).
The response of the water-trap seals in the fully-vented system is improved, aided by the additional ventilation provided by the ventilation pipework (vent pipes, cross vents, and branch vents). The maximum water-trap seal fluctuations for the bottom, middle, and top trap are 23 mm, 17 mm, and 10 mm, respectively. Each trap does, however, lose some water during the appliance water discharge, having a lower retained water level as a result.
Adding AAVs to the single-stack system reduces the water-trap seal fluctuations in a similar way to the fully-vented system. Where AAVs are located on the water-trap seal branch, such as for the trap at the bottom of the stack (see Figure 4), the resultant fluctuations are reduced to a maximum of just 14 mm. The fluctuations at the middle and top traps (maximums of 19 mm and 28 mm, respectively) are slightly higher than those at the bottom trap as the upper two traps do not have AAVs located on the water-trap seal branch.
The operational performance elements of stack pressure profiles, airflows, and resultant trap retention depths for the 10 story building with a 100 mm diameter stack are shown in Figure 7 for the same three system configurations of single-stack, fully-vented, and single-stack with AAVs. The stack pressure profiles are displayed for four timesteps (1.5 s, 3.0 s, 4.25 s, and 6.0 s) across the simulation test period. The profile can be seen to change during the appliance water discharge (varying from atmospheric pressure before the water discharge begins, to a maximum negative pressure towards the base of the stack during full discharge flow, before then returning to atmospheric pressure once the water discharge has ended). The maximum negative pressure in the single-stack system reaches almost −40 mm water gauge (wg) at 4.25 s. This reduces to −10 mm wg for the fully-vented system, showing a clear improvement to the operational performance of the system due to the increased ventilation. The stack pressure profile of the single-stack with AAVs is quite different as it shows more pressure fluctuations across the height of the stack due to the operation of the distributed AAVs in permitting localized airflow into the system at the point of need.
The airflow induced by the discharging water flow is also shown in Figure 7. It shows the air in to the system (via the open stack termination for the single-stack and fully-vented system; and via both the open stack termination and system AAVs for the single-stack with AAVs system) and the air out of the system (to the sewer). As each system is subjected to the same discharge water flow, the induced airflow out of the system (air out) is the same in each case. The air in, however, varies depending on the ventilation configuration. The air in for the single-stack and fully-vented system (that from the open stack termination) looks quite similar in terms of airflow and matches closely to the airflow rate of the air out, but the way the air moves within the system varies considerably as the vast majority of the airflow in the single-stack system moves primarily within the stack itself, while for the fully-vented system the moving airflow is divided across the additional ventilation pipework. The biggest difference of the air in can be seen for the single-stack system with AAVs. The air in from the open stack termination is considerably lower than air out, and the make-up air is brought into the system from the connected AAVs (the airflow from one AAV is shown in Figure 7c for illustration).
The final element of operational performance shown in Figure 7 is the important measure of water-trap seal retention depth following the applied water discharge flow. The trap depths for those in the single-stack system are most affected, with traps connected lower down the stack having the lowest depth retention: bottom trap (19 mm retained); middle trap (29 mm retained); and top trap (42 mm retained). This is considerably improved for the fully-vented system: bottom trap (41 mm retained), middle trap (29 mm retained), and top trap (45 mm retained). Inclusion of the AAVs on the single-stack increases trap retention when compared to the single-stack system, with the bottom trap retaining the most amount of water due to the AAVs connected to the branch: bottom trap (43 mm retained); middle trap (41 mm retained); and top trap (36 mm retained). A minimum retained trap seal depth of 25 mm is required (as set out in BS EN 12056-2:2000), and it can be seen that the bottom trap of the single-stack system fails to retain this minimum depth.

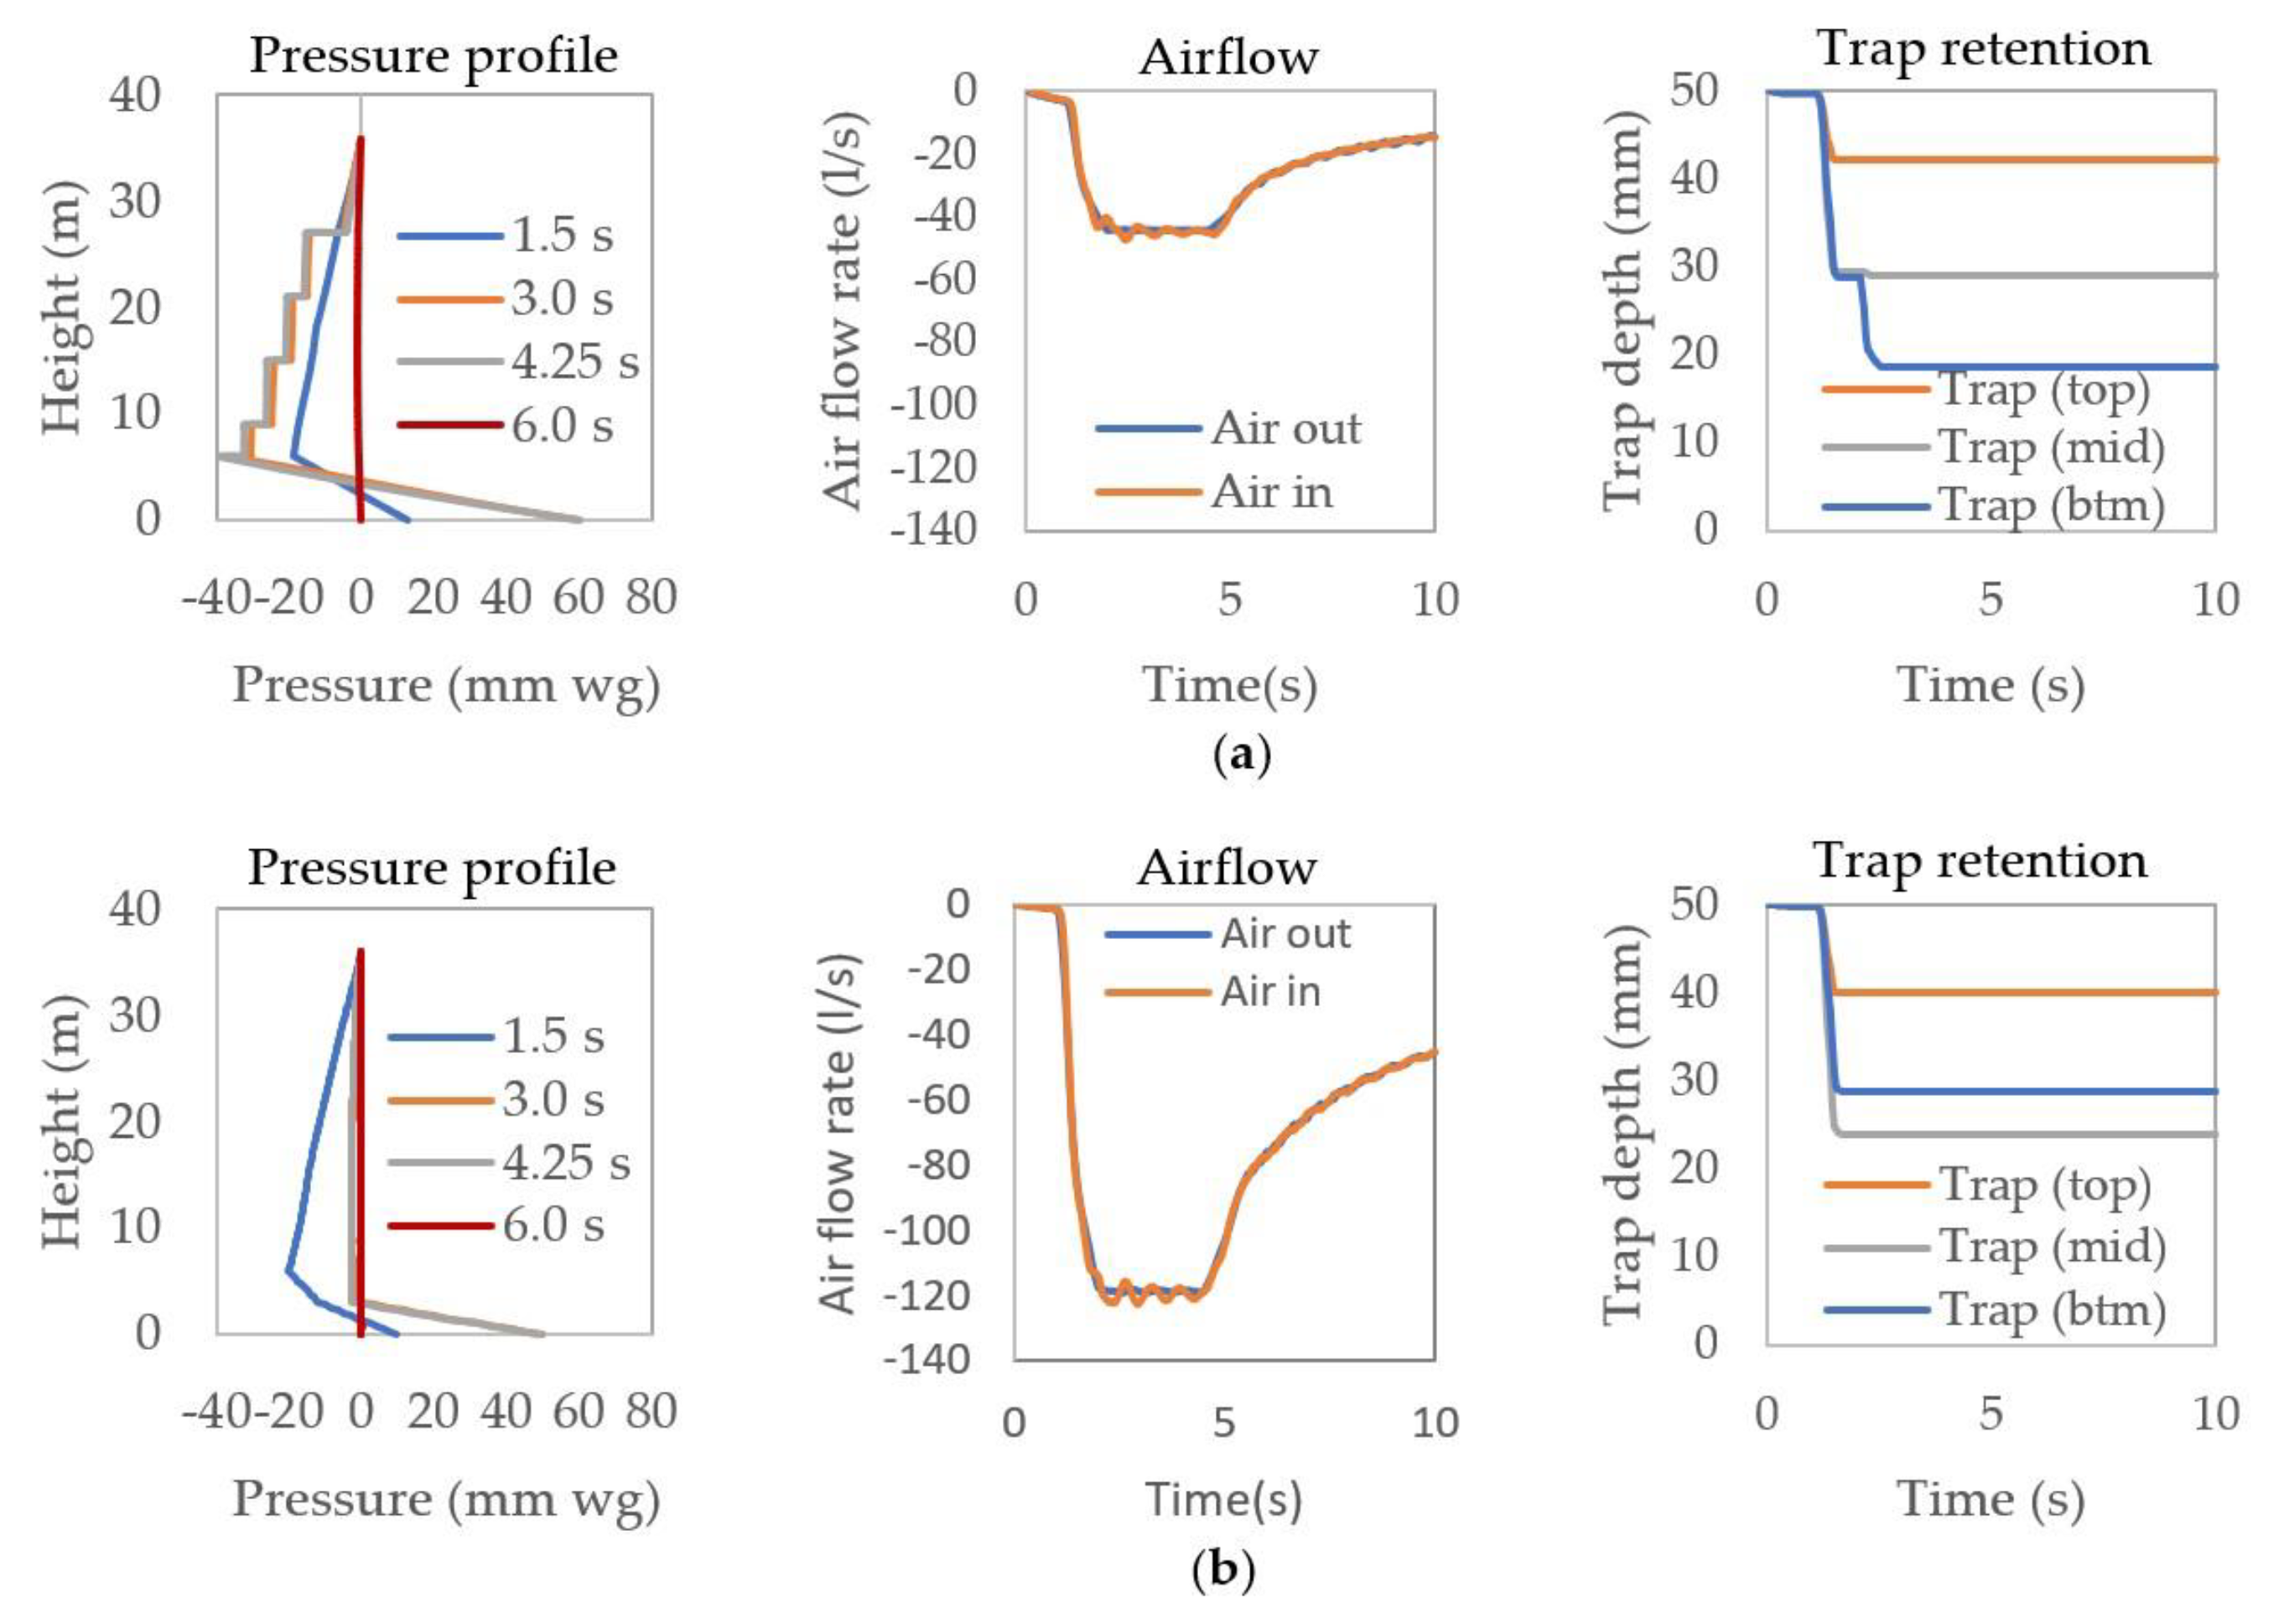
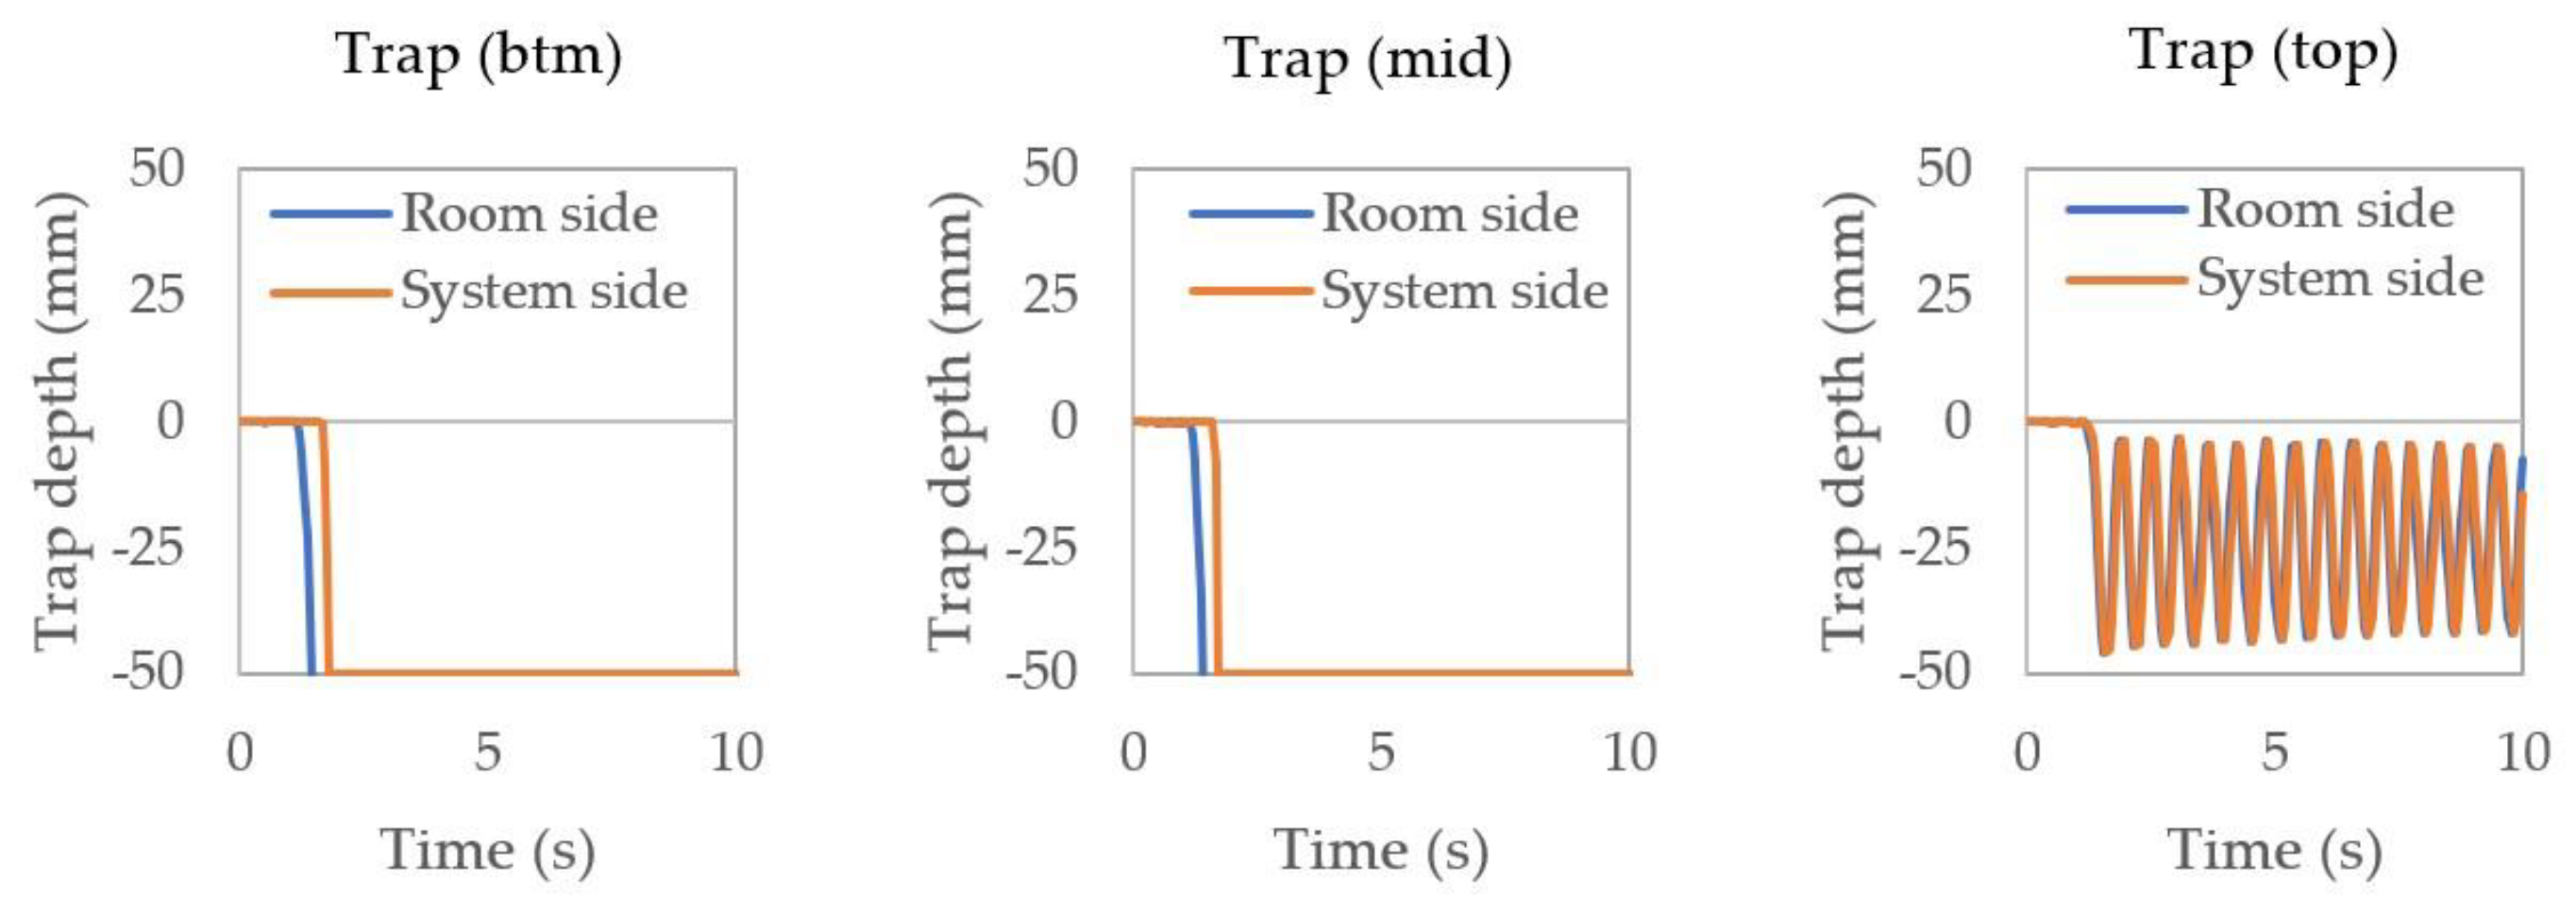
3.2. Stack Diameter (100 mm vs. 150 mm)

The consequence of fully loading the 100 mm and 150 mm diameter stacks with the maximum recommended water flow rates is illustrated in Figure 8. As an example, the water-trap seal response for the 10 story single-stack system configuration is compared for both the 100 mm diameter stack (with the maximum water flow rate of 5.2 L/s) and 150 mm diameter stack (with the maximum water flow rate of 12.4 L/s).
It can be seen that the water-trap seals on the 150 mm stack are subject to a greater number of larger fluctuations over the simulated test duration, most likely due to the increased water discharge flow rate and associated induced airflow. While this results in only slightly larger initial fluctuations: 42 mm, 50 mm, and 20 mm for the bottom, middle, and top traps, respectively compared to that of the 100 mm diameter stack (42 mm, 41 mm, and 16 mm), the 50 mm fluctuation at the middle trap on the 150 mm stack represents a complete drop in water seal depth permitting a momentary breach in system integrity and posing a potential cross-transmission route. It should be noted that the other system configurations performed better than the single-stack comparison used in this example, with no other breaches detected for either the 100 mm or 150 mm stacks for the 10 story building.
Differences can also be seen when comparing the other elements of operational performance, as illustrated in Figure 9. The increase in water flow rate from 5.2 L/s to 12.4 L/s results in an induced airflow three times greater in the 150 mm diameter stack (roughly −120 L/s) than in the 100 mm diameter stack (roughly −40 L/s).
Comparison of the stack pressure profiles show that the maximum negative pressure generated in the 150 mm diameter stack (−20 mm wg) is around half that generated in the 100 mm diameter stack (−40 mm wg). This reduction in pressure is due to the larger central air core within the 150 mm stack.
Due to the differences in water-trap seal fluctuations, as illustrated in Figure 8, there are also differences in water-trap seal retention depths for both stack diameters. The 100 mm stack diameter has water-trap seal retention depths of 19 mm, 29 mm, and 42 mm for the bottom, middle, and top traps, respectively, while those for the 150 mm diameter stack are found to be 29 mm, 24 mm, and 40 mm. While the bottom trap in the 150 mm diameter stack has an improves retention depth (29 mm compared to 19 mm), the middle trap just falls short of the minimum retention depth of 25 mm.

3.3. Building Height (10 Stories vs. 20 Stories)

The effect of building height on a system’s operational performance can be seen by comparing the water-trap seal fluctuations of the single-stack systems for the 10 story building (Figure 8b) with those for the 20 story building (Figure 10) both of, which have a 150 mm diameter stack and discharge water flow rate of 12.4 L/s. While for the 10 story building, the bottom and middle traps show large fluctuations, the water seals for those traps in the 20 story building are completely depleted within the first 2 s of the simulation. The trap at the top of the 20 story building can be seen to undergo larger fluctuations with an initial fluctuation of 46 mm, compared to 20 mm for the 10 story building.
Figure 11 shows that the maximum negative pressure generated within the single-stack system within the 20 story building drops to −70 mm wg, compared to −20 mm wg for the 10 story building (see Figure 9b). Due to the full depletion of the bottom and middle traps in the 20 story building, they become routes for air movement both in and out of the system (see Figure 11). Trap retention of the bottom and middle traps can be seen to be 0 mm (creating a full breach in system integrity and routes for potential cross-transmission), while the top trap retains a depth of 27 mm.
Figure 12 illustrates trap retention for the additional 20 story building system configurations. In each system, there is some loss of trap seal depth. Of particular note is the retention depths of the bottom and middle traps of the modified one-pipe system, which are 19 mm and 23 mm, respectively, which fall below the 25 mm minimum retention levels.

4. Conclusions

This paper has highlighted the important limitations of current design guides when applied to the design of building drainage systems of tall buildings. It has quantified the difference in building drainage system performance between a 10 story and 20 story building of common system configurations (single-stack system, modified one-pipe system, fully-vented system, and single-stack system with AAVs) using 100 mm and 150 mm diameter vertical stacks. The issues highlighted here would be expected to be even greater for buildings greater than 20 stories.
It has been shown that simply extrapolating the system design for tall buildings is not an adequate solution, particularly under unsteady wastewater discharge and heavy-loading conditions and that, even with additional ventilation pipework, water-trap seal retention is reduced, and system integrity is compromised. It should be noted that, if to be used, the vent pipe and cross vents should be at least the same diameter as the main stack (which is not always the case recommended in design guides). In all scenarios, an active approach to ventilation produced the best results, with AAVs providing air at the “point of need” (i.e., the closest to the airflow induction point).
The paper demonstrates the requirement for more research in the area of building drainage system design for tall buildings. Importantly, the required research must be incorporated into national design guides and standards as soon as possible to facilitate the demand for increased public health safety, system efficiency, and design rationale. The most practical way of facilitating this is the numerical simulation of building drainage systems, which enables the operational performance of different building heights and system configurations to be accurately assessed, as long as a suitable means of verification is available.
In light of the exponential growth in the number of tall buildings being constructed globally and the rising dissatisfaction among designers regarding the use of limited and outdated national design guides that do not currently extend to tall buildings, the action is urgently required to produce updated design methodologies in order to deal with the particular difficulties associated with building drainage system designs in tall buildings and ensuring such systems safeguard public health.
The key points from this paper can be summarized as follows:
  • There are important limitations of current design guides when applied to the design of building drainage systems of tall buildings;
  • Designs based on current codes, which are primarily derived from low/medium rise research, cannot be extrapolated for use in high rise drainage design;
  • Vent pipe and cross vents should be at least the same diameter as the main stack (which is not always the case recommended in design guides);
  • An active approach to ventilation produced the best results, with AAVs providing air at the “point of need”;
  • Action is urgently required to produce updated design methodologies in order to deal with the particular difficulties associated with building drainage system designs in tall buildings and ensuring such systems safeguard public health.

Author Contributions

Conceptualization, M.G., D.K. and D.C.; methodology, M.G. and D.K.; software, M.G., D.K. and D.C.; validation, M.G., D.K. and D.C.; formal analysis, M.G., D.K. and D.C.; investigation, M.G., D.K. and D.C.; data curation, M.G., D.K. and D.C.; writing—original draft preparation, M.G., D.K., and D.C.; writing—review and editing, M.G., D.K., D.C., Y.X., and C.S.; visualization, M.G., D.K. and D.C.; supervision, M.G., D.K. and D.C.; project administration, M.G., D.K. and D.C.; funding acquisition, M.G., D.K. and D.C. All authors have read and agreed to the published version of the manuscript.

Funding

This research was funded by Aliaxis S.A., and the APC was funded by Aliaxis S.A.

Institutional Review Board Statement

Not applicable.

Informed Consent Statement

Not applicable.

Data Availability Statement

The data presented in this study are available on request from the corresponding author.

Conflicts of Interest

The authors declare no conflict of interest.

Abbreviations

cWave propagation speed(m/s)
DPipe diameter
fFriction factor
LPipe length(m)
PWetted perimeter(m)
pPressure(N/m2) or (mm water gauge)
tTime(s)
tpPipe period(s)
uMean airflow velocity(m/s)
xDistance(m)
ΔtTime increment(s)
ΔxDistance increment(m)
Δptotal Total system pressure losses(N/m2) or (mm water gauge)
ΔpentryPressure losses at entry(N/m2) or (mm water gauge)
Δpdry_pipefrictionPressure losses in dry pipe(N/m2) or (mm water gauge)
ΔpbranchjunctionPressure losses at junctions(N/m2) or (mm water gauge)
ΔpbackpressurePressure losses at stack base(N/m2) or (mm water gauge)
γRatio of specific heat
ρDensity(kg/m3)
Subscripts
P, R, Snodes in MoC calculation
Other terms
C+, C Characteristic slopes
K1–K4Constant in characteristic equations based on known parameters

References

  1. ASPE. Plumbing Engineering Design Handbook, Volume 1: Fundamentals of Plumbing Engineering; ASPE: Rosemount, IL, USA, 2017. [Google Scholar]
  2. BS EN 12056-2:2000. Gravity Drainage Systems inside Buildings. Sanitary Pipework, Layout and Calculation; BSI: London, UK, 2000. [Google Scholar]
  3. IAPMO. Uniform Plumbing Code; IAMPO: Ontario, CA, USA, 2021. [Google Scholar]
  4. AS/NZS 3500. 1:2018. Plumbing and Drainage. Part 1: Water Services; Standards Australia: Sydney, Australia, 2018. [Google Scholar]
  5. ICC. International Plumbing Code; ICC Publishing: Country Club Hills, IL, USA, 2018. [Google Scholar]
  6. Gormley, M.; Aspray, T.J.; Kelly, D.A.; Rodriguez-Gil, C. Pathogen cross-transmission via building sanitary plumbing systems in a full scale pilot test-rig. PLoS ONE 2017, 12, e0171556. [Google Scholar] [CrossRef] [PubMed]
  7. Swaffield, J. Transient Airflow in Building Drainage Systems; Spon: London, UK, 2010. [Google Scholar]
  8. CTBUH. Tall Building Criteria. Available online: https://www.ctbuh.org/resource/height (accessed on 15 February 2021).
  9. Henry, S.; Wood, A. (Eds.) Tall Buildings + Urban Habitat: Volume 1; Council on Tall Buildings and Urban Habitat: Chicago, IL, USA, 2018; ISBN 978-0-939493-62-3. [Google Scholar]
  10. Swaffield, J.A.; Boldy, A. Pressure Surge in Pipe and Duct Systems; 1st ed.; Avebury Technical: London, UK, 1993; ISBN 978-0291397966. [Google Scholar]
  11. Cheng, C.L.; Mui, K.W.; Wong, L.T.; Yen, C.J.; He, K.C. Characteristics of air pressure fluctuations in high-rise drainage stacks. Build. Environ. 2010, 45, 684–690. [Google Scholar] [CrossRef]
  12. Swaffield, J.A.; Campbell, D.P. Air pressure transient propagation in building drainage vent systems, an application of unsteady flow analysis. Build. Environ. 1992, 27, 357–365. [Google Scholar] [CrossRef]
  13. Chadwick, E. (Ed.) Report on the Sanitary Condition of the Labouring Population of Great Britain, 1st ed.; Edinburgh University Press: Edinburgh, UK, 1842. [Google Scholar]
  14. Hunter, R. Methods of Estimating Loads in Plumbing Systems. Natl. Bur. Stand. USA 1940, BMS65, 17. [Google Scholar]
  15. Gormley, M.; Swaffield, J.A.; Sleigh, P.A.; Noakes, C.J. An assessment of, and response to, potential cross-contamination routes due to defective appliance water trap seals in building drainage systems. Build. Serv. Eng. Res. Technol. 2012, 33, 203–222. [Google Scholar] [CrossRef]
  16. Campbell, D.P. Developments in mathematical simulation of fluid flow in building drainage systems. Build. Serv. Eng. Res. Technol. 2011, 33, 307–317. [Google Scholar] [CrossRef]
  17. Campbell Surfactant effects on air pressure transients in building drainage, waste and ventilation (DWV) systems. Build. Environ. 2007, 42, 1989–1993. [CrossRef]
  18. Gormley, M.; Campbell, D.P. The transport of discrete solids in above ground near horizontal drainage pipes: A wave speed dependent model. Build. Environ. 2006, 41, 534–547. [Google Scholar] [CrossRef]
  19. Gormley, M.; Campbell, D. Modelling water reduction effects: Method and implications for horizontal drainage. Build. Res. Inf. 2006, 34, 131–144. [Google Scholar] [CrossRef]
  20. Swaffield, J.A.; Campbell, D.P. Numerical modelling of air pressure transient propagation in building drainage systems, including the influence of mechanical boundary conditions. Build. Environ. 1992, 27, 455–467. [Google Scholar] [CrossRef]
  21. Swaffield, J.A.; Campbell, D.P.; Gormley, M. Pressure transient control: Part II - Simulation and design of a positive surge protection device for building drainage networks. Build. Serv. Eng. Res. Technol. 2005, 26, 195–212. [Google Scholar] [CrossRef]
  22. Campbell, D.; Saunders, C.; Muhsin, S. The Development of a Simulated Sediment Dosing Apparatus for Deposition Research in Wastewater Collection Systems. J. Water Resour. Prot. 2018, 10, 493–506. [Google Scholar] [CrossRef] [Green Version]
  23. Swaffield, J.A.; Campbell, D.P.; Gormley, M. Pressure transient control: Part I - Criteria for transient analysis and control. Build. Serv. Eng. Res. Technol. 2005, 26, 99–114. [Google Scholar] [CrossRef]
  24. Kelly, D.A.; Swaffield, J.A.; Jack, L.B.; Campbell, D.P.; Gormley, M. Pressure transient identification of depleted appliance trap seals: A sinusoidal wave technique. Build. Serv. Eng. Res. Technol. 2008, 29, 219–232. [Google Scholar] [CrossRef]
  25. Gormley, M. Wastewater systems in the time of Covid-19: Surveillance, epidemiology and design. Proc. Inst. Civ. Eng. -Water Manag. 2020, 173, 271–273. [Google Scholar] [CrossRef]
  26. Gormley, M.; Aspray, T.J.; Kelly, D.A. COVID-19: Mitigating transmission via wastewater plumbing systems. Lancet Glob. Health 2020, 8, e643. [Google Scholar] [CrossRef] [Green Version]
  27. Swaffield, J.; Jack, L.; Campbell, D.; Gormley, M. Positive air pressure propagation in building drainage and vent systems. Build. Serv. Eng. Res. Technol. 2004, 25, 77–88. [Google Scholar] [CrossRef]
  28. Campbell, D.P. Experimental application of particle imaging to fluid velocity analysis in building drainage systems. Build. Serv. Eng. Res. Technol. 2011, 32, 263–275. [Google Scholar] [CrossRef]
  29. Fox, J. (Ed.) Transient Flow in Pipes, Open Channels and Sewers, 3rd ed.; Wiley: Hoboken, NJ, USA, 1989; ISBN 978-0745802657. [Google Scholar]
Figure 1. Pressure profile for a single-stack system with two active branches.
Buildings 11 00070 g001
Figure 2. Grid showing characteristic lines as utilized in the method of characteristics approach to air pressure transient modeling.
Buildings 11 00070 g002
Figure 3. Boundary conditions and available characteristics for a typical building drainage system.
Buildings 11 00070 g003
Figure 4. System configurations used for numerical simulation (not to scale).
Buildings 11 00070 g004
Figure 5. Water discharge flow profile for both the 100 mm and 150 mm stack simulations. The single-stack system is shown in this example; however, these discharge flow profiles apply to each system configuration.
Buildings 11 00070 g005
Figure 6. Simulated water-trap seal fluctuations for the 10 story building with 100 mm diameter stack in system configurations: (a) single-stack; (b) fully-vented; and (c) single-stack with air admittance valves (AAVs).
Buildings 11 00070 g006
Figure 7. Simulated elements of operational performance, including the stack pressure profile, airflow, and resultant trap retention depth for the 10 story building with 100 mm diameter stack in system configurations: (a) single-stack; (b) fully-vented; and (c) single-stack with AAVs.
Buildings 11 00070 g007
Figure 8. Simulated water-trap seal fluctuations for the 10 story building as a single-stack system with (a) 100 mm diameter stack and (b) 150 mm diameter stack.
Buildings 11 00070 g008
Figure 9. Simulated elements of operational performance, including the stack pressure profile, airflow, and resultant trap retention depth for the 10 story building as a single-stack system with (a) 100 mm diameter stack and (b) 150 mm diameter stack.
Buildings 11 00070 g009
Figure 10. Simulated water-trap seal fluctuations for the 20 story building as a single-stack sysTable 150 mm diameter stack.
Buildings 11 00070 g010
Figure 11. Simulated elements of operational performance, including the stack pressure profile, airflow, and resultant trap retention depth for the 20 story building as a single-stack system with a 150 mm diameter stack.
Buildings 11 00070 g011
Figure 12. Simulated resultant trap retention depths for the 20 story building with 150 mm diameter stack for (a) modified one-pipe; (b) fully-vented; and (c) single stack with AAVs.
Buildings 11 00070 g012
Table 1. Pipe lengths and diameters for each system configuration. Values are provided for the 10 story building. Where different for the 20 story building, these are shown in brackets.
System ElementPipe FeatureSingle StackModified One-PipeFully-VentedSingle Stack with AAVs
Stack pipesLength3 m (6 m)
Diameter100 mm (150 mm)
BranchesLength2 m
Diameter100 mm
TrapsLength0.25 m
Diameter100 mm
Closed endsLength0.25 m
Diameter100 mm
Vent pipesLengthn/a6 m (12 m)n/a
Diametern/a100 mmn/a
Cross ventsLengthn/a0.25 mmn/a
Diametern/a100 mmn/a
Branch ventsLengthn/an/a2 mn/a
Diametern/an/a50 mmn/a
AAV pipesLengthn/an/an/a0.25 m
Diametern/an/an/a100 mm
The 10 story building was simulated with both a 100 mm and 150 mm diameter stack.
Publisher’s Note: MDPI stays neutral with regard to jurisdictional claims in published maps and institutional affiliations.

