Article

Office Distractions and the Productivity of Building Users: The Effect of Workgroup Sizes and Demographic Characteristics

1
Cities Research Institute, Griffith University, Gold Coast 4215, Australia
2
School of Built Environment, Massey University, Auckland 0632, New Zealand
3
School of Architecture, Victoria University of Wellington, Wellington 6011, New Zealand
*
Author to whom correspondence should be addressed.
Buildings 2021, 11(2), 55; https://doi.org/10.3390/buildings11020055
Submission received: 24 December 2020 / Revised: 29 January 2021 / Accepted: 2 February 2021 / Published: 6 February 2021
(This article belongs to the Special Issue Buildings: 10th Anniversary)

Abstract

:
Knowledge workers are experiencing ever-increasing distractions or unwanted interruptions at workplaces. We explored the effect of unwanted interruptions on an individual’s perceived productivity in various building types, user groups and workgroups. A case study of 68 buildings and their 5149 occupants using the Building Use Studies methodology was employed in this study. The database contains information on the occupants’ perceptions of physical and environmental parameters, including unmined data on the frequency of unwanted interruptions. Pearson’s correlation was used to test the correlation between the variables. In order to determine whether there are any statistically significant differences between the means of two or more independent (unrelated) groups, one-way ANOVA was employed to examine the significance of differences in mean scores between various user groups and workgroups. The evidence of clear correlations between the frequency of unwanted interruptions and perceived productivity is detailed in various user groups and in multiple building types. The Pearson correlation coefficients were −0.361 and −0.348 for sustainable and conventional buildings, respectively, demonstrating a lower sensitivity to unwanted interruptions in sustainable buildings. Females and older participants were more sensitive to unwanted interruptions and their productivity levels were reduced much more by unwanted interruptions. Comparing different sized workgroups, the highest sensitivity to unwanted interruptions for occupants in offices shared with more than 8 people was found. The findings of this study contribute to the understanding of different user needs and preferences in the design of workplaces.

1. Introduction

Over recent decades, much consideration has been given to the effect of the physical environment of office buildings on the comfort, health and productivity of building users. In this regard, considerable effort has been expended to learn about the influence of the thermal, visual and acoustic aspects of buildings on occupant behaviours and expectations [1,2]. Building users and their productivity is influenced by various physical and behavioural components in an office environment [3]. Office distractions could be classified in the behavioural, environmental category as an integrated dimension of the office environment [4]. In a study of faculty research performance, an individual’s research productivity was associated with a combination of individual and institutional characteristics [5]. Particularly, uninterrupted time to devote to scholarly activities was one of the major components of the institutional characteristics that led to higher perceived productivity [5].
Scholarly work has done much to highlight the detrimental effect of noise in sectors other than the knowledge sector across various demographics. For instance, Schneider et al. [6] documented extensive evidence that noise levels regularly exceed limit values in many sectors, such as agriculture, construction, engineering, the food and drink industry, woodworking, foundries and entertainment. The authors noted that in the Czech Republic, 75% of workers exposed to noise in textile production are observed to be female, followed by 5% in food production. Mohammadi et al. [7] observed a significant effect of occupational noise on the blood biochemical parameters of workers in an Iranian insulator manufacturing plant. A relationship between exposure to noise and significantly increased systolic blood pressure of 62 male workers in a sack manufacturing company was found in Nigeria [8].
However, the same effort has not been expanded on workers in the knowledge industry whose job involves the handling and use of information; and who spend most of their time in an office environment. Perhaps the reason for the lack of attention is that the noise levels experienced in office buildings are at a lower level compared to those observed on farms, factories and construction sites. Additionally, whereas the health effect of loud noise has been documented as significant [8,9], the impact of low noise has not. Thus, noise experienced in office buildings may not be regarded as detrimental.
As noted earlier, investigations of the effect of the physical aspects of buildings (in this case, the office environment) on productivity have hinged on importance of the worker to organisational success and productivity. While aspects such as temperature, lighting and facilities have been extensively studied, somewhat less attention has been given to the study of distractions or unwanted interruptions on the productivity of occupants in offices. That said, the potential disadvantages of noise, mostly in the form of distraction and unwanted interruptions on knowledge worker productivity, have been reflected in a few studies in the past [10,11]. Interestingly, some studies found contradictory results, showing that people can complete interrupted tasks in less time with no difference in quality, yet with more stress, higher frustration, and time pressure [12]. Another study demonstrated that different interruption moments have different impacts on user emotional states and positive social attributions [13]. The perception of too many unwanted interruptions along with the overall satisfaction with air quality were the most significant factors among all indoor environmental quality (IEQ) parameters in predicting perceived productivity according to Francis [14].
In his book “Rewording the Brain”, Astle [15] noted that you would need 23 min and 15 s to get back on track after a two-minute off-topic interruption. This struck a chord—not just because of the amount of time and the apparent precision of its duration, but because it echoed one’s own experience. Knowledge workers need some time to recover from a distraction, which can potentially lead to errors [16]. It is estimated that interruptions in knowledge work cost 588 billion USD per annum in the United States alone [17]. It is also not by accident that so many authors seem to work on their novels in the garden shed or in a remote part of the house or the country; focus groups go into a retreat to hammer out policy, and academics pine for the mythical ‘quality time’ to conduct and write-up their research. All recognise the need to avoid off-topic interruptions to enable full focus on the task at hand.
While evidence is mounting that unwanted interruptions may be an important predictor of worker productivity in office environments, the part played by factors such as workgroup and demography is less studied. Offices can be categorised into several workgroups from cellular offices with a single occupant to open-plan offices with more than eight occupants [18]. Office design layout influences occupant satisfaction and perceived productivity in workplace environments [19]. Noise, distraction and privacy loss seem to have adverse effects on productivity in open-plan layouts [20]. Haynes et al. (2017) showed that the greatest impact on perceived productivity was the availability of a variety of physical layouts, control over interaction and the “downtime” offered by social interaction points. Depending on the workgroup sizes, office occupants may also experience various levels of visual and acoustic privacy, and consequently, different amounts of distraction and unwanted interruptions [21]. On the other hand, among all the environmental and behavioural components, in low-performance buildings, perceived productivity was strongly associated with building aesthetics and quality, and noise distraction and privacy; while in high-performance buildings, productivity was highly correlated with office layout, employees’ working experience, and work hours [22]. Therefore, a hypothesis was developed that workgroup sizes, the type of use, and sustainability intention of office buildings might also be a significant indicator of the impact of noise on knowledge workers’ productivity.
Our investigation commenced with (in retrospect rather belatedly) a pilot study of relevant data from the 30 or so buildings featured in Baird’s survey of “Sustainable Buildings in Practice” [23]. This involved a simple comparison of the averages for each building of the “Unwanted Interruptions” scores versus the percentage increase or decrease in perceived productivity, this latter being adjudged to be the variable most likely to be influenced by unwanted interruptions (Table 1).
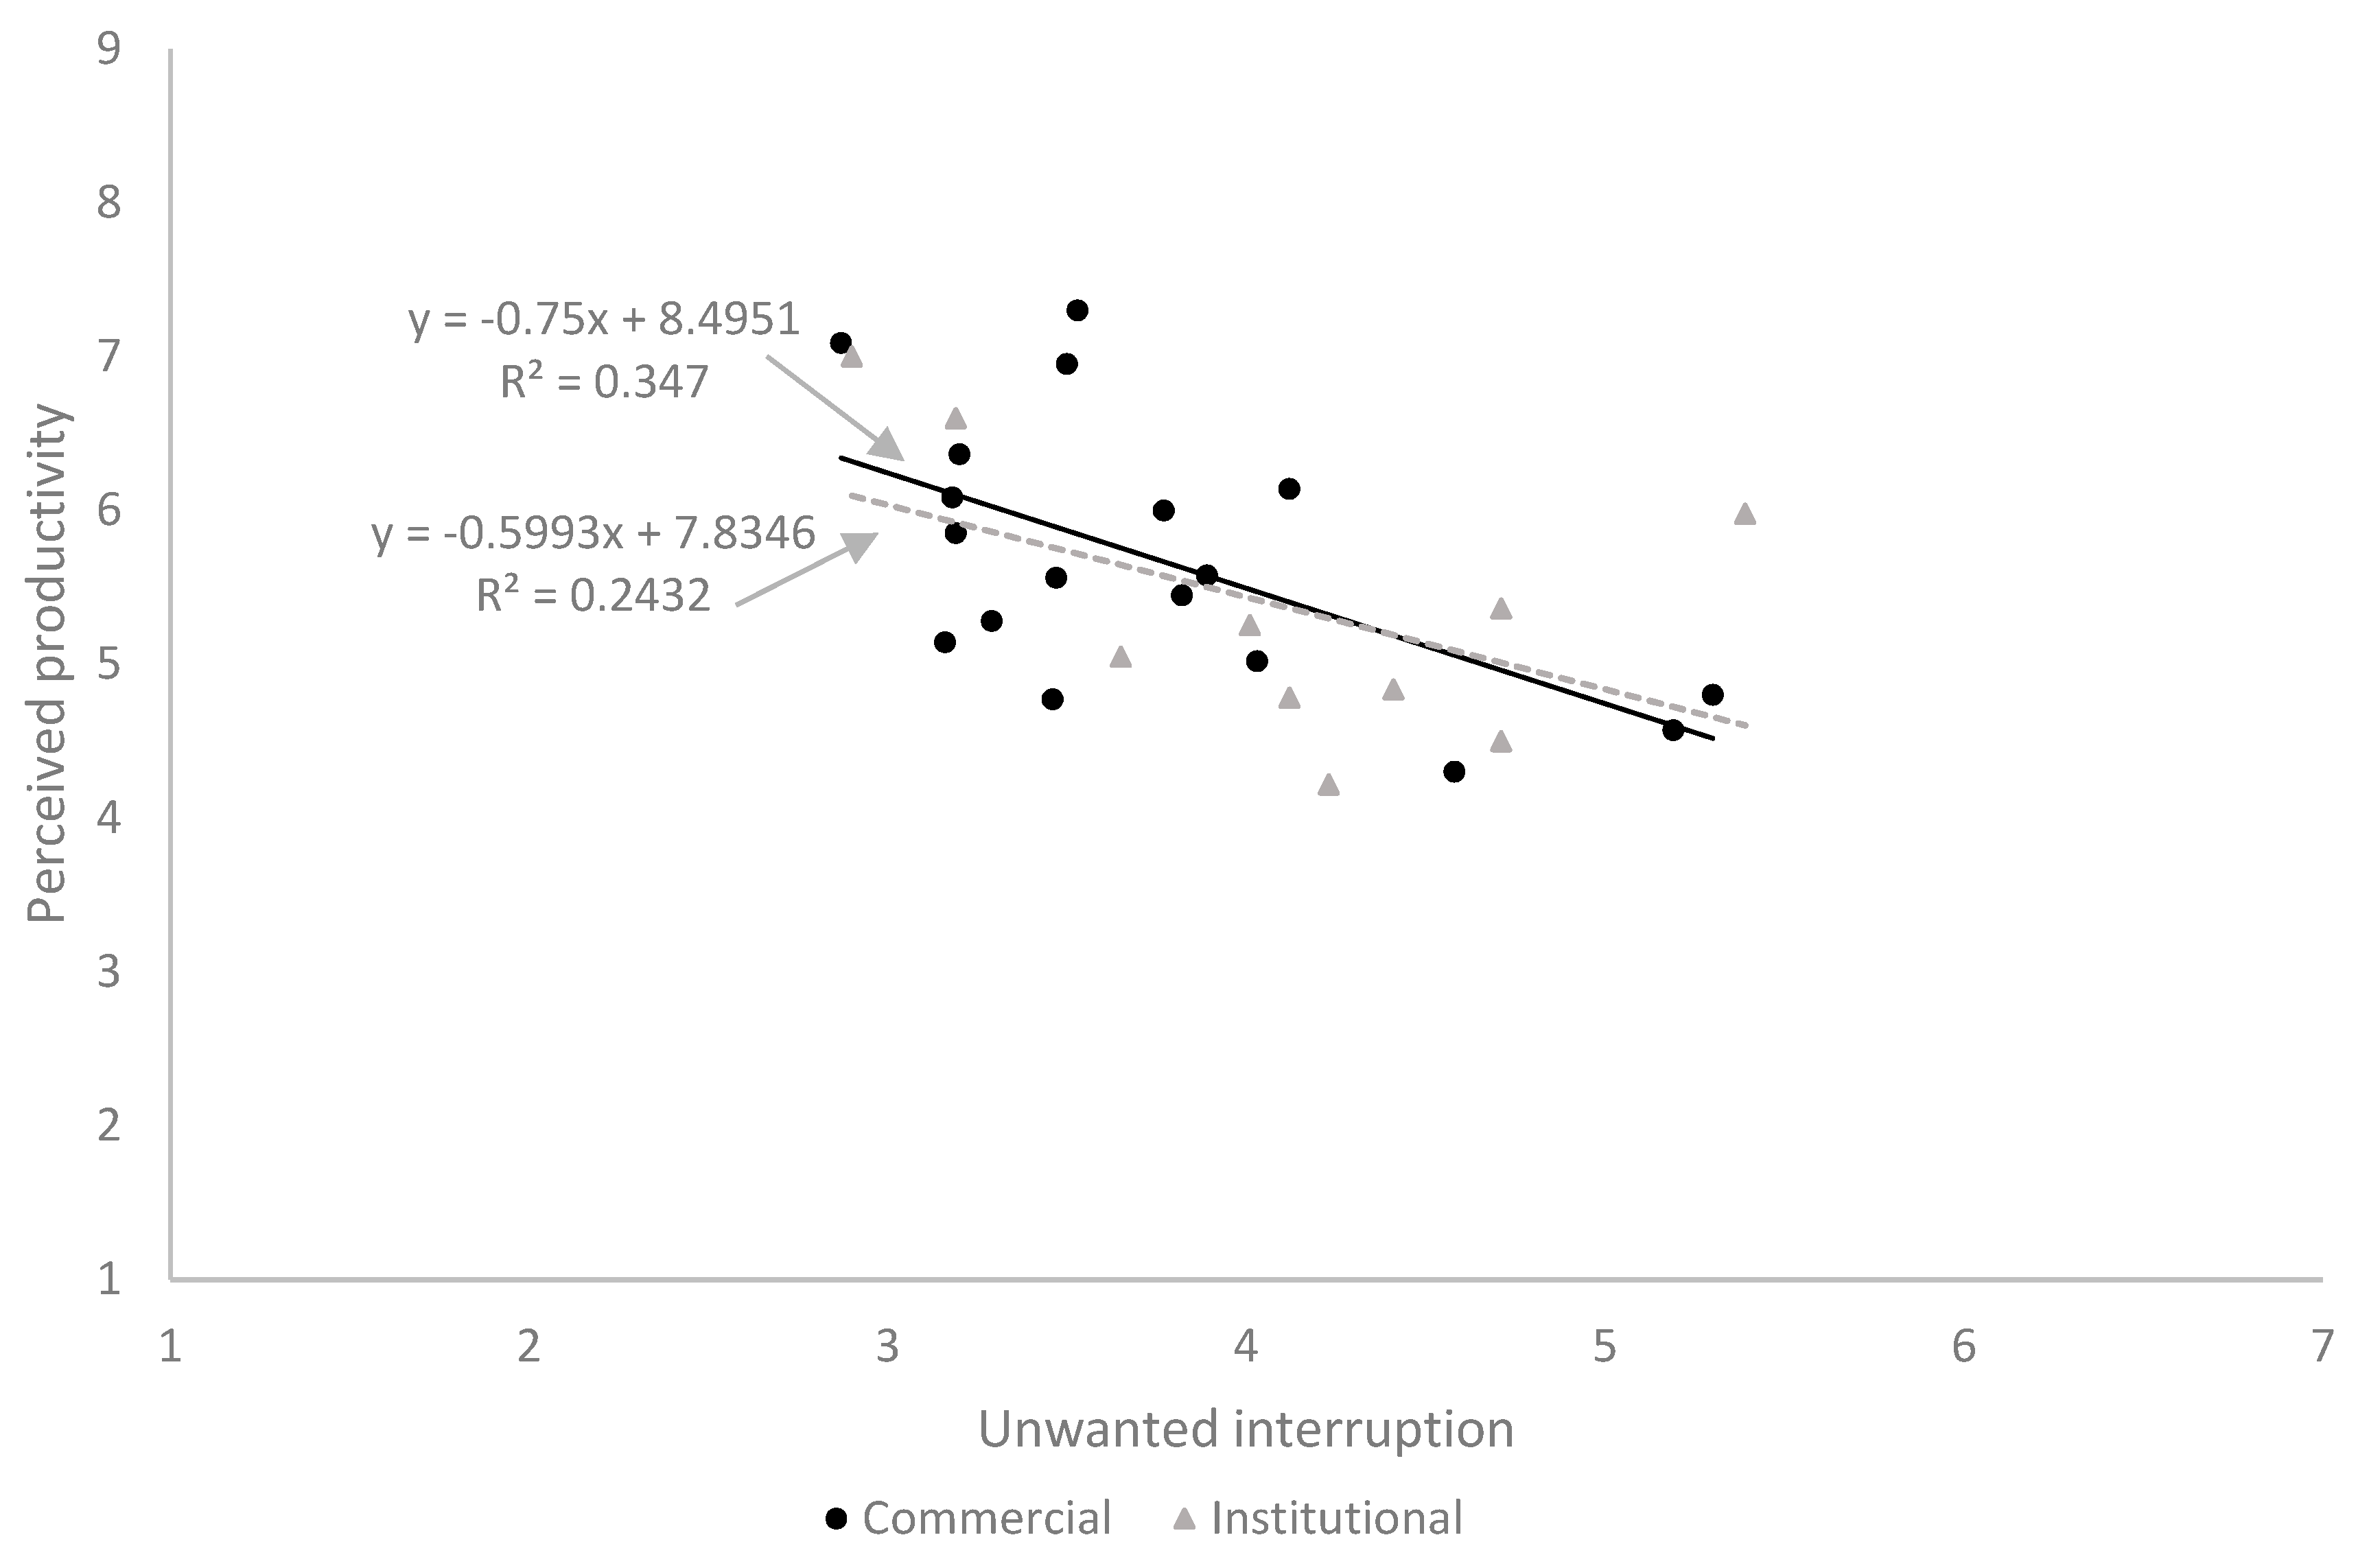
Twenty buildings reported increases in perceived productivity averaging +9.4% overall, corresponding to an unwanted interruptions score averaging 3.57 (on the 7-point scale where 1 signifies the least effect; and 7 the greatest). For the 9 buildings which reported average decreases of −5.0% overall, the unwanted interruptions score averaged 4.59. The highest frequency in unwanted interruptions were observed in commercial buildings (5.30; 5.19). The higher sensitivity of users in commercial buildings to unwanted interruptions was observed when the averages of unwanted interruptions for the buildings were plotted against perceived productivity for both commercial and institutional buildings. As shown in Figure 1, the R-square of the trendline of the linear equation for commercial buildings is closer to 1 than institutional buildings. The trend was clear, albeit on the basis of building averages rather than individual respondents. While building averages are useful to give an overview of performance, or when comparing buildings, the effect of interruptions requires study of the perceptions of individuals.
With the promising results of the pilot study, the decision was taken to expand the research to the full-scale with a database of 68 buildings and 5149 respondents. The aim of this research was to compare the tolerance of unwanted interruptions among several user groups and workgroup size in a systematic way. Thus, differences in sensitivity to unwanted interruptions between commercial and academic buildings, between sustainable and conventional buildings, between younger and older workers, between males and females, and between differently sized workplace clusters were explored in detail.
After the methodology section (Section 2), the main findings are presented as follows: The differences in sensitivity to unwanted interruptions found between different building use—commercial versus academic buildings in Section 3.1.; building design intent—sustainable versus conventional buildings in Section 3.2.; age groups—under 30 years versus over 30 years or over in Section 3.3.; genders—male and female in Section 3.4.; and workgroup sizes in Section 3.5.

2. Methodology

A database of post-occupancy evaluation (POE) studies and the BUS (Building Use Studies) methodology survey questionnaires were utilised for this research. The BUS methodology survey is a well-recognised survey tool, which has been effectively used in many research studies around the world. Full detail of the BUS methodology and the actual questionnaire are presented in earlier studies [24]. The survey consists of several questions regarding user background information and various satisfaction questions. From 68 buildings, 5149 survey responses were collected over a 12-year period. Table 2 provides a summary of the building description including countries, number of occupants in the buildings, sustainability credentials, and building use. The majority of data was collected from New Zealand (56.7%). The largest building had 342 occupants, and the smallest had only 11 occupants. There were a relatively equal number of green and conventional buildings. In terms of building use, 72% were commercial buildings and 28% were academic building.
A subset of the questionnaire responses was used to serve the purpose of this study (see Table 3). The utilised questions in this analysis included the age of participants, the gender of participants, workgroup sizes, perceived productivity, and unwanted interruptions. The age category was under 30 years for the younger groups and 30 years or over for the older groups. The productivity question asked survey participants to estimate how they think their productivity at work was decreased or increased by the environmental conditions in the building using a 9-point scale (where a 5 signifies conditions have no effect, less than 5 signifies a decrease and greater than 5 an increase). Respondents were asked to “Please estimate how you are affected by unwanted interruptions …” on a 7-point semantic differential scale ranging from “Not at all” (scoring 1) to “Very frequently” (scoring 7). The paper questionnaires were distributed in the buildings in person, and the responses were typically collected after five to seven days. A response rate greater than 75% was required to ensure results were representative. To verify whether a statistically significant linear relationship exists between two continuous variables, Pearson’s correlation was used to test the correlation between the variables. In order to determine whether there are any statistically significant differences between the means of two or more independent (unrelated) groups, one-way ANOVA was also employed to examine the significance of differences in mean scores between various user groups and workgroups.
Statistical analysis included basic descriptive statistics, one-way ANOVA and Pearson correlations. Descriptive statistics consist of mean values, standard deviation and sample numbers in each group. One-way ANOVA is used to determine whether there are any statistically significant differences between the means of two groups of design intent, building use, age, gender and workgroup. One-way ANOVA tests the null hypothesis:
H0: µ1 = µ2 = µ3 = … = µk
where µ is the group mean, and k is the number of groups. The null hypothesis for the one-way ANOVA is that there is no difference in the population means of the different groups. If one-way ANOVA reports a p-value less than 0.05, the null hypothesis is rejected, and it is confirmed that the two sample groups do not have the same mean.
Pearson correlation is the test statistics that measures the statistical relationship, or association, between two continuous variables. The Pearson correlation produces a sample correlation coefficient, r, which measures the strength and direction of linear relationships between pairs of continuous variables. The coefficient is a number between −1 and +1 that indicates to which extent two variables are linearly related and it is calculated from the following formula:
r x y   =   cov ( x , y ) var ( x ) · var ( y )
where cov(x, y) is the sample covariance of x and y; var(x) is the sample variance of x; and var(y) is the sample variance of y.

3. Findings

3.1. Building Use—Commercial Versus Institutional

The comparison analysis of descriptive statistics including mean scores and standard deviations showed that productivity was scored much better in commercial buildings with a mean score of 5.21 than in institutional buildings with a mean score of 4.96 (see Table 4); while unwanted interruptions were more frequent in institutional buildings than commercial buildings with mean scores of 4.28 and 4.06, respectively (Figure 2). One-way ANOVA tests showed a significant difference (p-value < 0.001) between the mean scores of productivity and unwanted interruptions in commercial and institutional buildings (Table 5).
The Pearson correlation analysis also showed negative coefficients of −0.384 and −0.324 with a statistical significance lower than 0.001 between productivity and unwanted interruptions in commercial and institutional buildings, respectively (see Table 6). Thus, in both commercial and institutional buildings, there seems to be a negative correlation between the frequency of unwanted interruptions and productivity. The negative effect of unwanted interruptions on productivity seemed slightly higher in commercial buildings than institutional buildings. Our result affirms that of the pilot study of sustainable buildings suggesting that irrespectively of the design intent, users in commercial buildings are more sensitive to unwanted interruptions than their counterparts in institutional buildings.

3.2. Design Intent—Sustainable Versus Conventional

The comparison analysis of descriptive statistics, including mean scores and standard deviations showed that productivity was scored better in sustainable buildings than conventional buildings, with mean score values of 5.49 and 4.70, respectively (Table 7). However, unwanted interruptions were more frequent in conventional buildings than sustainable buildings, with the mean score values of 4.31 and 3.97, respectively (Figure 3). When comparing the two groups in design intent, the more frequent unwanted interruptions coincide with the worst productivity in conventional buildings. One-way ANOVA tests also showed a significant difference (p-value < 0.001) between the mean scores of productivity and unwanted interruptions in sustainable and conventional buildings (Table 8).
For both building groups, negative Pearson correlation coefficients were observed with statistical significance lower than 0.001 between productivity and unwanted interruptions in both building groups of sustainable and conventional buildings (Table 9). The Pearson correlation coefficients were −0.361 and −0.348 for sustainable and conventional buildings, respectively. This demonstrates a lower sensitivity of sustainable office occupants to unwanted interruptions.

3.3. Age of Occupant—under 30 Years versus 30 Years or Over

Productivity was scored better among the younger participants with a mean of 5.39 compared to the older participants with a mean of 5.04 (see Table 10). For the younger participants, unwanted interruptions were scored better with the mean score of 3.85 in comparison with the older participants with a mean score of 4.22 (Figure 4). Therefore, lower unwanted interruptions and higher productivity were observed among the younger participants, while the older group projected higher unwanted interruptions and consequently lower perceived productivity. As shown in Table 11, the difference between the mean scores of the younger and older participants was statistically significant (p-value < 0.001) indicating that the null hypothesis was true and obtaining that difference in the mean values by chance is very small.
As shown in Table 12, for under 30 years and 30 years or over, the Pearson correlation coefficients were negative with a statistical significance lower than 0.001, indicating that the null hypothesis was true and there was a measurable difference between the age groups. For the younger group, the Pearson correlation coefficients was −0.350 and for the older group the coefficient was −0.367. The Pearson correlation analysis showed that the older group was more sensitive to unwanted interruptions and the productivity scores were much lower than the younger group.

3.4. Gender—Male versus Female

The mean score value of productivity for female participants was 5.00, which was worse than the male participants, who scored their productivity with a mean value of 5.25 (see Table 13). The unwanted interruptions were scored 4.05 for male participants and 4.21 by female participants (Figure 5). As shown in Table 14, a significant difference between the mean scores of productivity and unwanted interruptions was observed between male and female participants.
The Pearson correlation analysis showed negative coefficient values with statistical significance lower than 0.001 (see Table 15). For the male participants, the Pearson correlation coefficient was −0.359 and for the male group the coefficient was −0.371. This finding showed that female participants were more sensitive to unwanted interruptions and productivity levels were reduced much more by unwanted interruptions than with the male group.

3.5. Workgroups

The workgroup sizes included solo occupants, shared with one other, shared with 2 to 4, shared with 5 to 8, and shared with over 8 people. The solo group obtained the best mean score for productivity, with a mean value of 5.32. The worst productivity scores were achieved for the more than 8 group, with a mean score value of 4.99 (see Table 16). The best unwanted interruption scores were obtained in the shared with one other group, with the mean score value of 3.85. The worst unwanted interruption score was found in the shared with more than 8 group, with a mean value of 4.25 (Figure 6).
Significant differences were found between the mean scores for both perceived productivity and unwanted interruptions when comparing various workgroups, as illustrated in Table 17. Except for solo offices, productivity and unwanted interruptions had negative correlations, meaning that the worse were the unwanted interruptions, the worse the productivity scores. Although unwanted interruptions were worse in solo offices in comparison with the shared with one other offices, the productivity scores were better in offices with a solo occupant in comparison to offices shared with one another. This indicated that there was an anomaly in the correlations between unwanted interruptions and productivity when small sized offices are compared.
Multiple comparisons and Tukey honestly significant difference (HSD) analysis for productivity showed that only when comparing the smallest workgroup and the largest workgroup was there a significant difference in productivity values (Table 18). For unwanted interruptions only when comparing the second smallest workgroup and the largest workgroup was there a significant difference (Table 19).
For all workgroups, negative Pearson correlation coefficients were identified with statistical significance lower than 0.001. The Pearson correlation coefficients for solo occupants, shared with one other, shared with 2–4, shared with 5–8, and shared with more than 8 were −0.304, −0.374, −0.291, −0.397 and −0.421, respectively, which indicates the highest sensitivity to unwanted interruptions for occupants in offices shared with more than 8 people.

4. Discussion

As organisations adopt larger workgroup environments to aid collaboration, workers may become overloaded with distractions [25]. Distracting workplaces can cost companies millions of dollars in lost productivity. Thus, creating a distraction free workplace will not only have major financial implication for employers, but also help employees with wellness, work-life balance, frustration, and stress.
Our research showed that respondents who were less troubled by unwanted interruptions were also more likely to experience the workplace as supportive for their productivity. In all categories of the investigated groups, significant correlations between unwanted interruptions and productivity were found. In all subsets of our dataset the more frequent the unwanted interruptions were, the worse the perceived productivity. This showed that the ability to concentrate has a substantial influence on perceived productivity [26]. This further reinforced that the physical environment and acoustic performance of the office support employee productivity. The negative correlations between unwanted interruptions and knowledge worker productivity provided further evidence that the acoustic design of the office environment has a decisive effect on user experience in buildings.
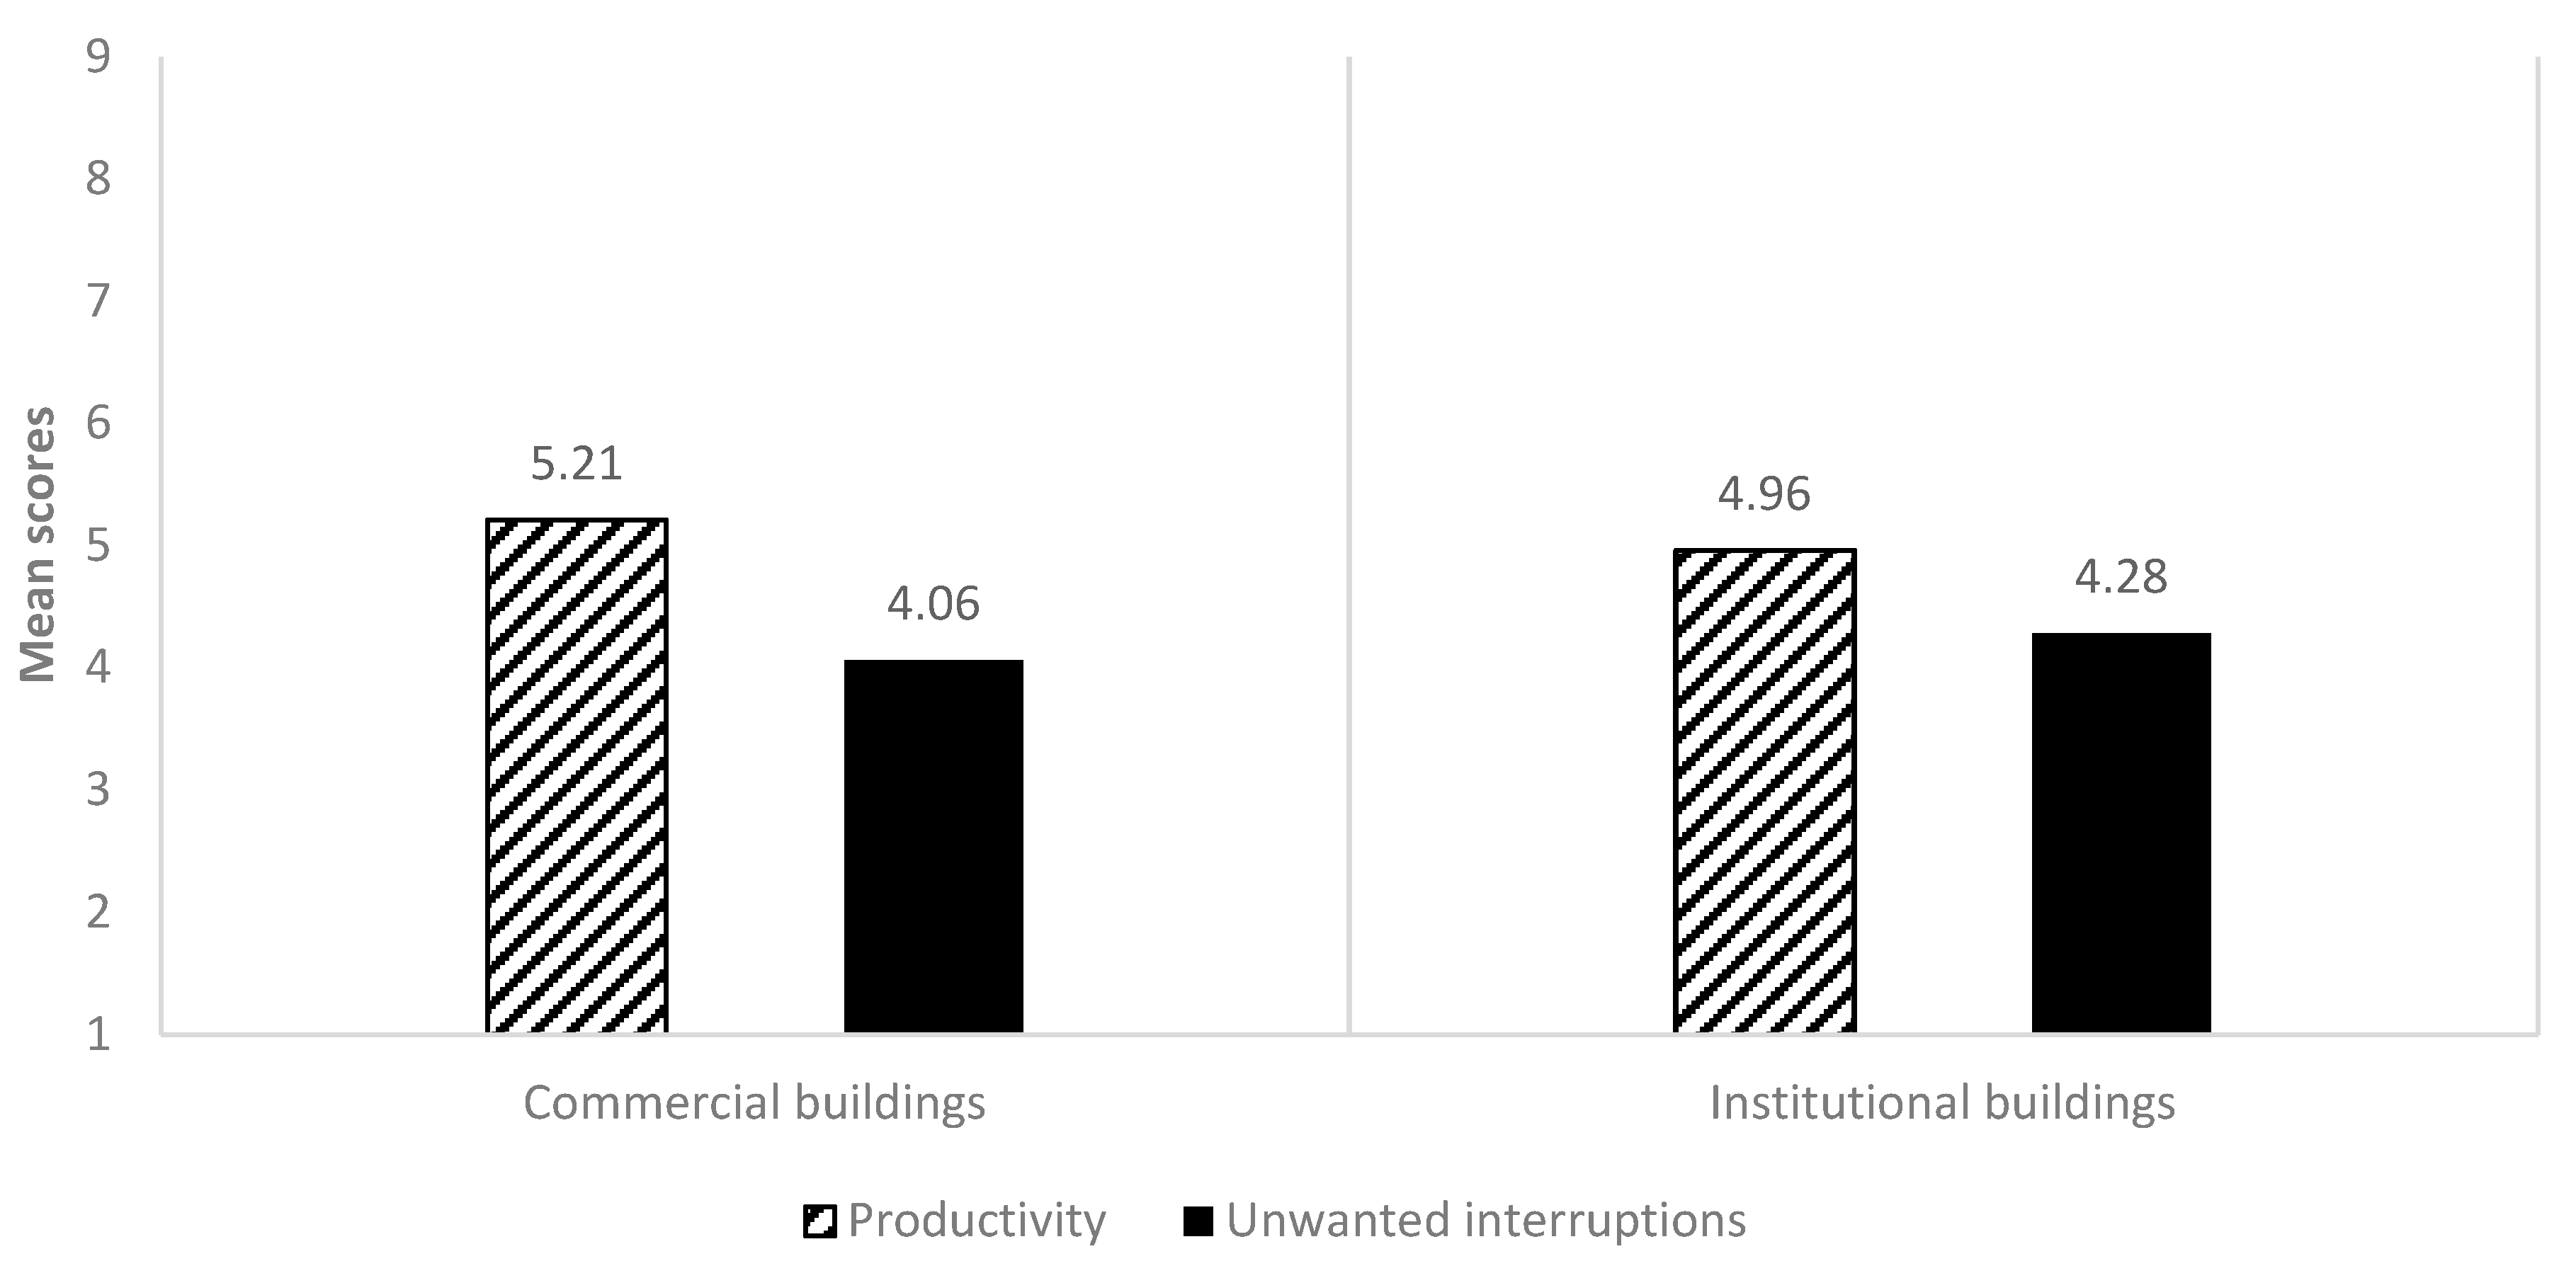
The present study investigated the sensitivity of various user groups to office distractions in multiple building types. It was found that commercial office workers had higher tolerance to unwanted interruptions when compared to institutional office occupants. Because of the differences in the nature of the work in commercial and institutional buildings, the expectations and occupant experiences differ when the two building users are compared [18]. Haynes [10] reported that office occupants with the higher variety of responsibilities in the office may be the least affected by distraction. As academics have multiple responsibilities, the lower tolerance of unwanted interruptions among institutional office users may be explained by the point that Haynes [10] makes.
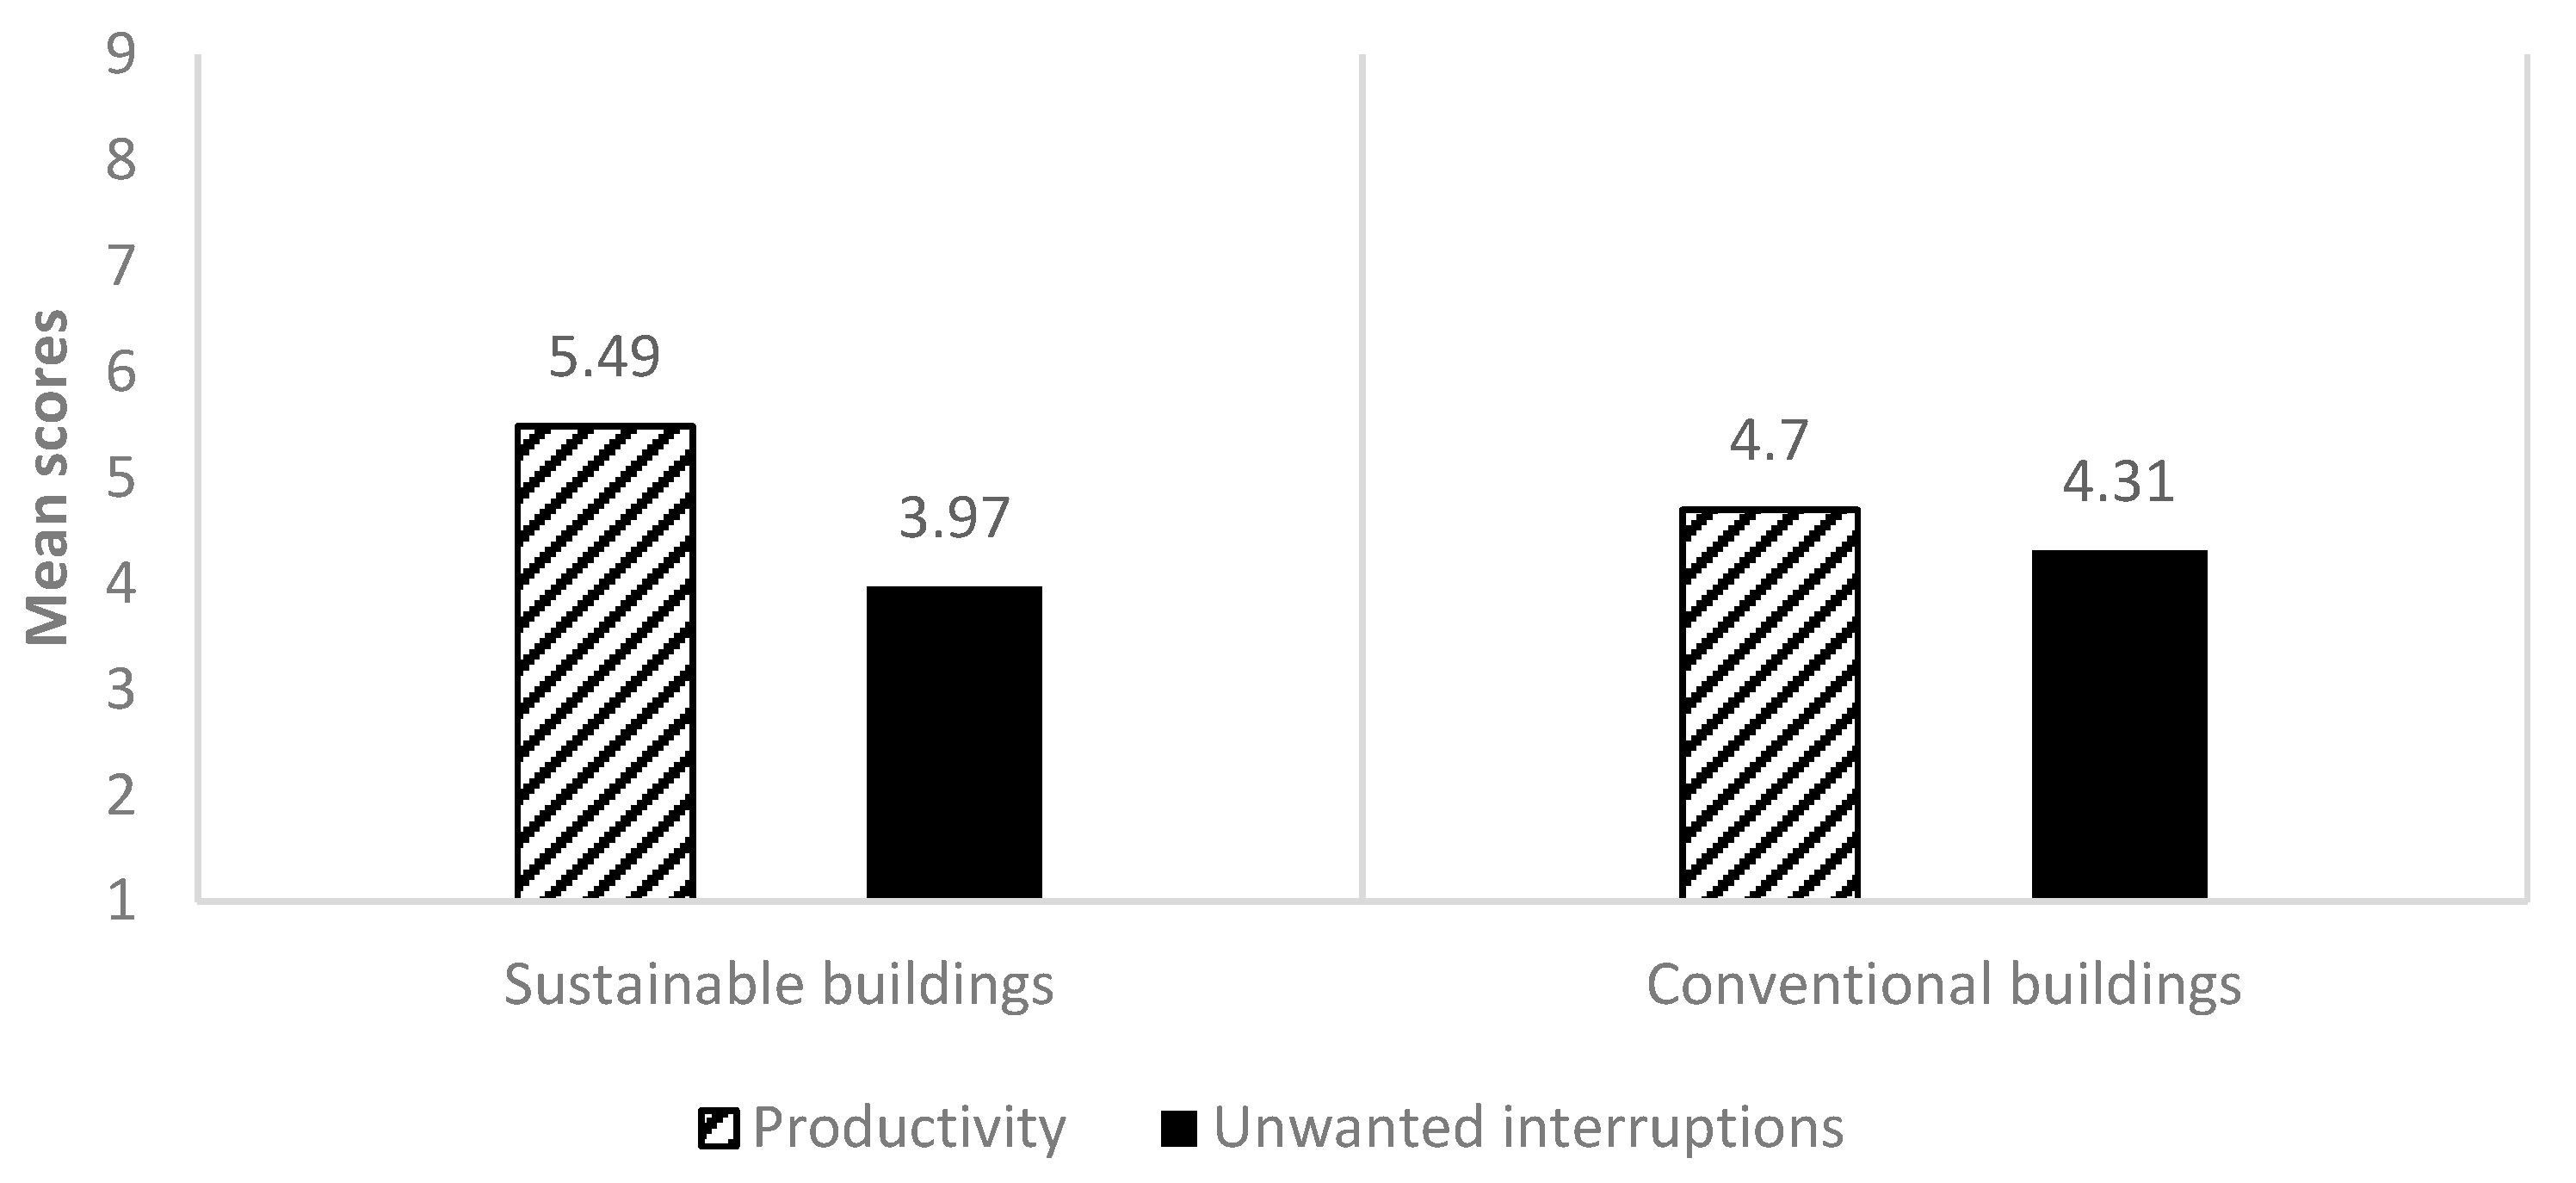
Higher tolerance of interruptions was also found among occupants in sustainable buildings. This finding is similar to previous studies that showed user of sustainable buildings tend to tolerate deficiencies rather more than users of more conventional buildings [27]. The higher tolerance of sustainable building users to interruptions in our study may be a result of the buildings’ sustainable performance overriding other aspects. As noted by Onyeizu [28], a sustainable office environment should have good acoustics to enable easy communication and an appropriate soundscape while reducing possible unwanted noise and disturbance. Another plausible reason may be that sustainable buildings have a better acoustic performance than conventional buildings, which create less disturbance and distractions to building users.
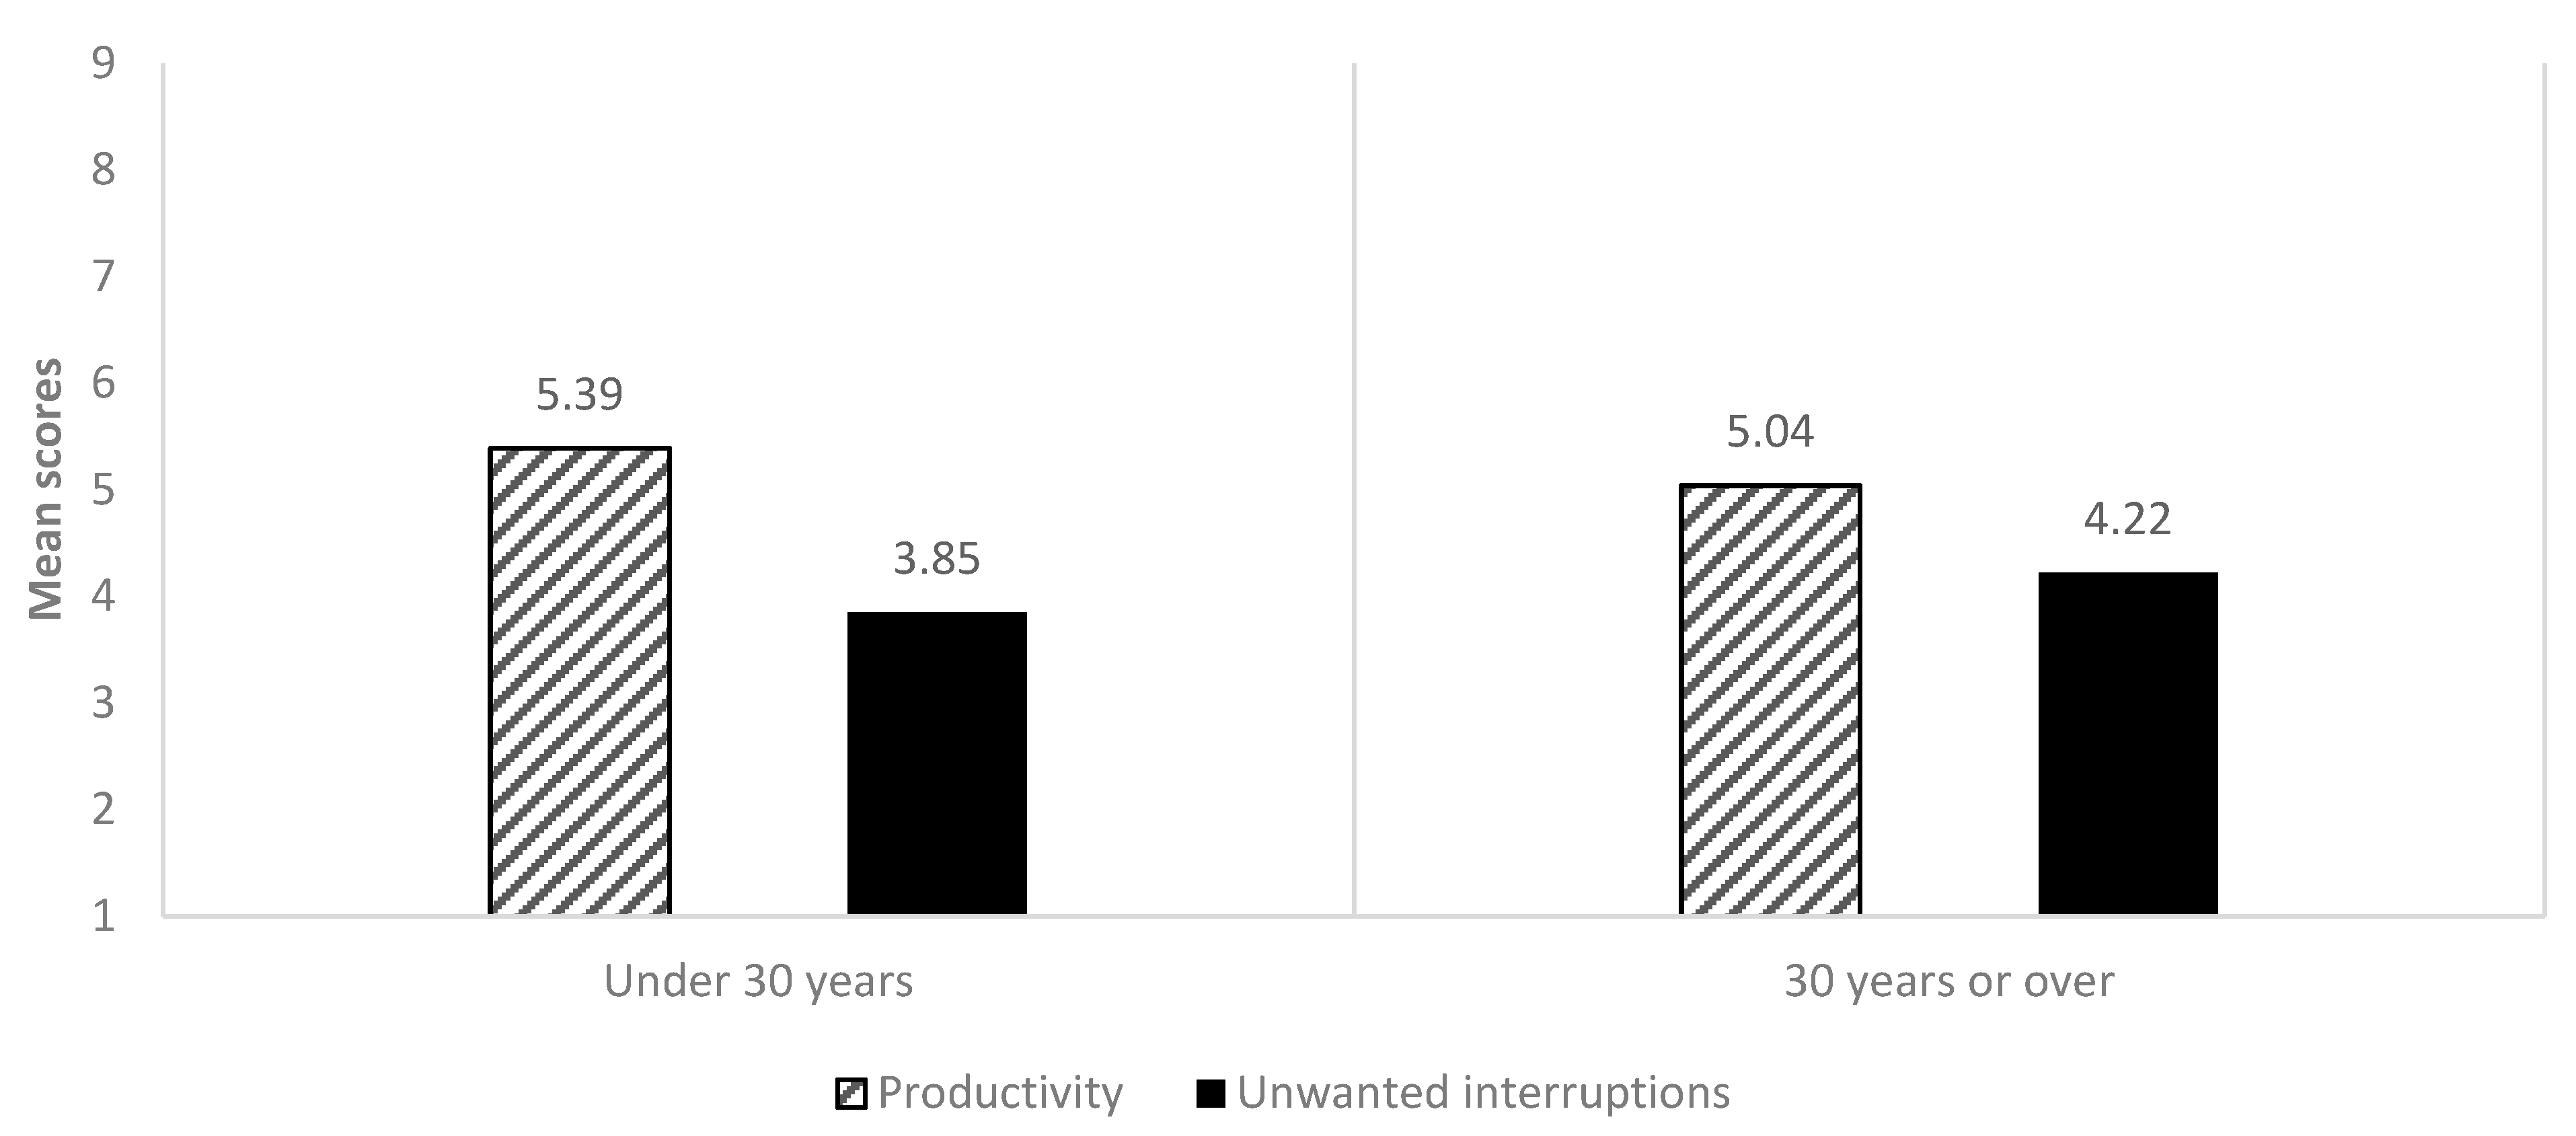
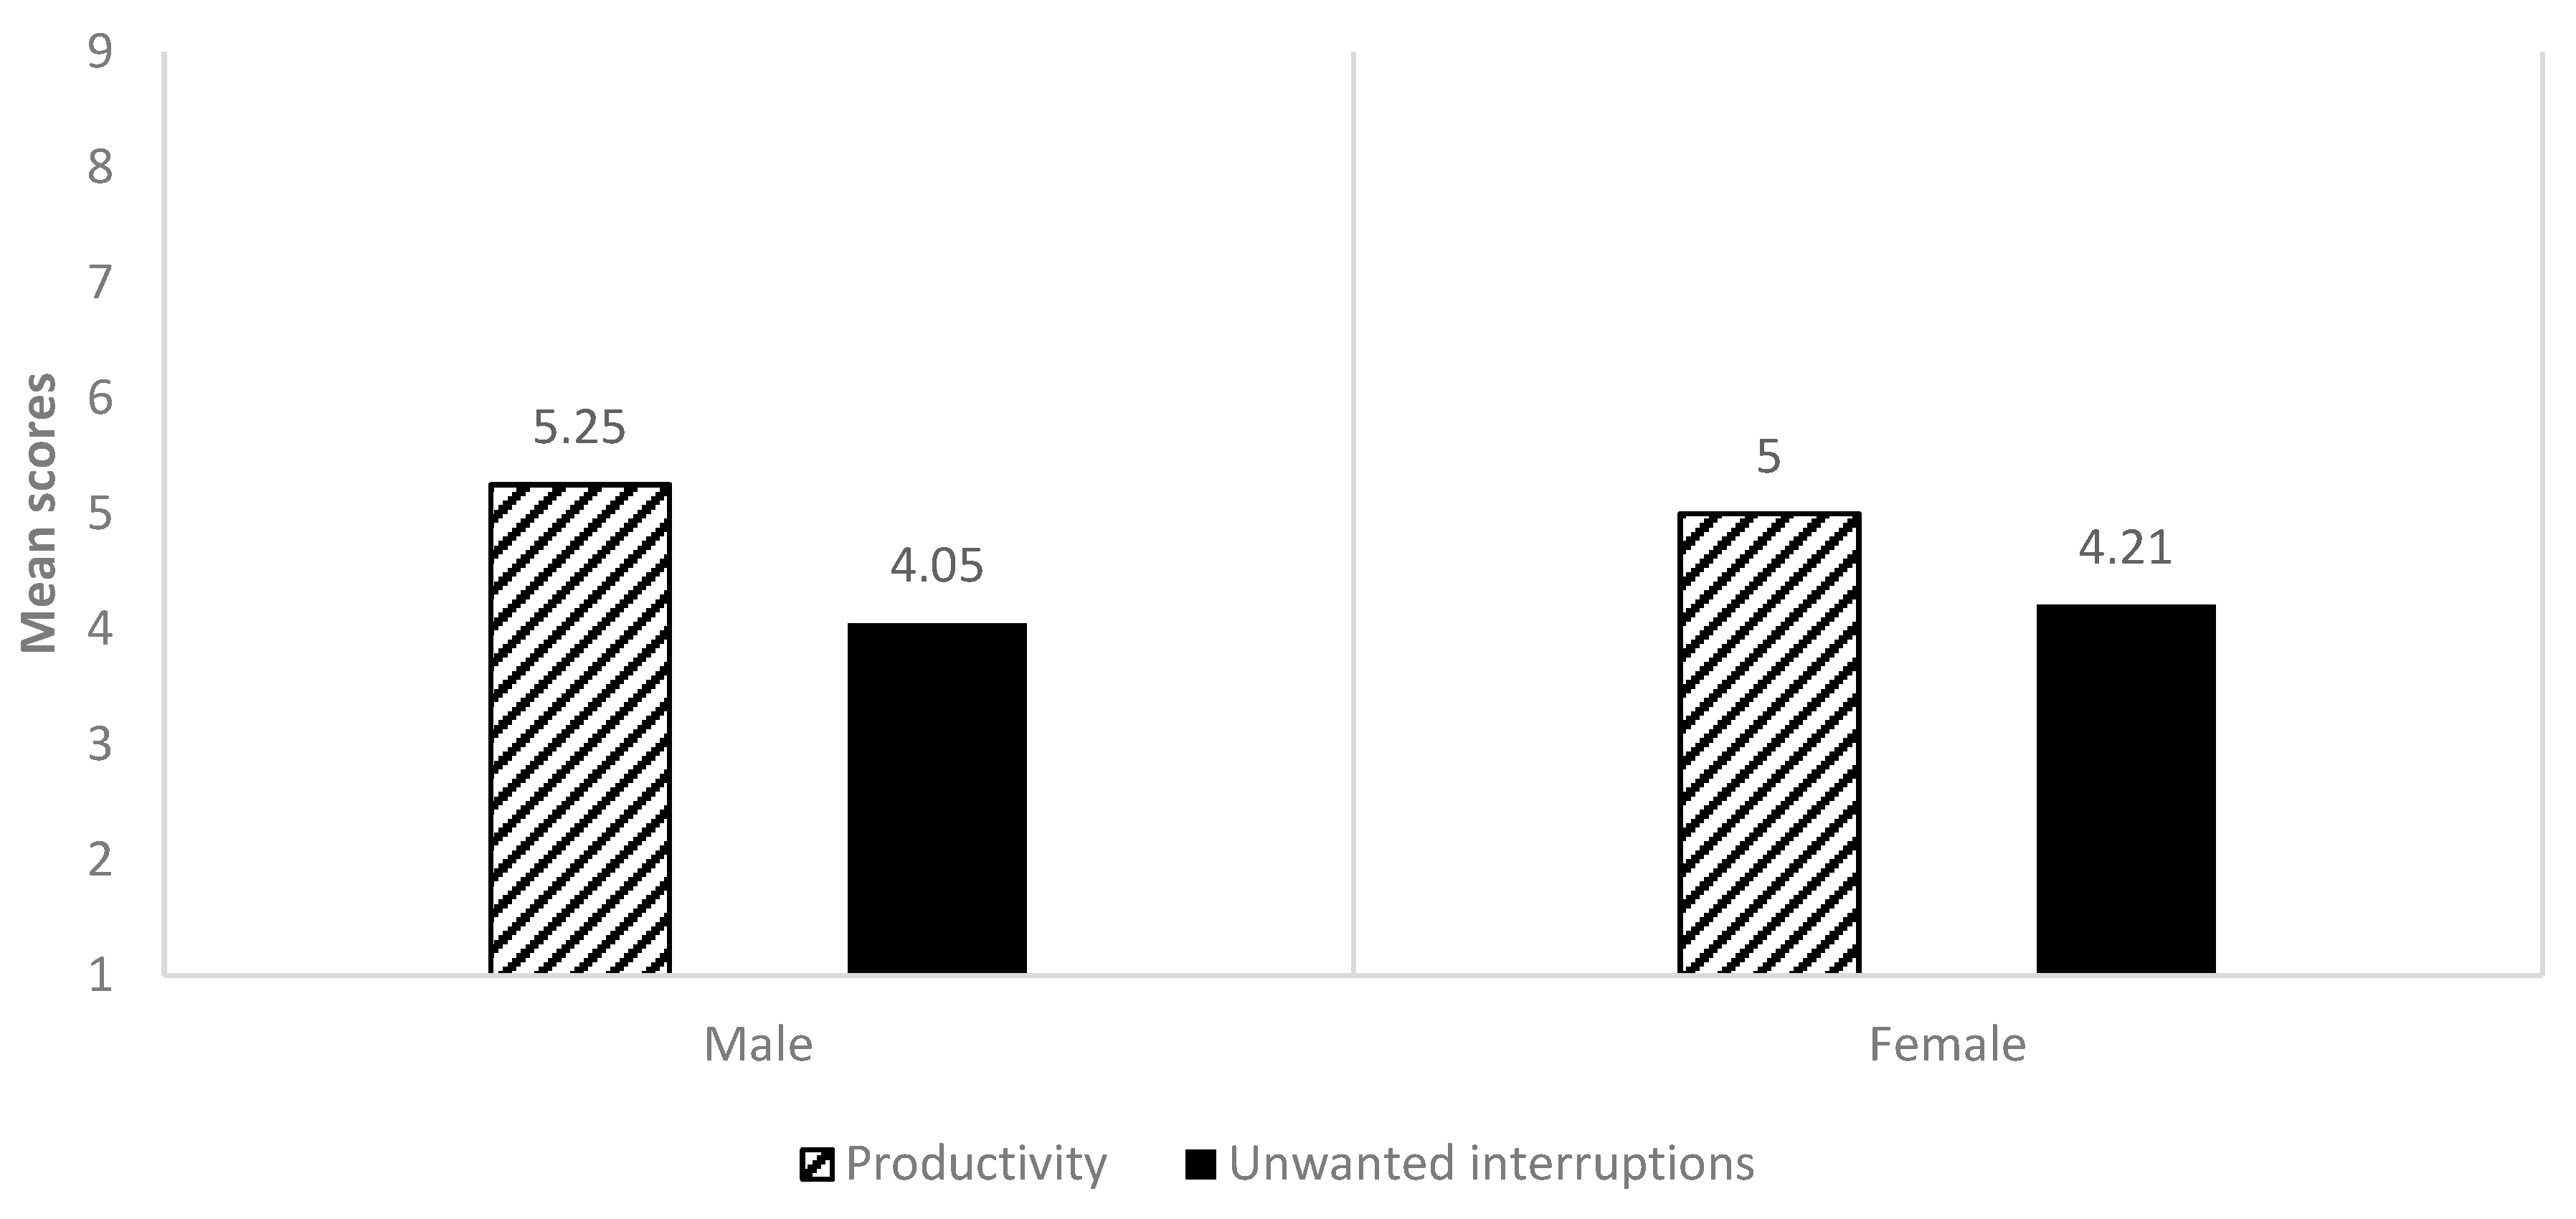
Occupants over 30 years of age showed higher sensitivity to unwanted interruptions in office environments. Likewise, female participants in our study showed higher sensitivity to unwanted interruptions, which is in line with previous studies that demonstrated genders have different responses to the negative aspects of open-plan offices in terms of distractions [21]. Consistent with our findings, Kalgotra, Sharda, and McHaney [29] demonstrated that interruptions caused by technologies significantly increased the task completion time particularly among young adult females and middle-aged males. The higher tolerance of interruptions among young adult female and middle-aged males may be associated with multi-tasking abilities [30]. One of the most important implications of this finding is that office designers need to account for the nature of the work and multitasking responsibilities for individuals when designing office spaces. Background noise and speech intelligibility in office environments particularly need further exploration when designing for more sensitive building users such as female and over 30 years old users.
This highlights the importance of matching work patterns with user preferences and requirements. The matching of office user needs with space provision can only be accomplished through understanding the way people work in office environments and identifying their specific requirements. What is important is building user involvement in the evaluation of building performances and in the creation of the space.
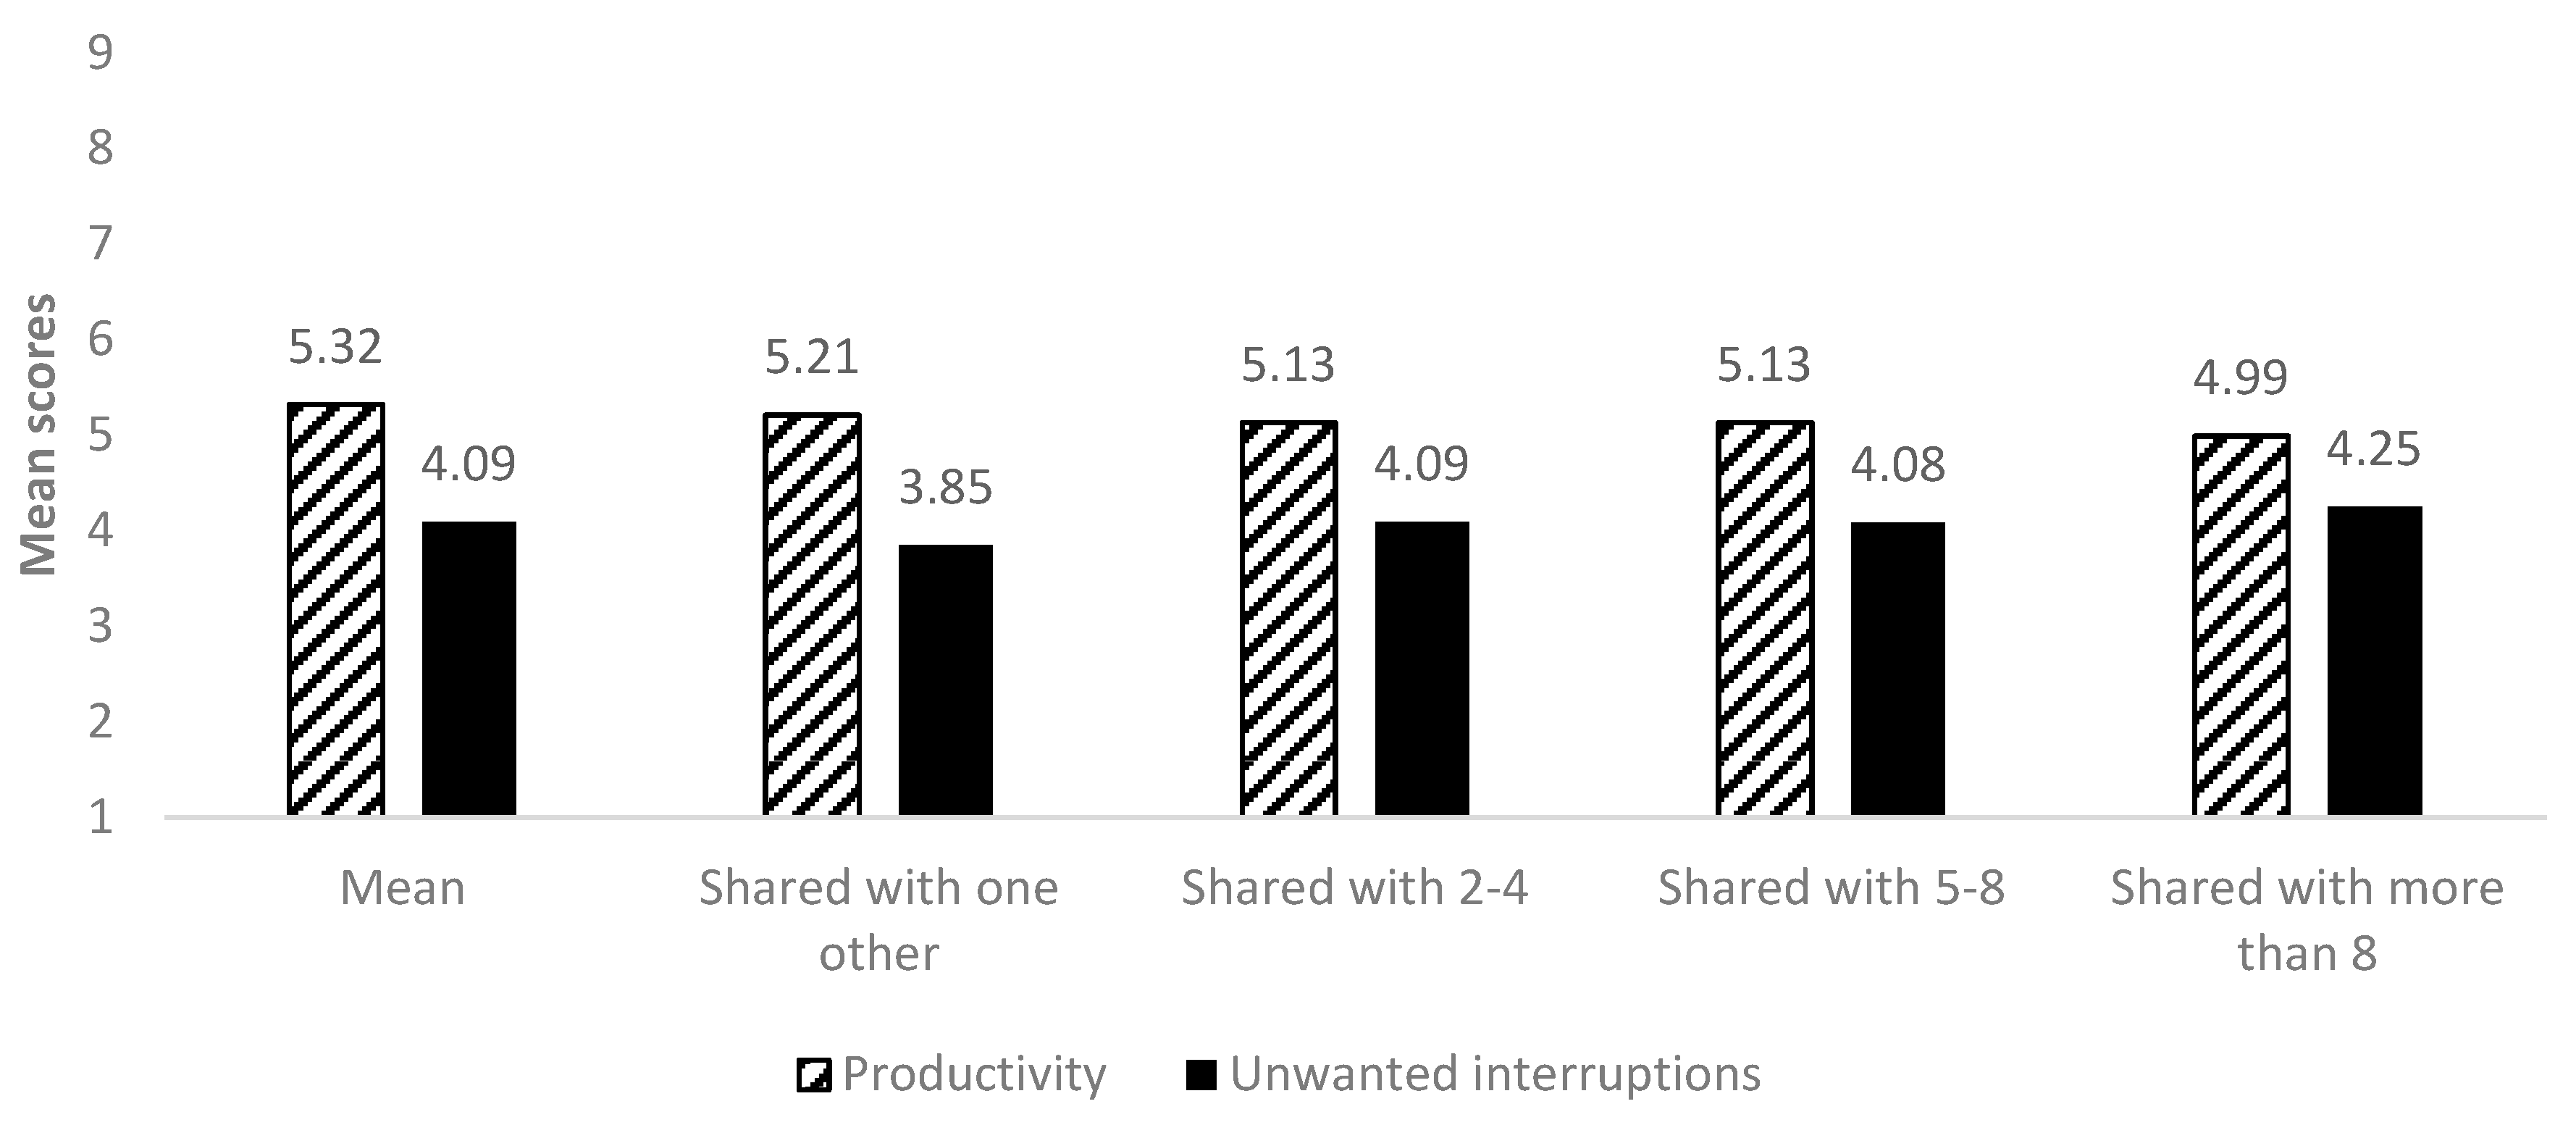
Our study also demonstrated that unwanted interruptions occurred more frequently in larger workgroups. The only exception was the solo offices in comparison with the shared with one other office. Although unwanted interruptions were worse in the solo offices than shared with one other, productivity scores were better in the solo offices. This exception may be due to the other desirable attributes that solo occupant offices have, such as privacy and bigger storage spaces, so even with more frequent unwanted interruptions, the productivity was boosted in solo offices. When comparing the five workgroup sizes, occupants in offices shared with more than 8 people had the lowest tolerance of unwanted interruptions. Open-plan offices may seem aesthetically pleasing, stimulate relationship-building interactions, and increase collaboration, yet offices shared with fewer people obtained higher perceived productivity [19]. As demonstrated by previous studies, self-interruption has a higher rate in larger open plan offices [31]. The performance loss in large workgroups is associated with the lack of speech privacy and reduced concentration as a result of overhearing other conversations [32]. Therefore, creating flexible open-plan offices that simultaneously enable both effective collaboration and undisturbed concentration may remain one of the highest aspirations of office design.
Employees rate their productivity based on individual productivity, rather than team productivity or organisational productivity [26]. Employees also acknowledge the physical environment of their office as an important, inspiring factor for individual productivity. A healthy workplace environment improves productivity and reduces employee-related costs. While organisations prefer open-plan layouts to facilitate collaboration and productive interaction, designers must remain aware that opportunities for concentration are of huge importance. Although some of these are universally relevant, it is essential to consider the particular work processes within the organisation when determining which specific aspects to focus upon.
Thoughtful design and practice can reduce the impact of unwanted interruptions on building users’ lives and improve the quality of working environment. Productivity was a factor that was studied in this paper, yet, sleep, fatigue, irritability, headaches and stress are others that interfere with human life. Including rooms that have higher levels of control over noise pollution is a one sensible solution to create productive buildings for more sensitive building users.
Productivity in buildings is affected by various personal and environmental parameters, for example, productivity seems to be higher in better ventilated buildings. However, it was shown in this paper that unwanted interruption is one of those parameters that influences productivity. Our statistical analysis with a large sample showed a correlation between the two variables, meaning that unwanted interruption greatly influences productivity and that is one of the important building design measures for productive buildings. Using a controlled data sample to keep all parameters the same for comparative studies is extremely difficult in this type of studies. However, to increase the validity of results, using a larger sample is recommend to future studies.

5. Conclusions

We have shown that distractions influence perceived productivity in different ways, depending on the physical and behavioural environments. Further evidence regarding knowledge-worker needs and preferences was provided in this research. The correlation between productivity, and unwanted interruptions in all groups tested proved to be significantly negative. Higher tolerance to unwanted interruptions was found among commercial office workers and in sustainable buildings. Our findings indicate the need for extensive investigation of the acoustic performance of commercial and institutional buildings at the architectural design stage. It was also shown that the acoustic design of office environments directly influences perceived productivity and special consideration is needed when designing workplaces for more sensitive building users such as females and those over 30 years old. These results highlight the importance of the need to account for user demographics when designing office spaces. Our study demonstrated higher levels of unwanted interruptions in bigger workgroups. This finding particularly contradicted conventional wisdom that bigger workgroups improve overall user performance and productivity by enhancing collaborations and interactions among building users. This research also provided a simple, effective framework for measuring the influence of physical features and demographics on user perceptions and productivity—the results of this work yield progressive improvement strategies for the relationship between office users and buildings. One limitation of the study is the sample size for the two age groups. In our database, the numbers of 30 years or over were much higher than those under 30 years. It is suggested that smaller age categories should be used in survey questions to balance the number of participants in different age groups.

Author Contributions

Conceptualization, M.K., E.O.R. and G.B.; methodology, M.K., E.O.R. and G.B.; software, M.K., E.O.R. and G.B.; validation, M.K., E.O.R. and G.B.; formal analysis, M.K., E.O.R. and G.B.; investigation, M.K., E.O.R. and G.B.; resources, M.K., E.O.R. and G.B.; data curation, M.K., E.O.R. and G.B.; writing—original draft preparation, M.K., E.O.R. and G.B.; writing—review and editing, M.K., E.O.R. and G.B.; visualization, M.K., E.O.R. and G.B.; All authors have read and agreed to the published version of the manuscript.

Funding

This research received no external funding.

Institutional Review Board Statement

Various ethical approval was obtained for the data collection that was conducted over the 12-year period.

Informed Consent Statement

Informed consent was obtained from all subjects involved in the study.

Data Availability Statement

The data presented in this study are available on request from the corresponding author.

Conflicts of Interest

The authors declare no conflict of interest.

References

  1. Jami, S.; Zomorodian, Z.S.; Tahsildoost, M.; Khoshbakht, M. The effect of occupant behaviors on energy retrofit: A case study of student dormitories in Tehran. J. Clean. Prod. 2020, 278, 123556. [Google Scholar] [CrossRef]
  2. Gou, Z.; Khoshbakht, M.; Mahdoudi, B. The impact of outdoor views on students’ seat preference in learning environments. Buildings 2018, 8, 96. [Google Scholar] [CrossRef] [Green Version]
  3. Haynes, B. The impact of the behavioural environment on office productivity. J. Facil. Manag. 2007, 5, 158–171. [Google Scholar] [CrossRef]
  4. Haynes, B. Office productivity: A theoretical framework. J. Corp. Real Estate 2007, 9, 97–110. [Google Scholar] [CrossRef]
  5. Bland, C.J.; Center, B.A.; Finstad, D.A.; Risbey, K.R.; Staples, J.G. A theoretical, practical, predictive model of faculty and department research productivity. Acad. Med. 2005, 80, 225–237. [Google Scholar] [CrossRef] [PubMed]
  6. Schneider, E. Noise in Figures; Risk Observatory Thematic Report; Commissioned by the European Agency for Safety and Health at Work; European Agency for Safety and Health at Work: Bilbao, Spain, 2005; ISBN 92-9191-150-X. Available online: https://osha.europa.eu/en/publications/report-noise-figures (accessed on 19 December 2020).
  7. Mohammadi, H.; Alimohammadi, I.; Roshani, S.; Pakzad, R.; Abdollahi, M.B.; Dehghan, S.F. The Effect of Occupational Noise Exposure on Blood and Biochemical Parameters: A Case Study of an Insulator Manufacturer in Iran. Electron. Physician 2016, 8, 1740–1746. [Google Scholar] [CrossRef] [PubMed] [Green Version]
  8. Ismaila, S.; Odusote, A. Noise exposure as a factor in the increase of blood pressure of workers in a sack manufacturing industry, Beni-Suef University. J. Basic Appl. Sci. 2014, 3, 116–121. [Google Scholar] [CrossRef] [Green Version]
  9. Mostaghaci, M.; Mirmohammadi, S.; Mehrparvar, A.; Bahaloo, M.; Mollasadeghi, A.; Davari, M. Effect of Workplace Noise on Hearing Ability in Tile and Ceramic Industry Workers in Iran: A 2-Year Follow-Up Study. Sci. World J. 2013, 2013, 923731. [Google Scholar] [CrossRef] [PubMed]
  10. Haynes, B. Impact of workplace connectivity on office productivity. J. Corp. Real Estate 2008, 10, 286–302. [Google Scholar] [CrossRef]
  11. Stokols, D.; Clitheroe, C.; Zmuidzinas, M. Qualities of work environments that promote perceived support for creativity. Creat. Res. J. 2002, 14, 137–147. [Google Scholar] [CrossRef] [Green Version]
  12. Mark, G.; Gudith, D.; Klocke, U. The cost of interrupted work: More speed and stress. In Proceedings of the SIGCHI Conference on Human Factors in Computing Systems, Florence, Italy, 5–10 April 2008. [Google Scholar]
  13. Adamczyk, P.D.; Bailey, B.P. If Not Now, When? The Effects of Interruption at Different Moments within Task Execution. In Proceedings of the SIGCHI Conference on Human Factors in Computing Systems, Vienna, Austria, 24–29 April 2004. [Google Scholar]
  14. Francis, M. Transforming spaces in higher education: Academic office environments and their influence on staff, a case-study from Melbourne, Australia. In Proceedings of the 53rd International Conference of the Architectural Science Association, Roorkee, India, 28–30 November 2019. [Google Scholar]
  15. Astle, D. Rewording the Brain: How Cryptic Crosswords Can Improve Your Memory and Boost the Power and Agility of Your Brain; Allen & Unwin: Crows Nest, Australia, 2018. [Google Scholar]
  16. Brumby, D.P.; Janssen, C.P.; Mark, G. How do interruptions affect productivity? In Rethinking Productivity in Software Engineering; Springer: Berlin/Heidelberg, Germany, 2019; pp. 85–107. [Google Scholar]
  17. Spira, J.B.; Feintuch, J.B. The Cost of Not Paying Attention: How Interruptions Impact Knowledge Worker Productivity; Report from Basex; Basex: New York, NY, USA, 2005. [Google Scholar]
  18. Khoshbakht, M.; Baird, G.; Rasheed, E.O. The influence of work group size and space sharing on the perceived productivity, overall comfort and health of occupants in commercial and academic buildings. Indoor Built Environ. 2020, 1420326X20912312. [Google Scholar] [CrossRef]
  19. Rasheed, E.O.; Khoshbakht, M.; Baird, G. Does the Number of Occupants in an Office Influence Individual Perceptions of Comfort and Productivity?—New Evidence from 5000 Office Workers. Buildings 2019, 9, 73. [Google Scholar] [CrossRef] [Green Version]
  20. Haynes, B.; Suckley, L.; Nunnington, N. Workplace productivity and office type: An evaluation of office occupier differences based on age and gender. J. Corp. Real Estate 2017, 19, 111–138. [Google Scholar] [CrossRef]
  21. Yildirim, K.; Akalin-Baskaya, A.; Celebi, M. The effects of window proximity, partition height, and gender on perceptions of open-plan offices. J. Environ. Psychol. 2007, 27, 154–165. [Google Scholar] [CrossRef]
  22. Göçer, Ö.; Candido, C.; Thomas, L.; Göçer, K. Differences in Occupants’ Satisfaction and Perceived Productivity in High-and Low-Performance Offices. Buildings 2019, 9, 199. [Google Scholar] [CrossRef] [Green Version]
  23. Baird, G. Sustainable Buildings in Practice: What the Users Think; Routledge: London, UK, 2010. [Google Scholar]
  24. Baird, G.; Leaman, A.; Thompson, J. A comparison of the performance of sustainable buildings with conventional buildings from the point of view of the users. Archit. Sci. Rev. 2012, 55, 135–144. [Google Scholar] [CrossRef]
  25. Haapakangas, A.; Hongisto, V.; Hyönä, J.; Kokko, J.; Keränen, J. Effects of unattended speech on performance and subjective distraction: The role of acoustic design in open-plan offices. Appl. Acoust. 2014, 86, 1–16. [Google Scholar] [CrossRef]
  26. Maarleveld, M.; De Been, I. The influence of the workplace on perceived productivity. In Proceedings of the EFMC2011 10th EuroFM Research Symposium: Cracking the Productivity Nut, Vienna, Austria, 24–25 May 2011. [Google Scholar]
  27. Leaman, A.; Bordass, B. Are users more tolerant of ‘green’ buildings? Build. Res. Inf. 2007, 35, 662–673. [Google Scholar] [CrossRef]
  28. Onyeizu, E. The delusion of green certification: The case of New Zealand green office buildings. In Proceedings of the 4th New Zealand Built Environment Research Symposium (NZBERS), Auckland, New Zealand, 14 November 2014. [Google Scholar]
  29. Kalgotra, P.; Sharda, R.; McHaney, R. Understanding the impact of interruptions on knowledge work: An exploratory neuroimaging study. In Proceedings of the 2016 49th Hawaii International Conference on System Sciences (HICSS), Koloa, HI, USA, 5–8 January 2016. [Google Scholar]
  30. Haynes, B. The impact of office comfort on productivity. J. Facil. Manag. 2008, 6, 37–51. [Google Scholar] [CrossRef] [Green Version]
  31. Dabbish, L.; Mark, G.; González, V.M. Why do I keep interrupting myself? Environment, habit and self-interruption. In Proceedings of the SIGCHI Conference on Human Factors in Computing Systems, Vancouver, BC, Canada, 7–12 May 2011. [Google Scholar]
  32. Roelofsen, P. Performance loss in open-plan offices due to noise by speech. J. Facil. Manag. 2008, 6, 202–211. [Google Scholar] [CrossRef]
Figure 1. The scatter plot of the pilot study of sustainable building averages of unwanted interruptions against perceived productivity.
Buildings 11 00055 g001
Figure 2. Comparative analysis of mean scores of productivity and unwanted interruptions between commercial and institutional buildings.
Buildings 11 00055 g002
Figure 3. Comparative analysis of mean scores of productivity and unwanted interruptions between sustainable and conventional buildings.
Buildings 11 00055 g003
Figure 4. Comparative analysis of mean scores of perceived productivity and unwanted interruptions between under 30 years and 30 years or over.
Buildings 11 00055 g004
Figure 5. Comparative analysis of mean scores of productivity and unwanted interruptions between male and female gender groups.
Buildings 11 00055 g005
Figure 6. Comparative analysis of mean scores of productivity and unwanted interruptions among various workgroups.
Buildings 11 00055 g006
Table 1. List of buildings in “Unwanted Interruptions” order (on a 7-point Scale where 1 is best), together with scores for Perceived Productivity.
BuildingLocationTypeUnwanted Interruptions ScoresProductivity % (Up or Down)
Torrent Research Centre (with AC)Ahmedabad, Indiacommercial2.8720.88
Military Families Resource CentreToronto, Canadainstitutional2.9020.00
Science Park in 2002Gelsenkirchen, Germanycommercial3.161.43
St Mary’s Credit UnionNavan, Irelandcommercial3.1810.83
Min Energy Water & CommunicationPutra Jaya, Malaysiainstitutional3.1916.00
Nikken Sekkei BuildingTokyo, Japancommercial3.198.51
Torrent Research Centre (with PDEC)Ahmedabad, Indiacommercial3.2013.66
Gifford StudiosSouthampton, Englandcommercial3.292.80
Science Park in 2006Gelsenkirchen, Germanycommercial3.46−2.27
Tokyo GasYokohama, Japancommercial3.475.62
NRG Systems FacilityVermont, USAcommercial3.5019.51
Natural Resources Defense CouncilCalifornia, USAcommercial3.5323.00
Institute of LanguagesSydney, Australiainstitutional3.650.48
40 Albert RoadMelbourne, Australiacommercial3.7710.00
Arup CampusSolihull, Englandcommercial3.824.47
Renewable Energy SystemsKings Langley, Englandcommercial3.895.77
Computer Science & EngineeringToronto, Canadainstitutional4.012.54
National Engineering YardsVancouver, Canadacommercial4.030.19
60 Leicester Street,Melbourne, Australiacommercial4.1211.39
Landcare ResearchAuckland, New Zealandinstitutional4.12−2.18
ZICER BuildingNorwich, Englandinstitutional4.23−7.81
City HallLondon, Englandinstitutional4.41−1.64
Found’n Building, Eden Project in 2006St Austell, Englandcommercial4.58−7.00
AUT AkorangaAuckland, New Zealandinstitutional4.713.64
Red Centre BuildingSydney, Australiainstitutional4.71−5.00
Scottsdale EcocentreTasmania, Australiacommercial5.19−4.29
Found’n Building, Eden Project in 2004St Austell, Englandcommercial5.30−2.00
Erskine BuildingChristchurch, New Zealandinstitutional5.399.80
Student Services CentreNewcastle, Australiainstitutionalna−2.04
Institute of Technical EducationBishan, Singaporeinstitutionalna−10.61
General Purpose BuildingNewcastle, Australiainstitutionalna−11.9
Menara UMNOPenang, Malaysiacommercialnana
Note: in two cases, the same building was surveyed twice some years apart; while in another, different ventilation systems were used in separate parts of the building. Interruptions were not assessed in four of the buildings, but they are listed separately at the bottom for completeness. AC means air-conditioned; PDEC means passive down-draught evaporative cooling.
Table 2. Studied buildings in the dataset and building specifications.
VariablesDataset Distribution
CountryNew Zealand (56.7%); Australia (17.3%); England (11.4%); USA (1.4%); India (3.3%); Ireland (0.3%); Japan (1.3%); Malaysia (3.1%); Canada (3.9%)
Number of occupantsMinimum = 11; Maximum = 342; Average = 75; Standard Deviation = 70
Sustainability credentialsGreen buildings (55.7%); Conventional (44.3%)
Building useCommercial (72%); Academic (28%)
Table 3. The subset of the survey questionnaire used in this study.
CategoryTopicQuestions
Background questionsAgeWhat is your age? Tick Under 30 or 30 or over
GenderWhat is your sex? Tick Male or Female
WorkgroupsIs your office or work area …? Tick Normally occupied by you alone, Shared with one other, Shared with 2–4 others, Shared with 5–8 others, or Shared with more than 8 others
SatisfactionUnwanted interruptionsPlease estimate how you are affected by unwanted interruptions…? Tick a number from 1 (for Not at all) to 7 (for Very frequently)
ProductivityPlease estimate how you think your productivity at work is decreased or increased by the environmental conditions in the building …? Tick a number from 1 (for Decreased by 40%) to 9 (for Increased by 40%)
Table 4. Descriptive statistics of productivity and unwanted interruptions in commercial and institutional buildings.
ParametersVariablesMeanStd. Deviationn
Commercial buildingsProductivity5.211.6763331
Unwanted interruptions4.061.6483377
Institutional buildingsProductivity4.961.7311407
Unwanted interruptions4.281.6951374
Table 5. One-way ANOVA analysis comparing productivity and unwanted interruptions in commercial and institutional building groups.
ParametersVariablesSum of SquaresdfMean SquareFp-Value
ProductivityBetween Groups59.829159.82920.897<0.001 **
Within Groups13,559.33447362.863--
Total13,619.1634737---
Unwanted InterruptionsBetween Groups50.199150.19918.176<0.001 **
Within Groups13,115.96847492.762--
Total13,166.1674750---
Note: ** Statistical significance p-value < 0.05.
Table 6. Pearson correlation comparing productivity and unwanted interruptions in commercial and institutional building groups.
ParametersVariablesStatisticsProductivityUnwanted Interruptions
CommercialProductivityPearson Correlation1−0.384 **
Significance (2-tailed)-<0.001
n33313212
Unwanted InterruptionsPearson Correlation−0.384 **1
Significance (2-tailed)<0.001-
n32123377
InstitutionalProductivityPearson Correlation1−0.324 **
Significance (2-tailed)-<0.001
n14071293
Unwanted InterruptionsPearson Correlation−0.324 **1
Significance (2-tailed)<0.001-
n12931374
Note: ** Statistical significance p-value < 0.05.
Table 7. Descriptive statistics of productivity and unwanted interruptions in sustainable and conventional buildings.
ParametersVariablesMeanStd. Deviationn
Sustainable buildingsProductivity5.491.7062604
Unwanted interruptions3.971.7012573
Conventional buildingsProductivity4.701.5812134
Unwanted interruptions4.311.6022178
Table 8. One-way ANOVA analysis comparing productivity and unwanted interruptions in sustainable and conventional building groups.
ParametersVariablesSum of SquaresdfMean SquareFp-Value
ProductivityBetween Groups714.7071714.707262.301<0.001 **
Within Groups12,904.45747362.725--
Total13,619.1634737---
Unwanted interruptionsBetween Groups136.9681136.96849.923<0.001
Within Groups13,029.19947492.744--
Total13,166.1674750---
Note: ** Statistical significance p-value < 0.05.
Table 9. Pearson correlation comparing productivity and unwanted interruptions in sustainable and conventional building groups.
ParametersVariablesStatisticsProductivityUnwanted Interruptions
Sustainable buildingsProductivityPearson Correlation1−0.361 **
Significance (2-tailed)-<0.001
n26042438
Unwanted InterruptionsPearson Correlation−0.361 **1
Significance (2-tailed)<0.001-
n24382573
Conventional buildingsProductivityPearson Correlation1−0.348 **
Significance (2-tailed)-<0.001
n21342067
Unwanted InterruptionsPearson Correlation−0.348 **1
Significance (2-tailed)<0.001-
n20672178
Note: ** Statistical significance p-value < 0.05.
Table 10. Descriptive statistics of productivity and unwanted interruptions for under 30 years and 30 years or over.
ParametersVariablesMeanStd. Deviationn
under 30 yearsProductivity5.391.7291200
Unwanted interruptions3.851.6681208
30 years or overProductivity5.041.6723473
Unwanted interruptions4.221.6493479
Table 11. One-way ANOVA analysis comparing perceived productivity and unwanted interruptions for under 30 years and 30 years or over.
ParametersVariablesSum of SquaresdfMean SquareFp-Value
ProductivityBetween Groups104.6691104.66936.788<0.001 **
Within Groups13,289.80546712.845--
Total13,394.4754672---
Unwanted InterruptionsBetween Groups121.3841121.38444.355<0.001 **
Within Groups12,821.29746852.737--
Total12,942.6814686---
Note: ** Statistical significance p-value < 0.05.
Table 12. Pearson correlation comparing productivity and unwanted interruptions for under 30 years and 30 years or over.
ParametersVariablesStatisticsProductivityUnwanted Interruptions
under 30 years ProductivityPearson Correlation1−0.350 **
Significance (2-tailed)-<0.001
n12001148
Unwanted InterruptionsPearson Correlation−0.350 **1
Significance (2-tailed)<0.001-
n11481208
30 years or overProductivityPearson Correlation1−0.367 **
Significance (2-tailed)-<0.001
n34733299
Unwanted InterruptionsPearson Correlation−0.367 **1
Significance (2-tailed)<0.001-
n32993479
Note: ** Statistical significance p-value < 0.05.
Table 13. Descriptive statistics of productivity and unwanted interruptions for different genders.
ParametersVariablesMeanStandard Deviationn
MaleProductivity5.251.6502413
Unwanted interruptions4.051.6052369
FemaleProductivity5.001.7282247
Unwanted interruptions4.211.7182301
Table 14. One-way ANOVA analysis comparing productivity and unwanted interruptions for male and female gender groups.
ParametersVariablesSum of SquaresdfMean SquareFp-Value
ProductivityBetween Groups68.197168.19723.935<0.001 **
Within Groups13,271.73746582.849--
Total13,339.9344659---
Unwanted InterruptionsBetween Groups30.708130.70811.1230.001 **
Within Groups12,887.73846682.761--
Total12,918.4464669---
Note: ** Statistical significance p-value < 0.05.
Table 15. Pearson correlation comparing productivity and unwanted interruptions for male and female gender groups.
ParametersVariablesStatisticsProductivityUnwanted Interruptions
Male ProductivityPearson Correlation1−0.359 **
Significance (2-tailed)-<0.001
n24132289
Unwanted InterruptionsPearson Correlation−0.359 **1
Significance (2-tailed)<0.001-
n22892369
FemaleProductivityPearson Correlation1−0.371 **
Significance (2-tailed)-<0.001
n22472144
Unwanted InterruptionsPearson Correlation−0.371 **1
Significance (2-tailed)<0.001-
n21442301
Note: ** Statistical significance p-value < 0.05.
Table 16. Descriptive statistics of productivity and unwanted interruptions for different workgroups.
ParametersVariablesMeanStd. Deviationn
Solo occupantProductivity5.321.6071056
Unwanted interruptions4.091.6751028
Shared with one otherProductivity5.211.637367
Unwanted interruptions3.851.670357
Shared with 2–4Productivity5.131.740781
Unwanted interruptions4.091.603798
Shared with 5–8Productivity5.131.726685
Unwanted interruptions4.081.696702
Shared with more than 8Productivity4.991.7241720
Unwanted interruptions4.251.6681740
Table 17. One-way ANOVA analysis comparing productivity and unwanted interruptions for different workgroups.
ParametersVariablesSum of SquaresdfMean SquareFp-Value
ProductivityBetween Groups77.330515.4665.390<0.001 **
Within Groups13,230.29346112.869--
Total13,307.6244616---
Unwanted InterruptionsBetween Groups58.633511.7274.2450.001 **
Within Groups12,782.46646272.763--
Total12,841.0994632---
Note: ** Statistical significance p-value < 0.05.
Table 18. Multiple comparisons and Tukey honestly significant difference (HSD) analysis for productivity scores among different workgroups.
(I) Work-Group(J) Work-GroupMean Difference (I–J)Std. Errorp-Value95% Confidence Interval
Lower BoundUpper Bound
Solo occupantShared with 1 other0.1150.1030.874−0.180.41
Shared with 2–40.1940.0800.147−0.030.42
Shared with 5–80.1920.0830.190−0.040.43
Shared with more than 80.331 **0.0660.000 **0.140.52
Shared with 1 otherSolo occupant−0.1150.1030.874−0.410.18
Shared with 2–40.0790.1070.977−0.230.38
Shared with 5–80.0770.1100.981−0.240.39
Shared with more than 80.2160.0970.231−0.060.49
Shared with 2–4Solo occupant−0.1940.0800.147−0.420.03
Shared with 1 other−0.0790.1070.977−0.380.23
Shared with 5–8−0.0020.0891.000−0.250.25
Shared with more than 80.1370.0730.420−0.070.35
Shared with 5–8Solo occupant−0.1920.0830.190−0.430.04
Shared with 1 other−0.0770.1100.981−0.390.24
Shared with 2–40.0020.0891.000−0.250.25
Shared with more than 80.1390.0770.458−0.080.36
Shared with more than 8Solo occupant−0.331 **0.0660.000 **−0.52−0.14
Shared with 1 other−0.2160.0970.231−0.490.06
Shared with 2–4−0.1370.0730.420−0.350.07
Shared with 5–8−0.1390.0770.458−0.360.08
Note: ** Statistical significance p-value < 0.05.
Table 19. Multiple comparisons and Tukey HSD analysis for unwanted interruptions among different workgroups.
(I) Work-Group(J) Work-GroupMean Difference (I–J)Std. Errorp-Value95% Confidence Interval
Lower BoundUpper Bound
Solo occupantShared with 1 other0.2400.1020.176−0.050.53
Shared with 2–4−0.0050.0781.000−0.230.22
Shared with 5–80.0090.0811.000−0.220.24
Shared with more than 8−0.1630.0650.125−0.350.02
Shared with 1 otherSolo occupant−0.2400.1020.176−0.530.05
Shared with 2–4−0.2440.1060.191−0.550.06
Shared with 5–8−0.2310.1080.268−0.540.08
Shared with more than 8−0.403 **0.097<0.001 **−0.68−0.13
Shared with 2–4Solo occupant0.0050.0781.000−0.220.23
Shared with 1 other0.2440.1060.191−0.060.55
Shared with 5–80.0130.0861.000−0.230.26
Shared with more than 8−0.1590.0710.223−0.360.04
Shared with 5–8Solo occupant−0.0090.0811.000−0.240.22
Shared with 1 other0.2310.1080.268−0.080.54
Shared with 2–4−0.0130.0861.000−0.260.23
Shared with more than 8−0.1720.0740.189−0.380.04
Shared with more than 8Solo occupant0.1630.0650.125−0.020.35
Shared with 1 other0.403 **0.097<0.001 **0.130.68
Shared with 2–40.1590.0710.223−0.040.36
Shared with 5–80.1720.0740.189−0.040.38
Note: ** Statistical significance p-value < 0.05.
Publisher’s Note: MDPI stays neutral with regard to jurisdictional claims in published maps and institutional affiliations.

