
Working from Home in Italy during COVID-19 Lockdown: A Survey to Assess the Indoor Environmental Quality and Productivity

 ,
,  , , , , ,
Abstract
:1. Introduction
1.1. Reference Literature on the Topic of Working for Home

| Ref. | WFH Typology | Number of Participants | Research Type | Category of the Assessment | Methodological Approach | Results |
|---|---|---|---|---|---|---|
| [3] | C | 258 teleworkers from two global Information Technology companies | Predictive | Job satisfaction according to technostress indicators | Survey | Teleworking produces technostress due to the job characteristics and technology as a function of the intensity of teleworking: The higher the intensity, the less technostress |
| [4] | C/E | 37,553 teleworkers (from 63 different studies) | Review | Affective, cognitive, social, professional and psychosomatic. | - | Remote working has a positive effect on job satisfaction, organisational commitment, reduction of emotional exhaustion and working autonomy and a negative effect due to social isolation and carrier advancement |
| [5] | C | N.A. (34 studies) | Review | Impact on work life and job satisfaction from four perspectives: communication, social relation, achievement recognition and work-life balance. | - | Remote working produces difficulties in communication, reduction of social relationship, achievement recognition and work-life balance |
| [6] | C | 45,000 workers (from Labour Force Surveys) & 4470 (2001) 7787 (2006) and 3200 (2012) workers | Review/theoretically informed predictions | Work effort, job- related well- being and work- life balance. | Surveys | Remote working has a positive effect on employing organization, commitment and job satisfaction and a negative effect on work-life balance |
| [7] | C | 180 | Descriptive | Job performance, satisfaction and creativity | Surveys | Higher levels of job performance, job satisfaction and creative performance in WFH. |
| [8] | C | 7500 | Descriptive | Relationship between WFH and extra work activities depending on the type of employee: how they use the saved travel time and budget | Survey | Telecommuting is associated with more out-of-home activities, and it improves the workers’ work–life balance |
1.2. Survey Definition Based on the Reference Literature
| Ref. | Case | Number of Participants | Research Type | Category of the Assessment | Köppen-Geiger Climate Classification [20] (Period) | Results |
|---|---|---|---|---|---|---|
| [12] | 22 buildings in the United States, including offices, laboratories, banks and courthouses | - | Causal explanatory | Satisfaction with indoor environments | Case 1: BSk, Dfa (summer 2001); Case 2: Csb, Bsk, Csa(November 2001) Case 3: BSk, Dfa (-), Csb, Bsk, Csa(-), Dfa, Dfb (-), Cfa (-) | Average satisfaction follows this ranking: 1. Lighting, 2. Layout, 3. Building and ground, 4. Wayfinding, 5. Air quality, 6. Thermal comfort and acoustic quality (same rating) |
| [13] | Five office cases in the Netherlands | 579 | Descriptive | Influential office design factors on occupant’s satisfaction | Cfb(different seasons) | Desk location and office layout have a large impact on occupant’s satisfaction |
| [14] | 30 office buildings from the BOSSA database | 5171 | Descriptive | Impact of different workspace layouts on occupants’ overall satisfaction on key IEQ dimensions, perceived productivity and perceived health | BWh, BWk, BSh, Csa, Csb, Cfa, Cfb, (different seasons) | Occupant’s satisfaction is related to the workspace layout |
| [15] | ~900 buildings by CBE database including office, education spaces, laboratories, healthcare workspaces, multi-family residential dormitories | >90,000 | Descriptive | Satisfaction with indoor environmental factors, privacy, furniture | Worldwide (different seasons) | Spaces’ ease of interaction, amount of light and cleanliness are the main source of satisfaction. Sound privacy, temperature and noise level are the main causes of dissatisfaction. |
| [16] | 351 office buildings by CBE database | 52,980 | Descriptive | Satisfaction with indoor environmental parameters, workspace, and building features | US (different seasons) | The most important parameters were satisfaction with the amount of space, noise level and visual privacy. |
| [17] | 3 different types of offices in Hong Kong | 293 | Descriptive/predictive | Acceptance of the perceived indoor environment is given by four aspects, namely thermal environment, indoor air quality, equivalent noise level and illumination level. | Cfa (-) | Operative temperature is the most influential variable. |
| [18] | 29 office buildings in US | 492 | Descriptive | Satisfaction with the indoor environments including thermal, air, acoustic, lighting, spatial and overall environmental qualities. | - | Each sub-set of IEQ satisfaction is ranked using statistical methods to illustrate respective contribution to overall environmental satisfaction, given workstation location and occupant gender. |
| [19] | Six of the interviews took place in the participants’ homes, the focus groups in surroundings familiar to the participants | 45 participants, 3 focus groups | Descriptive | Balancing between WFH and work-life | Csa | Positive parameters are flexibility and choice for a broad range of workers. Negative: doesn’t facilitate the breakdown of traditional gender roles nor does it smooth out the inequalities that education and income bring. |
| [20] | SOEP dataset concerning German employees WFH | 22,000 | Descriptive | Satisfaction with indoor environmental factors, privacy, furniture | Cfb, Dfb | Indoor environmental factors, privacy and furniture are statistically significant on work effort and on unpaid overtime hours |
| [21] | 50 employees from IT sectors to teaching sectors in Mangalore (India) | 50 | Descriptive | Productivity and satisfaction in WFH versus working at office | Am | Presence of children at home, comfortable space at home, quiet environment at home and good internet access are the most important variables |
| [22] | Participants were recruited through emails, social media platforms and newsletters in California | 988 valid questionnaires | Descriptive | Social, behavioural and physical factors on well-being of office workstation users during COVID-19 WFH | Csa, Csb | Physical exercise, communication with colleagues, children at home, distractions while working, workstation set-up and satisfaction with indoor environmental factors |
1.3. Motivation and Goals
- Goal 1—Descriptive approach. Question 1: How do home workers feel the IEQ during working activities at home? Question 2: Are they satisfied about their productivity?
- Goal 2—Predictive model. Question 3: What are the most suitable algorithms and influential features to predict workers’ overall satisfaction?
- Goal 3—Sentiment analysis. Question 4: What impact does WFH have on workers’ satisfaction?
2. Method
2.1. Data Acquisition
- Section A: Each participant must give consent for the use of the given answers for scientific purposes, according to the guidelines of GDPR UE 2016/679;
- Section B: Personal information defining the users and their household;
- Section C: Information on the dwelling characteristics, such as building type (detached house or apartment), year of construction and refurbishment interventions;
- Section D: Characteristics of the rooms commonly used in WFH, such as dimensions and layout, time spent in the room, appliances and controls and ease of use;
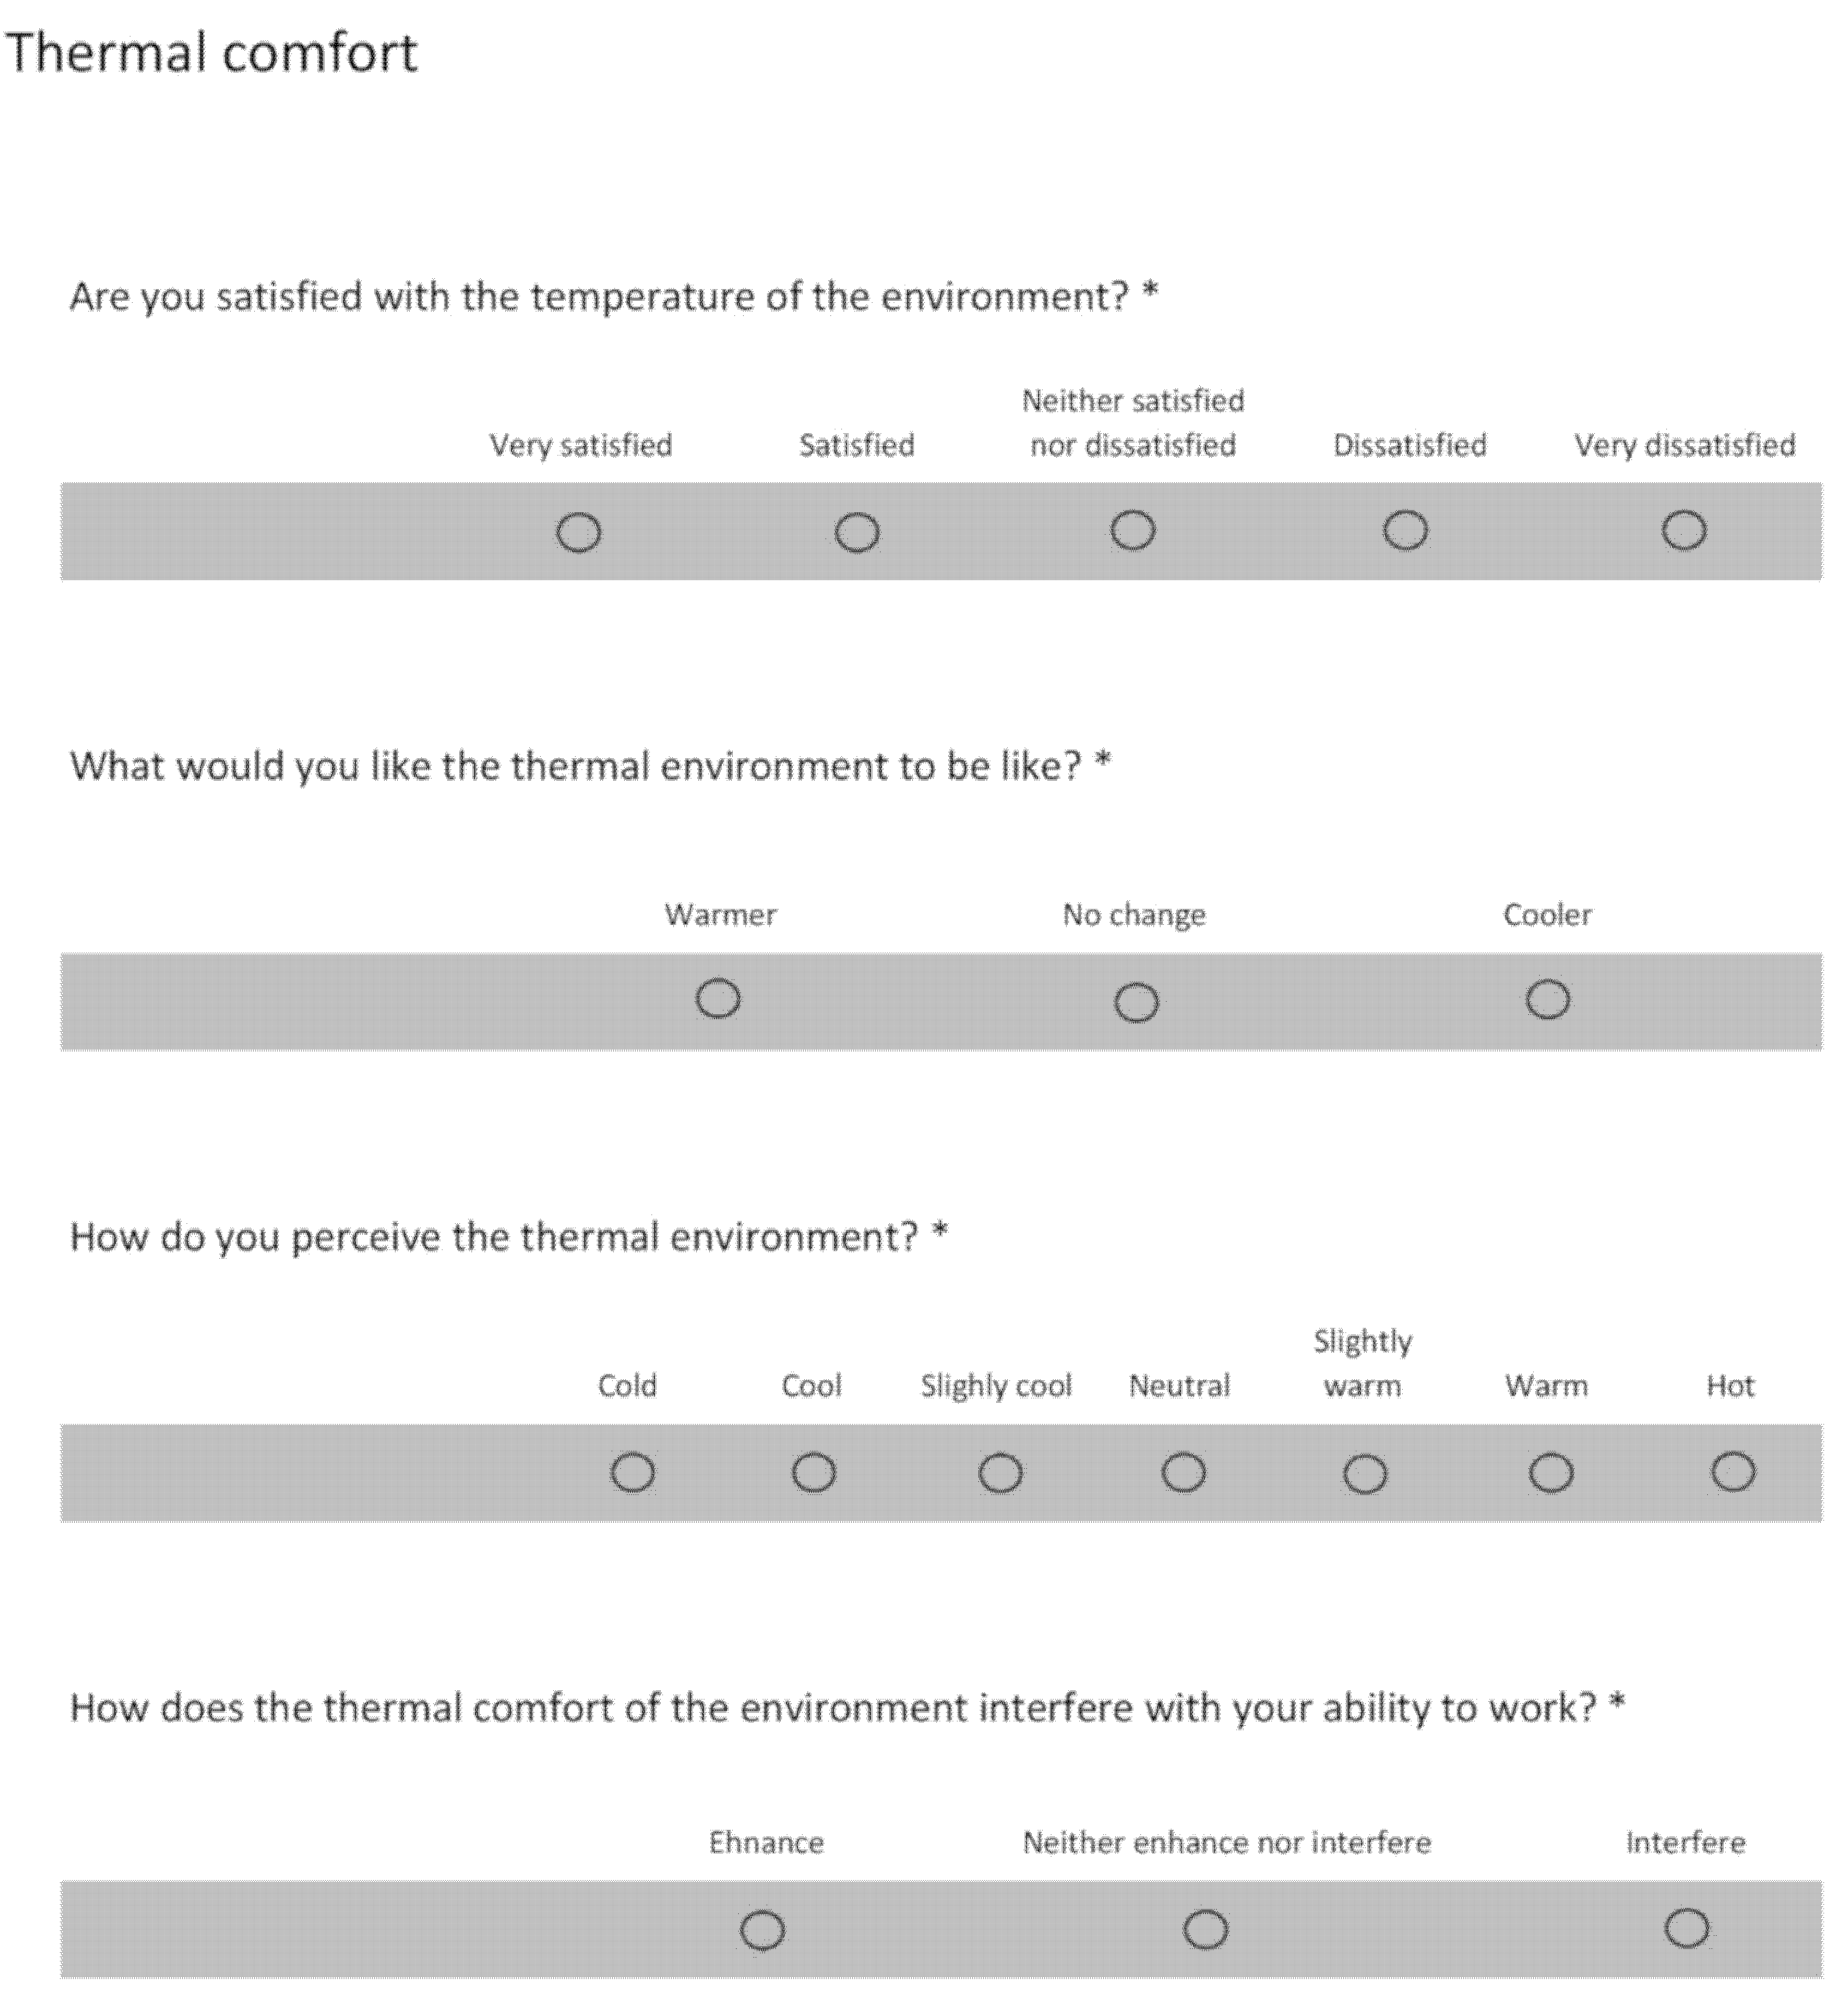
- Section E: Information of single aspects of comfort in the following order TC, VC, AQ and IAQ. Each aspect is investigated from three perspectives: Satisfaction, preference and perception. For each category, a specific Categorical Scale (CS) [29] is defined with different points (see Table 3). Satisfaction is analysed with a 5-point scale, ranging from “Very dissatisfied” (−2) to “Very satisfied” (+2). For the question on preference, the bipolar 3-point scale is used, except for acoustic quality that requires one polar 4-point scale. The perception category differs from aspect to aspect. TC uses the 7-point scale of the ASHRAE standard [30], VC a bipolar 5-point scale, AQ a unipolar 5-point scale and, finally, IAQ a unipolar 4-point scale. The interference of all the considered environmental factors in relation to the productivity of the work activity is defined by considering a bipolar 3-point scale. Figure 2 shows, as an example, the format used and relative questions (translated into English) related to TC;
- Section F refers to overall satisfaction and satisfaction in relation to some other aspects that may affect working activities: Available space, furniture and accessories, visual and acoustic privacy, productivity. Participants have to answer questions about the relative importance of ten specific aspects in relation to satisfaction and how WFH could affect the comfort perception. Table 3 summarises the characteristics of the scales used to identify the satisfaction, preference and perception of participants in relation to the considered aspects and the relative scores. Depending on the scale used (one polar or bipolar), the value zero is not always associated with a “neutral” score. With bipolar scales, the neutral value zero is the best condition. However, with AQ preference, AQ perception and IAQ perception characterised by one polar scale, the value zero is associated with the best condition;
- Section G provides an open-ended question that allows participants to give their comments.
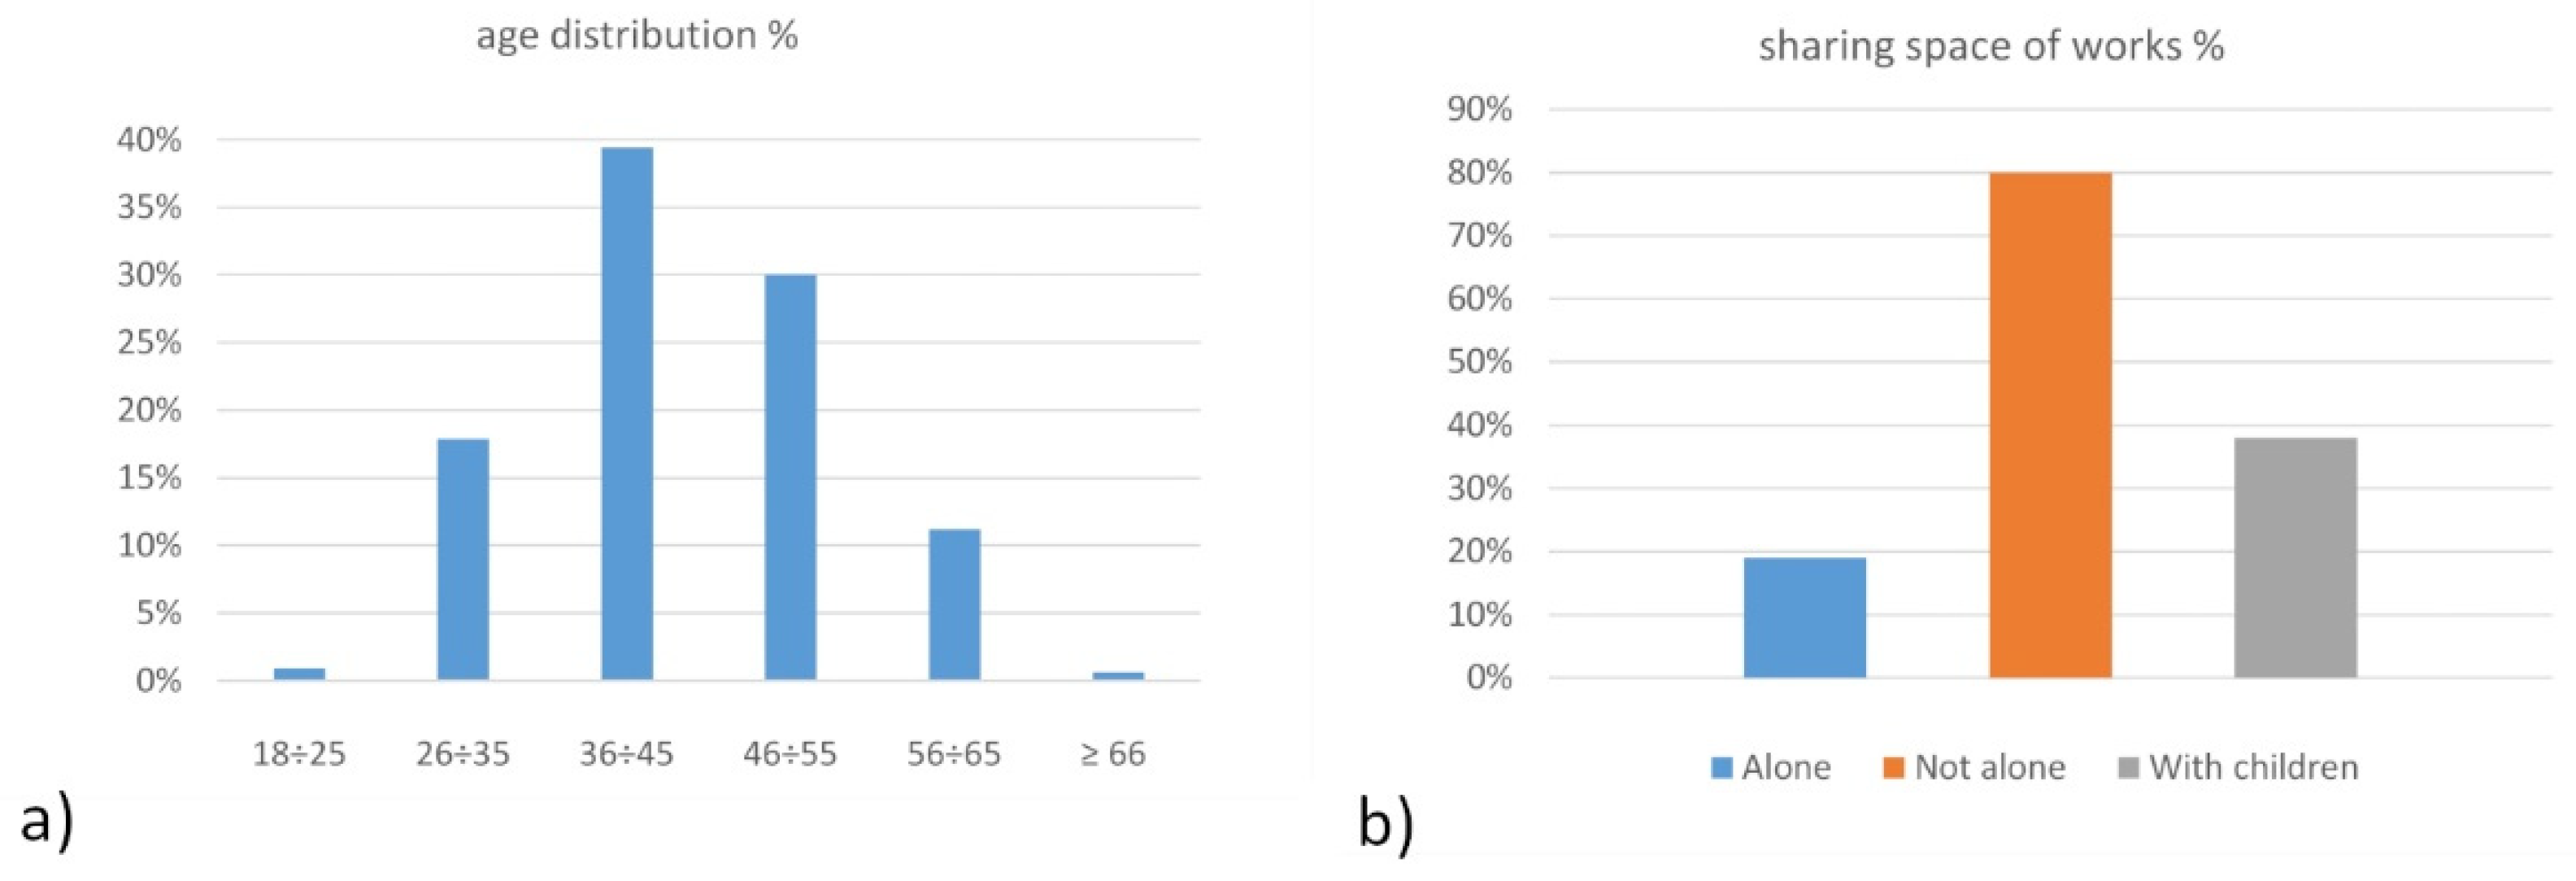
- The type of dwelling and rooms worked in;
- The prevalence of WFH in Italy before the lockdown;
- The imposed conditions of “living together” and the possible presence of children during working hours due to closed schools and distance learning.
2.2. Data Preparation
2.3. Data Analysis
- It well fits the “short” texts, such as those used, for example, on social media, reviews of products or services and also in this particular questionnaire;
- It does not require training data, as it uses a combination of a sentiment lexicon as a list of lexical features (e.g., words) which are generally labelled as positive or negative according to their semantic orientation.
- Positive sentiment: Compound score >= 0.05.
- Neutral sentiment: −0.05 < compound score < 0.05
- Negative sentiment: Compound score <= −0.05.
3. Results and Discussion
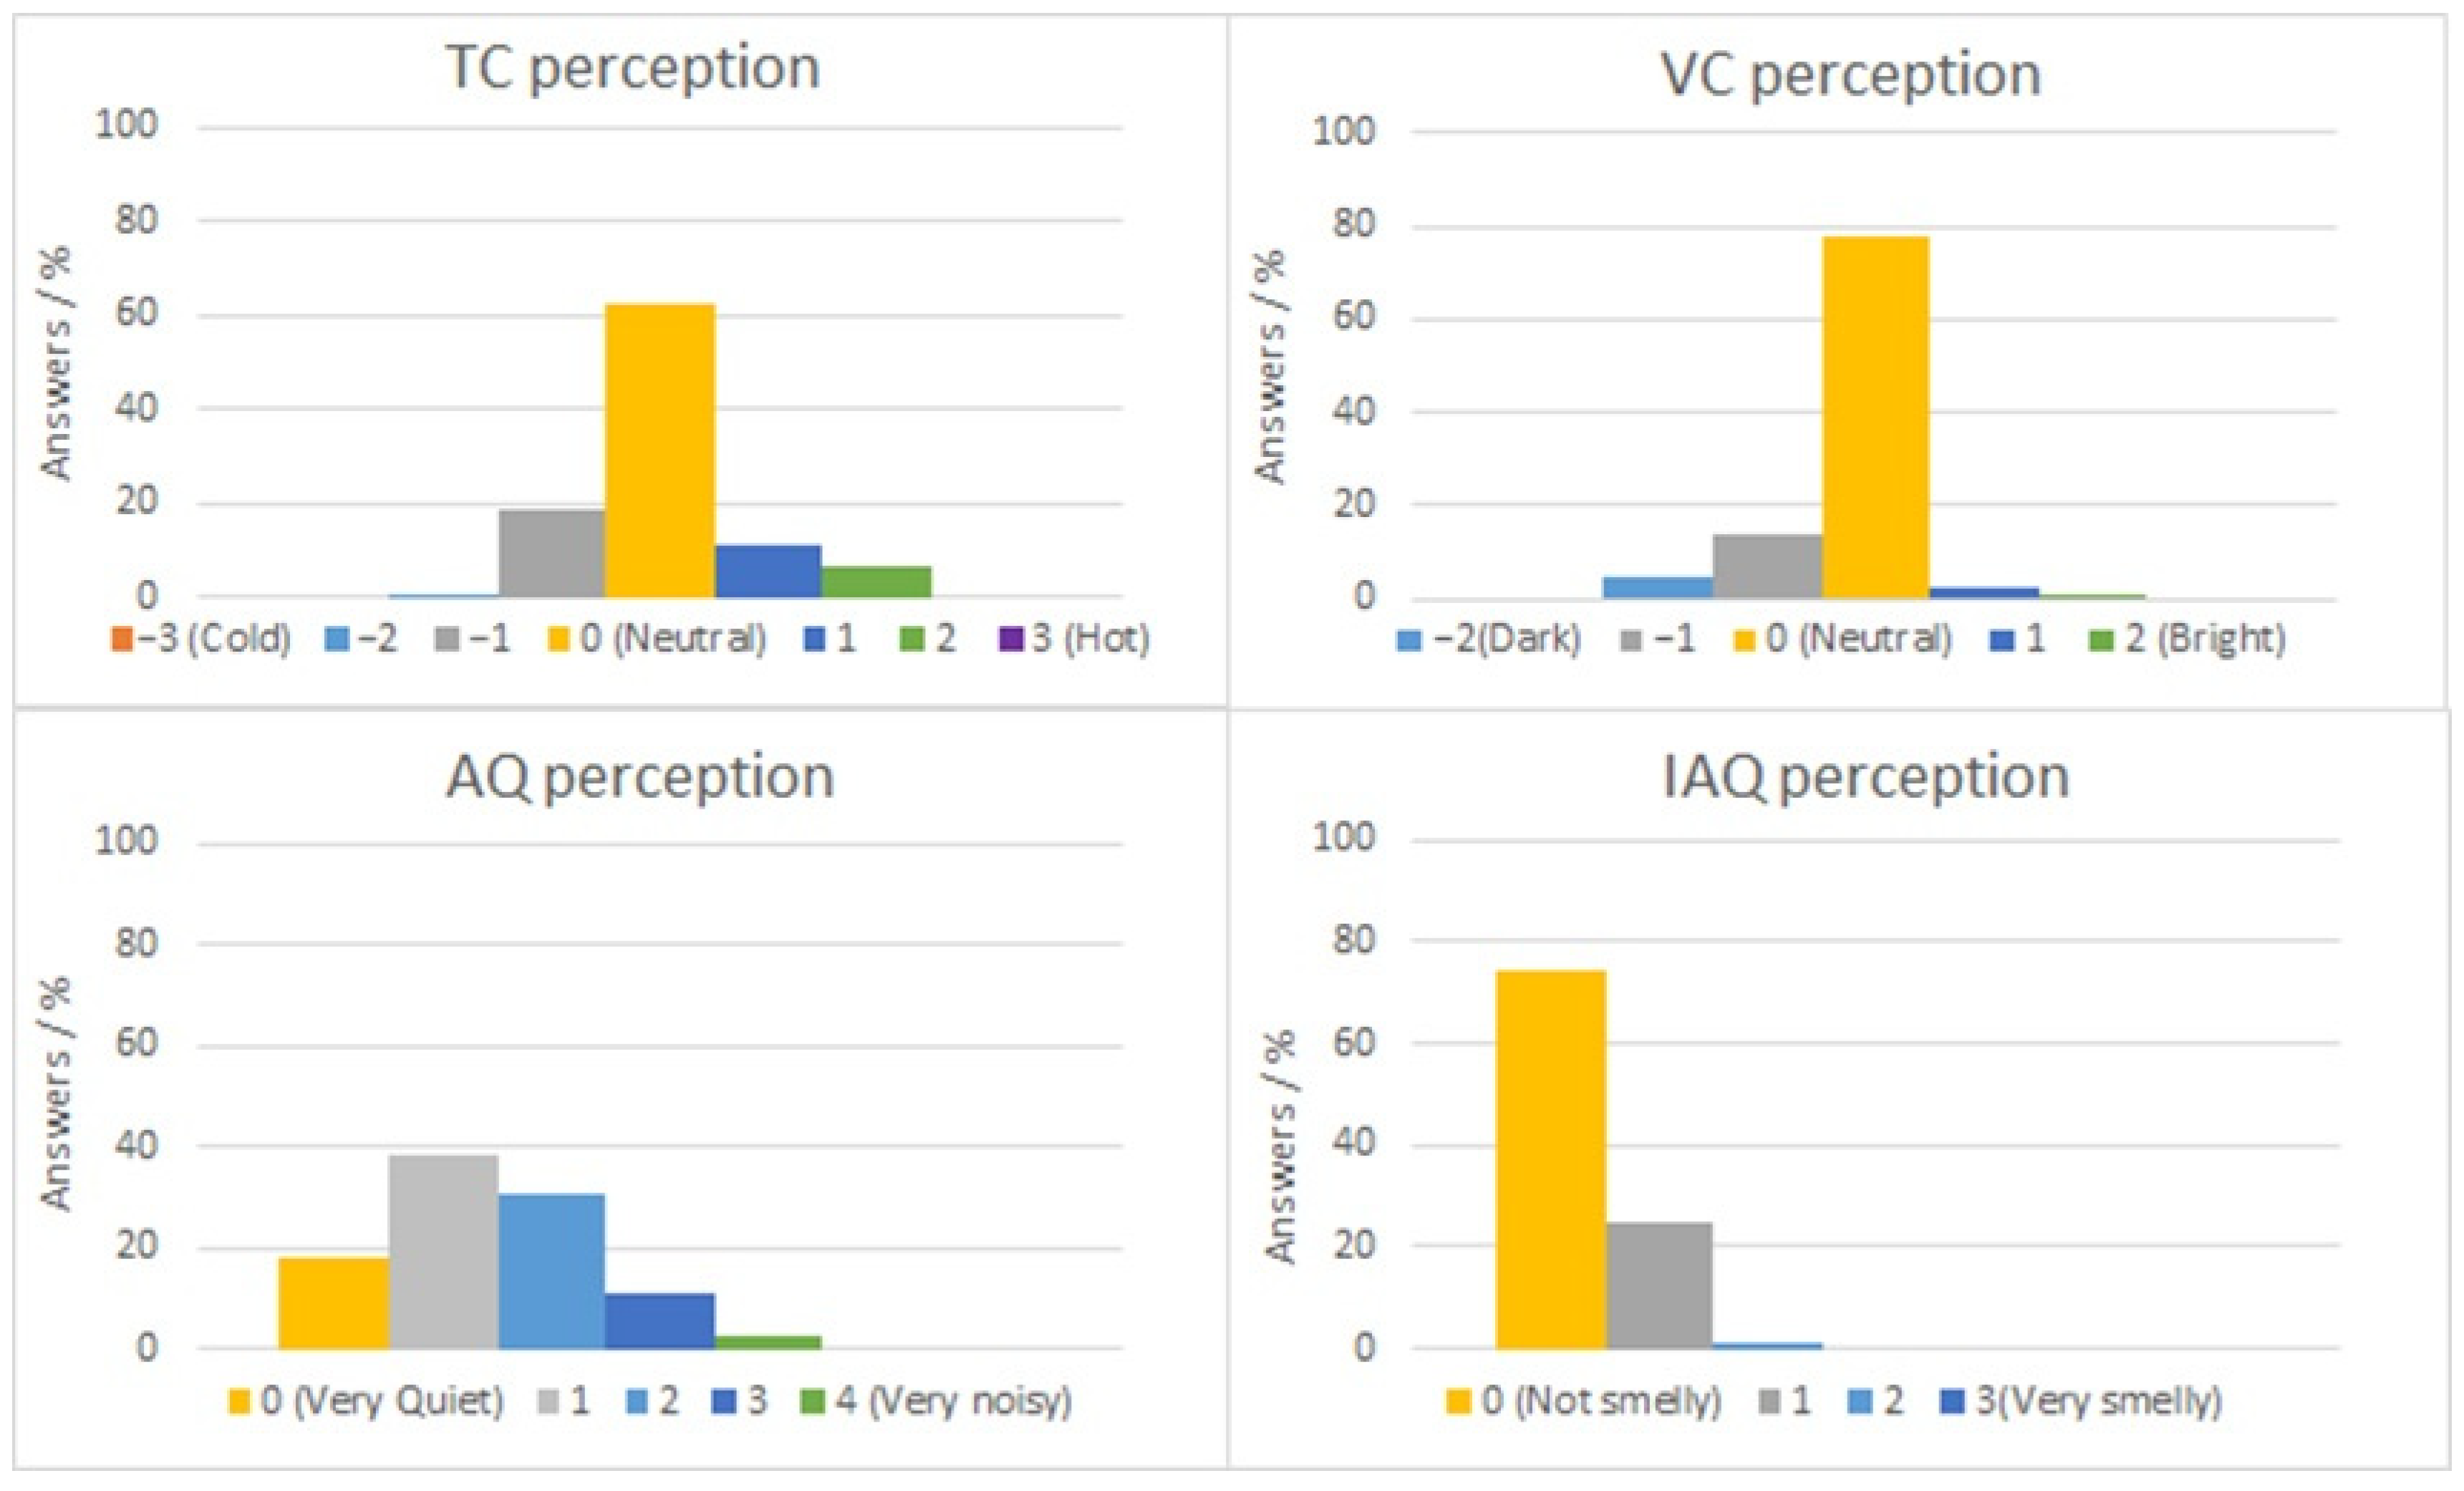
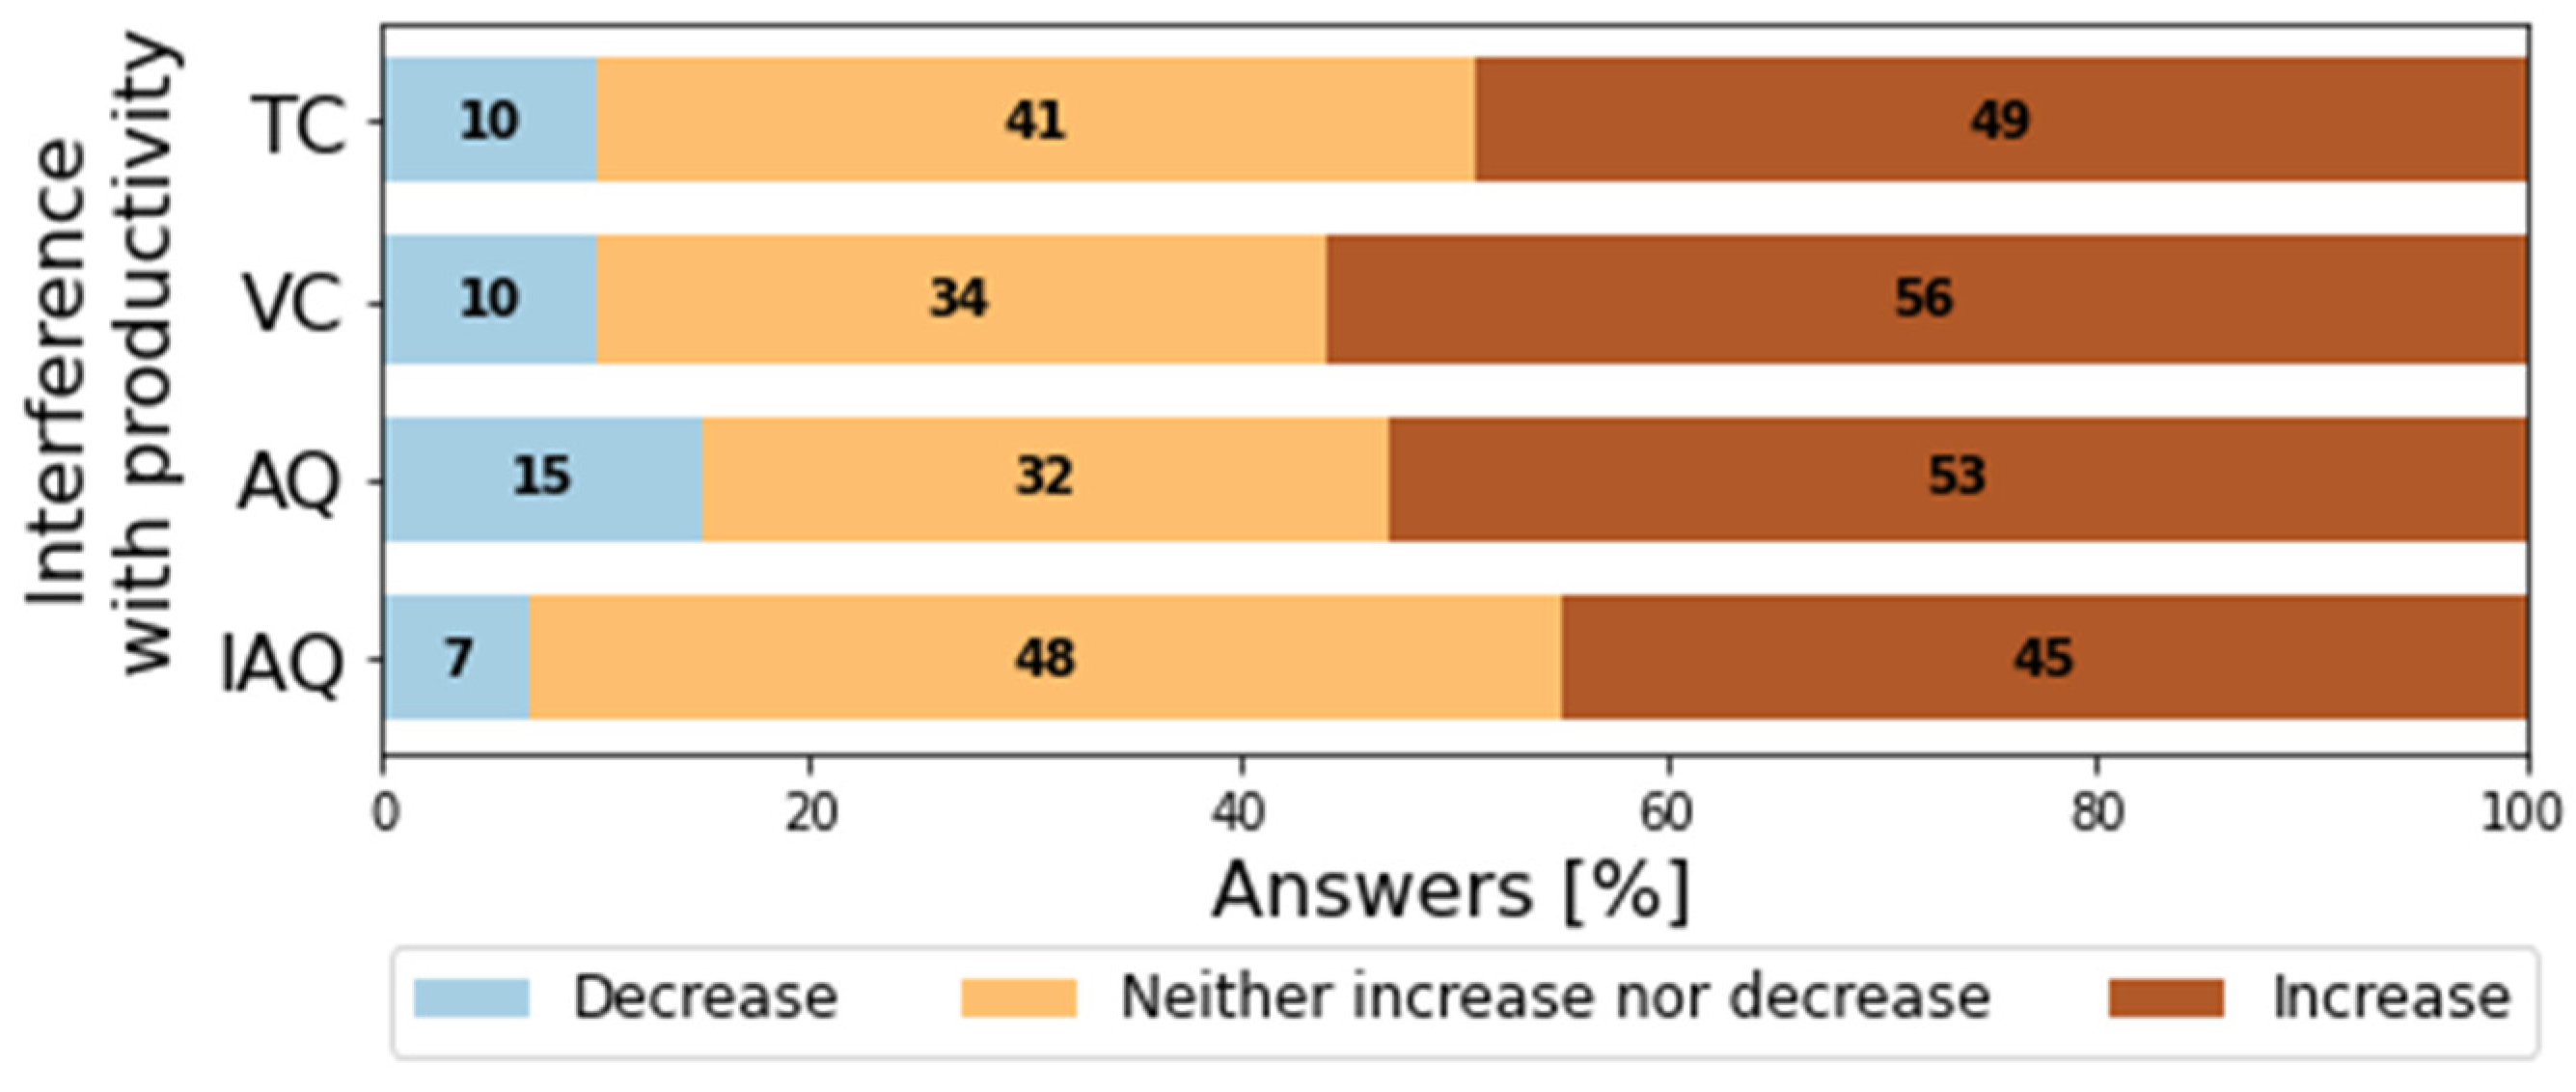
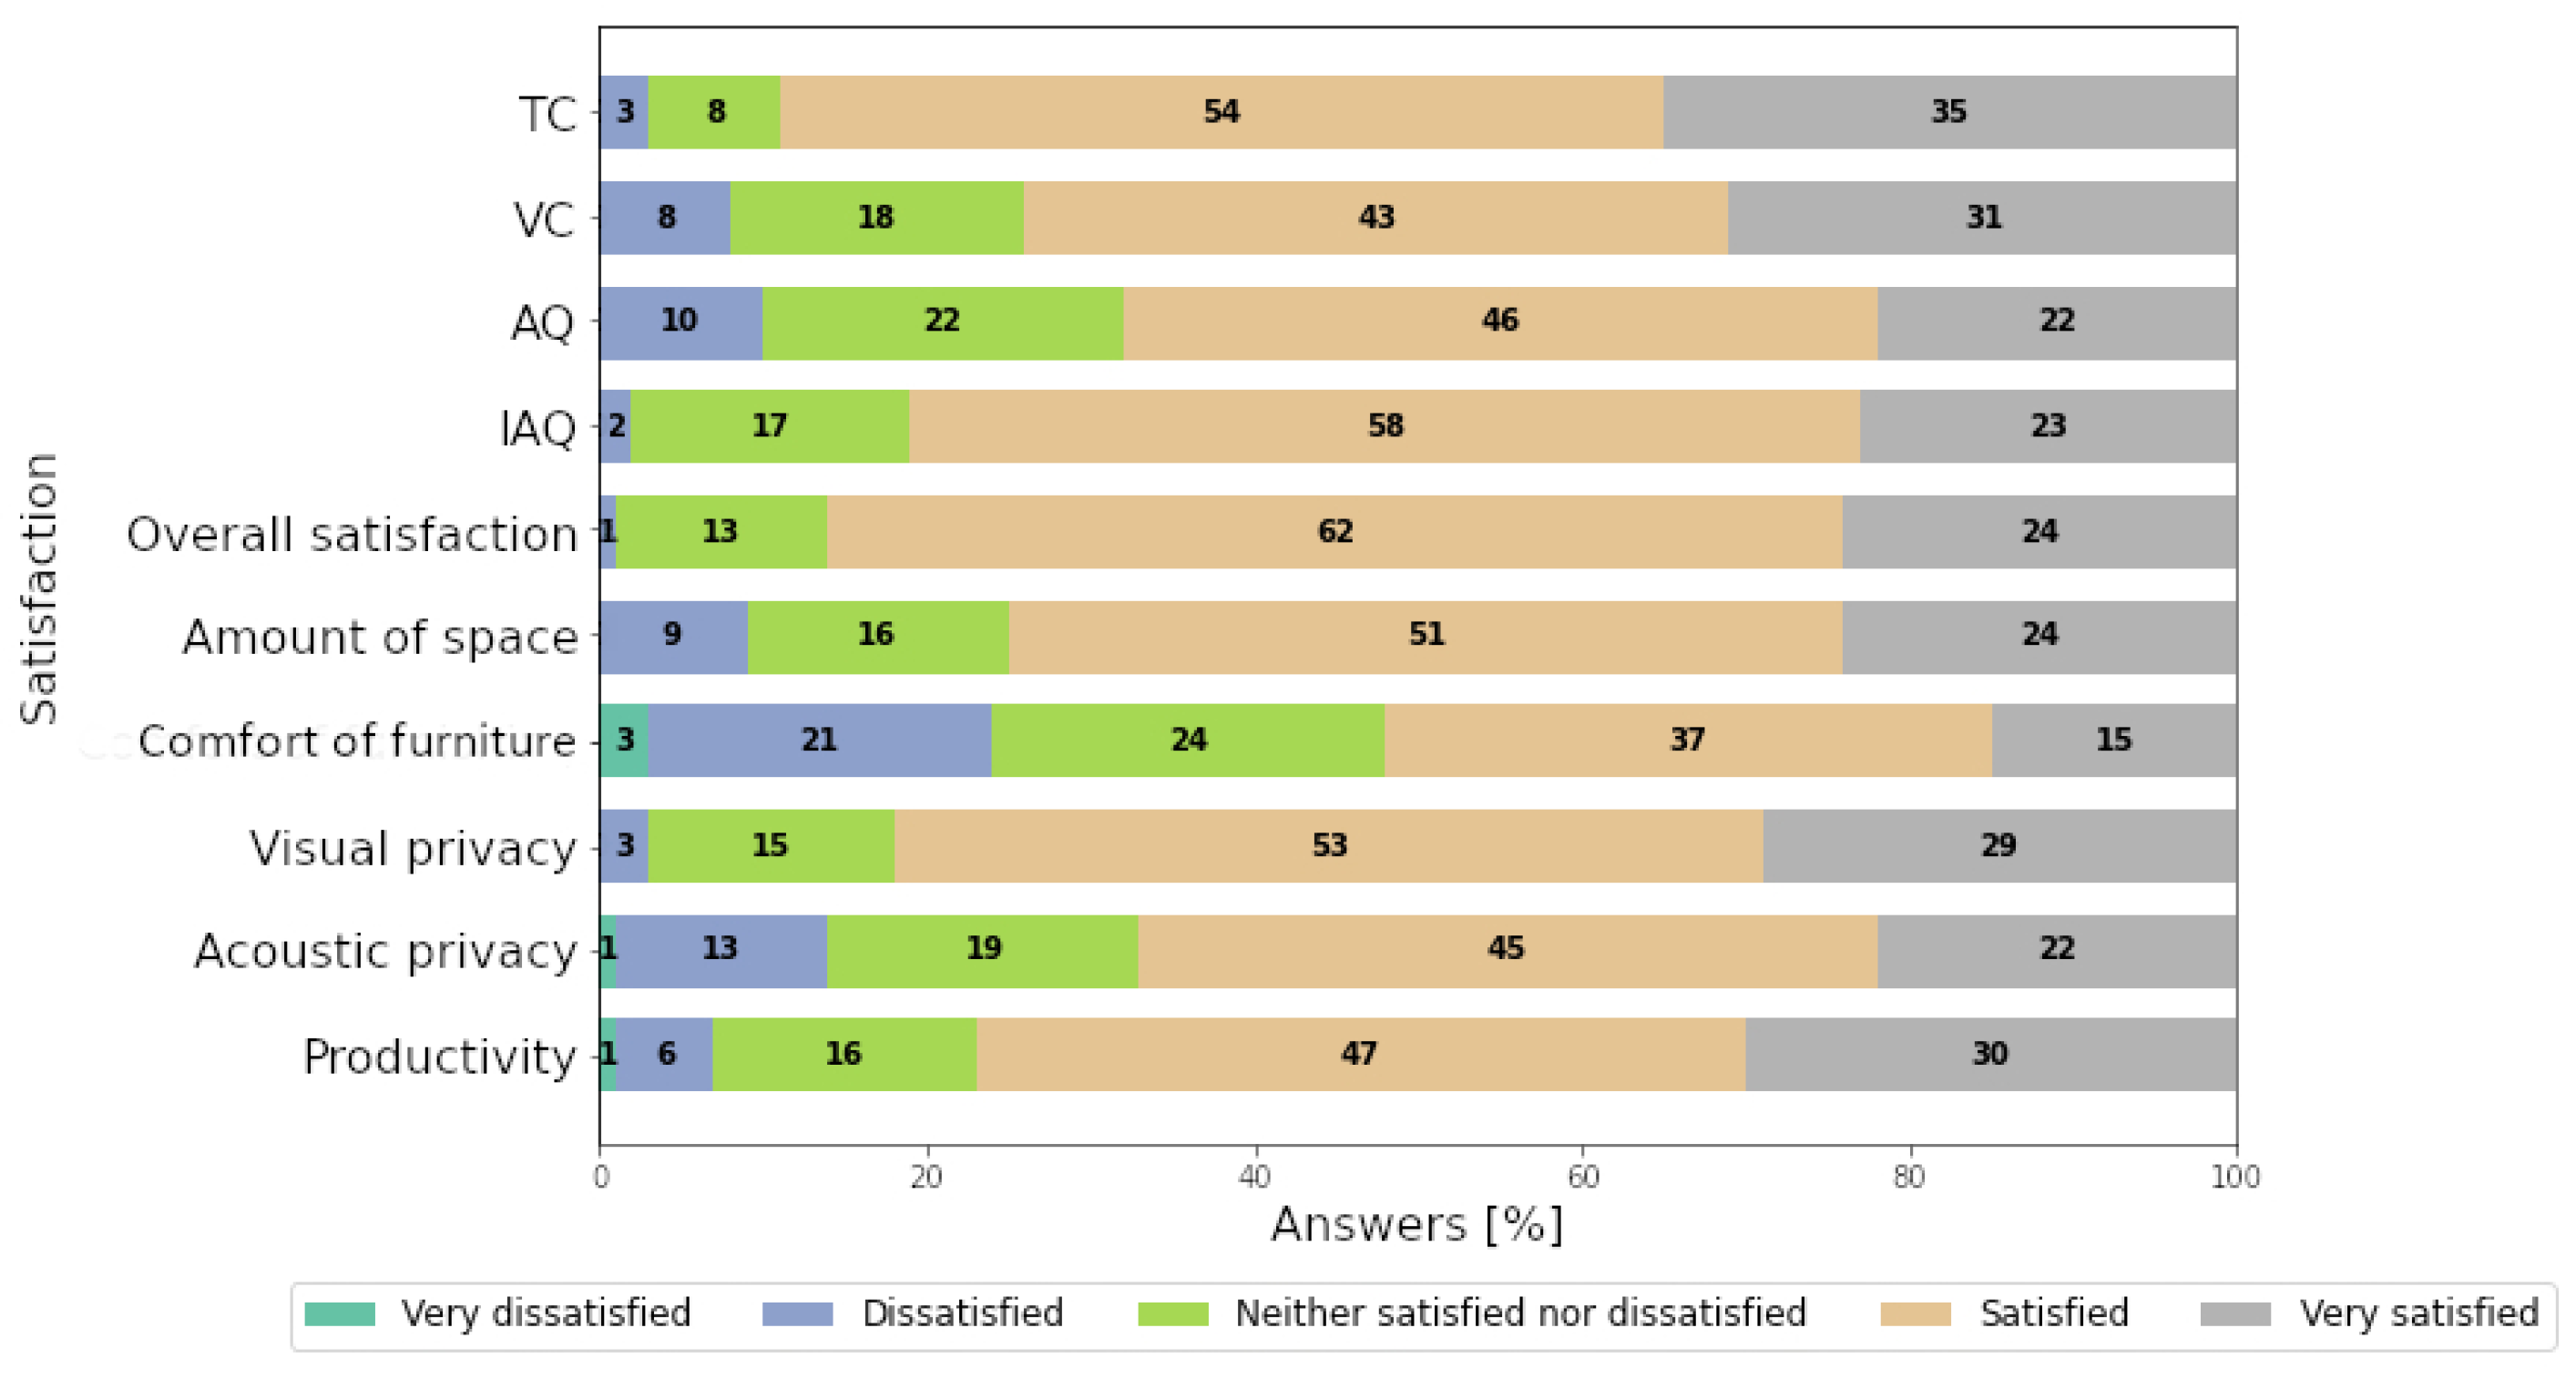
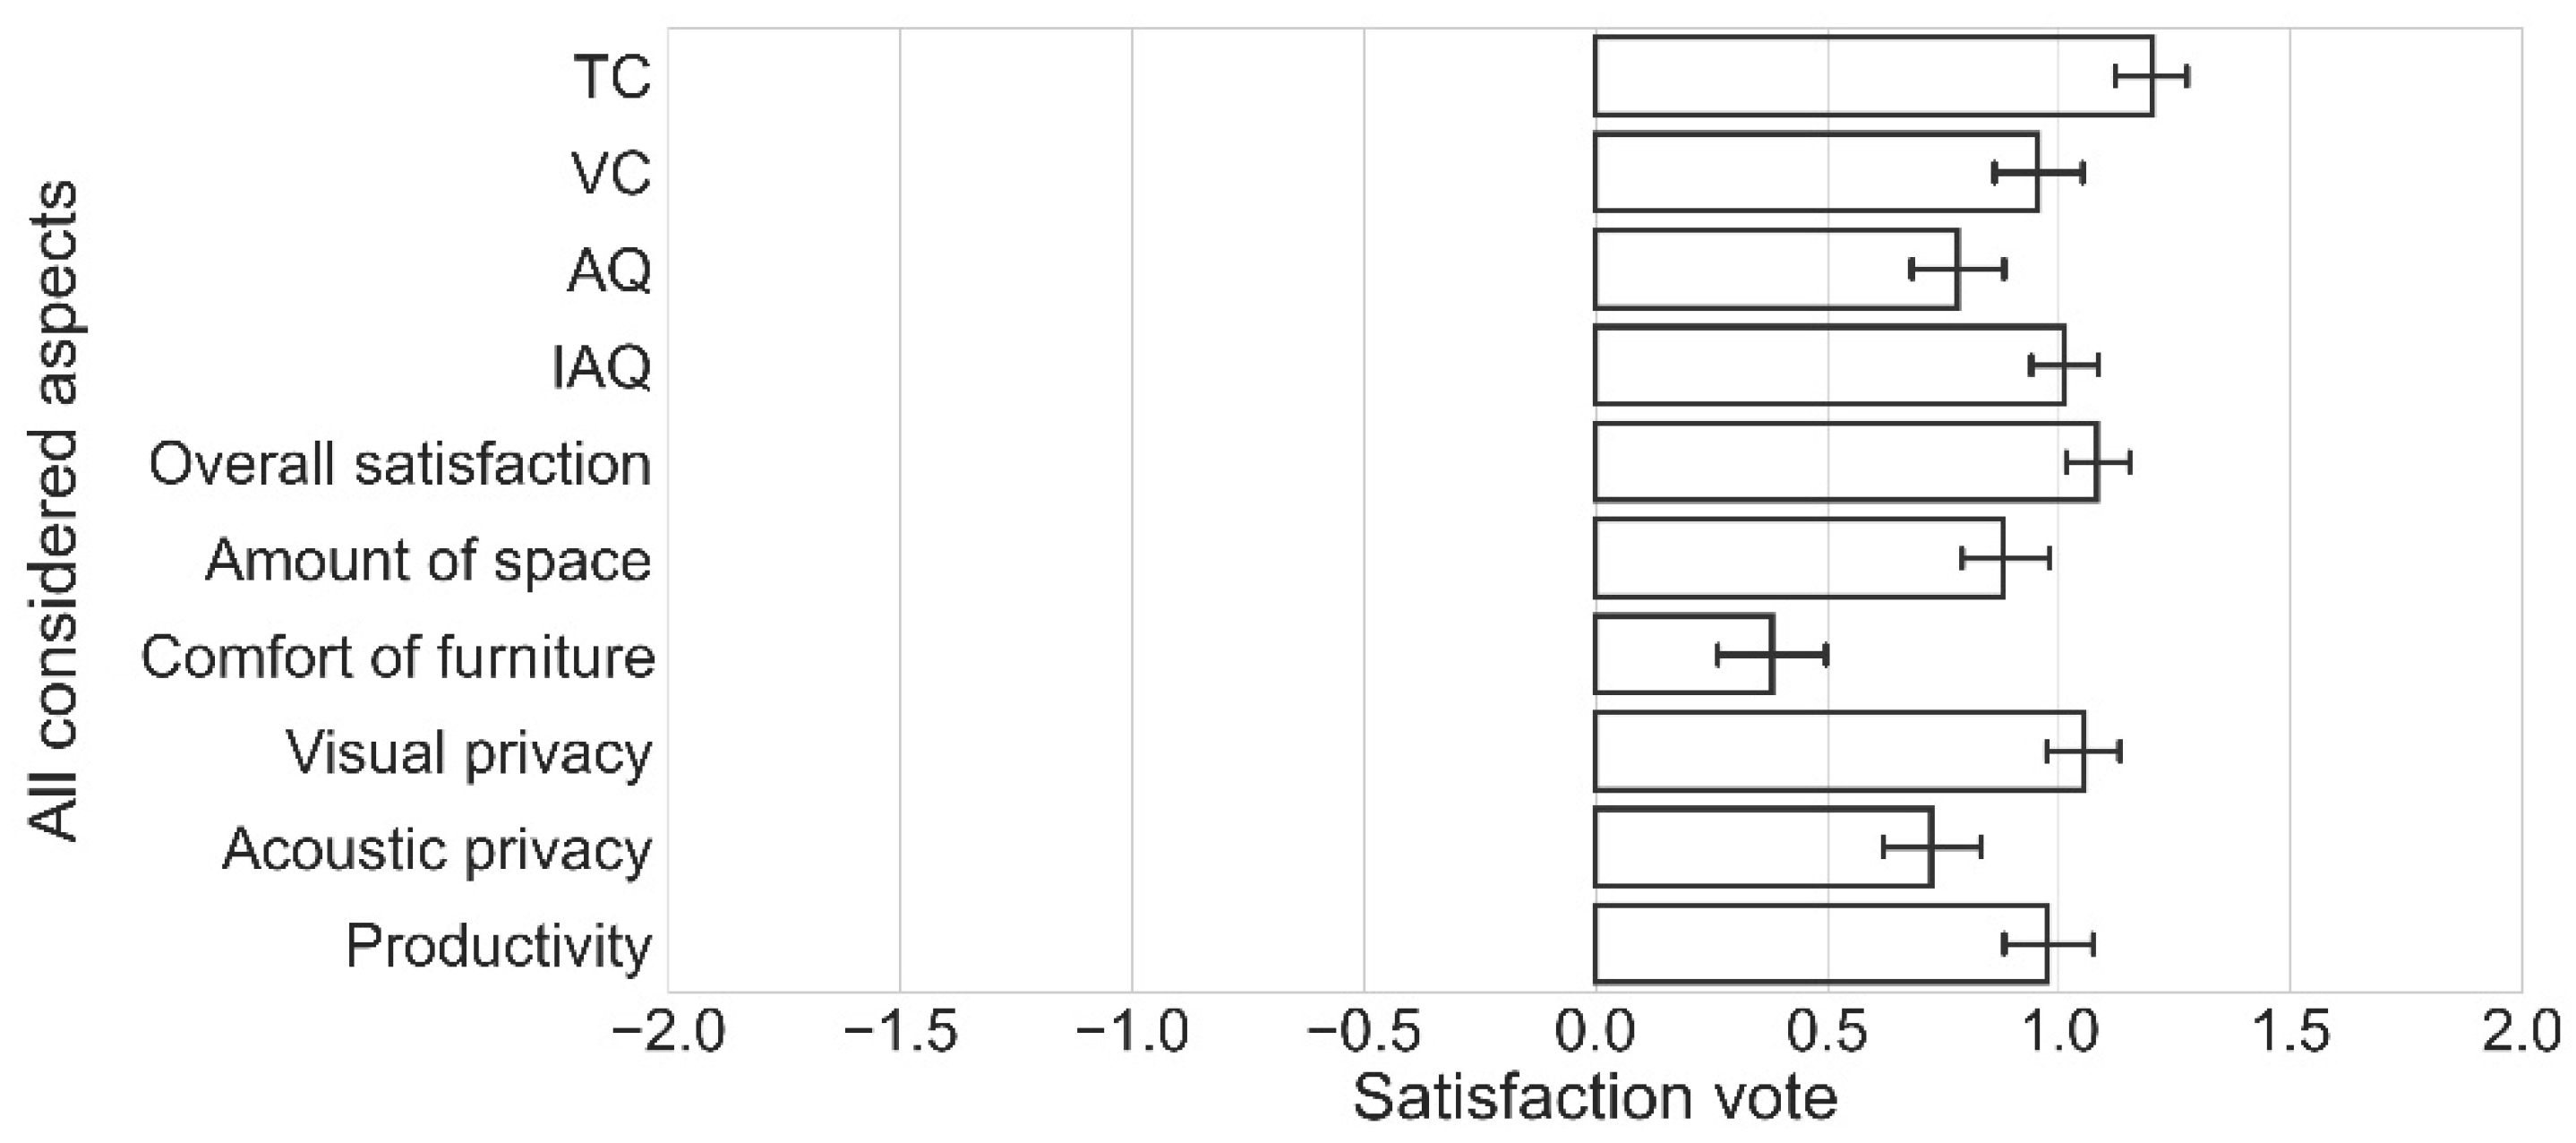
3.1. Goal 1—Descriptive Approach. Question 1: How Do Home Workers Feel the IEQ during Working Activities at Home? Question 2: Are They Satisfied about Their Productivity?
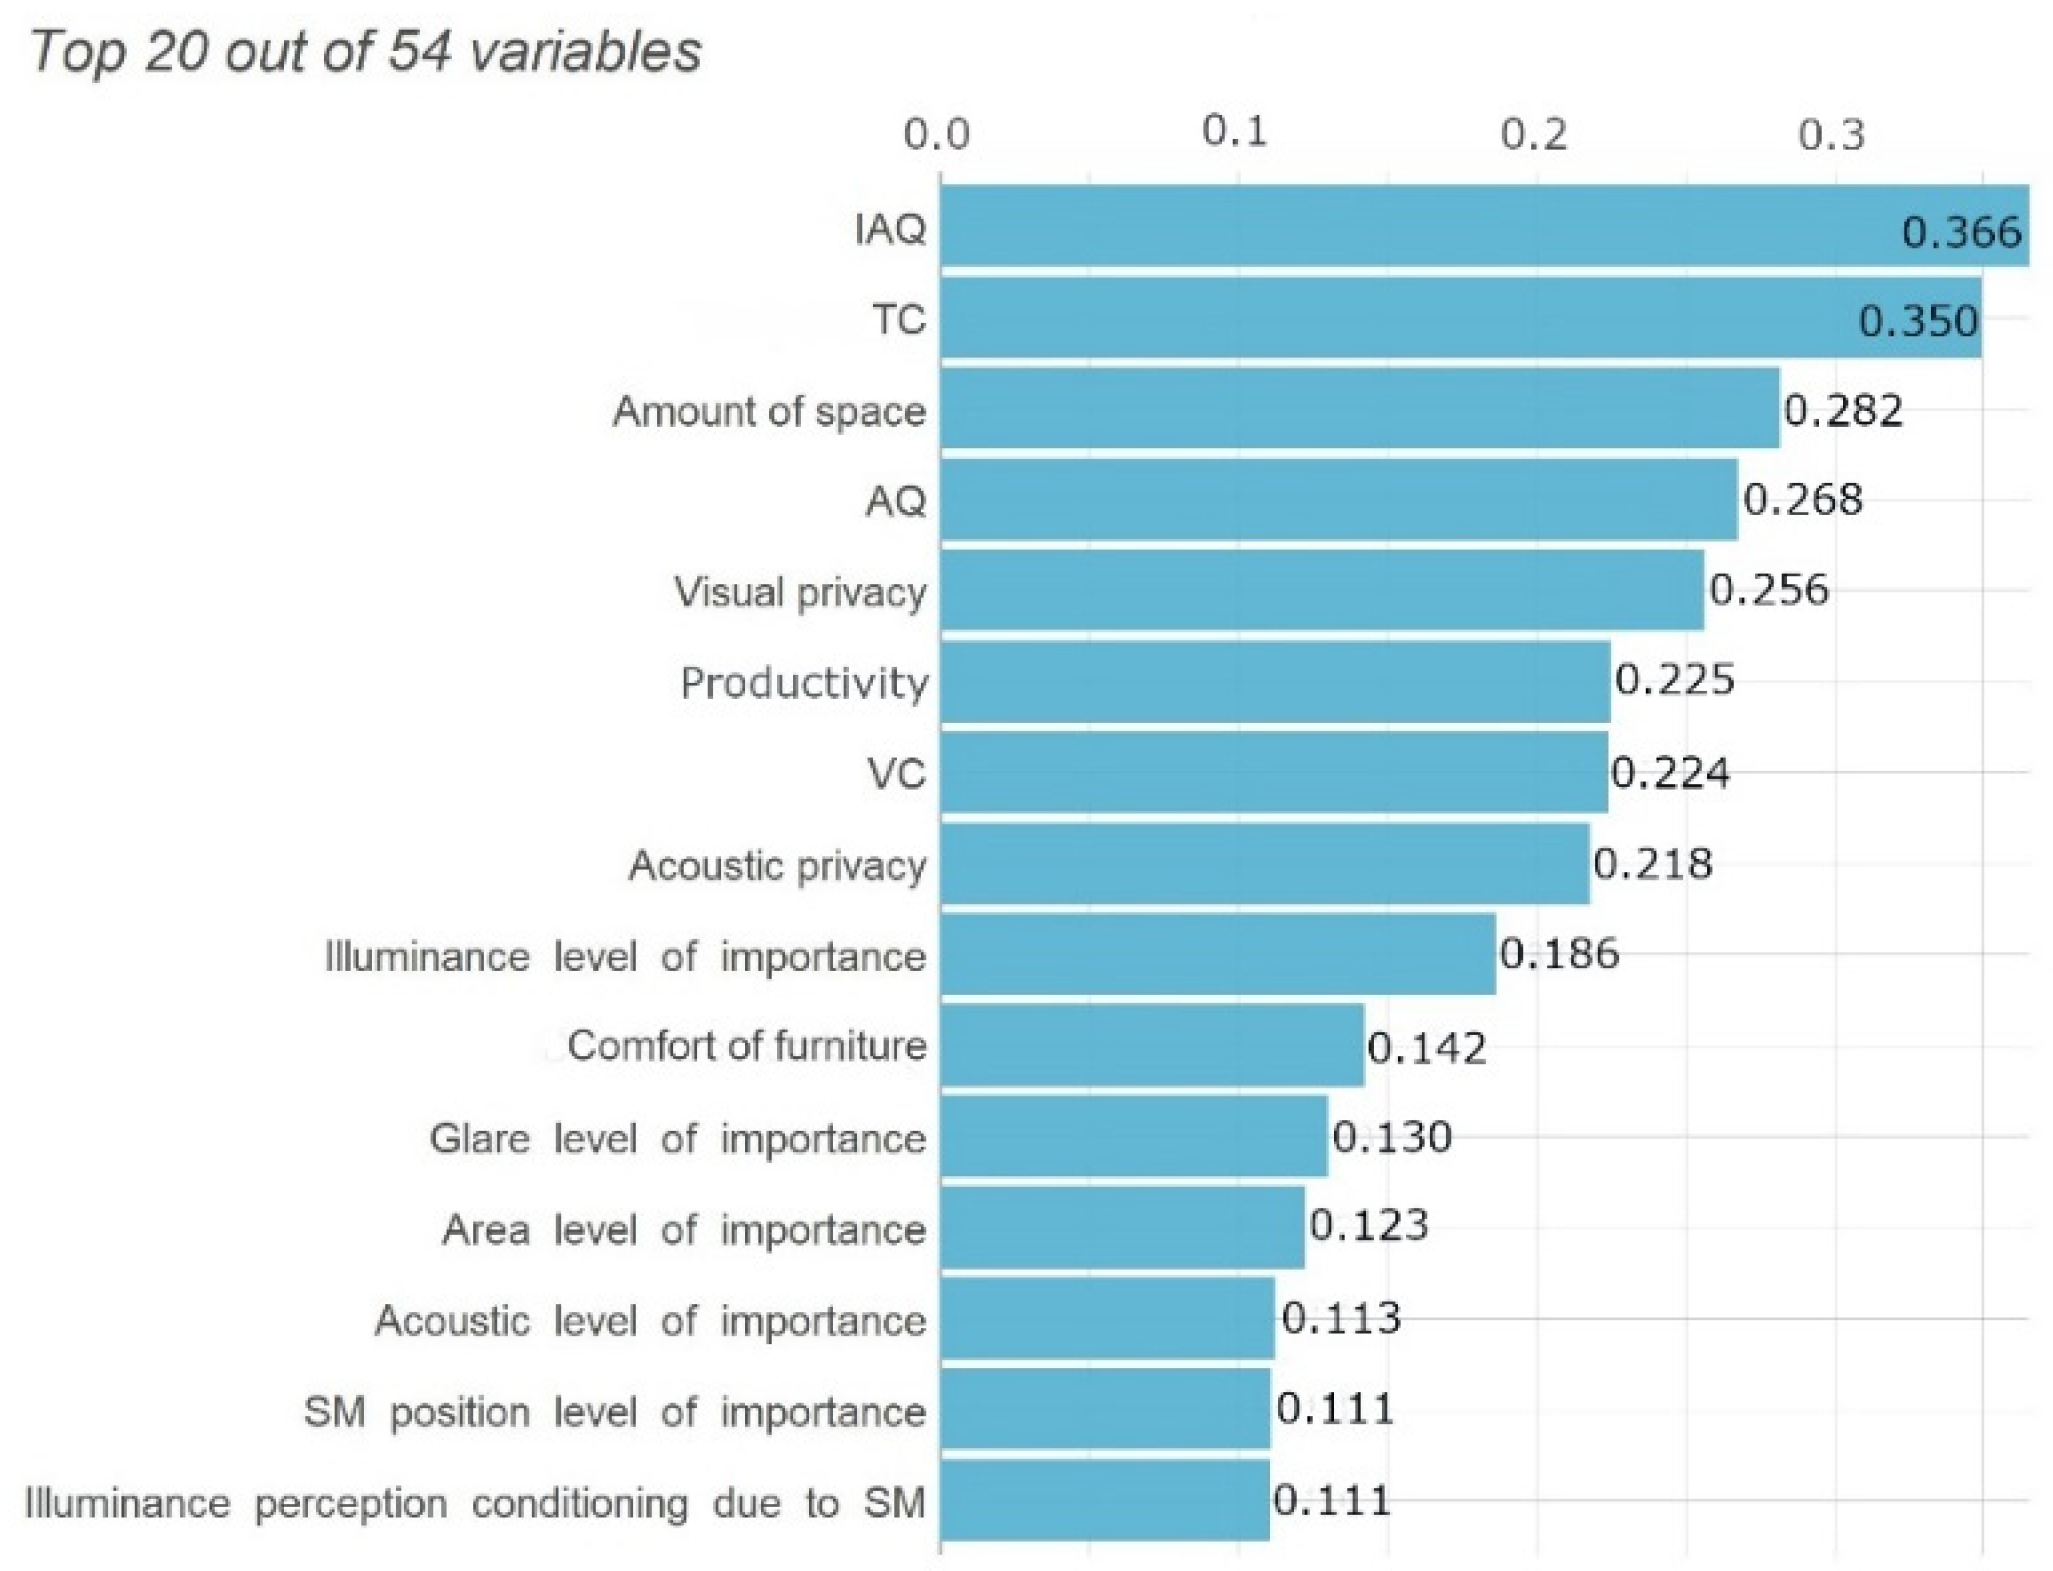
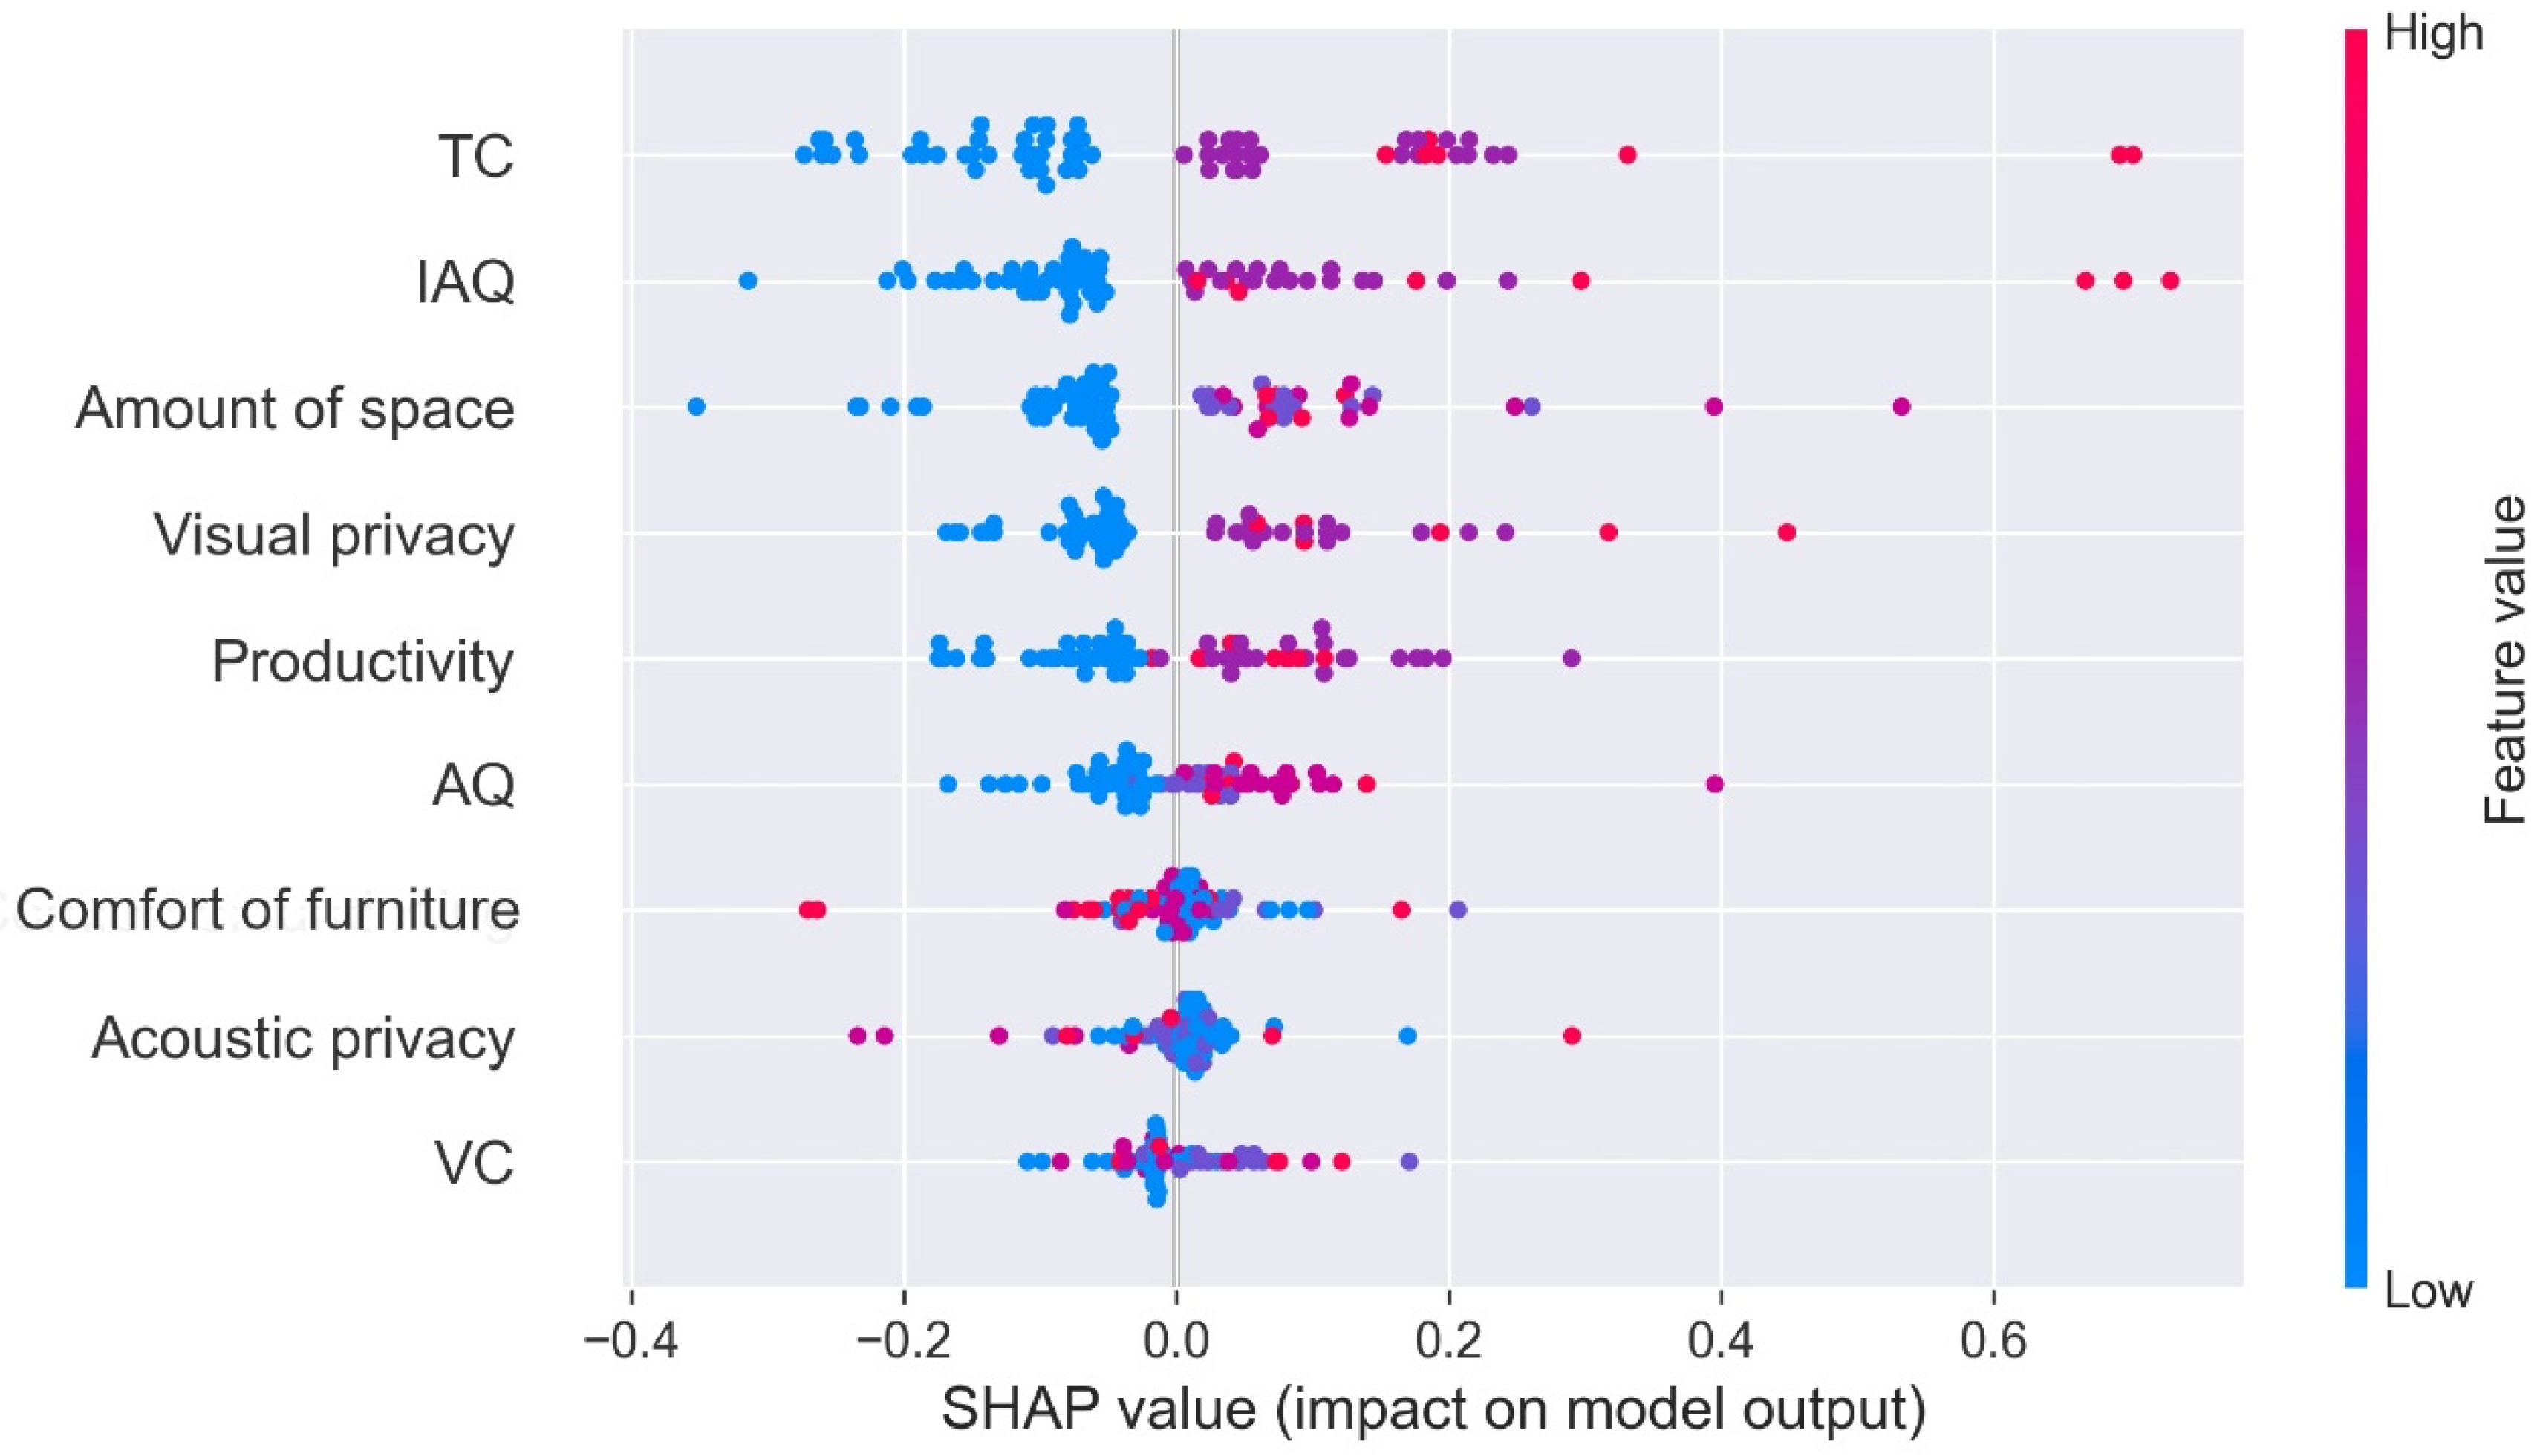
3.2. Goal 2—Predictive Model. Question 3: What Are the Most Suitable Algorithms and Influential Features to Predict Workers’ Overall Satisfaction?
- Extra Trees classifier, which is used to estimate the importance of features [60];
- For LSV, GBC and XGB, a recursive feature elimination procedure was performed to identify the number (n) of features useful for the best predictive value and the n most important features, except for XGB, for which the n most important features were selected considering the built-in feature importance functionality [61];
- For KNN and SVM, a permutation feature importance technique was performed [62] due to the intrinsic nature of these two models that do not support native feature importance scores;
3.3. Goal 3—Sentiment Analysis. Question 4: What Impact Does WFH Have on Workers’ Satisfaction?
- 43% of the sentences expressed negative opinions about WFH because they were not prepared for it due to lack of proper equipment, internet connection, seats and furniture.
- 14% complain about the presence of school-age children due to the closure of schools and distance learning.
- 17% express a negative judgement due to the emergency condition (other roommates in WFH or lack of possibility to go out, etc.).
- 26% express a negative judgement due to the reasons other than those mentioned in the three previous categories.
4. Conclusions
5. Future Works
Author Contributions
Funding
Institutional Review Board Statement
Informed Consent Statement
Data Availability Statement
Conflicts of Interest
Appendix A
| ID | Feature Label | Description | Question | Possible Answers |
| 0 | Age_range | Range of age | Please indicate your range of age | 18–25 26–35 36–45 46–55 56–65 66 or more |
| 1 | Gender | Gender | Please indicate your gender | Male Female I prefer not to answer |
| 2 | Degree | School education level | Please indicate your educational qualification | Primary school diploma Secondary school diploma Graduate Degree (or higher) |
| 3 | Occupation | Current occupation | What is your current occupation? | Public body employee Employee private company Self-employed Dealer Teacher Researcher/University Professor Other (please specify) |
| 4 | Time_in_SW | How long the user has been in WFH | How long have you been in WFH? | From 1 to 2 weeks From 2 weeks to 1 month More than 1 month |
| 5 | Position | Position in WFH (Sitting/Standing/Other) | How do you perform your WFH? | Mainly seated Mainly standing Other (to specify) |
| 6 | How many | Number of people with whom the environment is shared | How many people share the residential unit during your WFH? | Open answer |
| 7 | Children_boolean | Presence/absence of children | Do the persons counted include children? | Yes No |
| 8 | Children_age_range | Range of age of the children | How old are the children? | Less than 6 years old From 6 to 12 years old More than 12 years old |
| 9 | Bld_Type | Type of residential unit | In which type of residential unit are you working? | Detached house Terraced house Flat Other (please specify) |
| 10 | Bld_y | Year of construction of the house | Year of construction of the house | Before 1976 Between 1976 and 1991 Between 1992 and 2000 Between 2000 and 2005 After 2005 I don’t know |
| 11 | Bld_ref_boolean | Renovation of the residential unit in the last 10 years (Yes/No) | Has the residential unit in which you live been renovated in the last 10 years? | Yes No I don’t know |
| 12 | Bld_ref_type | Type of renovation intervention performed | What type of renovation intervention has been performed? | Windows substitution External insulation Counter walls Other (please specify) |
| 13 | Env_SM | Room where the WFH has been performed | Identify the room where you perform your smart working activity | Kitchen Living room Bedroom Study room Other (please specify) |
| 14 | Env_area_range | Area of the room | What is the plan size of the identified environment? (if you are not sure, it is suggested to measure the length and width of the room and multiply them to return the correct value) | Less than 10 m² Between 10 and 15 m² Between 15 and 20 m² Between 20 and 25 m² More than 25 m² |
| 15 | Env_how_many_hours | Hours spent in the room for WFH | How many hours a day do you usually use this room for WFH? | Less than 6 h Between 6 and 9 h More than 9 h |
| 16 | Therm_usability | Presence and ease of use of thermostat | Please indicate the possible presence and ease of use of the following devices in the residential unit (thermostat) | Easy to use Difficult to use Not present I don’t know |
| 17 | Thermostatic valves_usability | Presence and ease of use of thermostatic valves | Please indicate the possible presence and ease of use of the following devices in the residential unit (thermostatic valves) | Easy to use Difficult to use Not present I don’t know |
| 18 | Aut_light_usability | Presence and ease of use of lighting automatic control system | Please indicate the possible presence and ease of use of the following devices in the residential unit (lighting automatic control system) | Easy to use Difficult to use Not present I don’t know |
| 19 | Air_change_system_usability | Presence and ease of use of ventilation automatic control system | Please indicate the possible presence and ease of use of the following devices in the residential unit (ventilation automatic control system) | Easy to use Difficult to use Not present I don’t know |
| 20 | Windows_open_range_time | Time with opened windows | Identify how long per day, overall, you leave the windows open | Less than 10 min Between 10 and 30 min Between 30 and 60 min More than 60 min |
| 21 | Env_position_occupied | Position occupied in the room | In relation to the identified environment, what is your usual position? | Near the window or French window (less than 2 m) Far from the window or French window (more than 2 m) |
| 22 | Env_windows_type | Window type | In relation to the identified environment, what kind of window is present? | Single panel window Two or more panels window Single panel French window Two or more panels French window |
| 23 | Env_windows_esposition | Window exposure | What is the window exposure? | North North-East East South-East South South-West West |
| 24 | Visual_privacy_adp_solution | Adapted solution to ensure visual privacy while working | Which solution do you use to ensure the level of visual privacy while working? | Use of the windows awnings Close of the roller shutter No solutions Other |
| 25 | Env_how_many_time_today | Time spent today in the considered environment | How much time have you already spent today in the considered environment? | Less than 1 h Between 1 and 3 h More than 3 h |
| 26 | TC | Thermal Comfort: temperature satisfaction | Are you satisfied with the temperature of the environment? | Very dissatisfied Dissatisfied Neither satisfied nor dissatisfied Satisfied Very satisfied |
| 27 | T_pref | Thermal preference | What would you like the thermal environment to be like? | Cooler No change Warm |
| 28 | T_perc | Thermal perception | How do you perceive the thermal environment? | Cold Cool Slightly cool Neutral Slightly warm Warm Hot |
| 29 | Thermal_discomfort_source | If you generally perceive a discomfort condition, specify which is the main source (you can also choose several options) | What would you like the thermal environment to be like? | Air movements (head, neck, ankles) Temperature too low Temperature too high Air too dry Air too humid Surrounding surfaces too cold or hot Inability to set up control systems properly Inability to adapt clothing to changes in room temperature No discomfort conditions Other (please specify) |
| 30 | TC_interference_with_SM | Interference of thermal comfort with the ability to perform working activity | How does the thermal comfort of the environment affect your ability to work? | Improves it It is indifferent It gets worse |
| 31 | VC | Visual comfort satisfaction | Are you satisfied with the brightness of the environment where you perform WFH? | Very dissatisfied Dissatisfied Neither satisfied nor dissatisfied Satisfied Very satisfied |
| 32 | V_pref | Visual preference | What would you like the environment brightness to be like? | More dark No change More light |
| 33 | V_perc | Visual_perception | How do you perceive the light of the environment? | Dark Slightly dark Neutral Slightly bright Bright |
| 34 | Visual_discomfort_source | Visual discomfort source during WFH | If you experience discomfort during the day, please specify the main reason (you can choose more than one option). | Too much daylight Little daylight Too much artificial light Little artificial light Glare No discomfort conditions |
| 35 | Artifical_lighting_use | Use of artificial lighting during WFH | Do you use artificial lighting in WFH? | In the morning In the afternoon In the evening Never |
| 36 | Visual_interference_with_SM | Interference of visual comfort with the ability to perform working activity | How does the visual comfort of the environment affect your ability to work? | Interfere Neutral Enhance |
| 37 | AQ | Acoustic Quality satisfaction | Are you satisfied with the acoustic quality of the environment? | Very dissatisfied Dissatisfied Neither satisfied nor dissatisfied Satisfied Very satisfied |
| 38 | A_vote | How do you rate the acoustic quality of the environment in which you perform WFH? | Very quiet Quiet Slightly noisy Noisy Very noisy | |
| 39 | A_pref | Acoustic preference | How would you like to improve the acoustic quality of the environment in which you perform WFH? | No change Slightly quieter Quieter Much quieter |
| 40 | Acoustic_interference_with_SM | Interference of acoustic quality with the ability to perform working activity | How does the acoustic comfort of the environment affect your ability to perform your work? | Interfere Neutral Enhance |
| 41 | Acoustic_privacy_setting | Solution adopted to ensure the acoustic privacy | What solution do you use to ensure the level of acoustic privacy while working? | Using headphones or similar Closing the door No solution Other (please specify) |
| 42 | IAQ | IAQ satisfaction | Are you satisfied with the indoor air quality? | Very dissatisfied Dissatisfied Neither satisfied nor dissatisfied Satisfied Very satisfied |
| 43 | Odour_perc | How do you perceive the smell of the environment? | Not smelly Slightly smelly Smelly Very smelly | |
| 44 | Odour_source | In case of bad air, define the source of odour | If you perceive a problem with bad air odour, choose which of the following options contributes the most | Kitchen Perfume Products used for cleaning Bad odours generated by instruments (ex. Printer) Bad odours produced by pets No odour problem Other (please specify) |
| 45 | IAQ_interference_with_SM | Interference of IAQ with the ability to perform working activity | How does the air quality level of the environment affect the ability to perform WFH? | Interfere Neutral Enhance |
| 46 | Overall_satisfaction | Overall comfort satisfaction | In general, are you satisfied with the overall comfort level of the environment? | Very dissatisfied Dissatisfied Neither satisfied nor dissatisfied Satisfied Very satisfied |
| 47 | Amount_of_space | Satisfaction with the amount of available space | In relation to the environment used for WFH, are you satisfied with the following aspects? (amount of space) | Very dissatisfied Dissatisfied Neither satisfied nor dissatisfied Satisfied Very satisfied |
| 48 | Comfort_of_furnishing | Satisfaction with the furniture and complements (desk, table, chair) | In relation to the environment used for WFH, are you satisfied with the comfort of furniture? | Very dissatisfied Dissatisfied Neither satisfied nor dissatisfied Satisfied Very satisfied |
| 49 | Visual_privacy | Satisfaction with the visual privacy | In relation to the environment used for WFH, are you satisfied with the following aspects? (Visual privacy) | Very dissatisfied Dissatisfied Neither satisfied nor dissatisfied Satisfied Very satisfied |
| 50 | Acoustic_privacy | Satisfaction with the acoustic privacy | In relation to the environment used for WFH, are you satisfied with the following aspects? (Acoustic privacy) | Very dissatisfied Dissatisfied Neither satisfied nor dissatisfied Satisfied Very satisfied |
| 51 | Productivity | Satisfaction with the work productivity | In relation to the environment used for WFH, are you satisfied with the following aspects? (Productivity) | Very dissatisfied Dissatisfied Neither satisfied nor dissatisfied Satisfied Very satisfied |
| 52 | Area_level of importance | Importance given to the amount of space in defining the overall satisfaction | In defining how satisfied you are with the environment, what importance do you attach to the following aspects? (Available space) | Not at all Not very important Indifferent Very important Extremely important |
| 53 | Furniture_level of importance | Importance given to the comfort of furniture in defining the overall satisfaction | In defining how satisfied you are with the environment, what importance do you attach to the following aspects? (furniture and complements) | Not at all Not very important Indifferent Very important Extremely important |
| 54 | SM_position_level of importance | Importance given to the location of the workstation in defining the overall satisfaction | In defining how satisfied you are with the environment, what importance do you attach to the following aspects? (Location of the workstation) | Not at all Not very important Indifferent Very important Extremely important |
| 55 | Visual_privacy_level of importance | Importance given to the visual privacy in defining the overall satisfaction | In defining how satisfied you are with the environment, what importance do you attach to the following aspects? (Visual privacy) | Not at all Not very important Indifferent Very important Extremely important |
| 56 | Acoustic_privacy_level of importance | Importance given to the acoustic privacy in defining the overall satisfaction | In defining how satisfied you are with the environment, what importance do you attach to the following aspects? (Acoustic privacy) | Not at all Not very important Indifferent Very important Extremely important |
| 57 | Thermal_comf_level of importance | Importance given to the thermal comfort in defining the overall satisfaction | In defining how satisfied you are with the environment, what importance do you attach to the following aspects? (Thermal comfort) | Not at all Not very important Indifferent Very important Extremely important |
| 58 | Illuminance_level of importance | Importance given to the illuminance level in defining the overall satisfaction | In defining how satisfied you are with the environment, what importance do you attach to the following aspects? (Illuminance) | Not at all Not very important Indifferent Very important Extremely important |
| 59 | Glare_level of importance | Importance given to the glare in defining the overall satisfaction | In defining how satisfied you are with the environment, what importance do you attach to the following aspects? (Glare) | Not at all Not very important Indifferent Very important Extremely important |
| 60 | Acoustic_level of importance | Importance given to the Acoustic Quality in defining the overall satisfaction | In defining how satisfied you are with the environment, what importance do you attach to the following aspects? (Acoustic aspects) | Not at all Not very important Indifferent Very important Extremely important |
| 61 | IAQ_level of importance | Importance given to the IAQ in defining the overall satisfaction | In defining how satisfied you are with the environment, what importance do you attach to the following aspects? (Air quality) | Not at all Not very important Indifferent Very important Extremely important |
| 62 | Note | Additional comments | Please provide any additional comments or aspects useful to describe your experience in WFH | Open answer |
References
- Google Trends—Smart Working, Flexible Working, Agile Working and Working from Home. Available online: https://trends.google.it/trends/explore?date=all&q=smart%20working,flexible%20working,agile%20working,Working%20From%20Home (accessed on 3 December 2021).
- CIPD. HR: Getting Smart about Agile Working, 1st ed.; CIPD: London, UK, 2014; pp. 1–36. Available online: https://www.cipd.co.uk/Images/hr-getting-smart-agile-working_2014_tcm18-14105.pdf (accessed on 3 December 2021).
- Suh, A.; Lee, J. Understanding teleworkers’ technostress and its influence on job satisfaction. Internet Res. 2017, 27, 140–159. [Google Scholar] [CrossRef]
- Charalampous, M.; Grant, C.A.; Tramontano, C.; Michailidis, E. Systematically reviewing remote e-workers’ well-being at work: A multidimensional approach. Eur. J. Work Organ. Psychol. 2019, 28, 51–73. [Google Scholar] [CrossRef]
- Zhang, J. The Dark Side of Virtual Office and Job Satisfaction. Int. J. Bus. Manag. 2016, 11, 40–46. [Google Scholar] [CrossRef]
- Felstead, A.; Henseke, G. Assessing the growth of remote working and its consequences for effort, well-being and work-life balance. New Technol. Work Employ. 2017, 32, 195–212. [Google Scholar] [CrossRef] [Green Version]
- Vega, R.P.; Anderson, A.J.; Kaplan, S.A. A Within-Person Examination of the Effects of Telework. J. Bus. Psychol. 2015, 30, 313–323. [Google Scholar] [CrossRef]
- He, S.Y.; Hu, L. Telecommuting, income, and out-of-home activities. Travel Behav. Soc. 2015, 2, 131–147. [Google Scholar] [CrossRef]
- Palmi, P.; Pichierri, M.; Prete, M.I. From remote to smart working during COVID-19 era, and after. First evidences from Italy. Open Rev. Manag. Bank. Financ. 2020. Available online: https://openreviewmbf.org/2020/08/21/from-remote-to-smart-working-during-the-covid-19-era-and-after-first-evidences-from-italy/ (accessed on 3 December 2021).
- Eurofound. Work–Life Balance and Flexible Working Arrangements in the European Union, 1st ed.; Eurofound: Dublin, Ireland, 2018; pp. 1–18. Available online: https://op.europa.eu/en/publication-detail/-/publication/ade345d1-2e59-11e8-b5fe-01aa75ed71a1/language-en/format-PDF/source-69540668 (accessed on 3 December 2021).
- Salamone, F.; Belussi, L.; Danza, L.; Meroni, I. A survey-based approach used to analyse the indoor satisfaction and productivity level of user in smart working during lock-down due to the COVID-19 pandemic. J. Phys. Conf. Ser. 2021, 2042, 012139. [Google Scholar] [CrossRef]
- Huizenga, C.; Laeser, K.; Arens, E. A web-based occupant satisfaction survey for benchmarking building quality. In Proceedings of the 9th International Conference on Indoor Air Quality and Climate, Monterey, CA, USA, 30 June–5 July 2002; Available online: https://escholarship.org/uc/item/0hs9x6gm (accessed on 3 December 2021).
- Kwon, M.; Remøy, H.; Van den Bogaard, M. Influential design factors on occupant satisfaction with indoor environment in workplaces. Build. Environ. 2019, 157, 356–365. [Google Scholar] [CrossRef]
- Candido, C.; Zhang, J.; Kim, J.; De Dear, R.; Thomas, L.; Strapasson, P.; Joko, C. Impact of workspace layout on occupant satisfaction, perceived health and productivity. In Proceedings of the 9th Windsor Conference: Making Comfort Relevant, Windsor, UK, 7–10 April 2016; pp. 1214–1225. [Google Scholar]
- Graham, A.; Parkinson, L.T.; Schiavon, T. Lessons learned from 20 years of CBE’s Occupant Survey. Build. Cities 2020, 2, 166–184. [Google Scholar] [CrossRef]
- Frontczak, M.; Schiavon, S.; Goins, J.; Arens, E.; Zhang, H.; Wargocki, P. Quantitative relationships between occupant satisfaction and satisfaction aspects of indoor environmental quality and building design. Indoor Air 2012, 22, 119–131. [Google Scholar] [CrossRef] [Green Version]
- Wong, L.T.; Mui, K.W.; Hui, P.S. A multivariate-logistic model for acceptance of indoor environmental quality (IEQ) in offices. Build. Environ. 2008, 43, 1–6. [Google Scholar] [CrossRef]
- Choi, J.H.; Aziz, A.; Loftness, V. Decision support for improving occupant environmental satisfaction in office buildings: The relationship between sub-set of IEQ satisfaction and overall environmental satisfaction. In Proceedings of the 9th International Conference Healthy Buildings, Syracuse, NY, USA, 13–17 September 2009. [Google Scholar]
- Crosbie, T.; Moore, J. Work–life Balance and Working from Home. Soc. Policy Soc. 2004, 3, 223–233. [Google Scholar] [CrossRef] [Green Version]
- Rupietta, K.; Beckmann, M. Working from Home: What is the Effect on Employees’ Effort?, Work. from Home What Is Eff. Employees’ Effort? Schmalenbach Bus. Rev. 2018, 70, 25–55. [Google Scholar] [CrossRef]
- Shareena, P.; Shahid, M. Work from home during COVID-19: Employees perception and experiences. Glob. J. Res. Anal. 2020, 9, 7–10. [Google Scholar] [CrossRef]
- Xiao, Y.; Becerik-Gerber, B.; Lucas, G.; Roll, S.C. Impacts of Working From Home During COVID-19 Pandemic on Physical and Mental Well-Being of Office Workstation Users. J. Occup. Environ. Med. 2021, 63, 181–190. [Google Scholar] [CrossRef] [PubMed]
- Brodeur, A.; Clark, A.E.; Fleche, S.; Powdthavee, N. COVID-19, lockdowns and well-being: Evidence from Google Trends. J. Public Econ. 2021, 193, 104346. [Google Scholar] [CrossRef] [PubMed]
- Pytrends Python Library. Available online: https://pypi.org/project/pytrends/ (accessed on 3 December 2021).
- ISTAT. 15° Censimento della Popolazione e delle Abitazioni 2011. 2011, pp. 2–6. Available online: http://www.istat.it/it/censimento-popolazione/censimento-popolazione-2011 (accessed on 3 December 2021).
- Eurostatat Data: Employed Persons Working from Home as a Percentage of the Total Employment. Available online: https://appsso.eurostat.ec.europa.eu/nui/show.do?query=BOOKMARK_DS-052914_QID_57A748D0_UID_-3F171EB0&layout=TIME,C,X,0;GEO,L,Y,0;SEX,L,Z,0;FREQUENC,L,Z,1;AGE,L,Z,2;WSTATUS,L,Z,3;UNIT,L,Z,4;INDICATORS,C,Z,5;&zSelection=DS-052914WSTATUS,EMP;DS-052914AGE,Y15 (accessed on 3 December 2021).
- Sun, S.; Luo, C.; Chen, J. A review of natural language processing techniques for opinion mining systems. Inf. Fusion. 2017, 36, 10–25. [Google Scholar] [CrossRef]
- International Standards Organisation (ISO), ISO 28802:2012—Ergonomics of the Physical Environment—Assessment of Environments by Means of an Environmental Survey Involving Physical Measurements of the Environment and Subjective Responses of People (ISO 28802:2012), ISO. 2012. Available online: https://www.iso.org/obp/ui/#iso:std:iso:28802:ed-1:v1:en (accessed on 3 December 2021).
- Lee, J.Y.; Stone, E.A.; Wakabayashi, H.; Tochihara, Y. Issues in combining the categorical and visual analog scale for the assessment of perceived thermal sensation: Methodological and conceptual considerations. Appl. Ergon. 2010, 41, 282–290. [Google Scholar] [CrossRef]
- Thermal Environmental Conditions for Human Occupancy, ASHRAE Stand. 2013. Available online: https://www.ashrae.org/technical-resources/bookstore/standard-55-thermal-environmental-conditions-for-human-occupancy (accessed on 3 December 2021).
- Salata, F.; Golasi, I.; Treiani, N.; PLoS, R.; de Lieto Vollaro, A. On the outdoor thermal perception and comfort of a Mediterranean subject across other Koppen-Geiger’s climate zones. Environ. Res. 2018, 167, 115–128. [Google Scholar] [CrossRef] [PubMed]
- Weather Time Series—April 2020—Italian Air Force Technical Reports. Available online: www.meteoam.it/sites/all/modules/custom/international_activities/files/Aprile_2020.pdf (accessed on 3 December 2021).
- Weather Time Series—May 2020—Italian Air Force Technical Reports. Available online: www.meteoam.it/sites/all/modules/custom/international_activities/files/Maggio_2020.pdf (accessed on 3 December 2021).
- Weather Time Series—June 2020—Italian Air Force Technical Reports. Available online: www.meteoam.it/sites/all/modules/custom/international_activities/files/Giugno_2020.pdf (accessed on 3 December 2021).
- Ouf, M.; Tamas, R.; O’Brien, W. Usability and comfort in Canadian offices: Interview of 170 university employees. IOP Conf. Ser. Mater. Sci. Eng. 2019, 609, 042091. [Google Scholar] [CrossRef]
- Boerstra, A.; Beuker, T.; Loomans, M.; Hensen, J. Impact of available and perceived control on comfort and health in European offices. Archit. Sci. Rev. 2013, 56, 30–41. [Google Scholar] [CrossRef] [Green Version]
- Pastore, L.; Andersen, M. Building energy certification versus user satisfaction with the indoor environment: Findings from a multi-site post-occupancy evaluation (POE) in Switzerland. Build. Environ. 2019, 150, 60–74. [Google Scholar] [CrossRef]
- Berquist, J.; Ouf, M.M.; O’Brien, W. A method to conduct longitudinal studies on indoor environmental quality and perceived occupant comfort. Build. Environ. 2019, 150, 88–98. [Google Scholar] [CrossRef]
- Sarran, L.; Hviid, C.A.; Rode, C. Correlation between perceived usability of building services and indoor environmental satisfaction in retrofitted low-energy homes. Build. Environ. 2020, 179, 106946. [Google Scholar] [CrossRef]
- Pedregosa, F.; Varoquaux, G.; Gramfort, A.; Michel, V.; Thirion, B.; Grisel, O.; Blondel, M.; Prettenhofer, P.; Weiss, R.; Dubourg, V.; et al. Scikit-learn: Machine learning in Python. J. Mach. Learn. Res. 2011, 12, 2825–2830. [Google Scholar]
- Scikit-Learn Python Based Library. Available online: http://scikit-learn.org/stable/ (accessed on 3 December 2021).
- XGBoost Python Based Library. Available online: https://github.com/dmlc/xgboost (accessed on 3 December 2021).
- Scikit-Learn Supervised Learning. Available online: https://scikit-learn.org/stable/supervised_learning.html (accessed on 3 December 2021).
- Scikit-Learn Flowchart for Choosing the Right Algorithm. Available online: https://scikit-learn.org/stable/tutorial/machine_learning_map/index.html (accessed on 3 December 2021).
- Scikit-Learn Description of the Linear Support Vector Classifier. Available online: https://scikit-learn.org/stable/modules/generated/sklearn.svm.LinearSVC.html#sklearn.svm.LinearSVC (accessed on 3 December 2021).
- Scikit-Learn Description of the k-Nearest Neighbors Preditctor. Available online: https://scikit-learn.org/stable/modules/generated/sklearn.neighbors.KNeighborsClassifier.html#sklearn.neighbors.KNeighborsClassifier (accessed on 3 December 2021).
- Scikit-Learn Description of the Support Vector Classifier. Available online: https://scikit-learn.org/stable/modules/generated/sklearn.svm.SVC.html#sklearn.svm.SVC (accessed on 3 December 2021).
- Scikit-Learn Description of the Gradient Boosting Classifier. Available online: https://scikit-learn.org/stable/modules/generated/sklearn.ensemble.GradientBoostingClassifier.html#sklearn.ensemble.GradientBoostingClassifier (accessed on 3 December 2021).
- eXtreme Gradient Boosting Documentation. Available online: https://xgboost.readthedocs.io/en/latest/ (accessed on 3 December 2021).
- Cruz, R.; Fernandes, K.; Cardoso, J.S.; Pinto Costa, J.F. Tackling class imbalance with ranking. In Proceedings of the International Joint Conference on Neural Networks (IJCNN), Vancouver, BC, Canada, 24–29 July 2016; pp. 2182–2187. [Google Scholar] [CrossRef] [Green Version]
- He, H.; Ma, Y. Imbalanced Learning: Foundations, Algorithms, and Applications; Wiley-IEEE Press: Piscataway, NJ, USA, 2013; pp. 1–210. [Google Scholar] [CrossRef]
- Hutto, C.J.; Gilbert, E.E. VADER: A Parsimonious Rule-based Model for Sentiment Analysis of Social Media Text. In Proceedings of the International AAAI Conference on Web and Social Media, Ann Arbor, MI, USA, 2–4 June 2014; Available online: http://sentic.net/ (accessed on 3 December 2021).
- WebPage of Italian Law 04/30/76 n. 373. Available online: https://www.gazzettaufficiale.it/eli/id/1976/06/07/076U0373/sg (accessed on 3 December 2021).
- Danza, L.; Barozzi, B.; Bellazzi, A.; Belussi, L.; Devitofrancesco, A.; Ghellere, M.; Salamone, F.; Scamoni, F.; Scrosati, C. A weighting procedure to analyse the Indoor Environmental Quality of a Zero-Energy Building. Build. Environ. 2020, 183, 107155. [Google Scholar] [CrossRef]
- International Standards Organisation (ISO), ISO-10551:2019—Ergonomics of the Physical Environment-Subjective Judgement Scales for Assessing Physical Environments, ISO. 2019. Available online: https://www.iso.org/standard/67186.html (accessed on 3 December 2021).
- Shmueli, G. To explain or to predict? Stat. Sci. 2010, 25, 289–310. [Google Scholar] [CrossRef]
- Lo, A.; Chernoff, H.; Zheng, T.; Lo, S.H. Why significant variables aren’t automatically good predictors. Proc. Natl. Acad. Sci. USA 2015, 112, 13892–13897. [Google Scholar] [CrossRef] [Green Version]
- Tatsat, H.; Puri, S.; Lookabaugh, B. Machine Learning and Data Science Blueprints for Finance; O’Reilly Media: Sevastopol, CA, USA, 2021. [Google Scholar]
- RIP Correlation. Introducing the Predictive Power Score. Available online: https://towardsdatascience.com/rip-correlation-introducing-the-predictive-power-score-3d90808b9598 (accessed on 3 December 2021).
- Feature importance—Extra Tree Classifier. Available online: https://scikit-learn.org/stable/modules/generated/sklearn.ensemble.ExtraTreesClassifier.html#sklearn.ensemble.ExtraTreesClassifier.feature_importances_ (accessed on 3 December 2021).
- Feature Importance—XGBoost. Available online: https://xgboost.readthedocs.io/en/latest/python/python_api.html (accessed on 3 December 2021).
- Gabrieli, G.; Balagtas, J.P.M.; Esposito, G.; Setoh, P. A machine learning approach for the automatic estimation of fixation-time data signals’ quality. Sensors 2020, 20, 6775. [Google Scholar] [CrossRef]
- Vega García, M.; Aznarte, J.L. Shapley additive explanations for NO2 forecasting. Ecol. Inform. 2020, 56, 101039. [Google Scholar] [CrossRef]
- Luo, M.; Xie, J.; Yan, Y.; Ke, Z.; Yu, P.; Wang, Z.; Zhang, J. Comparing machine learning algorithms in predicting thermal sensation using ASHRAE Comfort Database II. Energy Build. 2020, 210, 109776. [Google Scholar] [CrossRef]
- Provoost, S.; Ruwaard, J.; van Breda, W.; Riper, H.; Bosse, T. Validating Automated Sentiment Analysis of Online Cognitive Behavioral Therapy Patient Texts: An Exploratory Study. Front. Psychol. 2019, 10, 1065. [Google Scholar] [CrossRef] [PubMed]
- Bartalucci, C.; Borchi, F.; Carfagni, M. Noise monitoring in Monza (Italy) during COVID-19 pandemic by means of the smart network of sensors developed in the LIFE MONZA project. Noise Mapp. 2020, 7, 199–211. [Google Scholar] [CrossRef]


| Parameter | Scale | Vote | −3 | −2 | −1 | 0 | 1 | 2 | 3 | 4 |
|---|---|---|---|---|---|---|---|---|---|---|
| TC | 5-point CS | Satisfaction | - | Very dissatisfied | Dissatisfied | Neither satisfied nor dissatisfied | Satisfied | Very satisfied | - | - |
| 3-point CS | Preference | - | - | Cooler | No change | Warmer | - | - | - | |
| 7-point CS | Perception | Cold | Cool | Slightly cool | Neutral | Slightly warm | Warm | Hot | - | |
| 3-point CS | Interference | - | - | Interfere | Neutral | Enhance | - | - | - | |
| VC | 5-point CS | Satisfaction | - | Very dissatisfied | Satisfied | Neither satisfied nor dissatisfied | Satisfied | Very satisfied | - | - |
| 3-point CS | Preference | - | - | Darker | No change | More light | - | - | - | |
| 5-point CS | Perception | Dark | Slightly dark | Neutral | Slightly bright | Bright | - | - | ||
| 3-point CS | Interference | - | - | Interfere | Neutral | Enhance | - | - | - | |
| AQ | 5-point CS | Satisfaction | - | Very dissatisfied | Dissatisfied | Neither satisfied nor dissatisfied | Satisfied | Very satisfied | - | - |
| 4-point CS | Preference | No change | Slightly quieter | Quieter | Much quieter | |||||
| 5-point CS | Perception | Very quiet | Quiet | Slightly Noisy | Noisy | Very noisy | ||||
| 3-point CS | Interference | - | - | Interfere | Neutral | Enhance | - | - | - | |
| IAQ | 5-point CS | Satisfaction | - | Very dissatisfied | Dissatisfied | Neither satisfied nor dissatisfied | Satisfied | Very satisfied | - | - |
| 4-point CS | Perception | Not smelly | Slightly smelly | Smelly | Very smelly | - | ||||
| 3-point CS | Interference | - | - | Interfere | Neutral | Enhance | - | - | - | |
| Overall satisfaction | 5-point CS | Satisfaction | - | Very dissatisfied | Dissatisfied | Neither satisfied nor dissatisfied | Satisfied | Very satisfied | - | - |
| Amount of space | 5-point CS | Satisfaction | - | Very dissatisfied | Dissatisfied | Neither satisfied nor dissatisfied | Satisfied | Very satisfied | - | - |
| Comfort of furniture | 5-point CS | Satisfaction | - | Very dissatisfied | Dissatisfied | Neither satisfied nor dissatisfied | Satisfied | Very satisfied | - | - |
| Visual privacy | 5-point CS | Satisfaction | - | Very dissatisfied | Dissatisfied | Neither satisfied nor dissatisfied | Satisfied | Very satisfied | - | - |
| Acoustic privacy | 5-point CS | Satisfaction | - | Very dissatisfied | Dissatisfied | Neither satisfied nor dissatisfied | Satisfied | Very satisfied | - | - |
| Productivity | 5-point CS | Satisfaction | - | Very dissatisfied | Dissatisfied | Neither satisfied nor dissatisfied | Satisfied | Very satisfied | - | - |
| Answer Provided by Participants (in Italian in Quotes, the Meaning on the Right) | Number | Aggregated Answer (Encoding) | Number | |
|---|---|---|---|---|
| “Studio” | Study room | 83 | Study room (1) | 83 |
| “Soggiorno” | Living Room | 129 | Living room (0) | 132 |
| “Angolo studio in soggiorno” | Study corner within living room | 1 | ||
| “Living room” | Living room | 1 | ||
| “Salotto” | Living room | 1 | ||
| “Mi sposto nei vari locali (cucina/soggiorno/camera)” | Not fixed room (Kitchen/Living room/Bedroom) | 1 | Moving (6) | 4 |
| “Cucina, camera, soggiorno” | Kitchen, Bedroom, Living room | 1 | ||
| “Dove capita” | Wherever | 1 | ||
| “Cucina oppure soggiorno oppure cameretta” | Kitchen or Living room or Bedroom | 1 | ||
| “Cucina” | Kitchen | 46 | Kitchen (2) | 46 |
| “Camera da letto” | Bedroom | 46 | Bedroom (3) | 48 |
| “Camera figlio” | Children’s room | 1 | ||
| “Stanza per ospiti” | Guest room | 1 | ||
| “Soggiorno/cucina open space” | Living/Kitchen in open space | 2 | Living area (single room) (5) | 9 |
| “soggiorno-cucina unica stanza” | Kitchen-dining single room | 1 | ||
| “Open soggiorno cucina” | Kitchen living room open area | 1 | ||
| “Zona giorno bilocale” | Two-room flat living area | 1 | ||
| “Soggiorno-cucina” | Living room-Kitchen | 1 | ||
| “Soggiorno con angolo cottura” | Living room with kitchen corner | 1 | ||
| “Cucina-soggiorno” | Kitchen-Living room | 1 | ||
| “Cucina + soggiorno (ambiente unico)” | Kitchen + Living room (single room) | 1 | ||
| “Vano scale“ | Stairs room | 2 | Other (4) | 8 |
| “Mansarda“ | Attic | 2 | ||
| “Corridoio“ | Aisle | 1 | ||
| “Stanza ripostiglio” | Storage room | 1 | ||
| “Balcone” | Balcony | 1 | ||
| “Zona pranzo, separata da soggiorno e cucina, su suppalco in open space” | Dining area separate from living room and kitchen on open space | 1 | ||
| Nr | Feature | List1 | List2 | List3 | List4 | List5 | List6 |
|---|---|---|---|---|---|---|---|
| 2 | School education level | • | |||||
| 3 | Current occupation | • | |||||
| 5 | Position in WFH (Sitting/Standing/Other) | • | |||||
| 10 | Year of construction of the house | • | |||||
| 11 | Renovation of the residential unit in the last 10 years (Yes/No) | • | |||||
| 12 | Type of renovation intervention performed | • | • | ||||
| 19 | Presence and ease of use of ventilation automatic control system | • | |||||
| 22 | Window type | • | |||||
| 23 | Window exposure | • | |||||
| 26 | TC- Thermal Comfort: temperature satisfaction | • | • | • | • | • | |
| 29 | If you generally perceive a discomfort condition, specify which is the main source (you can also choose several options) | • | • | ||||
| 31 | VC -Visual comfort satisfaction | • | |||||
| 34 | Visual discomfort source during WFH | • | |||||
| 35 | Use of artificial lighting during WFH | • | |||||
| 36 | Interference of visual comfort with the ability to perform working activities | • | |||||
| 37 | AQ—Acoustic Quality satisfaction | • | • | • | |||
| 40 | Interference of acoustic quality with the ability to perform working activities | • | • | ||||
| 41 | Solution adopted to ensure the acoustic privacy | ||||||
| 42 | IAQ—IAQ satisfaction | • | • | • | |||
| 44 | In case of bad air, define the source of odours | • | • | • | |||
| 45 | Interference of IAQ with the ability to perform working activity | • | |||||
| 47 | Satisfaction with the amount of available space | • | • | • | |||
| 48 | Satisfaction with the furniture and complements (desk, table, chair) | • | • | • | |||
| 49 | Satisfaction with the visual privacy | • | • | • | • | • | |
| 50 | Satisfaction with the acoustic privacy | • | • | • | • | • | • |
| 51 | Satisfaction with the work productivity | • | • | • | • | ||
| 58 | Importance given to the illuminance level in defining the overall satisfaction | • | |||||
| 60 | Importance given to the Acoustic Quality in defining the overall satisfaction | • |
| List | LSVC AVG ± STD | KNN AVG ± STD | SVM AVG ± STD | GBC AVG ± STD | XGB AVG ± STD |
|---|---|---|---|---|---|
| 1 | 0.694 ± 0.086 | 0.684 ± 0.067 | 0.762 ± 0.064 | 0.748 ± 0.075 | 0.746 ± 0.056 |
| 2 | 0.681 ± 0.090 | 0.688 ± 0.062 | 0.742 ± 0.062 | 0.747 ± 0.092 | 0.736 ± 0.056 |
| 3 | 0.539 ± 0.043 | 0.583 ± 0.066 | 0.617 ± 0.091 | 0.664 ± 0.103 | 0.693 ± 0.042 |
| 4 | 0.663 ±0.073 | 0.672 ± 0.068 | 0.734 ± 0.087 | 0.761 ± 0.088 | 0.758 ± 0.056 |
| 5 | 0.605 ± 0.054 | 0.617 ±0.082 | 0.597 ± 0.094 | 0.709 ± 0.069 | 0.693 ± 0.087 |
| 6 | 0.622 ± 0.078 | 0.616 ± 0.083 | 0.596 ± 0.075 | 0.707 ± 0.078 | 0.708 ±0.063 |
| Algorithms | Hyperparameters | Range | Selected |
|---|---|---|---|
| LSVC | Penalty | [‘l1’, ‘l2’] | ‘l2’ |
| C_value | [100, 10, 1.0, 0.1, 0.01] | 1.0 | |
| KNN | Leaf_size | range(1,10,2) | 1 |
| n_neighbors | range(1,30,5) | 6 | |
| p_value | [1, 2] | 1 | |
| SVM | Kernel | [‘poly’, ‘rbf’, ‘sigmoid’] | ‘rbf’ |
| C_value | [100, 50, 10, 1.0, 0.1, 0.01] | 50 | |
| Gamma | [‘auto’, ‘scale’, 100, 10, 1, 0.1, 0.01, 0.001, 0.0001] | 0.01 | |
| GBC | Max_depth | range(5,16,2) | 4 |
| Min_samples_split | range(200,1001,200) | 200 | |
| XGB | Learning_rate | [0.05, 0.1, 0.15, 0.2, 0.25, 0.30] | 0.3 |
| Max_depth | range(3,10,2) | 3 | |
| Min_child_weight | range(1,6,2) | 3 | |
| Gamma | [i/10.0 for i in range(0,5)] | 0 | |
| Colsample_bytree | [0.3, 0.4, 0.5, 0.7] | 1 |
Publisher’s Note: MDPI stays neutral with regard to jurisdictional claims in published maps and institutional affiliations. |
© 2021 by the authors. Licensee MDPI, Basel, Switzerland. This article is an open access article distributed under the terms and conditions of the Creative Commons Attribution (CC BY) license (https://creativecommons.org/licenses/by/4.0/).
Share and Cite
Salamone, F.; Barozzi, B.; Bellazzi, A.; Belussi, L.; Danza, L.; Devitofrancesco, A.; Ghellere, M.; Meroni, I.; Scamoni, F.; Scrosati, C. Working from Home in Italy during COVID-19 Lockdown: A Survey to Assess the Indoor Environmental Quality and Productivity. Buildings 2021, 11, 660. https://doi.org/10.3390/buildings11120660
Salamone F, Barozzi B, Bellazzi A, Belussi L, Danza L, Devitofrancesco A, Ghellere M, Meroni I, Scamoni F, Scrosati C. Working from Home in Italy during COVID-19 Lockdown: A Survey to Assess the Indoor Environmental Quality and Productivity. Buildings. 2021; 11(12):660. https://doi.org/10.3390/buildings11120660
Chicago/Turabian StyleSalamone, Francesco, Benedetta Barozzi, Alice Bellazzi, Lorenzo Belussi, Ludovico Danza, Anna Devitofrancesco, Matteo Ghellere, Italo Meroni, Fabio Scamoni, and Chiara Scrosati. 2021. "Working from Home in Italy during COVID-19 Lockdown: A Survey to Assess the Indoor Environmental Quality and Productivity" Buildings 11, no. 12: 660. https://doi.org/10.3390/buildings11120660