
Optimal Planning of Hotel Renovation Projects


Abstract
:1. Introduction
2. Literature Review
3. Methodology
4. Optimization Module
4.1. Decision Variables
4.1.1. Hotel Renovation Selection
4.1.2. Floor Renovation Start Date
4.1.3. Use of Overtime Hours
4.1.4. Number of Assigned Crews
4.1.5. Floor Renovation Order
4.2. Objective Function
4.3. Planning Constraints
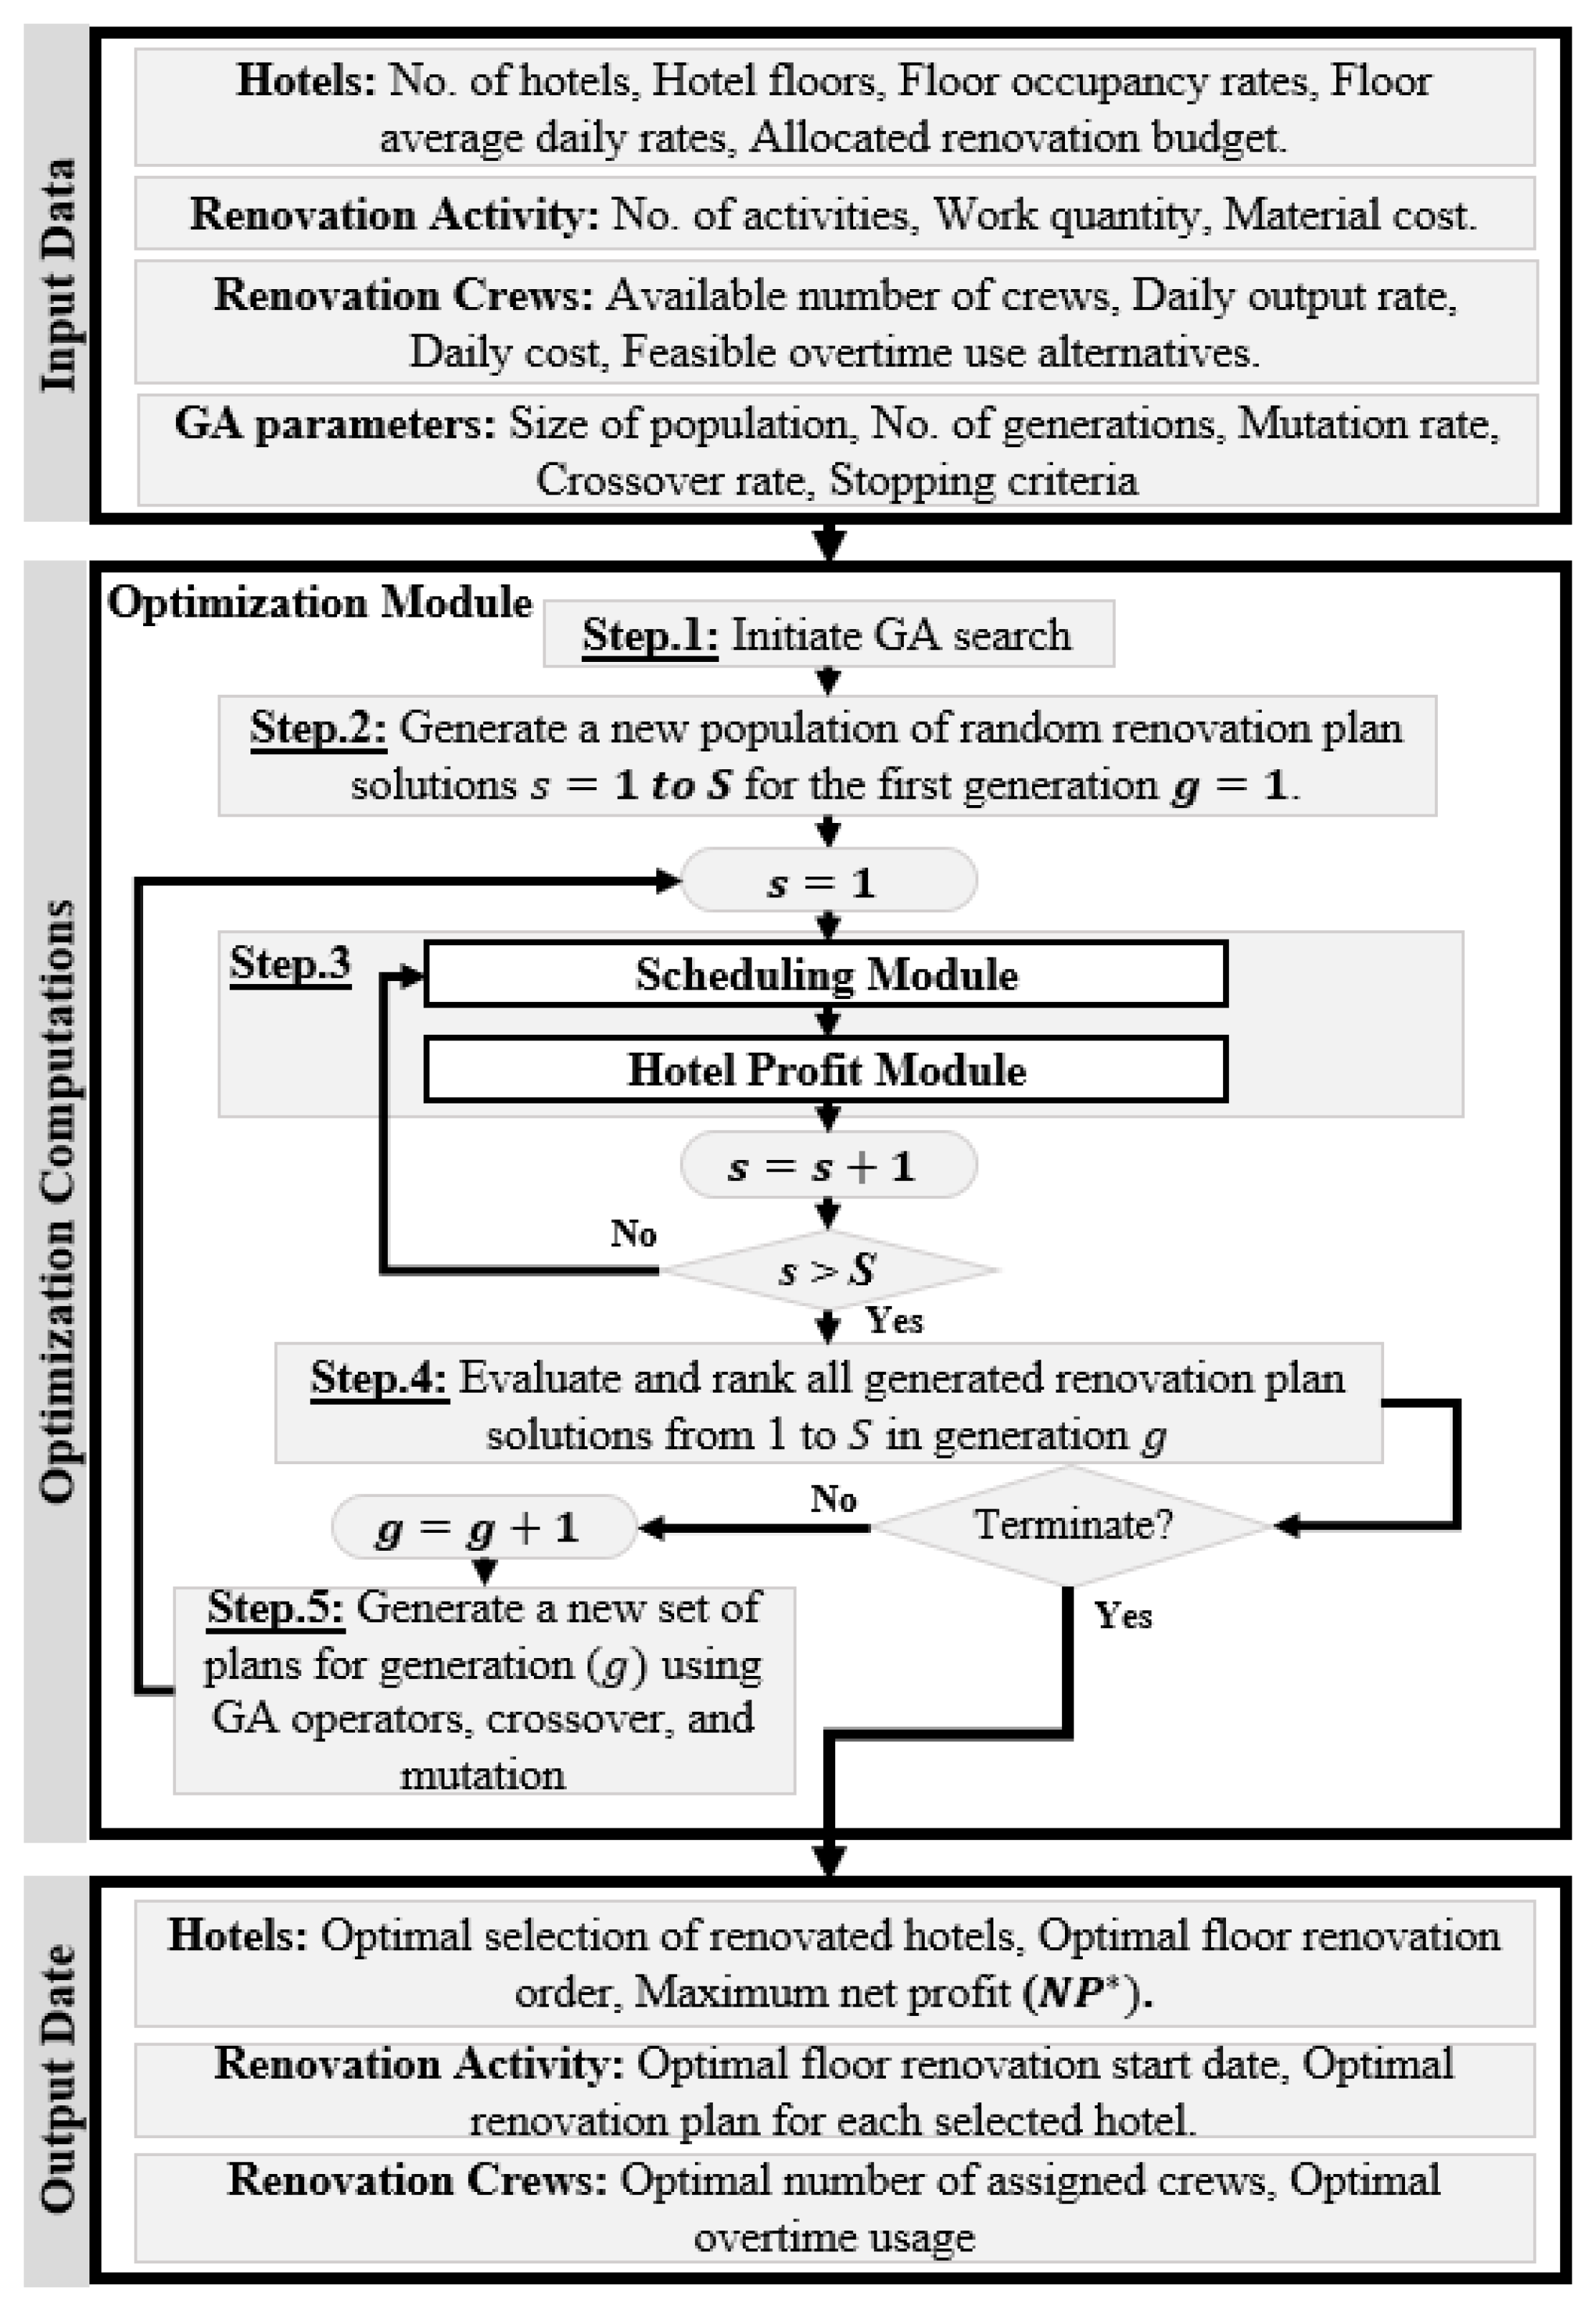
4.4. Optimization Computations
5. Scheduling Module
- Calculate work duration () of activity in each floor in each hotel based on its quantity of work (), number of assigned crews (), and daily output rate of the selected overtime hour use alternative (), as shown in Equation (9).where is duration of activity in floor in hotel in days; is quantity of work of activity in floor in hotel in unit of measurement; is daily output rate of selected overtime alternative assigned to activity in unit of measurement per workday.
- Calculate the start date () of each renovation activity in floor of hotel that satisfies job logic and precedence relationship constraints. For activities with no predecessors, is identified as the latest of the crew deployment date ) and the floor renovation start date (), as shown in Equation (10a). For activities with one or more predecessors, is identified as the latest of the crew deployment date ) and the latest activity start date which is dependent on the finish dates of its predecessors and their specified lag times, as shown in Equation (10b).where is earliest possible crew deployment date of activity in day; is start date of activity in floor of hotel ; is finish date of predecessor activity in floor of hotel is specified lag time between finish date of predecessor and start date of activity .
- Calculate the finish date () of each renovation activity in each floor of hotel based on the activity start date and duration, as shown in Equation (11):where is finish date of activity in floor of hotel ; is start date of activity in floor of hotel ; is duration activity in floor in hotel in days.
- Compute the crew work disruption time () of each renovation activity in hotel based on its start date in successor floor with renovation order of () and its finish date in floor (), using Equation (12):where is crew work disruption time of activity in hotel in day; is start date of activity in successor floor with renovation order in hotel ; is finish date of activity in floor with renovation order in hotel .
6. Hotel Profit Module
- Calculate total hotel revenues () based on (i) daily occupancy rates of each floor in each hotel before renovation () and after renovation (), and (ii) average daily rates of each floor in each hotel before renovation () and after renovation (), as shown in Equations (13)–(18). It should be noted that the model provides planners with the flexibility to specify the need to vacate the upper and/or lower floors of each floor being renovated to mitigate renovation work noise and its negative impact on hotel residence. In these cases, the model is designed to calculate the associated noise mitigation cost due to the additional floor closures and consider its impact on total hotel revenues, as shown in Equations (15)–(17).where is daily occupancy rate of floor in hotel on calendar day before renovation in %; is average daily rate of floor in hotel on calendar day before renovation in $/day; is daily occupancy rate of floor in hotel on calendar day after renovation in %; is average daily rate of floor in hotel on calendar day after renovation in $/day; is finish date of renovation work in floor in hotel ; is total revenue gains of all hotels before renovation in $; is total revenue gains of all hotels after renovation in $; is total noise mitigation cost of all hotels resulting from closures of lower floors in $; is total noise mitigation cost of all hotels resulting from closures of upper floors in $; is total noise mitigation cost of all hotels resulting from closures of upper and/or lower floors in $.
- Calculate total material cost () of all activities in each floor of hotel based on material cost rate of each renovation activity, and its quantity of work in floor of hotel , as shown in Equation (19):where is material cost rate of activity in $ per unit of measurement; is quantity of work of activity in floor of hotel in units of measurement.
- Calculate total crew cost () that account for labor and equipment costs of all activities () in each floor of hotel based on the number of assigned crews to perform activity (), their daily crew cost rates, and duration activity in floor of hotel , using Equation (20):where is daily crew cost rate of selected overtime alternative for renovating activity in hotel in $ per day.
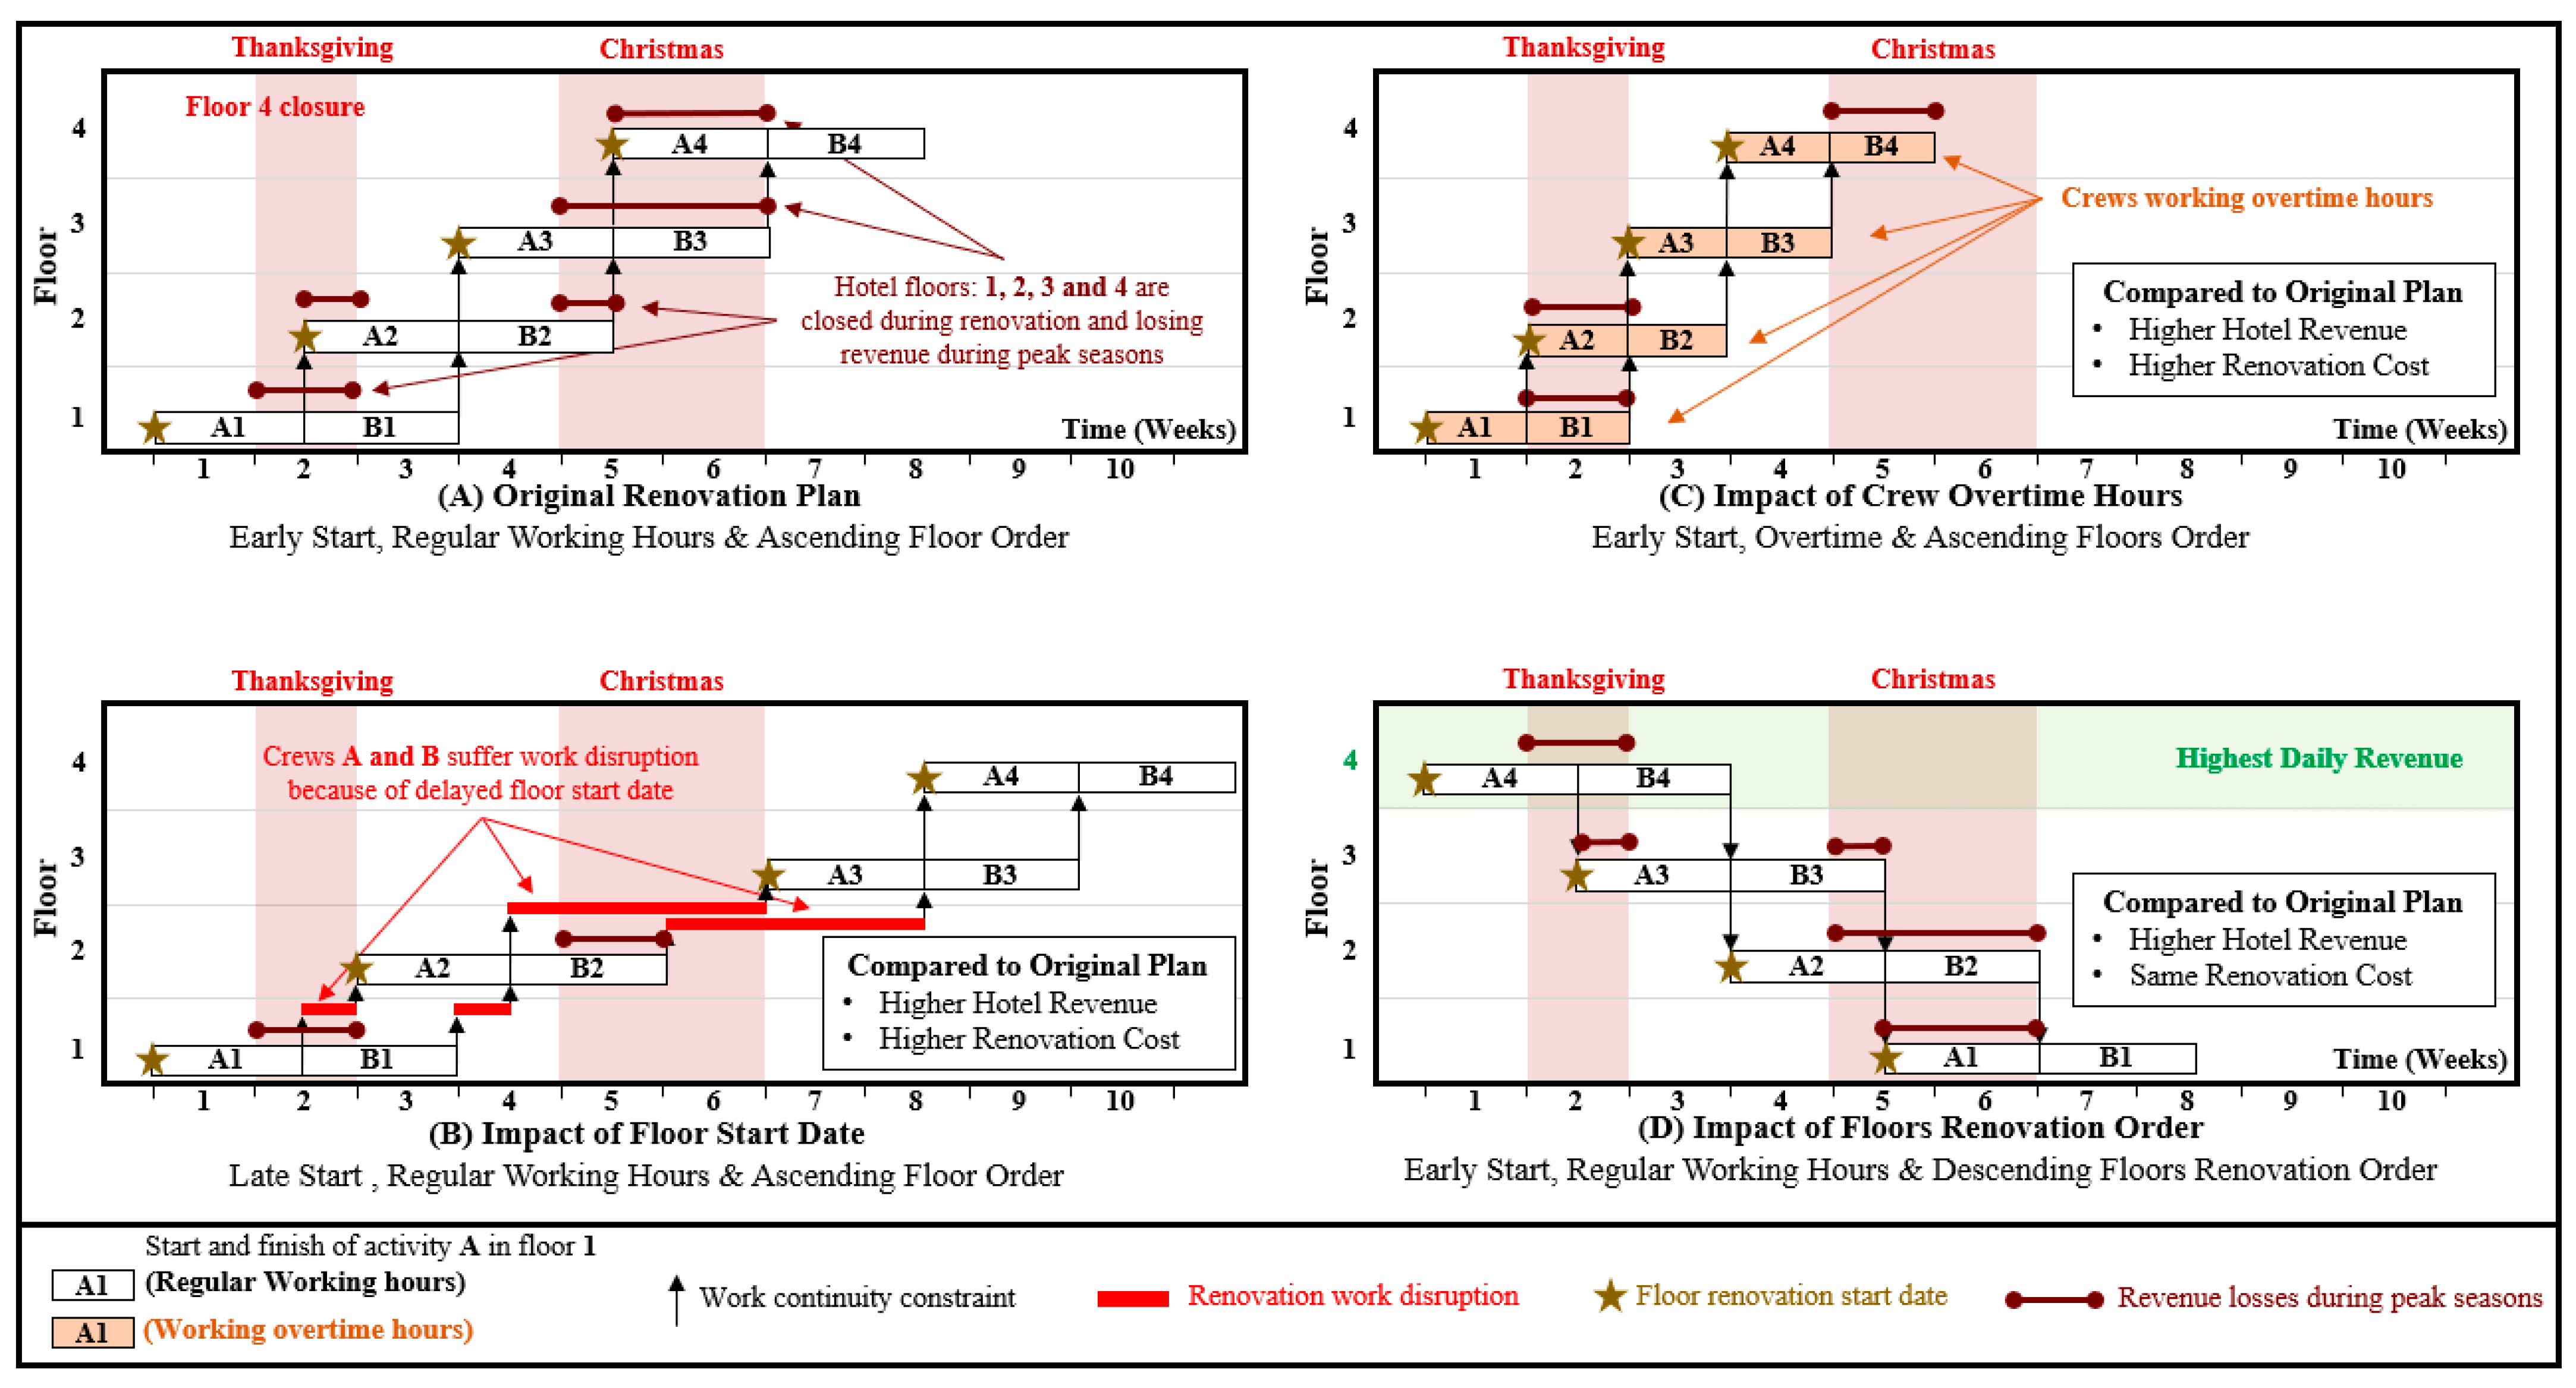
- Calculate total work disruption cost () of all renovation activities () incurred when a crew has to wait before resuming work in its next assigned floor. A work disruption is often encountered when the next assigned floor is unavailable for renovation due to (1) planner-specified delay in the renovation start date of selected floors to minimize their closures and hotel revenue losses during high peak seasons, as shown in Figure 1B; and/or (2) ongoing work of predecessor renovation activities. This cost is calculated based on the number of work disruption periods () for each activity and its associated daily work disruption cost () specified by the planner, using Equation (21):where is work disruption of activity in hotel in days; is daily work disruption cost of activity in $/day.
- Calculate total indirect cost () for each selected hotel () based on project duration () and daily indirect cost rate () that accounts for all time-dependent costs such as site supervision, site utilities, and office overhead, as shown in Equation (22).where is duration of renovation work in hotel in days; is daily indirect cost rate for hotel in $/day.
7. Application Example
8. Discussion
9. Conclusions
Author Contributions
Funding
Informed Consent Statement
Data Availability Statement
Conflicts of Interest
References
- American Hotel & Lodging Association. AHLA’s State of the Hotel Industry. 2021. Available online: https://www.ahla.com/soti2021 (accessed on 1 December 2021).
- Hassanien, A.; Baum, T. Hotel Innovation through Property Renovation. Int. J. Hosp. Tour. Adm. 2002, 3, 5–24. [Google Scholar] [CrossRef]
- Turner, M.J.; Hesford, J.W. The Impact of Renovation Capital Expenditure on Hotel Property Performance. Cornell Hosp. Q. 2019, 60, 25–39. [Google Scholar] [CrossRef]
- van Meerendonk, P. Maximizing Hotel Profits Even While Renovating, 2014. HotelExecutive Web Site. Available online: http://hotelexecutive.com/business_review/4174/maximizing-hotel-profits-even-while-renovating (accessed on 1 December 2021).
- Bloom, B.A.N. The relationship among guestroom renovation, customer satisfaction, and profitability. J. Hosp. Financ. Manag. 2012, 20, 97. [Google Scholar] [CrossRef] [Green Version]
- Echarri, V.; Aldea, F.J.; Gómez, J.G.; Del Hombrebueno, J.R. The integrated renovation of high-rise hotels on the Spanish Mediterranean coast. Int. J. Sustain. Dev. Plan. 2017, 12, 205–216. [Google Scholar] [CrossRef] [Green Version]
- Hassanien, A. Exploring hotel renovation in large hotels: A multiple case study. Struct. Surv. 2006, 24, 41–64. [Google Scholar] [CrossRef]
- Hassanien, A. Exploring the relationship between hotel renovation and hotel inspection. Int. J. Hosp. Tour. Adm. 2007, 8, 1–21. [Google Scholar] [CrossRef]
- Hassanien, A.; Losekoot, E. The application of facilities management expertise to the hotel renovation process. Facilities 2002, 20, 230–238. [Google Scholar] [CrossRef]
- Ihsan, B.; Alshibani, A. Factors affecting operation and maintenance cost of hotels. Prop. Manag. 2018, 36, 296–313. [Google Scholar] [CrossRef]
- Nanu, L.; Ali, F.; Berezina, K.; Cobanoglu, C. The effect of hotel lobby design on booking intentions: An intergenerational examination. Int. J. Hosp. Manag. 2020, 89, 102530. [Google Scholar] [CrossRef]
- Penner, R.H. Hotel Renovation Planning & Design. Cornell Hotel. Restaur. Adm. Q. 1996, 37, 9–10. [Google Scholar]
- Abdallah, M.; El-Rayes, K.; Liu, L. Optimizing the selection of sustainability measures to minimize life-cycle cost of existing buildings. Can. J. Civ. Eng. 2016, 43, 151–163. [Google Scholar] [CrossRef]
- AlOtaibi, M.; El-Rayes, K.; Altuwaim, A. Optimizing the Renovation Scheduling of Leased Residential Buildings to Minimize Total Project Cost. J. Constr. Eng. Manag. 2021, 147, 04021074. [Google Scholar] [CrossRef]
- Bucoń, R.; Tomczak, M. Supporting Building Administrator’s Decisions in Determining Maintenance Costs of Residential Buildings. Eng. Struct. Technol. 2016, 8, 15–22. [Google Scholar]
- Chantrelle, F.P.; Lahmidi, H.; Keilholz, W.; Mankibi, M.; Michel, P. Development of a multicriteria tool for optimizing the renovation of buildings. Appl. Energy 2011, 88, 1386–1394. [Google Scholar] [CrossRef]
- Cho, K.; Kim, T. Optimized scheduling method for office building renovation projects. Expert Syst. Appl. 2021, 168, 114212. [Google Scholar] [CrossRef]
- Farahani, A.; Wallbaum, H.; Dalenbäck, J. Construction Management and Economics Optimized maintenance and renovation scheduling in multifamily buildings-a systematic approach based on condition state and life cycle cost of building components. Constr. Manag. Econ. 2019, 37, 139–155. [Google Scholar] [CrossRef] [Green Version]
- Fiedler, K. Special conditions for time scheduling of building modernization process. Int. J. Proj. Manag. 1987, 5, 35–38. [Google Scholar] [CrossRef]
- Galiotto, N.; Heiselberg, P.; Knudstrup, M.A. The integrated renovation process: Application to family homes. Proc. Inst. Civ. Eng. Eng. Sustain. 2015, 168, 245–257. [Google Scholar] [CrossRef]
- Grussing, M.N.; Asce, M.; Liu, L.Y. Knowledge-Based Optimization of Building Maintenance, Repair, and Renovation Activities to Improve Facility Life Cycle Investments. J. Perform. Constr. Facil. 2014, 28, 539–548. [Google Scholar] [CrossRef]
- Ho, P.; Fischer, M. Validating Renovation Phasing Schedules Using 4D Model Based Methods. In Proceedings of the Construction Research Congress 2009: Building a Sustainable Future, Seattle, WA, USA, 5–7 April 2009; pp. 926–935. [Google Scholar]
- Jensen, P.A.; Maslesa, E. Value based building renovation—A tool for decision-making and evaluation. Build. Environ. 2015, 92, 1–9. [Google Scholar] [CrossRef] [Green Version]
- Lee, H.Y. Renovation scheduling to minimize user impact of a building that remains in operation. Autom. Constr. 2012, 22, 398–405. [Google Scholar] [CrossRef]
- Liu, L. A Systematic Approach for Major Renovation of Residential Buildings. Ph.D. Thesis, Linköping University, Linköping, Sweden, 2017. [Google Scholar]
- Park, C.Y. Managing Tenant Movement Scenarios Based on Tenant Satisfaction during Occupied Renovation Activities. Master’s Thesis, Seoul National University, Seoul, Korea, 2017. [Google Scholar]
- Shiue, F.J.; Zheng, M.C.; Lee, H.Y.; Khitam, A.F.K.; Li, P.Y. Renovation construction process scheduling for long-term performance of buildings: An application case of university campus. Sustainability 2019, 11, 5542. [Google Scholar] [CrossRef] [Green Version]
- Whiteman, W.E.; Irwig, H.G. Disturbance scheduling technique for managing renovation work. J. Constr. Eng. Manag. 1988, 114, 191–213. [Google Scholar] [CrossRef]
- Yee, P.; Fischer, M.; Yee, J.; Fischer, P.; Haymaker, M. Automated identification of occupant interactions in renovations of occupied buildings. J. Inf. Technol. Constr. 2013, 18, 182–213. Available online: http://www.itcon.org/2013/10 (accessed on 1 December 2021).
- Altuwaim, A.; El-Raye, K. Optimizing the scheduling of repetitive construction to minimize interruption cost. Constr. Eng. Manag. 2018, 144, 04018051. [Google Scholar] [CrossRef]
- Ammar, M.A. Optimization of line of balance scheduling considering work interruption. Int. J. Constr. Manag. 2019. Available online: https://www.tandfonline.com/doi/full/10.1080/15623599.2019.1624003 (accessed on 1 December 2021). [CrossRef]
- Hassan, A.; El-Rayes, K. Quantifying the interruption impact of activity delays in non-serial repetitive construction projects. Constr. Manag. Econ. 2020, 38, 515–533. [Google Scholar] [CrossRef]
- Hegazy, T.; Wassef, N. Cost optimization in projects with repetitive nonserial activities. J. Constr. Eng. Manag. 2001, 127, 183–191. [Google Scholar] [CrossRef]
- Huang, Y.S.; Zou, X.; Zhang, L.H. Genetic algorithm–based method for the deadline problem in repetitive construction projects considering soft logic. J. Manag. Eng. 2016, 32, 04016002. [Google Scholar] [CrossRef]
- Ioannou, P.G.; Yang, I.-T. Repetitive scheduling method: Requirements, modeling, and implementation. J. Constr. Eng. Manag. 2016, 142, 4016002. [Google Scholar] [CrossRef]
- Ipsilandis, P.G. Multiobjective Linear Programming Model for Scheduling Linear Repetitive Projects. J. Constr. Eng. Manag. 2007, 133, 417–424. [Google Scholar] [CrossRef]
- Jaskowski, P.; Biruk, S. Scheduling of Repetitive Construction Processes with Concurrent Work of Similarly Specialized Crews. J. Civ. Eng. Manag. 2020, 26, 579–589. [Google Scholar] [CrossRef]
- Monghasemi, S.; Abdallah, M. Linear Optimization Model to Minimize Total Cost of Repetitive Construction Projects and Identify Order of Units. J. Manag. Eng. 2021, 37, 04021036. [Google Scholar] [CrossRef]
- Salama, T.; Moselhi, O. Multi-objective optimization for repetitive scheduling under uncertainty. Eng. Constr. Archit. Manag. 2019, 26, 1294–1320. [Google Scholar] [CrossRef]


| Activity Number | Activity Description | Predecessor Activities | Unit of Measurement | Quantity of Work per Floor | Material Cost ($) | Maximum Available Crews for Each Hotel | ||
|---|---|---|---|---|---|---|---|---|
| Hotel 1 | Hotel 2 | Hotel 3 | ||||||
| Demolition and Removal | ||||||||
| 1 | Carpet, bonded, including surface scraping | - | S.F. * | 2080 | 1560 | 1820 | 0 | 9 |
| 2 | Bathtub and showerhead | 1 | Each ** | 32 | 24 | 28 | 0 | 10 |
| 3 | Sink, single compartment, and faucets | 2 | Each | 32 | 24 | 28 | 0 | 9 |
| 4 | Water closets (Toilet) | 3 | Each | 32 | 24 | 28 | 0 | 9 |
| 5 | Tile, ceramic, thin set | 4 | S.F. | 4782 | 3672 | 4206 | 0 | 6 |
| Plumbing | ||||||||
| 6 | Bathtub, soaking, acrylic, w/pop-up drain 66″ × 36″ × 20″ deep | 5 | Each | 32 | 24 | 28 | 1675 | 10 |
| 7 | Sink, with trim, porcelain enamel on cast iron, 22″ × 19″, single bowl | 6 | Each | 32 | 24 | 28 | 690 | 8 |
| 8 | Bath faucet, diverter spout combination | 7 | Each | 32 | 24 | 28 | 86 | 10 |
| 9 | Water closets, bowl only, with flush valve, seat, 1.6 gpf, wall hung | 8 | Each | 32 | 24 | 28 | 970 | 9 |
| Electricity | ||||||||
| 10 | Switch plates, 1 gang, 2 switch, plastic | 9 | Each | 90 | 112 | 102 | 5 | 9 |
| 11 | Receptacle, duplex, 120 volt, grounded, 15 amp | 10 | Each | 96 | 72 | 84 | 1.3 | 9 |
| 12 | Interior lighting fixtures | 11 | Each | 192 | 144 | 168 | 75 | 10 |
| Painting | ||||||||
| 13 | Paint interior, and exterior walls, complete, including surface prep, primer and 2 coats finish for all rooms | 12 | S.F. | 2534 | 1932 | 2226 | 0.21 | 6 |
| Flooring | ||||||||
| 14 | Ceramic tiles, recycled glass, standard colors, 2″ × 2″ | 13 | S.F. | 2080 | 1560 | 1820 | 22 | 7 |
| 15 | Sheet carpet, Nylon, level loop, 28 oz., light to medium traffic | 14 | S.F. | 4782 | 3672 | 4206 | 39.5 | 10 |
| Furniture | ||||||||
| 16 | Hotel Furniture, Standard quality set, minimum | 15 | Each | 32 | 24 | 28 | 2550 | 8 |
| Activity | Feasible Alternative | Daily | ||
|---|---|---|---|---|
| Overtime Hours (hour/day) | Output Rate (unit/day) | Cost Rate ($/day) | ||
| 1 | 1 | 0 | 675 | 667 |
| 2 | 2 | 803 | 1001 | |
| 3 | 4 | 932 | 1334 | |
| 2 | 1 | 0 | 4 | 521 |
| 2 | 2 | 5 | 781 | |
| 3 | 3 | 5 | 911 | |
| 3 | 1 | 0 | 8 | 521 |
| 2 | 3 | 10 | 911 | |
| 4 | 1 | 0 | 8 | 521 |
| 2 | 4 | 11 | 1042 | |
| 5 | 1 | 0 | 5000 | 683 |
| 2 | 2 | 5950 | 1025 | |
| 3 | 3 | 6975 | 1366 | |
| 6 | 1 | 0 | 5.5 | 942 |
| 2 | 3 | 7 | 1648 | |
| 7 | 1 | 0 | 8 | 941 |
| 2 | 3 | 10 | 1646 | |
| 3 | 4 | 11 | 1882 | |
| 8 | 1 | 0 | 8 | 521 |
| 2 | 4 | 11 | 1042 | |
| 9 | 1 | 0 | 5.8 | 938 |
| 2 | 3 | 7 | 1641 | |
| 10 | 1 | 0 | 80 | 487 |
| 2 | 2 | 95 | 731 | |
| 3 | 4 | 110 | 974 | |
| 11 | 1 | 0 | 40 | 489 |
| 2 | 3 | 51 | 856 | |
| 12 | 1 | 0 | 6 | 756 |
| 2 | 4 | 8 | 1512 | |
| 13 | 1 | 0 | 325 | 358 |
| 2 | 3 | 418 | 627 | |
| 14 | 1 | 0 | 190 | 706 |
| 2 | 2 | 226 | 1058 | |
| 3 | 3 | 244 | 1235 | |
| 15 | 1 | 0 | 75 | 394 |
| 2 | 2 | 89 | 591 | |
| 3 | 4 | 104 | 788 | |
| 16 | 1 | 0 | 10 | 158 |
| 2 | 3 | 13 | 276 | |
| Activity Number | Daily Renovation Work Disruption Cost
($/day) | ||||
|---|---|---|---|---|---|
| One Week or Less | Two Weeks | Three Weeks | Four Weeks | Five Weeks or More | |
| 1 | 500 | 334 | 233 | 133 | 0 |
| 2 | 391 | 260 | 182 | 104 | 0 |
| 3 | 391 | 260 | 182 | 104 | 0 |
| 4 | 391 | 260 | 182 | 104 | 0 |
| 5 | 512 | 342 | 239 | 137 | 0 |
| 6 | 706 | 471 | 330 | 188 | 0 |
| 7 | 706 | 470 | 329 | 188 | 0 |
| 8 | 391 | 260 | 182 | 104 | 0 |
| 9 | 703 | 469 | 328 | 188 | 0 |
| 10 | 365 | 244 | 171 | 97 | 0 |
| 11 | 367 | 245 | 171 | 98 | 0 |
| 12 | 567 | 378 | 265 | 151 | 0 |
| 13 | 269 | 179 | 125 | 72 | 0 |
| 14 | 529 | 353 | 247 | 141 | 0 |
| 15 | 295 | 197 | 138 | 79 | 0 |
| 16 | 118 | 79 | 55 | 32 | 0 |
| Hotel No. | Floor No. | Daily Occupancy Rate before Renovation
(%) | |||||||
|---|---|---|---|---|---|---|---|---|---|
| Monday | Tuesday | ... | Saturday | Sunday | ... | Thursday | Friday | ||
| 16 January 2023 | 17 January 2023 | 29 July 2023 | 30 July 2023 | 21 December 2023 | 22 December 2023 | ||||
| 1 | 1 | 87 | 91 | 58 | 58 | 91 | 74 | ||
| 2 | 89 | 93 | 61 | 61 | 93 | 76 | |||
| 3 | 90 | 95 | 63 | 63 | 95 | 79 | |||
| 4 | 92 | 97 | 67 | 67 | 97 | 80 | |||
| 5 | 93 | 98 | 71 | 71 | 98 | 80 | |||
| 6 | 97 | 100 | 71 | 71 | 100 | 81 | |||
| 7 | 100 | 100 | 72 | 72 | 100 | 82 | |||
| 8 | 100 | 100 | 74 | 74 | 100 | 84 | |||
| 9 | 100 | 100 | 76 | 76 | 100 | 86 | |||
| 10 | 100 | 100 | 81 | 81 | 100 | 88 | |||
| 2 | 1 | 76 | 76 | 58 | 81 | 73 | 59 | ||
| 2 | 73 | 75 | 58 | 80 | 77 | 61 | |||
| 3 | 78 | 77 | 56 | 77 | 80 | 59 | |||
| 4 | 81 | 73 | 56 | 75 | 82 | 56 | |||
| 5 | 82 | 81 | 64 | 77 | 73 | 69 | |||
| 6 | 98 | 93 | 69 | 88 | 89 | 65 | |||
| 7 | 92 | 93 | 63 | 99 | 83 | 69 | |||
| 8 | 91 | 83 | 64 | 84 | 89 | 67 | |||
| 9 | 87 | 94 | 72 | 90 | 89 | 68 | |||
| 10 | 92 | 94 | 72 | 95 | 93 | 66 | |||
| 11 | 96 | 91 | 84 | 96 | 89 | 77 | |||
| 12 | 89 | 97 | 76 | 93 | 83 | 80 | |||
| 13 | 96 | 100 | 73 | 96 | 95 | 74 | |||
| 14 | 94 | 85 | 77 | 83 | 93 | 77 | |||
| 15 | 87 | 99 | 76 | 93 | 94 | 83 | |||
| 3 | 1 | 63 | 68 | 93 | 69 | 71 | 91 | ||
| 2 | 61 | 67 | 96 | 67 | 64 | 79 | |||
| 3 | 64 | 71 | 80 | 63 | 66 | 90 | |||
| 4 | 63 | 67 | 85 | 64 | 64 | 78 | |||
| 5 | 65 | 63 | 92 | 64 | 71 | 99 | |||
| 6 | 68 | 68 | 87 | 71 | 64 | 85 | |||
| 7 | 66 | 74 | 82 | 69 | 62 | 81 | |||
| 8 | 67 | 69 | 84 | 61 | 67 | 78 | |||
| 9 | 66 | 63 | 86 | 60 | 64 | 88 | |||
| 10 | 62 | 65 | 83 | 61 | 73 | 85 | |||
| 11 | 69 | 75 | 81 | 64 | 63 | 89 | |||
| 12 | 70 | 62 | 90 | 68 | 65 | 85 | |||
| Hotel No. | Floor No. | Daily Occupancy Rate after Renovation
(%) | |||||||
|---|---|---|---|---|---|---|---|---|---|
| Monday | Tuesday | ... | Saturday | Sunday | ... | Thursday | Friday | ||
| 16 January 2023 | 17 January 2023 | 29 July 2023 | 30 July 2023 | 21 December 2023 | 22 December 2023 | ||||
| 1 | 1 | 90 | 94 | 60 | 60 | 94 | 76 | ||
| 2 | 92 | 96 | 63 | 63 | 96 | 78 | |||
| 3 | 93 | 98 | 65 | 65 | 98 | 81 | |||
| 4 | 95 | 100 | 69 | 69 | 100 | 82 | |||
| 5 | 96 | 100 | 73 | 73 | 100 | 82 | |||
| 6 | 100 | 100 | 73 | 73 | 100 | 83 | |||
| 7 | 100 | 100 | 74 | 74 | 100 | 84 | |||
| 8 | 100 | 100 | 76 | 76 | 100 | 87 | |||
| 9 | 100 | 100 | 78 | 78 | 100 | 89 | |||
| 10 | 100 | 100 | 83 | 83 | 100 | 91 | |||
| 2 | 1 | 80 | 80 | 61 | 85 | 77 | 62 | ||
| 2 | 77 | 79 | 61 | 84 | 81 | 64 | |||
| 3 | 82 | 81 | 59 | 81 | 84 | 62 | |||
| 4 | 85 | 77 | 59 | 79 | 86 | 59 | |||
| 5 | 86 | 85 | 67 | 81 | 77 | 72 | |||
| 6 | 100 | 98 | 72 | 92 | 93 | 68 | |||
| 7 | 97 | 98 | 66 | 100 | 87 | 72 | |||
| 8 | 96 | 87 | 67 | 88 | 93 | 70 | |||
| 9 | 91 | 99 | 76 | 95 | 93 | 71 | |||
| 10 | 97 | 99 | 76 | 100 | 98 | 69 | |||
| 11 | 100 | 96 | 88 | 100 | 93 | 81 | |||
| 12 | 93 | 100 | 80 | 98 | 87 | 84 | |||
| 13 | 100 | 100 | 77 | 100 | 100 | 78 | |||
| 14 | 99 | 89 | 81 | 87 | 98 | 81 | |||
| 15 | 91 | 100 | 80 | 98 | 99 | 87 | |||
| 3 | 1 | 67 | 73 | 100 | 74 | 76 | 97 | ||
| 2 | 65 | 72 | 100 | 72 | 68 | 85 | |||
| 3 | 68 | 76 | 86 | 67 | 71 | 96 | |||
| 4 | 67 | 72 | 91 | 68 | 68 | 83 | |||
| 5 | 70 | 67 | 98 | 68 | 76 | 100 | |||
| 6 | 73 | 73 | 93 | 76 | 68 | 91 | |||
| 7 | 71 | 79 | 88 | 74 | 66 | 87 | |||
| 8 | 72 | 74 | 90 | 65 | 72 | 83 | |||
| 9 | 71 | 67 | 92 | 64 | 68 | 94 | |||
| 10 | 66 | 70 | 89 | 65 | 78 | 91 | |||
| 11 | 74 | 80 | 87 | 68 | 67 | 95 | |||
| 12 | 75 | 66 | 96 | 73 | 70 | 91 | |||
| Hotel No. | Floor No. | Average Daily Rate before Renovation
($/day) | |||||||
|---|---|---|---|---|---|---|---|---|---|
| Monday | Tuesday | ... | Saturday | Sunday | ... | Thursday | Friday | ||
| 16 January 2023 | 17 January 2023 | 29 July 2023 | 30 July 2023 | 21 December 2023 | 22 December 2023 | ||||
| 1 | 1 | 3040 | 3040 | 2584 | 2584 | 3040 | 2584 | ||
| 2 | 3040 | 3040 | 2584 | 2584 | 3040 | 2584 | |||
| 3 | 3040 | 3040 | 2584 | 2584 | 3040 | 2584 | |||
| 4 | 3040 | 3040 | 2584 | 2584 | 3040 | 2584 | |||
| 5 | 3040 | 3040 | 2584 | 2584 | 3040 | 2584 | |||
| 6 | 3040 | 3040 | 2584 | 2584 | 3040 | 2584 | |||
| 7 | 3040 | 3040 | 2584 | 2584 | 3040 | 2584 | |||
| 8 | 3040 | 3040 | 2584 | 2584 | 3040 | 2584 | |||
| 9 | 3040 | 3040 | 2584 | 2584 | 3040 | 2584 | |||
| 10 | 3040 | 3040 | 2584 | 2584 | 3040 | 2584 | |||
| 2 | 1 | 3408 | 3408 | 2880 | 3408 | 3408 | 2880 | ||
| 2 | 3408 | 3408 | 2880 | 3408 | 3408 | 2880 | |||
| 3 | 3408 | 3408 | 2880 | 3408 | 3408 | 2880 | |||
| 4 | 3408 | 3408 | 2880 | 3408 | 3408 | 2880 | |||
| 5 | 3408 | 3408 | 2880 | 3408 | 3408 | 2880 | |||
| 6 | 3408 | 3408 | 2880 | 3408 | 3408 | 2880 | |||
| 7 | 3408 | 3408 | 2880 | 3408 | 3408 | 2880 | |||
| 8 | 3408 | 3408 | 2880 | 3408 | 3408 | 2880 | |||
| 9 | 3408 | 3408 | 2880 | 3408 | 3408 | 2880 | |||
| 10 | 3408 | 3408 | 2880 | 3408 | 3408 | 2880 | |||
| 11 | 3408 | 3408 | 2880 | 3408 | 3408 | 2880 | |||
| 12 | 3408 | 3408 | 2880 | 3408 | 3408 | 2880 | |||
| 13 | 3408 | 3408 | 2880 | 3408 | 3408 | 2880 | |||
| 14 | 3408 | 3408 | 2880 | 3408 | 3408 | 2880 | |||
| 15 | 3408 | 3408 | 2880 | 3408 | 3408 | 2880 | |||
| 3 | 1 | 3332 | 3332 | 4172 | 3332 | 3332 | 4172 | ||
| 2 | 3332 | 3332 | 4172 | 3332 | 3332 | 4172 | |||
| 3 | 3332 | 3332 | 4172 | 3332 | 3332 | 4172 | |||
| 4 | 3332 | 3332 | 4172 | 3332 | 3332 | 4172 | |||
| 5 | 3332 | 3332 | 4172 | 3332 | 3332 | 4172 | |||
| 6 | 3332 | 3332 | 4172 | 3332 | 3332 | 4172 | |||
| 7 | 3332 | 3332 | 4172 | 3332 | 3332 | 4172 | |||
| 8 | 3332 | 3332 | 4172 | 3332 | 3332 | 4172 | |||
| 9 | 3332 | 3332 | 4172 | 3332 | 3332 | 4172 | |||
| 10 | 3332 | 3332 | 4172 | 3332 | 3332 | 4172 | |||
| 11 | 3332 | 3332 | 4172 | 3332 | 3332 | 4172 | |||
| 12 | 3332 | 3332 | 4172 | 3332 | 3332 | 4172 | |||
| Hotel No. | Floor No. | Average Daily Rate after Renovation
($/day) | |||||||
|---|---|---|---|---|---|---|---|---|---|
| Monday | Tuesday | ... | Saturday | Sunday | ... | Thursday | Friday | ||
| 16 January 2023 | 17 January 2023 | 29 July 2023 | 30 July 2023 | 21 December 2023 | 22 December 2023 | ||||
| 1 | 1 | 3557 | 3557 | 3023 | 3023 | 3557 | 3023 | ||
| 2 | 3557 | 3557 | 3023 | 3023 | 3557 | 3023 | |||
| 3 | 3557 | 3557 | 3023 | 3023 | 3557 | 3023 | |||
| 4 | 3557 | 3557 | 3023 | 3023 | 3557 | 3023 | |||
| 5 | 3557 | 3557 | 3023 | 3023 | 3557 | 3023 | |||
| 6 | 3557 | 3557 | 3023 | 3023 | 3557 | 3023 | |||
| 7 | 3557 | 3557 | 3023 | 3023 | 3557 | 3023 | |||
| 8 | 3557 | 3557 | 3023 | 3023 | 3557 | 3023 | |||
| 9 | 3557 | 3557 | 3023 | 3023 | 3557 | 3023 | |||
| 10 | 3557 | 3557 | 3023 | 3023 | 3557 | 3023 | |||
| 2 | 1 | 3919 | 3919 | 3312 | 3919 | 3919 | 3312 | ||
| 2 | 3919 | 3919 | 3312 | 3919 | 3919 | 3312 | |||
| 3 | 3919 | 3919 | 3312 | 3919 | 3919 | 3312 | |||
| 4 | 3919 | 3919 | 3312 | 3919 | 3919 | 3312 | |||
| 5 | 3919 | 3919 | 3312 | 3919 | 3919 | 3312 | |||
| 6 | 3919 | 3919 | 3312 | 3919 | 3919 | 3312 | |||
| 7 | 3919 | 3919 | 3312 | 3919 | 3919 | 3312 | |||
| 8 | 3919 | 3919 | 3312 | 3919 | 3919 | 3312 | |||
| 9 | 3919 | 3919 | 3312 | 3919 | 3919 | 3312 | |||
| 10 | 3919 | 3919 | 3312 | 3919 | 3919 | 3312 | |||
| 11 | 3919 | 3919 | 3312 | 3919 | 3919 | 3312 | |||
| 12 | 3919 | 3919 | 3312 | 3919 | 3919 | 3312 | |||
| 13 | 3919 | 3919 | 3312 | 3919 | 3919 | 3312 | |||
| 14 | 3919 | 3919 | 3312 | 3919 | 3919 | 3312 | |||
| 15 | 3919 | 3919 | 3312 | 3919 | 3919 | 3312 | |||
| 3 | 1 | 3998 | 3998 | 5006 | 3998 | 3998 | 5006 | ||
| 2 | 3998 | 3998 | 5006 | 3998 | 3998 | 5006 | |||
| 3 | 3998 | 3998 | 5006 | 3998 | 3998 | 5006 | |||
| 4 | 3998 | 3998 | 5006 | 3998 | 3998 | 5006 | |||
| 5 | 3998 | 3998 | 5006 | 3998 | 3998 | 5006 | |||
| 6 | 3998 | 3998 | 5006 | 3998 | 3998 | 5006 | |||
| 7 | 3998 | 3998 | 5006 | 3998 | 3998 | 5006 | |||
| 8 | 3998 | 3998 | 5006 | 3998 | 3998 | 5006 | |||
| 9 | 3998 | 3998 | 5006 | 3998 | 3998 | 5006 | |||
| 10 | 3998 | 3998 | 5006 | 3998 | 3998 | 5006 | |||
| 11 | 3998 | 3998 | 5006 | 3998 | 3998 | 5006 | |||
| 12 | 3998 | 3998 | 5006 | 3998 | 3998 | 5006 | |||
| 13 | 3998 | 3998 | 5006 | 3998 | 3998 | 5006 | |||
| 14 | 3998 | 3998 | 5006 | 3998 | 3998 | 5006 | |||
| 15 | 3998 | 3998 | 5006 | 3998 | 3998 | 5006 | |||
| Optimal Hotel Selection | Floor No. | Optimal Floor Start Date | Optimal Floor Order |
|---|---|---|---|
| 1 | 1 | 109.9 | 10 |
| 2 | 109.6 | 9 | |
| 3 | 109.3 | 8 | |
| 4 | 42.6 | 6 | |
| 5 | 109.0 | 7 | |
| 6 | 42.3 | 5 | |
| 7 | 0.0 | 1 | |
| 8 | 0.6 | 3 | |
| 9 | 0.3 | 2 | |
| 10 | 42.0 | 4 | |
| 3 | 1 | 1.5 | 5 |
| 2 | 2.1 | 7 | |
| 3 | 1.3 | 4 | |
| 4 | 32.5 | 10 | |
| 5 | 1.8 | 6 | |
| 6 | 33.1 | 12 | |
| 7 | 0.0 | 1 | |
| 8 | 1.0 | 3 | |
| 9 | 32.8 | 11 | |
| 10 | 0.3 | 2 | |
| 11 | 32.3 | 9 | |
| 12 | 32.0 | 8 |
| Activity Number | Optimal Overtime Use Alternative | Optimal Number of Crews | ||
|---|---|---|---|---|
| Hotel 1 | Hotel 3 | Hotel 1 | Hotel 3 | |
| 1 | 1 | 1 | 9 | 5 |
| 2 | 2 | 2 | 10 | 10 |
| 3 | 1 | 1 | 10 | 10 |
| 4 | 1 | 1 | 10 | 10 |
| 5 | 1 | 1 | 4 | 5 |
| 6 | 1 | 1 | 10 | 10 |
| 7 | 1 | 1 | 8 | 8 |
| 8 | 1 | 1 | 8 | 9 |
| 9 | 1 | 1 | 10 | 9 |
| 10 | 1 | 1 | 5 | 6 |
| 11 | 1 | 1 | 9 | 6 |
| 12 | 1 | 1 | 10 | 10 |
| 13 | 1 | 1 | 6 | 6 |
| 14 | 1 | 1 | 6 | 5 |
| 15 | 2 | 2 | 10 | 10 |
| 16 | 2 | 2 | 6 | 5 |
| Renovation Plan | Set of Possible Renovation Planning Decisions | Net Profit Performance | |||||||
|---|---|---|---|---|---|---|---|---|---|
| Hotel Renovation Selection | Floor Renovation Order | Overtime Hours Alternative | Number of Crews for Each Activity | Hotel Revenues ($) | Renovation Cost ($) | Net Profit ($) | Loss in Net ProfitCompared to Optimal Renovation Plan a | ||
| ($) | (%) | ||||||||
| 1 | 1 | Ascending | No overtime | Max | Infeasible solution * | ||||
| 2 | |||||||||
| 3 | |||||||||
| 2 | 1 | Ascending | No overtime | Max | 38,882,673 | 12,042,991 | 26,839,682 | 2,135,499 | 7 |
| 2 | |||||||||
| 3 | 1 | Ascending | Max overtime | Max | 39,262,750 | 11,565,566 | 27,697,214 | 1,277,967 | 4 |
| 3 | |||||||||
| 4 | 1 | Descending | Max overtime | Max | Infeasible solution ** | ||||
| 2 | |||||||||
| 5 | 2 | Ascending | No overtime | Max | 38,413,047 | 12,342,433 | 26,070,614 | 2,904,567 | 10 |
| 3 | |||||||||
| 6 | 1 | Descending | Max overtime | Half | 37,497,125 | 12,207,775 | 25,289,350 | 3,685,832 | 13 |
| 3 | |||||||||
| 7 | 1 | Descending | No overtime | Half | 35,452,997 | 11,593,667 | 23,859,331 | 5,115,850 | 18 |
| 3 | |||||||||
| 8 | 1 | Ascending | No overtime | Half | 35,166,837 | 12,069,883 | 23,096,954 | 5,878,227 | 25 |
| 2 | |||||||||
| 9 | 2 | Ascending | No overtime | Half | 33,589,751 | 12,367,586 | 21,222,165 | 7,753,016 | 27 |
| 3 | |||||||||
| 10 | 1 | Ascending | No overtime | Min | 31,276,431 | 11,978,686 | 19,297,746 | 9,677,435 | 33 |
| 3 | |||||||||
| 11 a | 1 and 3 | Optimal | Optimal | Optimal | 40,645,527 | 11,670,347 | 28,975,181 | 0 | 0 |
Publisher’s Note: MDPI stays neutral with regard to jurisdictional claims in published maps and institutional affiliations. |
© 2021 by the authors. Licensee MDPI, Basel, Switzerland. This article is an open access article distributed under the terms and conditions of the Creative Commons Attribution (CC BY) license (https://creativecommons.org/licenses/by/4.0/).
Share and Cite
AlOtaibi, M.; El-Rayes, K.; Altuwaim, A.; AlOmani, A. Optimal Planning of Hotel Renovation Projects. Buildings 2021, 11, 658. https://doi.org/10.3390/buildings11120658
AlOtaibi M, El-Rayes K, Altuwaim A, AlOmani A. Optimal Planning of Hotel Renovation Projects. Buildings. 2021; 11(12):658. https://doi.org/10.3390/buildings11120658
Chicago/Turabian StyleAlOtaibi, Mansour, Khaled El-Rayes, Ayman Altuwaim, and Abdullah AlOmani. 2021. "Optimal Planning of Hotel Renovation Projects" Buildings 11, no. 12: 658. https://doi.org/10.3390/buildings11120658