
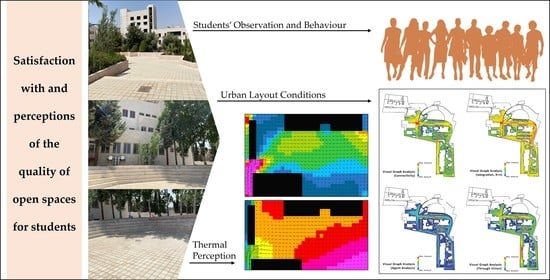
Towards Meaningful University Space: Perceptions of the Quality of Open Spaces for Students


Abstract
:
1. Introduction
2. Materials and Methods
2.1. Study Area (Case Study)
2.1.1. Study Area Meteorological Data
2.1.2. Study Area Urban Configuration
2.1.3. Study Area Physical Context
2.2. Spatial Analysis: Space Syntax
2.2.1. Visibility Graph Analysis
- Connectivity analysis, which identifies the number of points that are visually connected to other adjacent spaces;
- Visual integration, which provides a representation of potential core areas in the layout or where the majority of the layout can be seen;
- Through-vision analysis, which shows how visual fields change in a given environment;
- Agent analysis, which identifies movement patterns and the frequent use of spaces released from a single point.
2.2.2. Axial Map
- Connectivity, which is a static local measure of the number of connections that each space has to its immediate neighbours. One of the fundamental concepts of graph theory in mathematics is connectivity. A space with a high connectivity value has many connections to its surroundings, whereas a space with few connections has a low connectivity value [36,41].
- Axial integration, which estimates a space’s access to all other spaces in the urban system by taking into account the total number of direction changes (syntactic steps) of an urban entity [36]. Axial integration and connectivity are inextricably linked. The longer an axial line in an urban area, the more connected it is to other lines and the greater its integration value (and vice versa). The fewer the direction changes of a specific space to all other spaces in the system, the greater its integration and thus its inter-accessibility.
2.3. Thermal Simulation
2.3.1. Thermal Comfort
2.3.2. Thermal Comfort Range
2.3.3. Thermal Modelling
2.4. Questionnaire
3. Results and Discussion
3.1. The Urban Layout Conditions Analysis
3.1.1. Visibility Graphs Analysis
3.1.2. Axial Map
3.2. The Outdoor Thermal Conditions Analysis
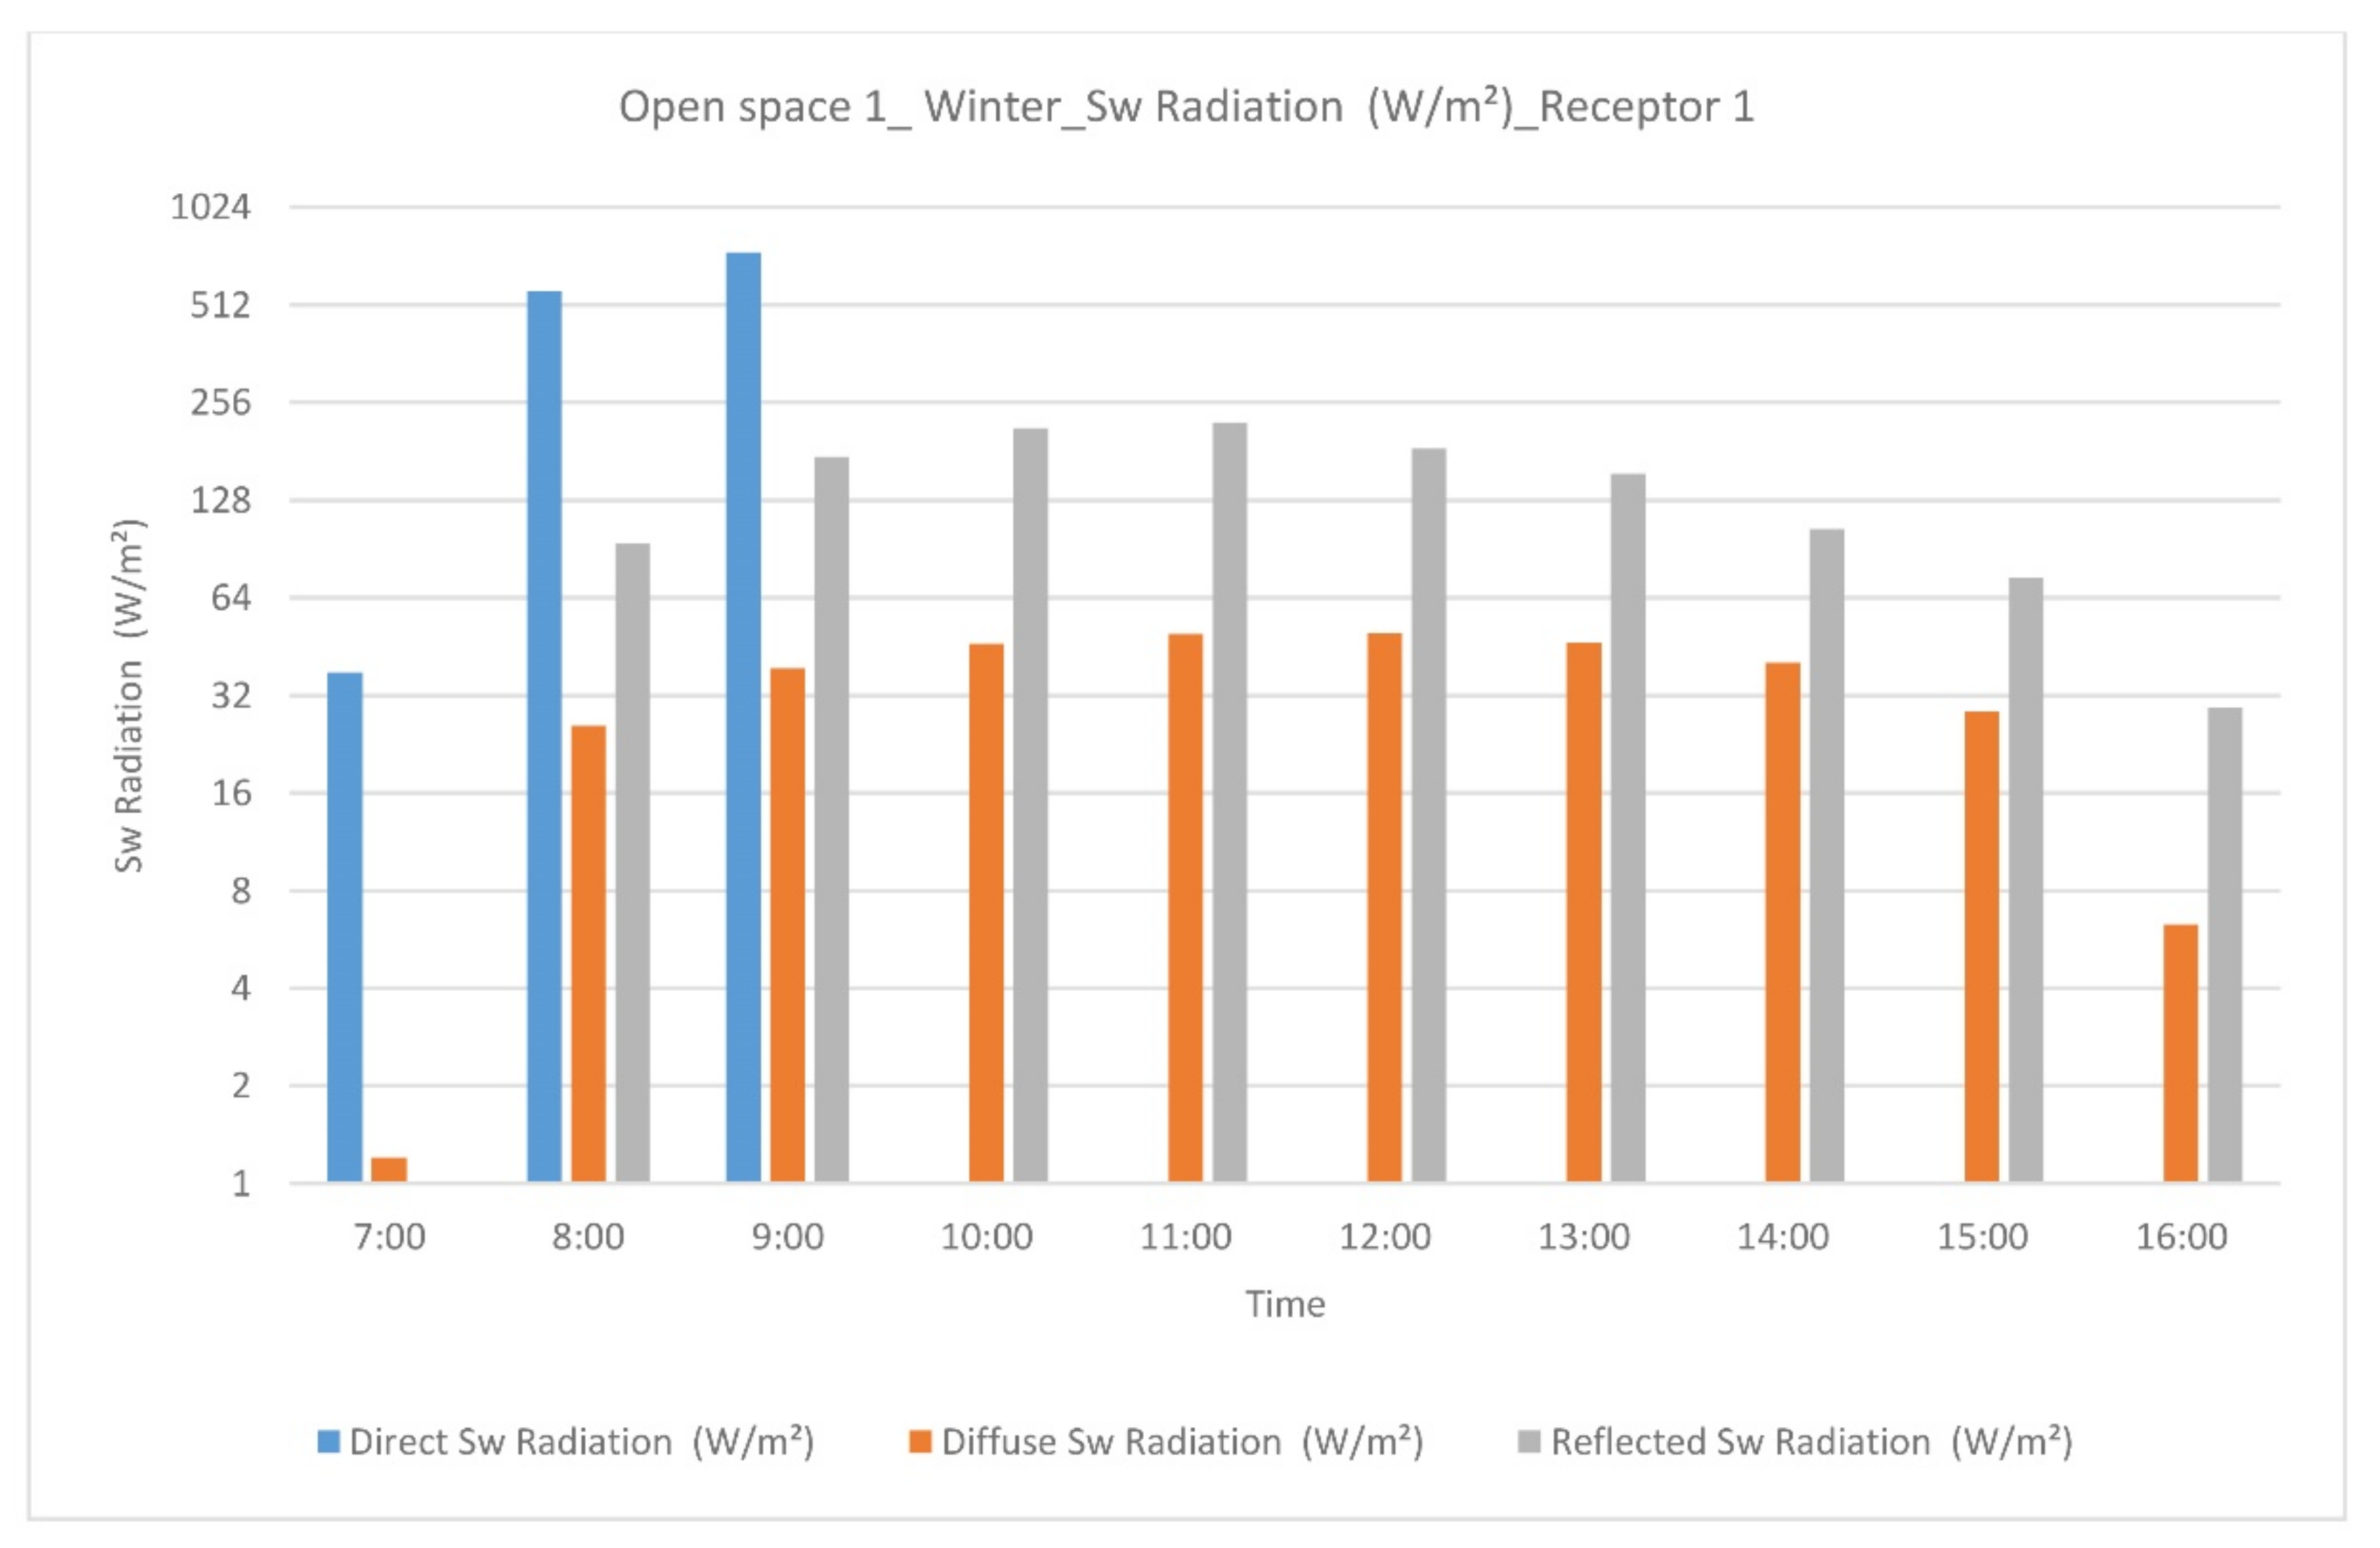
3.2.1. Open Space 1
3.2.2. Open Space 2
3.2.3. Open Space 3
3.3. The Students’ Observation and Behaviour Analysis
3.3.1. The Routine Uses of the Open Spaces
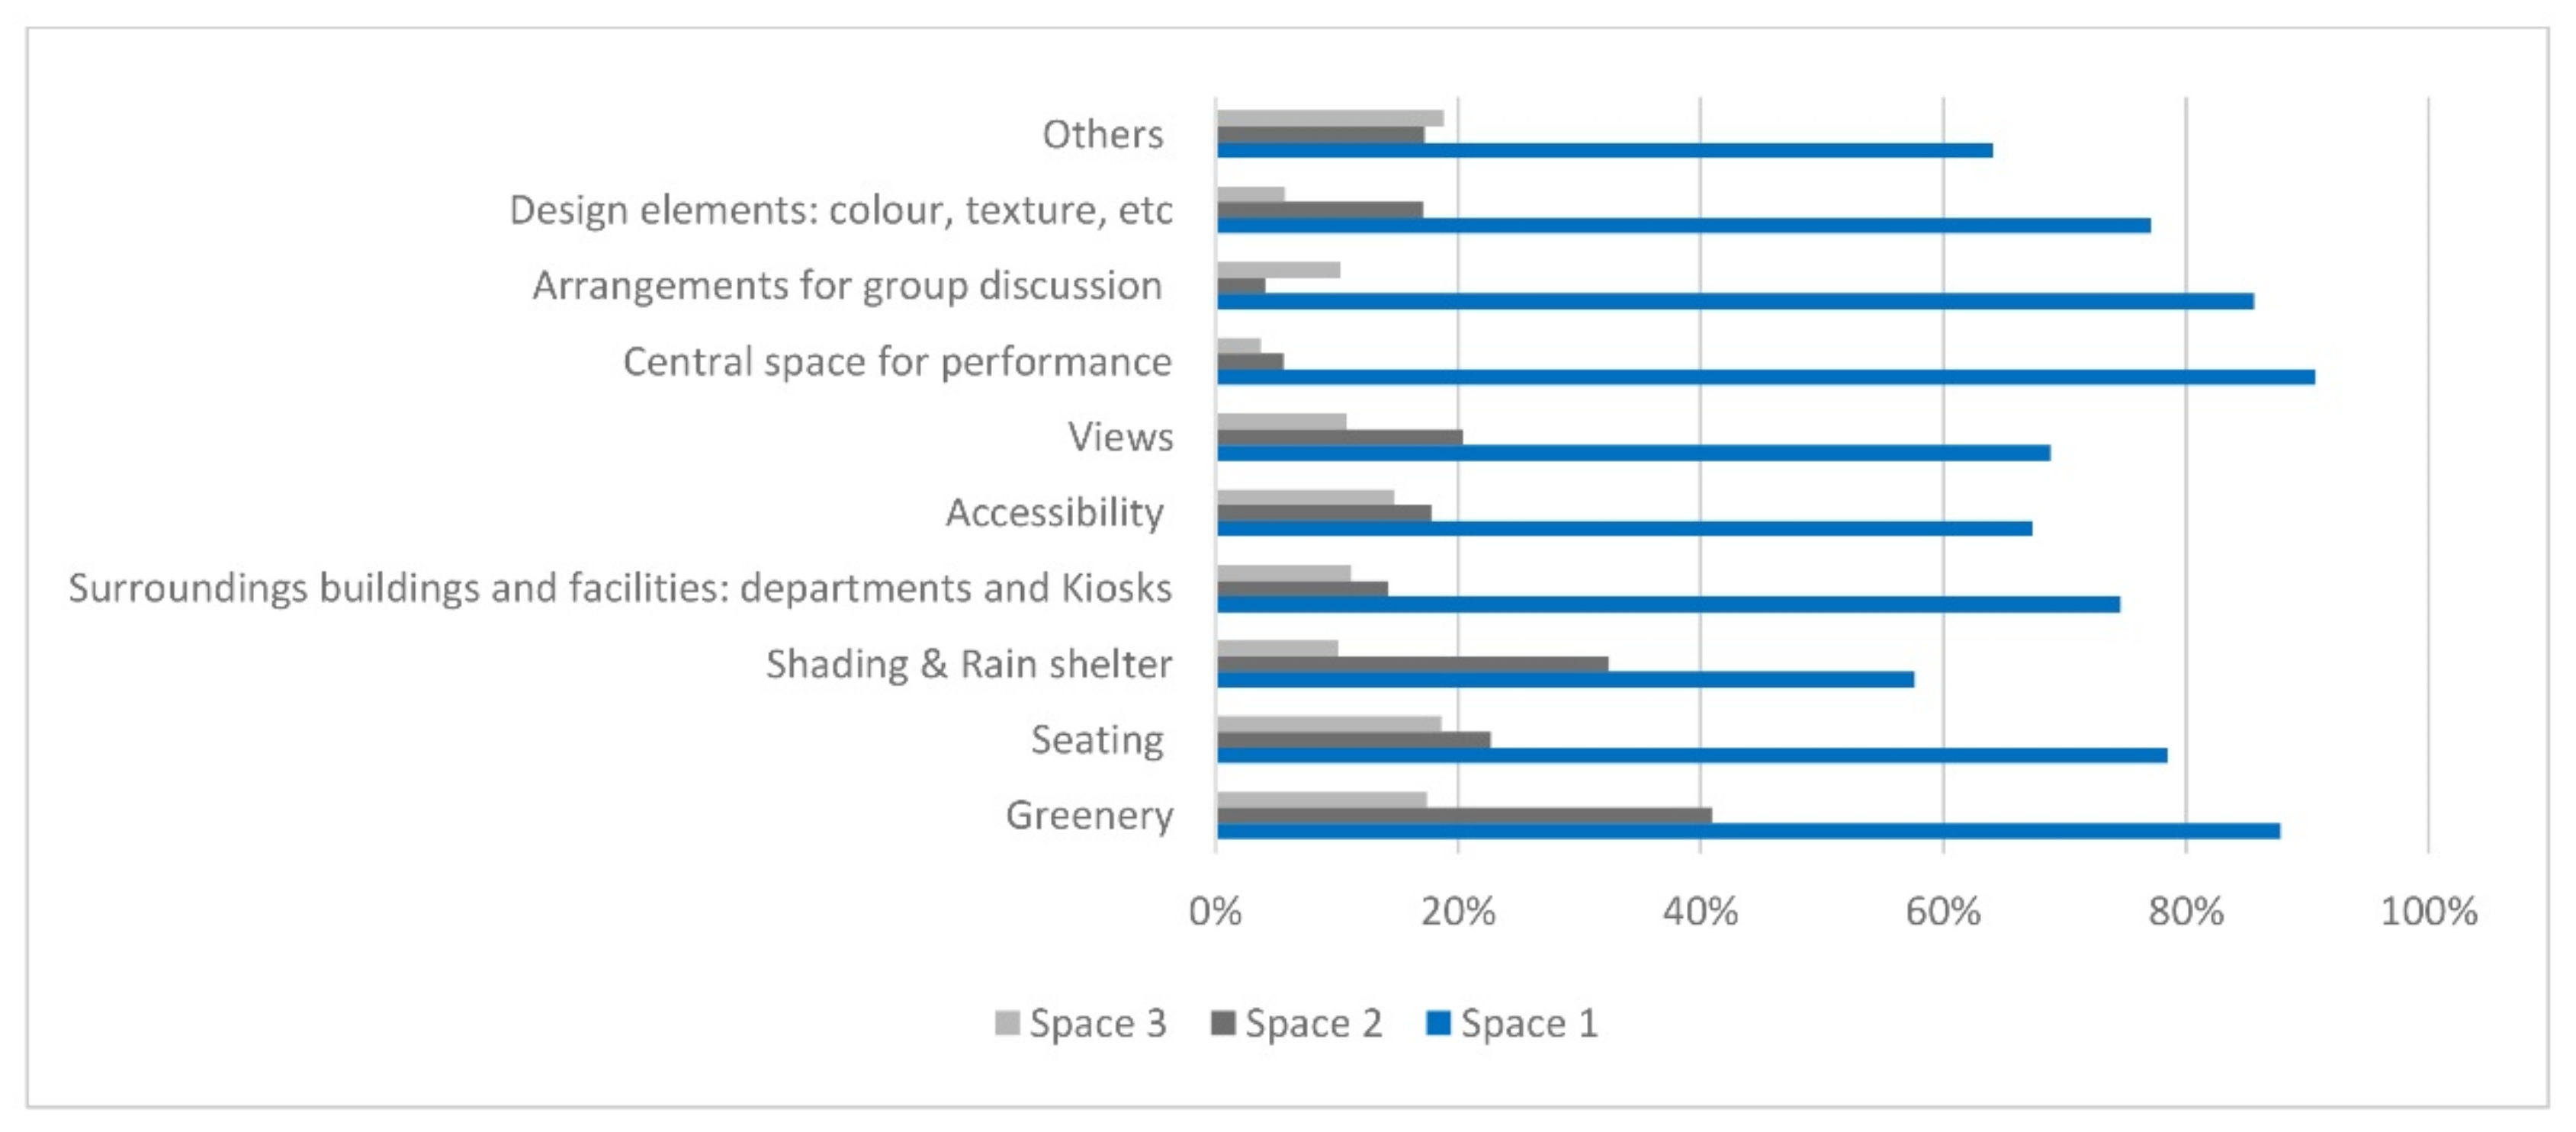
3.3.2. The Attractive Features of the Open Spaces
3.3.3. The Thermal Environment of the Open Spaces
3.4. Overall Findings: Most Comfortable and Favourable Conditions of Outdoor Open Spaces
4. Conclusions
Author Contributions
Funding
Institutional Review Board Statement
Informed Consent Statement
Data Availability Statement
Acknowledgments
Conflicts of Interest
Appendix A
Appendix A.1. Solar Radiation in Open Space 1


Appendix A.2. Solar Radiation in Open Space 2


Appendix B

| Time | Summer (21 June) | Winter (21 December) | Autumn (22 September) | Spring (20 March) | ||||
|---|---|---|---|---|---|---|---|---|
| Ta | Rh | Ta | Rh | Ta | Rh | Ta | Rh | |
| 00:00:00 | 25.2 | 38 | 9.5 | 69 | 22.7 | 64 | 11.9 | 59 |
| 01:00:00 | 24.5 | 41 | 8.6 | 71 | 21.9 | 67 | 11 | 59 |
| 02:00:00 | 23.7 | 41 | 7.5 | 75 | 21 | 70 | 10 | 61 |
| 03:00:00 | 23.3 | 41 | 6.5 | 82 | 20.5 | 67 | 9.5 | 63 |
| 04:00:00 | 23 | 42 | 5.9 | 88 | 20 | 69 | 9 | 64 |
| 05:00:00 | 23 | 42 | 5.4 | 93 | 19.7 | 72 | 8.6 | 69 |
| 06:00:00 | 24 | 39 | 5 | 87 | 20 | 69 | 8.5 | 72 |
| 07:00:00 | 25.5 | 37 | 4.9 | 88 | 21.7 | 61 | 9.3 | 68 |
| 08:00:00 | 27.1 | 34 | 6 | 85 | 23.5 | 54 | 11.1 | 63 |
| 09:00:00 | 28.6 | 31 | 7.3 | 78 | 25.2 | 48 | 11.9 | 59 |
| 10:00:00 | 30.1 | 27 | 8.7 | 66 | 26.8 | 37 | 12.7 | 52 |
| 11:00:00 | 31.4 | 26 | 9.8 | 61 | 28.1 | 35 | 13.2 | 51 |
| 12:00:00 | 32.5 | 25 | 10.6 | 57 | 29.1 | 32 | 14.4 | 47 |
| 13:00:00 | 33.3 | 24 | 11.2 | 57 | 29.8 | 31 | 15 | 45 |
| 14:00:00 | 33.8 | 25 | 11.3 | 55 | 30.1 | 30 | 15.5 | 46 |
| 15:00:00 | 33.9 | 26 | 11 | 56 | 30.2 | 30 | 15.9 | 43 |
| 16:00:00 | 33.7 | 26 | 10.3 | 59 | 29.7 | 30 | 15.9 | 44 |
| 17:00:00 | 33.1 | 27 | 9.2 | 66 | 28.8 | 32 | 15.2 | 46 |
| 18:00:00 | 32.1 | 28 | 8.9 | 68 | 27.6 | 33 | 14.2 | 51 |
| 19:00:00 | 30.9 | 30 | 8.6 | 68 | 26.3 | 35 | 13.6 | 59 |
| 20:00:00 | 29.6 | 35 | 8.3 | 69 | 25.4 | 40 | 13 | 62 |
| 21:00:00 | 28.3 | 36 | 7.9 | 72 | 24.5 | 42 | 12.4 | 66 |
| 22:00:00 | 27 | 38 | 7.6 | 72 | 23.6 | 47 | 11.8 | 69 |
| 23:00:00 | 25.7 | 41 | 7.3 | 74 | 22.6 | 49 | 11.2 | 71 |
Appendix C
| Variable | Questions | p |
|---|---|---|
| The routine uses of the open spaces | ||
| How much time do you spend in university on a daily basis? | How important is the use of courtyards for you? | 0.126 (>0.05) |
| Which open space do you prefer in the university campus? | 0.000 (<0.05) | |
| How often do you visit or spend time in the open spaces on campus? | 0.000 (<0.05) | |
| How long do you usually stay at this place? | 0.020 (<0.05) | |
| When do you spend time in the open spaces on campus? | 0.004 (<0.05) | |
| Which open space do you prefer in the university campus? | Faculty/location of the open space | 0.000 (<0.05) |
| How satisfied are you with the temperatures in the open space that you spend the most time in? | 0.356 (>0.05) | |
| The attractive features of the open spaces | ||
| When you are in this place, how crowded do you find it to be? | How satisfied are you with the temperatures in the open space in which you spend the most time? | 0.640 (>0.05) |
| In warm/hot weather, how you describe the temperatures in the open space? | 0.023 (<0.05) | |
| In cool/cold weather, how you describe the temperatures in the open space? | 0.057 (>0.05) | |
| The routine uses of the open spaces | ||
| Which open space do you prefer in the university campus? | The attractive features of the open spaces | |
| Student needs | ||
| Attending activities occurring in the open space | 0.102 (>0.05) | |
| Physical features | ||
| Greenery | 0.00 (<0.05) | |
| Seating | 0.002 (<0.05) | |
| Shading and rain shelter | 0.056 (>0.05) | |
| Surrounding buildings and facilities (departments, kiosks) | 0.556 (>0.05) | |
| Accessibility | 0.012 (<0.05) | |
| Views | 0.610 (>0.05) | |
| Central space for performance | 0.443 (>0.05) | |
| Arrangements for group discussion | 0.815 (>0.05) | |
| Design elements (colour, texture, etc.) | 0.766 (>0.05) | |
| Others | 0.458 (>0.05) | |
| What would you describe as the source of this discomfort? | ||
| Humidity too high (damp) | 0.014 (<0.05) | |
| Humidity too low (dry) | 0.194 (>0.05) | |
| Air movement too high (windy) | 0.708 (>0.05) | |
| Air movement too low (stuffy) | 0.493 (>0.05) | |
| Direct solar radiation | 0.696 (>0.05) | |
| Hot/cold surrounding surfaces | 0.605 (>0.05) | |
| Noise | 0.605 (>0.05) | |
| The comfort features of the open spaces | ||
| How satisfied are you with the temperatures in the open space in which you spend the most time? | Physical features | |
| Greenery | 0.00 (<0.05) | |
| Seating | 0.002 (<0.05) | |
| Shading and rain shelter | 0.065 (>0.05) | |
| Surrounding buildings and facilities (departments, kiosks) | 0.00 (<0.05) | |
| Accessibility | 0.030 (<0.05) | |
| Views | 0.019 (<0.05) | |
| Central space for performance | 0.014 (<0.05) | |
| Arrangements for group discussion | 0.025 (<0.05) | |
| Design elements (colour, texture, etc.) | 0.005 (<0.05) | |
| Others | 0.224 (>0.05) |
| Dimension | Category | Questions | Answers | Response (%) |
|---|---|---|---|---|
| The routine uses of the open spaces | Experiences in open spaces | How much time do you spend in university on a daily basis? | <2 h | 6 |
| 2–3 h | 8.8 | |||
| 4–5 h | 41.7 | |||
| 6–7 h | 43.5 | |||
| How important is the use of courtyards for you? | Not very important | 0.9 | ||
| Not important | 3 | |||
| Neutral | 13.1 | |||
| Important | 24.1 | |||
| Very important | 58.9 | |||
| Which open space do you prefer in the university campus? | Open space (1) | 66.7 | ||
| Open space (2) | 17.5 | |||
| Open space (3) | 15.8 | |||
| Frequency | How often do you visit or spend time in the open spaces on campus? | Daily | 69 | |
| Once every 2–3 days | 24.4 | |||
| Once per week | 6.6 | |||
| Never | 0 | |||
| If you spend time in the university’s open spaces, answer the following questions. When do you spend time in the open spaces on campus? | Morning (before 11:00) | 17.3 | ||
| Midday (11:00–14:00) | 67.9 | |||
| Afternoon (14:00–17:00) | 14.8 | |||
| How long do you usually stay in this place? | Less than 30 min. | 18.2 | ||
| 30 min–1 h | 47 | |||
| 1–2 h | 25.3 | |||
| More than 2 h | 9.5 | |||
| The attractive features of the open spaces | Student needs | Why do you spend time in this place? * | Socialising | 84.2 |
| Eating and drinking | 77.4 | |||
| Relaxing | 64.3 | |||
| Studying | 29.5 | |||
| Exercising/walking | 29.8 | |||
| Attending activities occurring in the open space | 37.8 | |||
| Other | 17.9 | |||
| When you are in this place, how crowded do you find it to be? | The space is empty most of the time | 8.1 | ||
| The space is partially crowded most of the time | 58.3 | |||
| The space is crowded most of the time | 33.6 | |||
| Physical features | What physical features in this place do you consider attractive? * | Greenery | 34.2 | |
| Seating | 51.2 | |||
| Shading and rain shelter | 41.4 | |||
| Surrounding buildings and facilities (departments, kiosks) | 39.9 | |||
| Accessibility | 38.4 | |||
| Views | 27.7 | |||
| Central space for performance | 16.1 | |||
| Arrangements for group discussion | 28.9 | |||
| Design elements (colour, texture, etc.) | 10.4 | |||
| Others | 19 | |||
| The comfortable features of the open spaces | Thermal satisfaction | How satisfied are you with the temperatures in the open space in which you spend the most time? | 1 (Very dissatisfied) | 5.7 |
| 2 | 6.8 | |||
| 3 | 15.2 | |||
| 4 | 29.2 | |||
| 5 | 24.1 | |||
| 6 | 11.9 | |||
| 7 (Very satisfied) | 7.1 | |||
| When do you feel most unsatisfied in the open space? * | Morning (before 11:00) | 12.2 | ||
| Midday (11:00–14:00) | 61.6 | |||
| Afternoon (14:00–17:00) | 32.7 | |||
| Not found | 14.6 | |||
| In warm/hot weather, how you describe the temperatures in the open space? | Always too hot | 21.4 | ||
| Often too hot | 31.8 | |||
| Occasionally too hot | 29.5 | |||
| Neutral | 15.8 | |||
| Occasionally too cold | 0.3 | |||
| Often too cold | 1.2 | |||
| Always too cold | 0 | |||
| In cool/cold weather, how you describe the temperatures in the open space? | Always too hot | 2.7 | ||
| Often too hot | 1.5 | |||
| Occasionally too hot | 2.9 | |||
| Neutral | 15.2 | |||
| Occasionally too cold | 24.1 | |||
| Often too cold | 34.8 | |||
| Always too cold | 18.8 | |||
| What would you describe as the source of this discomfort? * | Humidity too high (damp) | 9.5 | ||
| Humidity too low (dry) | 9.5 | |||
| Air movement too high (windy) | 29.5 | |||
| Air movement too low (stuffy) | 11.6 | |||
| Direct solar radiation | 49.4 | |||
| Hot/cold surrounding surfaces | 20.5 | |||
| Noise | 26.5 | |||
| Others | 20.5 |
References
- Scholl, K.; Gulwadi, G.B. Recognizing campus landscapes as learning spaces. J. Learn. Spaces 2015, 4, 53–60. [Google Scholar]
- Alnusairat, S.; Al-Shatnawi, Z.; Kakani, A. Towards an Integrated Sustainable University Campus: The Social Pillar–Case of Al-Ahliyya Amman University Jordan. In Proceedings of the 35th PLEA International Conference: Planning Post Carbon Cities, Coruna, Spain, 1–3 September 2020; Volume 3, pp. 1513–1518. [Google Scholar]
- Rached, I.; Elsharkawy, H. The Role of Open Spaces in the University Campus in the Egyptian Context. In Proceedings of the Designing Place—International Urban Design Conference, Nottingham, UK, 2–3 April 2012; pp. 1–15. [Google Scholar]
- Hanan, H. Open Space as meaningful place for students in ITB campus. Procedia Soc. Behav. Sci. 2013, 85, 308–317. [Google Scholar] [CrossRef] [Green Version]
- Tudorie, C.; Vallés-Planells, M.; Gielen, E.; Arroyo, R.; Galiana, F. Towards a greener university: Perceptions of landscape services in campus open space. Sustainability 2020, 12, 6047. [Google Scholar] [CrossRef]
- Farag, A.A.; Badawi, S.R.; Doheim, R.M. Assessment of user happiness in campus open spaces. J. Public Space 2019, 4, 45–64. [Google Scholar] [CrossRef]
- Wilson, T. Design Guidelines for Activating Outdoor Spaces of University Campuses; California Polytechnic State University: San Luis Obispo, CA, USA, 2018. [Google Scholar]
- Becki, B.; Taskan, G.; Bogenç, Ç. The effect of courtyard designs on young people, which have been made according to different functional preferences: Barti university (Turkey). J. Food Agric. Environ. 2013, 11, 1804–1813. [Google Scholar]
- Mt Akhir, N.; Sakip, S.R.; Abbas, M.Y.; Othman, N. A Taste of spatial character: Quality outdoor space in campus landscape leisure setting. Environ. Behav. Proc. J. 2017, 2, 65. [Google Scholar] [CrossRef] [Green Version]
- Bogerd, N.V.D.; Dijkstra, S.C.; Koole, S.L.; Seidell, J.C.; Vries, R.D.; Maas, J. Nature in the indoor and outdoor study environment and secondary and tertiary education students’ well-being, academic outcomes, and possible mediating pathways: A systematic review with recommendations for science and practice. Health Place 2020, 66, 102403. [Google Scholar] [CrossRef]
- Thompson, C.W.; de Oliveira, S.E.M. Evidence on Health Benefits of Urban Green Spaces. In Urban Green Spaces and Health: A Review of Evidence; Egorov, A., Mudu, P., Braubach, M., Martuzzi, M., Eds.; World Health Organisation Regional Office for Europe: Copenhagen, Denmark, 2016; pp. 3–20. [Google Scholar]
- Pope, D.; Tisdall, R.; Middleton, J.; Verma, A.; Van Ameijden, E.; Birt, C.; Bruce, N.G. Quality of and access to green space in relation to psychological distress: Results from a population- based cross-sectional study as part of the EURO-URHIS 2 project. Eur. J. Public Health 2018, 28, 35–38. [Google Scholar] [CrossRef] [PubMed] [Green Version]
- Dadvand, P.; Nieuwenhuijsen, M.J.; Esnaola, M.; Forns, J.; Basagana, X.; Alvarez- Pedrerol, M.; Rivas, I.; Lopez-Vicente, M.; De Castro Pascual, M.; Su, J.; et al. Green spaces and cognitive development in primary schoolchildren. Proc. Natl. Acad. Sci. USA 2015, 112, 7937–7942. [Google Scholar] [CrossRef] [PubMed] [Green Version]
- Zacharias, J.; Stathopoulos, T.; Wu, H. Spatial behavior in San Francisco’s plazas: The effects of microclimate, other people, and environmental design. Environ. Behav. 2004, 36, 638–658. [Google Scholar] [CrossRef]
- Aydin, D.; Ter, U. Outdoor Space quality: Case study of a university campus plaza Dicle Aydin and Ummugulsum Ter. Archnet-IJAR. Int. J. Archit. Res. 2008, 2, 189–203. [Google Scholar]
- American Planning Association (APA). Characteristics and Guidelines of Great Public Spaces. 2014. Available online: https://www.planning.org/greatplaces/ (accessed on 28 June 2021).
- Capelli, M.; Conserva, F. The Environmental Sustainability at the Time of COVID-19 Pandemy: A Holistic Approach through LEED ® v4 BD+C Rating System. 2020. Available online: https://www.researchgate.net/publication/341103541_The_environmental_sustainability_at_the_time_of_COVID-19_pandemy_an_holistic_approach_through_LEED_R_v4_BDC_rating_system (accessed on 28 June 2021). [CrossRef]
- Özkan, D.G.; Alpak, E.M.; Var, M. Design and construction process in campus open spaces: A case study of Karadeniz Technical University. Urban Des. Int. 2017, 22, 236–252. [Google Scholar] [CrossRef]
- Meeder, M.; Aebi, T.; Weidmann, U. The influence of slope on walking activity and the pedestrian modal share. Transp. Res. Procedia 2017, 27, 141–147. [Google Scholar] [CrossRef]
- Carmona, M. Principles for public space design, planning to do better. Urban Des. Int. 2019, 24, 47–59. [Google Scholar] [CrossRef] [Green Version]
- Deasy, C.M.; Lasswell, T. Designing Places for People; Whitney Library of Design: New York, NY, USA, 1985. [Google Scholar]
- Sun, G.; Haining, R.; Lin, H.; Oreskovic, N.; He, J. Comparing the perception with the reality of walking in a hilly environment: An accessibility method applied to a University campus in Hong Kong. Geospat. Health 2015, 10, 32–39. [Google Scholar] [CrossRef] [PubMed] [Green Version]
- Chen, L.; Ng, E. Outdoor thermal comfort and outdoor activities: A review of research in the past decade. Cities 2012, 29, 118–125. [Google Scholar] [CrossRef]
- Aruninta, A.; Kurazumi, Y.; Fukagawa, K.; Ishii, J. The integration of human thermal comfort in an outdoor campus landscape in a tropical climate. Int. J. 2018, 14, 26–32. [Google Scholar] [CrossRef]
- Elnabawi, M.; Hamza, N.; Dudek, S. Thermal perception of outdoor urban spaces in the hot arid region of Cairo, Egypt. Sustain. Cities Soc. 2016, 22, 136–145. [Google Scholar] [CrossRef]
- Nikolopoulou, M.; Baker, N.; Steemers, K. Thermal comfort in outdoor urban spaces: Understanding the human parameter. Sol. Energy 2001, 70, 227–235. [Google Scholar] [CrossRef]
- Elgheznawy, D.; Eltarabily, S. The impact of sun sail-shading strategy on the thermal comfort in school courtyards. Build. Environ. 2021, 202, 108046. [Google Scholar] [CrossRef]
- Abdallah, A.; Hussein, S.; Nayel, M. The impact of outdoor shading strategies on student thermal comfort in open spaces between education building. Sustain. Cities Soc. 2020, 58, 102124. [Google Scholar] [CrossRef]
- Soares, R.; Corvacho, H.; Alves, F. Summer Thermal Conditions in Outdoor Public Spaces: A Case Study in a Mediterranean Climate. Sustainability 2021, 13, 5348. [Google Scholar] [CrossRef]
- Al-Shatnawi, Z.; Alnusairat, S.; Kakani, A. Towards zero solid waste in Jordanian universities: The case of Al-Ahliyya Amman University. Environ. Res. Eng. Manag. 2020, 76, 46–59. [Google Scholar] [CrossRef]
- Peel, M.; Finlayson, B.; McMahon, T. Updated world map of the Köppen-Geiger climate classification. Hydrol. Earth Syst. Sci. 2007, 11, 1633–1644. [Google Scholar] [CrossRef] [Green Version]
- Ayyad, Y.; Sharples, S. Envi-MET Validation and Sensitivity Analysis Using Field Measurements in a Hot Arid Climate. In IOP Conference Series: Earth and Environmental Science; IOP Publishing: Bristol, UK, 2019; p. 012040. [Google Scholar]
- Hillier, B. Space is the Machine: A Configurational Theory of Architecture; Cambridge University Press: Cambridge, UK, 1984. [Google Scholar]
- Turner, A. Depthmap 4: A Researcher’s Handbook; University College London: London, UK, 2004. [Google Scholar]
- Turner, A.; Doxa, M.; O’sullivan, D.; Penn, A. From isovists to visibility graphs: A methodology for the analysis of architectural space. Environ. Plan. B Plan. Des. 2001, 28, 103–121. [Google Scholar] [CrossRef] [Green Version]
- Hillier, B.; Hanson, J. The Social Logic of Space; Cambridge University Press: Cambridge, UK, 1989. [Google Scholar]
- Benedikt, M.L. To take hold of space: Isovists and isovist fields. Environ. Plan. B Plan. Des. 1979, 6, 47–65. [Google Scholar] [CrossRef]
- Theil, P. A sequence experience notation for architectural and urban space. Town Plan. Rev. 1961, 32, 33–52. [Google Scholar] [CrossRef]
- Turner, A. Depthmap: A program to perform visibility graph analysis. In Proceedings of the 3rd International Symposium on Space Syntax, Atlanta, GA, USA, 7–11 May 2001; Volume 31, pp. 12–31. [Google Scholar]
- Varoudis, T. DepthmapX- Open Source Multi-Platform Spatial Network Analysis Software, Version 0.30. 2012. Available online: http://varoudis.github.io/depthmapX/ (accessed on 20 July 2021).
- Klarqvist, B. A space syntax glossary. Nord. Arkit. 1993, 2, 11–12. [Google Scholar]
- Höppe, P. The physiological equivalent temperature–a universal index for the biometeorological assessment of the thermal environment. Int. J. Biometeorol. 1999, 43, 71–75. [Google Scholar] [CrossRef]
- Matzarakis, A.; Amelung, B. Physiological equivalent temperature as indicator for impacts of climate change on thermal comfort of humans. Adv. Glob. Chang. 2008, 30, 161–172. [Google Scholar]
- Matzarakis, A.; Mayer, H.; Iziomon, M.G. Applications of a universal thermal index: Physiological equivalent temperature. Int. J. Biometeorol. 1999, 43, 76–84. [Google Scholar] [CrossRef] [PubMed]
- Gulyás, Á.; Matzarakis, A. Seasonal and spatial distribution of physiologically equivalent temperature (PET) index in Hungary. Q. J. Hung. Meteorol. Serv. 2019, 113, 221–231. [Google Scholar]
- Bruse, M. Bleeding Edge: Envi-MET Oveview. 2004. Available online: http://www.envi-met.net/documents/papers/overview30.pdf (accessed on 23 August 2021).
- Song, B.; Park, K.-H.; Jung, S.-G. Validation of ENVI-met Model within Situ Measurements Considering Spatial Characteristics of Land Use Types. J. Korean Assoc. Geogr. Inf. Stud. 2014, 17, 156–172. [Google Scholar]
- De Dear, R.; Brager, G. Developing an adaptive model of thermal comfort and preference. ASHRAE Trans. 1998, 104, 1–18. [Google Scholar]
- Wohlwill, J. Human adaptation to levels of environmental stimulation. J. Hum. Ecol. 1974, 2, 127–147. [Google Scholar] [CrossRef]
- Ruiz, M.; Correa, E. Adaptive model for outdoor thermal comfort assessment in an Oasis city of arid climate. Build. Environ. 2015, 85, 40–51. [Google Scholar] [CrossRef]
- Kruger, E.; Drach, P.; Emmanuel, R.; Corbella, O. Assessment of daytime outdoor comfort levels in and outside the urban area of Glasgow, UK. Int. J. Biometeorol. 2012, 57, 521–533. [Google Scholar] [CrossRef] [PubMed]
- Lin, T.; Matzarakis, A. Tourism climate and thermal comfort in Sun Moon Lake, Taiwan. Int. J. Biometeorol. 2008, 52, 281–290. [Google Scholar] [CrossRef]
- Canan, F.; Golasi, I.; Ciancio, V.; Coppi, M.; Salata, F. Outdoor thermal comfort conditions during summer in a cold semi-arid climate. A Transversal Field Surv. Cent. Anatolia Build. Environ. 2019, 148, 212–224. [Google Scholar]
- Faragallah, R.N. The impact of productive open spaces on urban sustainability: The case of El Mansheya Square–Alexandria. Alex. Eng. J. 2018, 57, 3969–3976. [Google Scholar] [CrossRef]
- Lau, S.S.Y.; Gou, Z.; Liu, Y. Healthy campus by open space design: Approaches and guidelines. Front. Archit. Res. 2014, 3, 452–467. [Google Scholar] [CrossRef] [Green Version]
- Makvandi, M.; Zhou, X.; Li, C.; Deng, Q. A Field Investigation on Adaptive Thermal Comfort in an Urban Environment Considering Individuals’ Psychological and Physiological Behaviors in a Cold-Winter of Wuhan. Sustainability 2021, 13, 678. [Google Scholar] [CrossRef]
- Lopes, H.S.; Remoaldo, P.C.; Ribeiro, V.; Martín-Vide, J. Perceptions of human thermal comfort in an urban tourism destination–A case study of Porto (Portugal). Build. Environ. 2021, 205, 108246. [Google Scholar] [CrossRef]
- Sabrin, S.; Karimi, M.; Nazari, R.; Pratt, J.; Bryk, J. Effects of Different Urban-Vegetation Morphology on the Canopy-level Thermal Comfort and the Cooling Benefits of Shade Trees: Case-study in Philadelphia. Sustain. Cities Soc. 2021, 66, 102684. [Google Scholar] [CrossRef]
- Yilmaz, S.; Ertem Mutlu, B.; Aksu, A.; Mutlu, E.; Al-ameri, A.Q. Street design scenarios using vegetation for sustainable thermal comfort in Erzurum, Turkey. Environ. Sci. Pollut. Res. 2021, 28, 3672–3693. [Google Scholar] [CrossRef] [PubMed]
- Rosso, F.; Franco, S. Environmental, social and economic sustainability in urban areas: A cool materials’ perspective. Tema-J. Land Use Mobil. Environ. 2021, 14, 293–298. [Google Scholar] [CrossRef]


| Elements | Features Affecting Students’ Experience of Outdoor Open Spaces in Universities | Studies |
|---|---|---|
| The urban layout and physical features | Natural landscape. | [1] |
| Physical features: the functions, activities, uses, and location relevant to the whole site. | [3] | |
| Setting and design of open spaces. | [6] | |
| Physical environment that encourages learning and development (use of various design attributes). | [7] | |
| Use of bicycle, walkability. | [17] | |
| Spatial organization. | [18] | |
| Effect of slope: a 1% increase in slope makes a walk roughly 10% less attractive / slopes have a strong detrimental impact on the attraction of walking. | [19] | |
| The students’ needs, perception, and behaviour | Flexibility of use, visual attraction. | [4] |
| Users’ age: young people. | [8] | |
| Preferences and usage during students’ leisure time. Preferences of character and spatial landscape. | [9] | |
| User characteristics. | [15] | |
| Personality of users. | [16] | |
| Users’ needs: physiological, security, belonging, esteem, self-actualization, intellectual. | [18] | |
| Users’ needs: social, cultural, and ideological dimensions. | [20] | |
| Friendship. | [21] | |
| Perception of pedestrians of the presences and the steepness of space. | [22] | |
| The thermal conditions | The effects of microclimate. | [14] |
| The thermal comfort. | [23] | |
| The meteorological conditions. | [24] | |
| Thermal perception of outdoor urban spaces. | [25] | |
| Thermal comfort of outdoor urban spaces. | [26] | |
| The impact of a sun sail-shading strategy on the thermal comfort. | [27] | |
| The impact of outdoor shading strategies on student thermal comfort. | [28] | |
| Thermal conditions in outdoor public spaces. | [29] |
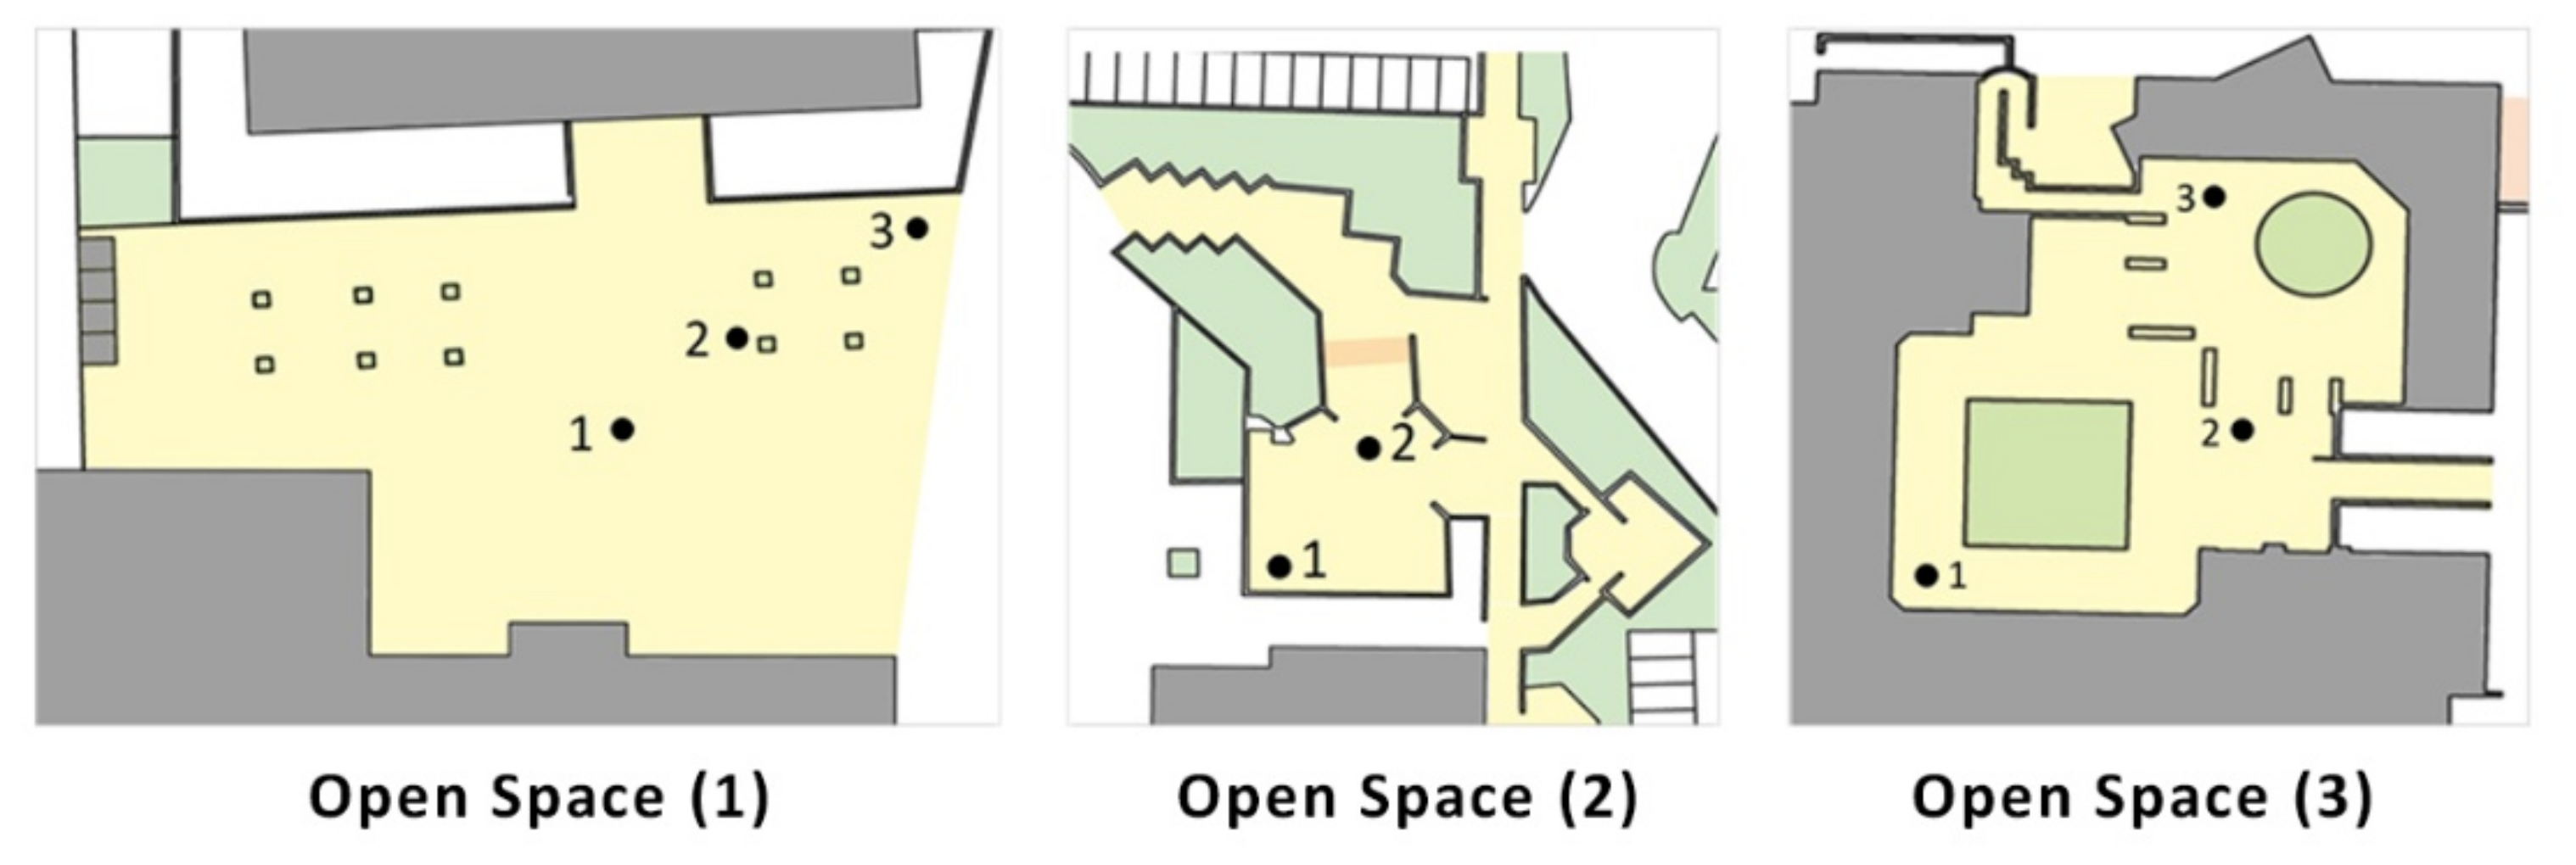
| Site | Open Space 1 | Open Space 2 | Open Space 3 |
|---|---|---|---|
| Area (m²) | 1680 | 4375 | 645 |
| Spatial configuration | Open area with low level of enclosure | Clustered gathering spaces along an axial path | Enclosed courtyard |
| Shaded area (m²) | 140 | 355 | - |
| Access | Architecture and design faculty Engineering faculty Student parking | Main university entrance IT faculty Law faculty Staff parking | Pharmacy faculty Allied medical sciences faculty Staff parking |
| Surrounding buildings and services | Architecture and design faculty Engineering faculty Student parking | IT faculty Law faculty | Pharmacy faculty |
| Vegetation cover area (m2) | 10 | 1725 | 115 |
| Seating length (m) | 50 | 65 | 15 |
| Universal PET | Modified PET | Thermal Perception | Grade of Physiological Stress |
|---|---|---|---|
| <4 | <6 | Very cold | Extreme cold stress |
| 4 to 8 | 6 to 11.2 | Cold | Strong cold stress |
| 8 to 13 | 11.2 to 16.5 | Cool | Moderate cold stress |
| 13 to 18 | 16.5 to 21.6 | Slightly cool | Slight cold stress |
| 18 to 23 | 21.6 to 32 | Comfortable | No thermal stress |
| 23 to 29 | 32 to 37 | Slightly warm | Slight heat stress |
| 29 to 35 | 37 to 42 | Warm | Moderate heat stress |
| 32 to 41 | 42 to 47 | Hot | Strong heat stress |
| >41 | >41 | Very hot | Extreme heat stress |
| Dimension | Category | Questions |
|---|---|---|
| The student profile | Socio-demographic | Faculty |
| Gender | ||
| Level of study | ||
| The routine uses of the open spaces | Experiences in open spaces | How much time do you spend in university on a daily basis? |
| How important is the use of courtyards for you? | ||
| Which open space do you prefer in the university campus? | ||
| Frequency | How often do you visit or spend time in the open spaces on campus? | |
| If you spend time in the university’s open spaces, answer the following questions. When do you spend time in the open spaces on campus? | ||
| How long do you usually stay in this place? | ||
| The attractive features of the open spaces | Student needs | Why do you spend time in this place? |
| When you are in this place, how crowded do you find it to be? | ||
| Physical features | What physical features in this place do you consider attractive? | |
| The comfort features of the open spaces | Thermal satisfaction | How satisfied are you with the temperatures in the open space in which you spend the most time? |
| When do you feel most unsatisfied in the open space? | ||
| In warm/hot weather, how would you describe the temperatures in the open space? | ||
| In cool/cold weather, how would you describe the temperatures in the open space? | ||
| What would you describe as the source of this discomfort? |
| Area | Visibility Graph Analysis | Axial Map Analysis | ||
|---|---|---|---|---|
| Connectivity | Integration | Connectivity | Integration | |
| Open space 1 | High/moderate | High | High | Moderate |
| Open space 2 | Moderate/low | High/moderate | High in axial path Low in clustered spaces | High in axial path Low in clustered spaces |
| Open space 3 | Low | Moderate | Low | Moderate |
| Area | Seasons | Summer | Winter | Autumn | Spring | ||||||||
|---|---|---|---|---|---|---|---|---|---|---|---|---|---|
| Receptors Number | 1 | 2 | 3 | 1 | 2 | 3 | 1 | 2 | 3 | 1 | 2 | 3 | |
| Open space 1 | Usage hours | 0 | 0 | 0 | 0 | 1 | 0 | 3 | 3 | 5 | 0 | 4 | 0 |
| Out of usage hours | 6 | 6 | 8 | 0 | 0 | 0 | 0 | 0 | 0 | 1 | 1 | 0 | |
| Open space 2 | Usage hours | 0 | 2 | - | 0 | 3 | - | 2 | 1 | - | 7 | 3 | - |
| Out of usage hours | 7 | 6 | - | 0 | 0 | - | 1 | 0 | - | 0 | 0 | - | |
| Open space 3 | Usage hours | 0 | 2 | 2 | 0 | 0 | 1 | 9 | 6 | 9 | 0 | 1 | 0 |
| Out of usage hours | 7 | 7 | 9 | 0 | 0 | 0 | 0 | 0 | 0 | 1 | 1 | 0 | |
| Area | The Routine Uses of the Open Spaces | The Attractive Features of the Open Spaces | The Thermal Comfort of the Open Spaces |
|---|---|---|---|
| Open space 1 | 70.8% | 65.8% | 66.4% |
| Open space 2 | 16.7% | 21.7% | 17.5% |
| Open space 3 | 12.5% | 12.6% | 16.1% |
Publisher’s Note: MDPI stays neutral with regard to jurisdictional claims in published maps and institutional affiliations. |
© 2021 by the authors. Licensee MDPI, Basel, Switzerland. This article is an open access article distributed under the terms and conditions of the Creative Commons Attribution (CC BY) license (https://creativecommons.org/licenses/by/4.0/).
Share and Cite
Alnusairat, S.; Ayyad, Y.; Al-Shatnawi, Z. Towards Meaningful University Space: Perceptions of the Quality of Open Spaces for Students. Buildings 2021, 11, 556. https://doi.org/10.3390/buildings11110556
Alnusairat S, Ayyad Y, Al-Shatnawi Z. Towards Meaningful University Space: Perceptions of the Quality of Open Spaces for Students. Buildings. 2021; 11(11):556. https://doi.org/10.3390/buildings11110556
Chicago/Turabian StyleAlnusairat, Saba, Yara Ayyad, and Zahra Al-Shatnawi. 2021. "Towards Meaningful University Space: Perceptions of the Quality of Open Spaces for Students" Buildings 11, no. 11: 556. https://doi.org/10.3390/buildings11110556