
On the Use of Perforated Sound Absorption Systems for Variable Acoustics Room Design

 , ,
, , 

Abstract
:1. Introduction
2. Concept Description
3. Sound Absorption Evaluation
4. Auditorium Simulation
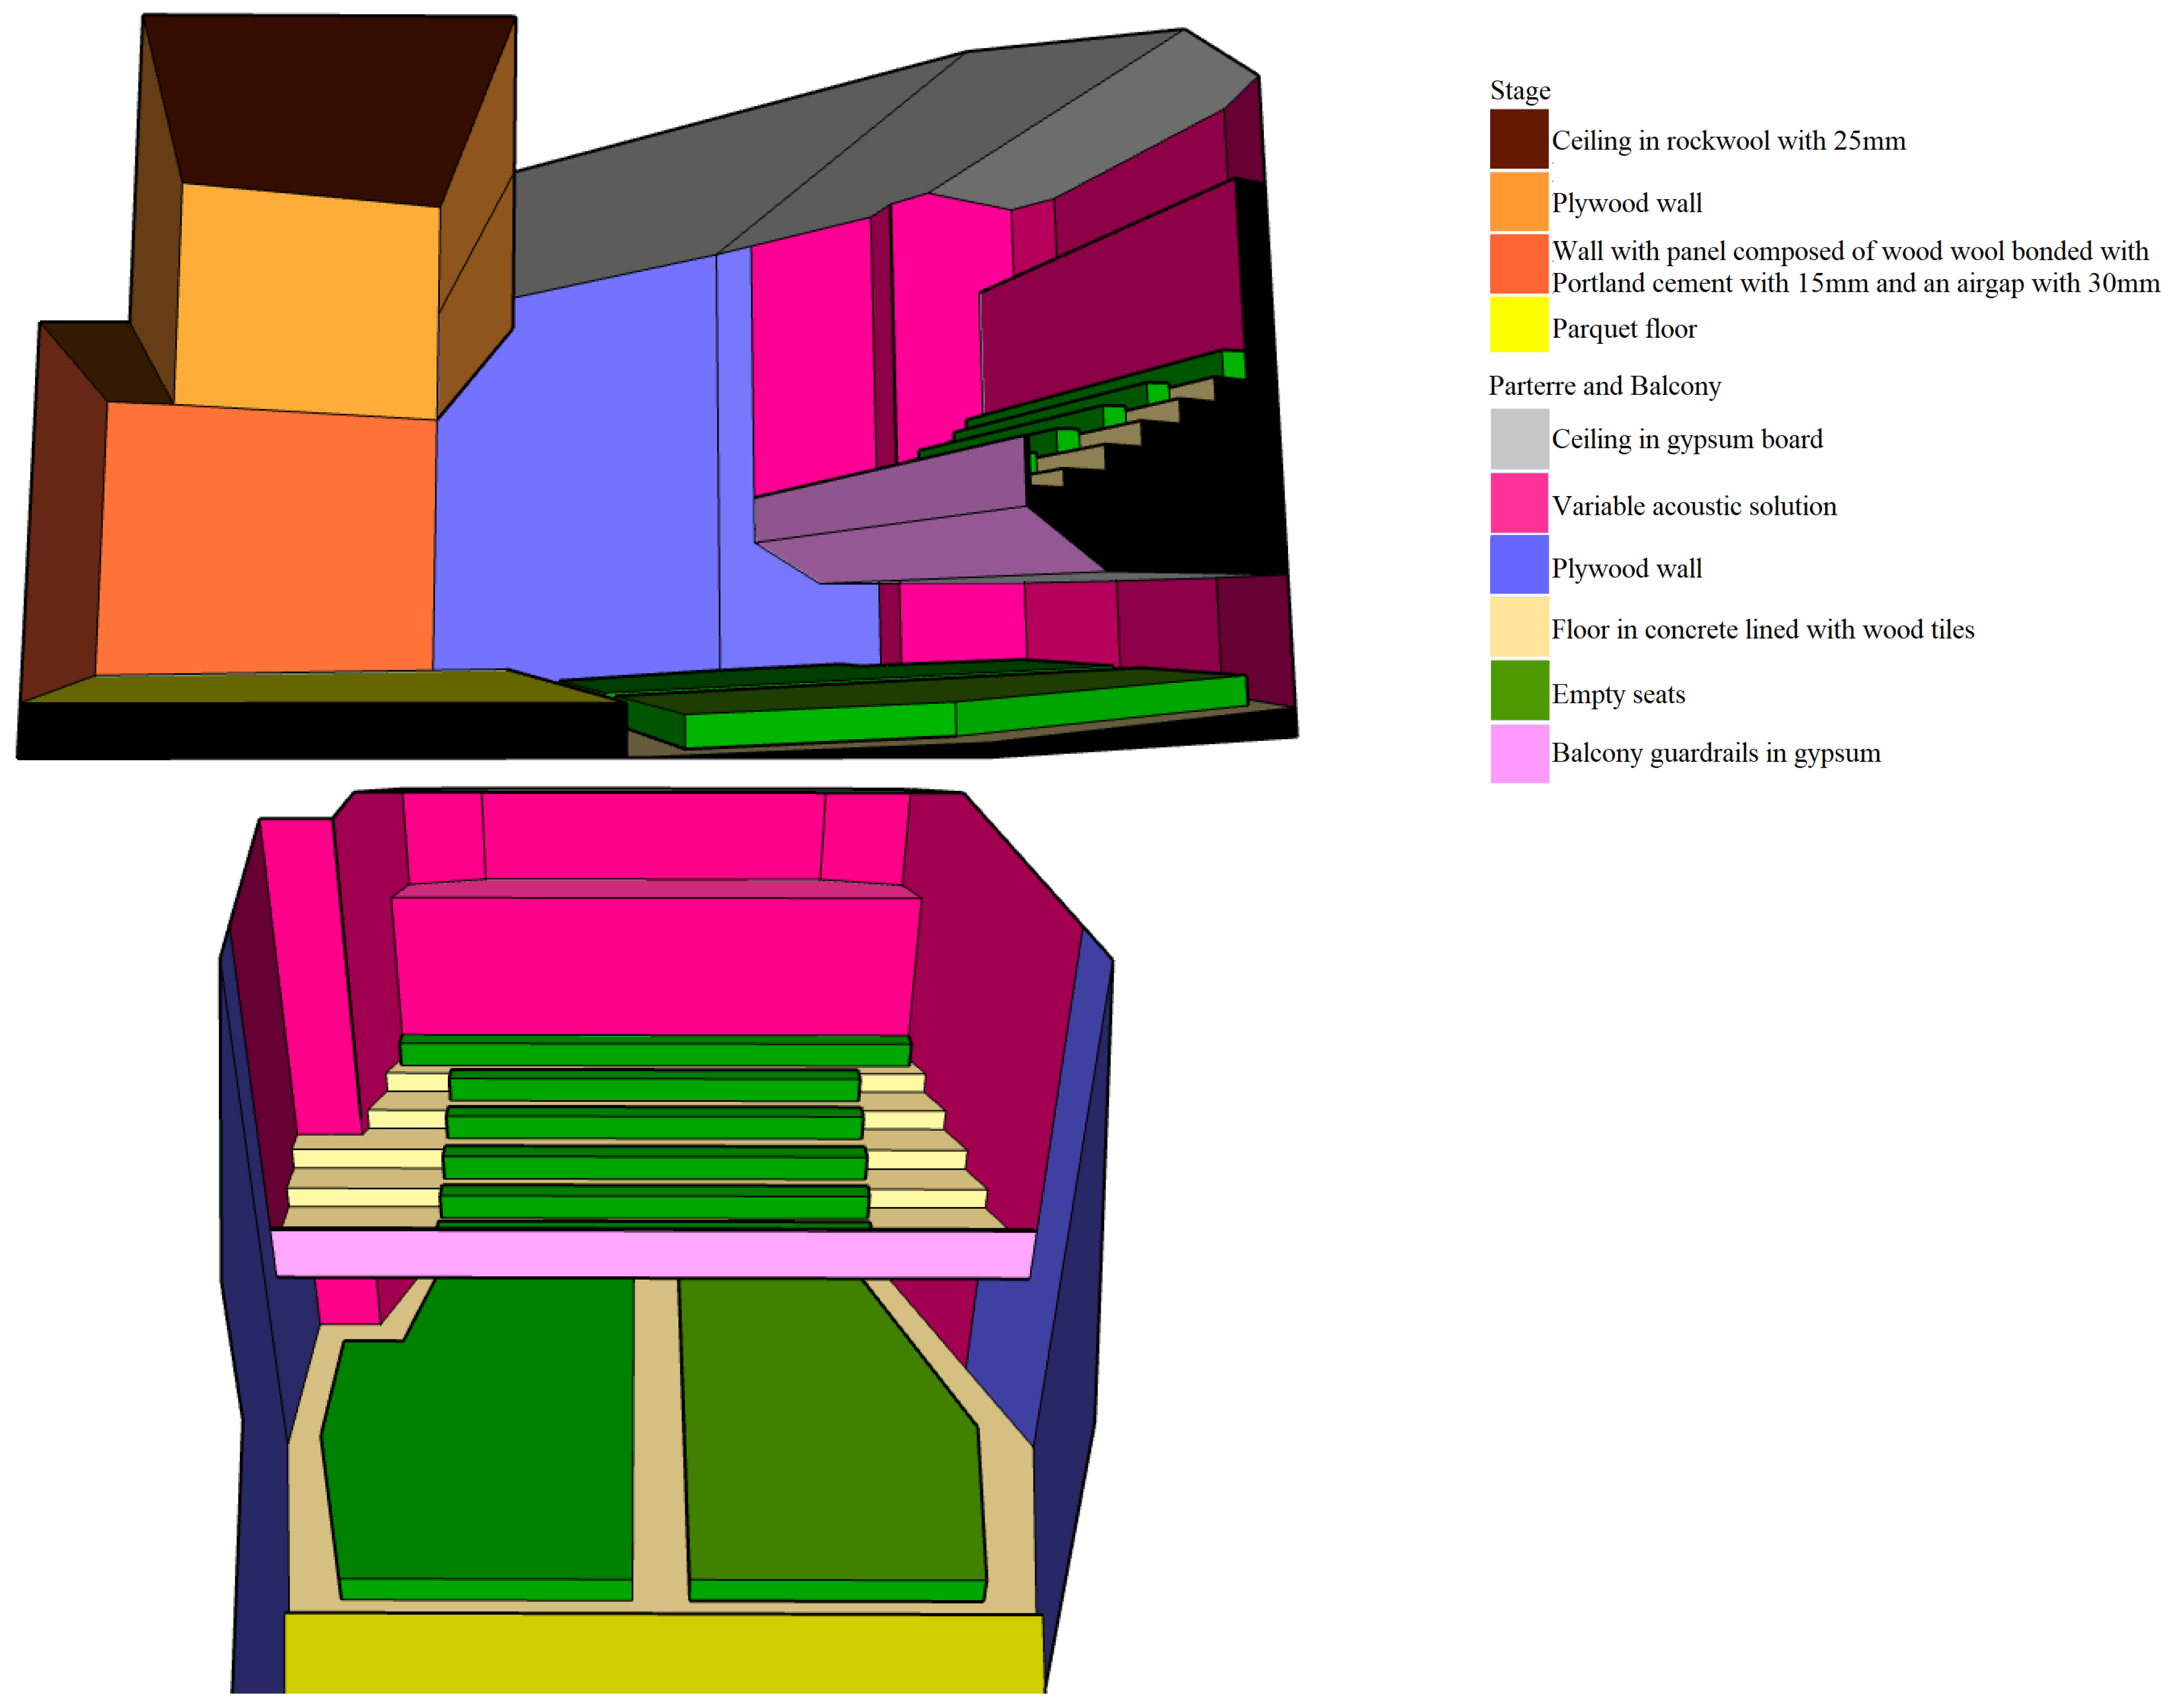
4.1. Model Description
4.2. Results
4.2.1. Preliminary Evaluation
4.2.2. Speech Assessment
Reverberation Time
Sound Pressure Level
Definition (D50)
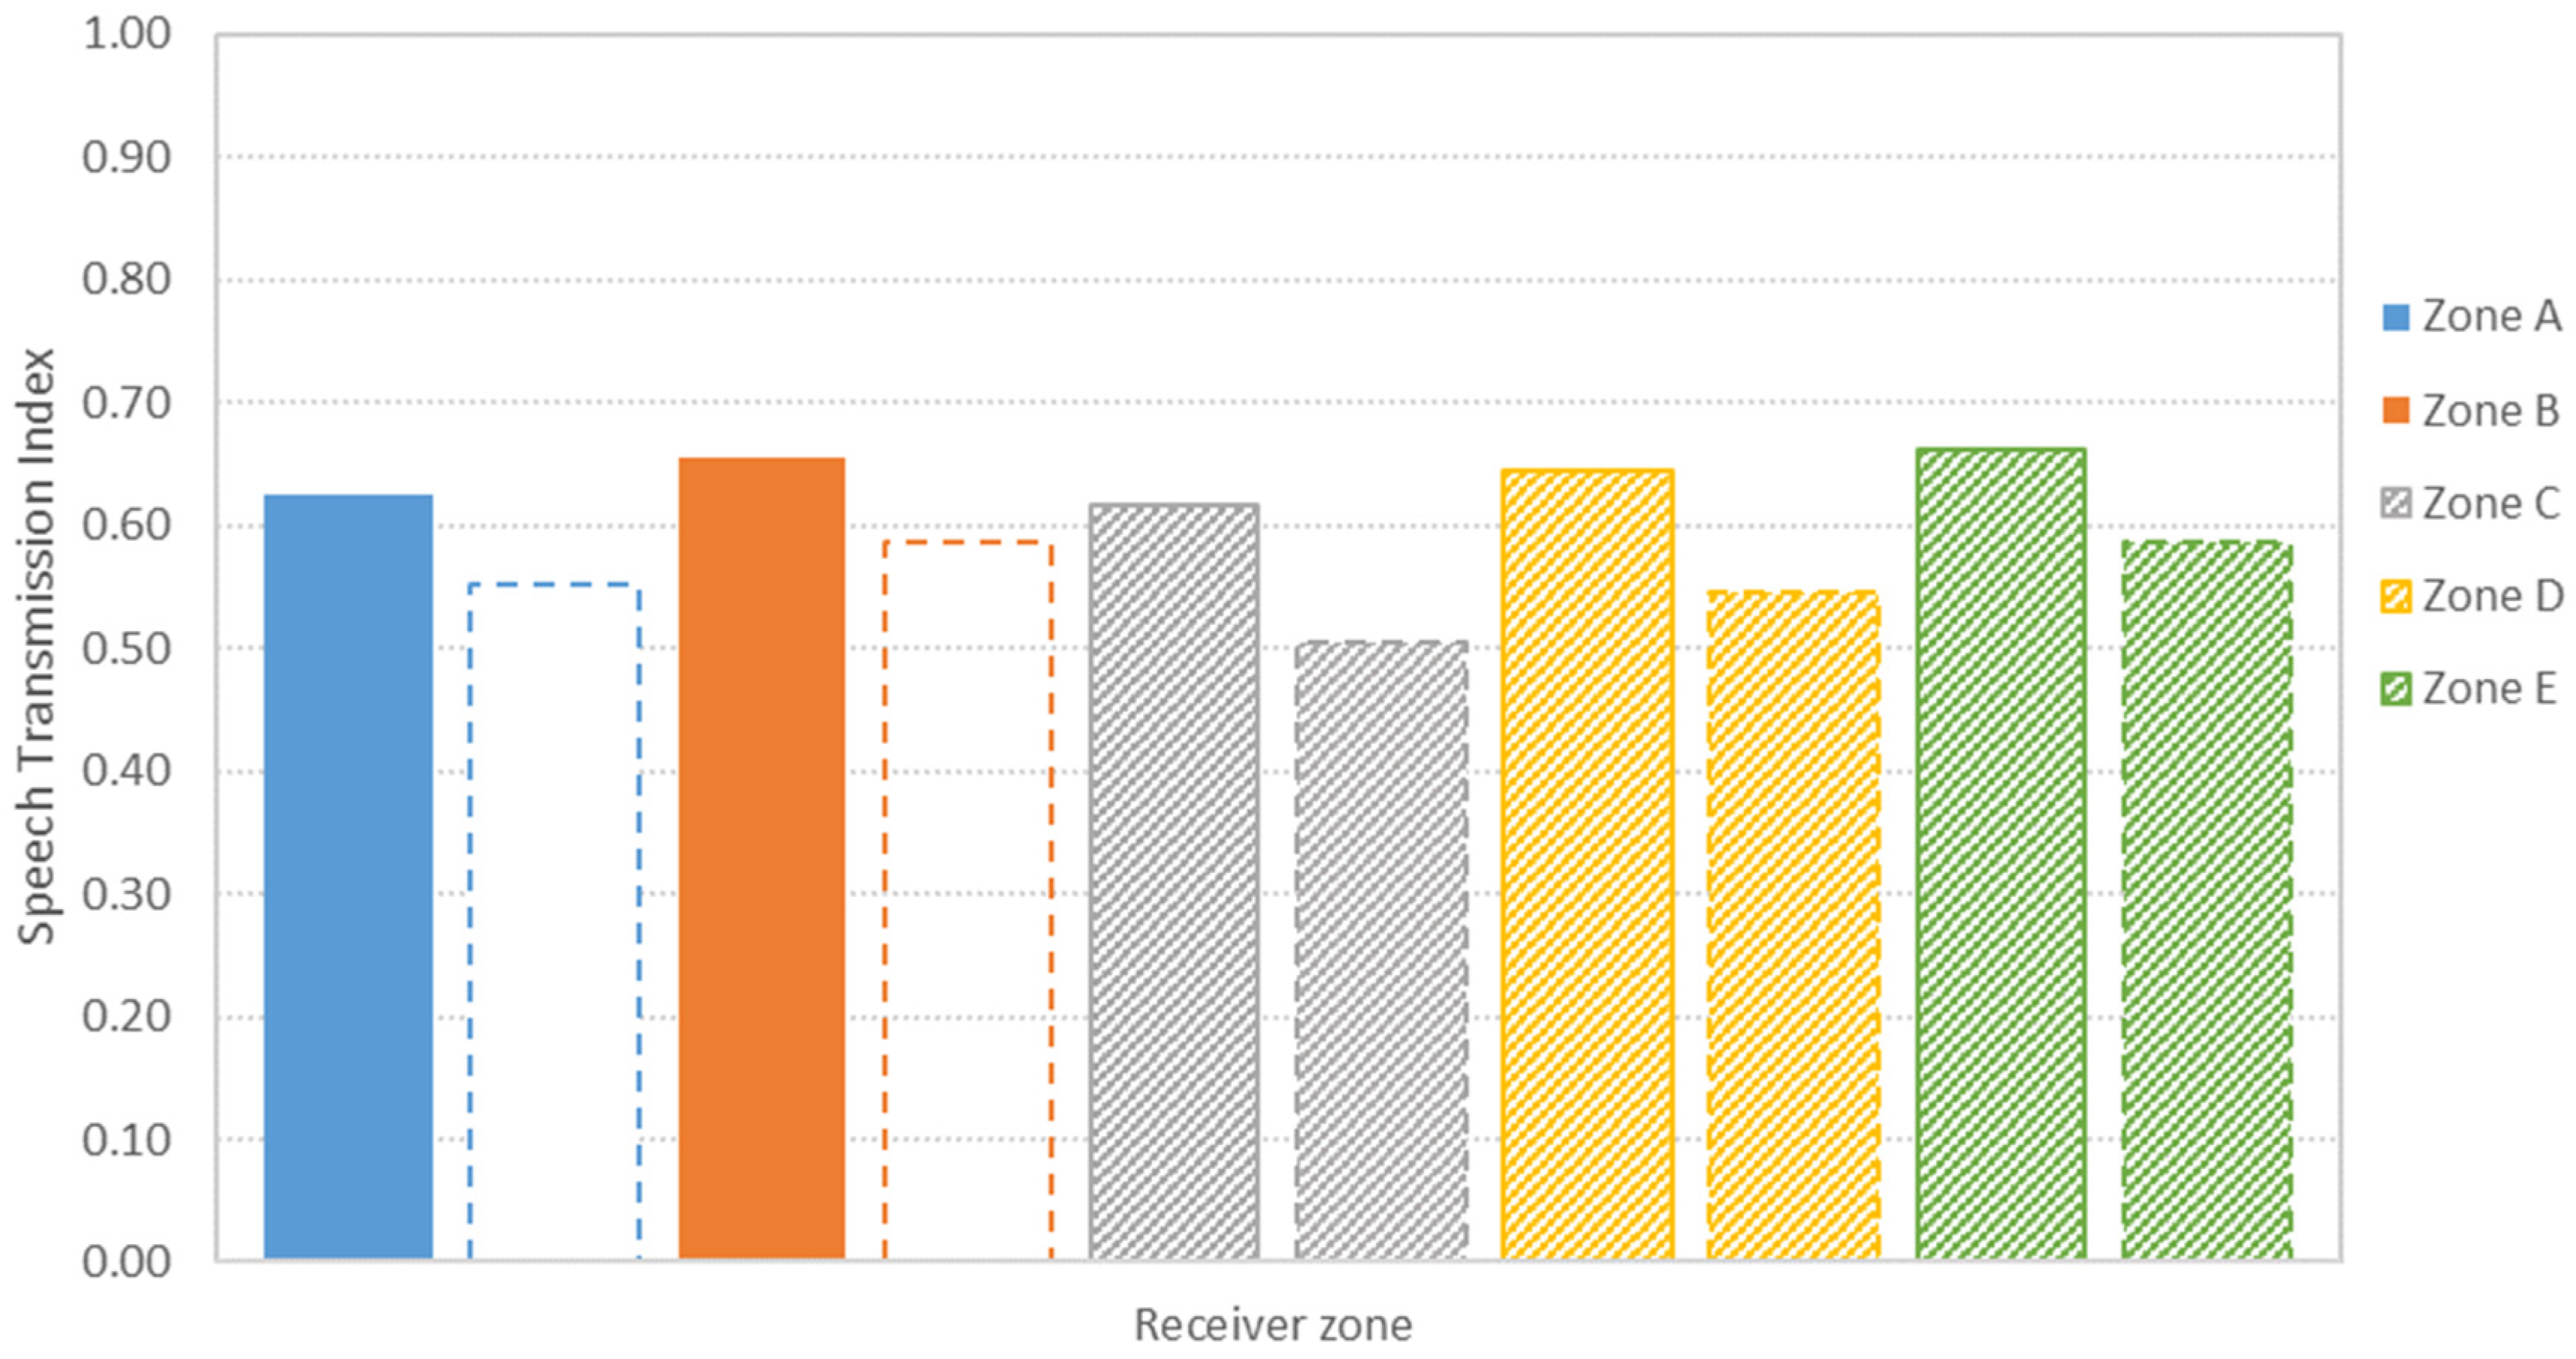
STI
4.2.3. Concert Assessment
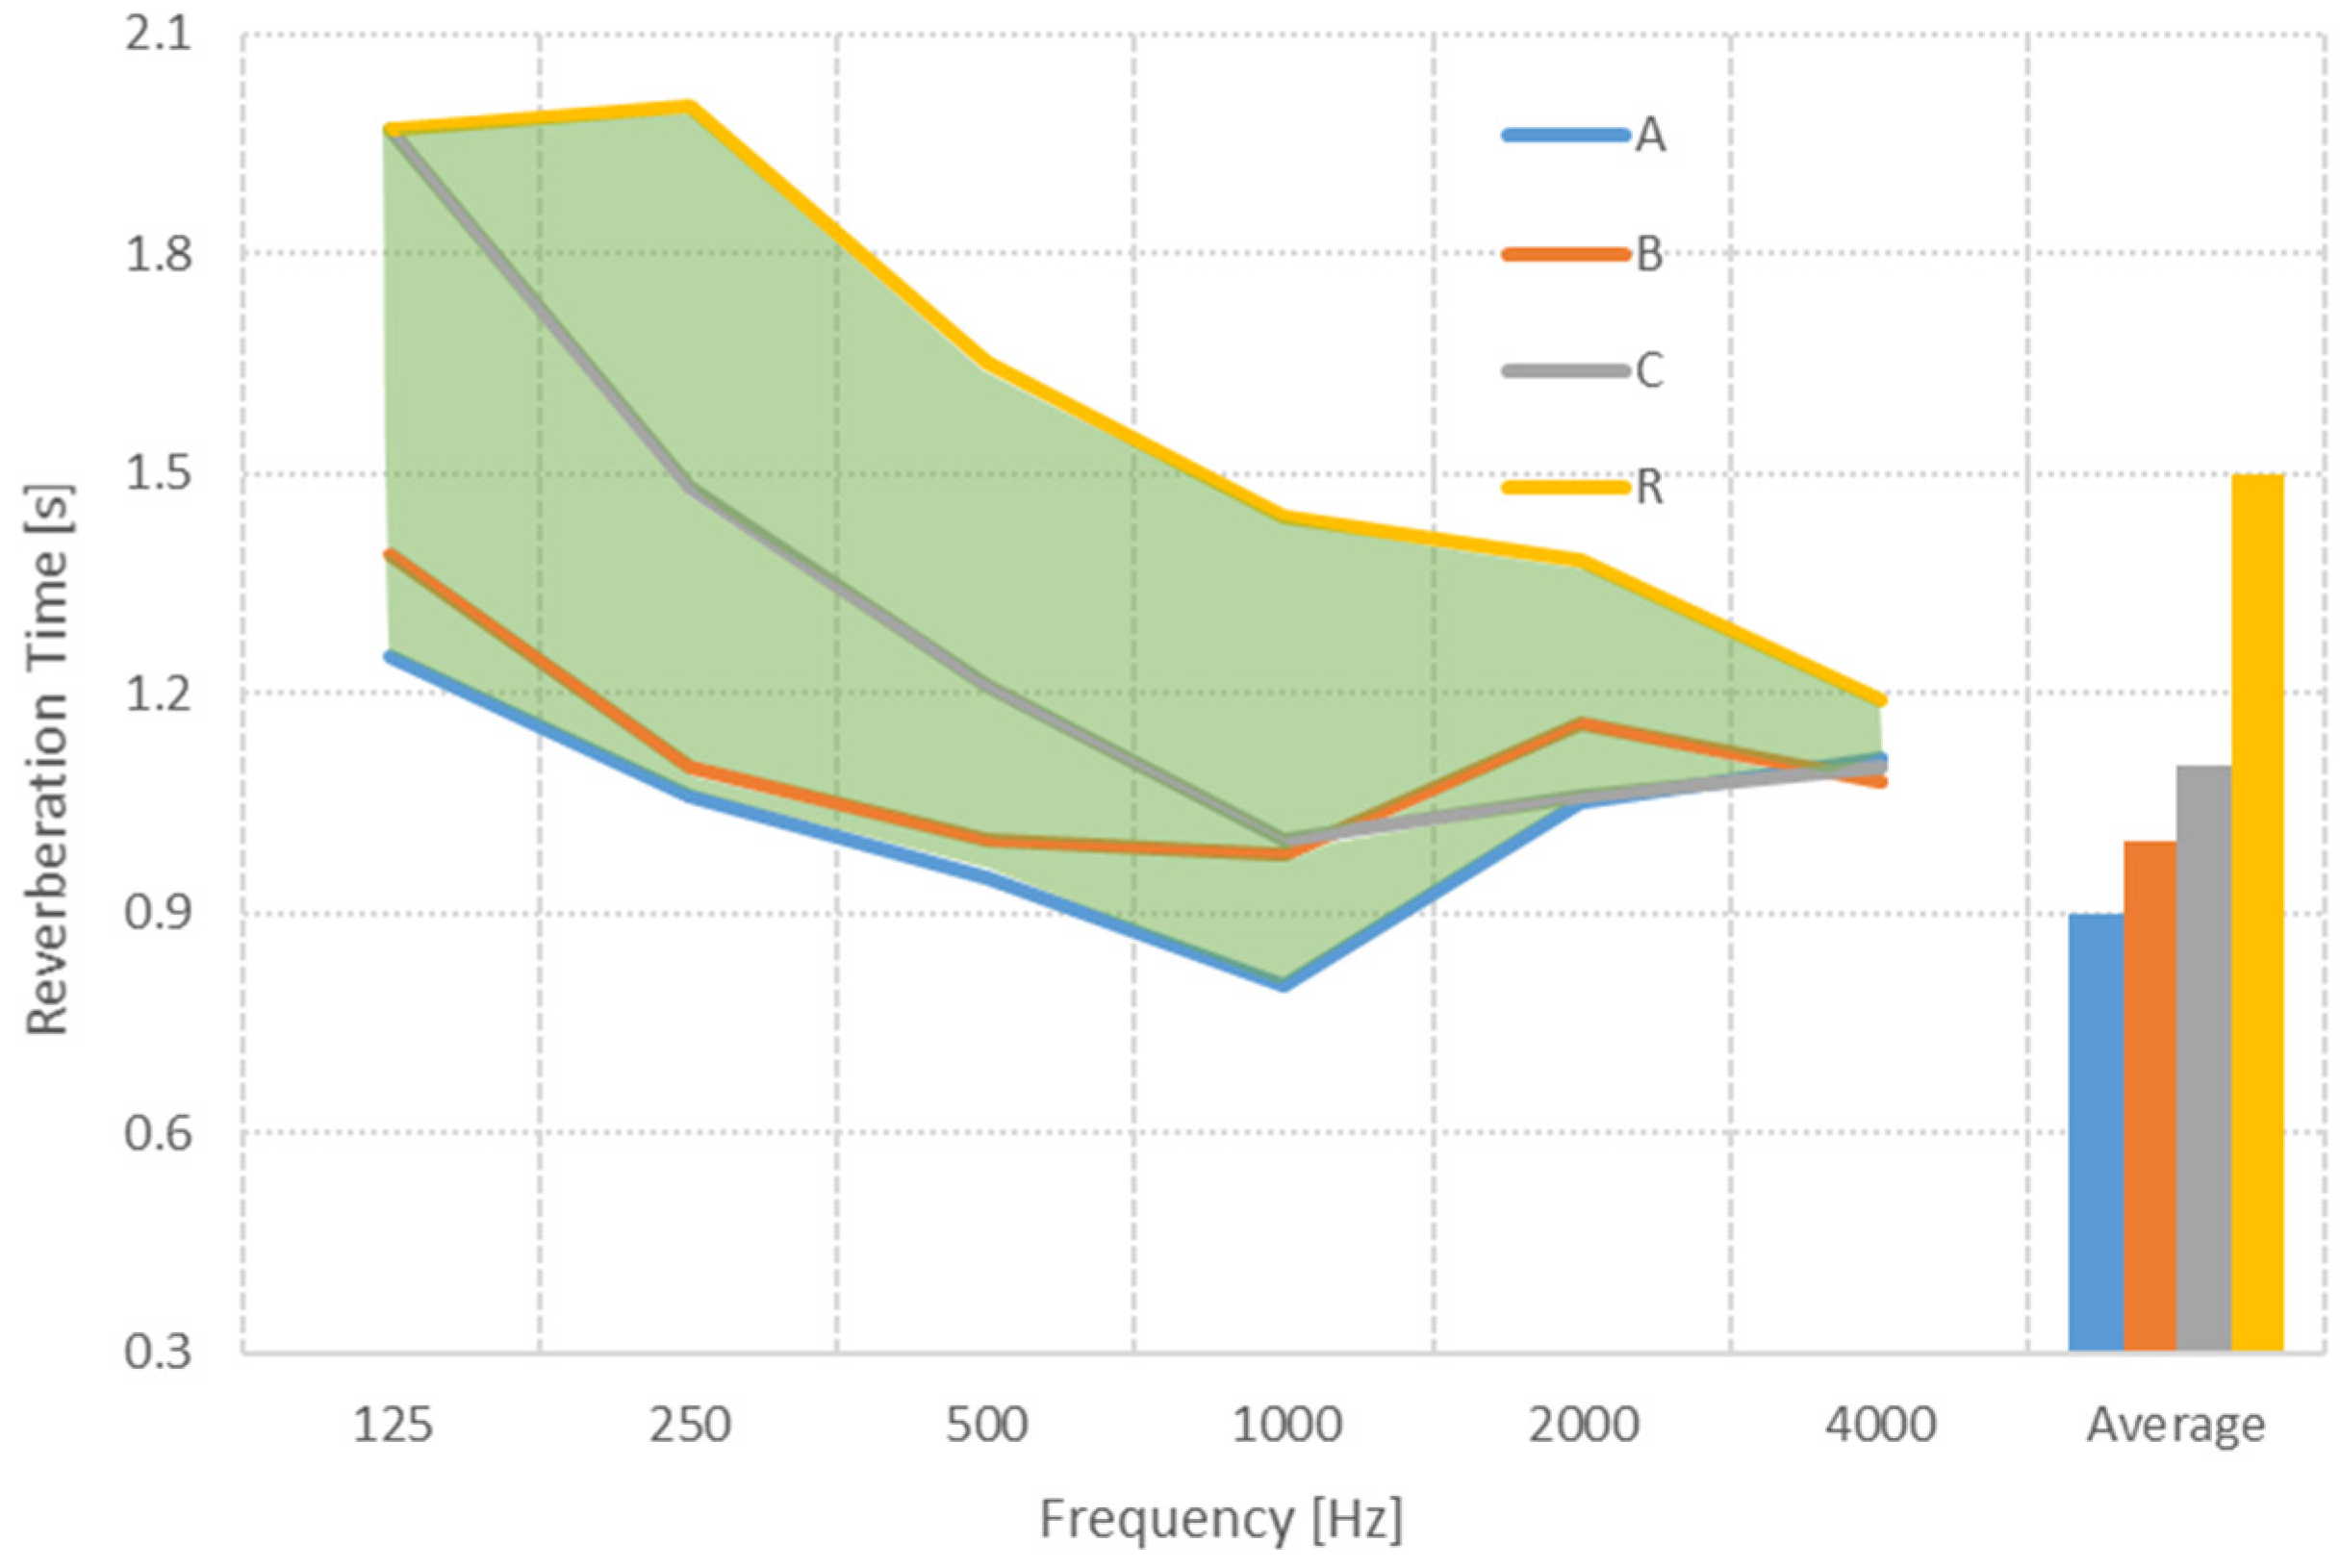
Reverberation Time
Early Decay Time (EDT)
Sound Pressure Level
Clarity (C80)
Strength (G)
Early Lateral Energy Fraction (LF)
4.3. Summary of the Results
5. Conclusions
Author Contributions
Funding

Institutional Review Board Statement
Informed Consent Statement
Data Availability Statement
Conflicts of Interest
References
- Barron, M. Acoustics for multi-purpose use. In Auditorium Acoustics and Architectural Design, 2nd ed.; Spon Press: London, UK; New York, NY, USA, 2010; pp. 385–408. [Google Scholar]
- Poletti, M.A. Active acoustic systems for the control of room acoustics. Build. Acoust. 2011, 18, 237–258. [Google Scholar] [CrossRef]
- Thün, G.; Velikov, K.; Sauvé, L.; McGee, W. Design Ecologies for Responsive Environments: Resonant Chamber, an Acoustically Performative System; ACADIA 12; Synthetic Digital Ecologies: San Francisco, CA, USA, 2012. [Google Scholar]
- Everest, F.A.; Pohlmann, K.C. Adjustable Acoustics. In Master Handbook of Acoustics, 6th ed.; McGraw-Hills: New York, NY, USA, 2009; pp. 375–390. [Google Scholar]
- Cairoli, M. Architectural customized design for variable acoustics in a multipurpose auditorium. Appl. Acoust. 2018, 140, 167–177. [Google Scholar] [CrossRef]
- Egan, M.D. Architectural Acoustics; J. Ross Publishing: Plantation, FL, USA, 2007; pp. 134–142. [Google Scholar]
- Beranek, L. Concert Halls and Opera Houses: Music, Acoustics, and Architecture, 2nd ed.; Springer: New York, NY, USA, 2004; pp. 549–550. [Google Scholar]
- Long, M. Architectural Acoustics; Elsevier Academic Press: Burlington, MA, USA, 2006; pp. 579, 653–657. [Google Scholar]
- Sadeghnia, G.R. Data-driven IoT-platform for optimizing variable acoustics in multifunctional performance spaces. J. Acoust. Soc. Am. 2019, 146, 2851. [Google Scholar] [CrossRef]
- Adelman-Larsen, N.W.; Thompson, E.R.; Gade, A.C. Suitable reverberation times for halls for rock and pop music. J. Acoust. Soc. Am. 2010, 127, 247–255. [Google Scholar] [CrossRef] [PubMed] [Green Version]
- Adelman-Larsen, N.W. Rock and Pop Venues: Acoustic and Architectural Design; Springer: Berlin/Heidelberg, Germany, 2014; pp. 140–142. [Google Scholar]
- Kusaka, M.; Sakagami, K.; Okuzono, T.; Kido, S.; Yamaguchi, D. Three-dimensional MPP space absorbers: An overview of the project and recent development. In Proceedings of the Inter-Noise and Noise-Con Congress and Conference Proceedings, Seoul, Korea, 23–26 August 2020; Volume 261, pp. 358–368. [Google Scholar]
- Sakagami, K.; Kusaka, M.; Okuzono, T.; Kido, S.; Yamaguchi, D. Diffuse-field sound absorption characteristics of a spherical-microperforated space absorber. Acoust. Sci. Technol. 2020, 41, 784–787. [Google Scholar] [CrossRef]
- Cox, T.; d’Antonio, P. Acoustic Absorbers and Diffusers: Theory, Design and Application, 3rd ed.; CRC Press: Boca Raton, FL, USA, 2017; pp. 225–255. [Google Scholar]
- Vorländer, M. Auralization: Fundamentals of Acoustics, Modelling, Simulation, Algorithms and Acoustic Virtual Reality; Springer: Berlin/Heidelberg, Germany, 2008; pp. 181–196. [Google Scholar]
- Lo Turco, M.; Zich, U.; Astolfi, A.; Shtrepi, L.; Poaola, B.M. From digital design to physical model. Origami techniques applied to dynamic panelling shapes for acoustic performance control. In Proceedings of the 35th International Conference on Education and Research in Computer Aided Architectural Design in Europe, Rome, Italy, 20–22 September 2017. [Google Scholar]
- Pellegrino, S. Deployable Structure; Springer: Vienna, Austria, 2001. [Google Scholar]
- Kolarevic, B.; Peters, B.; Peters, T. Parametric Evolution, Inside Smart Geometry: Expanding the Architectural Possibilities of Computational Design; Wiley & Sons: New York, NY, USA, 2013. [Google Scholar]
- Panneton, R. Comments on the limp frame equivalent fluid model for porous media. J. Acoust. Soc. Am. 2007, 122, EL217–EL222. [Google Scholar] [CrossRef] [PubMed]
- Bonfiglio, P.; Pompoli, F. Inversion problems for determining physical parameters of porous materials: Overview and comparison between different methods. Acta Acust. United Acust. 2013, 99, 341–351. [Google Scholar] [CrossRef]
- Ramis, J.; Del Rey, R.; Alba, J.; Godinho, L.; Carbajo, J. A model for acoustic absorbent materials derived from coconut fiber. Mater. Construcción 2014, 64, e008. [Google Scholar] [CrossRef] [Green Version]
- Crandall, I.B. Theory of Vibrating Systems and Sound; Van Nostrand: New York, NY, USA, 1926. [Google Scholar]
- Patraquim, R.; Godinho, L.; Tadeu, A.; Amado-Mendes, P. Influence of the Presence of Lining Materials in the Acoustic Behaviour of Perforated Panel Systems; ICSV 18: Rio de Janeiro, Brazil, 2018. [Google Scholar]
- Mechel, F.P. Formulas of Acoustics, 2nd ed.; Springer: Berlin/Heidelberg, Germany, 2008; p. 796. [Google Scholar]
- Wu, M. Micro-Perforated Panels Duct Silencing. Noise Control Eng. J. 1997, 45, 69–77. [Google Scholar] [CrossRef]
- ISO 10534-2. Acoustics: Determination of Sound Absorption Coefficient and Impedance in Impedances Tubes. Part 2: Transfer-Function Method; International Standards Organization: Geneva, Switzerland, 1998. [Google Scholar]
- Larner, D.; Davy, J. The prediction of the diffuse field sound absorption of perforated panel systems. In Proceedings of the 44th InterNoise Congress and Exposition on Noise Control Engineering, San Francisco, CA, USA, 9–12 August 2015. [Google Scholar]
- Rindel, J.H. The use of computer modelling in room acoustics. J. Vibroeng. 2000, 3, 219–224. [Google Scholar]
- Dance, S.M.; Van Buuren, G. Effects of damping on the low-frequency acoustics of listening rooms based on an analytical model. J. Sound Vib. 2013, 332, 6891–6904. [Google Scholar] [CrossRef]
- Isbert, A.C. Diseño Acústico de Espacios Arquitectónicos; Universidad Politécnica de Catalunya: Catalonia, Spain, 1998; pp. 34–35, 184. [Google Scholar]
- Celenit Technical Guide. Available online: https://www.celenit.com/Public/Downloads.php?celenit_depliant_ad_manuale_it-pdf.pdf&Open (accessed on 20 January 2021).
- Decree-Law, n.º 96/2008, June 9th, Regulamento dos Requisitos Acústicos dos Edifícios (RRAE). Available online: http://www.oern.pt/documentos/legislacao/d_dl_dr/DL96_2008.pdf (accessed on 10 January 2021). (In Portuguese).
- Arau, H. ABC de la Acústica Arquitectónica; CEAC: Barcelona, Spain, 1999; pp. 217–288. [Google Scholar]
- NS 8178:2014. Acoustic Criteria for Rooms and Spaces for Music Rehearsal and Performance; Standard Norge: Oslo, Norway, 2014. (In Norwegian) [Google Scholar]
- ISO 3382-1:2009. Acoustics—Measurement of Room Acoustic Parameters—Part 1: Performance Spaces; International Organization for Standardization: Brussels, Belgium, 2009. [Google Scholar]
- Rossing, T. Handbook of Acoustics; Springer Science & Business Media: New York, NY, USA, 2007; pp. 437–438. [Google Scholar]
- Beranek, L.L. Concert Halls and Opera Houses: How They Sound; Springer: New York, NY, USA, 1996. [Google Scholar]
- Reichardt, W.; Alim, O.A.; Schmidt, W. Definition and basis of making an objective evaluation to distinguish between useful and useless clarity defining musical performances. Acta Acust. United Acust. 1975, 32, 126–137. [Google Scholar]
- Rindel, J.H. Rooms for Music—Acoustical Needs and Requirements; Baltic-Nordic Acoustic Meeting: Tallinn, Estonia, 2014. [Google Scholar]


| ID | Panels | Thickness (mm) | Diameter of the Hole (mm) | Perforation Rate (%) |
|---|---|---|---|---|
| PP | Perforated | 12 | 8 | 18 |
| ID | Porous material | Thickness (mm) | Density (kg/m3) | Flow resistivity Pa·s·m−2 |
| MW | Mineral Wool | 40 mm | 70 | 28,377 |
| Configuration | Layer 1 | Layer 2 | Layer 3 | Layer 4 |
|---|---|---|---|---|
| A | PP | Airgap d1 = 10 mm | MW | Airgap d1 = 100 mm |
| B | PP | Airgap d1 = 55 mm | MW | Airgap d1 = 55 mm |
| C | PP | Airgap d1 = 100 mm | MW | Airgap d1 = 10 mm |
| AuditoriumPart | Materials | Area | Area | Acoustic Parameter * | Octave Bands [Hz] | |||||
|---|---|---|---|---|---|---|---|---|---|---|
| m2 | % | 125 | 250 | 500 | 1000 | 2000 | 4000 | |||
| Stage | Ceiling in rockwool with 25 mm | 105.2 | 5.2 | α | 0.25 | 0.60 | 0.65 | 0.95 | 0.95 | 0.95 |
| Plywood wall | 267.1 | 13.3 | α | 0.11 | 0.10 | 0.07 | 0.05 | 0.05 | 0.05 | |
| Wall with panel composed of wood wool bonded with Portland cement with 15 mm and an airgap with 30 mm | 182.4 | 9.1 | α | 0.10 | 0.15 | 0.40 | 0.75 | 0.45 | 0.55 | |
| Parquet floor | 148.1 | 7.4 | α | 0.02 | 0.03 | 0.04 | 0.05 | 0.05 | 0.06 | |
| Parterre and Balcony | Ceiling in gypsum board | 335.0 | 16.7 | α | 0.12 | 0.10 | 0.08 | 0.06 | 0.06 | 0.06 |
| Plywood wall | 223.8 | 11.1 | α | 0.11 | 0.10 | 0.07 | 0.05 | 0.05 | 0.05 | |
| Floor in concrete lined with wood tiles | 144.5 | 7.2 | α | 0.02 | 0.04 | 0.05 | 0.04 | 0.10 | 0.05 | |
| Empty chairs, low upholstered | 271.8 | 13.5 | α | 0.25 | 0.35 | 0.47 | 0.51 | 0.49 | 0.45 | |
| s | 0.20 | 0.30 | 0.40 | 0.50 | 0.60 | 0.70 | ||||
| Balcony guardrails in gypsum | 73.7 | 3.7 | α | 0.12 | 0.10 | 0.08 | 0.06 | 0.06 | 0.06 | |
| Variable Acoustic Configuration A | 256.6 | 12.8 | α | 0.88 | 0.99 | 0.99 | 0.92 | 0.48 | 0.24 | |
| s | 0.12 | 0.13 | 0.14 | 0.15 | 0.16 | 0.17 | ||||
| Variable Acoustic Configuration B | α | 0.63 | 0.92 | 0.90 | 0.55 | 0.37 | 0.27 | |||
| s | 0.12 | 0.13 | 0.14 | 0.15 | 0.16 | 0.17 | ||||
| Variable Acoustic Configuration C | α | 0.20 | 0.42 | 0.49 | 0.53 | 0.48 | 0.24 | |||
| s | 0.12 | 0.13 | 0.14 | 0.15 | 0.16 | 0.17 | ||||
| Variable Acoustic Configuration Reflector | α | 0.20 | 0.10 | 0.10 | 0.10 | 0.15 | 0.20 | |||
| s | 0.12 | 0.13 | 0.14 | 0.15 | 0.16 | 0.17 | ||||
| Type of Use | Reverberation Time | Recommended Value (s) | Reference |
|---|---|---|---|
| Theatre | Tmax | 1.3 | Arau [33] |
| Tmin | 0.8 | ||
| Opera | Tmax | 1.5 | Arau [33] |
| Tmin | 1.1 | ||
| Chamber music | Tmax | 1.5 | Arau [33] |
| Tmin | 1.3 | ||
| Concerts | Tmax | 1.8 | Arau [33] |
| Acoustic powerful music | Tmin | 1.5 | Standard NS 8178 [34] |
| Acoustic quiet music | Tmax | 2.2 | Standard NS 8178 [34] |
| Tmin | 1.8 | ||
| Amplified music | Tmax | 1.0 | Standard NS 8178 [34] |
| Tmin | 0.8 |
| Parterre | Balcony | |||||||||
|---|---|---|---|---|---|---|---|---|---|---|
| Distance between receiver and reference receiver (m) | 2.9 | 5.2 | 8.2 | 11.4 | 8.1 | 9.2 | 10.2 | 11.4 | 12.5 | 13.3 |
| ΔL [dB] | 2.0 | 3.7 | 5.5 | 6.1 | 5.5 | 5.2 | 5.7 | 5.7 | 5.8 | 6.4 |
| STI | <0.30 | 0.30–0.45 | 0.45–0.60 | 0.60–0.75 | |
|---|---|---|---|---|---|
| Score | Bad | Poor | Fair | Good | Excellent |
| Parterre | Balcony | |||||||||
|---|---|---|---|---|---|---|---|---|---|---|
| Distance between receiver reference receiver (m) | 2.9 | 5.2 | 8.2 | 11.4 | 8.1 | 9.2 | 10.2 | 11.4 | 12.5 | 13.3 |
| ΔL [dB] | 1.8 | 3.2 | 3.2 | 4.6 | 4.1 | 4.2 | 4.0 | 3.9 | 3.9 | 3.9 |
| Type of Use | Recommended Values |
|---|---|
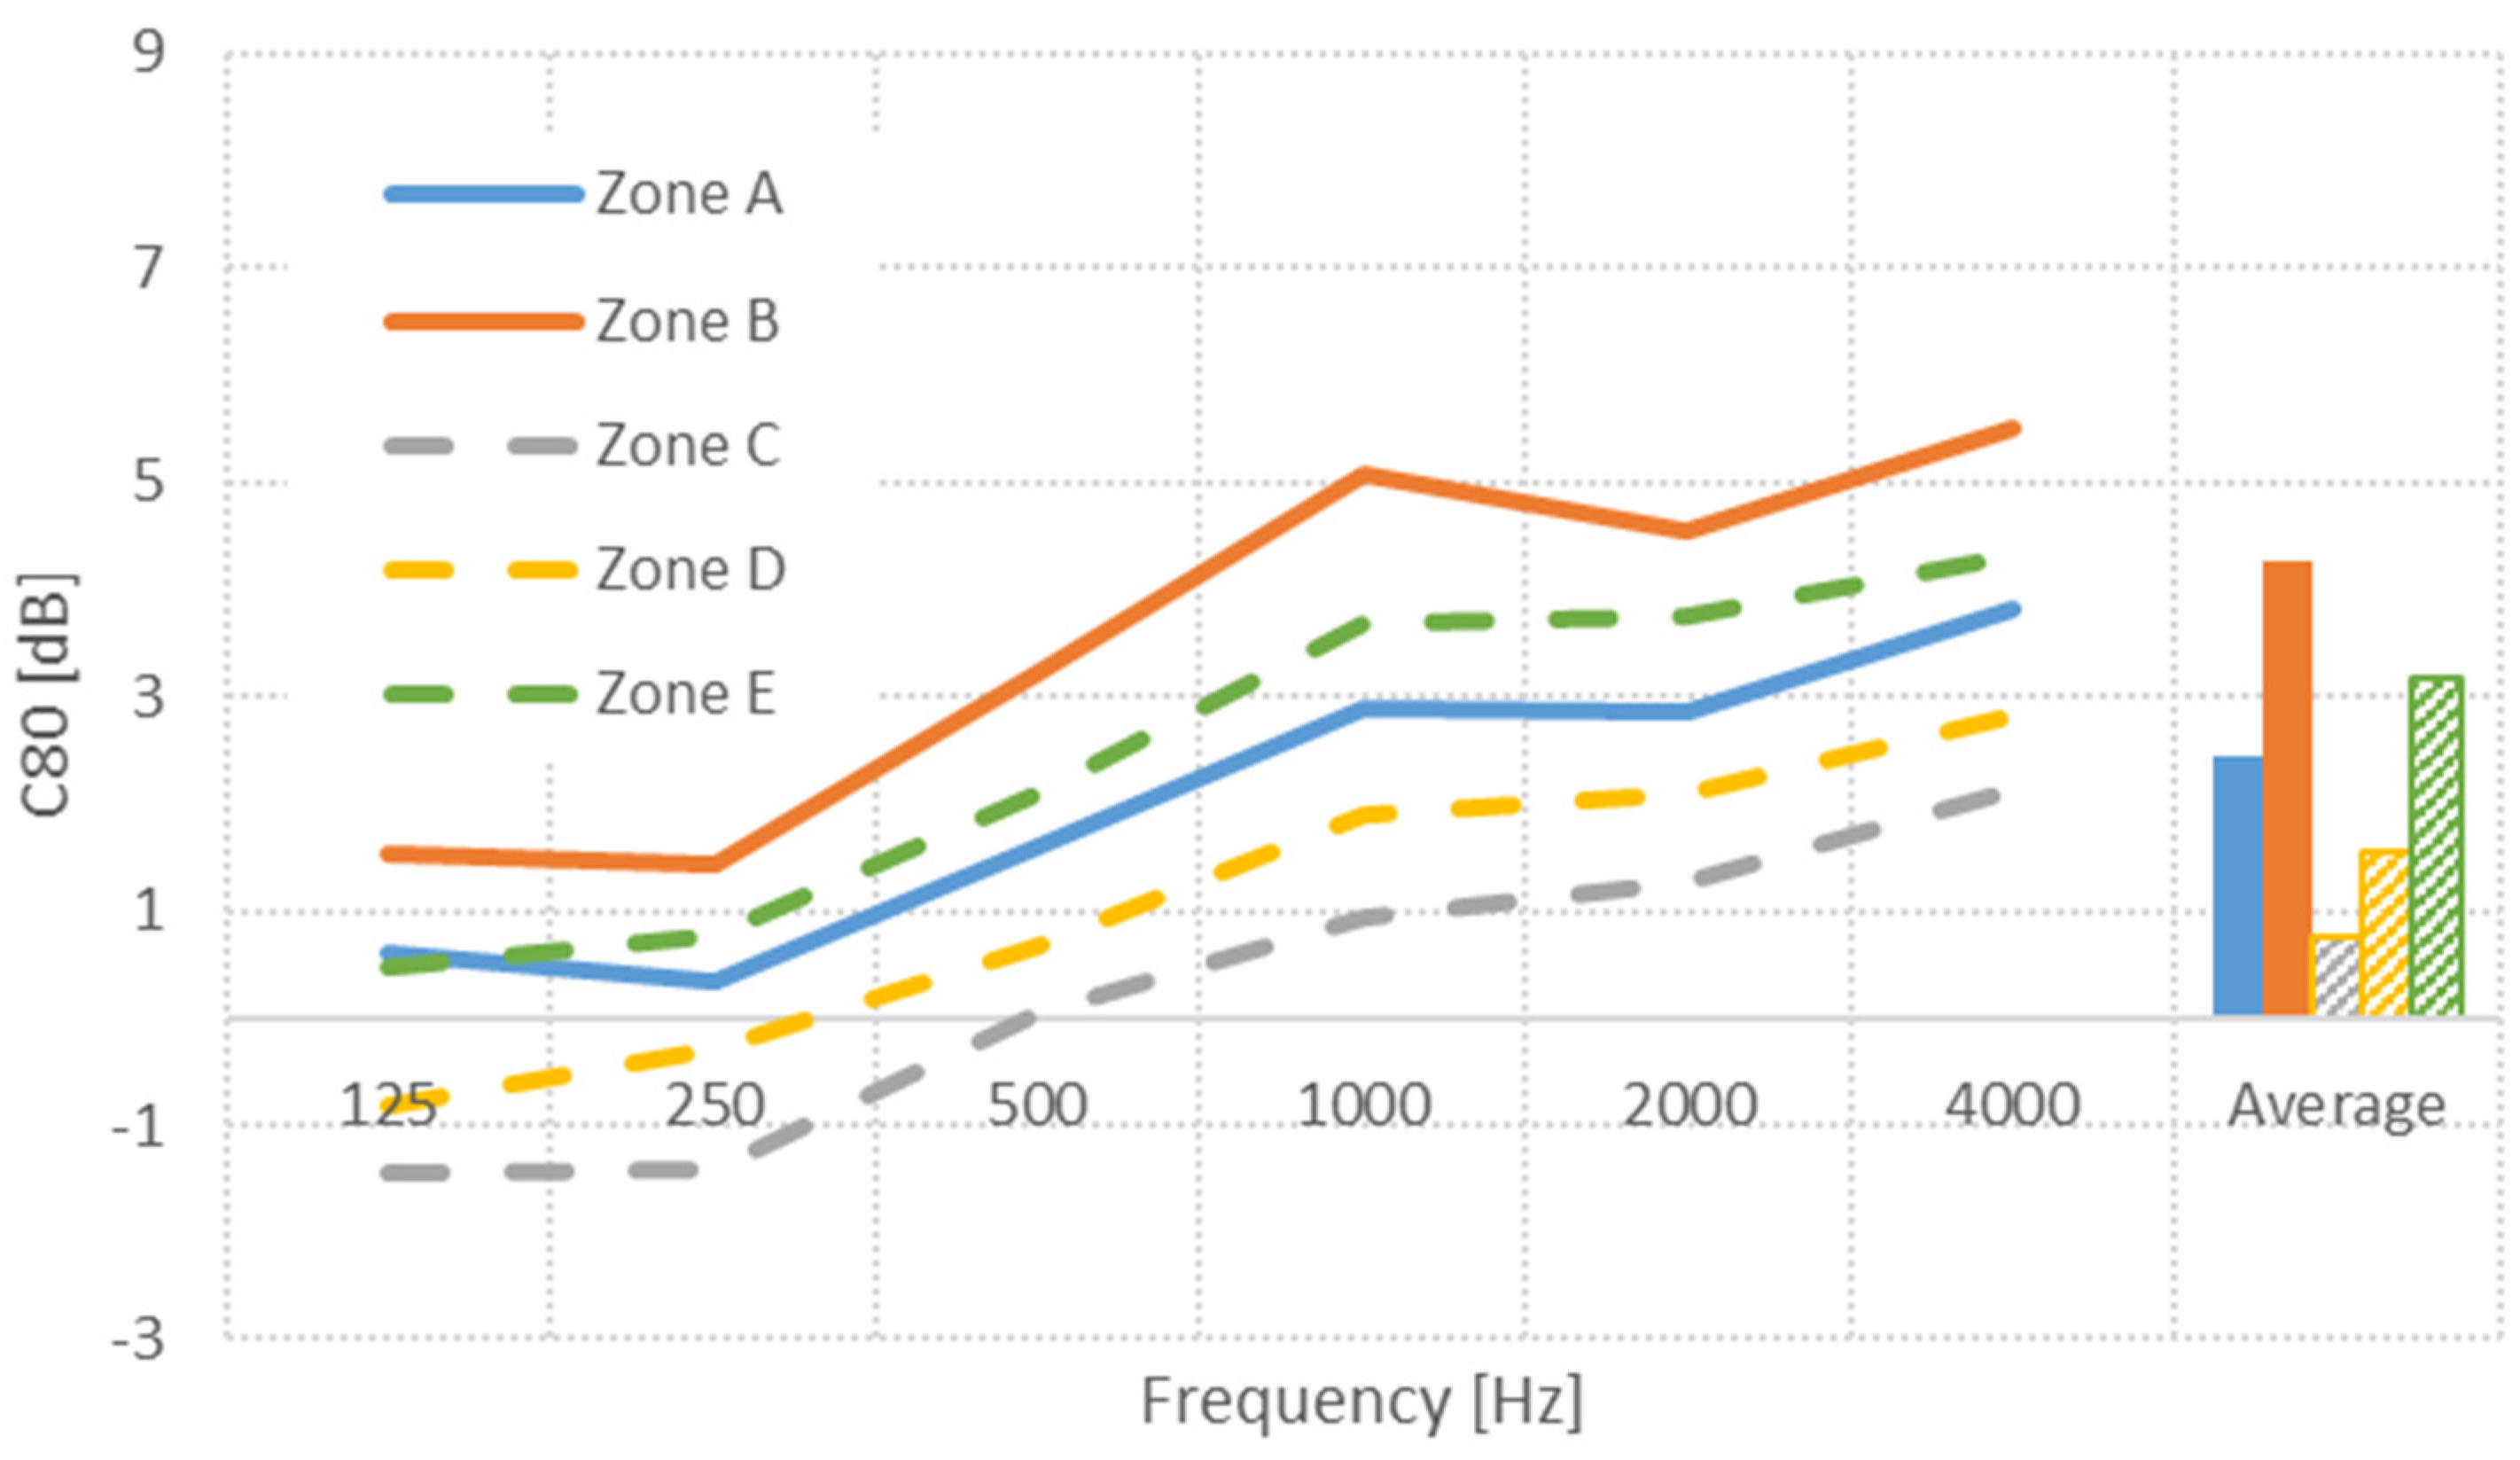
| Opera | 2 dB < C80 < 6 dB |
| Concert | −2 dB < C80 < 4 dB |
| Single Number Acoustic Indicator | Configuration A | Requirement | Requirement Accomplished | Single Number Frequency Averaging [Hz] |
|---|---|---|---|---|
| T30 (s) | [0.9 s; 1 s] | ≤0.9 s | ✓ | 500 and 1000 Hz |
| D50 (%) | [70%; 71%] | >50% | ✓ | 500 and 1000 Hz |
| STI (%) | [62%; 66%] | [60; 75%] Good | ✓ | - |
| Max ΔL [dB] | 3.2 dB | ≤1 dB | + − | Overall sound pressure level |
| Single Number Acoustic Indicator | Parterre | Balcony | |||
|---|---|---|---|---|---|
| Zone A | Zone B | Zone C | Zone D | Zone E | |
| T30 (s) | 0.93 | 0.93 | 0.96 | 0.93 | 0.93 |
| D50 (%) | 70 | 71 | 71 | 70 | 70 |
| STI (%) | 63 | 65 | 62 | 64 | 66 |
| SPL [dB] | 87.4 | 85.6 | 85.0 | 84.9 | 84.2 |
| Acoustic Indicator | Auditorium | Acoustic Requirement Evaluation | |
|---|---|---|---|
| Configuration R | Requirement | Requirement Accomplished | |
| T30 (s) | [1.5 s;1.6 s] | [1.5 s;1.8 s] | ✓ |
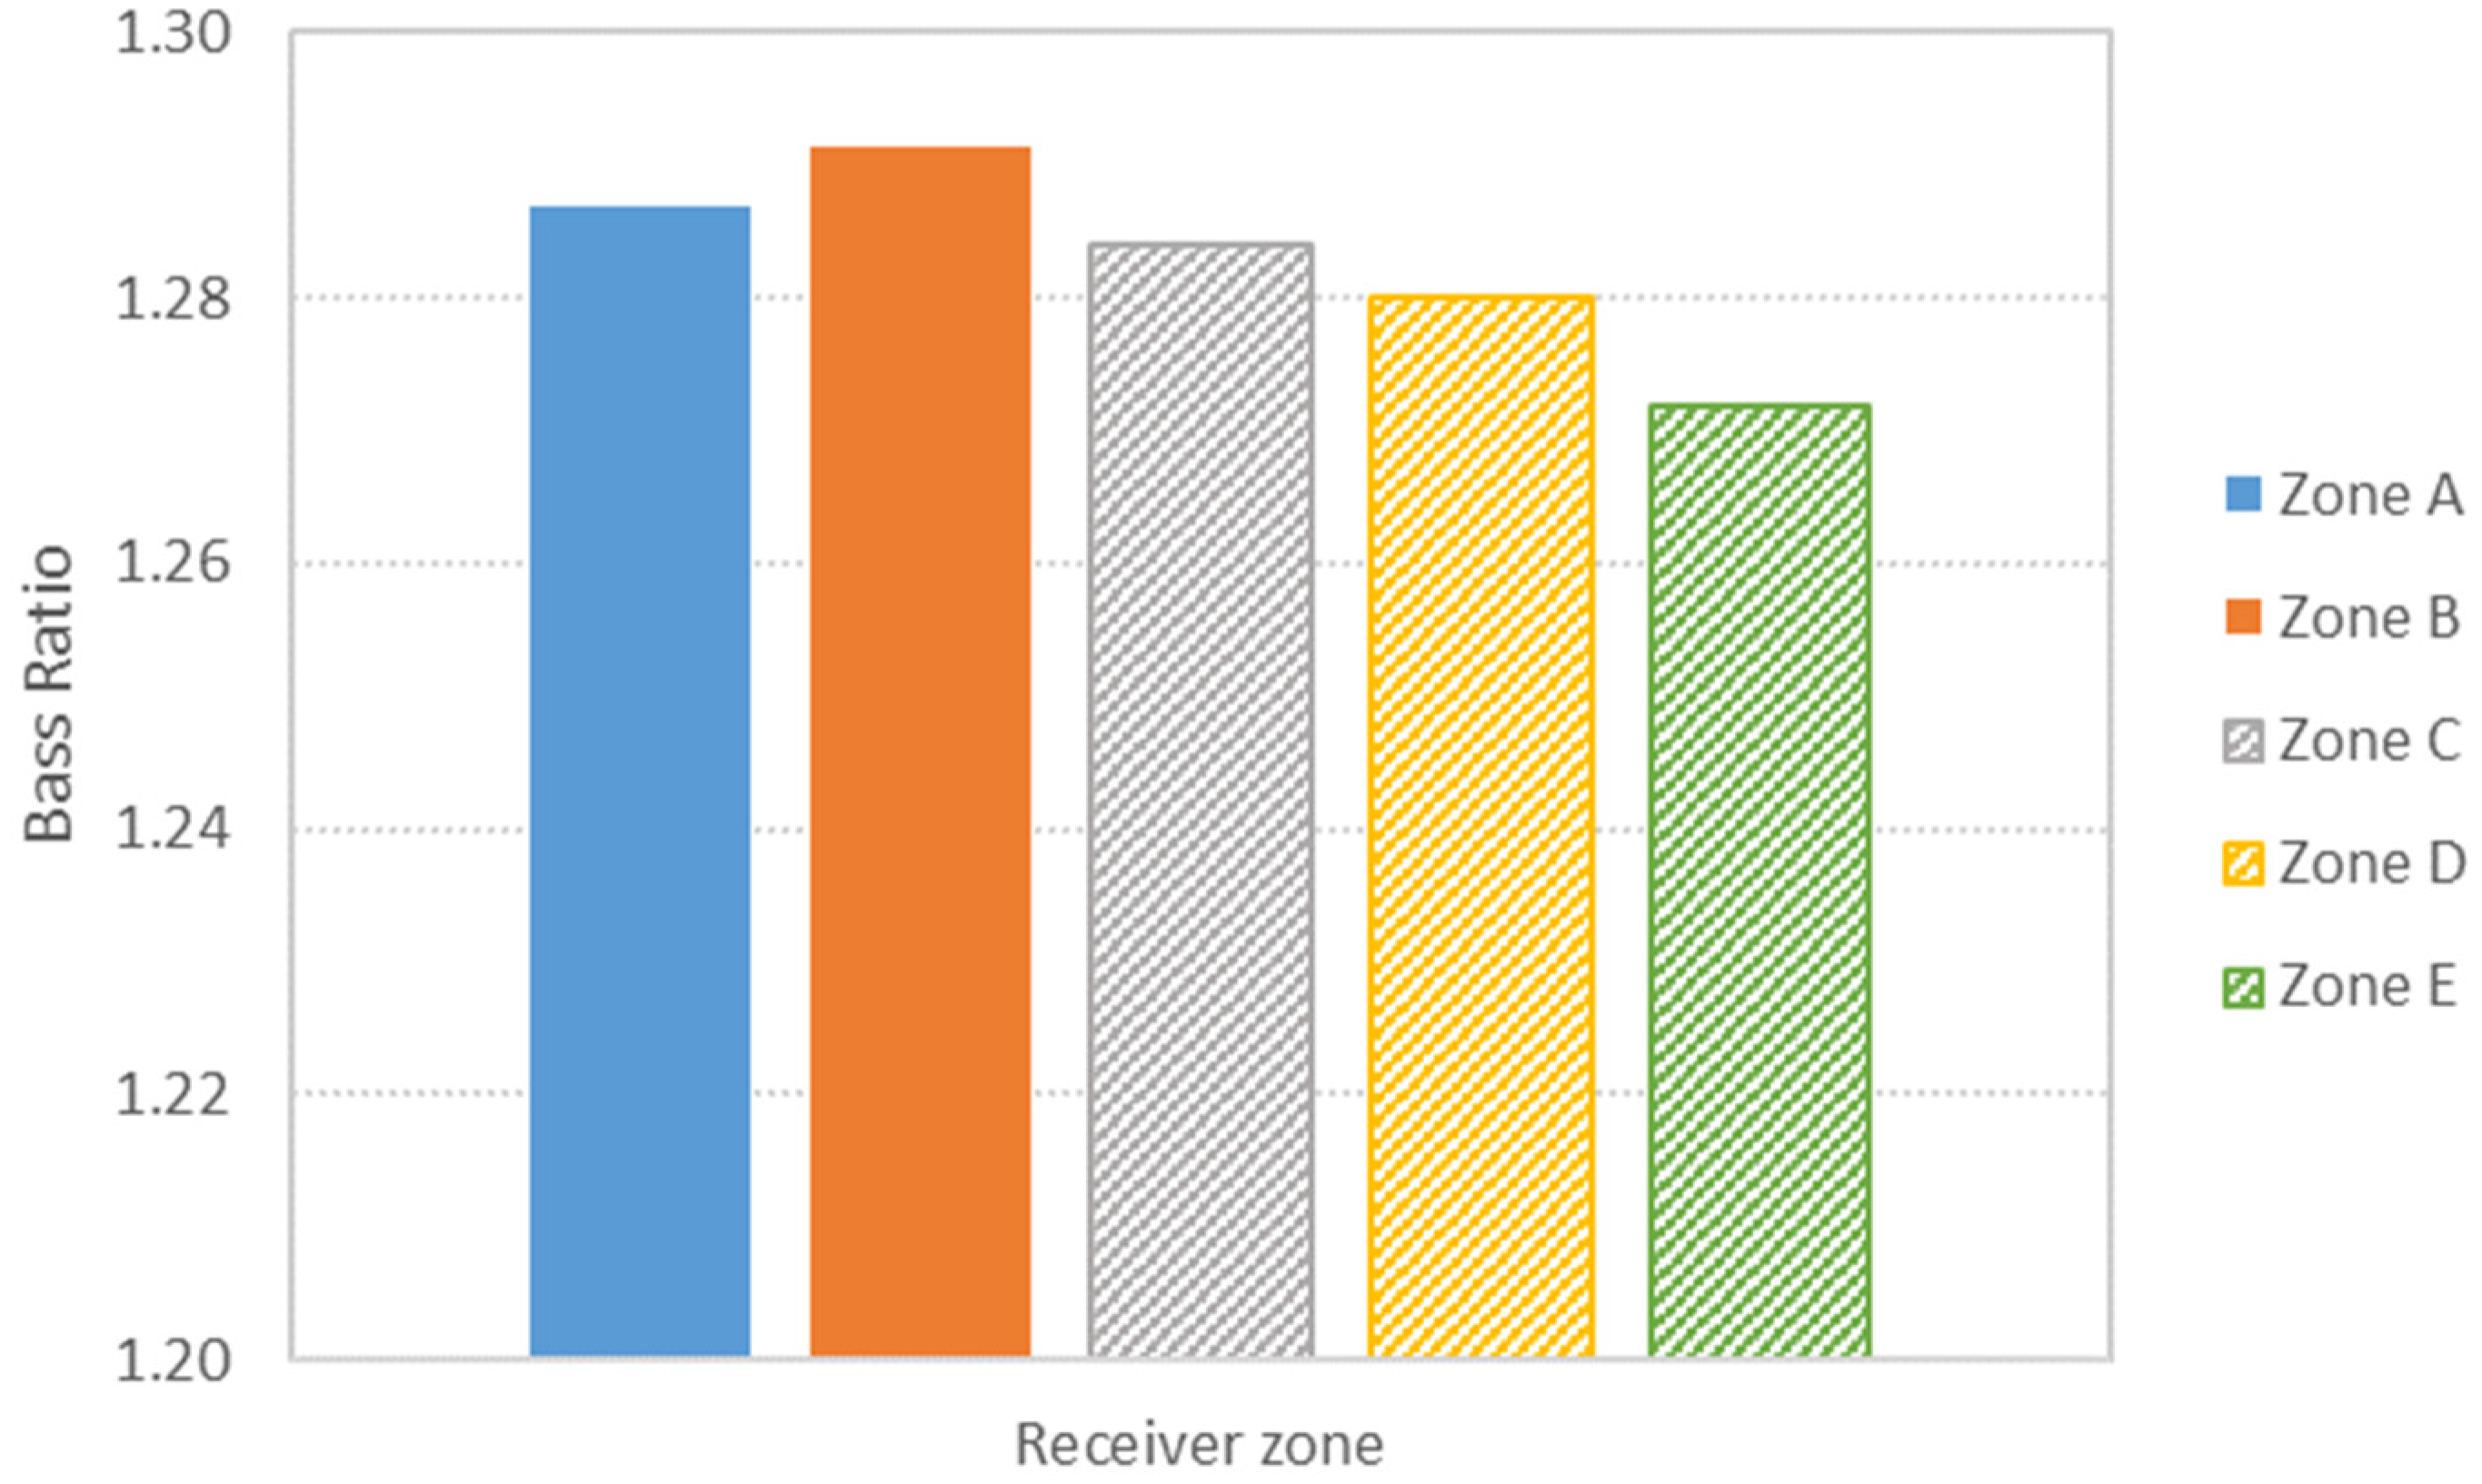
| BR | [1.27; 1.29] | Around 1.3 is considered acceptable | + − |
| EDT (s) | [1.2 s–1.5 s] | [1 s; 3 s] | ✓ |
| RT/EDT | [0.73; 0.94] | EDT/RT ratio should have a value close to 1 | + − |
| C80 (dB) | [1 dB–4 dB] | [−2 dB;4 dB] | ✓ |
| G (dB) | [9.2 dB–10.4 dB] | [6 dB; 11 dB] | ✓ |
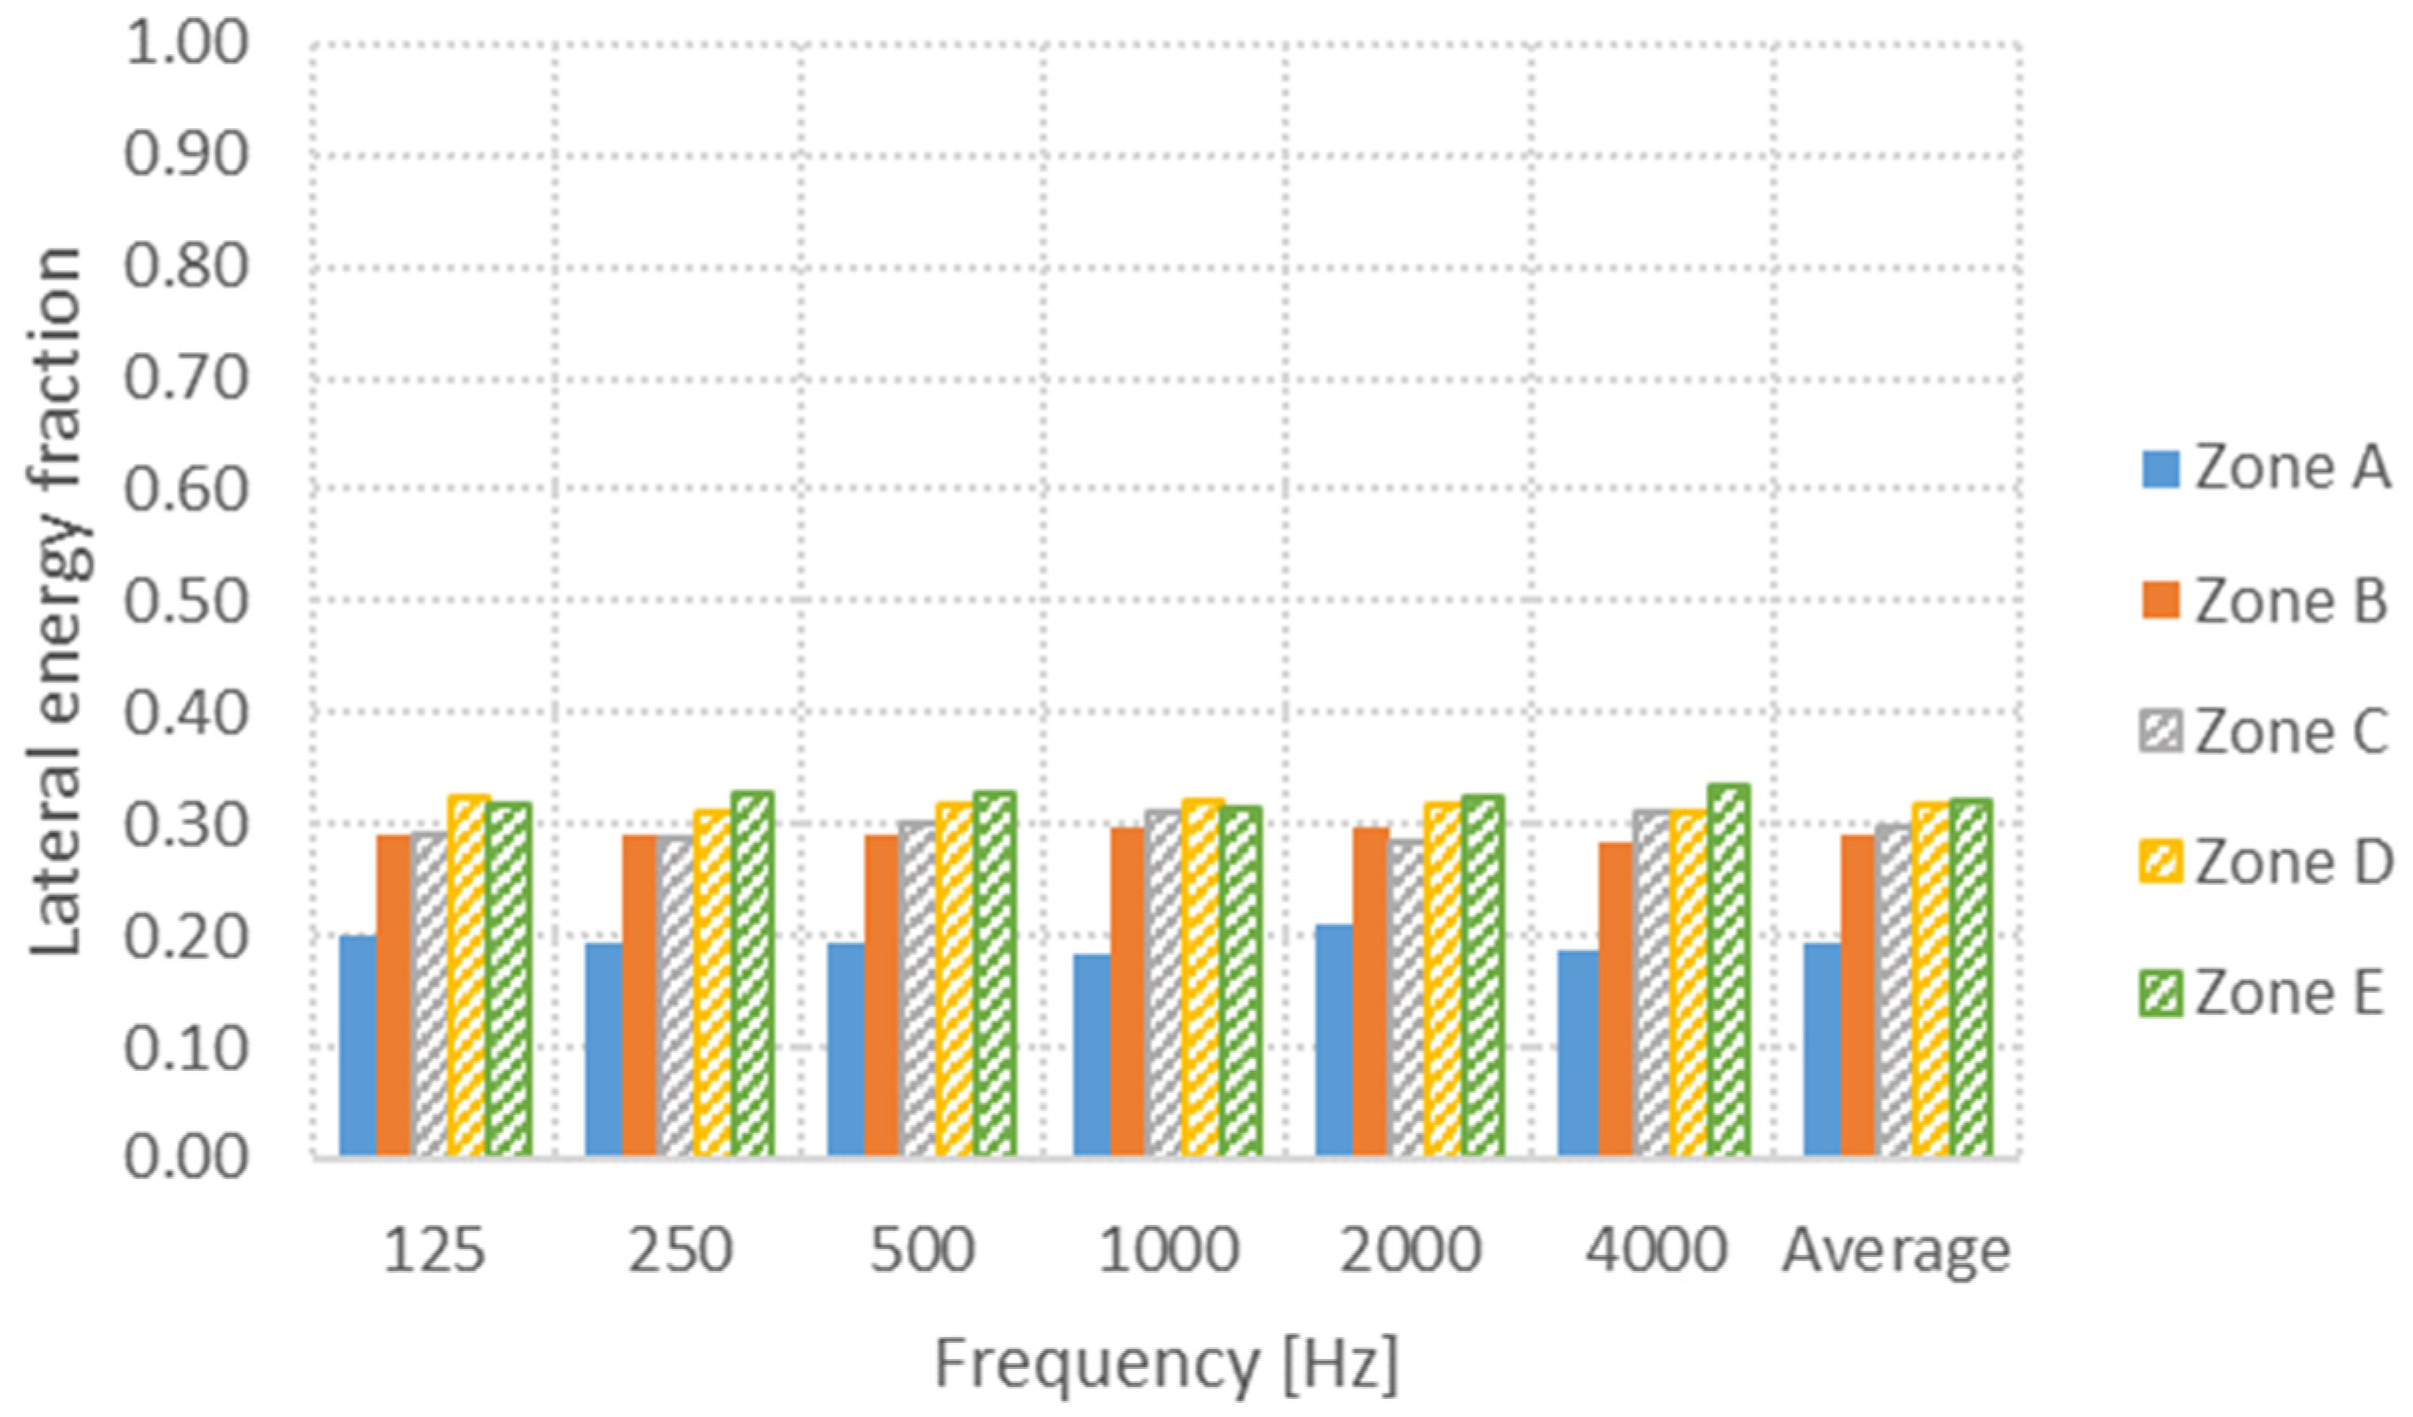
| LF | [0.19; 0.32] | [0.05;0.35] | ✓ |
| Max ΔL [dB] | 1.4 dB | ≤1 dB | ✓ |
| Parterre | Balcony | Spatial Distribution Evaluation | |||||||
|---|---|---|---|---|---|---|---|---|---|
| Subjective Listener Aspect | Single Number Acoustic Indicator | Zone A | Zone B | Zone C | Zone D | Zone E | Just Noticeable Difference among Zones (JND) | Reference Just Noticeable Difference (JND) | Analysis |
| - | T30 (s) | 1.55 | 1.55 | 1.54 | 1.55 | 1.56 | - | - | - |
| - | BR | 1.29 | 1.29 | 1.28 | 1.28 | 1.27 | - | - | - |
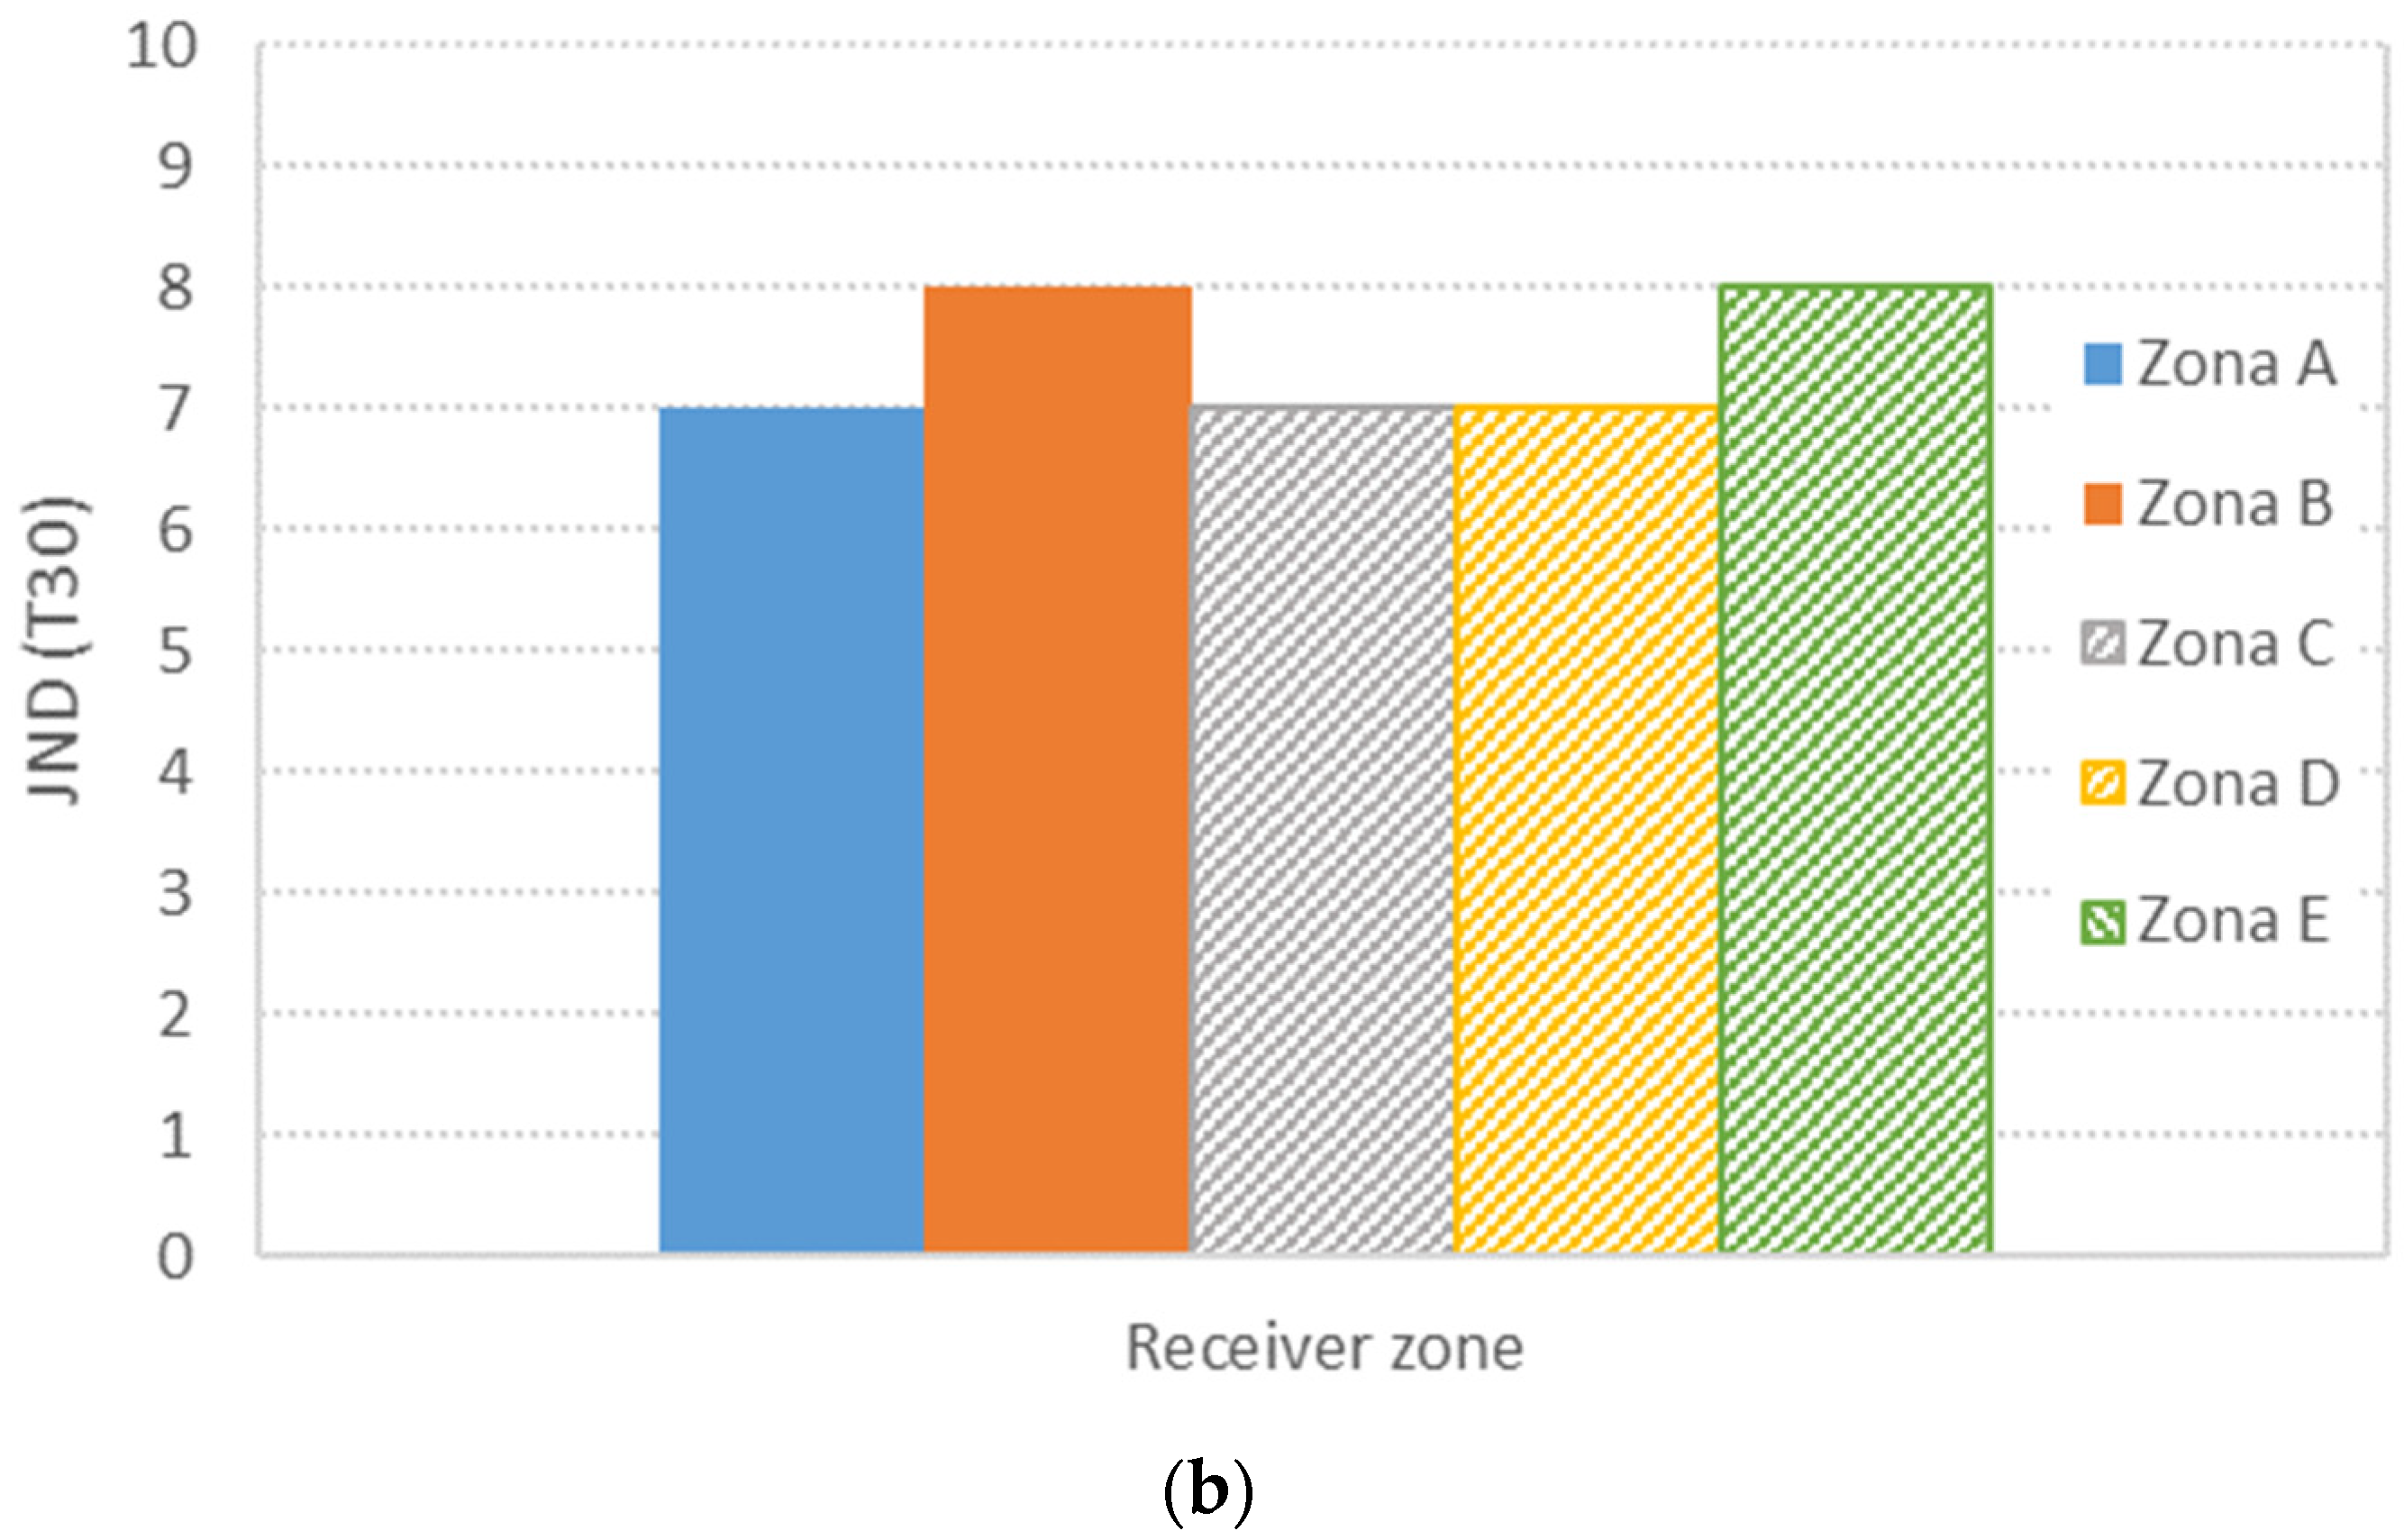
| Perceived reverberance | EDT (s) | 1.49 | 1.18 | 1.46 | 1.38 | 1.28 | ≤4 JND | 5% | Differences in the perception will be noticed bellow the balcony |
| - | RT/EDT | 0.94 | 0.73 | 0.92 | 0.87 | 0.78 | - | - | - |
| Perceived clarity of sound | C80 (dB) | 2.4 | 4.3 | 0.8 | 1.6 | 3.2 | ≤4 JND | 1 dB | Differences in the perception of clarity may be noticed |
| Subjective level of sound | G (dB) | 10.4 | 9.2 | 9.4 | 9.4 | 9.4 | 1 JND | 1 dB | ✓ |
| Apparent source width | LF | 0.19 | 0.29 | 0.30 | 0.32 | 0.32 | ≤3 JND | 0.05 | Differences in the perception of source will be noticed in the front seats |
| - | SPL [dB] | 88.7 | 87.7 | 87.2 | 87.3 | 87.4 | - | - | - |
Publisher’s Note: MDPI stays neutral with regard to jurisdictional claims in published maps and institutional affiliations. |
© 2021 by the authors. Licensee MDPI, Basel, Switzerland. This article is an open access article distributed under the terms and conditions of the Creative Commons Attribution (CC BY) license (https://creativecommons.org/licenses/by/4.0/).
Share and Cite
Pereira, A.; Gaspar, A.; Godinho, L.; Amado Mendes, P.; Mateus, D.; Carbajo, J.; Ramis, J.; Poveda, P. On the Use of Perforated Sound Absorption Systems for Variable Acoustics Room Design. Buildings 2021, 11, 543. https://doi.org/10.3390/buildings11110543
Pereira A, Gaspar A, Godinho L, Amado Mendes P, Mateus D, Carbajo J, Ramis J, Poveda P. On the Use of Perforated Sound Absorption Systems for Variable Acoustics Room Design. Buildings. 2021; 11(11):543. https://doi.org/10.3390/buildings11110543
Chicago/Turabian StylePereira, Andreia, Anna Gaspar, Luís Godinho, Paulo Amado Mendes, Diogo Mateus, Jesus Carbajo, Jaime Ramis, and Pedro Poveda. 2021. "On the Use of Perforated Sound Absorption Systems for Variable Acoustics Room Design" Buildings 11, no. 11: 543. https://doi.org/10.3390/buildings11110543