Article

Digital Simulation for Buildings’ Outdoor Thermal Comfort in Urban Neighborhoods

1
School of Architecture and Urban Planning, Beijing University of Civil Engineering and Architecture, Beijing 100044, China
2
Tsinghua Shenzhen International Graduate School, Tsinghua University, Shenzhen 518055, China
*
Author to whom correspondence should be addressed.
Buildings 2021, 11(11), 541; https://doi.org/10.3390/buildings11110541
Submission received: 11 October 2021 / Revised: 10 November 2021 / Accepted: 10 November 2021 / Published: 15 November 2021
(This article belongs to the Special Issue Architecture: Integration of Art and Engineering)

Abstract

:
Buildings’ outdoor thermal comfort influences environment quality and human behavior in urban neighborhoods. The Universal Thermal Climate Index (UTCI) has been broadly applied to the study of buildings’ outdoor thermal comfort in urban areas. However, complex environmental conditions in climate-sensitive urban areas can make UTCI assessment complicated and ineffective. This paper introduces digital techniques into buildings’ outdoor thermal comfort analysis for the improvement of the urban habitant environment. A digital simulation system is generated to facilitate the analysis procedure for buildings’ outdoor thermal comfort assessment in urban neighborhoods. The analysis addresses the research question: “Can digital simulation techniques provide a modeling system to assess buildings’ outdoor thermal comfort continuously and effectively?” Methods include a case study of neighborhoods in Beijing, qualitative and quantitative analysis based on digital processes, and parametric modeling. The results indicate that digital simulation techniques and tools have the capability to support the analysis of buildings’ outdoor thermal comfort by providing three-dimensional models, algorithm-based analysis, and visual simulation. The findings include a critique of digital simulation as applied to architecture study and insights on potentially improving buildings’ outdoor thermal comfort through human–computer interactions.

1. Introduction

Thermal comfort is the condition of mind that expresses satisfaction with the thermal environment [1]. In urban areas, people can experience outdoor thermal sensation in outdoor areas of buildings, such as public gardens, streets, and markets. Buildings’ outdoor thermal comfort analysis in urban space contributes significantly to human health [2]. The thermal complex is relevant to human health because of a close relationship between the thermoregulatory mechanisms and the circulatory system [3]. The assessment of outdoor thermal comfort has played an active role in promoting buildings’ outdoor environments and public life, especially in intensive urban neighborhoods. Digital simulation has proved its efficiency in architecture and civil engineering industries [4]. Hence, this paper scopes the possibility of improving the approach of buildings’ outdoor thermal comfort assessment by digital simulation techniques.
Early study on outdoor thermal comfort began with the analysis of British mines in the 20th century, and approaches have since developed over the decades. Developments in physics have resulted in a variety of approaches to the assessment of buildings’ outdoor thermal comfort. A widespread consensus holds that direct sun falling on a person can substantially affect buildings’ outdoor thermal comfort [5,6,7,8]. Nowadays, the differing models of outdoor thermal comfort assessment can be broadly delineated by two categories: thermal safety and thermal balance. Thermal safety models evaluate the safety of work environments. Variables include the physical index, air quality and subjective experiences. The application of the thermal safety model began with endeavors to understand the indoor and outdoor thermal environments of office buildings—particularly those in tropical and subtropical zones. In 1919, the American Society of Heating and Ventilation Engineers first analyzed the influence of thermal comfort on human sensation and health. After that, Corrected Effective Temperature (CET) was created in 1930s to assess thermal safety using globe thermometer temperature instead of dry bulb temperature in those cases where the reading of the globe thermometer was higher than the dry bulb temperature [9]. With increasing demand for outdoor thermal comfort analysis, the use of Web Bulb Globe Temperature (WBGT) began in order to prevent thermal injury accidents in military training. In 1984, Steadman indicated that the equivalent Apparent Temperature (AT) could measure a building’s outdoor temperature as perceived by humans by considering temperature, relative humidity, and wind speed [10]. The US National Weather Service simplified and converted AT into a multivariate statistical regression model and renamed it Heat Index (HI). HI indicates that a sustained wet bulb temperature of about 35 °C can be fatal to healthy people; at this temperature, our bodies switch from shedding heat to the environment to gaining heat from it [11]. WBGT, AT, and HI have been used evaluate human safety in harsh environments.
In contrast to the thermal safety model, the thermal balance model believes that physical human comfort is based on biological heat exchange mechanisms. Although sunlight has a greater impact than either wind or humidity on thermal comfort [12,13,14], thermal comfort also encompasses buildings’ external environmental situation, breathing heat dissipation, and the thermal resistance of clothing. In 1970, Predicted Mean Vote (PMV) was developed by Fanger as an empirical measure of the human sensation of thermal comfort [15]. PMV uses a thermal sensation score to describe the vote of multiple participants. However, buildings’ outdoor thermal environment is far more complex than an indoor one. The diversity of activities and increased metabolic levels complicate the measurement of outdoor thermal comfort. Physiological Equivalent Temperature (PET) was generated to specifically analyze outdoor thermal comfort. PET reflects a situation in which human skin and internal body temperatures are balanced with air temperature within a specific environment. As Matzarakis and Amelung stated, PET could measure how changes in the thermal environment can affect human well-being [3]. These well-documented thermal indices have varying foci but are essentially different combinations of the same set of important meteorological and thermophysiological parameters [16]. The International Society of Biometeorology recently proposed the Universal Thermal Climate Index (UTCI) meets the requirements for analyzing human biometeorology, individual characteristics, and valid evaluation procedures in all climates, seasons, and scales [17]. The UTCI is primarily concerned with balancing the temperature of human bodies [18,19] and generates objective thermal models which are applicable to architecture and urban design [20,21,22].
The urban neighborhood environment is currently more climate-sensitive than ever before. The assessment of the thermal environment is one of the main issues in climatic research, and more than 100 simple climatic indices have been developed to facilitate it thus far [17]. Increasing population, building density, and automobiles have created sensitive and fragile living habitats for humans. Inhabitants of urban areas witness air pollution, global warming, and flood disasters. The UTCI processes become complicated in the face of increasingly complex climate situations and sensitive living environments. Multiple factors, including air temperature, water vapor pressure, humidity, and wind speed, work together to calculate the UTCI value of a specified area. The resulting value represents a fixed instant that fails to represent the thermal situation over a continuous period of time. Moreover, current UTCI calculation results are presented as two-dimensional data. They do not intuitively indicate the outcome of multiple calculations.
This paper introduces the use of digital simulation technology to support buildings’ outdoor thermal comfort analysis. Digital simulation utilizes computer-aided tools to redefine the relationship between building geometries and outdoor environments by considering variables as dynamic and mutable elements. Data calculations of UTCI are extended and presented as a year-round outdoor thermal comfort simulation with three-dimensional models. Parametric manners help to effectively evaluate buildings’ outdoor thermal comfort with UTCI processes. The research question can be described as: Can digital simulation techniques provide a modeling system to assess buildings’ outdoor thermal comfort continuously and effectively?

2. Methods

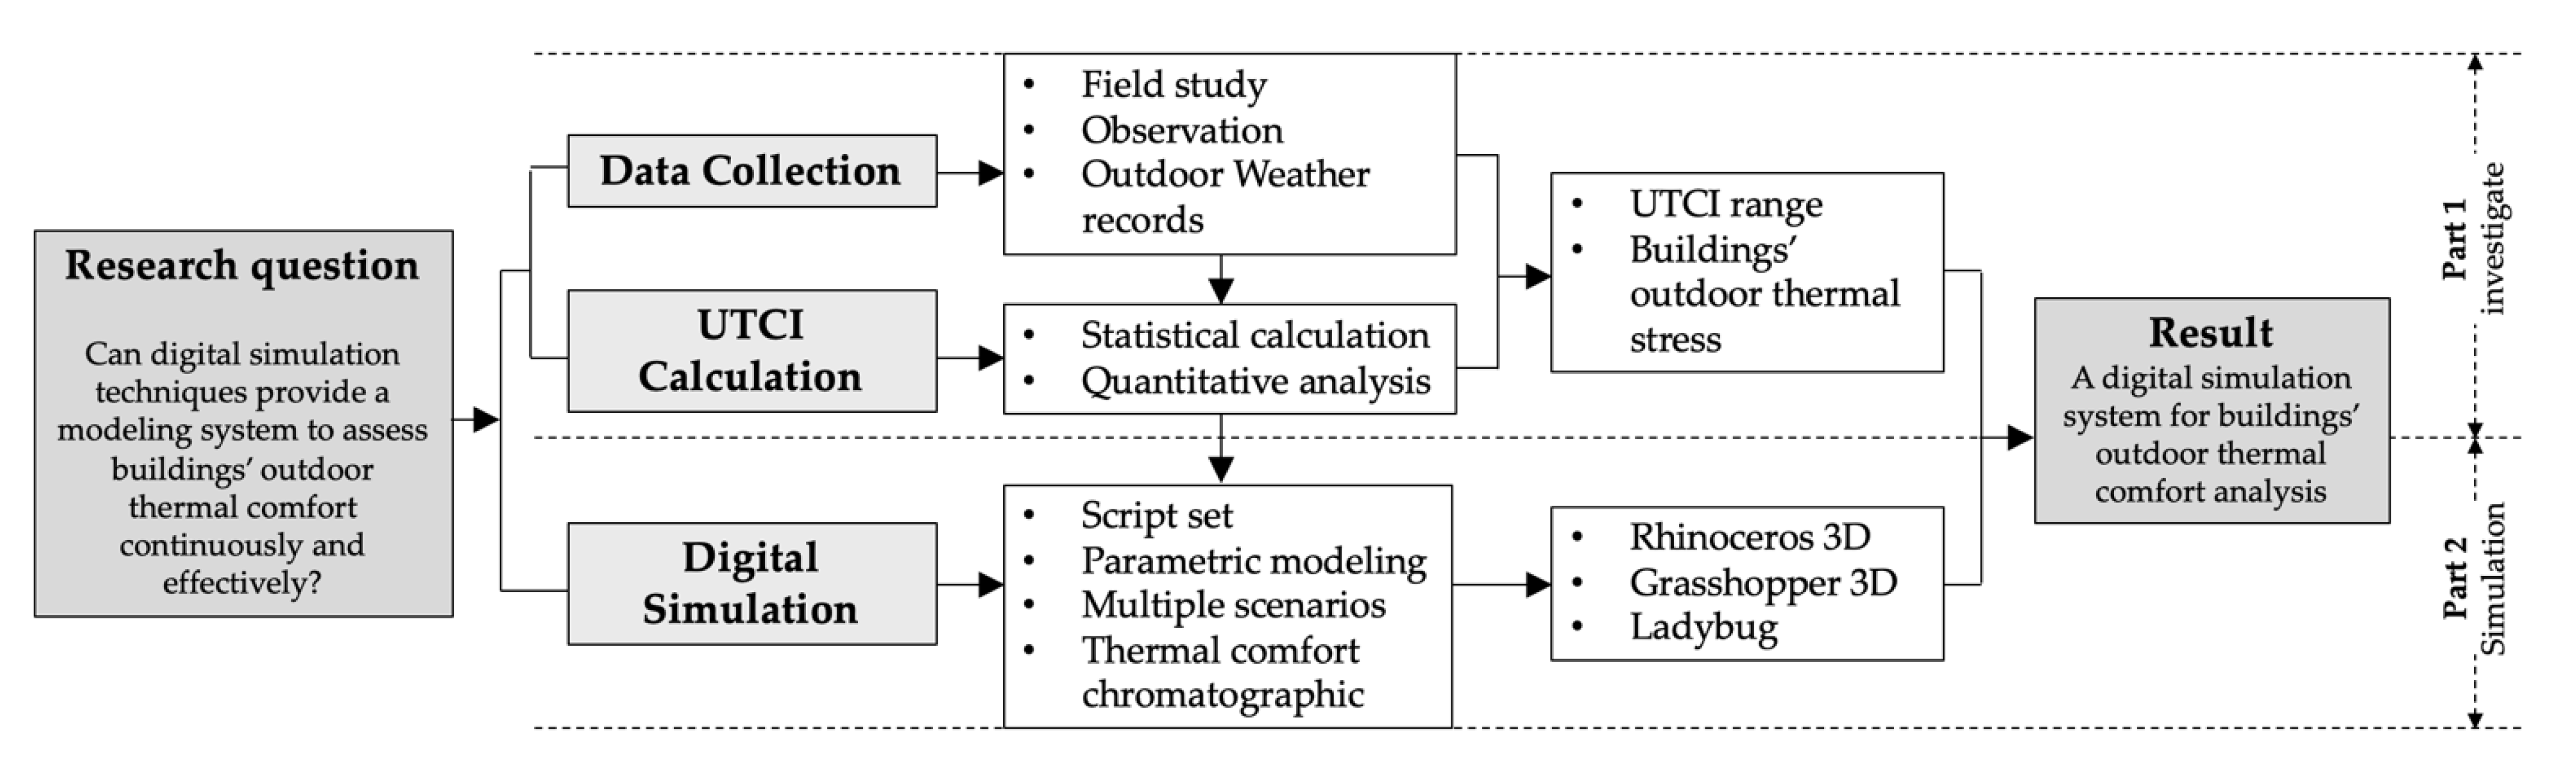
In order to address the research question, two urban neighborhoods of Beijing, China were selected as study samples. A method framework was built. It consisted of two parts. Firstly, data collection and UTCI calculation approach worked to understand the outdoor thermal comfort condition of the nominated neighborhoods. Methods included field study as well as qualitative and quantitative analysis. It tended to calculate buildings’ outdoor thermal comfort stress as the standard that the UTCI indicates. Secondly, digital simulation worked to analyze and assess buildings’ outdoor thermal comfort by providing three-dimensional models, algorithm-based analysis, and visual simulation. Rhinoceros 3D and Grasshopper 3D software (with plug-in Ladybug) were employed as digital simulation tools. Figure 1 presents the methodology framework.
The assumptions were that (1) UTCI calculation can work to analyze buildings’ outdoor thermal comfort in the nominated neighborhoods in Beijing; (2) digital manners can provide a continuous and effective approach to analyze buildings’ outdoor thermal comfort by embedding UTCI calculation into digital modeling platform. Part 1 of the methodology framework (Figure 1) targeted a response to the first assumption. Part 2 targeted a response to the second assumption.

2.1. Data Collection and UTCI Calculation

Two typical neighborhoods in Beijing were nominated for use as experimental cases. Beijing, the capital of China, has developed quickly in the last few decades. The increasing density of population and buildings make the city one of the greatest metropolises of the world. The nominated neighborhoods are located at Sanlihe East Road and Nanshagou Road, Haidian District. Both contain dense residential buildings and variously scaled street stores. The choice of these neighborhoods was two-fold: They are similar in location, building density and climate sensitivity. The two nominated neighborhoods were close to each other in location. The Sanlile neighborhood is located at 39.9065° N, 116.3305° E. The Nanshagou neighborhood is located at 39.9169° N, 116.3265° E. The similarity of the geographical location means they have similar humidity, climate situation, and wind condition in the semi-humid and semi-arid monsoon zone. Building functions, materials, and the age of the nominated neighborhoods are also similar. Most buildings in the Sanlihe and Nanshagou neighborhoods are both intended for residences, with brick–concrete building structures. The two neighborhoods were both constructed in the 1980s–1990s. The difference between them is the layout of building clusters. In the Sanlihe neighborhood, building cluster is presented as a mix of enclosure-type and line-type. In the Nanshagou neighborhood, building cluster is presented as a line-type. It is of benefit to control variables when assessing buildings’ outdoor thermal comfort between different building cluster forms. Additionally, the chosen neighborhoods share spatial characteristics of residential areas in old city of Beijing. Experimental results can provide references for community and neighborhood renewal in similar areas.
In order to understand buildings’ outdoor thermal comfort condition, data collection in the neighborhoods encompassed three types: average temperature, humidity, and wind speed. A thermohygrometer (type: ADT7461ARMZ-R7) worked to collect the temperatures and humidity data multiple times, then achieved average values. An anemograph (type: TSI9535) worked to measure wind speeds.
UTCI calculation was the foundational method used. Standard UTCI analyzed the sensible temperature of a human body with ideal conditions—where the wind speed was 0.5 m/s, the mean radiation temperature was equivalent to the air temperature, and the relative humidity was 50.0%. The experimental participant had specific physical features: they weighed 73.5 kg and had a body fat content of 14.0%. The conceptual equation of UTCI was presented as Formula (1). Basing on the Commission for Thermal Physiology of the International Union of Physiological Sciences, UTCI assessment has multiple categories ranging from extreme heat stress to extreme cold stress [23].
UTCI = Ta + offset (Ta; Tmrt; Va; RH)
where Ta = average temperature (°C), Tmrt = mean radiant temperature (Kelvin), Va = average wind speed (m/s), RH = relative humidity (%). Va value is limited between 0.5 and 17 m/s.
According to the UTCI assessment scale and the collected data, the conditions of buildings’ outdoor thermal comfort of the neighborhoods could be calculated.

2.2. Digital Simulation

Digital simulation was used as a novel method for the facilitation of buildings’ outdoor thermal comfort analysis. It is rooted in digital animation techniques, and the latest refinements are based on advanced parametric design systems and scripting methods [24]. This paper used Rhinoceros 3D and Grasshopper 3D software (Robert McNeel and Associates. Seattle, WA, USA) to edit scripts and geometry constraints and to build digital models. Rhinoceros 3D and Grasshopper 3D rely on algorithm logic to create geometry with a visual programming language interface [25]. An algorithm is expressed within a finite amount of space and time and in well-defined formal language to calculate a function in mathematics and computer science [26]. It starts with an initial state and input then describes a computation that, when executed, proceeds through a finite number of well-defined successive states, eventually producing the output, then terminating [27].
The digital simulation procedure contained two aspects: input parameters and output models with quantified outdoor thermal comfort measurements. The input parameters included location, dry bulb temperature, relative humidity, direct normal radiation, diffuse horizontal radiation, horizontal infrared radiation, season, and solar-adjusted mean radiation temperature. These variables were embedded into the constraint script of Grasshopper 3D. The script contained three sections. The first step was to input parameters of physical built environment, such as neighborhoods’ coordinates and building locations. The second step contained the input of thermal-related parameters, such as dry bulb temperatures, relative humidity and direct normal radiation. The third step was to input season parameters, such as a typical summer week. A typical summer week means the week containing the day of the summer solstice. Through automatic calculation with the parametric software, three-dimensional models of outdoor thermal comfort performance could be directly presented in Rhinoceros 3D. Ladybug, a plug-in of Grasshopper 3D, inputs climate data into the digital simulation system. The required input climate data, such as historic average temperature and mean radiant temperature, could be captured with open access of the China Standard Weather Database. This procedure enables an outdoor thermal comfort analysis over a continuous one-year period. The scope of the digital simulation system includes a rational insight into how people of a building cluster can access and use outdoor space comfortably. It helps urban planners, architects, and civil engineering analysts to quantify thermal measurement and improve the planning and design process with due consideration to sustainability.
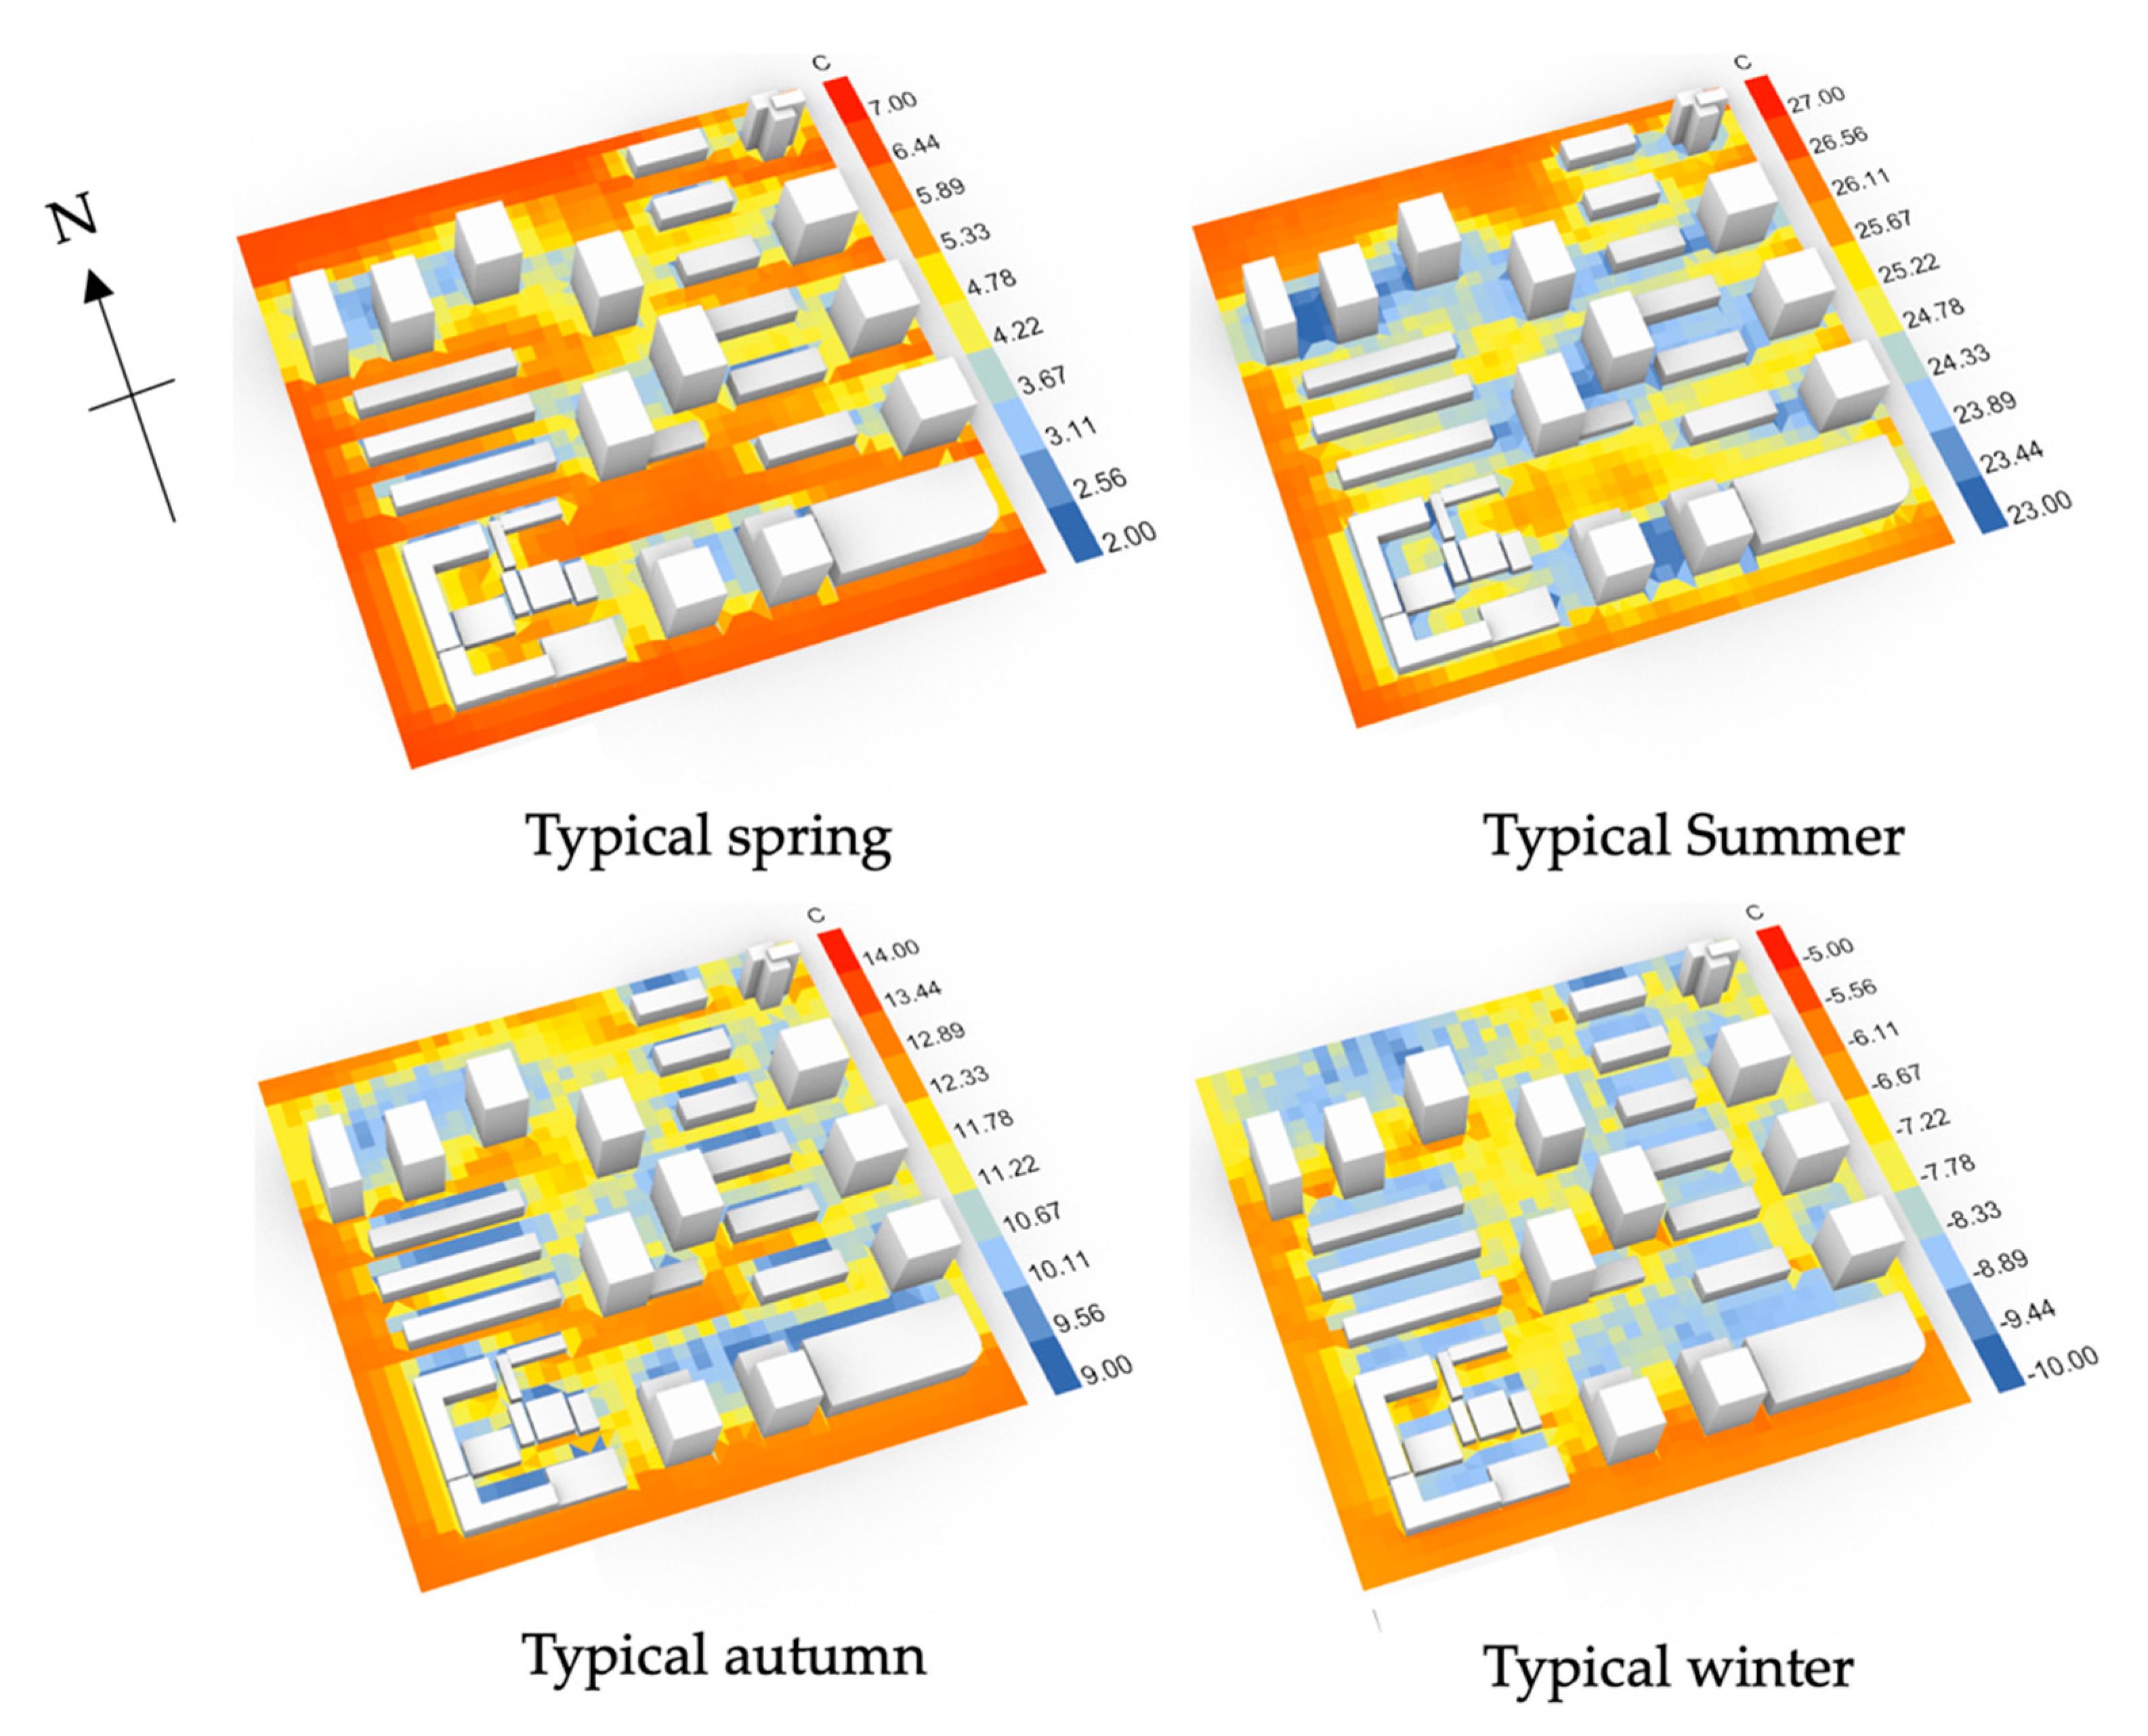
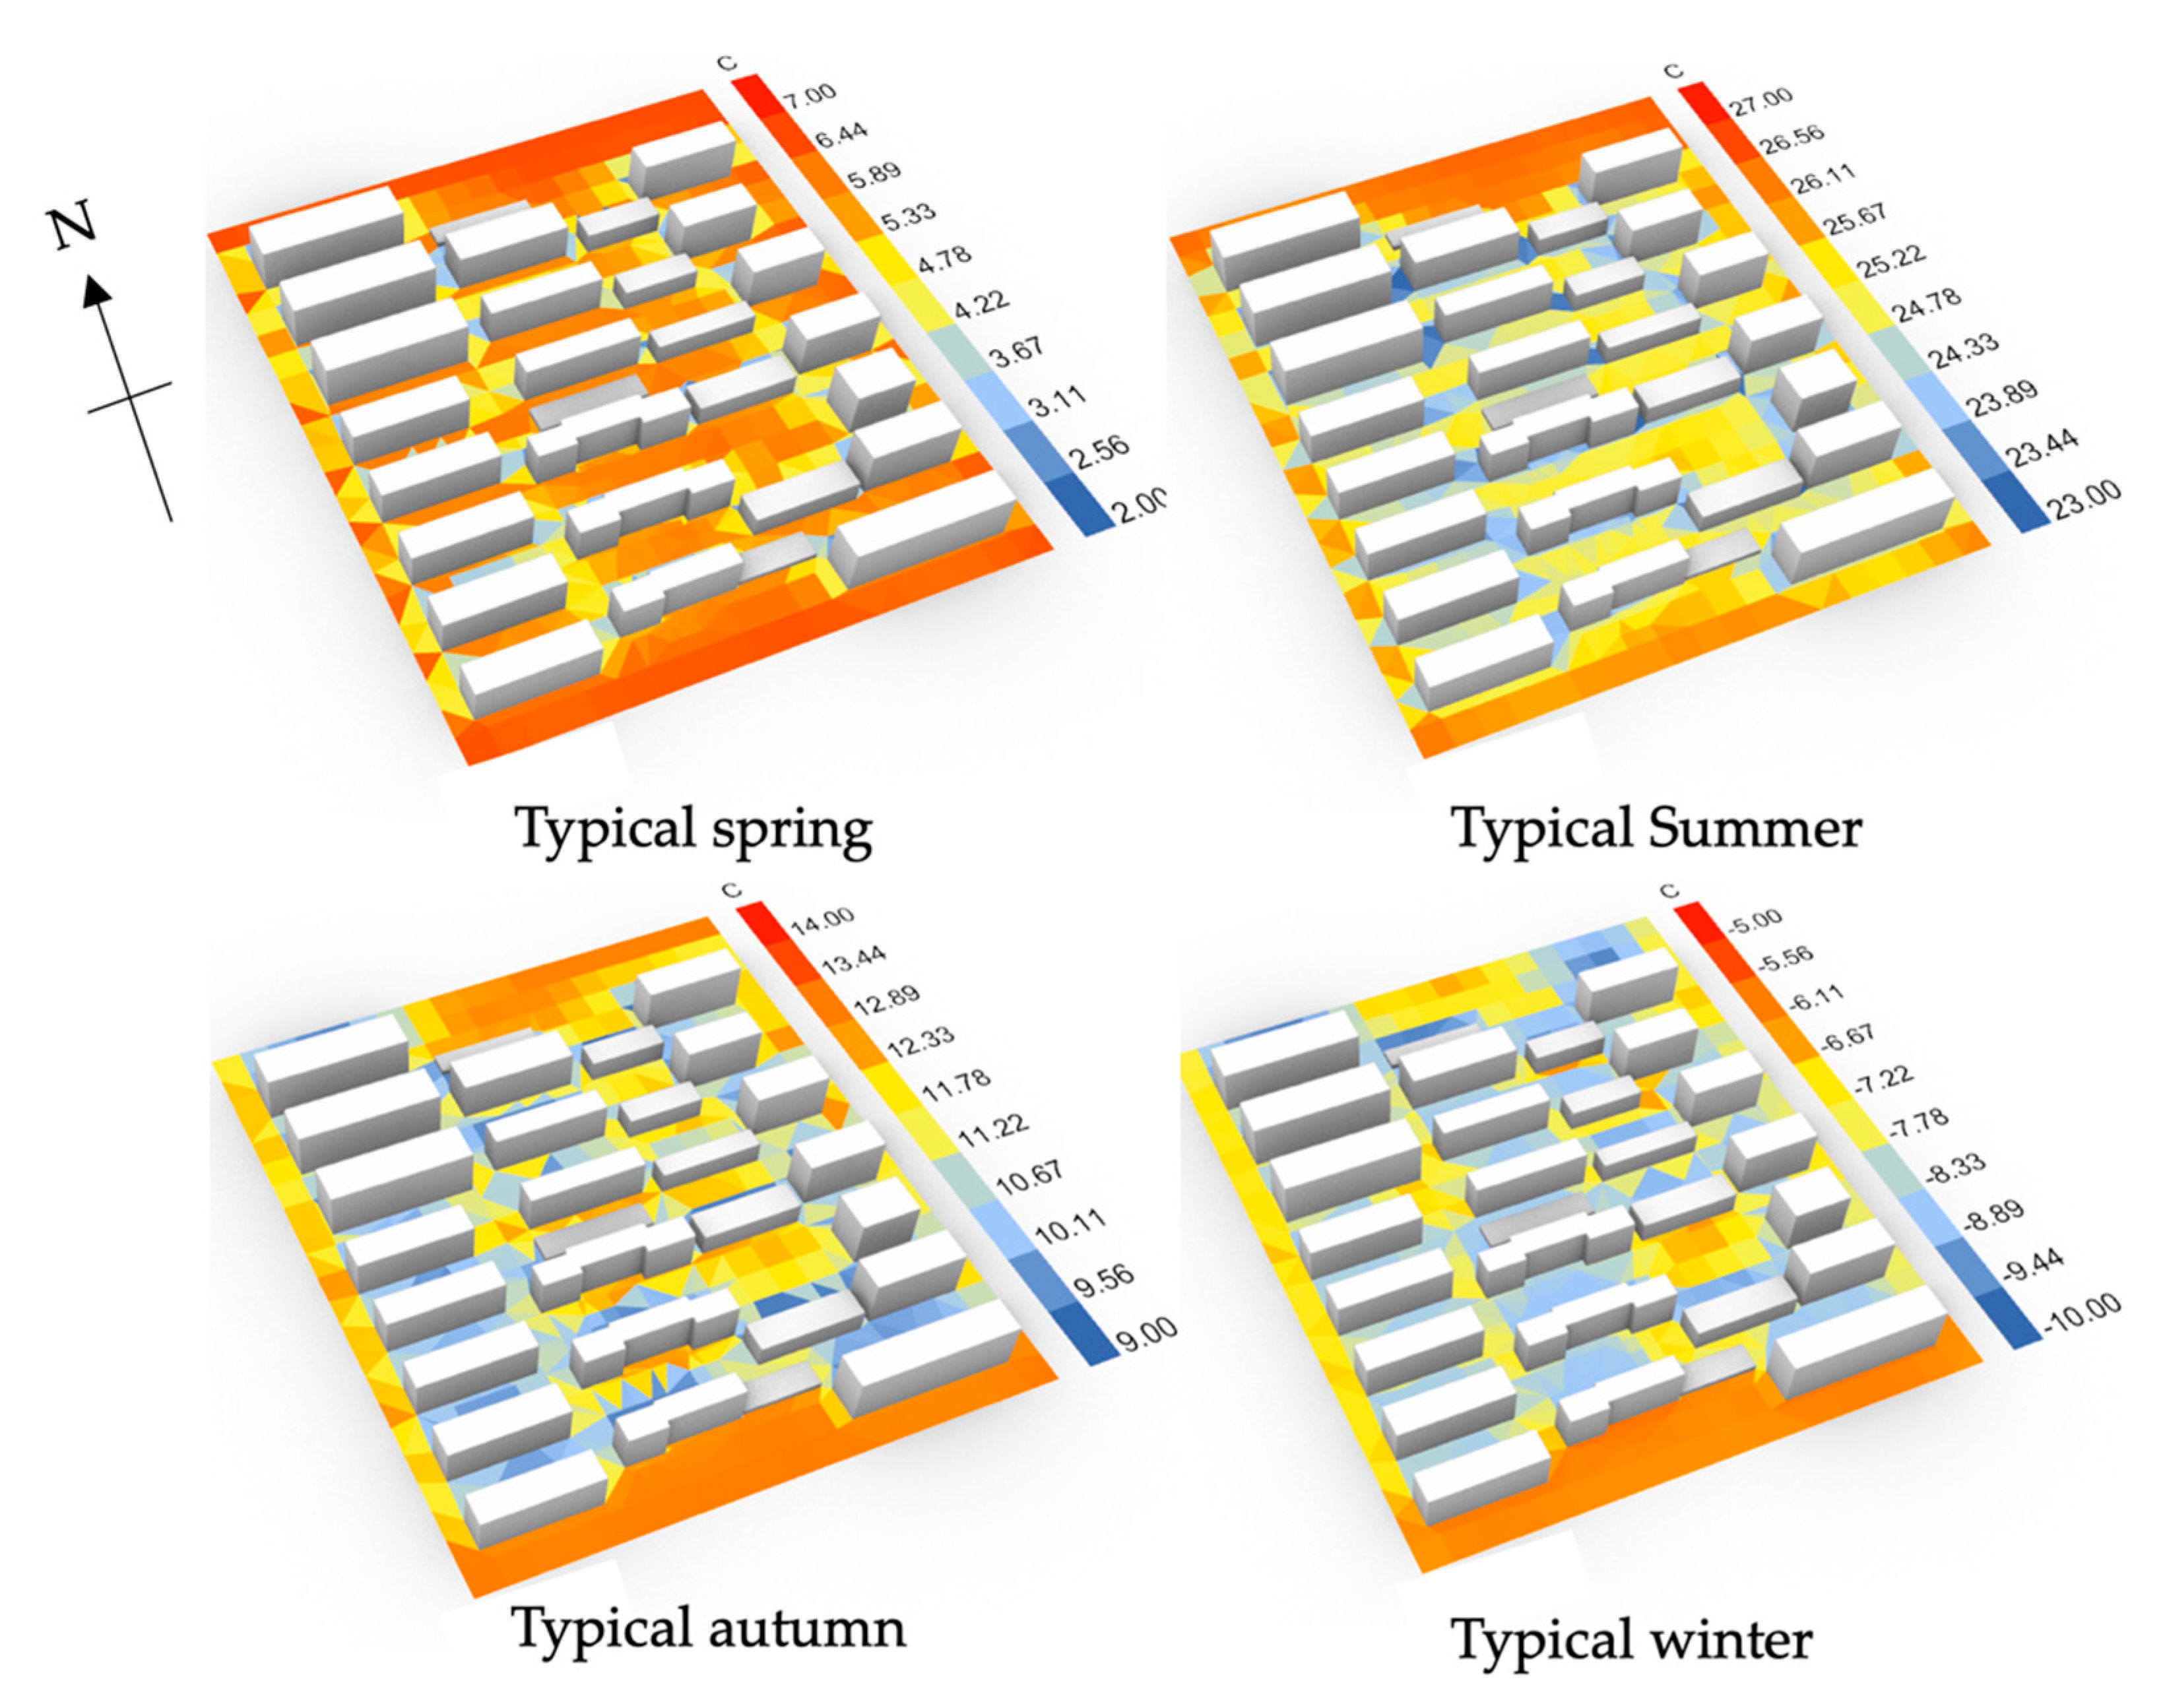
Digital tools helped to provide simulation results of buildings’ outdoor thermal comfort of the nominated neighborhoods. 
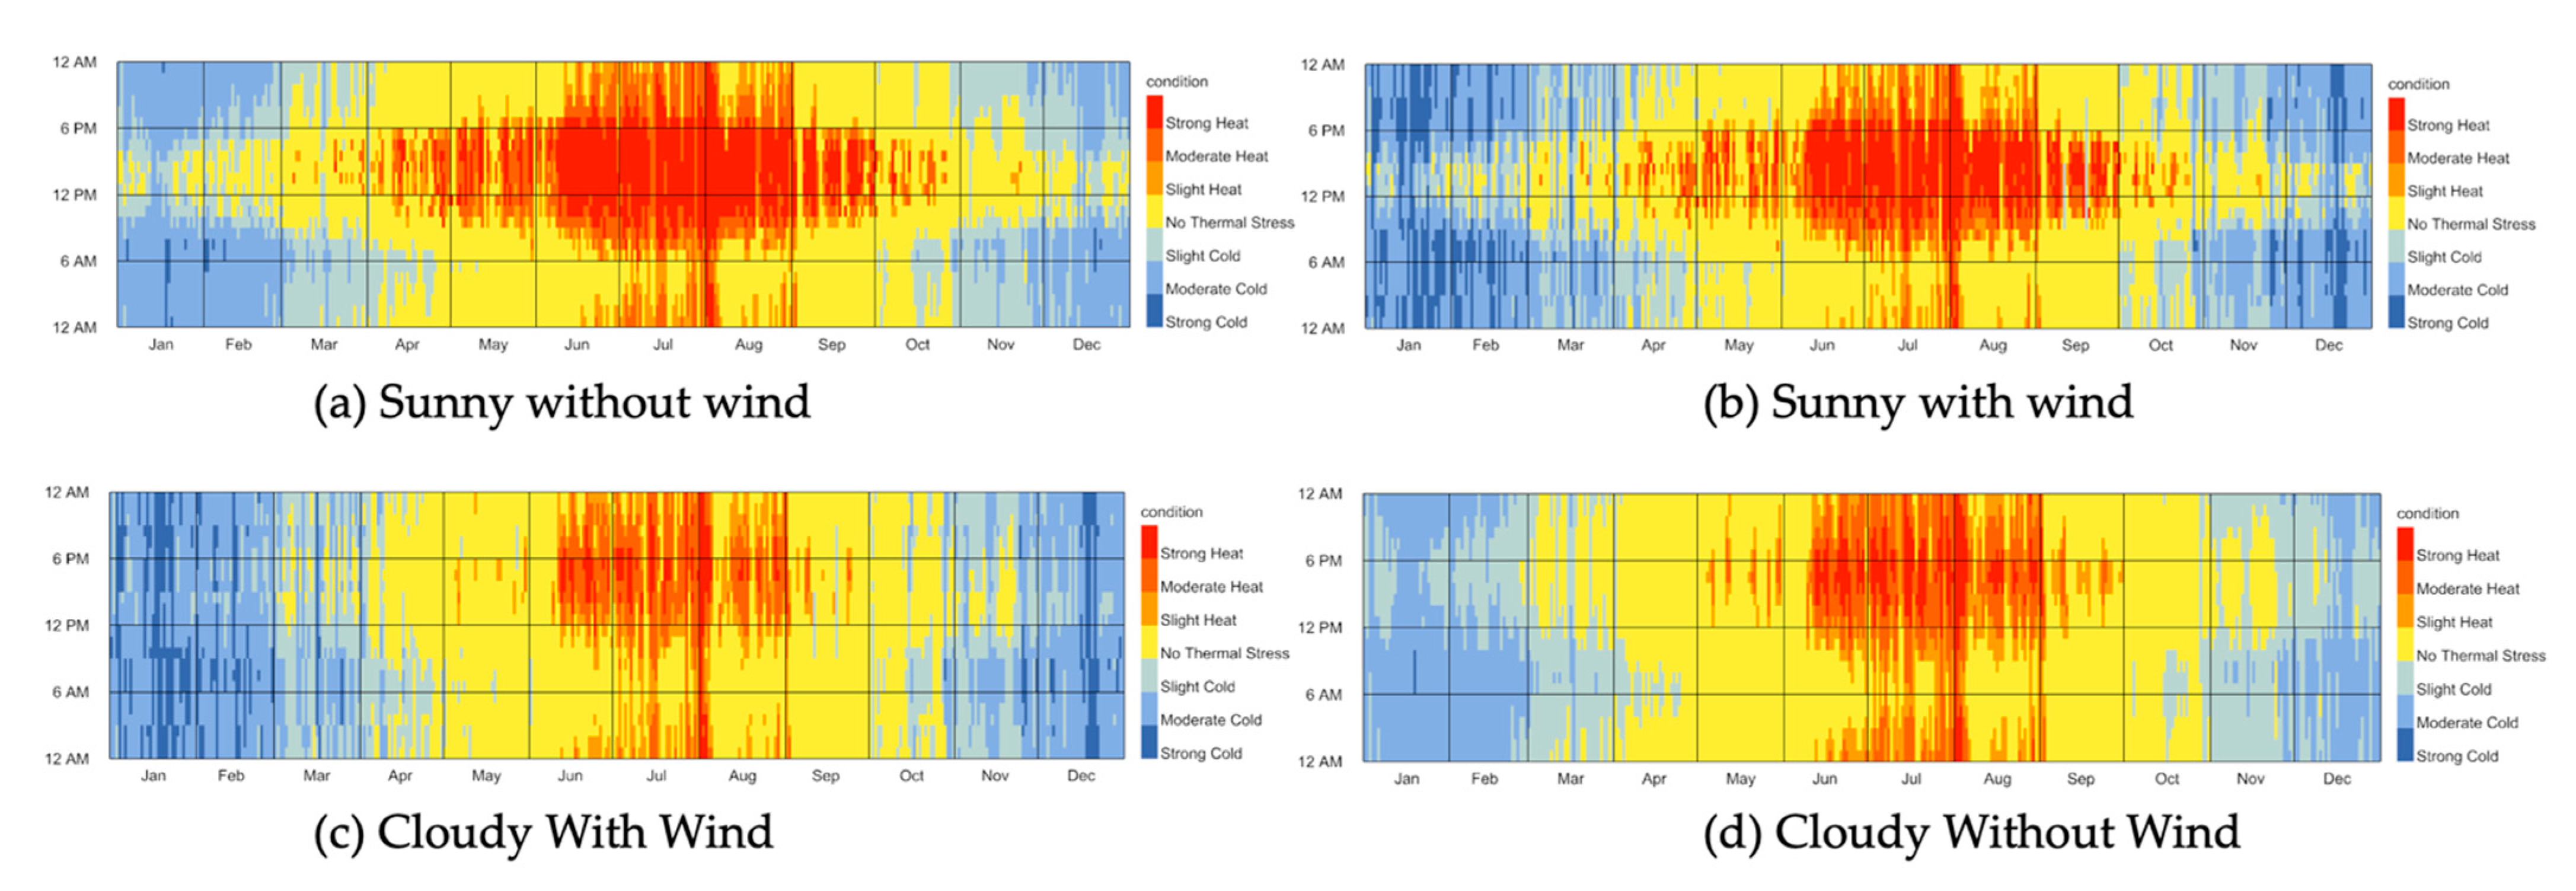
Figure 2 presents the foundational climate situation over a one-year period (8760 h) in Beijing, as generated in Grasshopper 3D and its plug-in, Ladybug. Briefly, the simulation indicated that warmer months are between June to August and cold months fall between December and February in Beijing. Summer and winter are relatively longer than spring and autumn; sunlight and wind affect the sensible temperature. Different sunlight and wind climates create a curve fluctuation, and sunny days without wind result in a relatively comfortable outdoor thermal situation in spring and autumn.

3. Results and Discussion

3.1. Buildings’ Outdoor Thermal Comfort Simulation Results

In the nominated neighborhoods, building heights are multiple. In the Sanlihe neighborhood, the tall buildings have 12 floors with an approximate height of 36 m. They are located in the northern, middle, and eastern areas of this neighborhood. Medium tall buildings have six floors, with an approximate height of 18 m. They are located in eastern and western areas. Low buildings have two to three floors with approximate heights of 6 to 9 m. They are located in the southern area. In the Nanshagou neighborhood, buildings have four to seven levels, with heights of 12 to 21 m, approximately. The distance between buildings is not a necessary parameter in Rhinoceros 3D and Grasshopper 3D. As coordinates of the neighborhoods are provided, the software can automatically calculate the coordinates of each building. Grasshopper 3D uses the geographic coordinates to directly analyze the solar radiation situation rather than the distances. Typical days of each season represent the outdoor thermal comfort situation. A typical spring means the day of the spring equinox. A typical summer means the day of the summer solstice. A typical autumn is the day of the autumnal equinox. A typical winter is the day of the winter solstice. The Sanlihe neighborhood (39.9065° N, 116.3305° E) is a relatively complex residential area with multi-height buildings. Building layouts can significantly impact outdoor thermal comfort in terms of access to sunlight and experiences of wind speed. In this case, the tall buildings cluster in the middle, eastern and northern areas. The simulation result of the Sanlihe neighborhoods is shown in Figure 3. Presented in Rhinoceros 3D, the simulation indicates that outdoor thermal comfort varies across a one-year period. In spring, the perceived outdoor temperature ranges between 2 °C and 7 °C. Most open spaces are at relatively comfortable temperatures, excluding those areas shadowed by tall buildings. People can do outdoor activities such as strolling between buildings of western and southern areas as well as in courtyards. In summer, the perceived outdoor temperature is between 23 °C and 27 °C. Shadow areas are larger than in spring. People tend to use the shadows, especially in southern areas, for outdoor activities to avoid direct sunlight. In autumn, the perceived outdoor temperature is between 9 °C and 14 °C and the temperature of outdoor spaces is relatively balanced. Outdoor thermal comfort displays a mild feature with a mean temperature of 11 °C. In winter, the shadow areas become much larger. The perceived outdoor temperature falls to −5 °C to −10 °C. Outdoor activities and movement become uncomfortable. Only the southern and western parts of the neighborhood enjoy a relatively warm atmosphere.
Digital simulation also represents buildings’ outdoor thermal comfort conditions of the Nanshagou neighborhood (39.9169° N, 116.3265° E). Building arrangement forms a regular matrix. Figure 4 presents the simulation results. In spring, the perceived outdoor temperature is between 2 °C and 7 °C. Open space areas in the southern and northern parts of the neighborhood are of relatively comfortable temperatures. Shadows occur in the northern parts of buildings, creating relatively cool sensations. In summer, the perceived outdoor temperature ranges between 23 °C and 27 °C. Outdoor thermal environments become warmer. Most areas are too warm for long periods of outdoor activity. People tend to stay in the shadows around buildings. In autumn, the perceived outdoor temperature is between 9 °C and 14 °C. The floor areas of warm and cold spaces are on a similar scale, with the southern region being relatively warmer than other zones. In winter, the perceived outdoor temperature falls to −5 °C to −10 °C, so the cold area grows. Solar radiation is an important factor affecting outdoor thermal comfort. Direct sunlight provides the southern area with a relatively warm atmosphere.
The nominated neighborhoods of Beijing provide two types of residential layout for testing the digital simulation system. Digital simulation results in Figure 3 and Figure 4 can reflect different building cluster types that affect buildings’ outdoor thermal comfort. For example, it would be warmer both around the outside and inside (south-west area) of the Sanlihe neighborhood in spring. However, it would be warmer between buildings and outside (north and south area) of the Nanshagou neighborhood in the same season. The results demonstrate that UTCI calculation can work to analyze buildings’ outdoor thermal comfort in the nominated neighborhoods in Beijing. Additionally, building geometries, locations, and cluster types can affect outdoor thermal comfort. Tall buildings lead to low perceived outdoor temperatures, considering the factors of solar radiation, wind speed and relative humidity. Areas outside the building clusters present warmer temperatures than areas between buildings. Enclosed building layouts form inner yards. Inner yards may create a cool atmosphere on summer days with favorable thermal conditions. The higher the distance between buildings, the warmer the emerging nodes. Residents desire intense sunlight and high temperatures in winter, but shadows and lower temperatures in summer.

3.2. A Digital Simulation System for Analyzing Building’s Outdoor Thermal Comfort

Conventional approaches of analyzing buildings’ outdoor thermal comfort rely on two-dimensional data calculations. It reflects outdoor thermal comfort conditions at specific points in time with temperature values. The present in situ results of buildings’ outdoor thermal comfort analysis can be presented as numbers and brief text-based descriptions. No direct three-dimensional simulation or visual performance is presented. That makes the analysis results too abstract to guide real building projects. For architects and civil engineering researchers to appreciate thermal comfort over a continuous time period, a volume of climate data must be collected and calculated multiple times. The process requires a significant investment of time and human resources. Table 1 shows examples of thermal comfort condition descriptions.
Based on data collection and UTCI stress category, the nominated neighborhoods have outdoor thermal comfort conditions of moderate cold stress, slight cold stress, and no thermal tress. General outdoor activities would be suitable in most public spaces outside buildings. Data were collected manually the Sanlihe and Nanshagou neighborhoods. Temperature, relative humidity, and wind speed were measured using a thermohygrometer (type: ADT7461ARMZ-R7) and anemograph (type: TSI9535) in the morning (8:00 a.m.), evening (6:00 p.m.), and at noon time (12:00 p.m.) the spring season (10 April 2021). The measurement is instantaneous by manual instruments. The height of temperature records is approximately 1.7 m. Average temperature, relative humidity, and average wind speed come from the mean value of the three records from morning to evening. Putting data into Equation (1), calculation results show in column UTCI of Table 1. They are examples of traditional UTCI manners that analyze buildings’ outdoor thermal comfort. The more accurate the UTCI calculation result is, the more data should be collected. According to the Commission for Thermal Physiology of the International Union of Physiological Sciences, the thermal comfort situation is described briefly, such as slight cold stress or moderate cold stress. UTCI calculation can only reflect the thermal characteristics but no corresponding physical edge.
However, digital simulation results are more dynamic and accurate than traditional ones. As Figure 3 and Figure 4 indicate, three-dimensional models contain more information regarding building environment, accurate construction edges, and thermal comfort rates of each coordinate point. For example, in the typical spring simulation of Figure 3, the UTCI calculation results by Grasshopper 3D range from 2.00 to 7.00. It means the buildings’ outdoor thermal comfort has the characteristic of slight cold stress. The data come from a year-round database of the China Standard Weather Database. Digital tools operate big data instead of manual work. Digital simulation methods are used to improve the calculation approach by generating three-dimensional models. These models can reflect exact physical edges that show where thermal comfort zones are and where not. Model-based results have the capability to guide real-life construction practice in architecture and civil engineering.
This paper introduces digital manners to thermal comfort calculation and generates a digital simulation system to improve methods of buildings’ outdoor thermal comfort analysis. Human–computer interaction tools provide a process for combining algorithms with UTCI analysis. Grasshopper 3D and Rhinoceros 3D work as digital tools for translating a variety of parameters, such as wind speed and relative humidity, into visibly demonstrable command components. Digital techniques simulate buildings’ outdoor thermal comfort. The simulation presents algorithm-based three-dimensional models. Thermal comfort is shown as chromatography based on the three-dimensional models. Clear building clusters and outdoor thermal comfort edges are shown in direct visualized models. The results indicate that digital manners can provide a continuous and effective approach to analyze buildings’ outdoor thermal comfort through embedding UTCI calculation into the digital modeling platform of Rhinoceros 3D and Grasshopper 3D. Additionally, urban alternatives may be simultaneously generated at a low computational cost and may be easily formulated within existing building and zoning boundaries [28].
Although parametric techniques can support procedures of buildings’ outdoor thermal comfort analysis, they are not a panacea resolving all issues pertaining to evaluating bodily sensations of temperature. This paper uses digital operations to chromatographically depict thermal comfort conditions. All results are based on limited parameters related to physical sensations of temperature. However, many more factors may impact buildings’ outdoor thermal comfort and human sensations of temperature. These may include the geographic situation, the landscape, and individual differences between human beings. Additionally, subjective sensations have not been factored into the digital simulation system. Overemphasizing digital techniques in physical environments may limit the success of addressing urban challenges. The digital simulation proposed in this paper can thus provide references for buildings’ outdoor thermal comfort evaluation, rather than a complete picture.

4. Conclusions

This paper experimentally generates a digital simulation system for analyzing and improving buildings’ outdoor thermal comfort in urban neighborhoods. Two neighborhoods of Beijing were nominated as research areas. Conventional UTCI measurements can reflect buildings’ outdoor thermal comfort situations by manual calculations and text-based descriptions. It calculates outdoor thermal comfort at a specific time point. Digital simulation uses more parameters to compute a volume of data (for example, climate records of one year-round period) to reflect a more accurate thermal comfort analysis. In this paper, conventional UTCI measurements and digital simulation both work on the nominated neighborhoods. The UTCI calculation results of the two approaches tend to be in accordance, while digital simulation provides a more visualized, effective, and continuous manner. Simulation experiments demonstrate the feasible application of that technology to support buildings’ outdoor thermal comfort calculation for achieving sustainable climate-sensitive territories. It proves simulation techniques that can provide a modeling system to assess buildings’ outdoor thermal comfort continuously and effectively. Conventional thermal comfort analysis procedures largely rely on a plethora of climate information and complex calculation with two-dimensional data. Digital techniques have the capability to present quantified thermal comfort operation results over a 12-month period. They also provide an alternative method that simulates buildings’ outdoor thermal comfort in an automatic and effective manner. Digital tools, Grasshopper 3D and Rhinoceros 3D, are used to create scripts and three-dimensional models. The results indicate that digital techniques can provide a three-dimensional modeling system to analyze buildings’ outdoor thermal comfort continuously and effectively. They do not necessarily result in a complete analysis of outdoor thermal comfort; however, the results work well as a reference for the study of outdoor thermal comfort. Longer-term, digital techniques have the potential to support architectural analysis and civil engineering study. They are convenient and effective methods for supporting the study of climate-sensitive communities and neighborhoods. Further research on digital simulation facilitating buildings’ outdoor thermal comfort analysis is indicated.

Author Contributions

Conceptualization, Y.Z. and C.L.; methodology, C.L.; software, Y.Z.; validation, Y.Z. and C.L.; formal analysis, Y.Z.; investigation, Y.Z.; resources, C.L.; data curation, Y.Z.; writing—original draft preparation, Y.Z.; writing—review and editing, C.L.; visualization, Y.Z.; supervision, Y.Z.; project administration, Y.Z.; funding acquisition, Y.Z. All authors have read and agreed to the published version of the manuscript.

Funding

This research was funded by the Beijing Municipal Education Commission, grant number KM202110016017. Soft Science Research Project of Ministry of Housing and Urban-Rural Development of the People’s Republic of China, grant number R20200287.

Conflicts of Interest

The authors declare no conflict of interest.

References

  1. American Society of Heating. Refrigerating and Air-Conditioning Engineers (ASHRAE). In ASHRAE Standard 55; ASHRAE: Peachtree Corners, GA, USA, 2004. [Google Scholar]
  2. Taleghani, M.; Kleerekoper, L.; Tenpierik, M.; Dobbelsteen, A.D. Outdoor Thermal Comfort Within Five Different Urban Forms in the Netherlands. Build. Environ. 2015, 83, 65–78. [Google Scholar] [CrossRef]
  3. Matzarakis, A.; Amelung, B. Physiological Equivalent Temperature as Indicator for Impacts of Climate Change on Thermal Comfort of Humans. Adv. Glob. Change Res. 2008, 30, 161–172. [Google Scholar]
  4. Zhang, Y.; Chang, L. Parametric Urbanism and Environment Optimization: Toward a Quality Environmental Urban Morphology. Int. J. Environ. Res. Public Health 2021, 18, 3558. [Google Scholar] [CrossRef] [PubMed]
  5. Yezioro, A.; Shaviv, E. Shading: A Design Tool for Analyzing Mutual Shading between Buildings. Sol. Energy 1994, 52, 27–37. [Google Scholar] [CrossRef]
  6. La Gennusa, M.; Nucara, A.; Rizzo, G.; Gianluca, S. The Calculation of the Mean Radiant Temperature of a Subject Exposed to the Solar Radiation—A Generalized Algorithm. Build. Environ. 2005, 40, 367–375. [Google Scholar] [CrossRef]
  7. Hodder, S.; Parsons, K. The Effects of Solar Radiation on Thermal Comfort. Int. J. Biometeorol. 2007, 51, 233–250. [Google Scholar] [CrossRef] [PubMed]
  8. Pantavou, K.; Theoharatos, G.; Santamouris, M.; Asimakopoulos, D. Outdoor Thermal Sensation of Pedestrians in A Mediterranean Climate and A Comparison with UTCI. Build. Environ. 2013, 66, 82–95. [Google Scholar] [CrossRef]
  9. Roberts, A. Mine Ventilation; Cleaver-Hume Press: London, UK, 1960. [Google Scholar]
  10. Steadman, R.G. A Universal Scale of Apparent Temperature. J. Appl. Meteorol. Climatol. 1984, 23, 1674–1687. [Google Scholar] [CrossRef]
  11. Sherwood, S.C.; Huber, M. An adaptability limit to climate change due to heat stress. Proc. Natl. Acad. Sci. USA 2010, 107, 9552–9555. [Google Scholar] [CrossRef] [PubMed] [Green Version]
  12. Abreu-Harbich, L.V.; Labaki, L.C.; Matzarakis, A. Thermal Bioclimate as A Factor in Urban and Architectural Planning in Tropical Climates-The Case of Campinas, Brazil. Urban Ecosyst. 2014, 17, 489–500. [Google Scholar] [CrossRef]
  13. Berkovic, S.; Yezioro, A.; Bitan, A. Study of Thermal Comfort in Courtyards in A Hot Arid Climate. Sol. Energy 2012, 86, 1173–1186. [Google Scholar] [CrossRef]
  14. Mackey, C.; Roudsari, M.S.; Samara, P. ComforCover: A Novel Method for the Design of outdoor shades. In Proceedings of the Spring Simulation Multi-Conference 2015, Alexandria, VA, USA, 12–15 April 2015. [Google Scholar]
  15. Fanger, P.O. Thermal Comfort Analysis and Applications in Environmental Engineering; Danish Technical Press: Copenhagen, Denmark, 1970. [Google Scholar]
  16. Matzarakis, A. Die Thermische Komponente des Stadtklimas; Meteorologisches Institut der Universität Freiburg: Freiburg, Germany, 2001. [Google Scholar]
  17. Blazejczyk, K.; Jendritzky, G.; Broede, P.; Fiala, D.; Havenith, G.; Epstein, Y.; Psikuta, A.; Kampmann, B. An Introduction to the Universal Thermal Climate Index (UTCI). Geogr. Pol. 2013, 86, 5–10. [Google Scholar] [CrossRef] [Green Version]
  18. Blazejczyk, K.; Epstein, Y.; Jendritzky, G.; Staiger, H.; Tinz, B. Comparison of UTCI to Selected Thermal Indices. J. Biometeorol. 2012, 56, 515–535. [Google Scholar] [CrossRef] [Green Version]
  19. Jendritzky, G.; De Dear, R.; Havenith, G. UTCI—Why Another Thermal Index? J. Biometeorol 2012, 56, 421–428. [Google Scholar] [CrossRef] [PubMed] [Green Version]
  20. Hoppe, P. Different Aspects of Assessing Indoor and Outdoor Thermal Comfort. Energy Build. 2002, 34, 661–665. [Google Scholar] [CrossRef]
  21. Fröhlich, D.; Matzarakis, A. Modeling of Changes in Thermal Bioclimate: Examples Based on Urban Spaces in Freiburg, Germany. Theor. Appl. Climatol. 2013, 111, 547–558. [Google Scholar] [CrossRef]
  22. Fröhlich, D.; Matzarakis, A. A quantitative sensitivity analysis on the behavior of common thermal indices under hot and windy conditions in Doha, Qatar. Theor. Appl. Climatol. 2016, 124, 179–187. [Google Scholar] [CrossRef]
  23. The Commission for Thermal Physiology of the International Union of Physiological Sciences. UTCI Assessment Scale. Available online: http://www.utci.org/utci_doku.php (accessed on 24 March 2021).
  24. Schumacher, P. Parametricism: A New Global Style for Architecture and Urban Design. Archit. Des. 2009, 79, 14–23. [Google Scholar] [CrossRef]
  25. Reilly, C. What is Grasshopper. Available online: https://www.lynda.com/Grasshopper-tutorials/What-Grasshopper/174491/194087-4.html (accessed on 24 December 2020).
  26. Rogers, H. Theory of Recursive Functions and Effective Computability; The Massachusetts Institute of Technology Press: Cambridge, MA, USA, 1987. [Google Scholar]
  27. Knuth, D. Semi-numerical Algorithms. In The Art of Computer Programming; Addison Wesley: Boston, MA, USA, 1969. [Google Scholar]
  28. Fink, T.; Vuckovic, M.; Petkova, A. KPI-Driven Parametric Design of Urban Systems. In Proceedings of the 26th Conference of the Association for Computer-Aided Architectural Design Research in Asia, Hong Kong, China, 29 March–1 April 2021; Available online: http://papers.cumincad.org/data/works/att/caadria2021_113.pdf (accessed on 3 August 2021).
Figure 1. Research methodology framework.
Buildings 11 00541 g001
Figure 2. Examples of outdoor thermal comfort situations across one year in Beijing.
Buildings 11 00541 g002
Figure 3. Digital simulation results of Sanlihe neighborhood.
Buildings 11 00541 g003
Figure 4. Digital simulation results of Nanshagou neighborhood.
Buildings 11 00541 g004
Table 1. Outdoor thermal comfort description of the neighborhoods (April 2021, Beijng).
Neighborhood NameData Record No.Average Temperature (°C)TmrtRelative Humidity (%)Average Wind Speed (m/s)UTCIStress Category
Sanlihe neighborhood
(39.9065° N, 116.3305° E)
123038158.7Slight cold stress
21802419−6.3Moderate cold stress
314020247.2Slight cold stress
Nanshagou neighborhood
(39.9169° N, 116.3265° E)
124039169.7No thermal stress
21502520−12.7Moderate cold stress
318021242.5Slight cold stress
Publisher’s Note: MDPI stays neutral with regard to jurisdictional claims in published maps and institutional affiliations.

