
Scenario-Based Comprehensive Assessment for Community Resilience Adapted to Fire Following an Earthquake, Implementing the Analytic Network Process and Preference Ranking Organization Method for Enriched Evaluation II Techniques


Abstract
:1. Introduction
2. Literature Review
3. Research Methodology
3.1. Design of the Empirical Analysis
3.2. Identification of the Indicators on Community Resilience Adapted to FFE Using SLR
- Duplicated screening. As an article may belong to multiple databases (for example, articles published by Elsevier may be indexed by Google Scholar), the elimination process needed to be repeated to ensure that there were no duplicate articles in the results.
- Title filtering. We carried out the title screening process by reviewing the titles to filter these articles that were obviously not related to the assessment indicators of community resilience adapted to FFE.
- Abstract filtering. Implementing abstract filtering was to check whether the detailed objectives and conclusions of the selected literature were related to the SLR strategies. It was necessary to obtain related information from the abstract and delete the articles which did not include the related contents about community resilience adapted to FFE.
- Full-text filtering. In this step, we downloaded and read the full text to ensure the availability of articles that met the above screening strategies.
- Reference filtering. Reference filtering was used to collect the missing articles from the references cited in the above-selected articles, which can provide the supplements.
3.3. Calculating the Weights of Indicators Using ANP
3.4. MCDA Method Selection
3.5. Obtaining the Ranking of Community Resilience Implementing PROMETHEE II Method
- Establishing the set of indicators, namely a set of various factors that affect the object of assessment. In this study, the set of indicators are interpreted as ;
- Determining the evaluation criteria. The evaluation criteria are a set of collections that describe the expert or community leader’s evaluation of various community resilience adapted to FFE. In this study, the set of indicators are interpreted as ;
- Selecting the studied hazard scenario. Due to the different influences of the negative impacts caused by different hazard scenarios in a community, the types and levels of hazards should be limited when evaluating and comparing the relative resilience to hazards of a group of communities. Based on the multi-scenario model comparison function provided by Visual PROMETHEE software, select a single hazard (fire following earthquake) and evaluate the resilience of communities;
- Result analysis. Based on the PROMETHEE II module of Visual PROMETHEE software, each indicator is used to decide the ranking of the community resilience adapted to FFE, and then the comprehensive priority level value and ranking can be obtained to determine the absolute value.
4. Empirical Analysis
4.1. Background of the Selected Samples
4.2. Data and Standardized Interview Adapting Scoring Scale
4.3. Determining the Weights of the Indicators Using ANP
4.4. Comprehensive Assessment on the Community Resilience Adapted to FFE
5. Results and Discussion
5.1. Results Analysis
- (1)
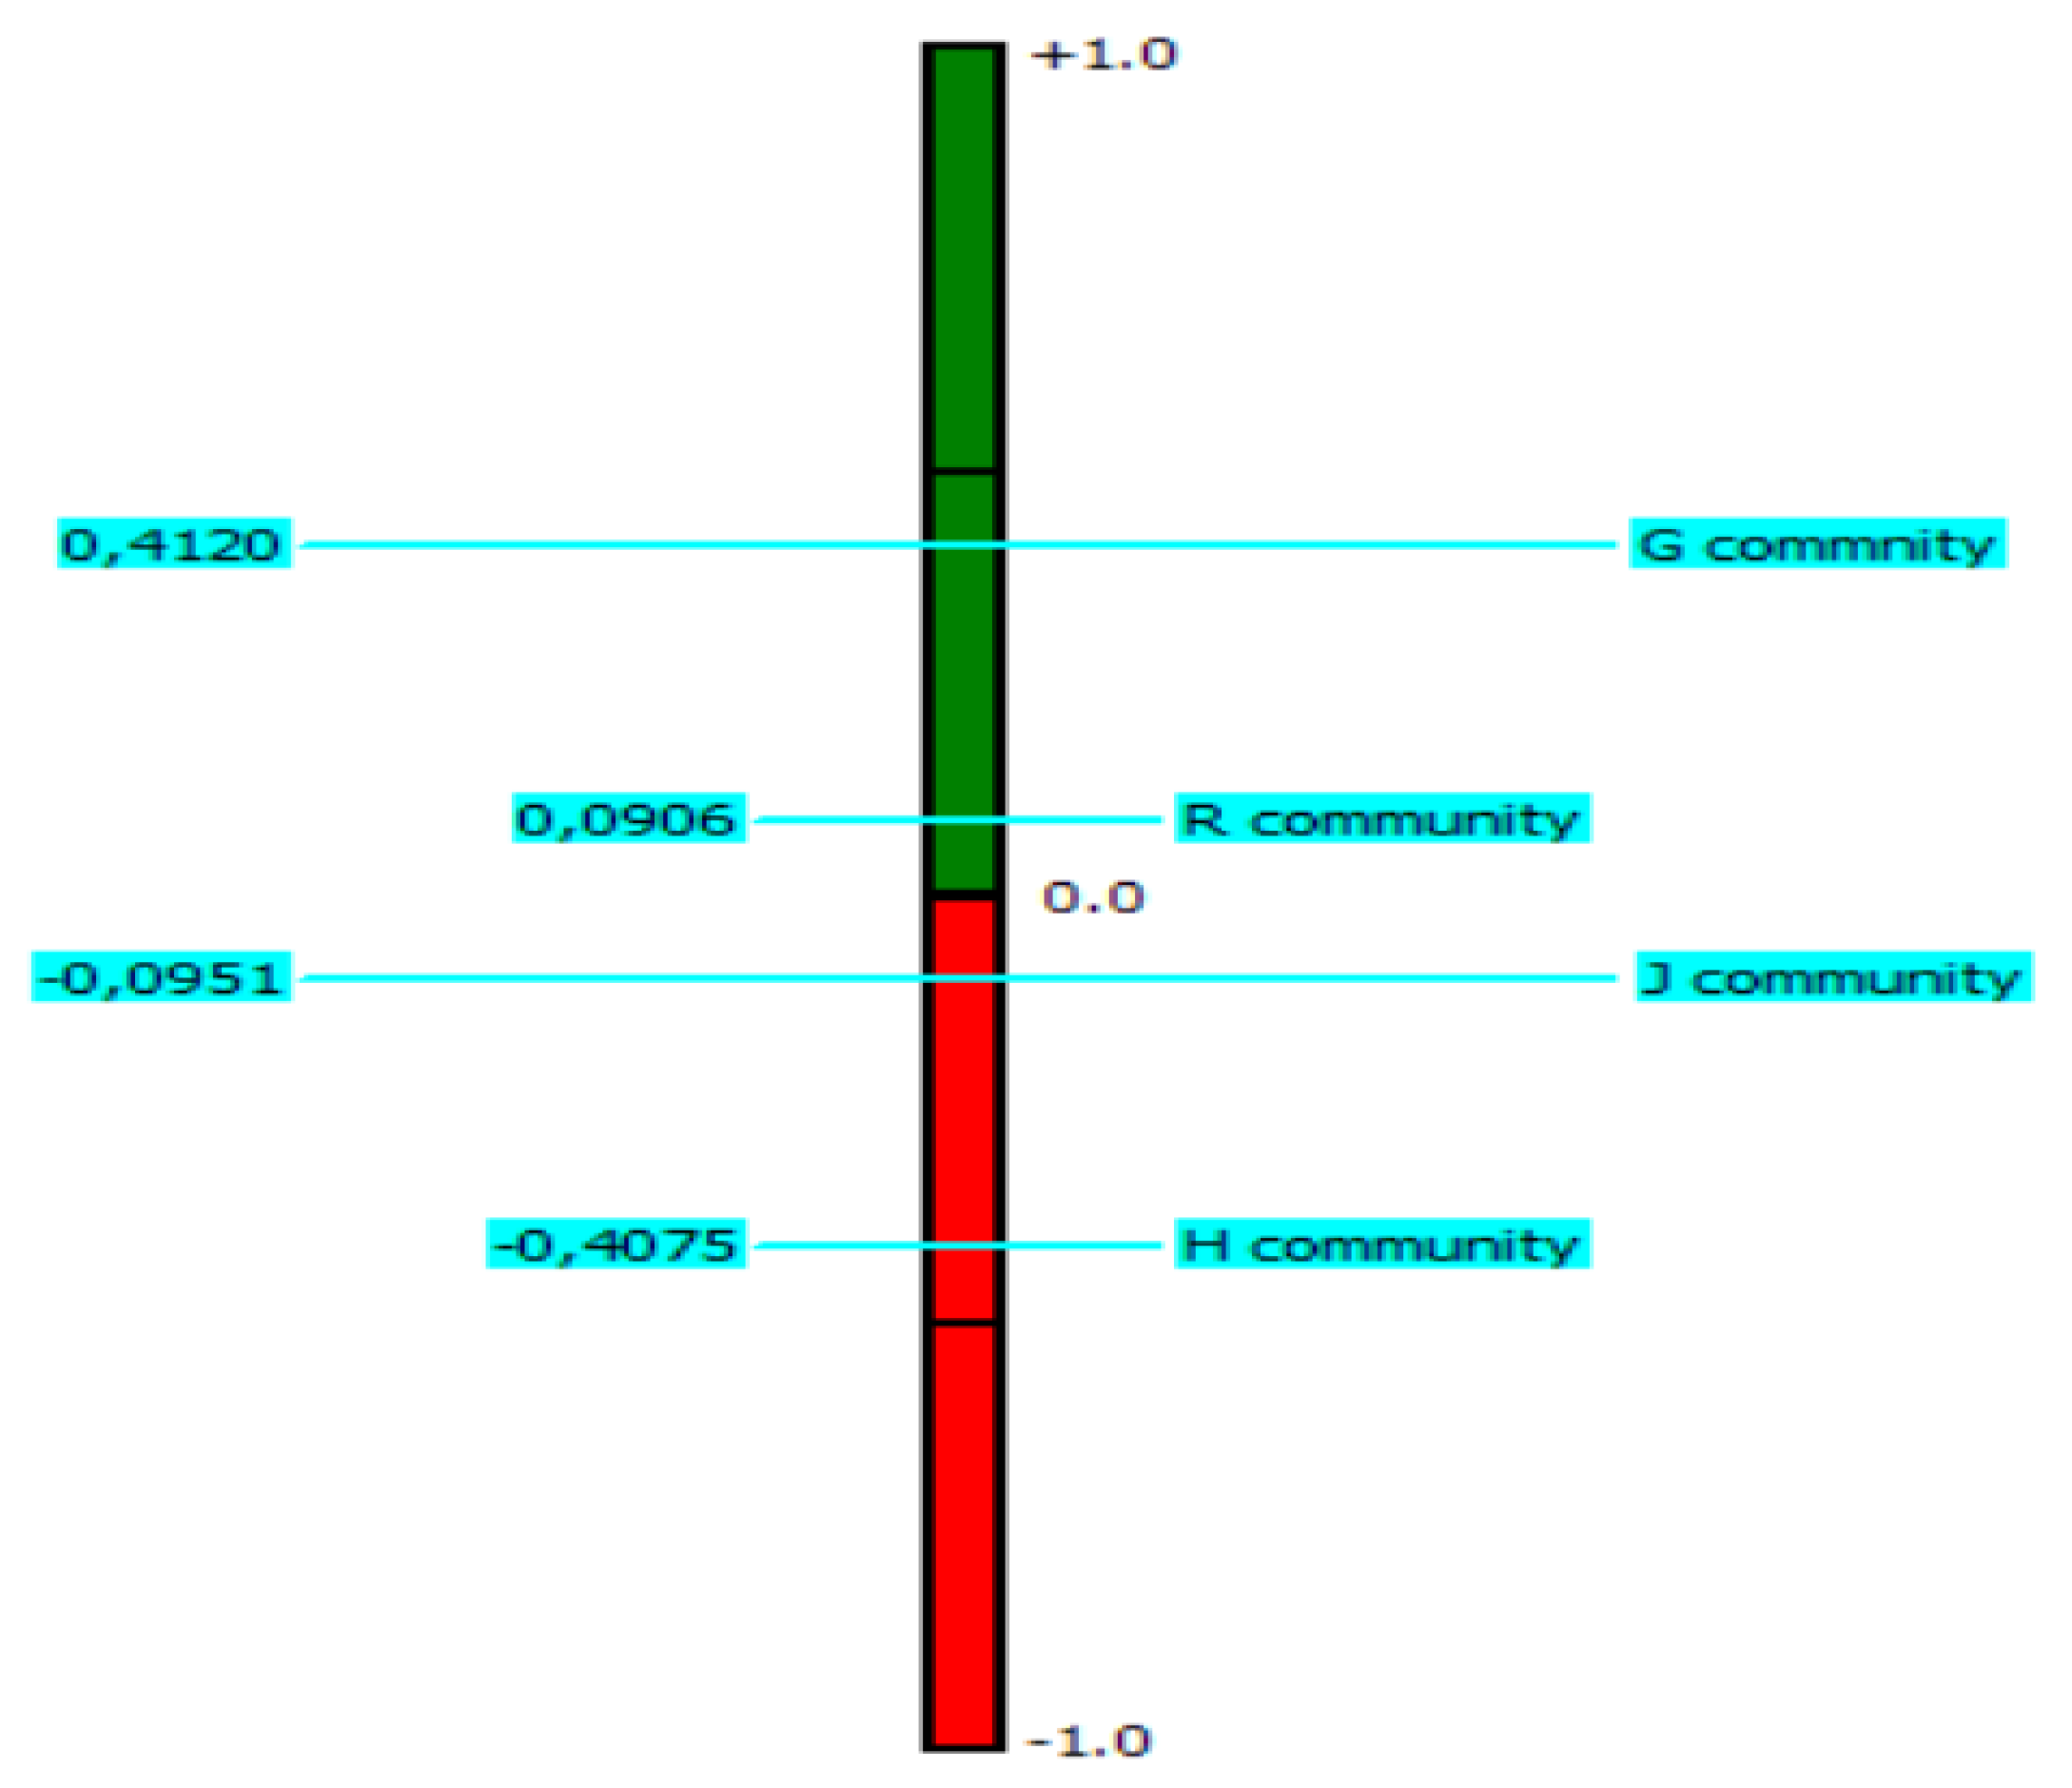
- Graphical analysis for interactive aid on assessment results
- (2)
- Net traffic ranking analysis of the four communities for assessment results.
- (3)
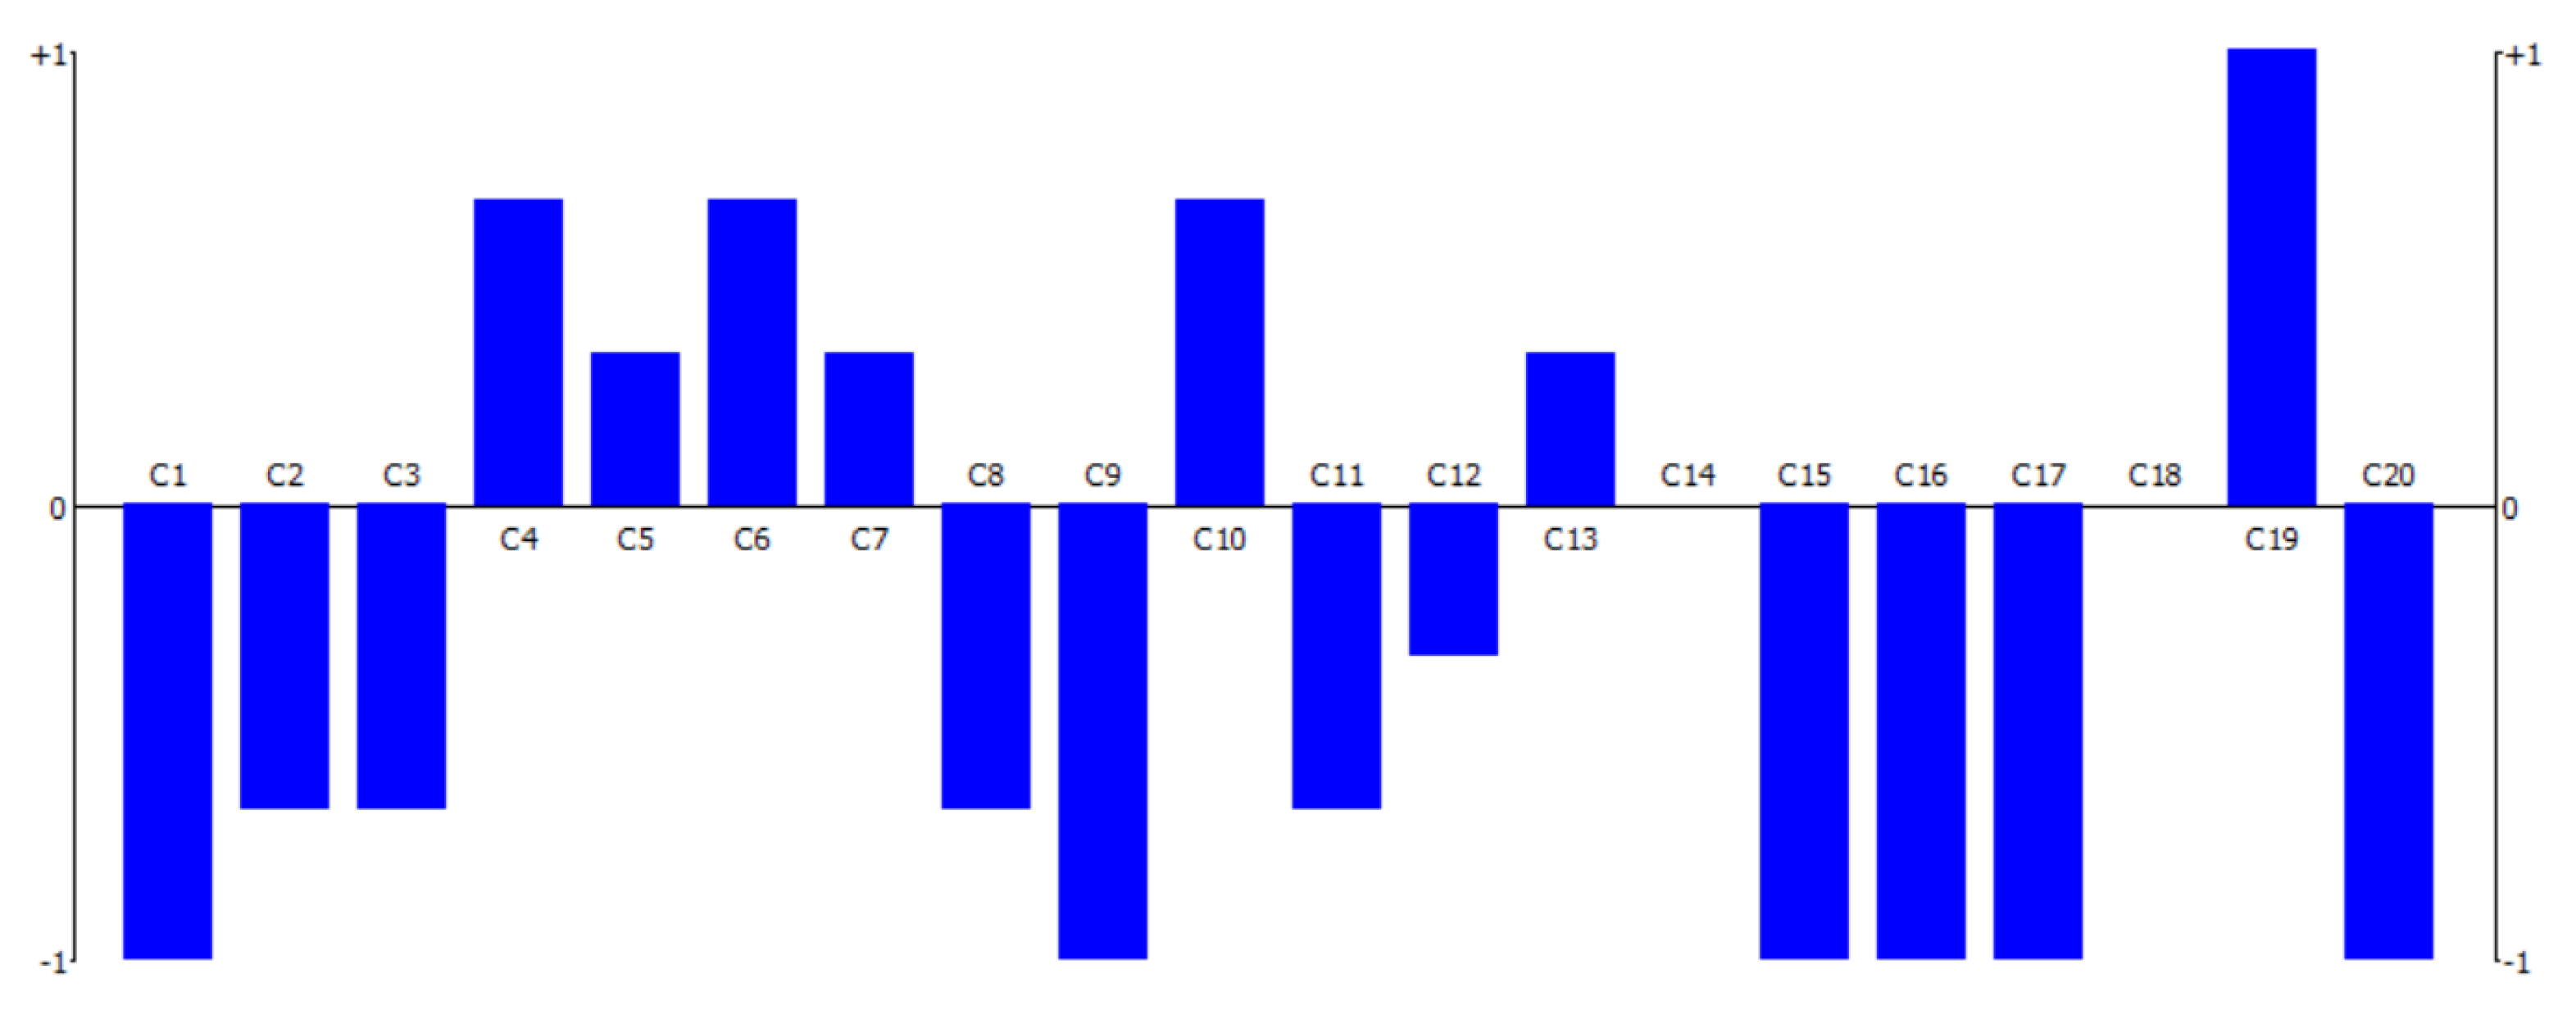
- Comparison analysis on post-hazard-adapting resilience indicators
5.2. Disscussion
6. Conclusions
Author Contributions
Funding
Conflicts of Interest
References
- Domingo-Echaburu, S.; Dávalos, L.; Orive, G.; Lertxundi, U. Drug pollution & Sustainable Development Goals. Sci. Total Environ. 2021, 800, 149412. [Google Scholar] [CrossRef]
- Haskins, C. Systems Engineering for Sustainable Development Goals. Sustainability 2021, 13, 10293. [Google Scholar] [CrossRef]
- Kim, J.J.; Goodwin, C.W.; Kim, S. Communication Turns Green Construction Planning into Reality. J. Green Build. 2017, 12, 168–186. [Google Scholar] [CrossRef]
- Lehmann, S. Resource recovery and materials flow in the city: Zero waste and sustainable consumption as paradigm in urban development. J. Green Build. 2011, 6, 88–105. [Google Scholar] [CrossRef] [Green Version]
- Wu, P.; Feng, Y. Using Lean Practices to Improve Current Carbon Labelling Schemes for Construction Materials—A General Framework. J. Green Build. 2012, 7, 173–191. [Google Scholar] [CrossRef]
- Chen, Y.; Liu, T.; Ge, Y.; Xia, S.; Yuan, Y.; Li, W.; Xu, H. Examining social vulnerability to flood of affordable housing communities in Nanjing, China: Building long-term disaster resilience of low-income communities. Sustain. Cities Soc. 2021, 71, 102939. [Google Scholar] [CrossRef]
- Butters, C.; Cheshmehzangi, A.; Sassi, P. Cities, Energy and Climate: Seven Reasons to Question the Dense High-Rise City. J. Green Build. 2020, 15, 197–214. [Google Scholar] [CrossRef]
- Lehmann, S. Towards a Sustainable City Centre: Integrating Ecologically Sustainable Development (ESD) Principles into Urban Renewal. J. Green Build. 2006, 1, 83–104. [Google Scholar] [CrossRef]
- Lee, K.; Park, C. The Sustainable Micro-Scale Movement of Communities: Case Studies of Subdivided Development and Adaptive Reuse of Shared Space in New York City. J. Green Build. 2016, 11, 23–37. [Google Scholar] [CrossRef]
- Hendee, B.A. Sustainable Site Development. J. Green Build. 2006, 1, 9–20. [Google Scholar] [CrossRef]
- Ahn, Y.H.; Kwon, H.; Pearce, A.R.; Wells, J.G. The Systematic Course Development Process: Building a Course in Sustainable Construction for Students in the USA. J. Green Build. 2009, 4, 169–182. [Google Scholar] [CrossRef]
- Lee, J.; Shepley, M. The Green Standard for Energy and Environmental Design (G-Seed) for Multi-Family Housing Rating System in Korea: A Review of Evaluating Practices and Suggestions for Improvement. J. Green Build. 2019, 14, 155–175. [Google Scholar] [CrossRef]
- Pujadas-Gispert, E.; Korevaar, C.; Alsailani, M.; Moonen, S. Linking Constructive and Energy Innovations for a Net Zero-Energy Building. J. Green Build. 2020, 15, 153–184. [Google Scholar] [CrossRef]
- Fakourian, F.; Asefi, M. Environmentally Responsive Kinetic Façade for Educational Buildings. J. Green Build. 2019, 14, 165–186. [Google Scholar] [CrossRef]
- Farzinmoghadam, M.; Mostafavi, N.; Infield, E.H.; Hoque, S. Developing an Automated Method for the Application of Lidar in Iumat Land-Use Model: Analysis of Land-Use Changes Using Building-Form Parameterization, Gis, and Artificial Neural Networks. J. Green Build. 2019, 14, 1–30. [Google Scholar] [CrossRef]
- Wuni, I.Y.; Shen, G.Q.; Osei-Kyei, R. Sustainability of Off-Site Construction: A Bibliometric Review and Visualized Analysis of Trending Topics and Themes. J. Green Build. 2020, 15, 131–154. [Google Scholar] [CrossRef]
- Lwin, M.; Panuwatwanich, K. Identification and Evaluation of Green Building Assessment Indicators for Myanmar. J. Green Build. 2021, 16, 143–172. [Google Scholar] [CrossRef]
- Bahho, M.; Vale, B. A Demonstration Building Project: Promoting Sustainability Values. J. Green Build. 2020, 15, 91–112. [Google Scholar] [CrossRef]
- Qin, L.; Wang, M.; Zhu, J.; Wei, Y.; Zhou, X.; He, Z. Towards Circular Economy through Waste to Biomass Energy in Madagascar. Complexity 2021, 2021, 1–10. [Google Scholar] [CrossRef]
- Storms, K.; Simundza, D.; Morgan, E.; Miller, S. Developing a resilience tool for higher education institutions: A must-have in campus master planning. J. Green Build. 2019, 14, 187–198. [Google Scholar] [CrossRef]
- Pushkar, S.; Verbitsky, O. Silver and Gold Leed Commercial Interiors: Certified Projects. J. Green Build. 2019, 14, 95–113. [Google Scholar] [CrossRef]
- Bray, J.; McCurry, N. Unintended Consequences: How the Use of LEED Can Inadvertently Fail to Benefit the Environment. J. Green Build. 2006, 1, 152–165. [Google Scholar] [CrossRef] [Green Version]
- Kensek, K. Visual Programming for Building Information Modeling: Energy and Shading Analysis Case Studies. J. Green Build. 2015, 10, 28–43. [Google Scholar] [CrossRef]
- MacDougall, C. Natural Building Materials in Mainstream Construction: Lessons from the U. K. J. Green Build. 2008, 3, 1–14. [Google Scholar] [CrossRef]
- Schroepfer, T.; Hee, L. Emerging Forms of Sustainable Urbanism: Case Studies of Vauban Freiburg and solar City Linz. J. Green Build. 2008, 3, 65–76. [Google Scholar] [CrossRef]
- Tinker, A.; Kreuter, U.; Burt, R.; Bame, S. Green Construction: Contractor Motivation and Trends in Austin, Texas. J. Green Build. 2006, 1, 118–134. [Google Scholar] [CrossRef]
- Yau, Y. Willingness to Pay and Preferences for Green Housing Attributes in Hong Kong. J. Green Build. 2012, 7, 137–152. [Google Scholar] [CrossRef]
- Coar, M.; Sarreshtehdari, A.; Garlock, M.; Khorasani, N.E. Methodology and challenges of fire following earthquake analysis: An urban community study considering water and transportation networks. Nat. Hazards 2021, 109, 1–31. [Google Scholar] [CrossRef]
- Lu, X.; Zeng, X.; Xu, Z.; Guan, H. Physics-based Simulation and High-fidelity Visualization of Fire Following Earthquake Considering Building Seismic Damage. J. Earthq. Eng. 2017, 23, 1173–1193. [Google Scholar] [CrossRef]
- Ji, T.; Wei, H.-H.; Shohet, I.M.; Xiong, F. Risk-based resilience concentration assessment of community to seismic hazards. Nat. Hazards 2021, 108, 1731–1751. [Google Scholar] [CrossRef]
- Liu, X.; Li, S.; Xu, X.; Luo, J. Integrated natural disasters urban resilience evaluation: The case of China. Nat. Hazards 2021, 107, 2105–2122. [Google Scholar] [CrossRef]
- Sun, W.; Hou, Y.; Guo, L. Big data revealed relationship between air pollution and manufacturing industry in China. Nat. Hazards 2021, 107, 2533–2553. [Google Scholar] [CrossRef]
- Zheng, Y.; Xie, Y.; Long, X. A comprehensive review of Bayesian statistics in natural hazards engineering. Nat. Hazards 2021, 108, 63–91. [Google Scholar] [CrossRef]
- Kendra, J.; Clay, L.; Gill, K.; Trivedi, J.; Marlowe, V.; Aguirre, B.; Nigg, J.; Trainor, J.; Carbone, E.; Links, J. Community Resilience: Toward a Framework for an Integrated, Interdisciplinary Model of Disaster. Nat. Hazards Rev. 2021, 22, 04021049. [Google Scholar] [CrossRef]
- Fuchs, S.; Keiler, M.; Glade, T. Editorial to the special issue on resilience and vulnerability assessments in natural hazard and risk analysis. Nat. Hazards Earth Syst. Sci. 2017, 17, 1203–1206. [Google Scholar] [CrossRef] [Green Version]
- Fuchs, S.; Keiler, M.; Ortlepp, R.; Schinke, R.; Papathoma-Köhle, M. Recent advances in vulnerability assessment for the built environment exposed to torrential hazards: Challenges and the way forward. J. Hydrol. 2019, 575, 587–595. [Google Scholar] [CrossRef]
- Papathoma-Köhle, M.; Thaler, T.; Fuchs, S. An institutional approach to vulnerability: Evidence from natural hazard management in Europe. Environ. Res. Lett. 2021, 16, 044056. [Google Scholar] [CrossRef]
- Birkmann, J.; Jamshed, A.; McMillan, J.M.; Feldmeyer, D.; Totin, E.; Solecki, W.; Ibrahim, Z.Z.; Roberts, D.; Kerr, R.B.; Poertner, H.-O.; et al. Understanding human vulnerability to climate change: A global perspective on index validation for adaptation planning. Sci. Total Environ. 2021, 803, 150065. [Google Scholar] [CrossRef]
- Mazzorana, B.; Comiti, F.; Scherer, C.; Fuchs, S. Developing consistent scenarios to assess flood hazards in mountain streams. J. Environ. Manag. 2012, 94, 112–124. [Google Scholar] [CrossRef] [PubMed]
- Kappes, M.S.; Keiler, M.; von Elverfeldt, K.; Glade, T. Challenges of analyzing multi-hazard risk: A review. Nat. Hazards 2012, 64, 1925–1958. [Google Scholar] [CrossRef] [Green Version]
- Navarro, O.; Restrepo-Ochoa, D.; Muñoz-Duque, L.A.; Zapa-Perez, K.; Ameline, A.; Mercier, D.; Fleury-Bahi, G. Determinants of coping strategies in two types of natural hazards: Flash floods and costal flooding. Int. J. Disaster Risk Reduct. 2020, 46, 101514. [Google Scholar] [CrossRef]
- Janizadeh, S.; Pal, S.C.; Saha, A.; Chowdhuri, I.; Ahmadi, K.; Mirzaei, S.; Mosavi, A.H.; Tiefenbacher, J.P. Mapping the spatial and temporal variability of flood hazard affected by climate and land-use changes in the future. J. Environ. Manag. 2021, 298, 113551. [Google Scholar] [CrossRef]
- Monge, J.J.; McDonald, N.; McDonald, G.W. A review of graphical methods to map the natural hazard-to-wellbeing risk chain in a socio-ecological system. Sci. Total Environ. 2021, 803, 149947. [Google Scholar] [CrossRef] [PubMed]
- Berlemann, M.; Eurich, M. Natural hazard risk and life satisfaction—Empirical evidence for hurricanes. Ecol. Econ. 2021, 190, 107194. [Google Scholar] [CrossRef]
- Stritih, A.; Bebi, P.; Rossi, C.; Grêt-Regamey, A. Addressing disturbance risk to mountain forest ecosystem services. J. Environ. Manag. 2021, 296, 113188. [Google Scholar] [CrossRef] [PubMed]
- Yabe, T.; Rao, P.S.C.; Ukkusuri, S.V. Resilience of Interdependent Urban Socio-Physical Systems using Large-Scale Mobility Data: Modeling Recovery Dynamics. Sustain. Cities Soc. 2021, 75, 103237. [Google Scholar] [CrossRef]
- Ferrario, M.F. Landslides triggered by multiple earthquakes: Insights from the 2018 Lombok (Indonesia) events. Nat. Hazards 2019, 98, 575–592. [Google Scholar] [CrossRef]
- Ma, S.; Xu, C. Assessment of co-seismic landslide hazard using the Newmark model and statistical analyses: A case study of the 2013 Lushan, China, Mw6.6 earthquake. Nat. Hazards 2018, 96, 389–412. [Google Scholar] [CrossRef]
- Huang, X.; Jin, H. An earthquake casualty prediction model based on modified partial Gaussian curve. Nat. Hazards 2018, 94, 999–1021. [Google Scholar] [CrossRef]
- Gao, D.; Wang, K.; Insua, T.L.; Sypus, M.; Riedel, M.; Sun, T. Defining megathrust tsunami source scenarios for northernmost Cascadia. Nat. Hazards 2018, 94, 445–469. [Google Scholar] [CrossRef]
- Anbazhagan, P.; Mog, K.; Rao, K.S.N.; Prabhu, N.S.; Agarwal, A.; Reddy, G.R.; Ghosh, S.; Deb, M.K.; Baruah, S.; Das, S.K. Reconnaissance report on geotechnical effects and structural damage caused by the 3 January 2017 Tripura earthquake, India. Nat. Hazards 2019, 98, 425–450. [Google Scholar] [CrossRef]
- Beirlant, J.; Kijko, A.; Reynkens, T.; Einmahl, J.H.J. Estimating the maximum possible earthquake magnitude using extreme value methodology: The Groningen case. Nat. Hazards 2018, 98, 1091–1113. [Google Scholar] [CrossRef] [Green Version]
- Sun, L.; Su, G.; Tian, Q.; Qi, W.; Liu, F.; Qi, M.; Li, R. Religious belief and Tibetans’ response to earthquake disaster: A case study of the 2010 Ms 7.1 Yushu earthquake, Qinghai Province, China. Nat. Hazards 2019, 99, 141–159. [Google Scholar] [CrossRef]
- Zhou, W.; Guo, S.; Deng, X.; Xu, D. Livelihood resilience and strategies of rural residents of earthquake-threatened areas in Sichuan Province, China. Nat. Hazards 2021, 106, 255–275. [Google Scholar] [CrossRef]
- Jin, K.P.; Yao, L.K.; Cheng, Q.G.; Xing, A.G. Seismic landslides hazard zoning based on the modified Newmark model: A case study from the Lushan earthquake, China. Nat. Hazards 2019, 99, 493–509. [Google Scholar] [CrossRef]
- Pozos-Estrada, A.; Chávez, M.M.; Jaimes, M.; Arnau, O.; Guerrero, H. Damages observed in locations of Oaxaca due to the Tehuantepec Mw8.2 earthquake, Mexico. Nat. Hazards 2019, 97, 623–641. [Google Scholar] [CrossRef]
- Cubellis, E.; Luongo, G.; Obrizzo, F.; Sepe, V.; Tammaro, U. Contribution to knowledge regarding the sources of earthquakes on the island of Ischia (Southern Italy). Nat. Hazards 2020, 100, 955–994. [Google Scholar] [CrossRef]
- Ma, Z.; Guo, S.; Deng, X.; Xu, D. Community resilience and resident’s disaster preparedness: Evidence from China’s earthquake-stricken areas. Nat. Hazards 2021, 108, 567–591. [Google Scholar] [CrossRef]
- Schekotov, A.; Chebrov, D.; Hayakawa, M.; Belyaev, G.; Berseneva, N. Short-term earthquake prediction in Kamchatka using low-frequency magnetic fields. Nat. Hazards 2019, 100, 735–755. [Google Scholar] [CrossRef]
- Kumlu, K.B.Y.; Tüdeş, Ş. Determination of earthquake-risky areas in Yalova City Center (Marmara region, Turkey) using GIS-based multicriteria decision-making techniques (analytical hierarchy process and technique for order preference by similarity to ideal solution). Nat. Hazards 2019, 96, 999–1018. [Google Scholar] [CrossRef]
- Yurdakul, Ö.; Duran, B.; Tunaboyu, O.; Avşar, Ö. Field reconnaissance on seismic performance of RC buildings after the January 24, 2020 Elazığ-Sivrice earthquake. Nat. Hazards 2020, 105, 859–887. [Google Scholar] [CrossRef]
- Zafarani, H.; Jafarian, Y.; Eskandarinejad, A.; Lashgari, A.; Soghrat, M.R.; Sharafi, H.; Afraz-e Haji-Saraei, M. Seismic hazard analysis and local site effect of the 2017 M w 7.3 Sarpol-e Zahab, Iran, earthquake. Nat. Hazards 2020, 103, 1783–1805. [Google Scholar] [CrossRef]
- Danatzko, J.M.; Sezen, H.; Chen, Q. Sustainable design and energy consumption analysis for structural components. J. Green Build. 2013, 8, 120–135. [Google Scholar] [CrossRef]
- Weerasinghe, G.; Soundararajan, K.; Ruwanpura, J. LEED–PDRI Framework for Pre-project Planning of Sustainable Building Projects. J. Green Build. 2007, 2, 123–143. [Google Scholar] [CrossRef]
- Farahani, S.; Tahershamsi, A.; Behnam, B. Earthquake and post-earthquake vulnerability assessment of urban gas pipelines network. Nat. Hazards 2020, 101, 327–347. [Google Scholar] [CrossRef]
- Ji, T.; Wei, H.-H.; Sim, T.; Yang, L.E.; Scheffran, J. Disaggregated validation of disaster-resilience indicators using household survey data: A case study of Hong Kong. Sustain. Cities Soc. 2021, 67, 102726. [Google Scholar] [CrossRef]
- Valentin, V.; Bogus, S.M. Assessing the link between public opinion and social sustainability in building and infrastructure projects. J. Green Build. 2015, 10, 177–190. [Google Scholar] [CrossRef]
- Boake, T.M. The Leap to Zero Carbon and Zero Emissions: Understanding How to Go Beyond Existing Sustainable Design Protocols. J. Green Build. 2008, 3, 64–77. [Google Scholar] [CrossRef] [Green Version]
- Eriksen, M.S.H.; Bjarløv, S.P.; Rode, C. Strengthening requirement specification in sustainable procurement—An investigation of challenges. J. Green Build. 2017, 12, 107–122. [Google Scholar] [CrossRef]
- Palanisamy, P.; Klotz, L. Delivery process attributes, common to India and the U.S., for more sustainable buildings. J. Green Build. 2011, 6, 146–157. [Google Scholar] [CrossRef]
- Omidvar, B.; Eskandari, M.; Peyghaleh, E. Seismic damage to urban areas due to failed buried fuel pipelines case study: Fire following earthquake in the city of Kermanshah, Iran. Nat. Hazards 2013, 67, 169–192. [Google Scholar] [CrossRef]
- Horman, M.J.; Riley, D.R.; Lapinski, A.R.; Korkmaz, S.; Pulaski, M.H.; Magent, C.S.; Luo, Y.; Harding, N.; Dahl, P.K. Delivering Green Buildings: Process Improvements for Sustainable Construction. J. Green Build. 2006, 1, 123–140. [Google Scholar] [CrossRef]
- Potbhare, V.; Syal, M.; Korkmaz, S. Adoption of Green Building Guidelines in Developing Countries Based on U.S. and India Experiences. J. Green Build. 2009, 4, 158–174. [Google Scholar] [CrossRef]
- Roostaie, S.; Kouhirostami, M.; Sam, M.; Kibert, C.J. Resilience coverage of global sustainability assessment frameworks: A systematic review. J. Green Build. 2021, 16, 23–53. [Google Scholar] [CrossRef]
- Shaikh, F.U.A.; Hosan, A.; Biswas, W.K. Sustainability assessment of reinforced concrete beam mixes containing recycled aggregates and industrial by-products. J. Green Build. 2020, 15, 95–119. [Google Scholar] [CrossRef]
- Suh, M.J.; Pearce, A.R.; Song, Y.; Kwak, Y.H.; Kim, J.I.; Zhang, Y. The Impact of Leed-Energy Star Certified Office Buildings on the Market Value of Adjoining Buildings in New York City. J. Green Build. 2019, 14, 31–52. [Google Scholar] [CrossRef]
- Tan, S.B. Measuring community resilience: A critical analysis of a policy-oriented indicator tool. Environ. Sustain. Ind. 2021, 12, 100142. [Google Scholar]
- Abdelhady, A.U.; Spence, S.M.; McCormick, J. Risk and fragility assessment of residential wooden buildings subject to hurricane winds. Struct. Saf. 2021, 94, 102137. [Google Scholar] [CrossRef]
- Wang, W.; van de Lindt, J.W.; Rosenheim, N.; Cutler, H.; Hartman, B.; Lee, J.S.; Calderon, D. Effect of Residential Building Wind Retrofits on Social and Economic Community-Level Resilience Metrics. J. Infrastruct. Syst. 2021, 27, 04021034. [Google Scholar] [CrossRef]
- Her, C.; Sambor, D.J.; Whitney, E.; Wies, R. Novel wind resource assessment and demand flexibility analysis for community resilience: A remote microgrid case study. Renew. Energy 2021, 179, 1472–1486. [Google Scholar] [CrossRef]
- Gholizadeh, M. Effects of floods on macroinvertebrate communities in the Zarin Gol River of northern Iran: Implications for water quality monitoring and biological assessment. Ecol. Process. 2021, 10, 1–11. [Google Scholar] [CrossRef]
- Nofal, O.M.; van de Lindt, J.W.; Do, T.Q.; Yan, G.; Hamideh, S.; Cox, D.T.; Dietrich, J.C. Methodology for Regional Multihazard Hurricane Damage and Risk Assessment. J. Struct. Eng. 2021, 147, 04021185. [Google Scholar] [CrossRef]
- Baca, M.; Schenkman, B.; Hightower, M. Use of Advanced Microgrids to Support Community Resilience. Nat. Hazards Rev. 2021, 22, 05021012. [Google Scholar] [CrossRef]
- Chen, Y.; Ji, W. Rapid Damage Assessment Following Natural Disasters through Information Integration. Nat. Hazards Rev. 2021, 22, 04021043. [Google Scholar] [CrossRef]
- Kim, J.; Kamari, M.; Lee, S.; Ham, Y. Large-Scale Visual Data–Driven Probabilistic Risk Assessment of Utility Poles Regarding the Vulnerability of Power Distribution Infrastructure Systems. J. Constr. Eng. Manag. 2021, 147, 04021121. [Google Scholar] [CrossRef]
- Sim, T.; Han, Z.; Guo, C.; Lau, J.; Yu, J.; Su, G. Disaster preparedness, perceived community resilience, and place of rural villages in northwest China. Nat. Hazards 2021, 108, 907–923. [Google Scholar] [CrossRef]
- Bulti, D.T.; Girma, B.; Megento, T.L. Community flood resilience assessment frameworks: A review. SN Appl. Sci. 2019, 1, 1663. [Google Scholar] [CrossRef] [Green Version]
- He, Z.; Chen, H. An ISM-Based Methodology for Interrelationships of Critical Success Factors for Construction Projects in Ecologically Fragile Regions: Take Korla, China as an Example. Appl. Sci. 2021, 11, 4668. [Google Scholar] [CrossRef]
- He, Z.; Chen, H. Critical factors for practicing sustainable construction projects in environmentally fragile regions based on interpretive structural modeling and cross-impact matrix multiplication applied to classification: A case study in China. Sustain. Cities Soc. 2021, 74, 103238. [Google Scholar] [CrossRef]
- Moghayedi, A.; Awuzie, B.; Omotayo, T.; Le Jeune, K.; Massyn, M.; Ekpo, C.; Braune, M.; Byron, P. A Critical Success Factor Framework for Implementing Sustainable Innovative and Affordable Housing: A Systematic Review and Bibliometric Analysis. Buildings 2021, 11, 317. [Google Scholar] [CrossRef]
- Dang, P.; Niu, Z.; Gao, S.; Hou, L.; Zhang, G. Critical Factors Influencing the Sustainable Construction Capability in Prefabrication of Chinese Construction Enterprises. Sustainability 2020, 12, 8996. [Google Scholar] [CrossRef]
- Olawumi, T.O.; Chan, D.W. Critical success factors for implementing building information modeling and sustainability practices in construction projects: A Delphi survey. Sustain. Dev. 2019, 27, 587–602. [Google Scholar] [CrossRef]
- Yu, S.; Malecha, M.; Berke, P. Examining factors influencing plan integration for community resilience in six US coastal cities using Hierarchical Linear Modeling. Landsc. Urban Plan. 2021, 215, 104224. [Google Scholar] [CrossRef]
- DiCarlo, M.F.; Berglund, E.Z. Connected communities improve hazard response: An agent-based model of social media behaviors during hurricanes. Sustain. Cities Soc. 2021, 69, 102836. [Google Scholar] [CrossRef]
- Wardekker, A. Contrasting the framing of urban climate resilience. Sustain. Cities Soc. 2021, 75, 103258. [Google Scholar] [CrossRef]
- Huang, S.; Wang, J.; Fu, Y.; Zuo, W.; Hinkelman, K.; Kaiser, R.M.; He, D.; Vrabie, D. An open-source virtual testbed for a real Net-Zero Energy Community. Sustain. Cities Soc. 2021, 75, 103255. [Google Scholar] [CrossRef]
- Esmalian, A.; Dong, S.; Mostafavi, A. Susceptibility curves for humans: Empirical survival models for determining household-level disturbances from hazards-induced infrastructure service disruptions. Sustain. Cities Soc. 2020, 66, 102694. [Google Scholar] [CrossRef]
- Roberts, F.; Archer, F.; Spencer, C. The potential role of nonprofit organisations in building community resilience to disasters in the context of Victoria, Australia. Int. J. Disaster Risk Reduct. 2021, 65, 102530. [Google Scholar] [CrossRef]
- Lin, S.-Y.; El-Tawil, S.; Aguirre, B.E. Computational Simulation of Benefit Fraud and Community Resilience in the Wake of Disaster. Nat. Hazards Rev. 2020, 21, 04020039. [Google Scholar] [CrossRef]
- Schulze, S.S.; Fischer, E.C.; Hamideh, S.; Mahmoud, H. Wildfire impacts on schools and hospitals following the 2018 California Camp Fire. Nat. Hazards 2020, 104, 901–925. [Google Scholar] [CrossRef]
- Zou, Y.; Stock, A.; Davidson, R.; Nozick, L.; Trainor, J.; Kruse, J. Perceived attributes of hurricane-related retrofits and their effect on household adoption. Nat. Hazards 2020, 104, 201–224. [Google Scholar] [CrossRef]
- Fraser, T.; Aldrich, D.P.; Small, A. Connecting Social Capital and Vulnerability: Citation Network Analysis of Disaster Studies. Nat. Hazards Rev. 2021, 22, 04021016. [Google Scholar] [CrossRef]
- Rakotosamimanana, S.; Rakotoarimanana, F.J.; Raharimanga, V.; Taglioni, F.; Ramamonjisoa, J.; Randremanana, R.V.; Rajerison, M.; Rakotomanana, F. Additional file 1 of Influence of Sociospatial determinants on knowledge, attitudes and practices related to the plague in a population living in endemic areas in the central highlands, Madagascar. BMC Public Health 2021, 21, 1–11. [Google Scholar] [CrossRef]
- Khalafzai, M.-A.K.; McGee, T.K.; Parlee, B. Spring flooding and recurring evacuations of Kashechewan First Nation, northern Ontario, Canada. Int. J. Disaster Risk Reduct. 2021, 63, 102443. [Google Scholar] [CrossRef]
- Page-Tan, C. An analysis of social media use and neighbor-assisted debris removal in Houston following Hurricane Harvey. Int. J. Disaster Risk Reduct. 2021, 63, 102450. [Google Scholar] [CrossRef]
- Uddin, M.S.; Haque, C.E.; Khan, M.N.; Doberstein, B.; Cox, R.S. Disasters threaten livelihoods, and people cope, adapt and make transformational changes: Community resilience and livelihoods reconstruction in coastal communities of Bangladesh. Int. J. Disaster Risk Reduct. 2021, 63, 102444. [Google Scholar] [CrossRef]
- Bernardini, G.; Finizio, F.; Postacchini, M.; Quagliarini, E. Assessing the flood risk to evacuees in outdoor built environments and relative risk reduction strategies. Int. J. Disaster Risk Reduct. 2021, 64, 102493. [Google Scholar] [CrossRef]
- Choudhury, M.-U.; Haque, C.E.; Doberstein, B. Adaptive governance and community resilience to cyclones in coastal Bangladesh: Addressing the problem of fit, social learning, and institutional collaboration. Environ. Sci. Policy 2021, 124, 580–592. [Google Scholar] [CrossRef]
- Mohibbullah, M.; Gain, A.K.; Ahsan, N. Examining local institutional networks for sustainable disaster management: Empirical evidence from the South-West coastal areas in Bangladesh. Environ. Sci. Policy 2021, 124, 433–440. [Google Scholar] [CrossRef]
- Ramezani, R.; Farshchin, A. Urban Resilience and Its Relationship with Urban Poverty. J. Urban Plan. Dev. 2021, 147, 05021042. [Google Scholar] [CrossRef]
- Hestad, D.; Tàbara, J.D.; Thornton, T.F. The role of sustainability-oriented hybrid organisations in the development of transformative capacities: The case of Barcelona. Cities 2021, 119, 103365. [Google Scholar] [CrossRef]
- Fazey, I.; Carmen, E.; Ross, H.; Rao-Williams, J.; Hodgson, A.; Searle, B.A.; AlWaer, H.; Kenter, J.O.; Knox, K.; Butler, J.R.A.; et al. Social dynamics of community resilience building in the face of climate change: The case of three Scottish communities. Sustain. Sci. 2021, 16, 1731–1747. [Google Scholar] [CrossRef]
- Tshimanga, R.M.; Lutonadio, G.S.K.; Kabujenda, N.K.; Sondi, C.M.; Mihaha, E.T.N.; Ngandu, J.F.K.; Nkaba, L.N.; Sankania, G.M.; Beya, J.T.; Kombayi, A.M.; et al. An integrated information system of climate-watermigrations-conflicts nexus in the Congo basin. Sustainability 2021, 13, 9323. [Google Scholar] [CrossRef]
- Ilie, M.; Ilie, G. The traditional wooden gates of maramure (Romania) as a part of the place legitimization processes. Transylv. Rev. 2021, 30, 83–98. [Google Scholar] [CrossRef]
- Bilau, A.A.; Witt, E.; Lill, I. Analysis of Measures for Managing Issues in Post-Disaster Housing Reconstruction. Buildings 2017, 7, 29. [Google Scholar] [CrossRef] [Green Version]
- Bae, J.-W.; Kim, Y.-W. Sustainable Value on Construction Projects and Lean Construction. J. Green Build. 2008, 3, 156–167. [Google Scholar] [CrossRef]
- Keysar, E.; Pearce, A.R. Decision Support Tools for Green Building: Facilitating Selection among New Adopters on Public Sector Projects. J. Green Build. 2007, 2, 153–171. [Google Scholar] [CrossRef]
- Ariaratnam, S.T.; Sihabuddin, S.S. Comparison of Emitted Emissions between Trenchless Pipe Replacement and Open Cut Utility Construction. J. Green Build. 2009, 4, 126–140. [Google Scholar] [CrossRef]
- Burroughs, S. Recommendations for the Selection, Stabilization, and Compaction of Soil for Rammed Earth Wall Construction. J. Green Build. 2010, 5, 101–114. [Google Scholar] [CrossRef]
- De Luca, P.; Carbone, I.; Nagy, J.B. Green Building Materials: A Review of State of the Art Studies of Innovative Materials. J. Green Build. 2017, 12, 141–161. [Google Scholar] [CrossRef]
- Mulligan, T.; Mollaoğlu-Korkmaz, S.; Cotner, R.; Goldsberry, A.D. Public policy and impacts on adoption of sustainable built environments: Learning from the constuction industry playmakers. J. Green Build. 2014, 9, 182–202. [Google Scholar] [CrossRef]
- Cheng, B.; Li, J.; Tam, V.W.Y.; Yang, M.; Chen, D. A BIM-LCA Approach for Estimating the Greenhouse Gas Emissions of Large-Scale Public Buildings: A Case Study. Sustainability 2020, 12, 685. [Google Scholar] [CrossRef] [Green Version]
- Xiao, L.; Lo, S.; Liu, J.; Zhou, J.; Li, Q. Nonlinear and synergistic effects of TOD on urban vibrancy: Applying local explanations for gradient boosting decision tree. Sustain. Cities Soc. 2021, 72, 103063. [Google Scholar] [CrossRef]
- Van De Lindt, J.W.; Peacock, W.G.; Mitrani-Reiser, J.; Rosenheim, N.; Deniz, D.; Dillard, M.; Tomiczek, T.; Koliou, M.; Graettinger, A.; Crawford, P.S.; et al. Community Resilience-Focused Technical Investigation of the 2016 Lumberton, North Carolina, Flood: An Interdisciplinary Approach. Nat. Hazards Rev. 2020, 21, 04020029. [Google Scholar] [CrossRef]
- Wu, W.-N. Disaster-Resistant Community: An examination of developmental differences. Nat. Hazards 2020, 101, 125–142. [Google Scholar] [CrossRef]
- Sutton, S.A.; Paton, D.; Buergelt, P.; Sagala, S.; Meilianda, E. Nandong smong and tsunami lullabies: Song and music as an effective communication tool in disaster risk reduction. Int. J. Disaster Risk Reduct. 2021, 65, 102527. [Google Scholar] [CrossRef]
- Rendon, C.; Osman, K.K.; Faust, K.M. Path towards community resilience: Examining stakeholders’ coordination at the intersection of the built, natural, and social systems. Sustain. Cities Soc. 2021, 68, 102774. [Google Scholar] [CrossRef]
- Qiang, Y.; Huang, Q.; Xu, J. Observing community resilience from space: Using nighttime lights to model economic disturbance and recovery pattern in natural disaster. Sustain. Cities Soc. 2020, 57, 102115. [Google Scholar] [CrossRef]
- Yang, Y.; Ng, S.T.; Zhou, S.; Xu, F.J.; Li, D.; Li, H. A federated pre-event community resilience approach for assessing physical and social sub-systems: An extreme rainfall case in Hong Kong. Sustain. Cities Soc. 2019, 52, 101859. [Google Scholar] [CrossRef]
- Jafari, M.; Alipour, A. Review of approaches, opportunities, and future directions for improving aerodynamics of tall buildings with smart facades. Sustain. Cities Soc. 2021, 72, 102979. [Google Scholar] [CrossRef]
- Davis, C.A. Understanding Functionality and Operability for Infrastructure System Resilience. Nat. Hazards Rev. 2021, 22, 06020005. [Google Scholar] [CrossRef]
- Sediek, O.A.; El-Tawil, S.; McCormick, J. Dynamic Modeling of In-Event Interdependencies in Community Resilience. Nat. Hazards Rev. 2020, 21, 04020041. [Google Scholar] [CrossRef]
- Nozhati, S.; Ellingwood, B.R.; Mahmoud, H. Understanding Community Resilience from a PRA Perspective Using Binary Decision Diagrams. Risk Anal. 2019, 39, 2127–2142. [Google Scholar] [CrossRef]
- Jia, Y.; Sasani, M. Modeling Joint Probability of Wind and Flood Hazards in Boston. Nat. Hazards Rev. 2021, 22, 04021047. [Google Scholar] [CrossRef]
- Miller, W.; Machard, A.; Bozonnet, E.; Yoon, N.; Qi, D.; Zhang, C.; Liu, A.; Sengupta, A.; Akander, J.; Hayati, A.; et al. Conceptualising a resilient cooling system: A socio-technical approach. City Environ. Interact. 2021, 11, 100065. [Google Scholar] [CrossRef]
- Chen, Q.; Kleinman, L.; Dial, A. Energy performance of campus leed® buildings: Implications for green building and energy policy. J. Green Build. 2015, 10, 137–160. [Google Scholar] [CrossRef]
- Chen, X.; Lu, W.; Xue, F.; Xu, J. A cost-benefit analysis of green buildings with respect to construction waste minimization using big data in Hong Kong. J. Green Build. 2018, 13, 61–76. [Google Scholar] [CrossRef]
- Budowle, R.; Krszjzaniek, E.; Taylor, C. Students as Change Agents for Community–University Sustainability Transition Partnerships. Sustainability 2021, 13, 6036. [Google Scholar] [CrossRef]
- Leckey, E.H.; Littrell, M.K.; Okochi, C.; González-Bascó, I.; Gold, A.; Rosales-Collins, S. Exploring local environmental change through filmmaking: The Lentes en Cambio Climático program. J. Environ. Educ. 2021, 52, 207–222. [Google Scholar] [CrossRef]
- Surya, B.; Suriani, S.; Menne, F.; Abubakar, H.; Idris, M.; Rasyidi, E.; Remmang, H. Community Empowerment and Utilization of Renewable Energy: Entrepreneurial Perspective for Community Resilience Based on Sustainable Management of Slum Settlements in Makassar City, Indonesia. Sustainability 2021, 13, 3178. [Google Scholar] [CrossRef]
- Pacheco, E.M.; Bisaga, I.; Oktari, R.S.; Parikh, P.; Joffe, H. Integrating psychosocial and WASH school interventions to build disaster resilience. Int. J. Disaster Risk Reduct. 2021, 65, 102520. [Google Scholar] [CrossRef]
- Floetgen, R.; Strauss, J.; Weking, J.; Hein, A.; Urmetzer, F.; Böhm, M.; Krcmar, H. Introducing platform ecosystem resilience: Leveraging mobility platforms and their ecosystems for the new normal during COVID-19. Eur. J. Inf. Syst. 2021, 30, 304–321. [Google Scholar] [CrossRef]
- Zamuda, C.D.; Ressler, A. Federal adaptation and mitigation programs supporting Community investment in electricity resilience to extreme weather. Electr. J. 2020, 33, 106825. [Google Scholar] [CrossRef]
- Zhang, W.; Valencia, A.; Gu, L.; Zheng, Q.P.; Chang, N.-B. Integrating emerging and existing renewable energy technologies into a community-scale microgrid in an energy-water nexus for resilience improvement. Appl. Energy 2020, 279, 115716. [Google Scholar] [CrossRef]
- Bukar, U.A.; Jabar, M.A.; Sidi, F.; Nor, R.N.H.B.; Abdullah, S.; Othman, M. Crisis Informatics in the Context of Social Media Crisis Communication: Theoretical Models, Taxonomy, and Open Issues. IEEE Access 2020, 8, 185842–185869. [Google Scholar] [CrossRef]
- Kaupper, T.; Mendes, L.W.; Harnisz, M.; Krause, S.M.B.; Horn, M.A.; Ho, A. Recovery of Methanotrophic Activity Is Not Reflected in the Methane-Driven Interaction Network after Peat Mining. Appl. Environ. Microbiol. 2021, 87. [Google Scholar] [CrossRef]
- Masindi, V.; Chatzisymeon, E.; Kortidis, I.; Foteinis, S. Assessing the sustainability of acid mine drainage (AMD) treatment in South Africa. Sci. Total Environ. 2018, 635, 793–802. [Google Scholar] [CrossRef] [Green Version]
- Randolph, R.; Chacko, S.; Morsch, G. Disaster Medicine: Public Health Threats Associated with Disasters. FP Essent 2019, 487, 11–16. [Google Scholar]
- Roemer, K.F.; Haggerty, J.H. Coal communities and the U.S. energy transition: A policy corridors assessment. Energy Policy 2021, 151, 112112. [Google Scholar] [CrossRef]
- Yi, C.; Jackson, N. A review of measuring ecosystem resilience to disturbance. Environ. Res. Lett. 2021, 16, 053008. [Google Scholar] [CrossRef]
- Lin, H.; Wang, Q.; Zhou, J.; Wang, D.; Men, Y.; Bai, Y.; Qu, J. Recovery trajectories and community resilience of biofilms in receiving rivers after wastewater treatment plant upgrade. Environ. Res. 2021, 199, 111349. [Google Scholar] [CrossRef]
- Moura, A.; Centurion, V.; Okada, D.; Motteran, F.; Delforno, T.; Oliveira, V.; Varesche, M. Laundry wastewater and domestic sewage pilot-scale anaerobic treatment: Microbial community resilience regarding sulfide production. J. Environ. Manag. 2019, 251, 109495. [Google Scholar] [CrossRef]
- Satty, T. Decisions with the Analytic Network Process (ANP); University of Pittsburgh (USA), ISAHP: Pittsburgh, PA, USA, 1996; Volume 96. [Google Scholar]
- Wu, Y.; Zhang, B.; Xu, C.; Li, L. Site selection decision framework using fuzzy ANP-VIKOR for large commercial rooftop PV system based on sustainability perspective. Sustain. Cities Soc. 2018, 40, 454–470. [Google Scholar] [CrossRef]
- Mahdiyar, A.; Tabatabaee, S.; Durdyev, S.; Ismail, S.; Abdullah, A.; Rani, W.N.M.W.M. A prototype decision support system for green roof type selection: A cybernetic fuzzy ANP method. Sustain. Cities Soc. 2019, 48, 101532. [Google Scholar] [CrossRef]
- Ghosh, S.; Das Chatterjee, N.; Dinda, S. Urban ecological security assessment and forecasting using integrated DEMATEL-ANP and CA-Markov models: A case study on Kolkata Metropolitan Area, India. Sustain. Cities Soc. 2021, 68, 102773. [Google Scholar] [CrossRef]
- Rad, T.G.; Sadeghi-Niaraki, A.; Abbasi, A.; Choi, S.-M. A methodological framework for assessment of ubiquitous cities using ANP and DEMATEL methods. Sustain. Cities Soc. 2018, 37, 608–618. [Google Scholar] [CrossRef]
- Chang, D.-Y. Applications of the extent analysis method on fuzzy AHP. Eur. J. Oper. Res. 1996, 95, 649–655. [Google Scholar] [CrossRef]
- Ghodsypour, S.H.; O’Brien, C. A decision support system for supplier selection using an integrated analytic hierarchy process and linear programming. Int. J. Prod. Econ. 1998, 56–57, 199–212. [Google Scholar] [CrossRef]
- Vaidya, O.S.; Kumar, S. Analytic hierarchy process: An overview of applications. Eur. J. Oper. Res. 2006, 169, 1–29. [Google Scholar] [CrossRef]
- Chen, H.; Li, H.; Wang, Y.; Cheng, B. A Comprehensive Assessment Approach for Water-Soil Environmental Risk during Railway Construction in Ecological Fragile Region Based on AHP and MEA. Sustainability 2020, 12, 7910. [Google Scholar] [CrossRef]
- Pohekar, S.; Ramachandran, M. Application of multi-criteria decision making to sustainable energy planning—A review. Renew. Sustain. Energy Rev. 2004, 8, 365–381. [Google Scholar] [CrossRef]
- Rezaei, J. Best-worst multi-criteria decision-making method. Omega 2015, 53, 49–57. [Google Scholar] [CrossRef]
- Tzeng, G.-H.; Chiang, C.-H.; Li, C. Evaluating intertwined effects in e-learning programs: A novel hybrid MCDM model based on factor analysis and DEMATEL. Expert Syst. Appl. 2007, 32, 1028–1044. [Google Scholar] [CrossRef]
- Opricovic, S.; Tzeng, G.-H. Compromise solution by MCDM methods: A comparative analysis of VIKOR and TOPSIS. Eur. J. Oper. Res. 2004, 156, 445–455. [Google Scholar] [CrossRef]
- Sayadi, M.K.; Heydari, M.; Shahanaghi, K. Extension of VIKOR method for decision making problem with interval numbers. Appl. Math. Model. 2009, 33, 2257–2262. [Google Scholar] [CrossRef]
- Xu, X. The SIR method: A superiority and inferiority ranking method for multiple criteria decision making. Eur. J. Oper. Res. 2001, 131, 587–602. [Google Scholar] [CrossRef]
- Wang, X.; Triantaphyllou, E. Ranking irregularities when evaluating alternatives by using some ELECTRE methods. Omega 2008, 36, 45–63. [Google Scholar] [CrossRef]
- Figueira, J.R.; Mousseau, V.; Roy, B. ELECTRE methods. In Multiple Criteria Decision Analysis; Springer: New York, NY, USA, 2016; pp. 155–185. [Google Scholar]
- Guitouni, A.; Martel, J.-M. Tentative guidelines to help choosing an appropriate MCDA method. Eur. J. Oper. Res. 1998, 109, 501–521. [Google Scholar] [CrossRef]
- Chang, Y.-H.; Yeh, C.-H. A new method selection approach for fuzzy group multicriteria decision making. Appl. Soft Comput. 2013, 13, 2179–2187. [Google Scholar] [CrossRef]
- Zcan, T.; Çelebi, N.; Esnaf, Ş. Comparative analysis of multi-criteria decision making methodologies and implementation of a warehouse location selection problem. Expert Sys. Appl. 2011, 38, 9773–9779. [Google Scholar]
- Saaty, T.L.; Ergu, D. When is a Decision-Making Method Trustworthy? Criteria for Evaluating Multi-Criteria Decision-Making Methods. Int. J. Inf. Technol. Decis. Mak. 2015, 14, 1171–1187. [Google Scholar] [CrossRef]
- Zanakis, S.H.; Solomon, A.; Wishart, N.; Dublish, S. Multi-attribute decision making: A simulation comparison of select methods. Eur. J. Oper. Res. 1998, 107, 507–529. [Google Scholar] [CrossRef]
- Kornyshova, E.; Salinesi, C. MCDM techniques selection approaches: State of the art. In Proceedings of the 2007 IEEE Symposium on Computational Intelligence in Multi-Criteria Decision-Making, Honolulu, HI, USA, 1–5 April 2007; pp. 22–29. [Google Scholar]
- Li, Y.; Thomas, M.A. A Multiple Criteria Decision Analysis (MCDA) software selection framework. In Proceedings of the 2014 47th Hawaii International Conference on System Sciences, Waikoloa, HI, USA, 6–9 January 2014; pp. 1084–1094. [Google Scholar]
- Kolios, A.; Mytilinou, V.; Lozano-Minguez, E.; Salonitis, K. A Comparative Study of Multiple-Criteria Decision-Making Methods under Stochastic Inputs. Energies 2016, 9, 566. [Google Scholar] [CrossRef] [Green Version]
- Sałabun, W.; Wątróbski, J.; Shekhovtsov, A. Are MCDA Methods Benchmarkable? A Comparative Study of TOPSIS, VIKOR, COPRAS, and PROMETHEE II Methods. Symmetry 2020, 12, 1549. [Google Scholar] [CrossRef]
- Wątróbski, J.; Jankowski, J.; Ziemba, P.; Karczmarczyk, A.; Zioło, M. Generalised framework for multi-criteria method selection. Omega 2018, 86, 107–124. [Google Scholar] [CrossRef]
- Brans, J.; Vincke, P.; Mareschal, B. How to select and how to rank projects: The Promethee method. Eur. J. Oper. Res. 1986, 24, 228–238. [Google Scholar] [CrossRef]
- Cheng, B.; Wang, L.; Huang, J.; Shi, X.; Hu, X.; Chen, H. A Computing Model for Quantifying the Value of Structural Health Monitoring Information in Bridge Engineering. Math. Probl. Eng. 2020, 2020, 8260909. [Google Scholar] [CrossRef]
- Cheng, B.; Wei, Y.; Zhang, W.; Zhou, X.; Chen, H.; Huang, L.; Huang, J.; Kang, X. Evolutionary Game Simulation on Government Incentive Strategies of Prefabricated Construction: A System Dynamics Approach. Complexity 2020, 2020, 8854609. [Google Scholar] [CrossRef]
- Cheba, K.; Kiba-Janiak, M.; Baraniecka, A.; Kołakowski, T. Impact of external factors on e-commerce market in cities and its implications on environment. Sustain. Cities Soc. 2021, 72, 103032. [Google Scholar] [CrossRef]
- Chen, L.; Pan, W. BIM-aided variable fuzzy multi-criteria decision making of low-carbon building measures selection. Sustain. Cities Soc. 2016, 27, 222–232. [Google Scholar] [CrossRef]
- Wu, Y.; Wang, Y.; Chen, K.; Xu, C.; Li, L. Social sustainability assessment of small hydropower with hesitant PROMETHEE method. Sustain. Cities Soc. 2017, 35, 522–537. [Google Scholar] [CrossRef]
- Palczewski, K.; Sałabun, W. Influence of various normalization methods in PROMETHEE II: An empirical study on the selection of the airport location. Procedia Comput. Sci. 2019, 159, 2051–2060. [Google Scholar] [CrossRef]
- Zięba, Z.; Dąbrowska, J.; Marschalko, M.; Pinto, J.; Mrówczyńska, M.; Leśniak, A.; Petrovski, A.; Kazak, J.K. Built Environment Challenges Due to Climate Change. IOP Conf. Ser. Earth Environ. Sci. 2020, 609. [Google Scholar] [CrossRef]
- Bouwer, L.M. Observed and projected impacts from extreme weather events: Implications for loss and damage. In Loss and Damage from Climate Change; Springer: Cham, Switzerland, 2019; pp. 63–82. [Google Scholar]


| Number | Indicators | Criteria Tier | Source of Data |
|---|---|---|---|
| C1 | Safety and health of residents | Management and resource | [94,95,96] |
| C2 | Participation rate of stakeholders | [94,97] | |
| C3 | Earthquake and fire prevention knowledge | [83,84,98,99,100,101] | |
| C4 | Chaos following an earthquake | [58,86,102] | |
| C5 | Response time of the firefighters | [103,104,105,106] | |
| C6 | External support | [77,107,108,109] | |
| C7 | Emergency management capabilities | [94,110] | |
| C8 | Resource reserve | [30,111,112,113] | |
| C9 | Anti-seismic and fire-proof design of buildings | Design and financial support | [79,114,115,116,117,118,119,120,121,122] |
| C10 | Finances of the community | [123,124,125] | |
| C11 | Communication systems | [83,84,94,126,127,128,129] | |
| C12 | Transportation systems | [3,4,5,130,131,132] | |
| C13 | Security systems | [77,81,113,133] | |
| C14 | Firefighting systems | [99,100,101,134] | |
| C15 | Gas supply systems | [79,135,136,137] | |
| C16 | Water supply systems | The function of urban infrastructure | [79,80,93,138,139,140] |
| C17 | Electricity supply systems | [97,135,141,142,143,144] | |
| C18 | Active fire control systems | [93,145,146] | |
| C19 | Sewage systems | [34,147,148] | |
| C20 | Waste treatment systems | [149,150,151,152] |
| Responders NO. | Roles in the Community | Years | Participants | Percentages |
|---|---|---|---|---|
| 1 | Local citizens | 19 years | 20 | 31.7% |
| 2 | Government branch | 8 years | 7 | 11.1% |
| 3 | Clerk in the community office | 13 years | 10 | 15.9% |
| 4 | Fire department and earthquake administration | 8 years | 4 | 6.3% |
| 5 | Security personnel in the community | 13 years | 4 | 6.3% |
| 6 | Firefighters | 10 years | 5 | 7.9% |
| 7 | Emergency management personnel | 11 years | 3 | 4.8% |
| 8 | Volunteers in the community | 5 years | 10 | 15.9% |
| Scores (S) | Pairwise Comparison | Index for the Importance |
|---|---|---|
| I | Ci→Cj | a |
| III | Ci→Cj | b |
| V | Ci→Cj | c |
| VII | Ci→Cj | d |
| IX | Ci→Cj | e |
| II, IV, VI, VIII | Median | Between the above indexes |
| 1/S | Cj→Ci | Negative values |
| C(i) | 1 | 2 | 3 | 4 | 5 | 6 | 7 | 8 | 9 | 10 | 11 | 12 | 13 | 14 | 15 | 16 | 17 | 18 | 19 | 20 |
|---|---|---|---|---|---|---|---|---|---|---|---|---|---|---|---|---|---|---|---|---|
| 1 | 1 | 1 | 1 | 1 | ||||||||||||||||
| 2 | 1 | 1 | 1 | 1 | 1 | 1 | ||||||||||||||
| 3 | ||||||||||||||||||||
| 4 | 1 | 1 | 1 | |||||||||||||||||
| 5 | 1 | 1 | ||||||||||||||||||
| 6 | 1 | 1 | ||||||||||||||||||
| 7 | 1 | |||||||||||||||||||
| 8 | 1 | 1 | ||||||||||||||||||
| 9 | 1 | 1 | ||||||||||||||||||
| 10 | ||||||||||||||||||||
| 11 | 1 | 1 | 1 | |||||||||||||||||
| 12 | 1 | 1 | 1 | |||||||||||||||||
| 13 | 1 | |||||||||||||||||||
| 14 | 1 | 1 | 1 | |||||||||||||||||
| 15 | 1 | 1 | ||||||||||||||||||
| 16 | 1 | 1 | ||||||||||||||||||
| 17 | 1 | 1 | 1 | |||||||||||||||||
| 18 | 1 | |||||||||||||||||||
| 19 | 1 | 1 | 1 | |||||||||||||||||
| 20 | 1 |
| Number | Code | Indicators | Weights |
|---|---|---|---|
| 1 | C1 | Safety and health of residents | 0.1250 |
| 2 | C2 | Participation rate of stakeholders | 0.0256 |
| 3 | C3 | Earthquake and fire prevention knowledge | 0.0753 |
| 4 | C4 | Chaos following an earthquake | 0.0159 |
| 5 | C5 | Response time of the firefighters | 0.0570 |
| 6 | C6 | External support | 0.0167 |
| 7 | C7 | Emergency management capabilities | 0.0483 |
| 8 | C8 | Resource reserve | 0.0291 |
| 9 | C9 | Anti-seismic and fire-proof design of buildings | 0.1074 |
| 10 | C10 | Finances of the community | 0.0256 |
| 11 | C11 | Communication systems | 0.0175 |
| 12 | C12 | Transportation systems | 0.0387 |
| 13 | C13 | Security systems | 0.0139 |
| 14 | C14 | Firefighting systems | 0.0198 |
| 15 | C15 | Gas supply systems | 0.0345 |
| 16 | C16 | Water supply systems | 0.0284 |
| 17 | C17 | Electricity supply systems | 0.1501 |
| 18 | C18 | Active fire control systems | 0.0492 |
| 19 | C19 | Sewage systems | 0.0962 |
| 20 | C20 | Waste treatment systems | 0.0256 |
| Number | Indicators | G | J | R | H |
|---|---|---|---|---|---|
| 1 | Safety and health of residents | 4 | 4 | 5 | 2 |
| 2 | Participation rate of stakeholders | 3 | 4 | 5 | 3 |
| 3 | Earthquake and fire prevention knowledge | 5 | 3 | 5 | 3 |
| 4 | Chaos following an earthquake | 3 | 2 | 4 | 4 |
| 5 | Response time of the firefighters | 3 | 5 | 3 | 4 |
| 6 | External support | 4 | 3 | 2 | 4 |
| 7 | Emergency management capabilities | 3 | 3 | 5 | 4 |
| 8 | Resource reserve | 3 | 4 | 4 | 3 |
| 9 | Anti-seismic and fire-proof design of buildings | 4 | 2 | 3 | 1 |
| 10 | Finances of the community | 4 | 3 | 3 | 4 |
| 11 | Communication systems | 5 | 5 | 3 | 3 |
| 12 | Transportation systems | 5 | 2 | 2 | 2 |
| 13 | Security systems | 4 | 1 | 2 | 3 |
| 14 | Firefighting systems | 4 | 4 | 4 | 4 |
| 15 | Gas supply systems | 4 | 5 | 5 | 3 |
| 16 | Water supply systems | 5 | 3 | 2 | 1 |
| 17 | Electricity supply systems | 5 | 4 | 4 | 2 |
| 18 | Active fire control systems | 4 | 2 | 1 | 2 |
| 19 | Sewage systems | 4 | 2 | 1 | 5 |
| 20 | Waste treatment systems | 4 | 2 | 3 | 1 |
| Number | Criteria Tier | G Community | J Community | R Community | H Community |
|---|---|---|---|---|---|
| 1 | Management and resource | 88.72 | 53.62 | 100 | 76.28 |
| 2 | Design and financial support | 100 | 90.31 | 78.96 | 52.1 |
| 3 | The function of urban infrastructure | 100 | 96.02 | 71.23 | 63.25 |
Publisher’s Note: MDPI stays neutral with regard to jurisdictional claims in published maps and institutional affiliations. |
© 2021 by the authors. Licensee MDPI, Basel, Switzerland. This article is an open access article distributed under the terms and conditions of the Creative Commons Attribution (CC BY) license (https://creativecommons.org/licenses/by/4.0/).
Share and Cite
He, Z.; Chen, H.; Yan, H.; Yin, Y.; Qiu, Q.; Wang, T. Scenario-Based Comprehensive Assessment for Community Resilience Adapted to Fire Following an Earthquake, Implementing the Analytic Network Process and Preference Ranking Organization Method for Enriched Evaluation II Techniques. Buildings 2021, 11, 523. https://doi.org/10.3390/buildings11110523
He Z, Chen H, Yan H, Yin Y, Qiu Q, Wang T. Scenario-Based Comprehensive Assessment for Community Resilience Adapted to Fire Following an Earthquake, Implementing the Analytic Network Process and Preference Ranking Organization Method for Enriched Evaluation II Techniques. Buildings. 2021; 11(11):523. https://doi.org/10.3390/buildings11110523
Chicago/Turabian StyleHe, Zheng, Huihua Chen, Hongyan Yan, Yang Yin, Qi Qiu, and Tingpeng Wang. 2021. "Scenario-Based Comprehensive Assessment for Community Resilience Adapted to Fire Following an Earthquake, Implementing the Analytic Network Process and Preference Ranking Organization Method for Enriched Evaluation II Techniques" Buildings 11, no. 11: 523. https://doi.org/10.3390/buildings11110523