Article

Critical Factors Affecting Team Work Efficiency in BIM-Based Collaborative Design: An Empirical Study in China

Sino-Australia Joint Research Center in BIM and Smart Construction, Shenzhen University, Shenzhen 518060, China
*
Author to whom correspondence should be addressed.
Buildings 2021, 11(10), 486; https://doi.org/10.3390/buildings11100486
Submission received: 28 September 2021 / Revised: 13 October 2021 / Accepted: 14 October 2021 / Published: 18 October 2021
(This article belongs to the Collection Buildings, Infrastructure and SDGs 2030)

Abstract

:
Building information modeling (BIM) can theoretically facilitate collaboration among diverse design participants in construction projects, but in practice, its implementation tends to prolong the design period. Existing literature has examined some technical and managerial causes of this problem but still lacks an overall coverage of related factors. This study aims to identify the comprehensive factors affecting the teamwork efficiency in China’s BIM-based collaborative design, and to investigate the critical factors and their interactions. Based on the input-process-output theory, this study initially established a hypothetical model. Potential factors were further identified through the literature review and semi-structured interviews. Questionnaire survey was conducted, and structural equation modeling was used for analysis. The results indicated that the team cooperation atmosphere is the most significant factor, followed by the collaborators’ learning ability, comfort of the working environment, BIM software function, and the characteristics and arrangement of the design task (CADT). Besides, the CADT negatively affects the teamwork efficiency through the human interaction process, while other factors exert positive impacts by affecting both the personal work process and the human interaction process. The findings can help design units to determine the management focus of BIM-based collaborative design and prioritize the allocation of limited resources accordingly to maximize teamwork efficiency.

1. Introduction

In the architecture, engineering, and construction (AEC) industry, design activity is deemed a crucial process throughout a building’s life-cycle since it determines up to 80% of the environmental performance and building’s operational costs [1]. The involvement of multiple disciplines in the design task is a prominent feature in this stage. In order to avoid errors and conflicts in construction projects, practical design typically requires close cooperation among participants in diverse professional domains of design, namely, architecture, structure, water supply and drainage, heating ventilation and air conditioning (HVAC), and electrical engineering (EE) [2]. Traditionally, the design teams accomplish a phased collaboration by regularly updating two-dimensional drawings and conducting repeated discussions [3]. However, along with dramatic expansions of the building scale and function, design-related information in construction projects becomes more intricate, resulting in a mismatch between the traditional collaborative design and the latest design requirements. Therefore, it is imperative to adopt a more feasible design approach to meet the demand for efficient collaboration and timely information sharing among project participants [4].
In recent years, various digital technologies offer new opportunities to further enhance collaborative design efficiency, most notably the application of building information modeling (BIM) [5]. As first defined in the National BIM Standard-United States, a building information model aims to “serve as a shared knowledge resource for information about a facility, forming a reliable basis for decisions during its life cycle from inception onward” [6]. BIM technology creates an efficient collaboration platform that enables various professionals to define, modify, and extract the geometric and property information of design elements at any time in a shared virtual environment [7]. Compared with the traditional design approach, the BIM-based collaborative design has the dual advantages in model visualization and information exchange, allowing the real-time communication and coordination between design participants [8,9]. Based on such interconnectivity and interoperability, the BIM implementation helps to streamline the design process and avoid design conflicts caused by different majors [10]. Therefore, BIM-based collaborative design may theoretically contribute to enhanced work efficiency within the design phase.
Despite these expected benefits, some design teams’ work efficiency has declined when applying BIM technology to practical collaborative design. According to the Report on technology application and development of building information modeling in Shanghai [11], 30.77% of design units delayed their project schedule after adopting the BIM-based collaborative design. It indicates that the promotion effect of BIM on collaborative design remains theoretical without addressing some critical hindrances from multiple aspects.
Previous studies have investigated the influencing factors of teamwork efficiency in BIM-based collaborative design. Many of these studies only consider the effect of technical factors on BIM-based collaboration. For example, Oh et al. [4] examined three major technical hindrances in the conventional BIM-based building design and further developed an integrated design system to optimize collaboration efficiency. Another perspective focuses on both factors from management and technology aspects [12]. According to Liu et al. [13], several factors about human-technology interactions and process management significantly influences BIM-based collaborative design. However, there are still two limitations in previous literature. On the one hand, few studies involve a comprehensive investigation of the potential factors. On the other hand, little is known about how these factors interrelate with teamwork efficiency. As a result of neglecting the above issues, the existing research failed to identify the weak areas of the BIM-based collaborative design and provide specific recommendations to enhance team work efficiency.
This study aims to identify critical factors affecting the teamwork efficiency in BIM-based collaborative design and interpret the related influence paths. Three objectives are to be achieved: (1) to discover the possible influencing factors of teamwork efficiency in BIM-based collaborative design; (2) to construct the influence mechanism between these factors and the final teamwork efficiency; and (3) to assess the importance of each type of factors. An empirical study was conducted in the context of China’s construction industry. Initially, a hypothetical model was established based on the input-process-output (I-P-O) theory. The detailed research process employed a holistic methodology with the structural equation model (SEM) as the kernel. Based on the analysis results, specific recommendations on BIM implementation in the design phase were drawn. The findings of this study provide useful references for design units to determine sensible management strategies and prioritize limited resources to enhance teamwork efficiency in BIM-based collaborative design, which is conducive to promoting sustainable development of society.

2. Literature Review and Hypotheses

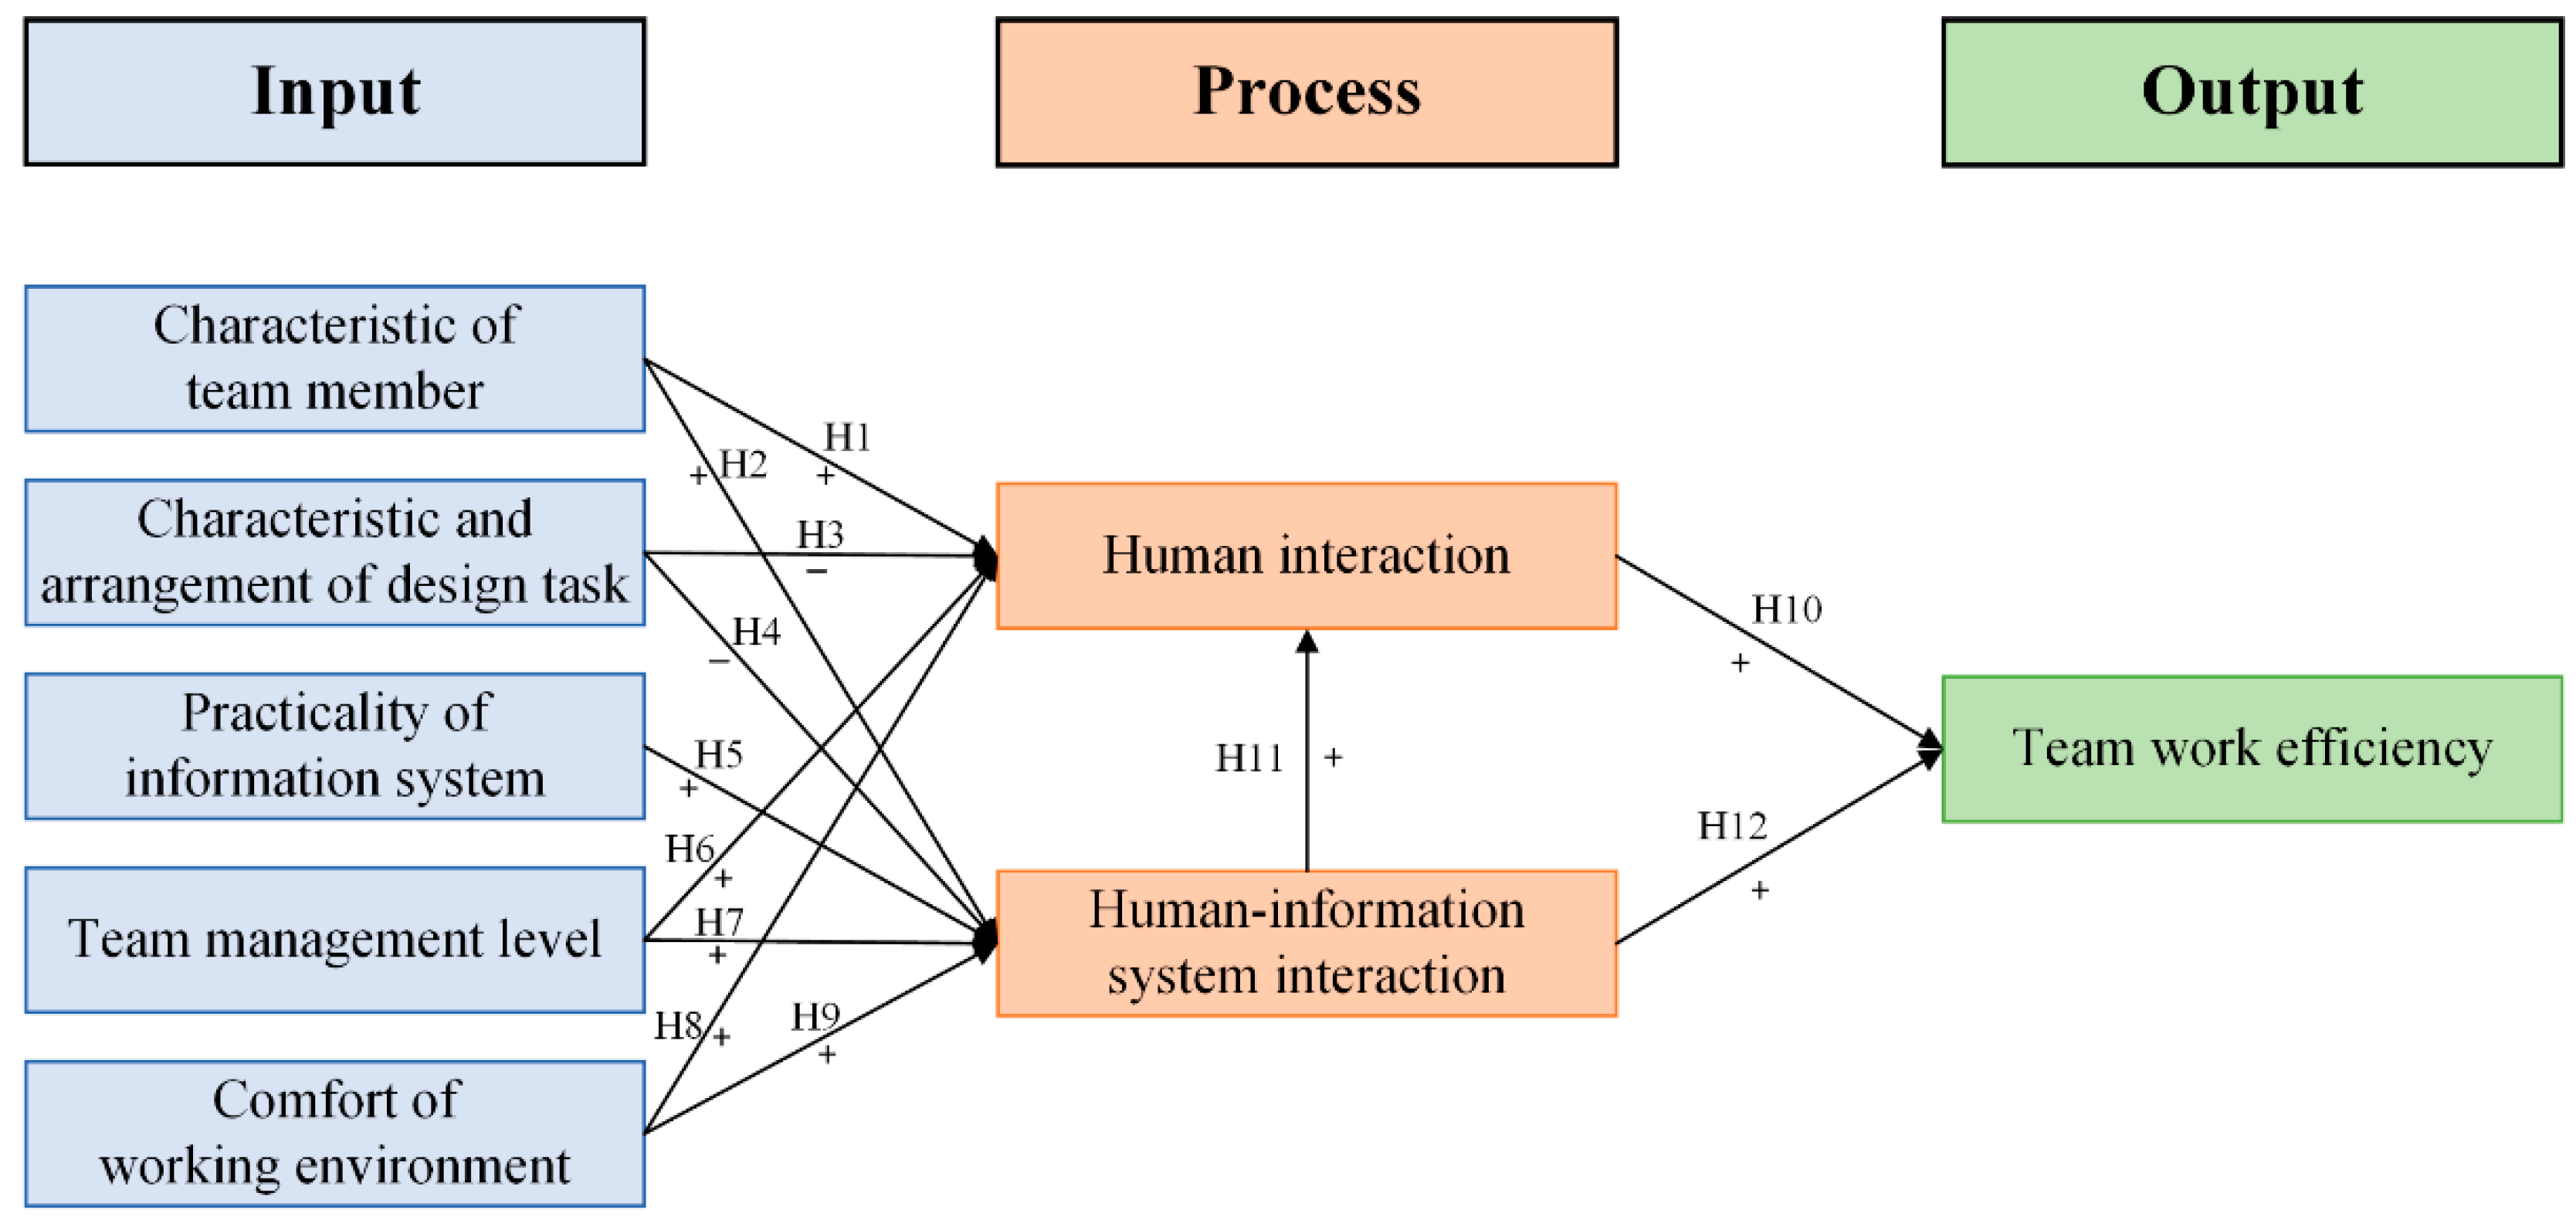
2.1. Theoretical Framework

As a dominant theoretical perspective of team efficiency research, the I-P-O theory has been widely applied in previous studies due to its simplicity and practicality of team conceptualization [14]. The I-P-O theory suggests that team efficiency not only depends on inputs but also are affected by processes [15].
The input in I-P-O theory describes the prerequisite elements that influence the interaction of members, including different levels: the individual level is called the characteristics of team members, such as attitudes, skills, and personality traits; the group level refers to the characteristics and arrangements of the task, the tools required to perform the task, and the management of the team; the organizational level involves the comfort of environment [16]. In this study, according to the work characteristics of BIM-based collaborative design, the extracted variables were characteristic of team member, characteristic and arrangement of design task, practicality of information system, team management level, and comfort of working environment. The process describes the interaction of members in task completion, which explains how the input affects results [17]. The study was particularly concerned with human interaction and human-information system interaction. The output describes the results achieved by the team in terms of efficiency or performance [18], so teamwork efficiency was determined.

2.2. Hypotheses Development

2.2.1. Characteristics of Team Members

The individual is the foundation of team interaction. People generally prefer to interact with members inside the team rather than outside the team [19]. The characteristics of team members include their experience, knowledge, personality, and others. Studies have shown that the members’ experience and knowledge are conducive to information exchange and communication from different perspectives [20]. Furthermore, the personality also influences the changes in interpersonal relationships within the team by affecting the way and extent of interaction with other members [21,22]. Therefore, Hypothesis 1 was proposed:
Hypothesis 1 (H1).
The characteristics of team members have a positive impact on human interaction.
In BIM-based collaborative design, the human-information system interaction refers to the personal work process in which designers complete design tasks by using information systems. The task-related knowledge and skills possessed by members positively influence on their personal work process [23]. Some scholars have clearly pointed out that the members’ personalities, especially conscientiousness, can also affect the working process of individuals in a team [24]. The more responsible members are, the better their personal work will be. Therefore, Hypothesis 2 was proposed:
Hypothesis 2 (H2).
The characteristics of team members have a positive impact on the human-information system interaction.

2.2.2. Characteristic and Arrangement of Design Task

The design task can be explained by its characteristics and arrangements. The characteristics of the design task include difficulty, complexity, and importance. The arrangements of the design task involve whether the arrangement is continuous and stable and whether the feedback is timely. It is found that the complexity of tasks negatively affects the interaction between team members [25]. The negative result of task conflict caused by unreasonable task scheduling is an interactive conflict [26]. Task conflict is seen as a prerequisite for interaction conflict [27], because individuals arguing about tasks respond consciously or unconsciously in harsh and radical ways. This may indicate disrespect and dislike for others, which can trigger negative emotions and lead to interaction conflicts [26]. Therefore, Hypothesis 3 was proposed:
Hypothesis 3 (H3).
The characteristics and arrangement of design tasks have a negative impact on human interaction.
A complicated design task will slow down the work and directly exert a negative impact on the individual work process (namely, human-information system interaction) if its difficulty and complexity is beyond the members’ capabilities [28]. Studies have shown that members are less motivated to participate in more challenging tasks [29]. Task conflicts caused by unreasonable task arrangement can also hinder their work process by bringing negative emotions to individuals [26]. Therefore, Hypothesis 4 was proposed:
Hypothesis 4 (H4).
The characteristics and arrangement of design tasks have a negative impact on the human-information system interaction.

2.2.3. Practicality of Information System

In BIM-based collaborative design, designers need to obtain information from the information system and apply new decisions to design results through the collection, processing, and feedback of information. In this process, participants usually use different software according to the type of work, which will result in data loss during information exchange and repetitive work for data recovery [4]. The interface friendliness and functional rationality of information systems positively influence the designers’ usage perception, thus further affecting their working process with information systems [30]. Therefore, Hypothesis 5 was proposed:
Hypothesis 5 (H5).
The practicality of information systems has a positive impact on the human-information system interaction.

2.2.4. Team Management Level

Team management level can be manifested in two aspects, team incentive and team culture [31]. Effective incentives mainly include salary incentives and promotion incentives, which can significantly increase employees’ passion [32]. Moreover, through emotional sharing, a member’s positive emotion enables other members to have a positive experience and even gain a positive collective state, thus strengthening the interaction process of the whole team members [33]. In addition, Caniëls et al. [34] also showed that a motivational management atmosphere is highly correlated with the collaboration between members. Therefore, Hypothesis 6 was proposed:
Hypothesis 6 (H6).
The team management level has a positive impact on human interaction.
Team culture refers to a subliminal culture formed by members when they accomplish the common goals of the team [35]. Kruchten [36] pointed out that the failure of project teams was due to cultural problems rather than other factors. Some researchers have analyzed that the team culture recognized by members can effectively enhance their cohesion, thus improving their workflow [37] (namely, the human-information system interaction). A well-managed team is beneficial to organize members and guide individuals to work efficiently [21]. Therefore, Hypothesis 7 was proposed:
Hypothesis 7 (H7).
The team management level has a positive impact on the human-information system interaction.

2.2.5. Comfort of Working Environment

The design work carried out by designers is mainly performed in the indoor environment, which includes a personal work area, air quality, light, sound, and thermal environment [38,39]. A well-working environment helps improving employee satisfaction and retention, while a poor may lead to miners and resignations, which inevitably reduce interaction among members [40]. In addition, an ideal working environment also improves employees’ happiness, which means improving their comfort, mood, motivation, vitality, and creativity [41]. This positive emotion drives the internal experience of the team and promotes favorable reactions, such as enhancing information exchange among colleagues, helping to develop interpersonal relationships, and encouraging cooperation [33]. Therefore, Hypothesis 8 was proposed:
Hypothesis 8 (H8).
The comfort of the working environment has a positive impact on human interaction.
The individual work process doesn’t take place in a vacuum, which prompts researchers to consider the working environment [42]. Carlisle et al. [43] confirmed that there is a significant positive correlation between the comfort of working environment and individual work process. Creating a pleasant working environment should be seriously taken so that members can work more effectively, and a more productive organization is built. Genaidy et al. [44] also explained that the working environment would affect the working process and results of members by influencing their behaviors. Therefore, Hypothesis 9 was proposed:
Hypothesis 9 (H9).
The comfort of the working environment has a positive impact on the human-information system interaction.

2.2.6. Human Interaction

Communication and interaction among members are the basis for problem-solving and information sharing [45]. In BIM-based collaborative design, there are some necessary interactions between different professional designers. When the external conditions of the team are determined, it is crucial to effectively manage the internal interaction process of the team to improve team efficiency [46]. Studies have shown that effective team interaction strategies and processes can improve their productivity and efficiency [47]. Therefore, Hypothesis 10 was proposed:
Hypothesis 10 (H10).
Human interaction has a positive impact on teamwork efficiency.

2.2.7. Human-Information System Interaction

Human-information system interaction enables people with different backgrounds and expertise to design together, thus facilitating human interaction in the process of generating new ideas from different perspectives [48]. As the subject of human-information system interaction, designers are required to be skilled in using software to complete design tasks and strengthen communication and cooperation among members to realize the perception, cognition, and decomposition of tasks [49]. When performing collaborative design, the information system used by designers can convey or develop their own design ideas effectively and make communication smoother [4]. Therefore, Hypothesis 11 was proposed:
Hypothesis 11 (H11).
The human-information system interaction has a positive impact on human interaction.
In BIM-based collaborative design, designers of different majors can carry out design work and share information on the same digital model through the information system so that timely understand the design situation of other majors and avoid unnecessary work caused by design collision [8]. Simultaneously, design participants can also timely provide information to owners and other demanders by using the information system [50], thereby speeding up the work progress [51]. This will have a positive impact on both the work efficiency of the team and individuals. Therefore, Hypothesis 12 was proposed:
Hypothesis 12 (H12).
The human-information system interaction has a positive impact on teamwork efficiency.
According to the above hypotheses, a preliminary theoretical model was established, as shown in Figure 1.

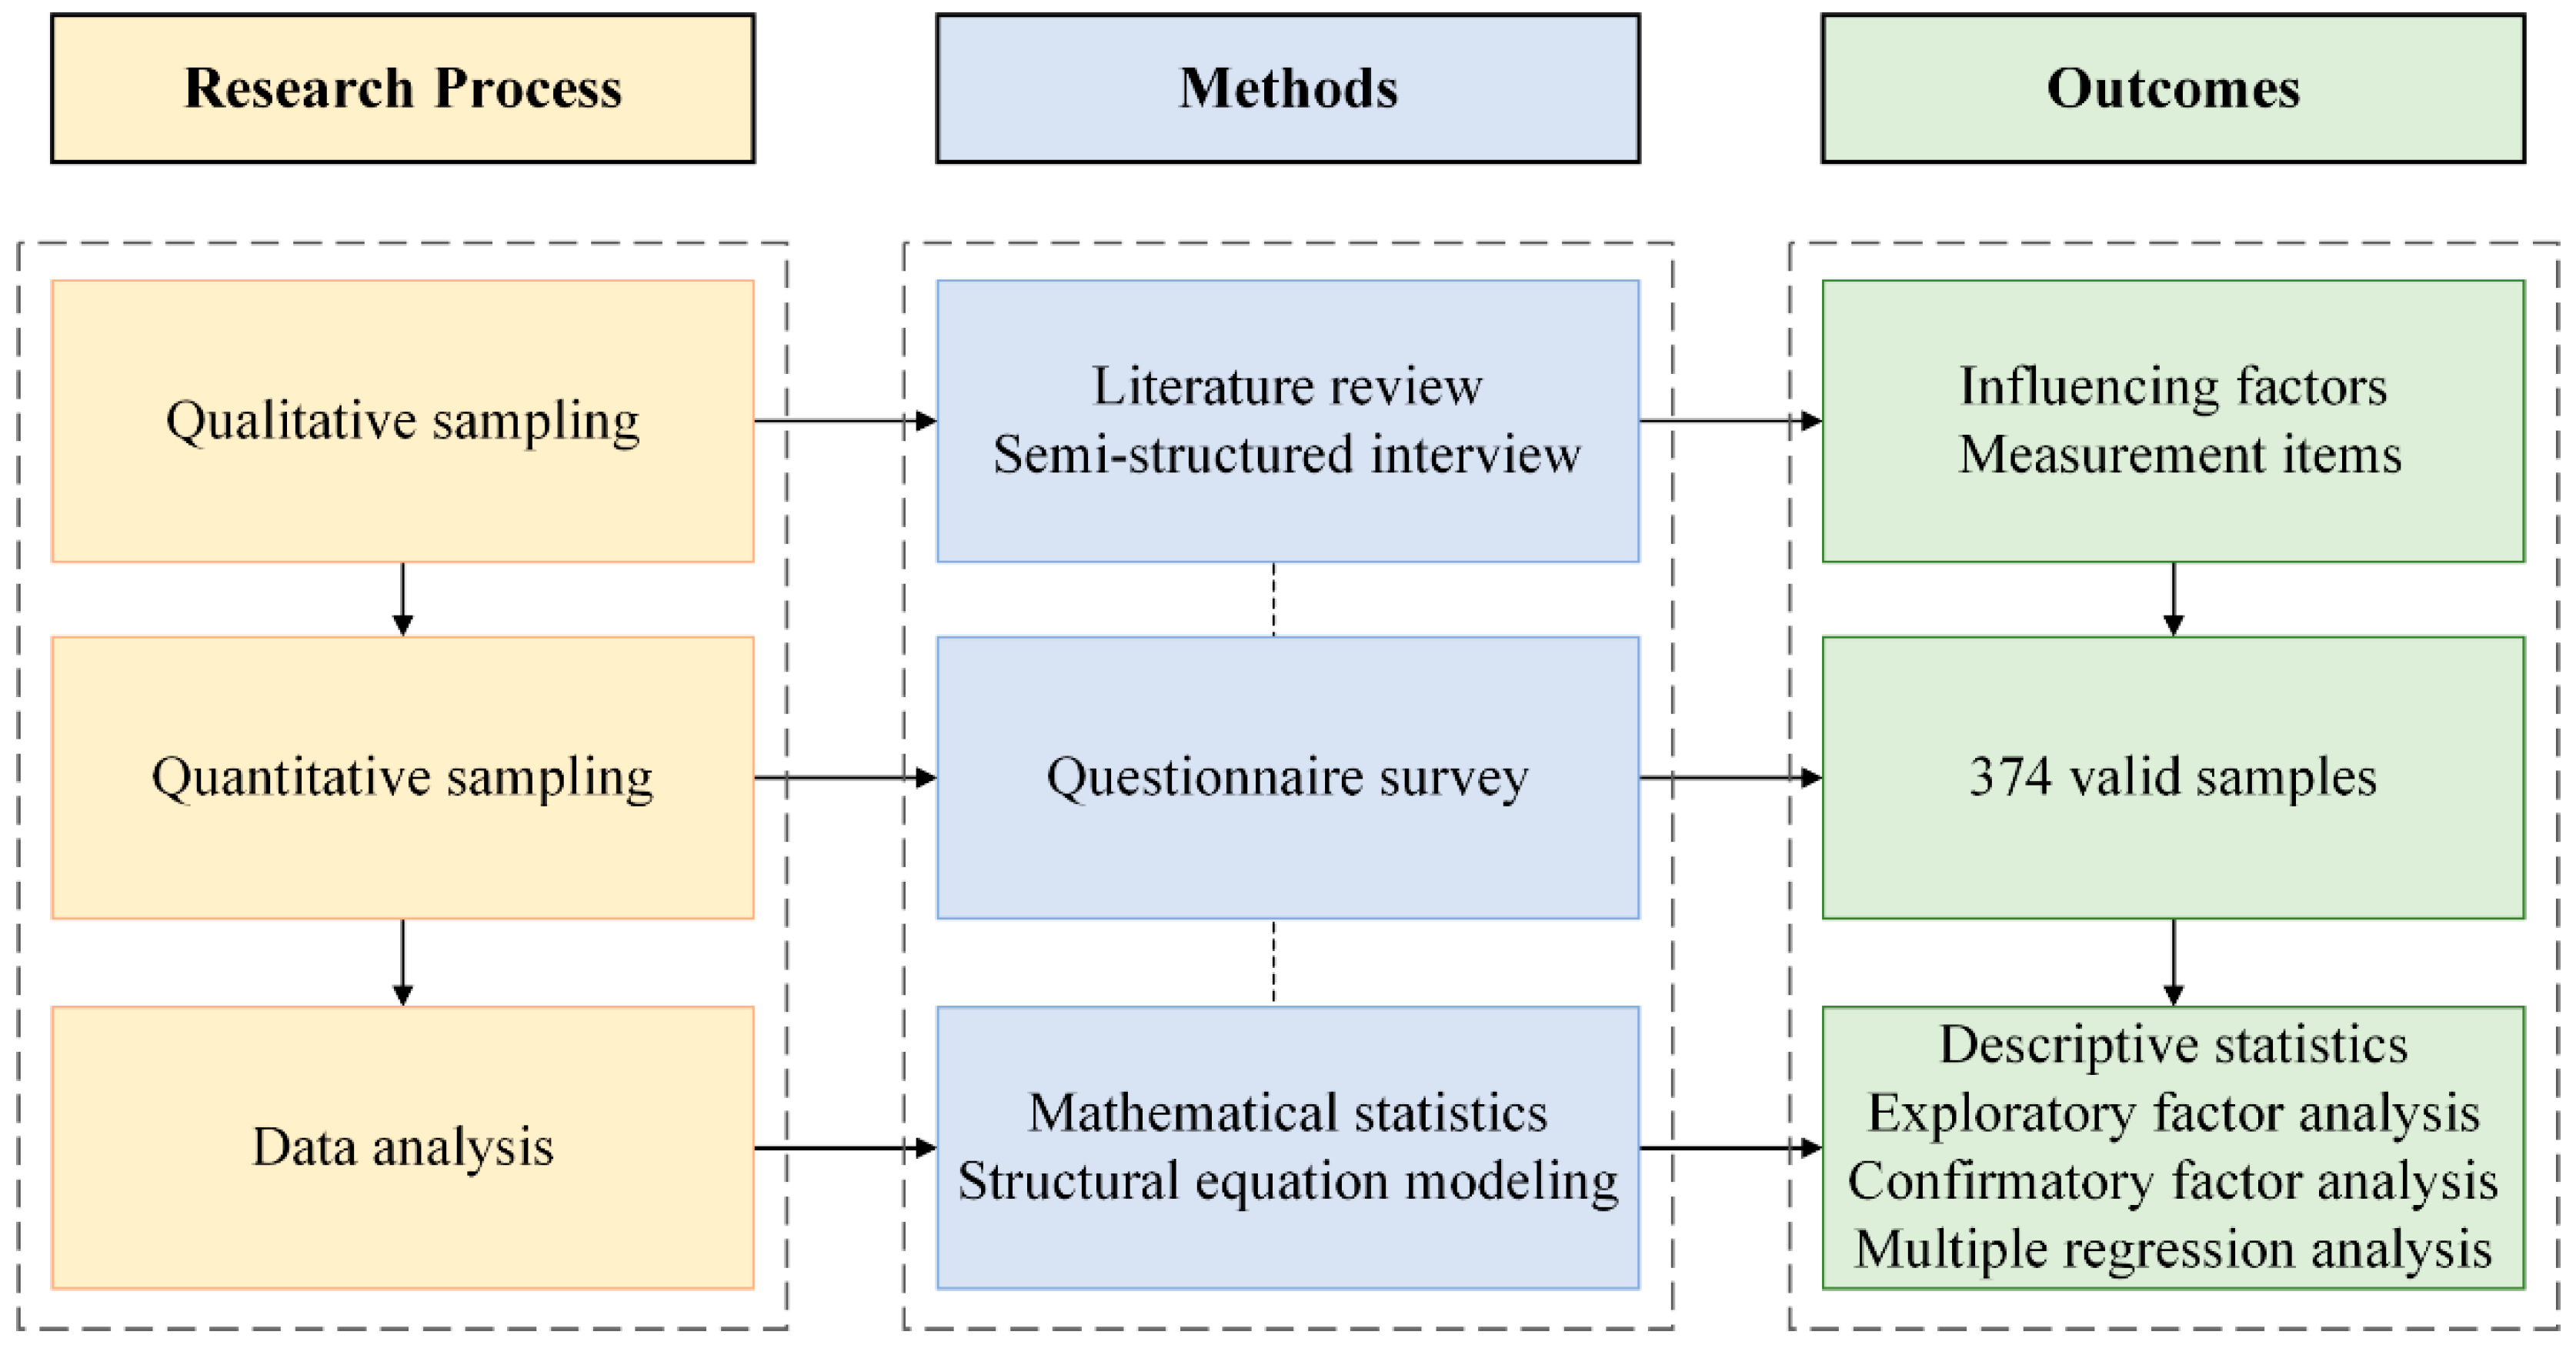
3. Research Methods and Process

The research process is divided into three steps, namely, qualitative sampling, quantitative sampling, and data analysis. Figure 2 illustrates the detailed research process.

3.1. Qualitative Sampling

Crucial factors influencing teamwork efficiency in BIM-based collaborative design were initially collected through literature retrieval in several databases, including Web of Science, Science Direct, ASCE, and EI. For a complete discovery of potential factors, six BIM experts from large design units in Shenzhen, China, were invited for semi-structured interviews to comment on the comprehensiveness of these factors and complement relevant items. The measurement scale was established based on the results of qualitative sampling (Table 1).

3.2. Quantitative Sampling

The questionnaire survey is a quantitative data collection method used to obtain sample data needed for empirical research [72]. The measurement items of the questionnaire were based on a five-point Likert scale. Respondents could choose one of “strongly disagree”, “disagree”, “indifferent”, “agree”, and “strongly agree” to express their attitudes, which were computed as 1, 2, 3, 4, and 5 separately. The questionnaire of this study is in Supplementary File.
Exploratory factor analysis (EFA) and confirmatory factor analysis (CFA) adopted in this study needed to use different samples. Studies had shown that the sample size of EFA was preferably more than 100 [73] and of CFA should be greater than 200 [74]. Therefore, this study conducted a questionnaire survey to collect data. The surveys were given out in Shenzhen, Guangzhou, Shanghai, and other cities with relatively advanced BIM technology development in China. The respondents were mainly concentrated in large and medium-sized design units because small units rarely adopt BIM technology. The respondents were BIM team members with different staff levels, including junior, mid-level, and senior engineers (see Table 2 for percentages). The junior and mid-level engineers were responsible for design works of different majors in the BIM team, such as architecture, structure, HVAC, etc., while the senior mainly took charge of collaborative project management. Then, this study adopted the snowball sampling method to spread the questionnaire online. In this process, BIM experts were invited to distribute the questionnaire on the Internet. A total of 517 questionnaires were collected in two surveys. Through filtering invalid questionnaires, 374 valid returns were obtained, among which the valid number of the first round of questionnaire was 146, and the second number was 228.

3.3. Data Analysis

SEM is a statistical method combining factor analysis and regression analysis, which has been widely used to investigate influencing factors and satisfaction [75,76]. The data analysis in this study included descriptive statistics, EFA, CFA, and multiple regression analysis. The age, educational level, major, title, and years of team members using BIM-based collaborative design were described by frequency, percentage, and cumulative percentage, which contributed to understanding members’ characteristics.
The 146 valid questionnaires from the first survey were used for EFA, which was initially conducted using Cronbach’s alpha with the aid of SPSS Statistics 22 (International Business Machines Corporation, Armonk, NY, USA). The samples were performed by Kjel-Meyer-Orkin (KMO) measurement and Bartlett spherical test to verify the applicability of factor analysis. When the KMO is higher than 0.6, and the Bartlett sphericity test is lower than 0.05, the sample is considered to satisfy the factor analysis [74]. Varimax rotation is the most commonly used factor rotation method, which can denoise the load column to clarify the factors’ meaning. Therefore, principal component analysis and Varimax rotation were applied to EFA, and the factor with the minimum eigenvalue higher than 1 was extracted.
The 228 valid questionnaires from the second survey were used for CFA, which evaluated the fit index of the model and analyzed the converged validity and discriminant validity test. Therefore, after the reliability test of 228 questionnaires, the above analysis should be carried out, respectively. The goodness-of-fit criteria of the model include absolute fit, incremental fit, and parsimonious fit [77]. The indices of absolute fit in the study covered normalized chi-square (X2/df), goodness-of-fit index (GFI), adjusted goodness-of-fit index (AGFI), and root mean square error of approximation (RMSEA). The incremental fit was evaluated by using Tucker-Lewis index (TLI), comparative fit index (CFI), and incremental index of fit (IFI), while the parsimonious fit was by parsimonious comparative fit index (PCFI), parsimonious normed fit index (PNFI), and parsimonious goodness-of-fit index (PGFI). The judgment indicators of converged validity involved three categories: factor loading, composite reliability, and average variance extracted (AVE) standardized by latent variables [78]. The criterion for discriminant validity was whether the AVE value of the latent variable was greater than the square of the correlation coefficient of each dimension [79].
After CFA, it was necessary to determine whether the internal structure of the model is reasonable by testing the covariance and covariance significance of potential variables. The test indicators included non-standardized estimate (Estimate), standard error of estimate (S.E.), critical ratio (C.R.), significant probability values (P), and standardized estimate (Estimate (std)). According to the p-value and modification index (M.I.), the initial model was corrected to obtain the final model and thus to determine the key factors and influencing paths.

4. Results

4.1. Descriptive Statistics

The statistical analysis results of respondents were shown in Table 2. The respondents in this survey were relatively young, with 62.3% under the age of 30. More designers were engaged in architectural design, accounting for 29.4% of the total. And 88.6% of the respondents had an undergraduate or higher degree. Also, 47.8% of them were middle or senior engineers, and 57% of them had been using BIM for over three years. It can be seen that the respondents had the knowledge of BIM-based collaborative design to some extent.

4.2. Exploratory Factor Analysis

4.2.1. Reliability Analysis

In the reliability analysis, the Cronbach’s alpha coefficient of each latent variable was all greater than 0.7. Furthermore, the coefficient of the total variables was above 0.9, indicating that the collected data had high reliability [80].

4.2.2. Validity Analysis

In the validity test, the KMO value of the overall samples was 0.785, and the significance probability of Sig. value was 0.000, indicating that the sample was a non-integral matrix. Therefore, data indicators were suitable for factor analysis.

4.2.3. Factor Analysis

A total of 13 factors were obtained from the preliminary results of factor analysis. The measurement items “CTM01, CTM08, TML01, TML02, CWE04, CADT06” were deleted because their factor loads were lower than 0.6, which was a stricter standard than those in prior studies [81], considering the distribution characteristics of factor load in this study. The factors with less than three measurement variables were further deleted. After these adjustments, a total of nine factors with eigenvalues greater than 1 were finally extracted, and the total variance explained was 69.617%, which was more than 60%. This showed that nine factors were sufficient to explain most of the variances. The result of “Human-information system interaction” was divided into two factors. The factors including “HISI01, HISI02, HISI03, HISI04” were named as “software-task-person matching”, which referred to task-centric, including whether the design task matched the software function and whether designer’s abilities matched the design task. The factors including “HISI05, HISI06, HISI07” were named as “software-person adaptation”, which represented the process of operating software based on the designers’ learning ability and was the basis of the human-information system interaction process. Besides, the factor extracted from the characteristic of team member was denominated as “collaborators’ learning ability”. The factor extracted from the team management level was named “team cooperation atmosphere”. The factor extracted from the practicality of information system was denominated as “BIM-based software function”. The remaining concepts had not changed.
The influencing factors of each variable had been extracted through factor analysis, and the research hypotheses were adjusted as follows:
H1. The collaborators’ learning ability has a positive impact on human interaction.
H2. The collaborators’ learning ability has a positive impact on the human-information system interaction.
H3. The characteristics and arrangement of design tasks have a negative impact on human interaction.
H4. The characteristics and arrangement of design tasks have a negative impact on the human-information system interaction.
H5. BIM-based software function has a positive impact on the human-information system interaction.
H6. The team cooperation atmosphere has a positive impact on human interaction.
H7. The team cooperation atmosphere has a positive impact on the human-information system interaction.
H8. The comfort of the working environment has a positive impact on human interaction.
H9. The comfort of the working environment has a positive impact onthe human-information system interaction.
H10. Human interaction has a positive impact on teamwork efficiency.
H11. The human-information system interaction has a positive impact on human interaction.
H12. The human-information system interaction has a positive impact on teamwork efficiency.
Since the factors of “software-person adaptation” and “software-task-person matching” were extracted from “human-information system interaction”, this study assumed that (1) “software-person adaptation” affected “software-task-person matching”; (2) the design task impacted “software-task-person matching” and didn’t affect “software-person adaptation”; and (3) the comfort of working environment influenced “software-person adaptation” rather than “software-task-person matching”. According to the factorial interactions above, an initial hypothetical model was established, as shown in Figure 3.

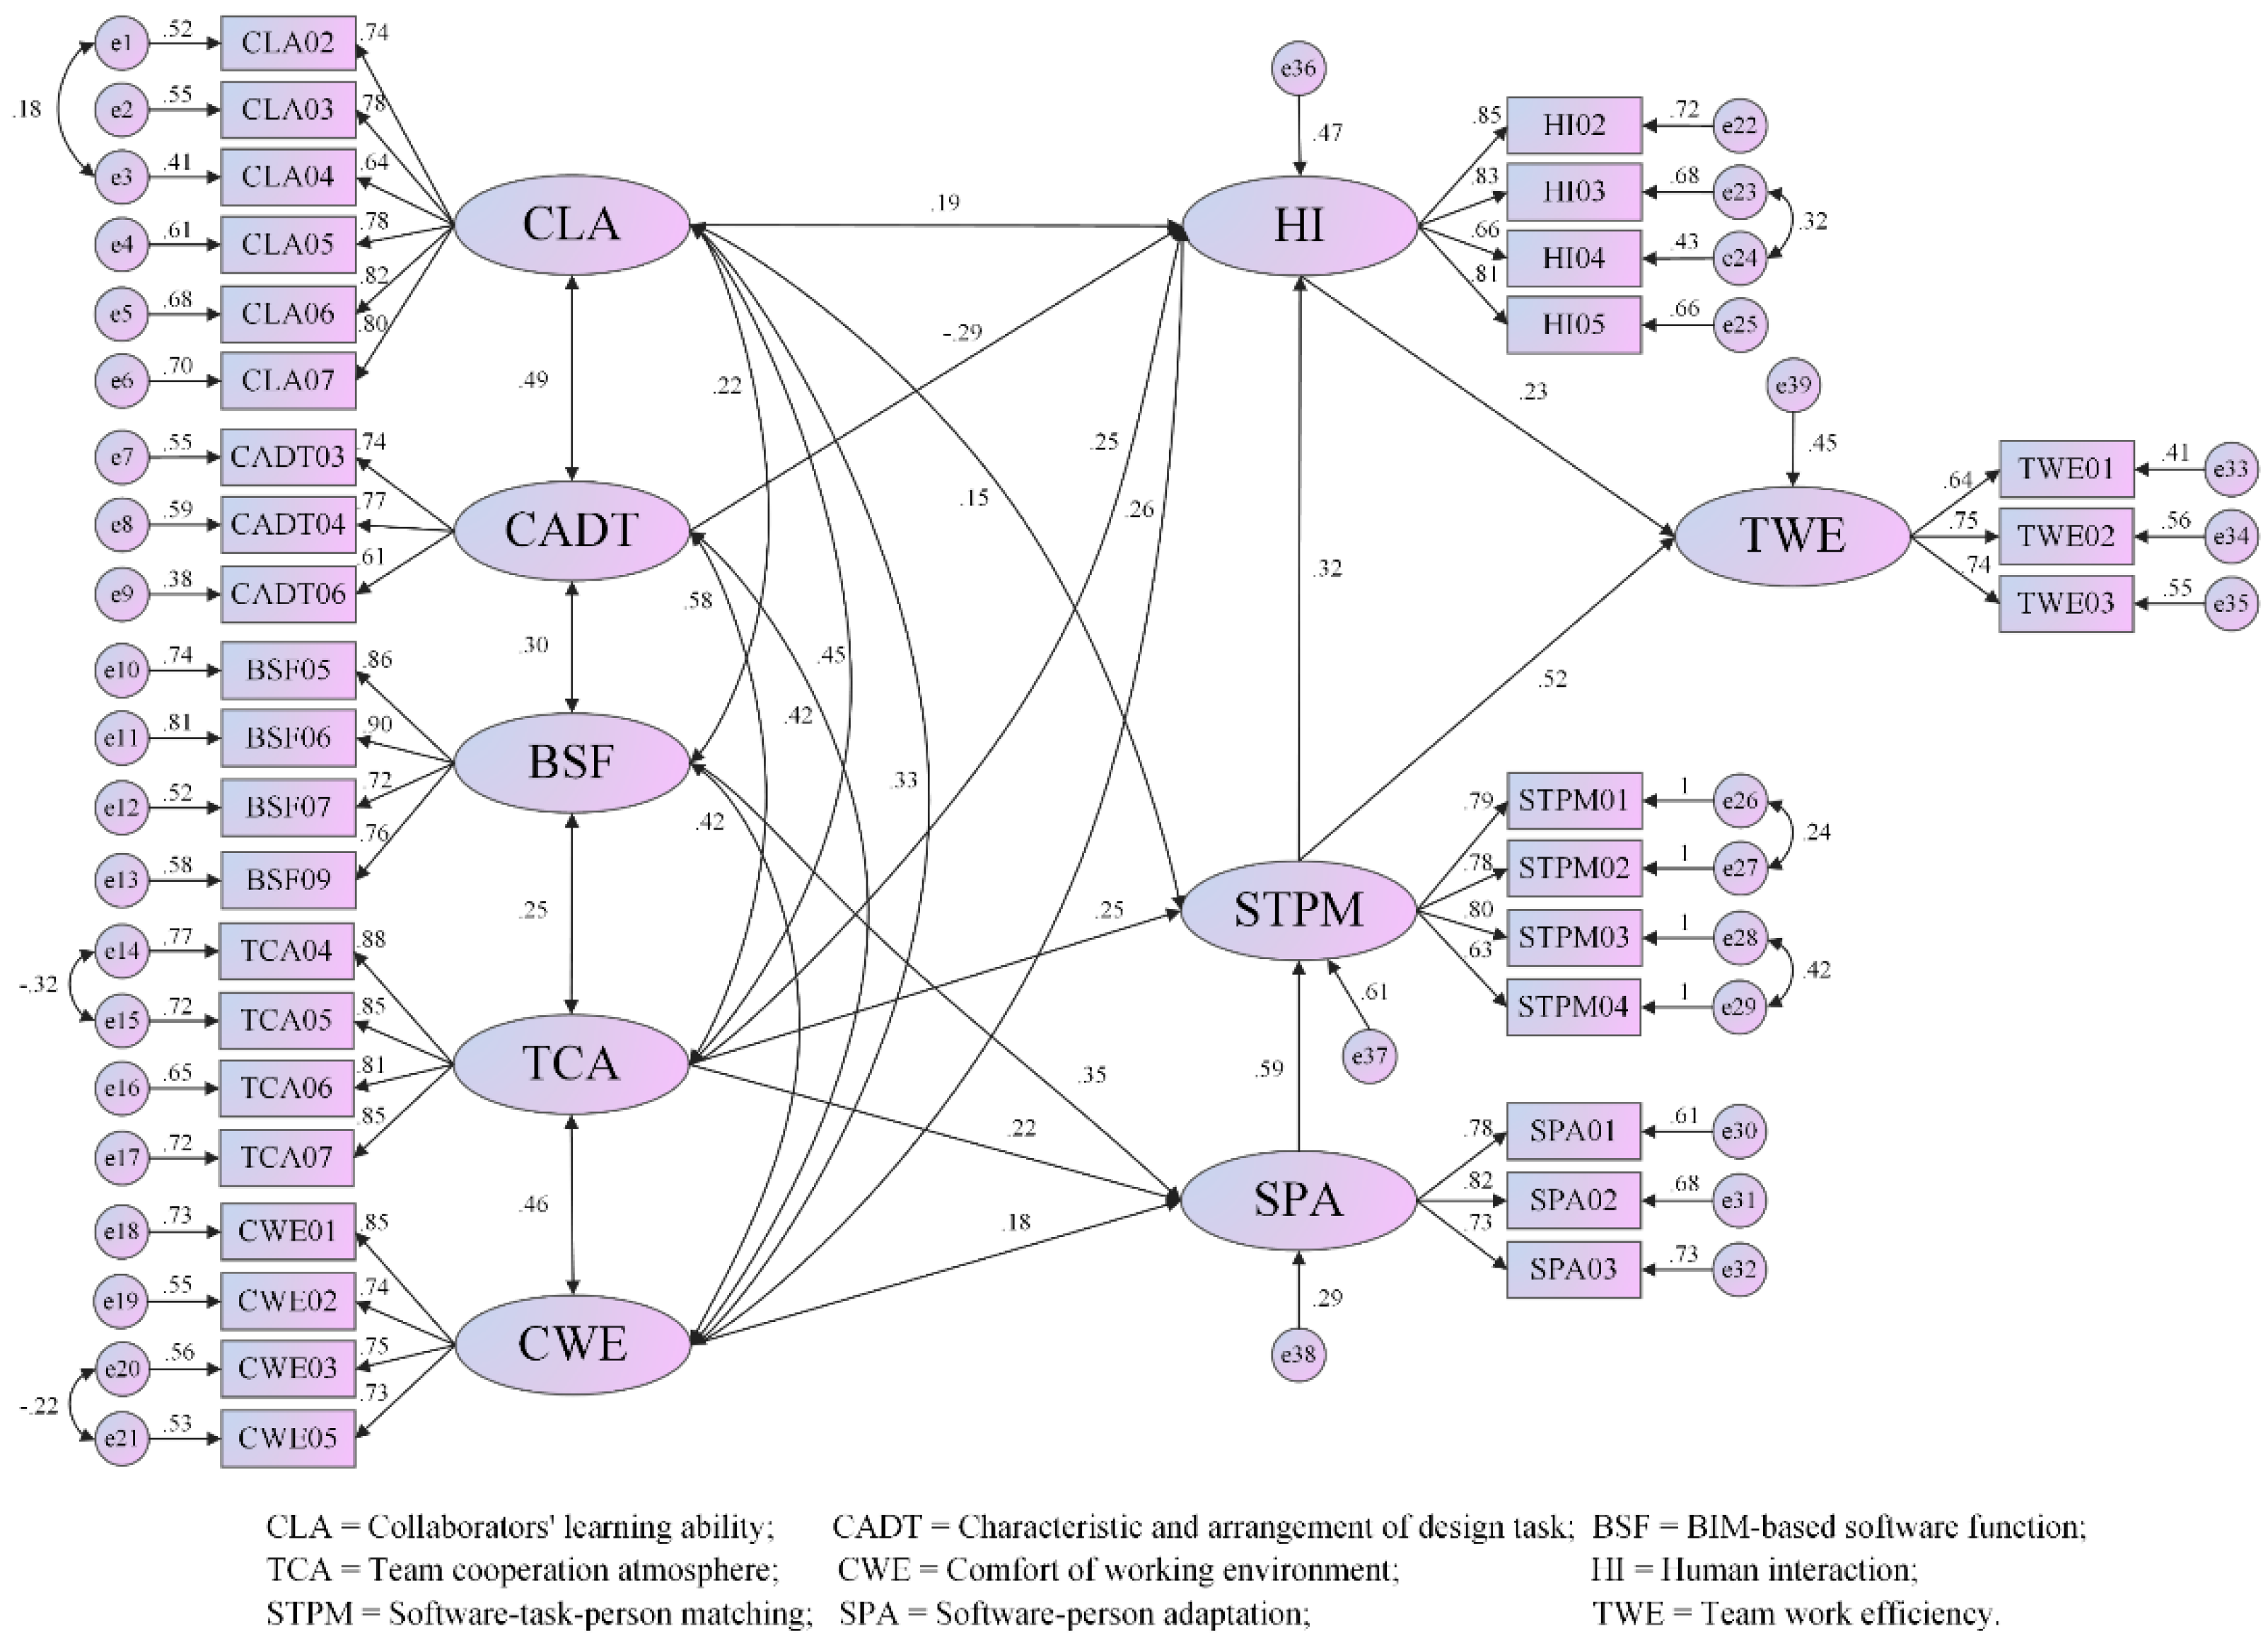
4.3. Confirmatory Factor Analysis

4.3.1. Reliability Analysis

The Cronbach’s alpha coefficients of each latent variable and the whole scale were calculated using SPSS Statistics 22. The Cronbach’s alpha of each latent variable was higher than 0.7, and this value of the whole scale was greater than 0.9, indicating that 228 samples had excellent reliability after EFA.

4.3.2. Validity Analysis

AMOS Statistics 24.0 (International Business Machines Corporation, Armonk, NY, USA) was used to verify the fit index of the model. The results showed that, except that AGFI was slightly lower than the reference standard, other indicators were within the acceptable range. The specific results of goodness-of-fit indices were indicated in Table 3.
Convergent Validity. The measurement error, combination reliability, and AVE were calculated by Excel. The convergent validity table of CFA was obtained, as shown in Table 4. It can be seen that all factor loads and AVE values exceeded 0.5, while the combination reliability of all latent variables was more than 0.7. The results indicated that the items of the same construct had strong convergent validity [82].
Discriminant Validity. The results of AMOS Statistics 24.0 were collated to obtain the discriminant validity of CFA, as shown in Table 5.
The analysis results showed that the AVE value of each latent variable in the diagonal was higher than the square of the correlation coefficient value between each latent variable in the column, indicating that all constructs had adequate discriminant validity. From the above, the model evaluation showed high reliability and validity of the constructs and items.

4.4. Multiple Regression Analysis

The multiple regression analysis of the initial model was carried out using AMOS Statistics 24.0. The test results were obtained, as shown in Table 6. Among them, the composite reliability (C.R.) of the four paths (CLA → SPA, CLA → STPM, CADT → STPM, BSF → STPM) was lower than 1.96, and the p-value was higher than 0.05, so the initial model needed to be corrected [72].
The model correction involved the following two measures. According to the p-value, the least significant path was deleted [83]. Based on the modification index (M.I.) value, paths were increased, or observed variables of same latent variable were set to be correlated with practical significance [84]. In this study, deleting paths and setting the correlations of observed variables with same latent variable were used to modify the model without increasing paths. The modification process conformed to the theoretical hypothesis.
According to Table 6, it can be seen that there were four paths in the M1 that needed to be modified. Firstly, the path “CLA → SPA” with the highest p-value was deleted. After similar procedures, the paths “CADT → STPM” and “BSF → STPM” were following deleted. Finally, the correction index M.I. of each path should be considered for model modification [85]. Therefore, combined with the practical significance, the model was deeply modified according to the largest MI to improve the correlation [86]. The new correlations were constructed successively as follows: “e42<-->e43” (MI = 27.943), “e40<-->e41” (MI = 11.609), “e28<-->e29” (MI = 9.253), “e31<-->e33” (MI = 5.395), “e51<-->e52” (MI = 4.613), “e46<-->e47” (MI = 4.188). The final model with a high degree of fitting was obtained at last, as shown in Figure 4. The analysis results of the final model were shown in Table 7 and Table 8. From Table 7, the goodness-of-fit of the final model was very well. Table 8 showed the regression weights, and the significance test results of each path.

4.5. Result of Hypothesis Testing

Although “Human-information system interaction” was extracted as the two factors of “software-person adaptation” and “software-task-person matching”, the two were closely related. Therefore, when analyzing the research hypothesis, as long as an influencing factor had a positive impact on any of the two factors, it was judged that the influencing factor had a positive impact on “Human-information system interaction”. According to this standard, the verification results of the hypothesis were obtained.
The results indicated that all hypotheses had been verified except Hypothesis 4 (H4). At present, the projects designed by design institutes through BIM-based collaborative design are mainly large-scale public construction projects characterized by the large volume and relatively complex design. This leads to the need for BIM team members to increase communication frequency in order to achieve design goals significantly. Therefore, the characteristics of design task affect teamwork efficiency through human interaction. Meanwhile, according to interviews, designers’ abilities and software functions can basically meet the design requirements of such projects, so the negative impact of the characteristics of design task on human-information system interaction is not significant.

4.6. Analysis of Main Paths

According to the results of AMOS Statistics 24, the standardized direct effects and standardized indirect effects of each path were ranked to obtain the total effect of each path and the factors that influenced teamwork efficiency, as shown in Table 9.
It can be seen from Table 9 that, according to the size of path effect value, the top three paths affecting team work efficiency were listed as follows: (1) team cooperation atmosphere influenced team work efficiency through individual work process (TCA → STPM → TWE); (2) BIM-based software function influences team work efficiency through individual work process (BSF → SPA → STPM → TWE); and (3) collaborators’ learning ability influenced team work efficiency through individual work process (CLA → STPM → TWE). “Software-person adaptation” and “software-task-person matching” belonged to the scope of the individual work process, so the three paths all affected teamwork efficiency through impacting the individual work process. Although other paths affected teamwork efficiency through the human interaction process, this wasn’t the main one because the efficiency of teamwork is determined by the efficiency of designers who do not understand BIM.

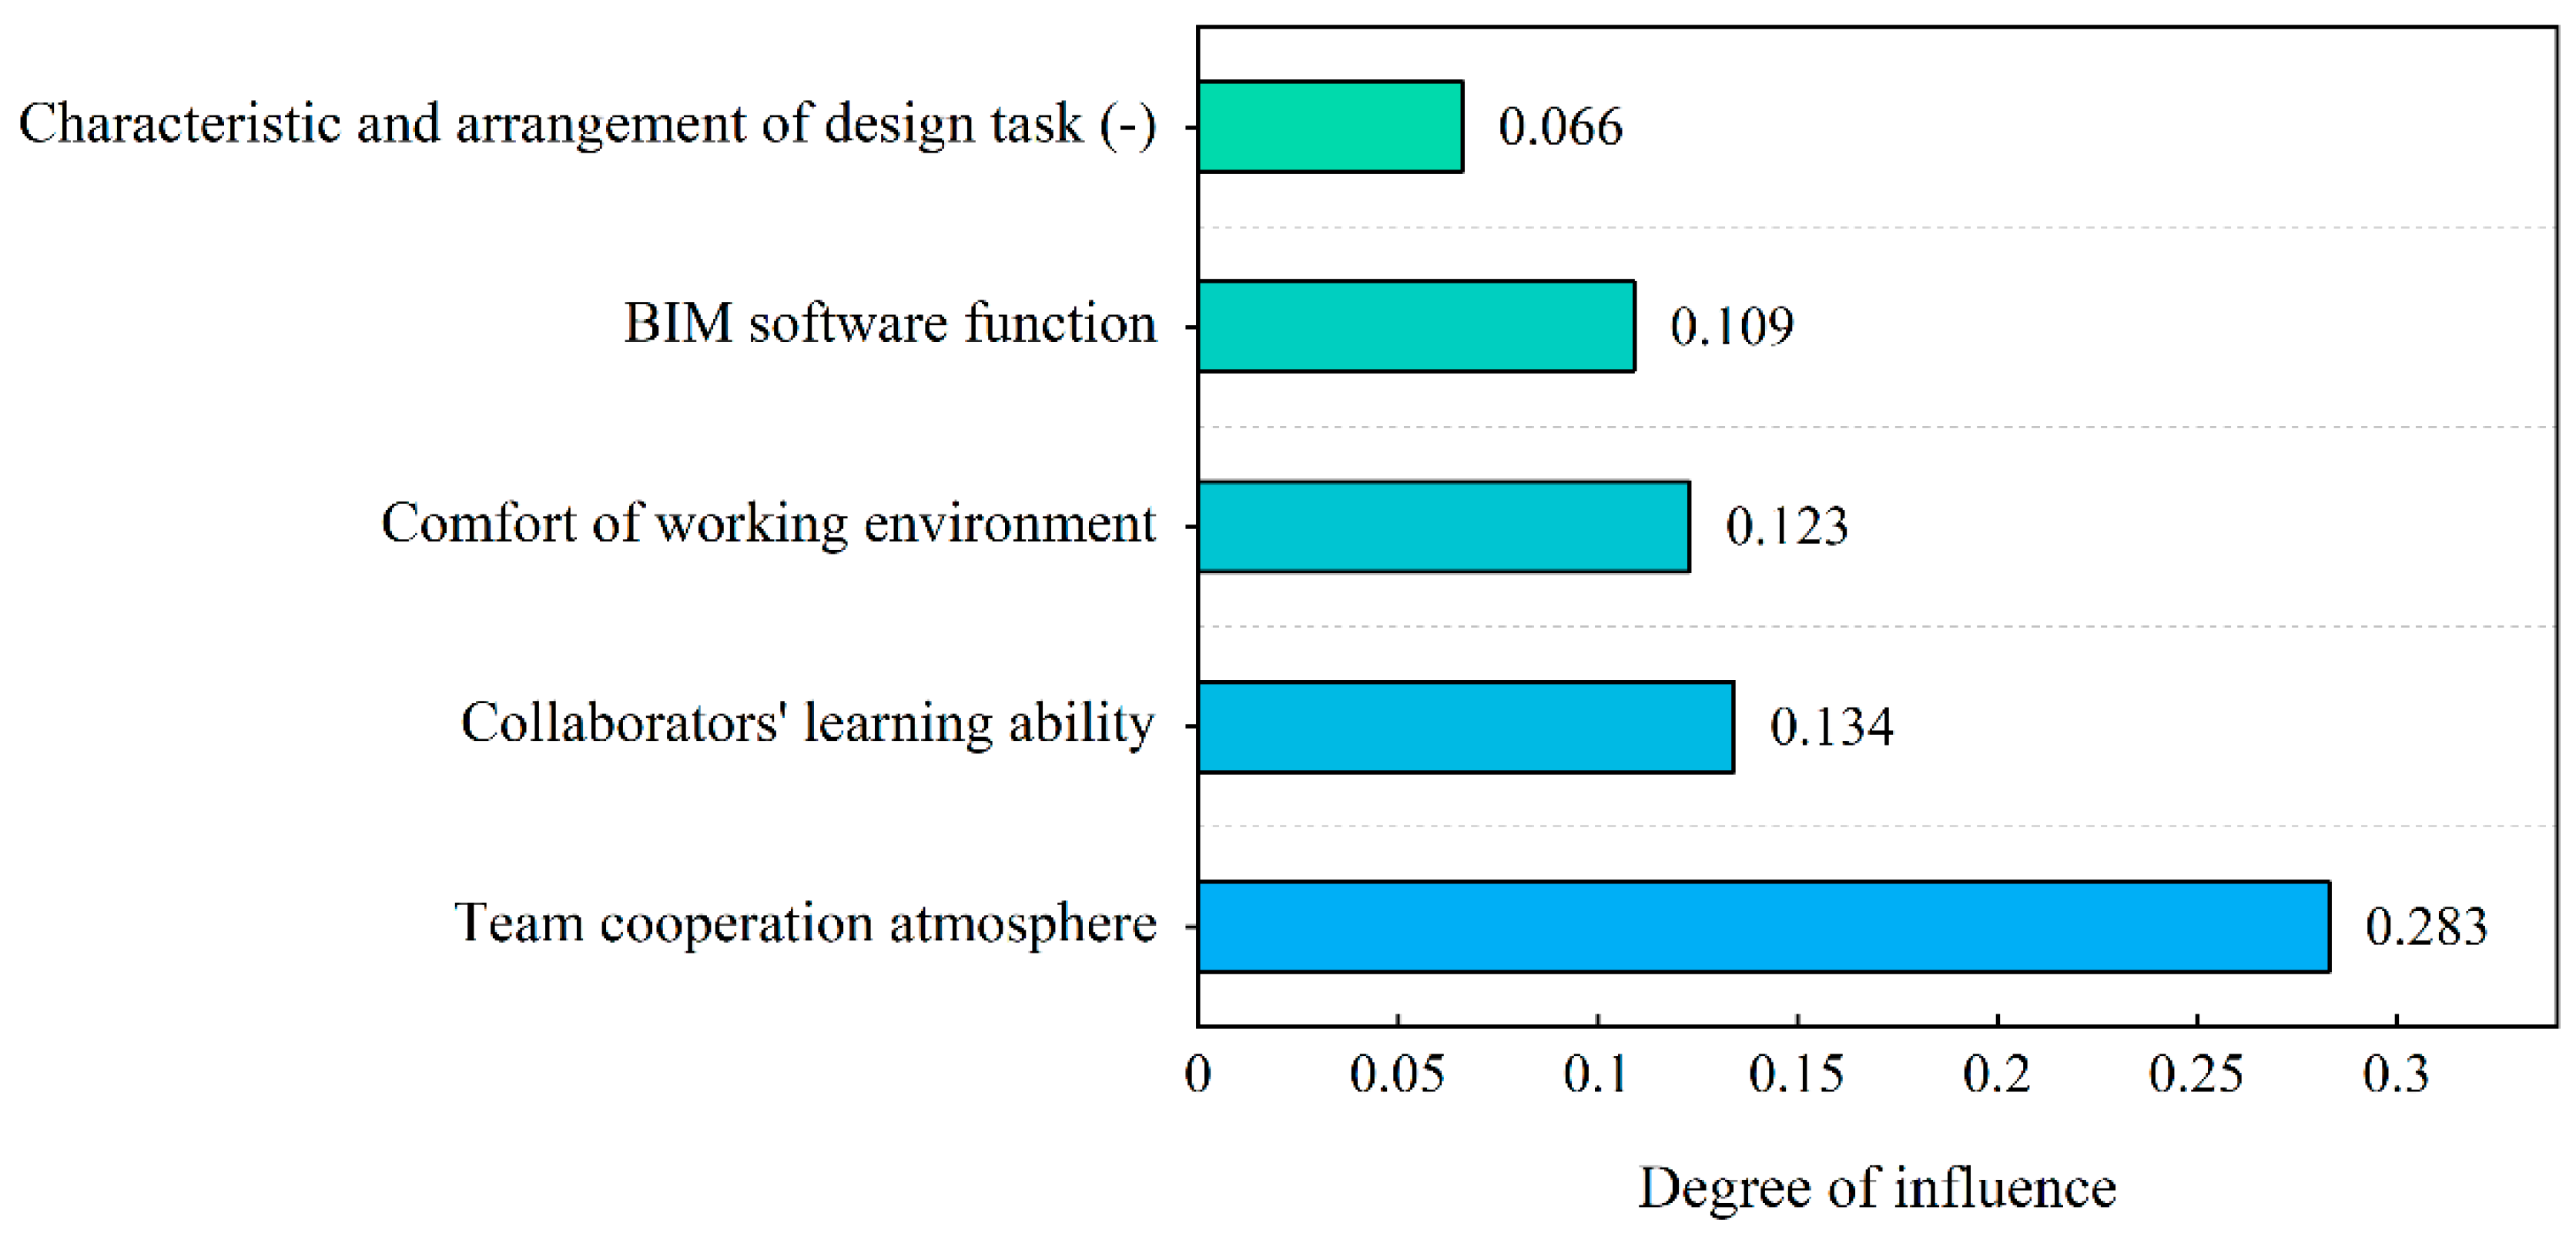
4.7. Analysis of Key Factors

As shown in Figure 5, the total effect of team cooperation atmosphere on teamwork efficiency was the largest, followed by collaborators’ learning ability, comfort of working environment, BIM-based software functions, while the characteristic and arrangement of design task had the least impact.
Teamwork atmosphere had the most significant impact on teamwork efficiency, indicating that it was the most critical factor of the model. Therefore, design institutes that adopt BIM-based collaborative design should focus on improving the atmosphere of teamwork. In BIM-based collaborative design, team members need to change traditional design thinking, actively share experience, and learn from each other. At the same time, the team leader should also have a high professional ability to promote the team to master BIM technology and related professional knowledge. Therefore, on the one hand, the design unit needs to take specific measures to improve the coverage of professional knowledge of BIM team members and train team leaders with strong professional abilities. On the other hand, it should also pay attention to the information flow and the interdependence among designers.

5. Discussion

Based on the above results of the research, this study invited four experts related to BIM-based collaborative design to conduct interviews to discuss the critical factors.

5.1. Impact of Collaborators’ Learning Ability

The combination of H1 and H10 proved that the factor of collaborators’ learning ability positively affects teamwork efficiency through the human interaction process. The combination of H2, H10, and H11 proved that this factor could indirectly affect human interaction through individual work process, thus having a positive impact on teamwork efficiency. The combination of H2 and H12 proved that the factor can also positively affect teamwork efficiency directly through the individual work process. This finding is consistent with the research that team diversity affects team performance through some mediating variables [87], which refer to the two processes in this study. The teamwork efficiency not only is related to the individual ability of members, but also needs the interaction between members to achieve the ability balance of entire team [88]. For example, a team member’s deficiency in a skill can be made up by another member with the skill [89].
The total effect value of collaborators’ learning ability is 0.134, ranking second, indicating that it is an important factor affecting teamwork efficiency. The BIM-based collaborative design is a new technology compared with the traditional, which puts forward higher requirements on the designer’s personal cognitive ability. At present, designers’ professional knowledge of engaged in BIM-based collaborative design in China is relatively single, while the knowledge beyond their major is seriously deficient. Since the comprehensive ability of BIM members cannot be significantly improved in a short time, this study suggests that design units can adopt the mentor system, which enables members with more experience to lead new designers in BIM projects. In addition, BIM consultants are regularly invited to train members to improve the overall ability of individuals and the design team, thus improving the efficiency of the team.

5.2. Impact of Characteristic and Arrangement of Design Task

The combination of H3 and H10 proved that the characteristic and arrangement of design task have a negative impact on team work efficiency through the human interaction process, which agrees with the connection between task conflict and relationship conflict pointed out by Jimmieson et al. [26]. In BIM-based collaborative design, vague or unreasonable task allocation among members often exists, which leads to the difficulty of various professional cooperation and task implementation. Papadonikolaki et al. [90] indicated that establishing BIM norms can effectively improve team collaboration modes and communication mechanisms. Therefore, this study proposes that design agencies should attach importance to the compilation of collaborative work standards for BIM projects, involving collaborative work flows that can be adopted for different project types, collaborative design specifications, and resolution mechanisms of design conflicts.
The failure of H4 indicated that the negative impact of the characteristic and arrangement of design task on the individual work process is not significant. This conclusion is not surprising. In fact, the argument that the difficulty and complexity of the design task have a negative impact on the working process of individuals may only be applicable to small and medium-sized design organizations [29]. Since design habits and management methods of this organizations are difficult to adapt to complex projects, they often apply BIM technology in the form of outsourcing. It was found in expert interviews that at present, large design institutes have their own BIM research and development teams, whose designers’ abilities and software functions can cope with complicated projects and continuously changing design requirements.

5.3. Impact of BIM Software Function

The combination of H5, H10, and H11 proved that the factor of BIM-based software functions could indirectly affect human interaction through individual work process, thus exerting a positive impact on the teamwork efficiency. The combination of H5 and H12 proved that this factor also positively affects teamwork efficiency directly through the individual work process. The use of BIM software encourages information sharing among project participants and identifies design errors through visualization to improve team productivity [91]. By providing the necessary BIM functions to manage design information in an integrated manner, design quality and productivity can be improved [4].
However, the function of BIM software requires higher adaptability of designers and software. At present, the adaptability is not strong enough. From the perspective of design institutes, the functions of BIM software should meet the needs of their own business as far as possible, while for software developers, BIM software should meet the needs of most design institutes. Therefore, BIM-based commercial design tools used in practice will inevitably cause some functional defects to design institutes [4]. The design institute should select the appropriate BIM software according to its own business needs and cooperate with the software suppliers to improve the software functions through secondary development.

5.4. Impact of Team Cooperation Atmosphere

Similarly, the combination of H6, H7, H10, H11, and H12 proved that team cooperation atmosphere positively influences teamwork efficiency through both the human interaction process and individual working process. It is the most significant factor that affects teamwork efficiency through the individual work process, and its impact on teamwork efficiency through the team interaction process is second only to the comfort of working environment and the characteristic and arrangement of design task. Its total effect value is 0.283, ranking the first, which is the most critical factor affecting teamwork efficiency. These findings also confirmed the views of other scholars: team atmosphere is considered to be an important positive factor affecting team performance [34,92].
The four observed variables of team cooperation atmosphere were the interpersonal relationship, cooperative attitude, willingness to share experience, and leadership expertise. In the BIM-based collaborative design, friendly interpersonal relationships among members can effectively enhance their willingness to share experience, improve designer’s mastery of BIM technology, and promote the interaction process of the human-information system. In addition, enhancing members’ willingness to share experience can also effectively promote the circulation of design knowledge in various professions of the team, which enables them to focus on not only their own professional design knowledge but also others, thus effectively promoting the team interaction process. However, Caniëls et al. [34] pointed out that some members of BIM-based collaborative design do not pay attention to cooperation with others. Although BIM-based collaborative design is conducted in the early stage of construction projects, designers still need to change traditional design thinking, actively share experience, and learn from each other. This study advises design organizations to establish team incentive mechanisms, such as team building and BIM experience sharing rewarding activities. Meanwhile, the team leader also has an important influence on the teamwork atmosphere. The team leader can reasonably assign tasks to team members to reduce design conflicts and develop effective solutions when problems occur. This is consistent with the view that team leadership behavior has a significant impact on team performance [93].

5.5. Impact of Comfort of Working Environment

The combination of H8, H9, H10, H11, and H12 proved that the comfort of working environment positively influences teamwork efficiency through both the human interaction process and individual working process. Its total effect value is 0.123, second only to the team cooperation atmosphere and the collaborator’s learning ability. Clements-Croome [40] and Wargocki [94] found that the ideal working environment results in lower absenteeism rates and higher employee retention, leading to higher productivity.
The comfort of working environment includes air quality, light, noise, temperature, and personal working area. According to interviews with experts, the working environment of large design units in Shenzhen is generally well, while that of small design units is relatively poor. This study calculated the average values of the observed variables of the working environment, among which air, light, noise, temperature, and personal working area were 3.6, 4.0, 3.7, 3.8, and 3.9, respectively. It can be seen that in the working environment of the design institute, in addition to relatively good lighting conditions, the other four aspects need to be improved. With regard to air, the design unit may take the option of installing an advanced HAVC system or configuring an air purifier depending on the economy. As for noise, the design unit should try to arrange closed meeting rooms for designers and control the sound insulation. In terms of temperature and individual working area, the design units are advised to conduct a demand survey on team members to make reasonable allocations.

6. Conclusions

This study identified critical factors affecting teamwork efficiency in BIM-based collaborative design in China and interpreted the related influence paths. It initially established a hypothetical model based on the I-P-O theory. Through the detailed literature review and semi-structured interviews, possible factors were further identified. The questionnaire surveys were conducted in China’s building design units to collect the empirical data, and structural equation modeling was then employed in the analysis. Results showed that team cooperation atmosphere has the most significant impact on teamwork efficiency in BIM-based collaborative design, followed by collaborators’ learning ability, comfort of working environment, and BIM software function, while the effect of the characteristic and arrangement of design task is minimal. It was found that the characteristic and arrangement of design task exerts a negative impact on the teamwork efficiency in BIM-based collaborative design only depending on the human interaction process. Besides, team cooperation atmosphere, collaborators’ learning ability, comfort of working environment, and BIM software function positively affect the teamwork efficiency through both the personal work process and the human interaction process.
This study has several theoretical and managerial implications for efficient collaborative design. Firstly, this paper offers a novel theoretical perspective for further in-depth studies in BIM implementation in China’s construction industry by adopting the I-P-O theory in the research process. Secondly, the findings help design participants to understand the interrelations between diverse influencing factors and teamwork efficiency in BIM-based collaborative design and will help them prioritize critical factors in practical management. Based on this, design units can develop sensible strategies to enhance design efficiency and resource utilization efficiency in order to achieve sustainable development of society. Thirdly, this study provides useful references for policymakers to develop appropriate incentives and standards, thus promoting BIM application in the design phase.
Despite these implications, limitations still exist in this study. Firstly, the influencing factors involved in this study may not be exhaustive or continue to hold true as technology develops and policies change. More effort would be devoted to updating these factors in future investigations. Secondly, since the research was performed in the Chinese context, there may be geographical limitations in identifying critical factors affecting BIM-based collaboration efficiency. Further work would expand the research scope to verify the universality of the research findings.

Supplementary Materials

The following are available online at https://www.mdpi.com/article/10.3390/buildings11100486/s1, Supplementray File: Questionnaire Survey.

Author Contributions

Conceptualization, J.W. and F.Z.; methodology, J.W.; software, Z.H.; validation, Z.Y.; analysis of the literature, Z.Y.; investigation, F.Z.; data curation, F.Z.; writing—original draft preparation, Z.Y.; writing—review and editing, Z.Y.; visualization, Z.H.; supervision and quality control, Z.W. All authors have read and agreed to the published version of the manuscript.

Funding

This research was funded by the National Natural Science Foundation of China (grant number 71772125).

Institutional Review Board Statement

Not applicable.

Informed Consent Statement

Informed consent was obtained from all subjects involved in the study.

Data Availability Statement

The data presented in this study are available on request from the corresponding author.

Acknowledgments

The authors are grateful for comments and recommendations from the editor and anonymous reviewers.

Conflicts of Interest

The authors declare no conflict of interest.

References

  1. Bogenstätter, U. Prediction and optimization of life-cycle costs in early design. Build. Res. Inf. 2000, 28, 376–386. [Google Scholar] [CrossRef]
  2. Tauriainen, M.; Marttinen, P.; Dave, B.; Koskela, L. The effects of BIM and lean construction on design management practices. Procedia Eng. 2016, 164, 567–574. [Google Scholar] [CrossRef]
  3. Zheng, Y.; Shen, H.; Sun, C. Collaborative design: Improving efficiency by concurrent execution of Boolean tasks. Expert Syst. Appl. 2011, 38, 1089–1098. [Google Scholar] [CrossRef]
  4. Oh, M.; Lee, J.; Hong, S.W.; Jeong, Y. Integrated system for BIM-based collaborative design. Autom. Constr. 2015, 58, 196–206. [Google Scholar] [CrossRef]
  5. Panteli, C.; Kylili, A.; Fokaides, P.A. Building information modelling applications in smart buildings: From design to commissioning and beyond A critical review. J. Clean. Prod. 2020, 265, 121766. [Google Scholar] [CrossRef]
  6. NIBS. United States National Building Information Modeling Standard Version 1—Part 1: Overview, Principles, and Methodologies; NIBS: Washington, DC, USA, 2007. [Google Scholar]
  7. Lewis, A.M.; Valdes-Vasquez, R.; Clevenger, C. Understanding the perceived value of using BIM for energy simulation. J. Green Build. 2019, 14, 79–92. [Google Scholar] [CrossRef]
  8. Charef, R.; Alaka, H.; Emmitt, S. Beyond the third dimension of BIM: A systematic review of literature and assessment of professional views. J. Build. Eng. 2018, 19, 242–257. [Google Scholar] [CrossRef]
  9. Khoshdelnezamiha, G.; Liew, S.C.; Bong, V.N.S.; Ong, D.E.L. Evaluation of BIM application for water efficiency assessment. J. Green Build. 2020, 15, 91–116. [Google Scholar] [CrossRef]
  10. Bui, N.; Merschbrock, C.; Munkvold, B.E. A review of Building Information Modelling for construction in developing countries. Procedia Eng. 2016, 164, 487–494. [Google Scholar] [CrossRef]
  11. Fei, X.; Xu, J.; Shen, H. Shanghai Building Information Modeling Technology Application and Development Report; Shanghai Municipal Commission of Housing Urban-Rural Development and Management: Shanghai, China, 2017. [Google Scholar]
  12. Grilo, A.; Jardim-Goncalves, R. Value proposition on interoperability of BIM and collaborative working environments. Autom. Constr. 2010, 19, 522–530. [Google Scholar] [CrossRef]
  13. Liu, Y.; van Nederveen, S.; Hertogh, M. Understanding effects of BIM on collaborative design and construction: An empirical study in China. Int. J. Proj. Manag. 2017, 35, 686–698. [Google Scholar] [CrossRef]
  14. Puck, J.; Pregernig, U. The effect of task conflict and cooperation on performance of teams: Are the results similar for different task types? Eur. Manag. J. 2014, 32, 870–878. [Google Scholar] [CrossRef]
  15. Mathieu, J.; Maynard, M.T.; Rapp, T.; Gilson, L. Team effectiveness 1997-2007: A review of recent advancements and a glimpse into the future. J. Manag. 2008, 34, 410–476. [Google Scholar] [CrossRef] [Green Version]
  16. Arman, G.; Adair, C.K. Cross-cultural differences in perception of time: Implications for multinational teams. Eur. J. Work Organ. Psychol. 2012, 21, 657–680. [Google Scholar] [CrossRef]
  17. Urbini, F.; Callea, A.; Chirumbolo, A.; Talamo, A.; Ingusci, E.; Ciavolino, E. Team performance in the Italian NHS: The role of reflexivity. J. Health Organ. Manag. 2018, 32, 190–205. [Google Scholar] [CrossRef] [PubMed]
  18. Li, J.; Roe, R.A. Introducing an intrateam longitudinal approach to the study of team process dynamics. Eur. J. Work Organ. Psychol. 2012, 21, 718–748. [Google Scholar] [CrossRef]
  19. Nezlek, J.B.; Smith, C.V. Social identity in daily social interaction. Self Identity 2005, 4, 243–261. [Google Scholar] [CrossRef]
  20. Liang, T.-P.; Liu, C.-C.; Lin, T.-M.; Lin, B. Effect of team diversity on software project performance. Ind. Manag. Data Syst. 2007, 107, 636–653. [Google Scholar] [CrossRef]
  21. Gill, C.; Metz, I.; Tekleab, A.G.; Williamson, I.O. The combined role of conscientiousness, social networks, and gender diversity in explaining individual performance in self-managed teams. J. Bus. Res. 2020, 106, 250–260. [Google Scholar] [CrossRef]
  22. Landis, B. Personality and social networks in organizations: A review and future directions. J. Organ. Behav. 2016, 37, S107–S121. [Google Scholar] [CrossRef]
  23. Sparrowe, R.T.; Liden, R.C.; Wayne, S.J.; Kraimer, M.L. Social networks and the performance of individuals and groups. Acad. Manag. J. 2001, 44, 316–325. [Google Scholar] [CrossRef]
  24. LePine, J.A.; Buckman, B.R.; Crawford, E.R.; Methot, J.R. A review of research on personality in teams: Accounting for pathways spanning levels of theory and analysis. Hum. Resour. Manag. Rev. 2011, 21, 311–330. [Google Scholar] [CrossRef]
  25. Yan, T.; Dooley, K.J. Communication intensity, goal congruence, and uncertainty in buyer–supplier new product development. J. Oper. Manag. 2013, 31, 523–542. [Google Scholar] [CrossRef]
  26. Jimmieson, N.L.; Tucker, M.K.; Campbell, J.L. Task conflict leads to relationship conflict when employees are low in trait self-control: Implications for employee strain. Pers. Individ. Dif. 2017, 113, 209–218. [Google Scholar] [CrossRef]
  27. Curseu, P.L.; Schruijer, S.G.L. Does conflict shatter trust or does trust obliterate conflict? Revisiting the relationships between team diversity, conflict, and trust. Group Dyn. Theory Res. Pract. 2010, 14, 66–79. [Google Scholar] [CrossRef] [Green Version]
  28. Choi, O.-K.; Cho, E. The mechanism of trust affecting collaboration in virtual teams and the moderating roles of the culture of autonomy and task complexity. Comput. Hum. Behav. 2019, 91, 305–315. [Google Scholar] [CrossRef]
  29. O’Brien, H.L.; Arguello, J.; Capra, R. An empirical study of interest, task complexity, and search behaviour on user engagement. Inf. Process. Manag. 2020, 57, 102226. [Google Scholar] [CrossRef]
  30. Rosnah, I.; Umi Kalsom, Y.; Tan Shiang, Y. A framework for classifying misfits between enterprise resourse planning (ERP) systems and business strategies. Asian Acad. Manag. J. 2011, 16, 53–75. [Google Scholar]
  31. Sudhakar, G.P.; Farooq, A.; Patnaik, S. Soft factors affecting the performance of software development teams. Team Perform. Manag. Int. J. 2011, 17, 187–205. [Google Scholar] [CrossRef]
  32. Neckermann, S.; Frey, B.S. And the winner is…? The motivating power of employee awards. J. Socio-Econ. 2013, 46, 66–77. [Google Scholar] [CrossRef]
  33. Meneghel, I.; Salanova, M.; Martinez, I.M. Feeling good makes us stronger: How team resilience mediates the effect of positive emotions on team performance. J. Happiness Stud. 2016, 17, 239–255. [Google Scholar] [CrossRef]
  34. Caniëls, M.C.J.; Chiocchio, F.; van Loon, N.P.A.A. Collaboration in project teams: The role of mastery and performance climates. Int. J. Proj. Manag. 2019, 37, 1–13. [Google Scholar] [CrossRef]
  35. Hann, M.; Bower, P.; Campbell, S.; Marshall, M.; Reeves, D. The association between culture, climate and quality of care in primary health care teams. Fam. Pract. 2007, 24, 323–329. [Google Scholar] [CrossRef] [PubMed]
  36. Kruchten, P. Analyzing Intercultural Factors Affecting Global Software Development—A Position Paper. In Proceedings of the 26th International Conference on Software Engineering “Third International Workshop on Global Software Development (GSD 2004)” W12S Workshop, Edinburgh, UK, 24 May 2004; pp. 59–62. [Google Scholar] [CrossRef] [Green Version]
  37. Hoch, J.E. Shared leadership, diversity, and information sharing in teams. J. Manag. Psychol. 2014, 29, 541–564. [Google Scholar] [CrossRef]
  38. Frontczak, M.; Schiavon, S.; Goins, J.; Arens, E.; Zhang, H.; Wargocki, P. Quantitative relationships between occupant satisfaction and satisfaction aspects of indoor environmental quality and building design. Indoor Air 2012, 22, 119–131. [Google Scholar] [CrossRef] [Green Version]
  39. Aigbavboa, C.; Thwala, W.D. Performance of a green building’s indoor environmental quality on building occupants in South Africa. J. Green Build. 2019, 14, 131–147. [Google Scholar] [CrossRef]
  40. Clements-Croome, D. Creative and productive workplaces: A review. Intell. Build. Int. 2015, 7, 164–183. [Google Scholar] [CrossRef]
  41. Reijula, J.; Gröhn, M.; Müller, K.; Reijula, K. Human well-being and flowing work in an intelligent work environment. Intell. Build. Int. 2011, 3, 223–237. [Google Scholar] [CrossRef]
  42. Johns, G. Reflections on the 2016 decade award: Incorporating context in organizational research. Acad. Manag. Rev. 2017, 42, 577–595. [Google Scholar] [CrossRef]
  43. Carlisle, J.; Bhanugopan, R.; D’Netto, B. Enhancing task performance through effective training: The mediating role of work environment and moderating effect of non-mandatory training. J. Bus. Res. 2019, 104, 340–349. [Google Scholar] [CrossRef]
  44. Genaidy, A.; Salem, S.; Karwowski, W.; Paez, O.; Tuncel, S. The work compatibility improvement framework: An integrated perspective of the human-at-work system. Ergonomics 2007, 50, 3–25. [Google Scholar] [CrossRef]
  45. Crick, J. Effective team communication. In Pract. 2014, 36, 96–98. [Google Scholar] [CrossRef]
  46. Cooke, N.J.; Gorman, J.C.; Myers, C.W.; Duran, J.L. Interactive team cognition. Cogn. Sci. 2013, 37, 255–285. [Google Scholar] [CrossRef]
  47. Schaffer, R.H.; Stearn, J.M. The rapid results package: Better performance/stronger managers. Bus. Horiz. 2015, 58, 687–695. [Google Scholar] [CrossRef]
  48. Li, K.; Tiwari, A.; Alcock, J.; Bermell-Garcia, P. Categorisation of visualisation methods to support the design of Human-Computer Interaction Systems. Appl. Ergon. 2016, 55, 85–107. [Google Scholar] [CrossRef] [PubMed] [Green Version]
  49. Li, H.; Huang, T.; Kong, C.W.; Guo, H.L.; Baldwin, A.; Chan, N.; Wong, J. Integrating design and construction through virtual prototyping. Autom. Constr. 2008, 17, 915–922. [Google Scholar] [CrossRef]
  50. Azhar, S. Building Information Modeling (BIM): Trends, benefits, risks, and challenges for the AEC industry. Leadersh. Manag. Eng. 2011, 11, 241–252. [Google Scholar] [CrossRef]
  51. Ding, L.; Zhou, Y.; Akinci, B. Building Information Modeling (BIM) application framework: The process of expanding from 3D to computable nD. Autom. Constr. 2014, 46, 82–93. [Google Scholar] [CrossRef]
  52. Choi, Y.G.; Kwon, J.; Kim, W. Effects of attitudes vs experience of workplace fun on employee behaviors. Int. J. Contemp. Hosp. Manag. 2013, 25, 410–427. [Google Scholar] [CrossRef]
  53. Halkos, G.; Bousinakis, D. The effect of stress and dissatisfaction on employees during crisis. Econ. Anal. Policy 2017, 55, 25–34. [Google Scholar] [CrossRef]
  54. Bakker, A.B. An evidence-based model of work engagement. Curr. Dir. Psychol. Sci. 2011, 20, 265–269. [Google Scholar] [CrossRef]
  55. Cai, W.; Song, W.; Zhao, S. An empirical study on the effects of creative personality and job autonomy on individual innovation performance of knowledge workers. Int. Bus. Manag. 2013, 6, 24–30. [Google Scholar] [CrossRef]
  56. Lu, C.-Q.; Wang, H.-J.; Lu, J.-J.; Du, D.-Y.; Bakker, A.B. Does work engagement increase person–job fit? The role of job crafting and job insecurity. J. Vocat. Behav. 2014, 84, 142–152. [Google Scholar] [CrossRef]
  57. Bosch-Sijtsema, P.M.; Ruohomäki, V.; Vartiainen, M. Knowledge work productivity in distributed teams. J. Knowl. Manag. 2009, 13, 533–546. [Google Scholar] [CrossRef]
  58. Chang, J.W.; Sy, T.; Choi, J.N. Team emotional intelligence and performance: Interactive dynamics between leaders and members. Small Group Res. 2012, 43, 75–104. [Google Scholar] [CrossRef]
  59. Kleingeld, A.; van Mierlo, H.; Arends, L. The effect of goal setting on group performance: A meta-analysis. J. Appl. Psychol. 2011, 96, 1289. [Google Scholar] [CrossRef] [PubMed]
  60. Hertel, G.; Geister, S.; Konradt, U. Managing virtual teams: A review of current empirical research. Hum. Resour. Manag. Rev. 2005, 15, 69–95. [Google Scholar] [CrossRef]
  61. Garbers, Y.; Konradt, U. The effect of financial incentives on performance: A quantitative review of individual and team-based financial incentives. J. Occup. Organ. Psychol. 2014, 87, 102–137. [Google Scholar] [CrossRef]
  62. O’Leary, M.B.; Mortensen, M.; Woolley, A.W. Multiple team membership: A theoretical model of its effects on productivity and learning for individuals and teams. Acad. Manag. Rev. 2011, 36, 461–478. [Google Scholar] [CrossRef] [Green Version]
  63. Meng, J.; Berger, B.K. The impact of organizational culture and leadership performance on PR professionals’ job satisfaction: Testing the joint mediating effects of engagement and trust. Public Relat. Rev. 2019, 45, 64–75. [Google Scholar] [CrossRef]
  64. Haemers, M.; Derammelaere, S.; Rosich, A.; Ionescu, C.M.; Stockman, K. Towards a generic optimal co-design of hardware architecture and control configuration for interacting subsystems. Mechatronics 2019, 63, 102275. [Google Scholar] [CrossRef]
  65. Chen, L.; Luo, H. A BIM-based construction quality management model and its applications. Autom. Constr. 2014, 46, 64–73. [Google Scholar] [CrossRef]
  66. Yang, J.-B.; Chou, H.-Y. Mixed approach to government BIM implementation policy: An empirical study of Taiwan. J. Build. Eng. 2018, 20, 337–343. [Google Scholar] [CrossRef]
  67. Hong, Y.; Hammad, A.W.A.; Sepasgozar, S.; Akbarnezhad, A. BIM adoption model for small and medium construction organisations in Australia. Eng. Constr. Archit. Manag. 2019, 26, 154–183. [Google Scholar] [CrossRef]
  68. Azhar, S.; Carlton, W.A.; Olsen, D.; Ahmad, I. Building information modeling for sustainable design and LEED® rating analysis. Autom. Constr. 2011, 20, 217–224. [Google Scholar] [CrossRef]
  69. Shirowzhan, S.; Sepasgozar, S.M.E.; Edwards, D.J.; Li, H.; Wang, C. BIM compatibility and its differentiation with interoperability challenges as an innovation factor. Autom. Constr. 2020, 112, 103086. [Google Scholar] [CrossRef]
  70. Tohidi, H. Teamwork productivity & effectiveness in an organization base on rewards, leadership, training, goals, wage, size, motivation, measurement and information technology. Procedia Comput. Sci. 2011, 3, 1137–1146. [Google Scholar] [CrossRef] [Green Version]
  71. Dohmen, T.; Falk, A. Performance pay and multidimensional sorting: Productivity, preferences, and gender. Am. Econ. Rev. 2011, 101, 556–590. [Google Scholar] [CrossRef] [Green Version]
  72. Wang, J.; Yu, B.; Tam, V.W.; Li, J.; Xu, X. Critical factors affecting willingness of design units towards construction waste minimization: An empirical study in Shenzhen, China. J. Clean. Prod. 2019, 221, 526–535. [Google Scholar] [CrossRef]
  73. MacCallum, R.C.; Widaman, K.F.; Zhang, S.; Hong, S. Sample size in factor analysis. Psychol. Methods 1999, 4, 84. [Google Scholar] [CrossRef]
  74. Kline, R.B. Principles and Practice of Structural Equation Modeling; Guilford Publications: New York, NY, USA, 2015. [Google Scholar]
  75. Liu, J.; Yi, Y.; Wang, X. Exploring factors influencing construction waste reduction: A structural equation modeling approach. J. Clean. Prod. 2020, 276, 123185. [Google Scholar] [CrossRef]
  76. Wu, G.; Liu, C.; Zhao, X.; Zuo, J. Investigating the relationship between communication-conflict interaction and project success among construction project teams. Int. J. Proj. Manag. 2017, 35, 1466–1482. [Google Scholar] [CrossRef]
  77. Xiong, B.; Skitmore, M.; Xia, B. A critical review of structural equation modeling applications in construction research. Autom. Constr. 2015, 49, 59–70. [Google Scholar] [CrossRef] [Green Version]
  78. Lai, W.-T.; Chen, C.-F. Behavioral intentions of public transit passengers—The roles of service quality, perceived value, satisfaction and involvement. Transp. Policy 2011, 18, 318–325. [Google Scholar] [CrossRef]
  79. Fornell, C.; Tellis, G.J.; Zinkhan, G.M. Validity assessment: A structural equations approach using partial least squares. In Proceedings of the American Marketing Association Educators’ Conference, Chicago, IL, 1–4 August 1982; pp. 1–5. [Google Scholar]
  80. Aigbavboa, C.; Thwala, W. Confirmatory factor analysis of neighbourhood features amongst South African low-income housing occupants. In Proceedings of the International Conference on Construction and Real Estate Management ICCREM 2013: Construction and Operation in the Context of Sustainability, Karlsruhe, Germany, 10–11 October 2013; pp. 1107–1122. [Google Scholar]
  81. Schreiber, J.B.; Nora, A.; Stage, F.K.; Barlow, E.A.; King, J. Reporting Structural Equation Modeling and Confirmatory Factor Analysis results: A review. J. Educ. Res. 2006, 99, 323–338. [Google Scholar] [CrossRef]
  82. Fornell, C.; Larcker, D.F. Evaluating structural equation models with unobservable variables and measurement error. J. Mark. Res. 1981, 18, 39–50. [Google Scholar] [CrossRef]
  83. Post, M.W.; de Witte, L.P.; van Asbeck, F.W.; van Dijk, A.J.; Schrijvers, A.J. Predictors of health status and life satisfaction in spinal cord injury. Arch. Phys. Med. Rehabil. 1998, 79, 395–401. [Google Scholar] [CrossRef]
  84. Cheung, G.W.; Rensvold, R.B. Testing factorial invariance across groups: A reconceptualization and proposed new method. J. Manag. 1999, 25, 1–27. [Google Scholar] [CrossRef]
  85. Mafimisebi, I.B.; Jones, K.; Sennaroglu, B.; Nwaubani, S. A validated low carbon office building intervention model based on structural equation modelling. J. Clean. Prod. 2018, 200, 478–489. [Google Scholar] [CrossRef]
  86. Ellis, B.B. Differential item functioning: Implications for test translations. J. Appl. Psychol. 1989, 74, 912. [Google Scholar] [CrossRef]
  87. Wu, G.; Zhao, X.; Zuo, J.; Zillante, G. Effects of team diversity on project performance in construction projects. Eng. Constr. Archit. Manag. 2019, 26, 408–423. [Google Scholar] [CrossRef]
  88. Hartog, J.; van Praag, M.; van der Sluis, J. If You Are So Smart, Why aren’t you an entrepreneur? Returns to cognitive and social ability: Entrepreneurs versus employees. J. Econ. Manag. Strategy 2010, 19, 947–989. [Google Scholar] [CrossRef]
  89. Huber, L.R.; Sloof, R.; Van Praag, M.; Parker, S.C. Diverse cognitive skills and team performance: A field experiment based on an entrepreneurship education program. J. Econ. Behav. Organ. 2020, 177, 569–588. [Google Scholar] [CrossRef]
  90. Papadonikolaki, E.; van Oel, C.; Kagioglou, M. Organising and Managing boundaries: A structurational view of collaboration with Building Information Modelling (BIM). Int. J. Proj. Manag. 2019, 37, 378–394. [Google Scholar] [CrossRef]
  91. Chong, H.-Y.; Lee, C.-Y.; Wang, X. A mixed review of the adoption of Building Information Modelling (BIM) for sustainability. J. Clean. Prod. 2017, 142, 4114–4126. [Google Scholar] [CrossRef] [Green Version]
  92. Martin, J.; Cormican, K.; Sampaio, S.C.B.; Wu, Q. Shared leadership and team performance: An analysis of moderating factors. Procedia Comput. Sci. 2018, 138, 671–679. [Google Scholar] [CrossRef]
  93. Ceri-Booms, M.; Curşeu, P.L.; Oerlemans, L.A.G. Task and person-focused leadership behaviors and team performance: A meta-analysis. Hum. Resour. Manag. Rev. 2017, 27, 178–192. [Google Scholar] [CrossRef] [Green Version]
  94. Wargocki, P. Productivity and health effects of high indoor air quality. In Encyclopedia of Environmental Health; Elsevier: Burlington, UK, 2011; pp. 688–693. [Google Scholar] [CrossRef]
Figure 1. The preliminary hypothetical model. Note: “+/−” indicates a positive/negative impact.
Buildings 11 00486 g001
Figure 2. The research process of the study.
Buildings 11 00486 g002
Figure 3. The initial hypothetical model of teamwork efficiency in BIM-based collaborative design.
Buildings 11 00486 g003
Figure 4. Standardized estimation of the final model.
Buildings 11 00486 g004
Figure 5. Degree of influence of key factors on teamwork efficiency.
Buildings 11 00486 g005
Table 1. Factors and measurement items for teamwork efficiency in BIM-based collaborative design.
Latent FactorsCodeItems for ConstructSources
Characteristic of team member
(CTM)
CTM01Physical conditionInterview
CTM02Work attitudeChoi et al. [52]
CTM03Work experienceHalkos and Bousinakis [53]
CTM04Job recognitionBakker [54]
CTM05UnderstandingInterview
CTM06Innovation capacityCai et al. [55]; Lu et al. [56]
CTM07Learning abilityLu et al. [56]
CTM08Professional matchingBosch-Sijtsema et al. [57]
Characteristic and arrangement of design task
(CADT)
CADT01Task importanceInterview
CADT02Task feedbacks are delayedChang et al. [58]
CADT03Task difficultyKleingeld et al. [59]
CADT04Task requirements are unclearHertel et al. [60]
CADT05Task discontinuityInterview
CADT06Task instabilityInterview
Team management level
(TML)
TML01Salary incentive mechanismGarbers and Konradt [61]
TML02Promotion assessment mechanismGarbers and Konradt [61]
TML03ConsultationInterview
TML04Interpersonal relationshipO’Leary et al. [62]
TML05Cooperative attitudeBakker [54]
TML06Willingness to share experienceInterview
TML07Leadership expertiseMeng and Berger [63]
TML08Leadership management abilityMeng and Berger [63]
Practicality of information system
(PIS)
PIS01Hardware configurationHaemers et al. [64]
PIS02Software system stabilityHaemers et al. [64]
PIS03Improve design qualityChen and Luo [65]
PIS04Reduce errors and omissionsYang and Chou [66]
PIS05Increase design speedInterview
PIS06Reduce the number of withdrawalsInterview
PIS07Information sharing functionCharef et al. [8]
PIS08VisualizationHong et al. [67]
PIS09Reduce communication timesInterview
PIS10Convenience of communicationAzhar et al. [68]
PIS11BIM software compatibilityShirowzhan et al. [69]
Comfort of working environment
(CWE)
CWE01Air qualityHong et al. [67]
CWE02IlluminationFrontczak et al. [38]
CWE03NoiseFrontczak et al. [38]
CWE04Personal work areaInterview
CWE05TemperatureFrontczak et al. [38]
Human interaction
(HI)
HI01Collaborative behaviorTohidi [70]
HI02Degree of effortDohmen and Falk [71]
HI03Reduce quarrel in the same professionInterview
HI04Interpersonal interactionBosch-Sijtsema et al. [57]
HI05Task interactionBosch-Sijtsema et al. [57]
HI06Reduce quarrel between different professionsInterview
Human-information system interaction
(HISI)
HISI01Ability to perform tasksLi et al. [49]
HISI02Bear the pressure of tasksInterview
HISI03Software meets needs of tasksInterview
HISI04Software meets needs of design projectLi et al. [49]
HISI05Ease of use of softwareLi et al. [49]
HISI06Degree to which software meets design habitsLi et al. [49]
HISI07Personal ability to learn softwareLi et al. [49]
Teamwork efficiency
(TWE)
TWE01Speed of completion of individual tasksBosch-Sijtsema et al. [57]
TWE02Speed of completion of teamworkInterview
TWE03Quality of resultsInterview
TWE04Personal satisfactionBosch-Sijtsema et al. [57]
TWE05Owner satisfactionBosch-Sijtsema et al. [57]
TWE06Project leader satisfactionBosch-Sijtsema et al. [57]
Table 2. Summary of respondent socio-demography (n = 374).
VariableCategoryNumberPercentage
(%)
Cumulative Percentage (%)
AgeUnder 30 years old23362.362.3
31–40 years old10327.690.0
Over 40 years old3810.1100.0
Educational levelJunior college or below4311.411.4
Undergraduate23663.274.6
Postgraduate or above9525.4100.0
MajorArchitectural design11029.429.4
Structural design8723.252.6
HVAC design5715.468.0
EE Design4311.479.4
Water supply and drainage design3910.589.9
Other3810.1100.0
Staff levelsJunior engineer14839.539.5
Mid-level engineer12734.273.7
Senior engineer5113.687.3
Other4812.7100.0
Working experience related to BIM design1–2 years16143.043.0
3–4 years11029.472.4
Over 5 years10327.7100.0
Table 3. Goodness-of-fit of the initial structural model.
Goodness-of-Fit MeasureLevel of Acceptance FitFit Statistics
Absolute fitX2/df<3.001.610
GFI>0.800.828
AGFI>0.800.797
RMSEA<0.080.052
Incremental fitTLI>0.900.918
IFI>0.900.927
CFI>0.900.926
Parsimonious fitPNFI>0.500.744
PCFI>0.500.832
PGFI>0.500.711
Table 4. Converged validity of the initial structural model.
ConstructItemFLCombination ReliabilityAVE
Collaborators’ learning ability
(CLA)
CTM020.8250.900.61
CTM030.770
CTM040.644
CTM050.800
CTM060.817
CTM070.833
Characteristic and arrangement of design task
(CADT)
CADT030.7250.770.53
CADT040.857
CADT060.576
Team cooperation atmosphere
(TCA)
TML040.8810.920.73
TML050.818
TML060.828
TML070.891
BIM-based software function
(BSF)
PIS050.8510.880.65
PIS060.867
PIS070.764
PIS090.744
Comfort of working environment
(CWE)
CWE010.9320.880.64
CWE020.785
CWE030.747
CWE050.719
Human interaction
(HI)
HI020.8760.910.71
HI030.897
HI040.804
HI050.787
Software-person adaptation
(SPA)
HISI050.7800.810.59
HISI060.850
HISI070.670
Software-task-person matching
(STPM)
HISI010.8440.880.66
HISI020.823
HISI030.850
HISI040.716
Team work efficiency
(TWE)
TWE10.6330.750.51
TWE30.834
TWE50.773
Table 5. Correlation matrix and discriminant validity for the constructs.
CADTBSFCWETCACLASPASTPMHITWE
CADT0.178
BSF0.0210.324
CWE0.0880.1490.344
TCA0.1410.0830.1670.418
CLA0.0890.0500.0930.1360.267
SPA0.0320.1010.0810.0980.0350.220
STPM0.0910.1040.1180.1760.1160.1870.317
HI0.0270.0900.1440.1420.1230.0900.1510.289
TWE0.0500.0720.0930.1200.0870.1110.1180.1460.273
Table 6. Regression weights in the initial model.
PathEstimateS.E.C.R.pEstimate (std)
BSF → SPA0.2720.0684.022***0.326
TCA → SPA0.1830.0702.614**0.229
CWE → SPA0.1530.0771.986*0.174
CLA → SPA−0.0230.083−0.2810.779−0.022
TCA → STPM0.1900.0692.761**0.226
SPA → STPM0.6430.0936.935***0.611
CLA → STPM0.1410.0771.8230.0680.128
CADT → STPM0.0470.0990.4750.6350.041
BSF → STPM−0.0770.059−1.2940.196−0.087
CADT → HI−0.2970.111−2.669**−0.265
TCA → HI0.2040.0762.683**0.250
CWE → HI0.2550.0713.590***0.284
CLA → HI0.2150.0822.601**0.201
STPM → HI0.2980.0773.889***0.307
HI → TWE0.2660.0773.435***0.298
STPM → TWE0.3970.0814.895***0.460
Note: *** p < 0.001; ** p < 0.01; * p < 0.05.
Table 7. Goodness-of-fit of the final structural model.
Goodness-of-Fit MeasureLevel of Acceptance FitFit Statistics
Absolute fitX2/df<3.001.486
GFI>0.800.843
AGFI>0.800.814
RMSEA<0.080.043
Incremental fitTLI>0.900.935
IFI>0.900.943
CFI>0.900.942
Parsimonious fitPNFI>0.500.752
PCFI>0.500.841
PGFI>0.500.711
Table 8. Regression weights in the final model.
PathEstimateS.E.C.R.PEstimate (std)
CLA → HI0.2580.0673.865***0.309
CADT → HI0.1510.0732.072*0.179
TCA → HI0.1780.0642.783**0.218
CWE → HI0.2100.0603.494***0.248
STPM → HI0.6100.0857.199***0.586
CLA → STPM0.1680.0732.284*0.152
TCA → SPA−0.3340.114−2.932**−0.292
TCA → STPM0.2150.0782.762**0.251
BSF → SPA0.2330.0693.387***0.263
CWE → SPA0.2110.0872.436*0.189
HI → TWE0.3720.0864.317***0.368
SPA → STPM0.4550.0924.927***0.517
STPM → TWE0.1970.0792.486*0.227
CLA → HI0.2580.0673.865***0.309
CADT → HI0.1510.0732.072*0.179
TCA → HI0.1780.0642.783**0.218
Note: *** p < 0.001; ** p < 0.01; * p < 0.05.
Table 9. Total effect of influencing factors on TWE in the final model.
PathEstimateS.E.C.R.
Collaborators’ learning ability
(CLA)
CLA → TWE 0.134
CLA → HI → TWE0.043
CLA → STPM → TWE0.078
CLA → STPM → HI → TWE0.013
Characteristic and arrangement of design task
(CADT)
CADT → TWE −0.066
CADT → HI → TWE−0.066
Team cooperation atmosphere
(TCA)
TCA → TWE 0.283
TCA → HI → TWE0.057
TCA → STPM → HI → TWE0.021
TCA → STPM → TWE0.128
TCA → SPA → STPM → TWE0.066
TCA → SPA → STPM → HI → TWE0.011
BIM-based software function
(BSF)
BSF → TWE 0.109
BSF → SPA → STPM → TWE0.094
BSF → SPA → STPM → HI → TWE0.015
Comfort of working environment
(CWE)
CWE → TWE 0.123
CWE → HI → TWE0.060
CWE → SPA → STPM → TWE0.054
CWE → SPA → STPM → HI → TWE0.009
Publisher’s Note: MDPI stays neutral with regard to jurisdictional claims in published maps and institutional affiliations.

