Article

Combined Flexural and Shear Strengthening of RC T-Beams with FRP and TRM: Experimental Study and Parametric Finite Element Analyses

1
EPICentre, Department of Civil, Environmental and Geomatic Engineering, University College London, London WC1E 6BT, UK
2
CONSTRUCT-LESE, Faculty of Engineering, University of Porto, 4200-465 Porto, Portugal
*
Author to whom correspondence should be addressed.
Currently at European Commission, Joint Research Centre, 21027 Ispra, Italy.
Buildings 2021, 11(11), 520; https://doi.org/10.3390/buildings11110520
Submission received: 31 July 2021 / Revised: 29 October 2021 / Accepted: 29 October 2021 / Published: 6 November 2021
(This article belongs to the Special Issue Assessment and Retrofit of Buildings)

Abstract

:
Due to inadequacies of reinforcement design in older structures and changes in building codes, but also the change of building use in existing structures, reinforced concrete (RC) beams often require upgrading during building renovation. The combined shear and flexural strengthening with composite materials, fibre-reinforced polymer sheets (FRP) and textile reinforced mortars (TRM), is assessed in this study. An experimental campaign on twelve half-scale retrofitted RC beams is presented, looking at various parameters of interest, including the effect of the steel reinforcement ratio on the retrofit effectiveness, the amount of composite material used for strengthening and the effect of the shear span, as well as the difference in effectiveness of FRP and TRM in strengthening RC beams. Significant effects on the shear capacity of composite retrofitted beams are observed for all studied parameters. The experimental study is used as a basis for developing a detailed finite element (FE) model for RC beams strengthened with FRP. The results of the FE model are compared to the experimental results and used to design a parametric study to further study the effect of the investigated parameters on the retrofit effectiveness.

1. Introduction

The strengthening of reinforced concrete (RC) elements is becoming a topic of increased importance due to the ageing of the European building stock and the associated need for building renovation to comply with modern standards, changes of use or the deterioration of materials. For RC beams, the use of fibre-reinforced polymer (FRP) sheets is a well-studied area of research and in particular a large number of experimental campaigns have been carried out for monotonic loading, e.g., [1,2,3,4,5,6,7,8,9,10]. Interest is also growing in other composite materials, such as textile-reinforced mortars (TRM), e.g., [11,12,13] or steel-reinforced grout (SRG) [14,15,16,17] for strengthening RC beams. There is also a wealth of design guidelines for RC beam strengthening focusing on shear and flexural strengthening, as well as the bond properties of FRP to concrete, such as the American ACI-440.2R-08 [18], the Canadian CSA-S806 [19], the fib Bulletin 14 [20], the Italian CNR-DT-200 [21], the Australian HB 305 [22] or the Eurocode 8—Part 3 [23].
Nonetheless, a study evaluating a database of over 250 experiments on RC beams strengthened with FRP found that current predictive models may not always render results adequate for design [24]. Lack of conservatism in design equations has also been noted in other experimental investigations [4], indicating that design equations for transversal FRP strengthening in most design codes depend largely on an FRP to concrete bond model, the effective strain of FRP and the width-to-spacing ratio of FRP strips. The lack of a sufficient number of beams with T-sections in the experimental literature has also been observed [9,10]. Experimental evidence however suggests that other important parameters are not sufficiently addressed in any guidelines, including crack patterns, the shear span-to-depth ratio [8] and the amount of flexural FRP strengthening [25], as well as the interaction of external FRP and internal steel reinforcement [26]. Models including such features have been proposed by [4,27,28].
Combined CFRP strengthening of RC beams in flexure and shear has been analysed by El-Ghandour and compared to predictions according to the ACI guidelines [29]. It was found that the guidelines are accurate for singly strengthened beams, but not for combined ones, as the enhancement in capacity depended strongly on the cracking and damage patterns observed. A similar study developed by Dong et al. [30] has shown that combined strengthening was more effective in increasing the capacity of a beam than flexural strengthening alone. El-Sayed has shown that flexural strengthening positively affects shear strengthening [25], as it changes the neutral axis depth of the beam, increasing the area of concrete in the compression zone that can resist shear. More recently, the effect of combined retrofit was assessed by Hawileh et al. [31], who observed that the shear strength of retrofitted beams increased also with the number of layers of flexural CFRP strengthening.
The effect of the shear span-to-depth ratio (a/d) on the effectiveness of shear retrofitting schemes was studied by Wakjira and Ebead [16] for SRG strengthened beams, observing an increase in retrofit effectiveness for higher a/d ratios. Tetta et al. made similar observations. The authors of [12] observed a doubling in strengthening effectiveness for increasing a/d ratios (1.6 to 2.6) for TRM-strengthened beams. For FRP-strengthened beams, Bousselham [5] observed a more significant FRP shear contribution in RC beams with higher shear span-to-depth ratios. Finally, Li and Leung [8] determined that the FRP shear strengthening effectiveness varies significantly with a/d ratios, finding that the highest effectiveness is achieved for medium a/d ratios (between 2.5 and 3.0), and are least effective for a/d ratios below 2.0.
Hawileh et al. [31], studied the effect of steel reinforcement ratios on FRP retrofit effectiveness, finding that strengthening is more effective for lightly reinforced beams. For SRG-strengthened shear-deficient RC beams, Thermou et al. [15] instead found the opposite to be true in terms of strength, while ductility improved more significantly for a lower steel reinforcement ratio. Experimental results from Osman et al. [32] show that the effect of the reinforcement ratio on the shear strength of FRP-retrofitted RC beams was considerably greater than that predicted by ACI equations.
Clearly, there is still a need for investigating some of these critical aspects further and this paper hence presents an experimental study on twelve RC T-beams retrofitted with FRP and TRM, investigating various parameters. Four main variables were evaluated in the experiments, namely: (a) the effect of steel shear reinforcement ratio; (b) the interaction between flexure and the shear capacity; (c) the effectiveness of TRM vs FRP and (d) the effect of the composite retrofit material arrangement. These parameters were found to be critical in the literature and are assessed here by means of comparisons of experimental results. The obtained results are then used to calibrate a non-linear finite element model (FEM) which is used for a parametric study to further study the effect of the investigated parameters on the retrofit effectiveness.

2. Materials and Methods

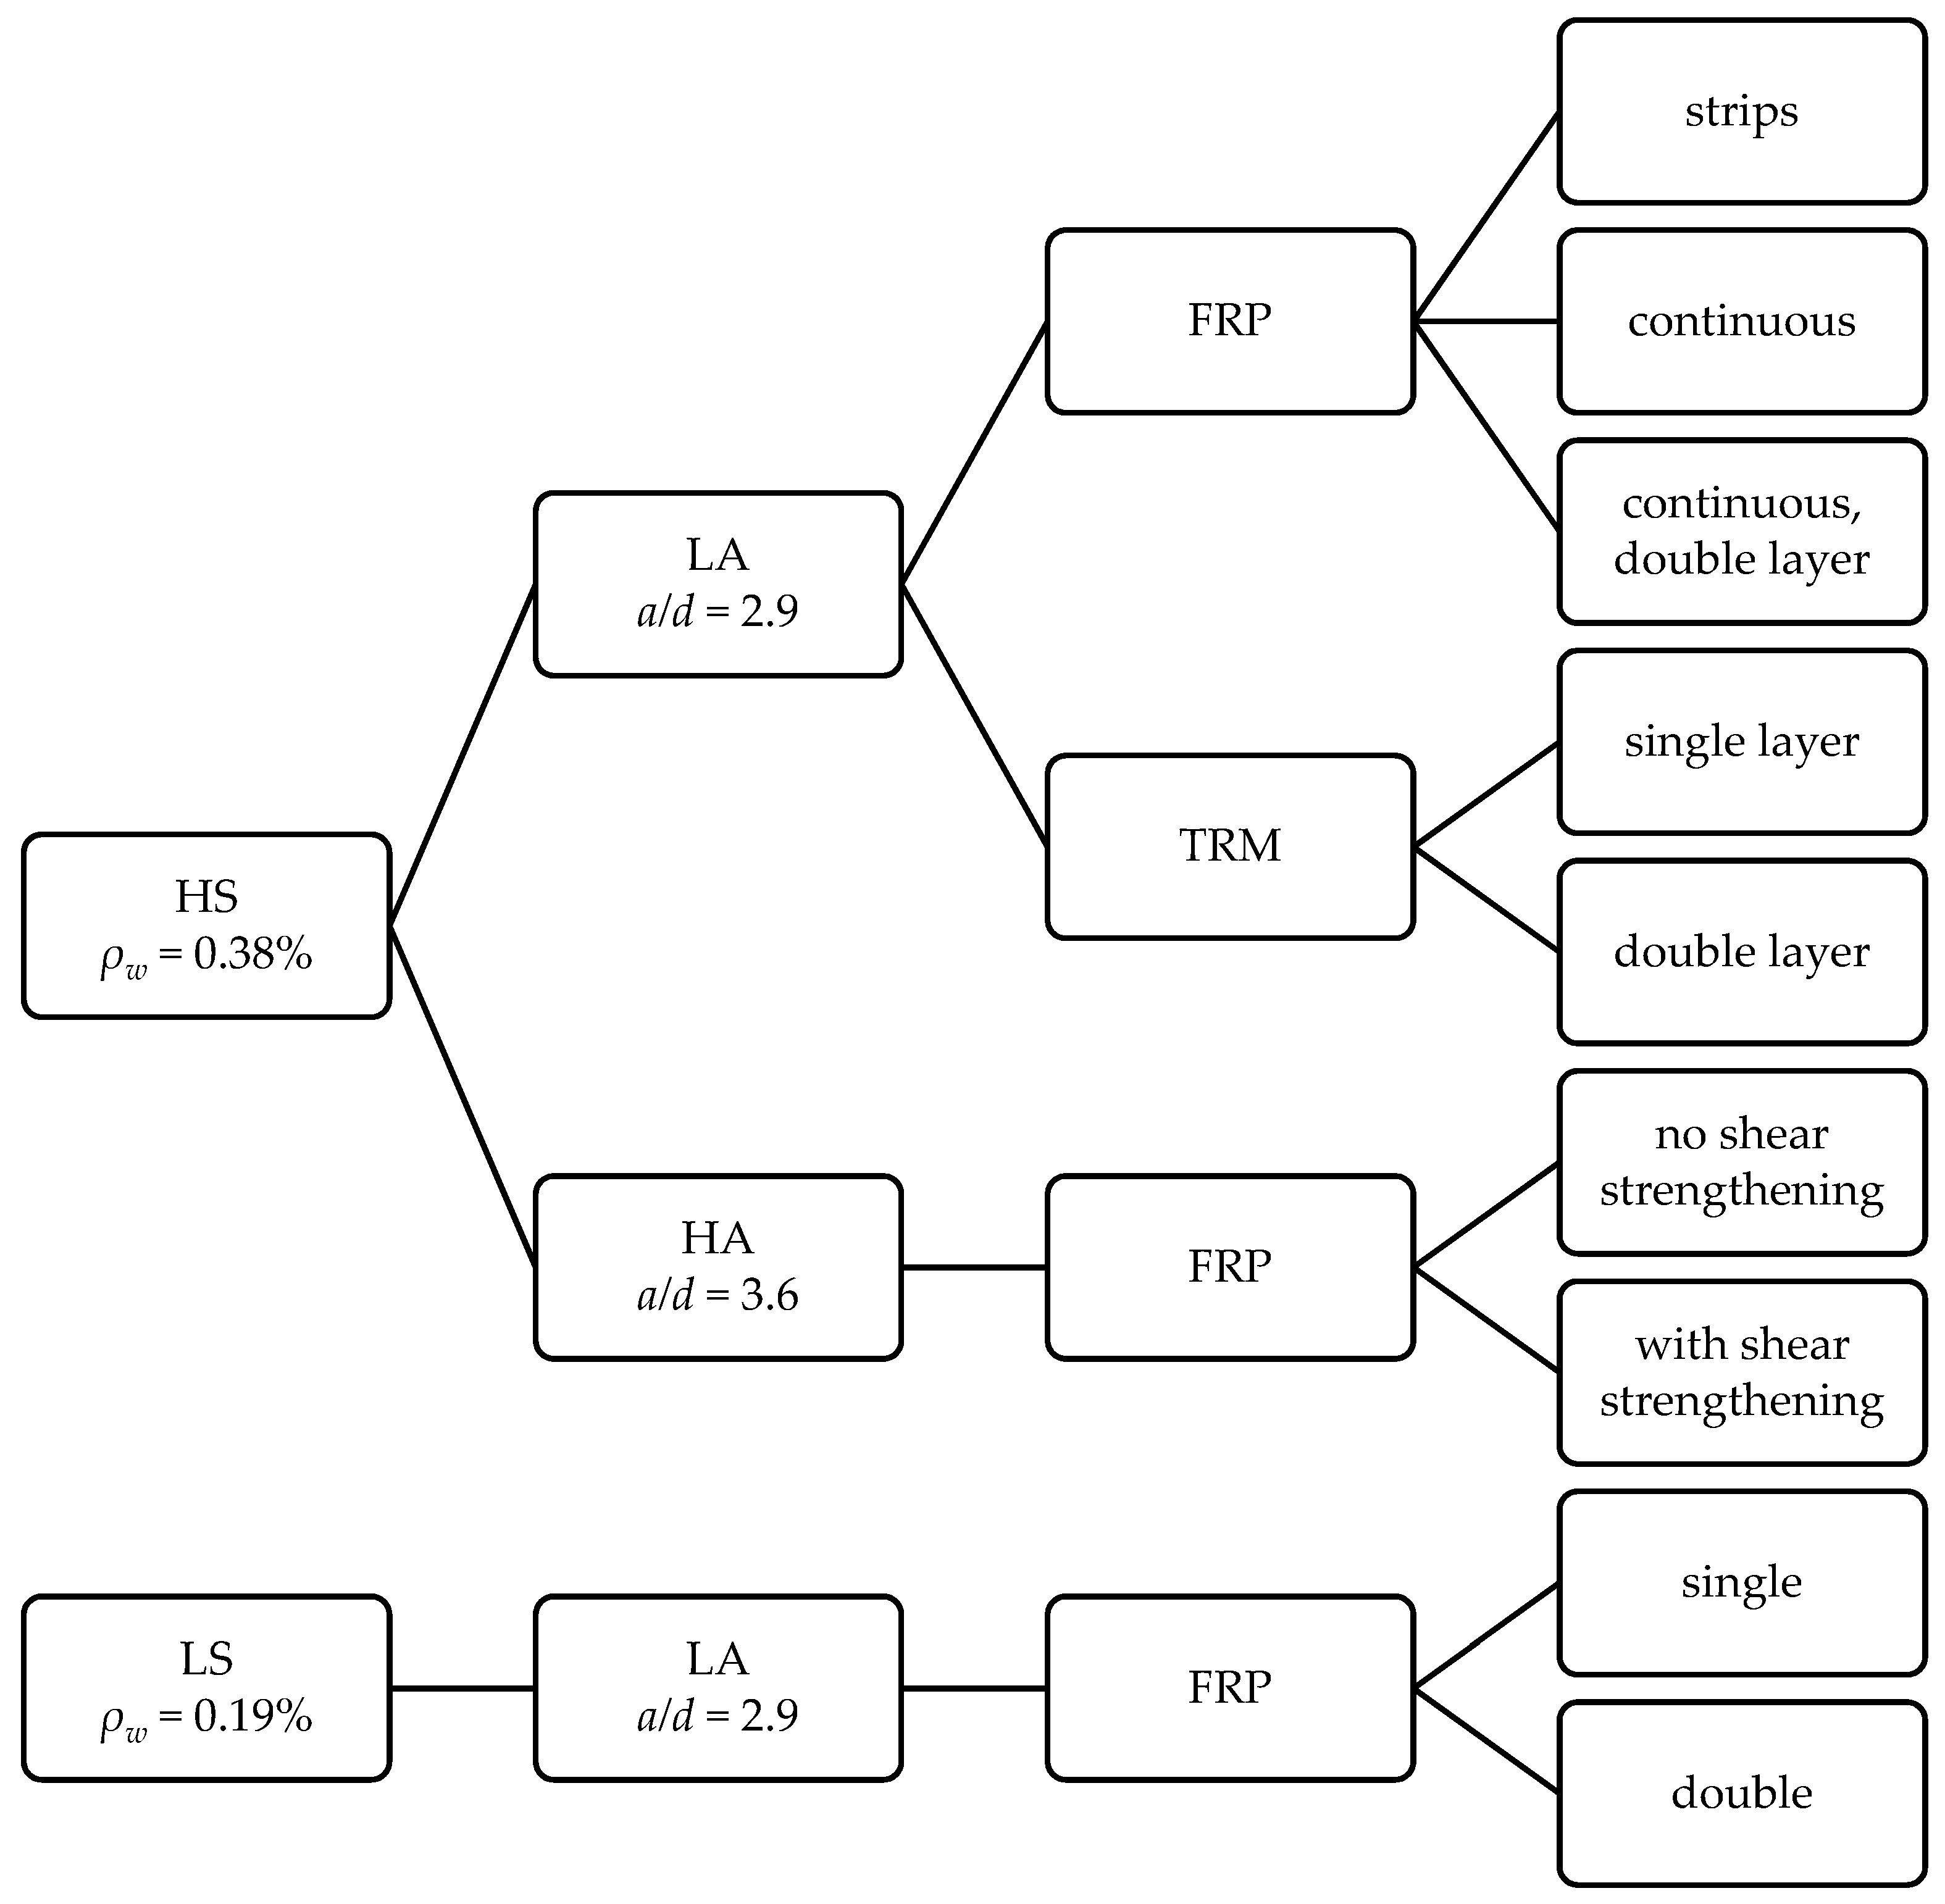
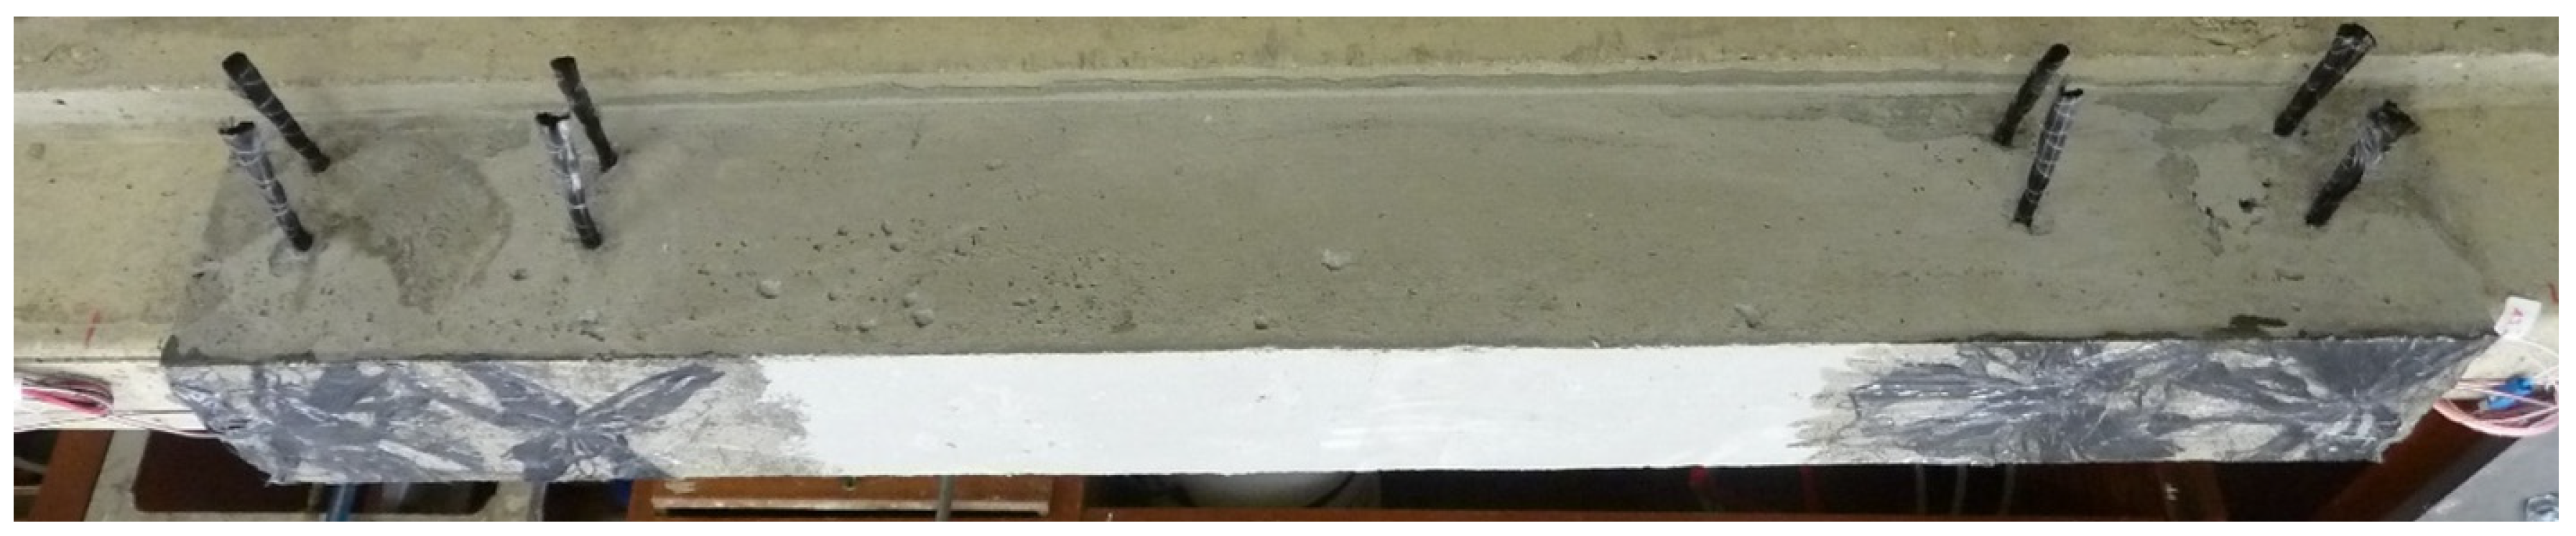
2.1. Specimens and Set-Up

Twelve half-scale RC T-beam specimens were grouped in three test series and tested under monotonic loading under four-point bending with the specimen geometries shown in Table 1. The beams have a span of 1.26 m, with a depth of 180 mm and a width of 100 mm at the bottom of the beam. The dimensions of the scaled specimens are not unlike many reported experimental studies, e.g., [9,31,33]; however, it has to be considered that several studies have shown that strengthening effectiveness would likely be lower if full-scale beams were tested, e.g., [6]. This should be considered when looking at the reported values of strength increase, and comparisons presented are hence made in relative terms.
Moreover, to consider the presence of a slab in the application of the retrofit, the beams were designed as a T-section with a 50 mm deep slab protruding 50 mm from the beam at either side. Seven beams were strengthened with FRP, while two were strengthened using TRM. Loading was applied linearly up to the failure of the beam with a rate of 0.2 kN/s using a 300 kN AEP TC4 load cell. The monitoring set-up consisted of three LVDTs for measuring displacements at mid-span (50 mm stroke) and the locations of applied load (25 mm), and the integrated load cell.
As shown in Table 1, to evaluate the effect of steel shear reinforcement ratio, two different amounts of shear reinforcement (HS and LS) were adopted for the specimens. The ratios of shear reinforcement, ρw (defined according to Equation (9.4) of Eurocode 2 [34]) was ρw = 0.38% (i.e., Φ6 at 150 mm c/c) for design HS in series 1 and 2, and ρw = 0.19% (Φ6 at 300 mm c/c) for the low shear (design LS) reinforcement ratio in series 3. The longitudinal reinforcement of the beams was kept constant for all beams, with two Φ10 bars at the bottom of the beams. The cover to the shear reinforcement was 25 mm, giving an effective depth of the section of 144 mm for all specimens. The T-section top-reinforcement consisted of four Φ6 bars in the longitudinal direction.
To test the interaction of shear and flexure, the effect of the shear span-to-depth ratio (a/d) was assessed. For the specimens with reinforcement detailing HS, a lower (2.9, series 1) and higher (3.6, series 2) a/d ratio were obtained by changing the distance between the two load actuators. Based on the two reinforcement designs and two a/d ratios, three series of tests were hence conducted, with results compared to control specimens S1-C, S2-C and S3-C. The variables tested in the experiments are summarised in Figure 1. Note that HS/LS stand for the high and low shear reinforcement detailing, respectively, and HA/LA for the higher or lower a/d ratio, respectively.

2.2. Materials

For composite strengthening, unidirectional CFRP sheets and a carbon mesh (20 mm mesh size) were used for the TRM application. The main properties, including the fibre weight per unit area, the nominal thickness tf defined by the ratio weight/density, as well as the elastic modulus Ef from coupon tests are found in Table 2. The FRP composite was applied to the surface of the concrete specimen using the wet-layup procedure recommended by the manufacturer. For the TRM, a mortar with characteristic compressive strength of 45 MPa (28 days), a characteristic flexural strength of 6 MPa and a characteristic elastic modulus of 30 GPa was used in a thick layer application of ca. 20 mm, following the manufacturer’s guidelines.
The measured concrete compressive cube strength from three standard 150-mm cube tests (fcu) per specimen are summarised in Table 3. Note that the concrete mix was the same for all specimens, with a target strength of fcu = 25 MPa. There was large variability between the concrete cube tests, as indicated by the coefficient of variation (C.O.V.) in the table. The steel reinforcement used consisted of Φ10 mm longitudinal bars (fym = 600 MPa) and Φ6 mm smooth transverse bars (fym = 470 MPa).

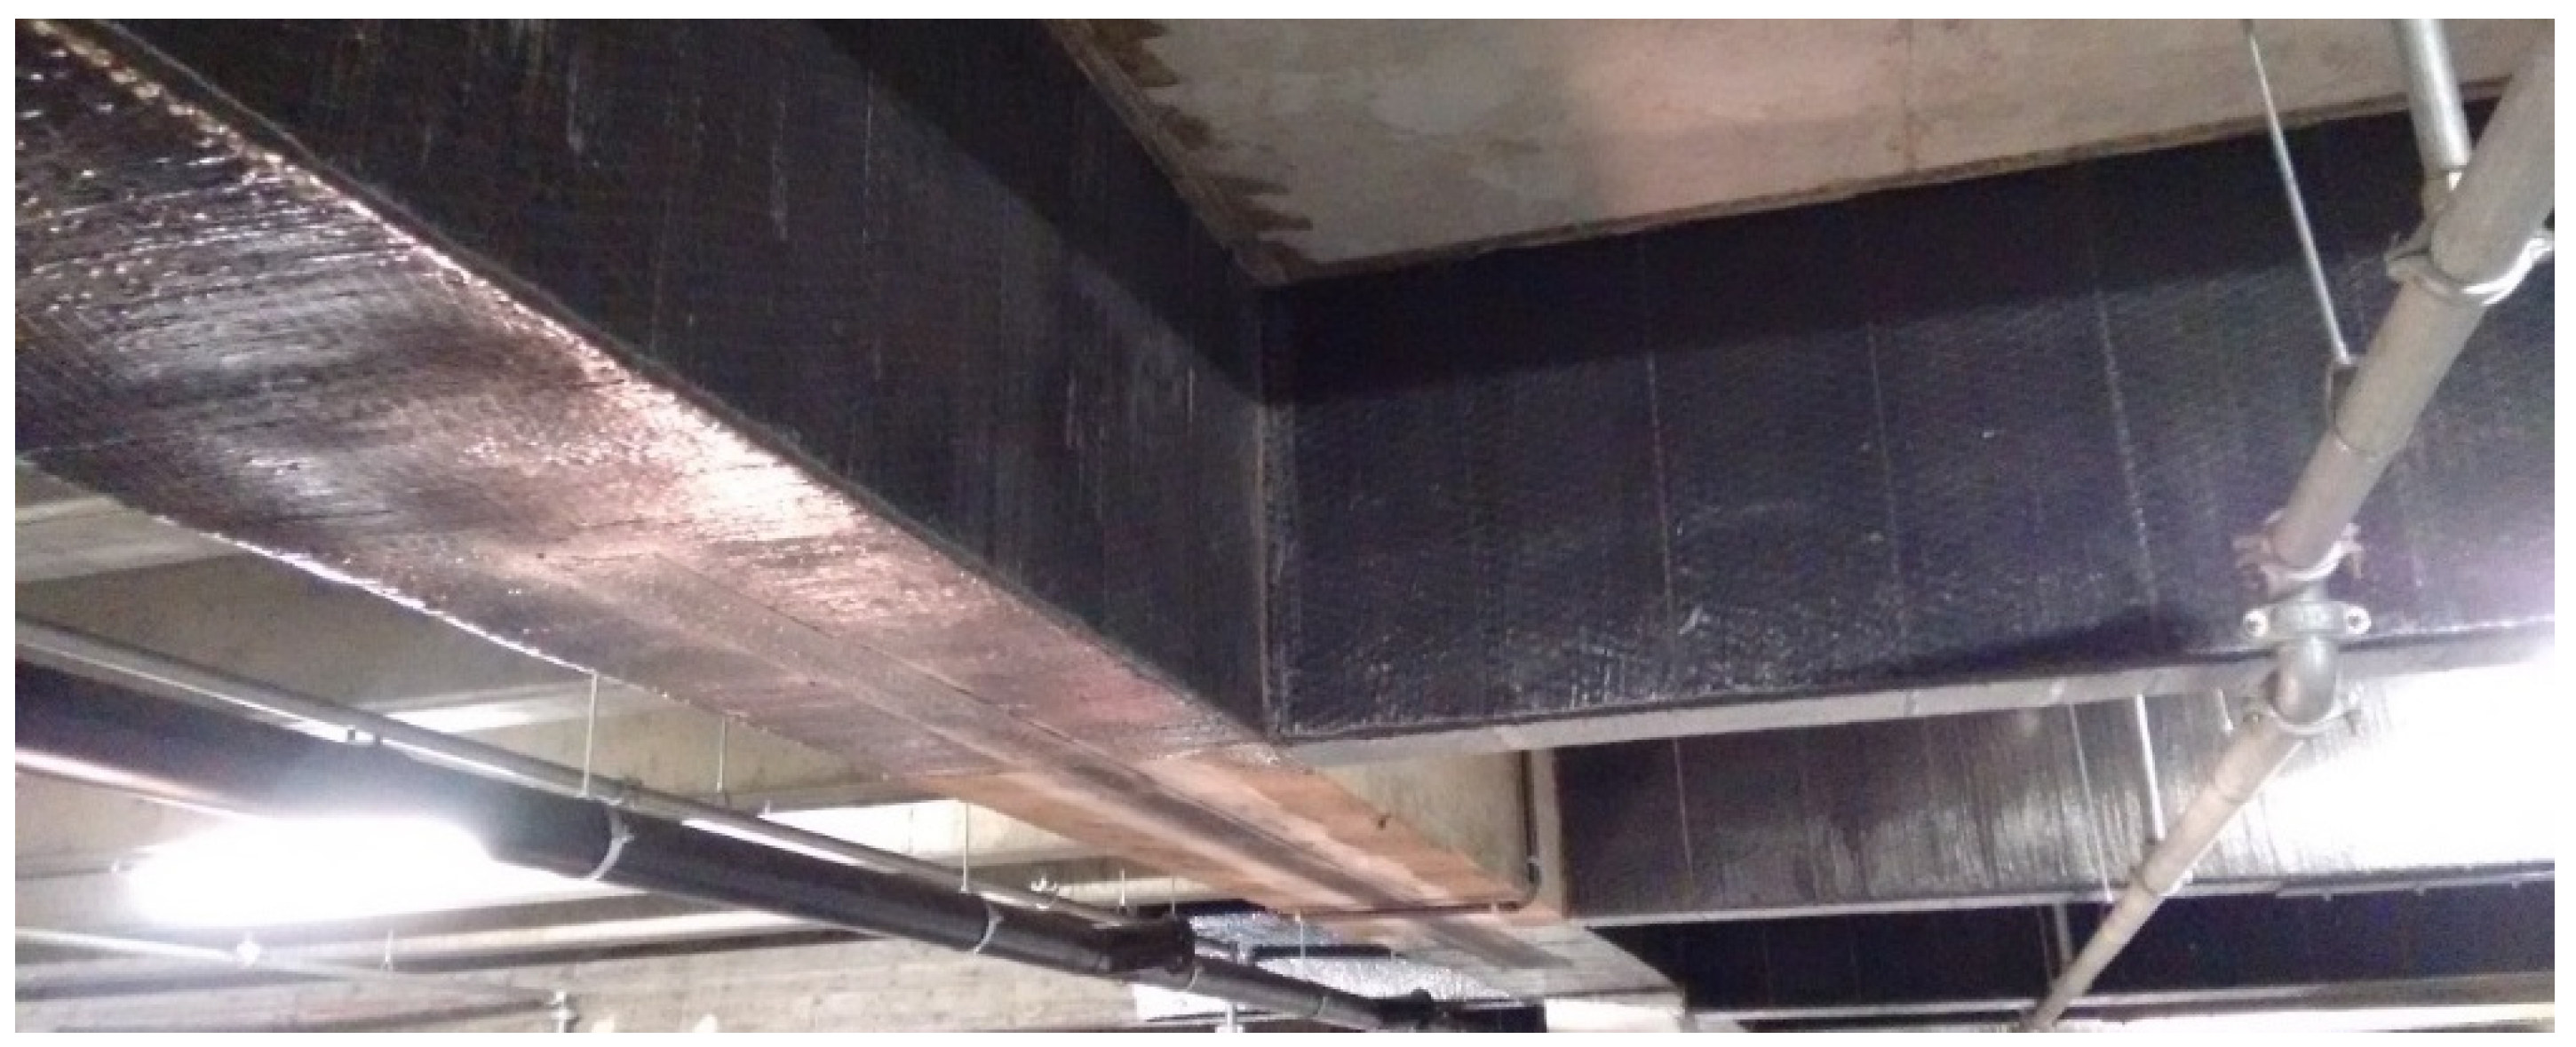
2.3. Retrofit Schemes

The other main test variables were related to the retrofit material and the amount of applied retrofit. To compare the different beam specimens, their full characteristics are given in Table 3. Some definitions are needed in terms of the respective reinforcement ratios. The FRP or TRM shear reinforcement ratio ρfw according to [35] is given as a ratio to the width of the beam section (bw) in Equation (1):
ρ f w = 2 · n · t f b w
where n is the number of layers and tf the nominal thickness of the composite strengthening material. In the case of the strengthening with FRP strips, this value is multiplied by the ratio (bf/sf), for strips of width bf placed at a spacing sf.
The mechanical shear reinforcement ratio (ωfw), also provided in Table 3, is determined as in Equation (2), as the geometric FRP or TRM amount (ρfw) multiplied by its effective strength (ffdd,e,U), divided by the product of the shear reinforcement ratio (ρw) and steel yield strength (fyw):
ω f w = ρ f w · f f d d , e , U ρ w · f y w
Note that rather than the ultimate tensile strength of the material, which is never reached in FRP or TRM-retrofitted specimens, ffdd,e,U, i.e., the effective design debonding strength for U-jackets, is used to account for the design strength of the composite material. It is calculated using Eurocode 8-Part 3 [23] Equation (A29) is based on the effective bond length, the geometry of the retrofit application and the material characteristics of the retrofit material and the concrete substrate. For the TRM-strengthened specimens, Eurocode 8-Part 3 (EC8) offers no design equations; however, the recently published Italian CNR guidelines, which are built on very similar equations to EC8 in FRP-shear strengthening [36,37], can be used to calculate the effective design bond strength of TRM U-jackets, called ffed in Equation (5.4) in CNR-DT 215/2018 [38], which is used instead:
f f e d = { σ f d L m a x l e d ( 1 1 3 L m a x l e d )   i f   L m a x l e d σ f d ( 1 1 3 l e d L m a x )     i f   L m a x > l e d
where σfd is the TRM design tensile strength and led is the effective anchorage length, and L m a x = m i n { 0.9 · d ,   h w } sin β , where hw is the cross-section web height (entirely covered by the U-wrap), d is the effective depth of the beam and β is the angle of the TRM application. The effective anchorage length provided by the manufacturer (150 mm) was assumed, which also corresponds to the value suggested in ACI 549.4R [39]. Note that this is lower than the conservative value provided in CNR-DT 215/2018 (300 mm), but a reduced value appears appropriate also given the provision of fibre-anchors. Finally, the longitudinal FRP or TRM reinforcement ratio ρfl is given by the area, Af, over the area of the beam (bw d).
The details of the different retrofit designs are shown in Table 4. In total, nine beams were retrofitted, of which seven beams were retrofitted using FRP and two were retrofitted with TRM. FRP was first applied for flexural strengthening to the bottom face of the beam. The end of the retrofit layer was 10 mm away from the support hinge in all beams. In three beams, shear strengthening and anchorage of the longitudinal FRP sheet were provided by U-strips (s), while in two beams continuous U-wrapping was applied (c). Two beams are retrofitted with a TRM U-jacket for flexural and shear strengthening applied along the length of the beam.
In terms of the practical application of the retrofitting, the concrete surfaces were first roughened using sandpaper and after removal of the dust, epoxy resin was applied on the concrete surface before applying the impregnated FRP sheet. For the TRM-retrofitting, an initial layer of mortar was applied instead. In the case of FRP-retrofitting, the longitudinal FRP at the bottom of the beam was applied before the transversal sheets. Note that all beams had rounded corners of 15 mm radius. The retrofit design in this study considers an increase in the flexural and shear capacity of the beams. For old RC structures, like the ones considered in this study, other beam damage mechanisms are possible, such as early pull-out of the beam reinforcement. The latter is particularly relevant in cases when beam longitudinal bars are inadequately anchored into the beam-column joints (e.g., straight anchorage and/or inadequate anchorage length). To account for this type of failure, it is recommended that continuous longitudinal FRP- or TRM-strengthening with adequate connection to and across the beam-column joint be provided (see, e.g.,: [33,34]).
In series 1, the effectiveness of three 40 mm U-strips with 140 mm spacing (S1-FRP1s, with ρfw = 0.13%) was compared to continuous U-wrapping (S1-FRP1c, with ρfw = 0.45 along a length of 400 mm. For the second beam with continuous U-wrapping, specimen S1-FRP2c, a double layer of flexural FRP strengthening was applied.
Another point of investigation in series 1 was the effectiveness of TRM strengthening. Two beams, S1-TRM1c and S1-TRM2c, were retrofitted with 1 or 2 layers of TRM U-wrap along the entire length of the beam. As can be seen in Table 3, beam S1-TRM1c has a comparable mechanical shear reinforcement ratio (ωfw = 0.5) to beam S1-FRP1s (ωfw = 0.6), while S1-TRM2c and S1-FRP1c are comparable (ωfw = 1.0 and 1.1, respectively).
For the TRM-strengthened beams, there was a significant increase in cross-section area compared to the FRP, as 10 mm of mortar was applied as a base layer with an additional 10 mm of mortar per layer. This mortar thickness, in line with the manufacturer’s guidelines to ensure an application similar to actual on-site works, corresponded to a rather thick application of TRM, where typical values range between 5 and 15 mm per layer [38]. Note that four fan-shaped fibre spike-anchors were applied on the lateral sides at the ends of the TRM jackets, distributed evenly within the zone between load application and the end of the jacket, as shown in Figure 2. Two further anchors were placed at the bottom side of the jacket. These consisted of 80 mm wide CFRP sheets rolled together. The anchors were soaked in epoxy resin and then placed inside holes pre-drilled into the beams, before being fanned out onto the TRM surface. The lateral anchors were passed through holes across the full beam section and extended further 100 mm outside on each side. The bottom anchors instead were embedded in holes drilled 60 mm into the beam (at the centreline of the beam).
In series 2, comparisons to series 1 could be made in terms of the shear span-to-depth ratio. Beam S2-FRP1c also has a continuous U-wrap shear retrofit as S1-FRP1c, with equal shear reinforcement ratios, hence allowing the comparison of the relative strengthening effectiveness with different a/d ratios. In beam S2-FRP0, no shear strengthening was applied, but only the layer of flexural FRP strengthening, in order to investigate the effect of flexural strengthening on the shear capacity of the beam.
Finally in series 3, the effect of reduced steel transverse reinforcement on the retrofit effectiveness was investigated for beams with FRP-strip strengthening, with beam S3-FRP1s having an FRP shear reinforcement with three 50 mm U-strips at 150 mm c/c (ρfw = 0.14%) comparable to S1-FRP1s (0.13%). This corresponds, however, to a mechanical shear reinforcement ratio (ωfw = 1.2) double than that of S3-FRP1s. In S3-FRP2s the effect of doubling the amount of strip-reinforcement was assessed, with four 65 mm wide U-strips at 110 mm c/c, hence a shear reinforcement ratio ρfw = 0.26%.
Note that for all specimens retrofitted with FRP, the length of the U-strips (130 mm) was higher than the required effective bond length (LE), ranging between 93.2 and 117.5 mm, for U-wrapped shear strengthening according to Equation (A28) of Eurocode 8-Part 3 [23]. No specific anchorage was applied for the FRP shear strengthening, which is the case for some real FRP retrofits seen onsite (e.g., Figure 3).

3. Results

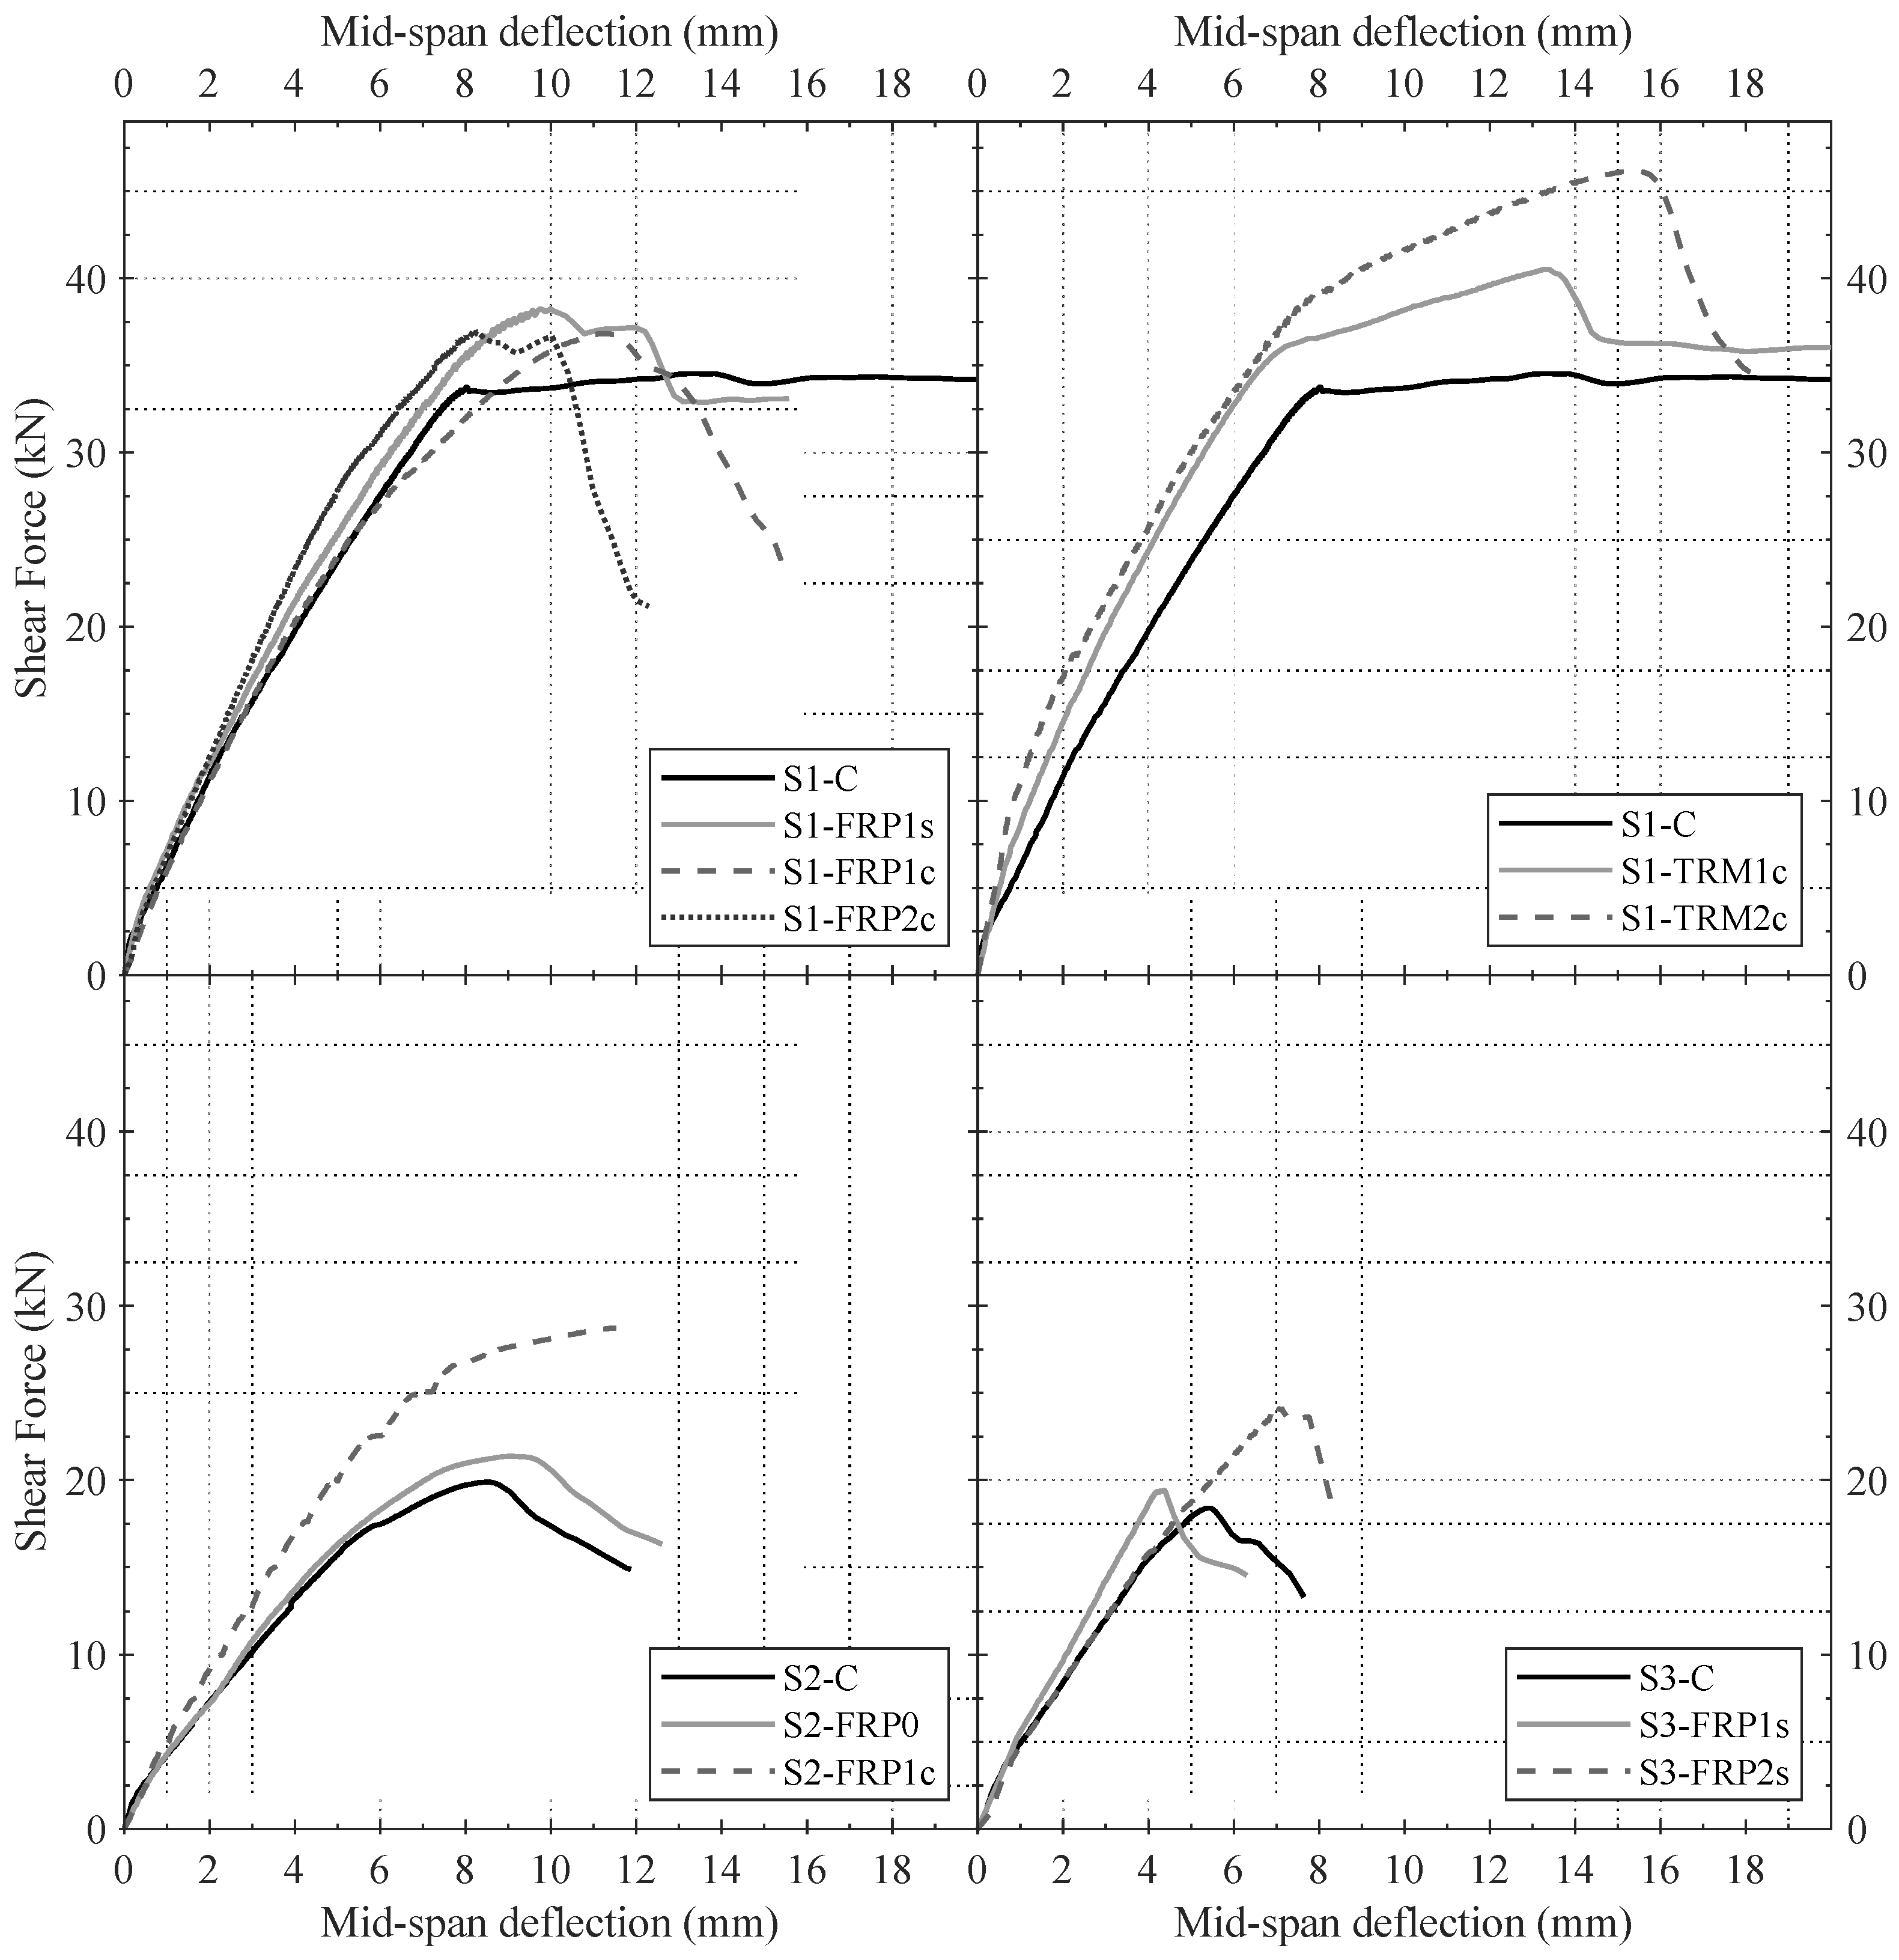
3.1. General Experimental Results

The results of the beam tests are summarised in Table 5 and the force-displacement curves are shown in Figure 4. The reported results include the maximum applied shear force (Vmax), the vertical mid-span deflection at the maximum shear force δmax, as well as the initial stiffness defined up to 0.4 Vmax (Ki). The relative differences (Δ) to the respective control specimen of the test series are also given for each specimen to ease comparison. Finally, the observed main crack angle(s) are also documented in Table 5.
Looking at the results of the three test series, the peak forces obtained in series 1 are significantly higher than the other two series. For the control specimens, the load capacity is 34.5 kN for S1-HS-LA-C, while it is 42.4% lower (19.9 kN) for specimen S2-HS-HA-C and 46.7% lower (18.4 kN) for specimen S3-LS-LA-C. The reason for the latter is due to the significantly reduced shear reinforcement provided (ρw = 0.19 vs. 0.38% for S1), while for the former, the reduction in strength is associated with the higher shear span-to-depth ratio (a/d = 3.6 vs. 2.9 in S1) as discussed in Section 3.4. Note that the presented results are influenced to a degree by the variation of concrete strength between some specimens. Moreover, the concrete strength of beam S1-C is 50% and 32% larger than the concrete strength of beams S2-C and S3-C, respectively. To consider this variation, a finite-element model was calibrated based on the experimental results and was used to assess the influence of concrete strength (Section 4.4.1). The critical experimental parameters (shear span and shear reinforcement) were then assessed through the FE model, removing the influence of concrete strength variation (see Section 4.4.2 and Section 4.4.3)

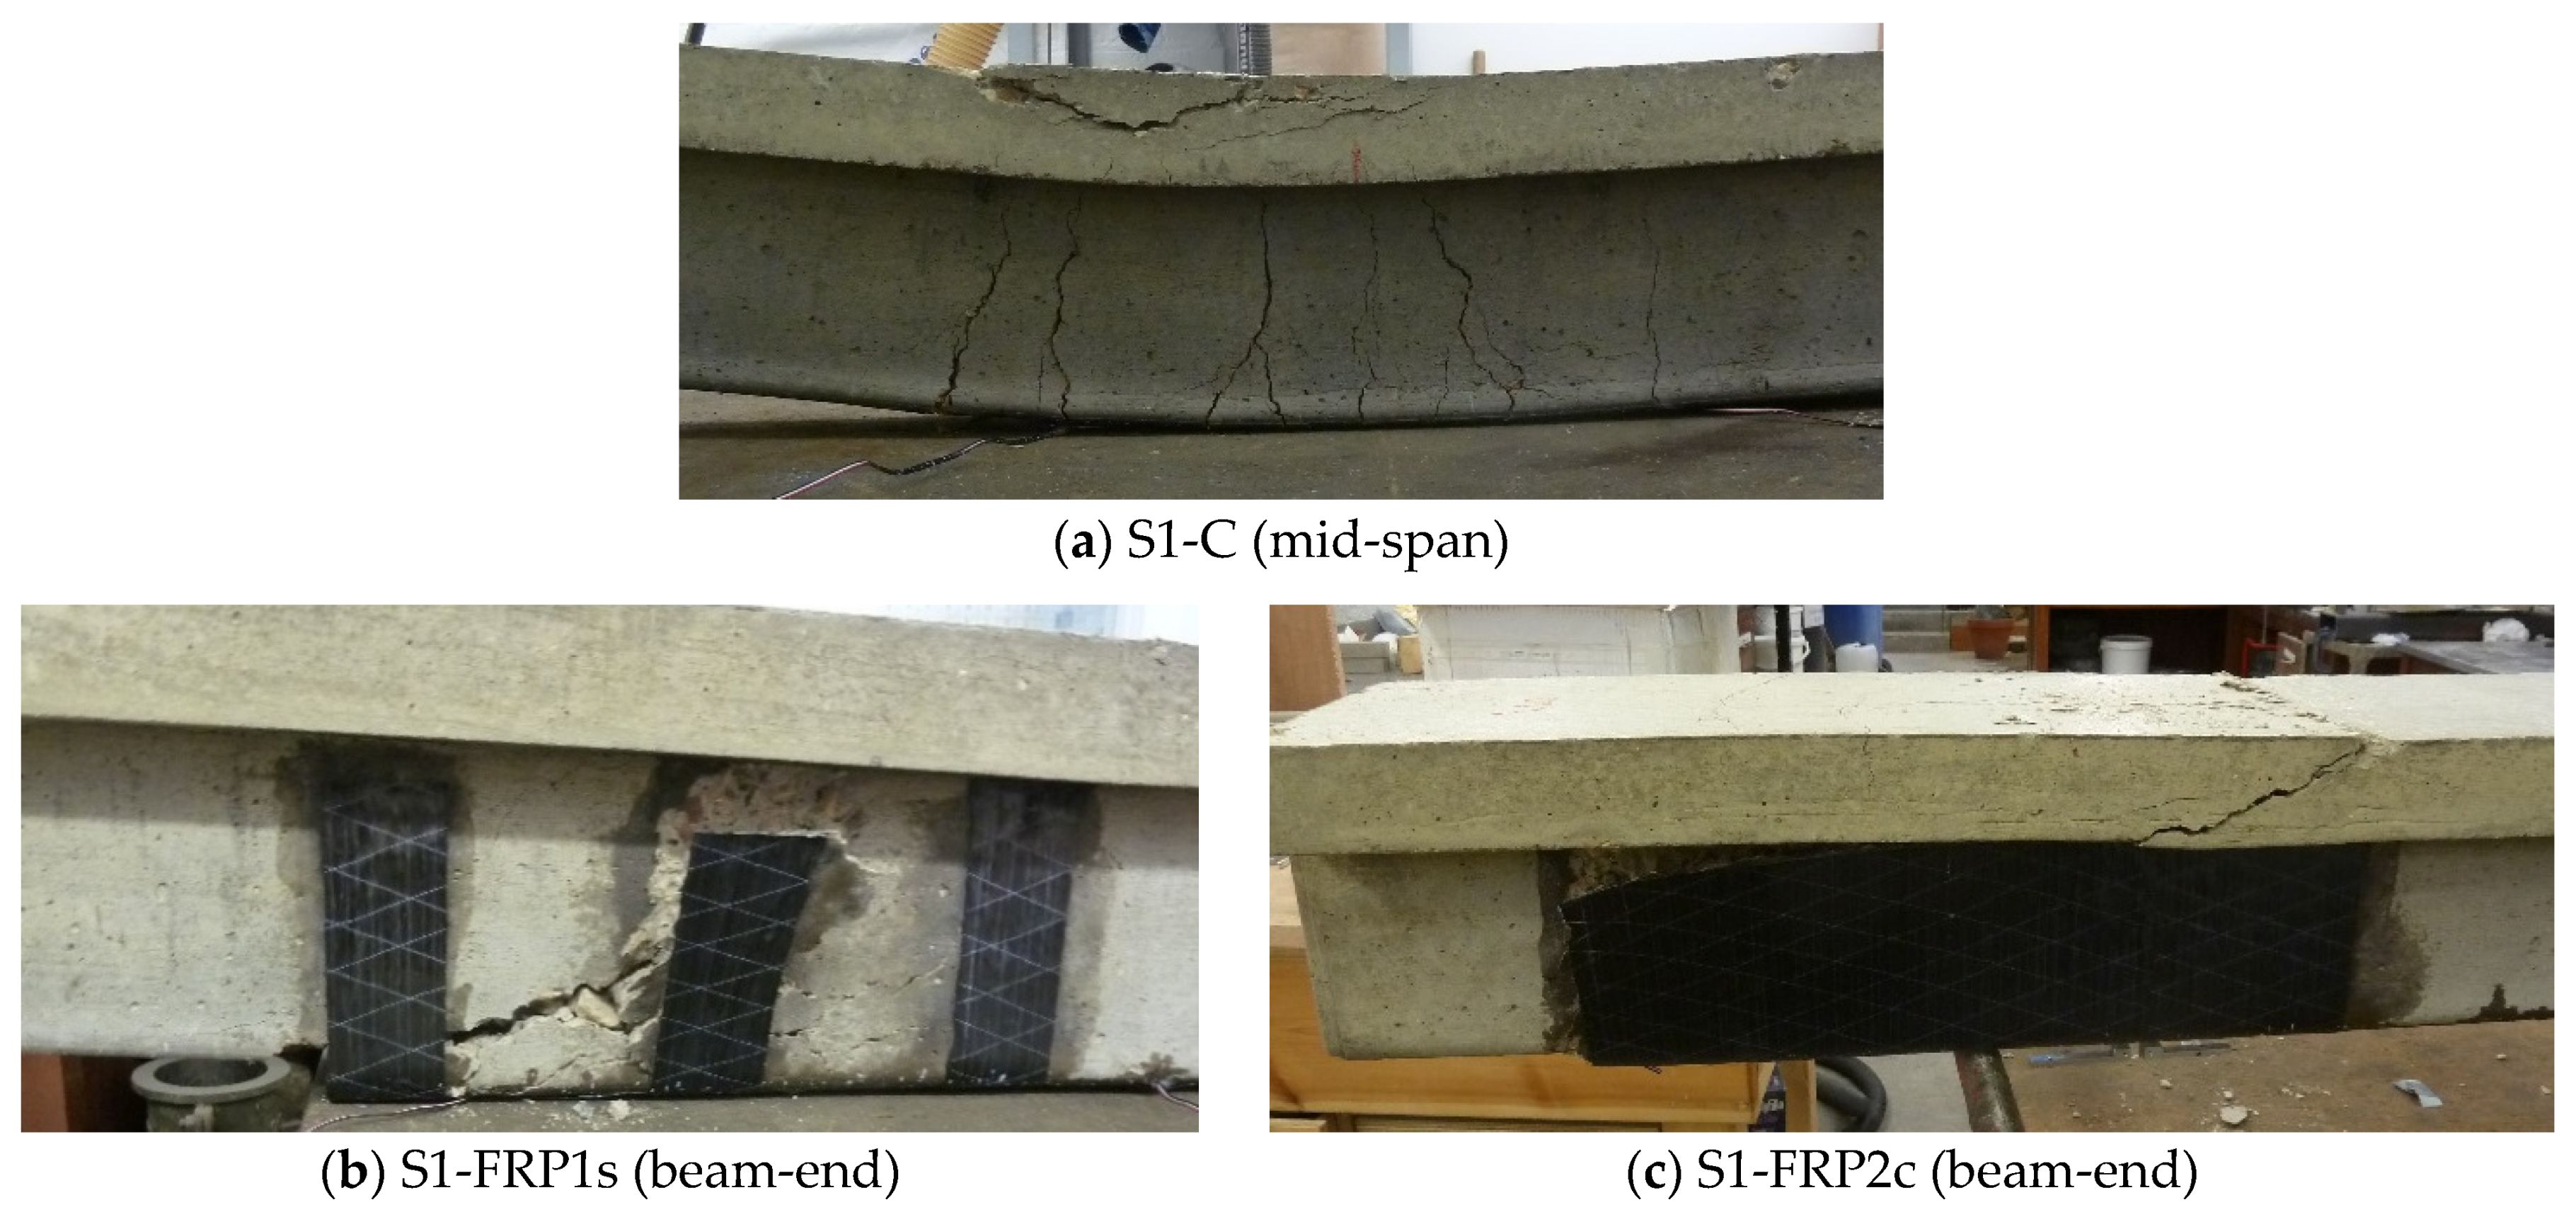
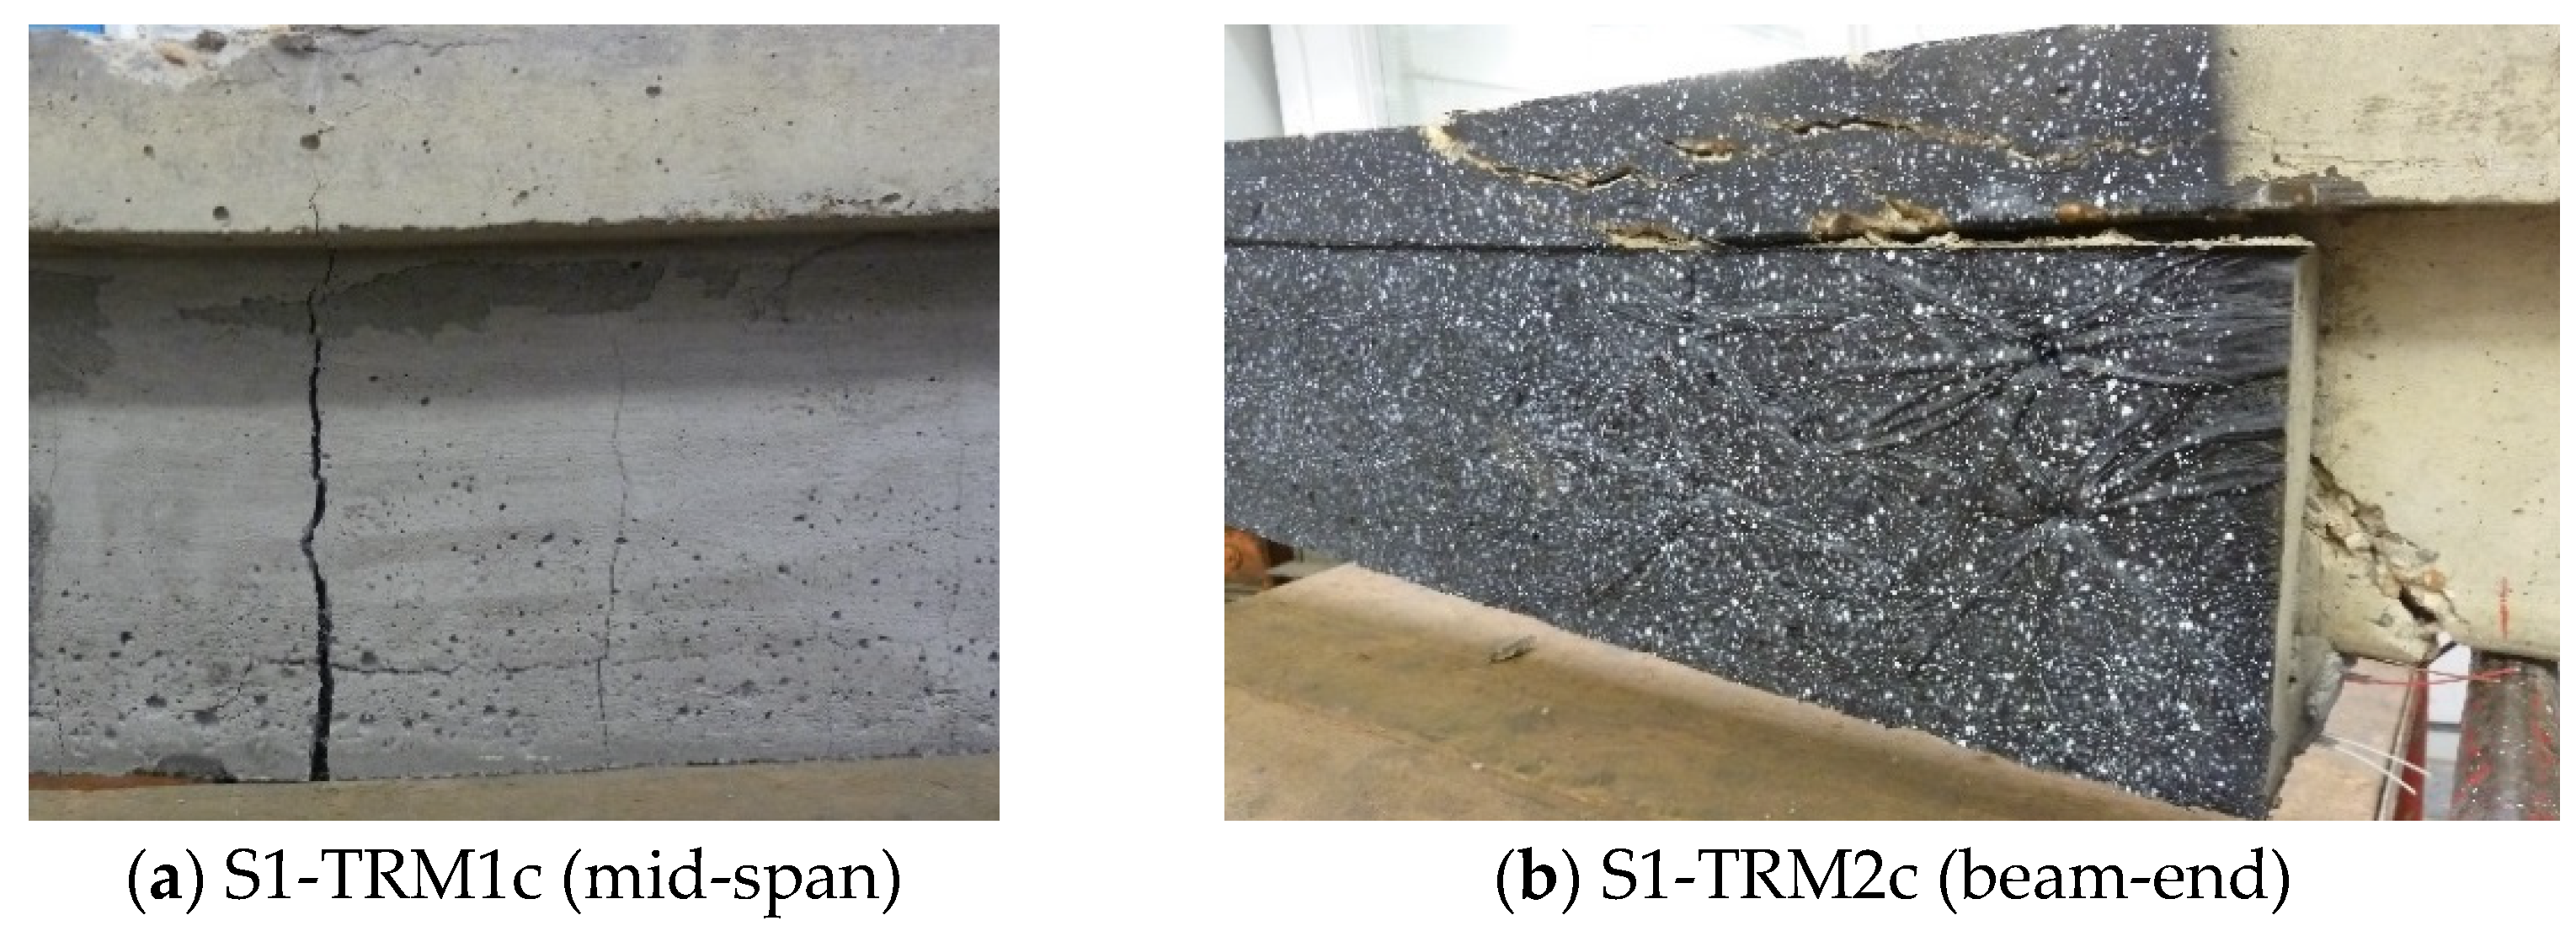
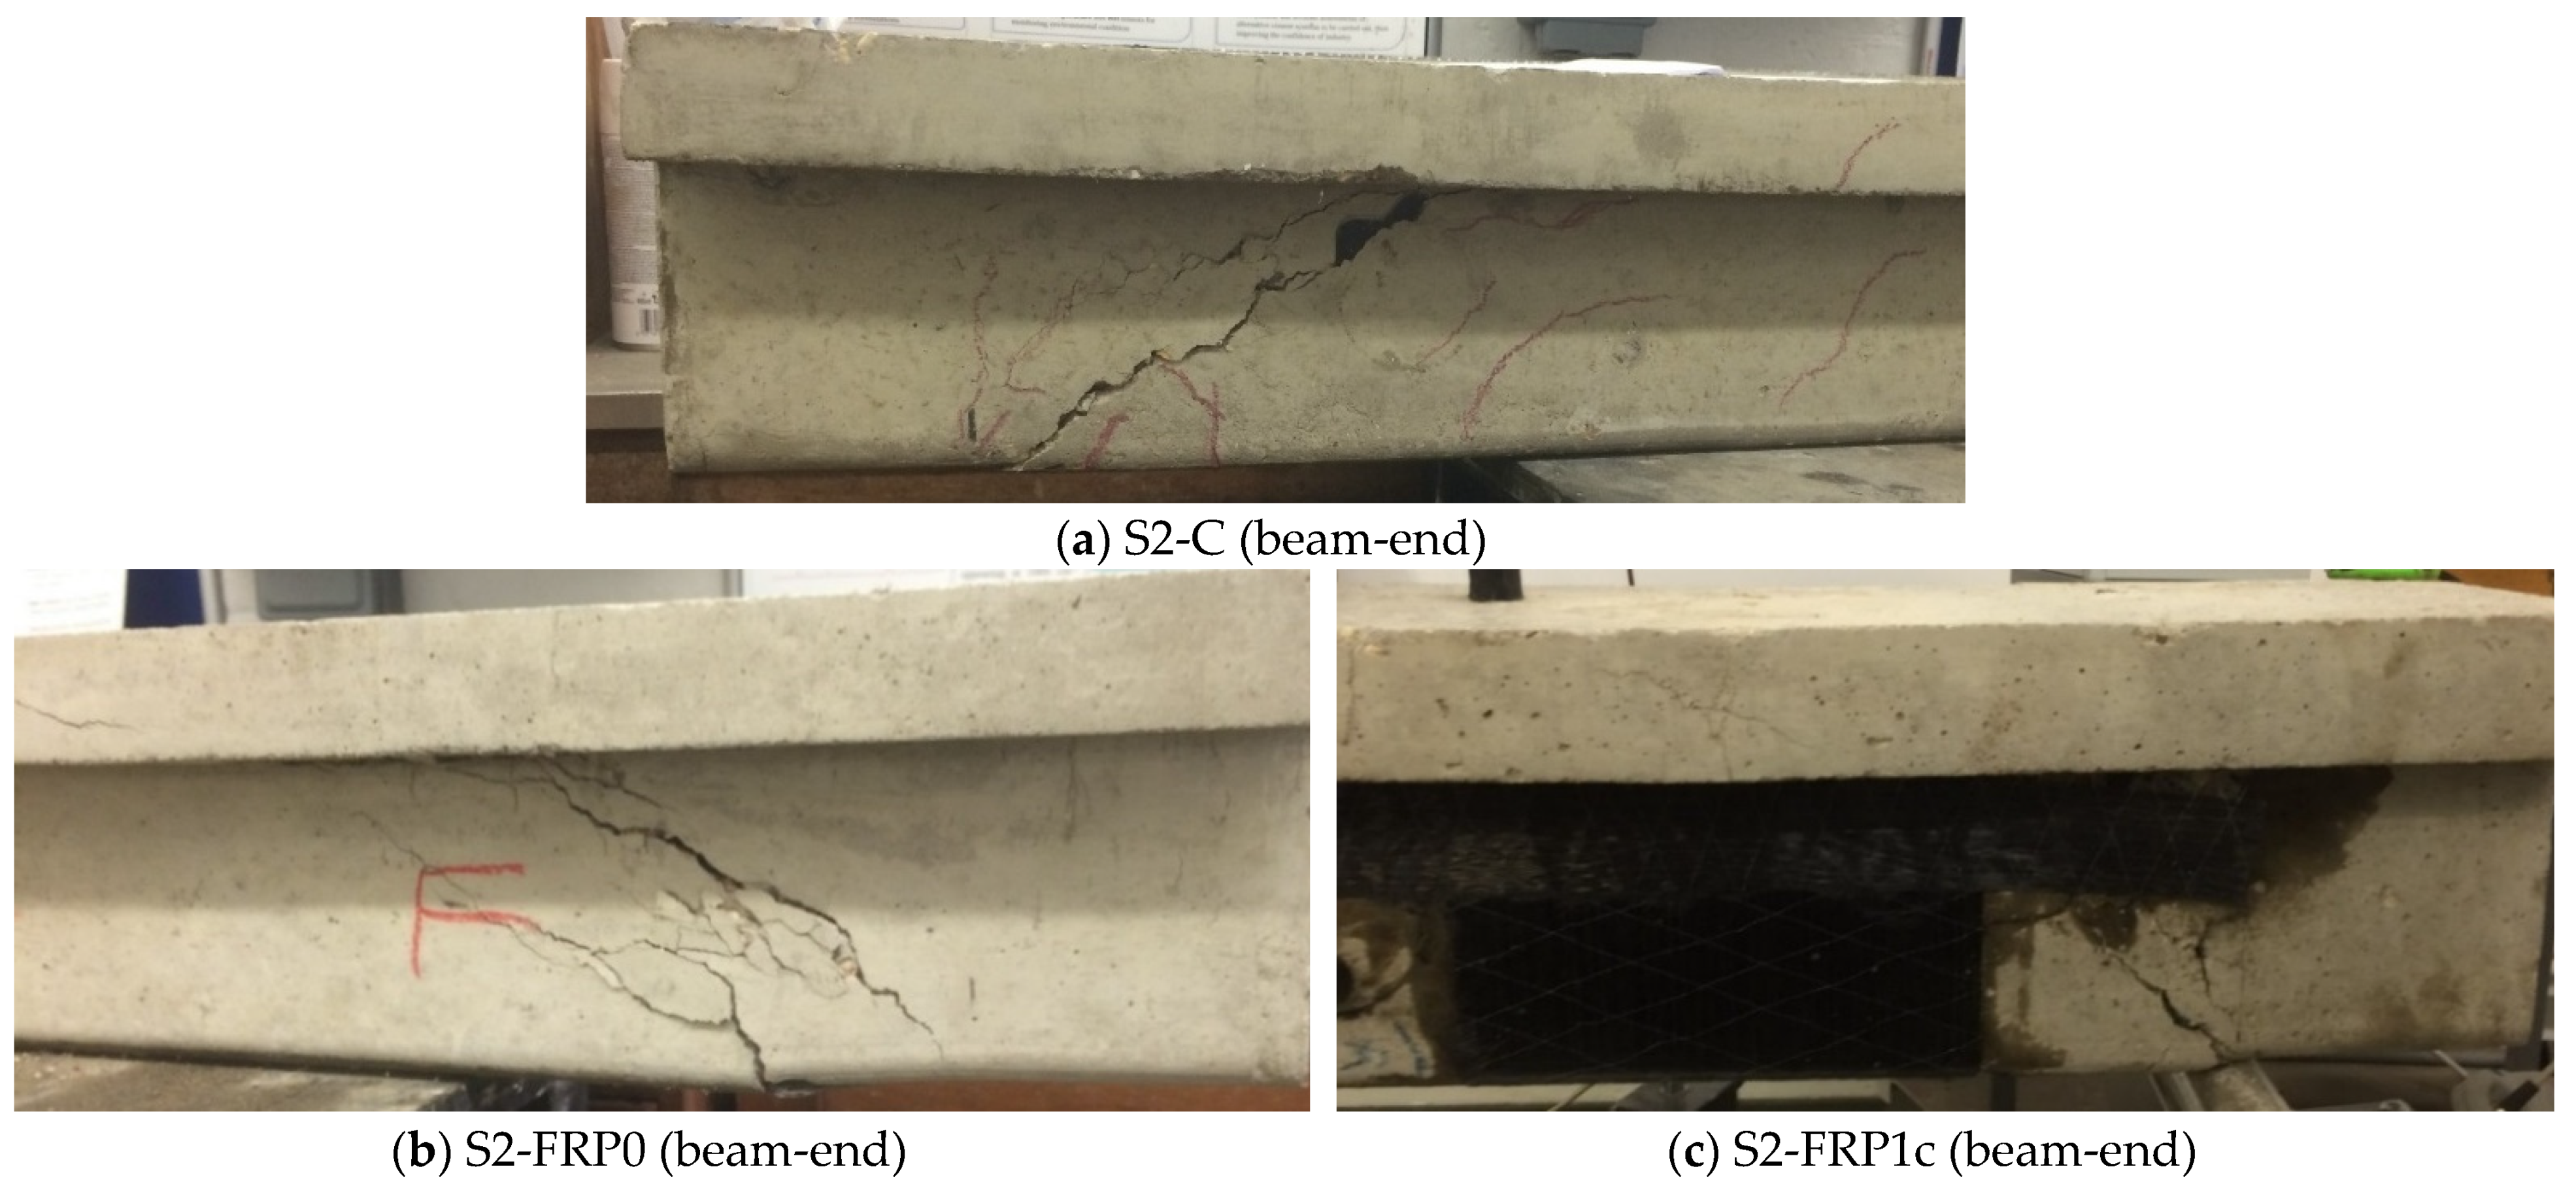
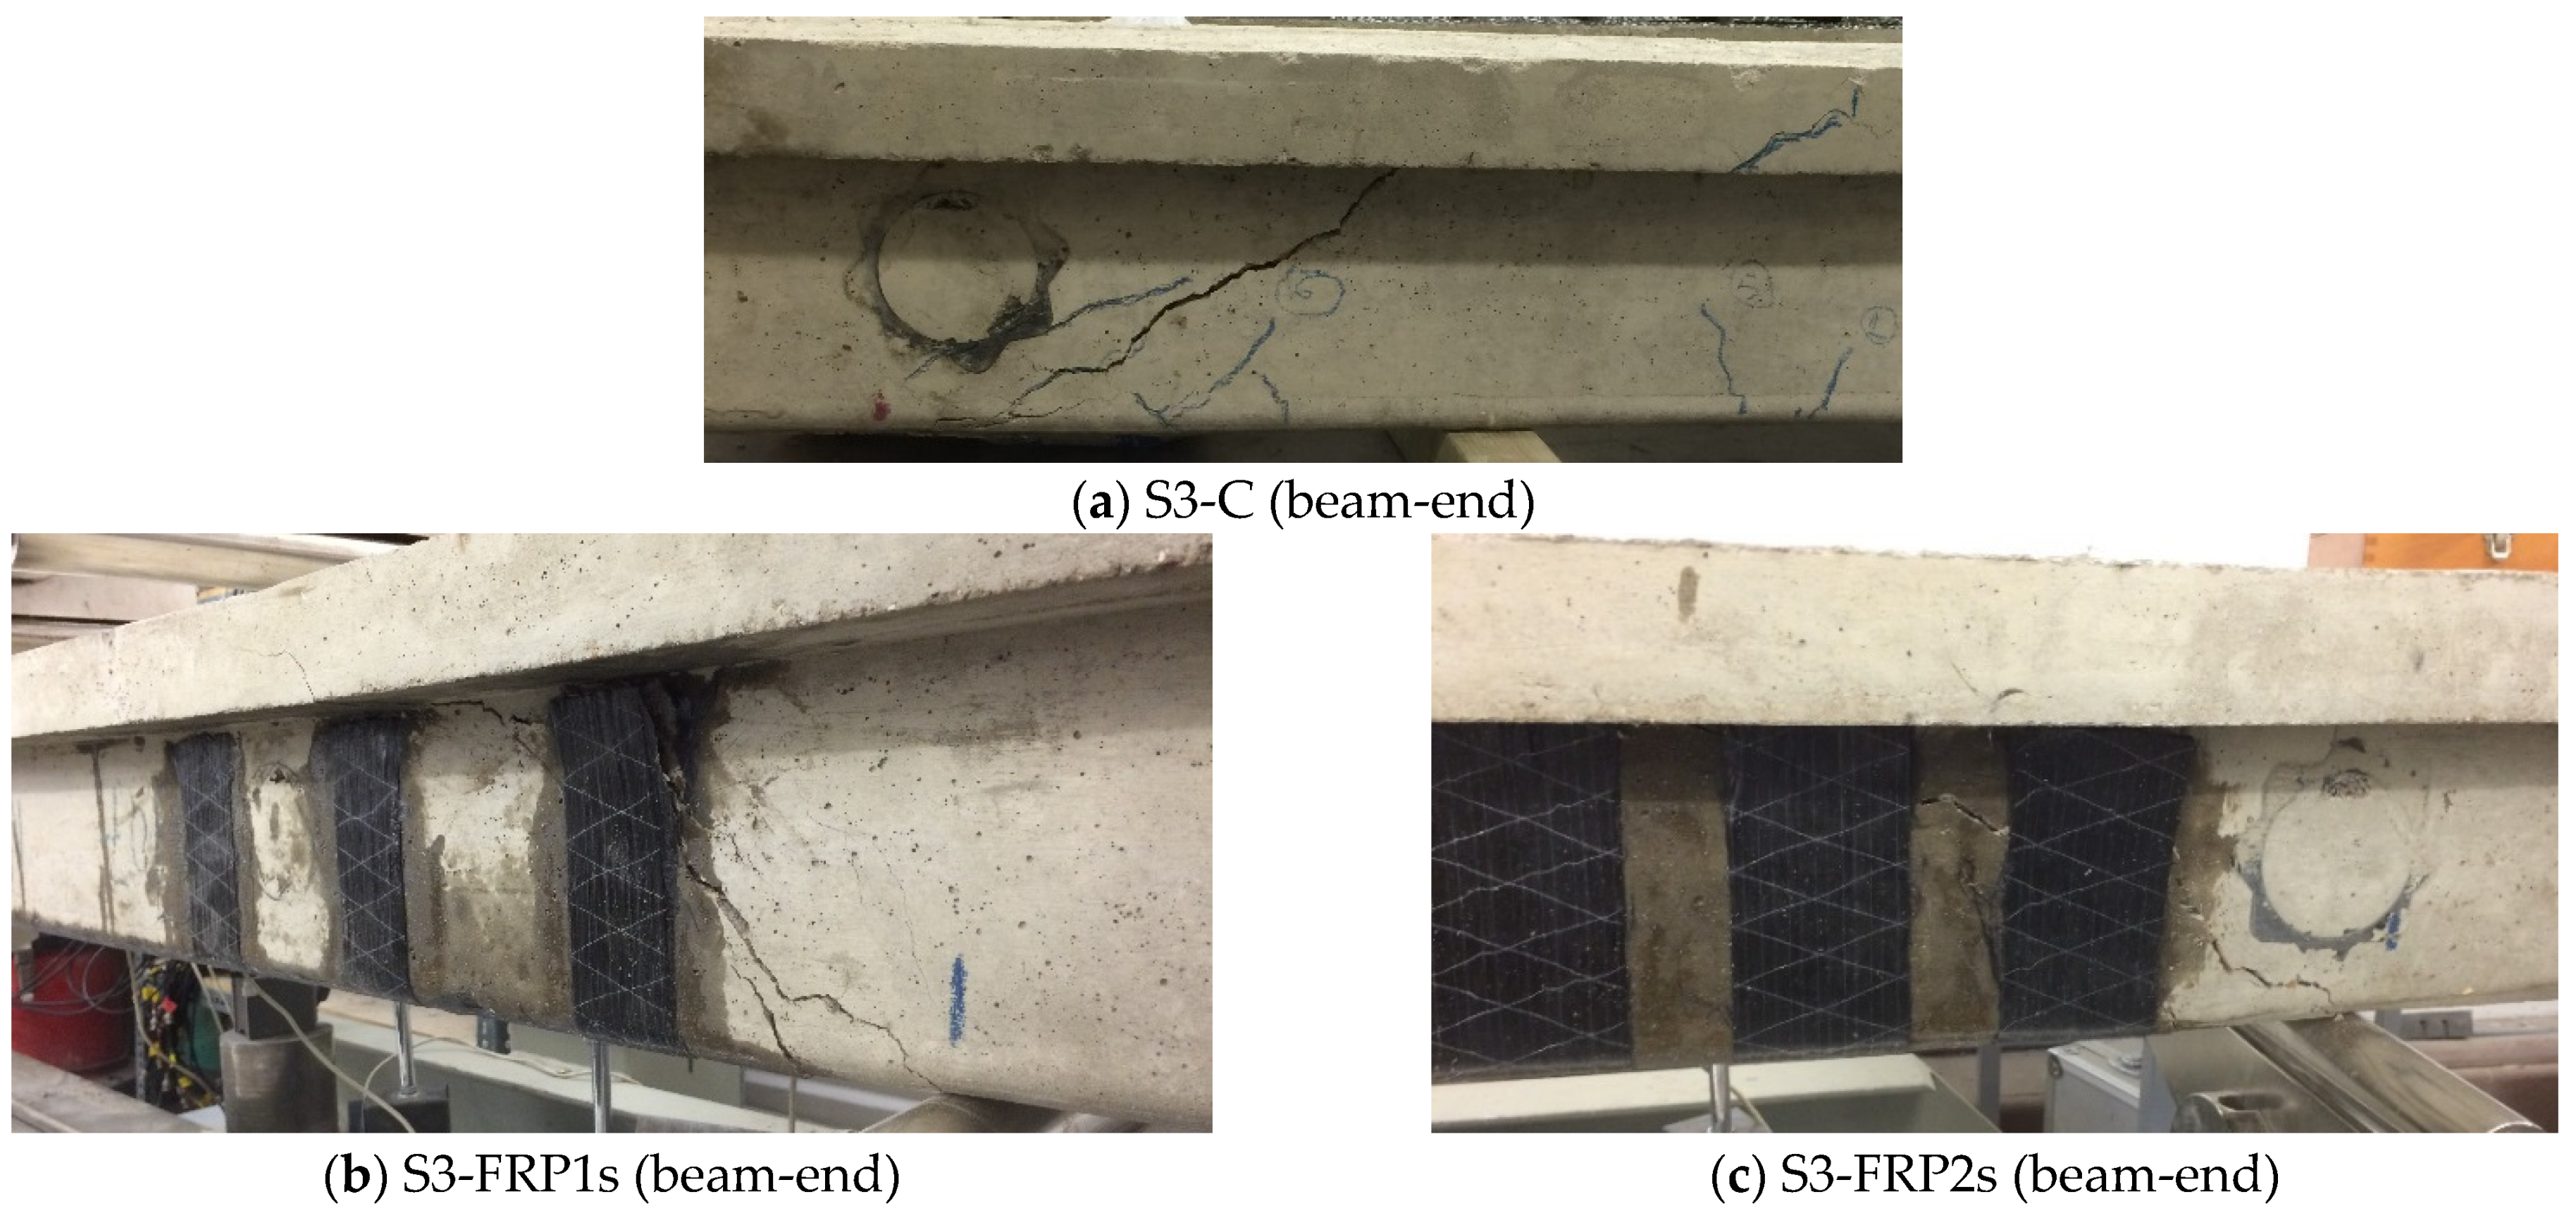
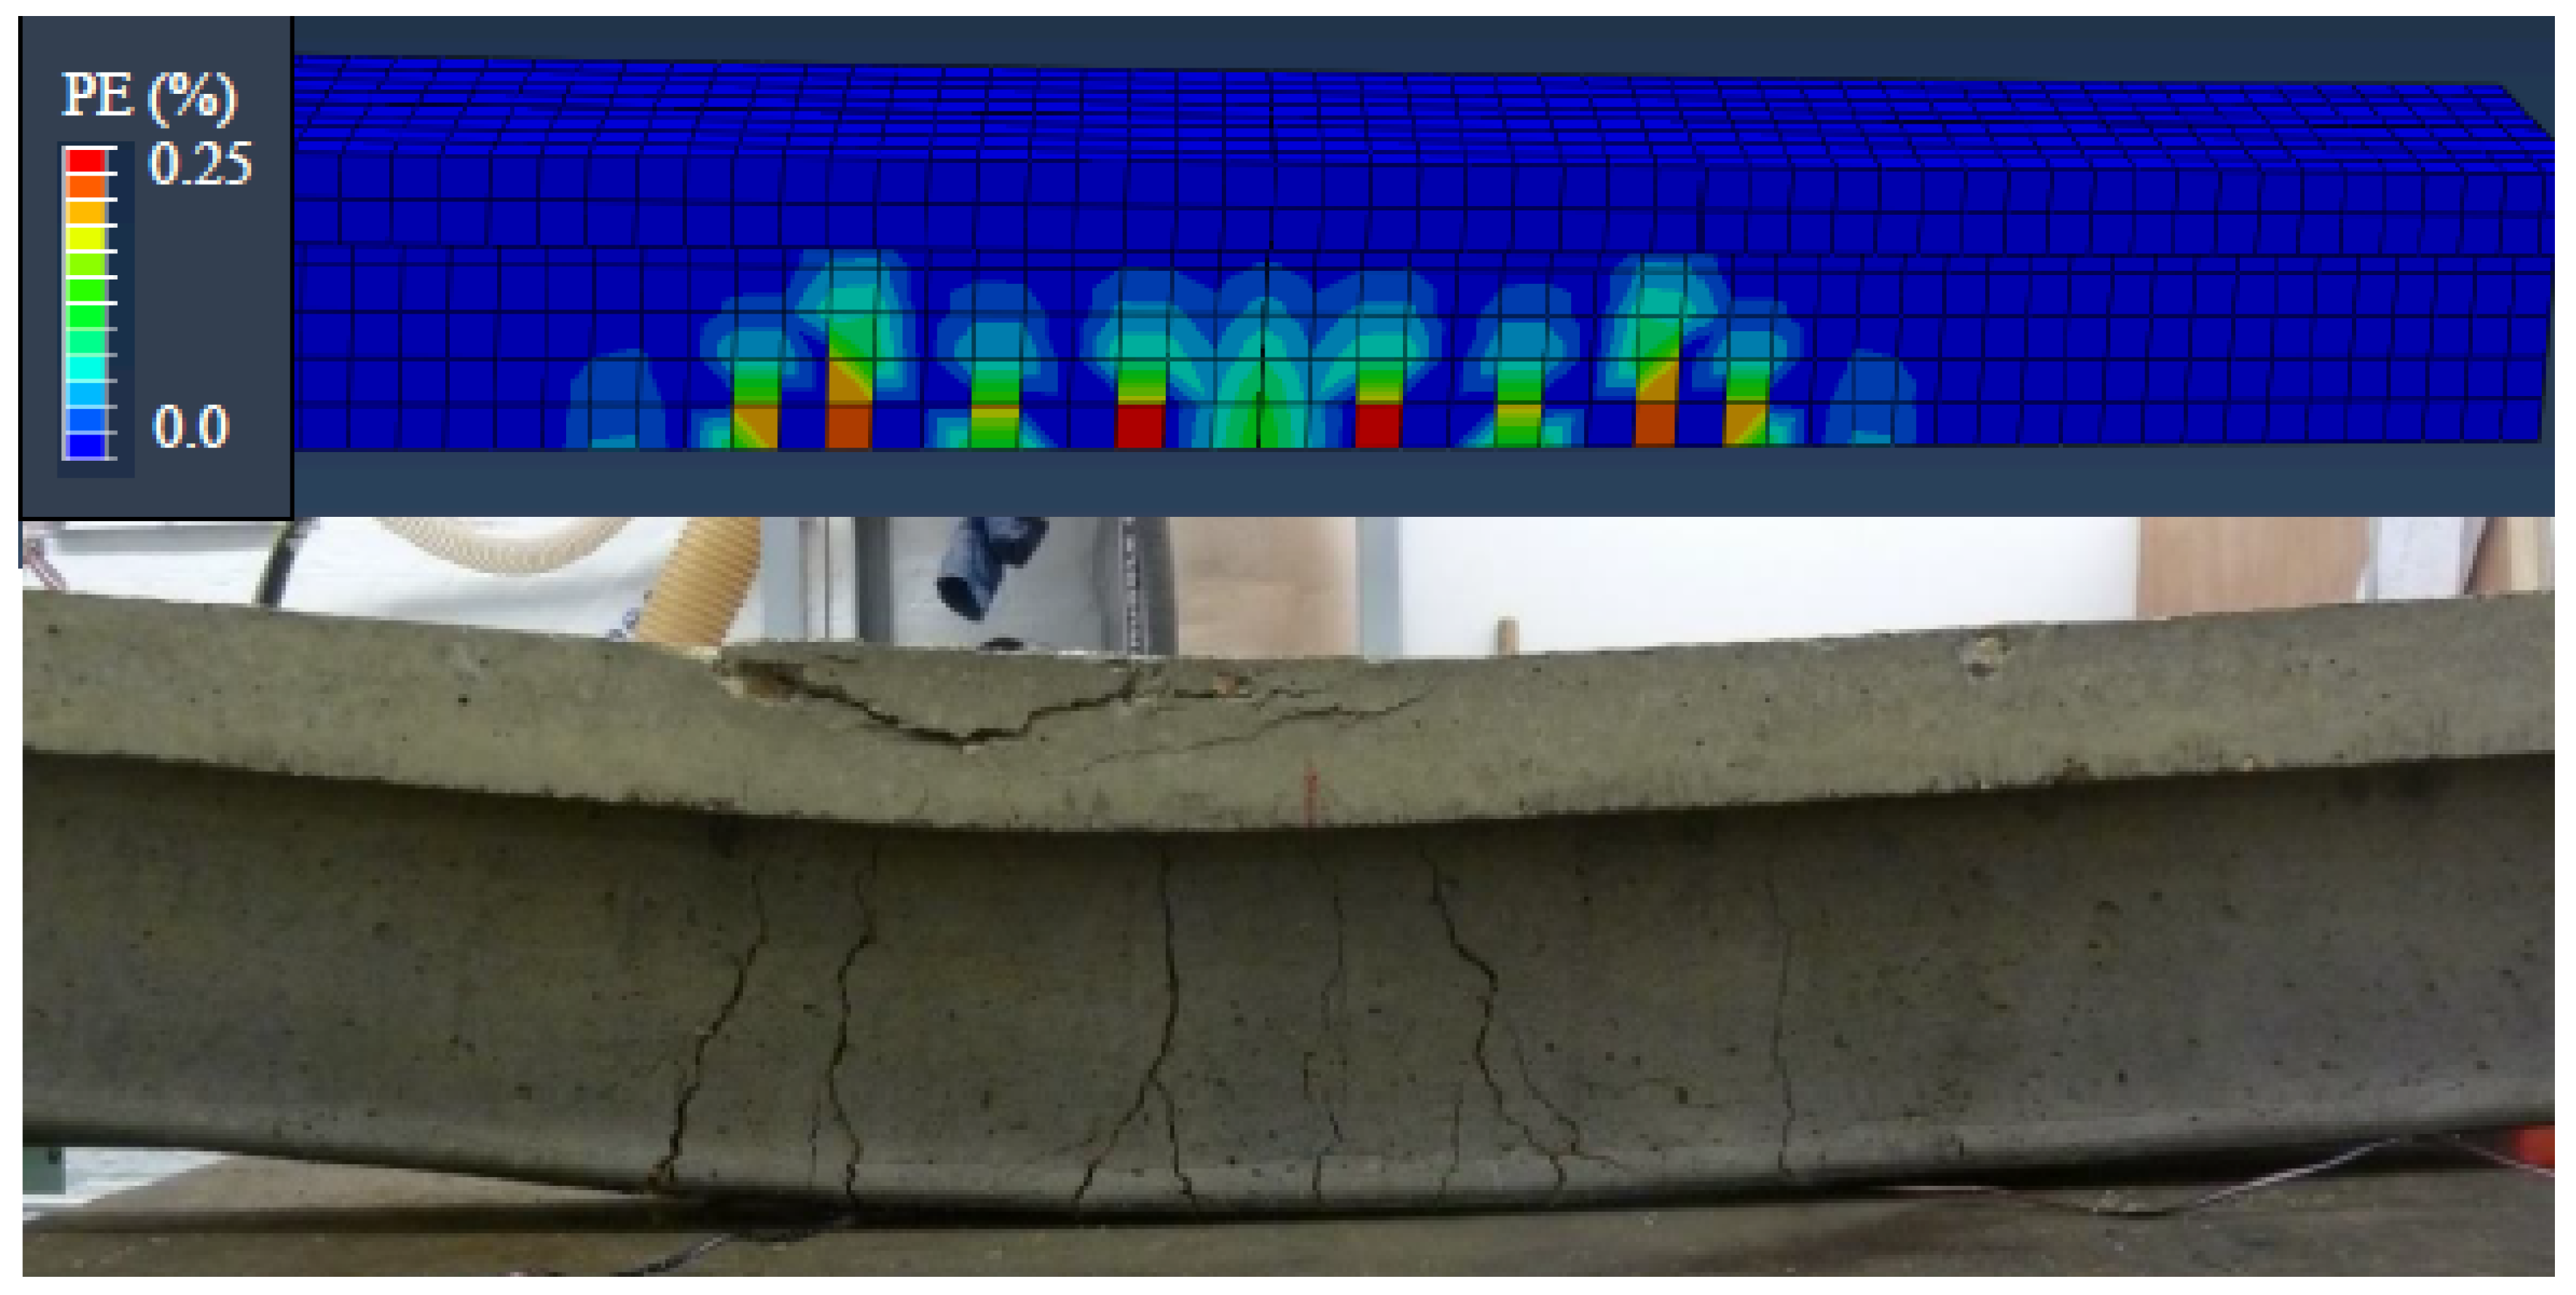
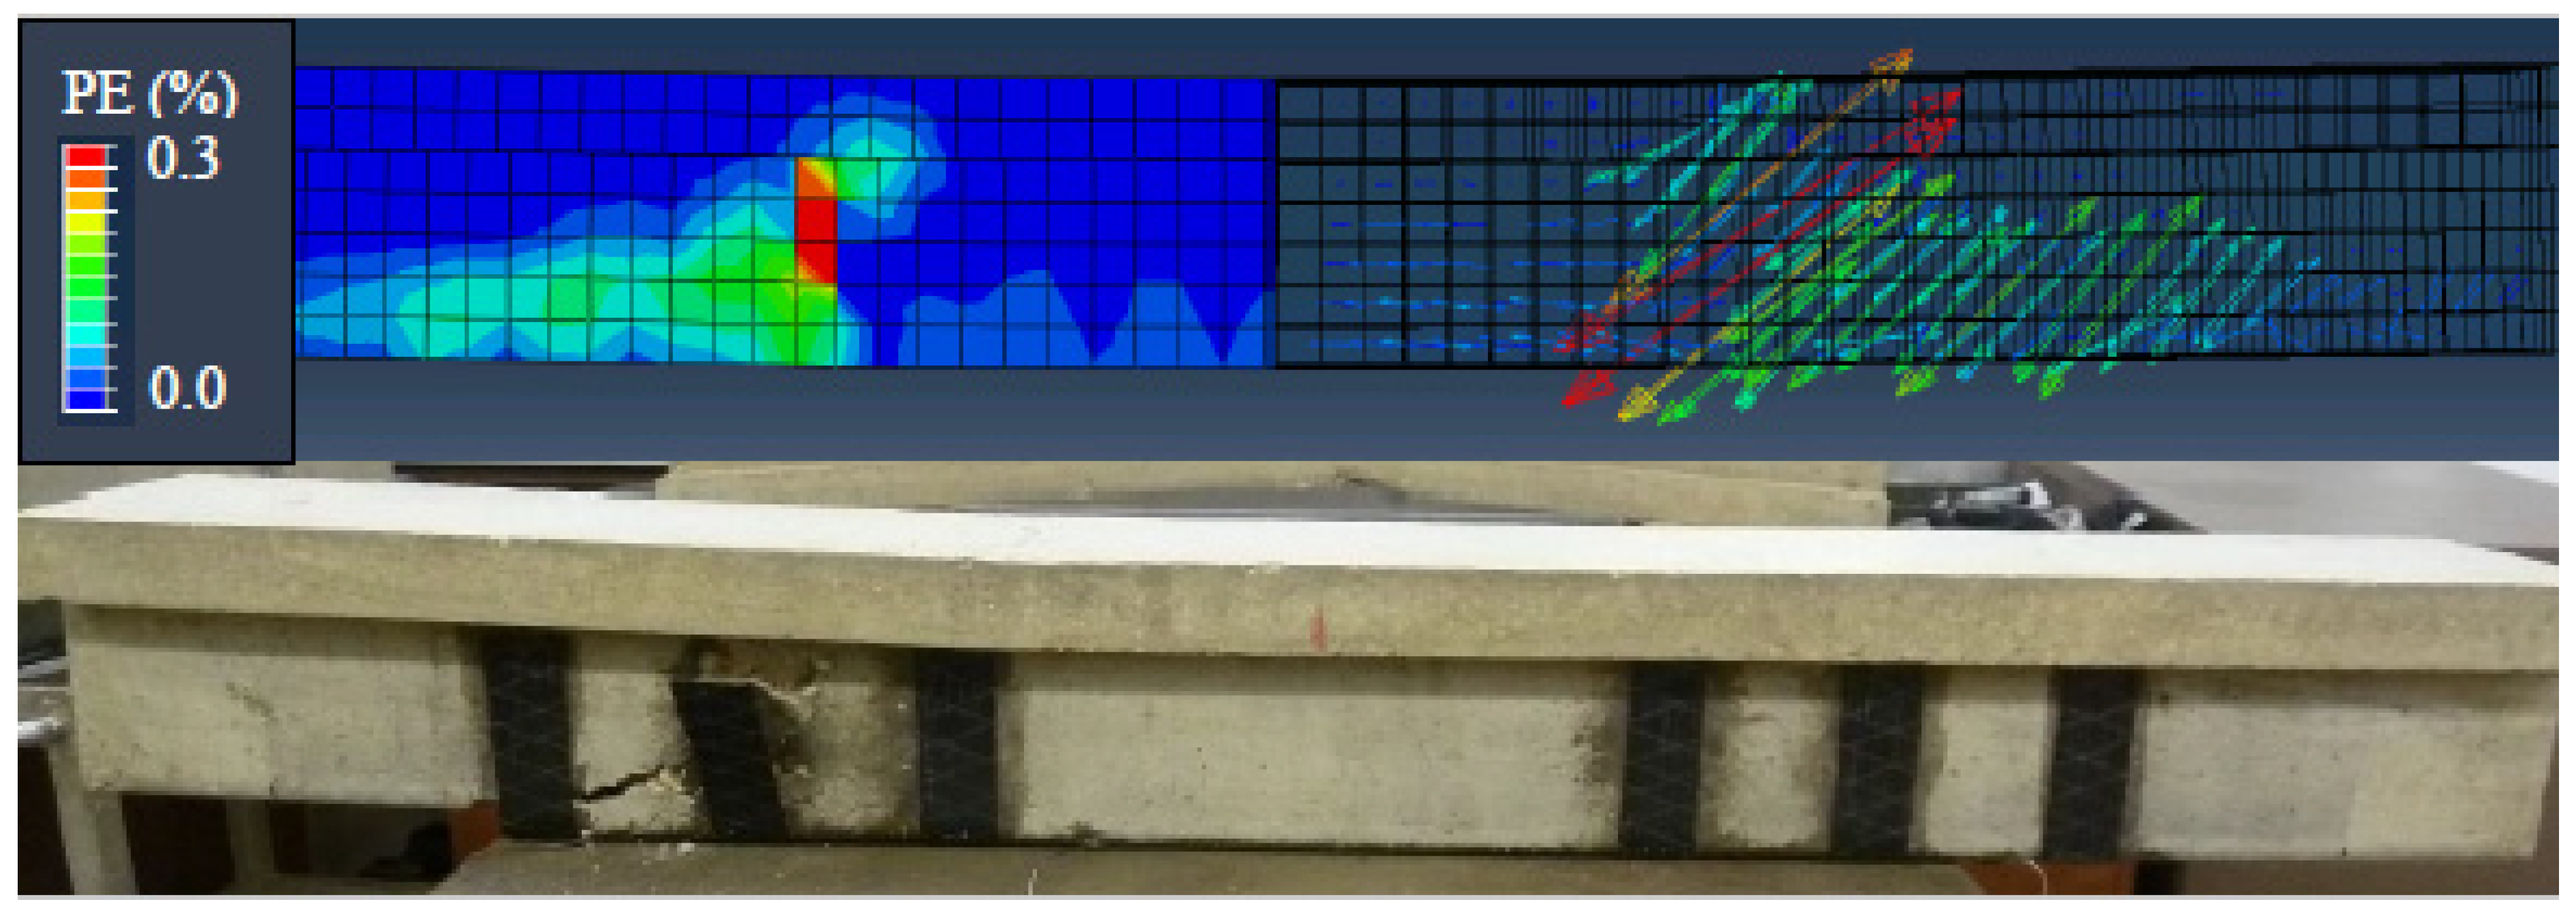
3.2. Observed Failure Mechanisms

The specimens were designed to represent beams that do not satisfy modern design rules, i.e., they have an inadequate hierarchy of strengths governed by a lower design shear capacity compared to their moment capacities, hence requiring shear strengthening (with FRP or TRM). All specimens were designed with a lower shear than flexural capacity according to Eurocode 2 [34] in order to be representative of old RC designs in which brittle shear-dominated failures can be observed. For the control specimens, this was however not the case for S1-C, which failed in bending, echoing observations of variability in the shear capacity of RC beams by other researchers [6]. Note also that the assumed concrete strength in the design was fcm = 25 MPa for all specimens, while the two specimens that failed in flexure had higher than expected concrete strengths. The effect of this is evaluated numerically in a later section.
Observation of failure modes indicates shear failures for all seven FRP-retrofitted beams. While the required effective bond length of the FRP was respected, debonding of the FRP U-wraps was observed; however, this was in the form of concrete cover peeling and not as delamination at the FRP-concrete interface. Detailed observations for the three test series are presented next.
In series 1, the control specimen failed in flexure, with a series of parallel cracks forming at the mid-span of the beam (Figure 5a). Moreover, concrete crushing at the flange was also observed. For the FRP-retrofitted specimens, instead, large diagonal shear cracking beneath the U-wraps was observed, together with the end-peeling of the concrete cover at the ends of the longitudinal FRP sheet. Both mechanisms are clearly visible in Figure 5b for specimen S1-FRP1s. The shear cracks formed along the diagonal between the point-load application and supports, causing debonding at the second (middle) U-wrap in S1-FRP1s, and debonding from the exterior corner of the continuous U-jacket in S1-FRP1c and S1-FRP2c, as shown in Figure 5c. The crack angles are very similar for all three specimens, with measured angles between 19 and 21°. In all cases, as can be observed in Figure 4, the strength increase was moderate (+10.8%, +6.6% and +7.0%, respectively) and the initial stiffness of the specimens was similar to that of the control specimen, with the exception of S1-FRP2c, with an increase in Ki of 14%. For this specimen, with increased flexural strengthening, the deflection at the maximum capacity, δmax, was the lowest (8.3 mm) of series 1, indicating a higher deflection control.
For the TRM-retrofitted specimens, despite a mechanical shear strengthening ratio in S1-TRM1c lower than S1-TRM2c, flexural failure was observed with a large flexural crack near the mid-span for S1-TRM1c, as shown in Figure 6a. For S1-TRM2c, as can be seen in Figure 6b, shear failure was observed instead, with a large shear crack opening underneath the TRM jacket causing debonding from the concrete substrate. The doubling in TRM jacket thickness clearly also affected the flexural strength of the specimen, which then had to withstand a much higher shear load. This caused the large shear crack opening and hence debonding at the top of the TRM jacket following the specimen’s failure. The crack angle was significantly steeper (37°) than the observed cracks in the FRP-retrofitted specimens. No shear cracks in the TRM jackets were however observed. This may be due to a less effective transfer of forces from the beam to the TRM in shear due to the thickness of the jacket. The strength increases to 40.5 kN (+17.4%) and 46.2 kN (+33.7%) were more substantial than for the FRP-strengthened counterparts. The significantly higher shear capacity despite a steeper crack angle indicates a different damage mode with the TRM retrofit related to the bi-directional mesh. It can also be noted that the TRM specimens present a significantly increased initial stiffness compared to the FRP specimens, with increases of +27% and +45% for one and two layers, respectively.
In series 2, with an increased a/d ratio, shear failure at the beam ends was observed for all three specimens, with shear cracking observed along the diagonal between the support and the load application (Figure 7). For specimen S2-FRP0, without FRP shear reinforcement, a strength increase of 7.5% was observed, but the failure mimicked that of the control specimen S2-C. In Figure 7b, a near-parallel shear crack originating from the end of the flexural FRP-reinforcement, caused by the end-peeling of the FRP, was also observed, with the angles of the two cracks (29 and 34°) being close to that of the control specimen (32°). In the specimen with continuous FRP shear strengthening (S2-FRP1c), the shear crack was found to be much steeper (39°) than in the other two specimens, likely due to the FRP strengthening resisting crack formation in the diagonal between support and load application. Some debonding of the FRP U-jacket was also observed; however, it did not limit the capacity of the beam, for which a shear strength increase of +44.2% (28.7 kN) and an increase in initial stiffness of +25% were observed compared to the control specimen S2-C.
In the final series, in which the effect of reduced steel shear reinforcement was investigated, shear failure was observed for all specimens, as shown in Figure 8. For the retrofitted specimens with a single shear strengthening amount (S3-FRP1s), a low shear strength increase to 19.4 kN (+5.4%) was observed, while the specimen with double the shear strengthening (S3-FRP2s) displayed a much larger strength increase to 24.2 kN (+31.3%). Cracking was observed to follow a steeper angle than in the specimens of series 1, with an increased crack angle for the two retrofitted specimens (29 and 33°) compared to the control specimen (27°). In both retrofit specimens, shear failure beneath the FRP jackets with limited end-debonding of the FRP U-jacket was observed, similarly to the FRP specimens in series 1. The debonding was however predominant in the jacket closest to the support, with a steeper (33°) and more staggered shear crack formation compared to the control specimen.

3.3. Interaction between Flexure and the Shear Capacity

To assess the effect of FRP flexural strengthening on the effectiveness of FRP shear strengthening, two sets of experiments were compared. For the beams of series 2, S2-FRP0 and S2-FRP1c, the former was only retrofitted in flexure, while the latter was retrofitted with continuous U-wrapping (ρfw = 0.45%). While the shear strength increase in beam S2-FRP1c was 44.2% compared to the control specimen, it was 7.5% for the specimen without shear strengthening. This could indicate that up to 17% of the shear capacity increase in S2-FRP1c may have stemmed from the longitudinal FRP application alone, which echoes previous observations that flexural strengthening positively affects shear strengthening [25]. This may be explained by an increase in the neutral axis depth of the beam, hence increasing the area of concrete in the compression zone that can resist shear. Note however the aforementioned difference in concrete strength between S2-FRP0 and S2-FRP1c, which of course also affects their shear capacity.
For beams S1-FRP1c and S1-FRP2c, instead, the same continuous U-wrapping was applied with geometrical FRP shear strengthening ratio, ρfw = 0.45%, but the latter beam had a double layer of FRP flexural strengthening (ρfl = 0.25% compared to 0.12% for S1-FRP1c). In both cases, the shear strength increases were however similar (6.6% and 7.0%), hence not indicating any effect of the FRP flexural strengthening on the effectiveness of the shear strengthening. The larger amount of longitudinal FRP in beam S1-FRP2c also led to better deflection control, with a lower vertical deflection at peak force (8.3 mm vs. 11.2 mm). This in turn would lead to a lower strain in the longitudinal FRP. This was indeed observed in the strain readings at mid-span for the two specimens, with a maximum FRP strain of 0.41% for beam S1-FRP1c, with less longitudinal FRP, but only 0.26% for beam S1-FRP2c. The reduced deflection may hence counteract the change in the neutral axis depth observed in previous experiments [25].

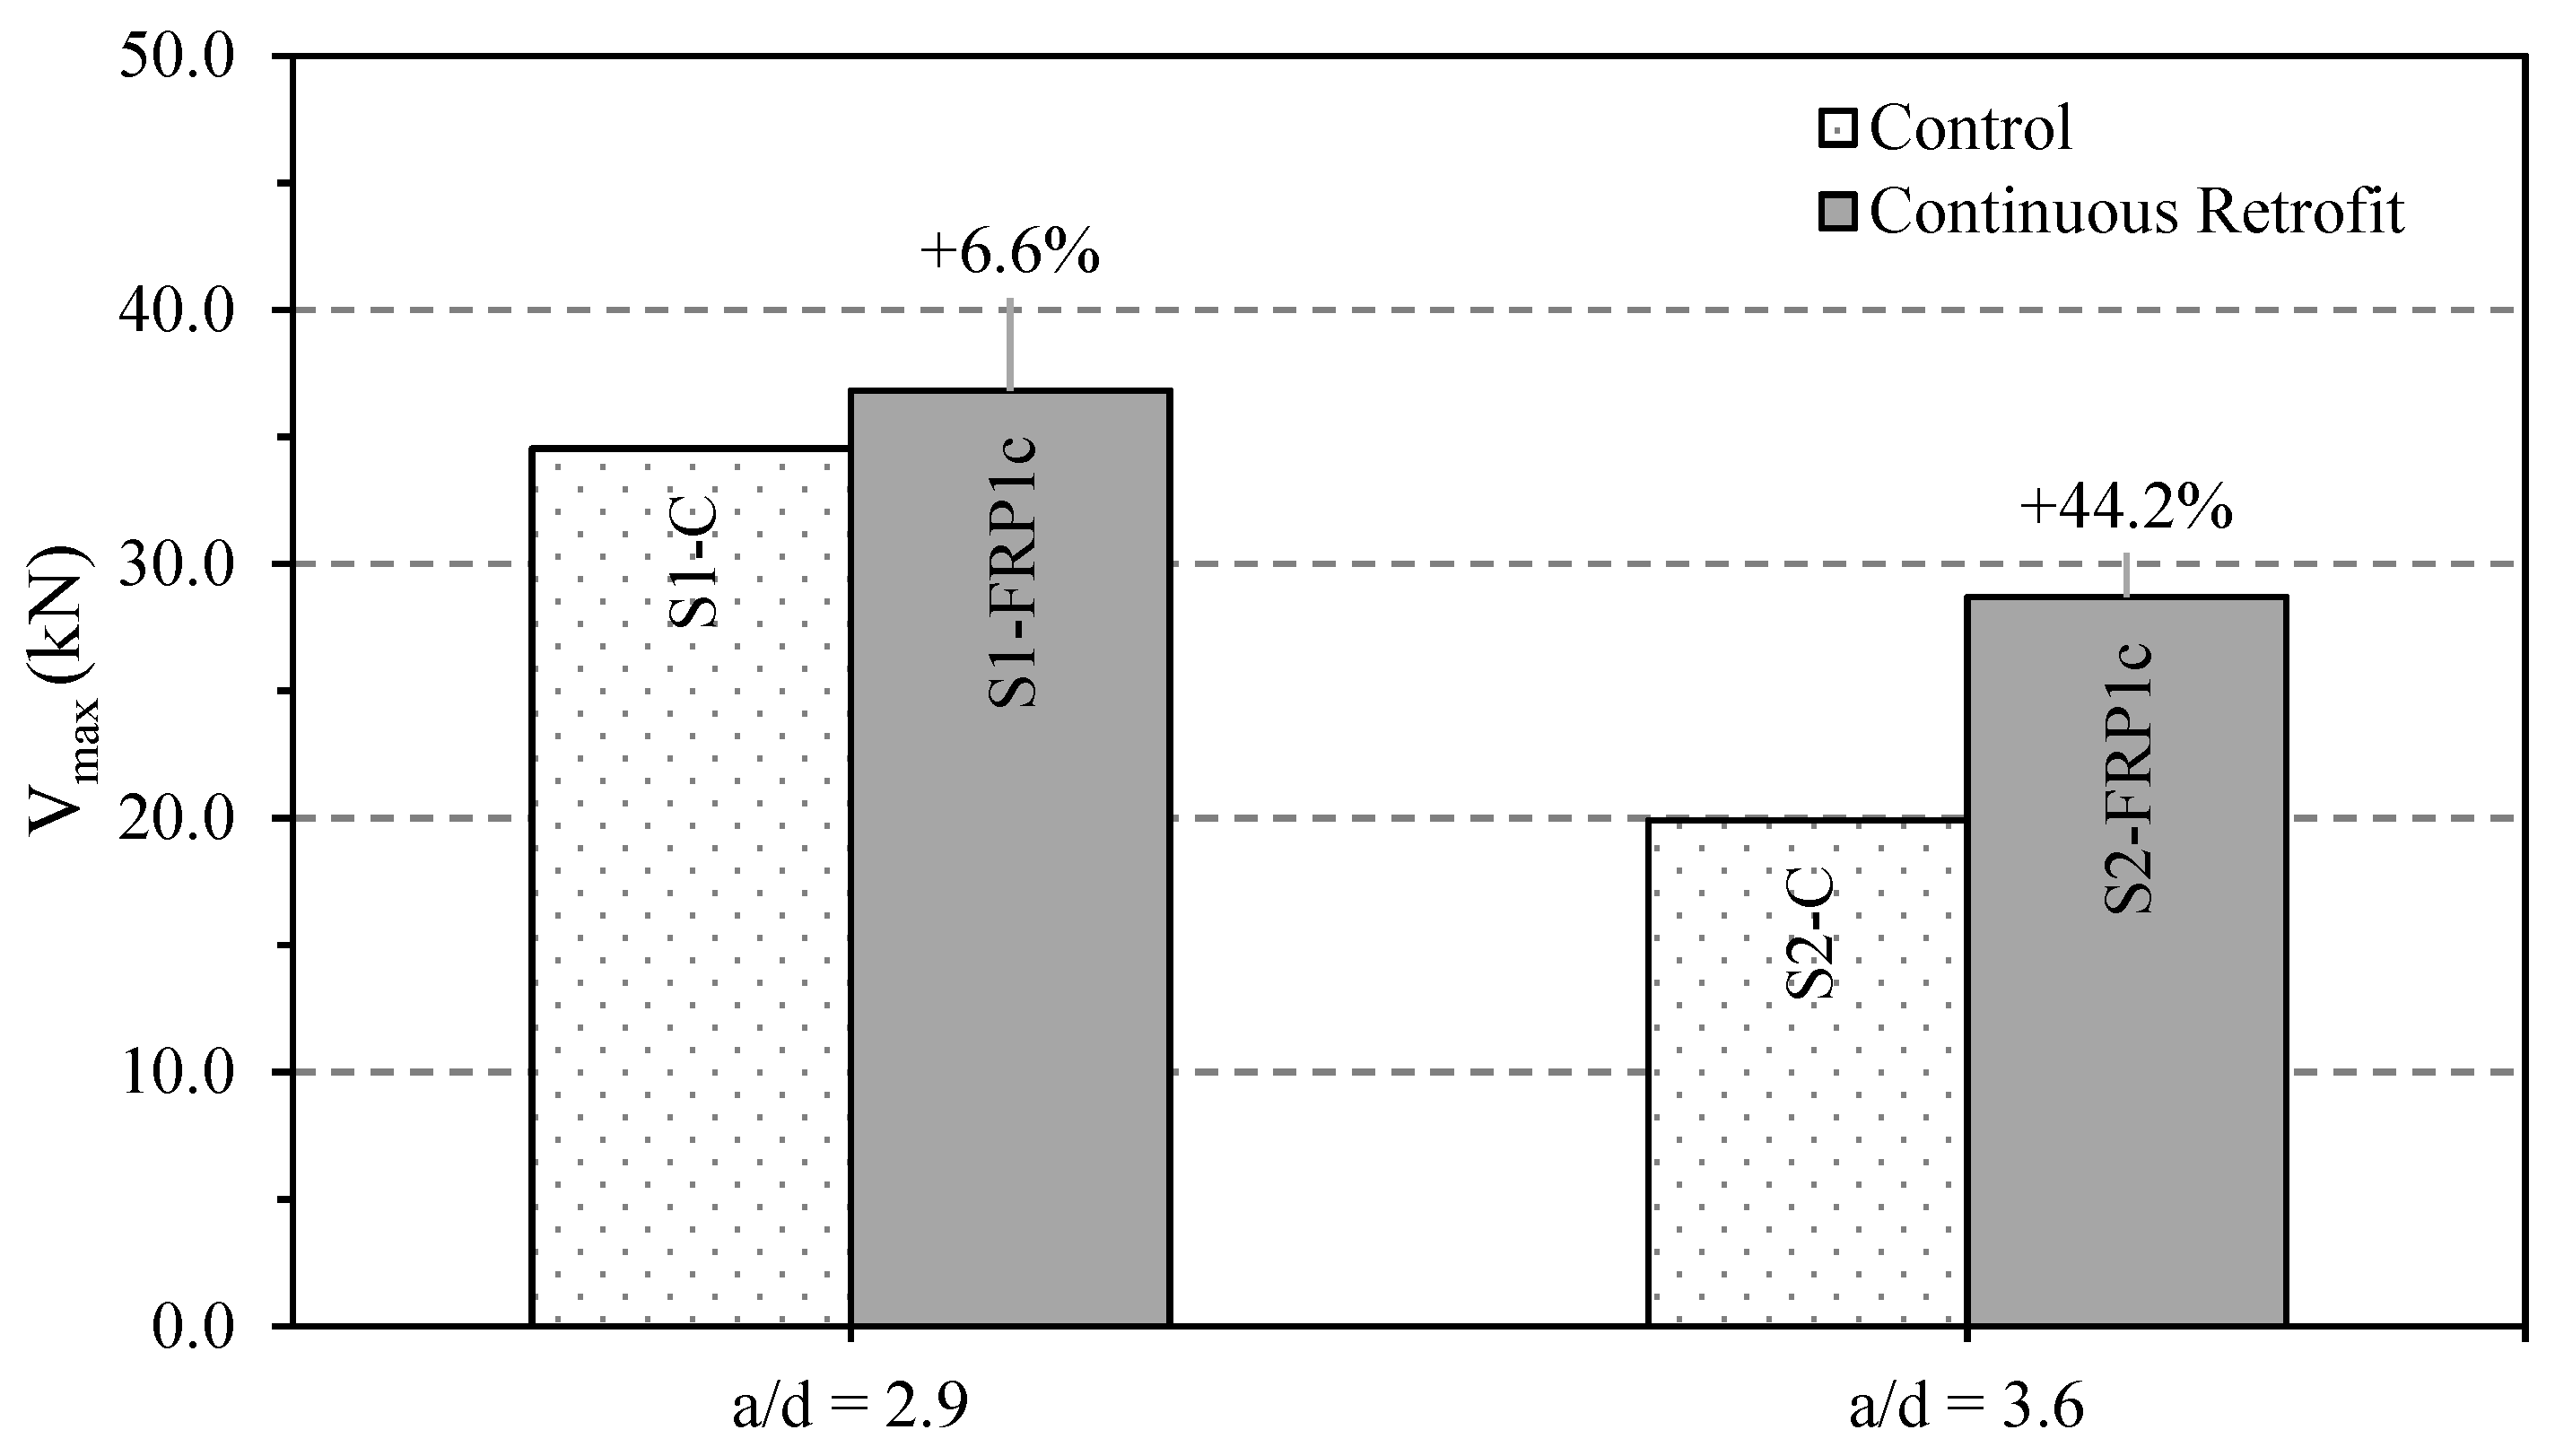
3.4. Effect of Shear Span to Depth Ratio

Comparing the two sets of beams with different shear span-to-depth ratios, S1 and S2, the effect of the longer shear span can be assessed (see Figure 9). In terms of the control specimens with the same RC design (HS), the shear force at maximum (Vmax) was 34.5 kN for S1-C, while it was 42.4% lower (19.9 kN) for specimen S2-C with a higher a/d ratio. Note that specimen S1-C was the only control specimen that did not fail in shear; the actual shear capacity is hence slightly larger. On the other hand, the shear capacity of specimen S1-FRP1c may have been lower, given the lower concrete strength, as will be analysed in Section 4.3.
The effect of reduced shear capacity with increased shear span is generally observed in the literature [40]. It can be explained by the formation of a concrete arch, i.e., a more pronounced share of the shear resistance being transferred via a diagonal compression strut for beams with a smaller a/d.
As shown in Figure 9, for the retrofitted beams S1-FRP1c and S2-FRP1c, with an equal amount of FRP shear strengthening but a difference in shear span, the strengthening effectiveness was significantly larger for the beam with the higher a/d ratio. For beam S2-FRP2c with a/d = 3.6, the increase in strength was the highest (+44.2%), while for beam S1-FRP1c (a/d = 2.9), the strength increased only by +6.6% compared to the control specimen.
The observation of higher strengthening effectiveness for higher a/d ratios echoes recent results reported in the literature for SRG-retrofitted beams [16], in which the strength increase doubled for beams with a/d = 2.6 compared to beams with a/d = 2.1. Similar trends were observed for TRM [12] and FRP-strengthened beams [5]. Generally, for low a/d, the concrete arch takes a more significant part of the loading, hence reducing the tensile FRP shear contribution.

3.5. Effect of Transverse Steel Reinforcement Ratio

By looking at beam S1-FRP1s in comparison with beams S3-FRP1s and S3-FRP2s, the effect of different amounts of shear steel reinforcement can be assessed. In the beams of series 3 with a low level of shear reinforcement (LS), the shear steel reinforcement ratio is half of the beams in series 1. For beams S1-FRP1s and S3-FRP1s, the geometrical FRP shear strengthening ratio, ρfw, is similar, with 0.13% and 0.14%, respectively. The obtained increase in shear strength is however double for the specimen from series 1 (+10.8% vs. the control beam) compared to that of series 3 (+5.4%), indicating a higher retrofit effectiveness for the beam with a larger amount of shear steel reinforcement. This is also in line with the observation of steeper cracks for the series 1 FRP specimens, i.e., causing increased tension in the FRP strips.
For beam S3-FRP2s, the retrofit was designed with a mechanical FRP shear strengthening ratio, ωfw = 2.1, i.e., a value 3.5 times higher than that of S1-FRP1s (ωfw = 0.6), in order to make up for the difference in design shear strength from the steel reinforcement. A significant increase in shear capacity was observed (+31.3% vs. the control beam); however, the strength of specimen S1-FRP1s was not achieved (24.2 kN vs 38.3 kN). Note that the latter also had a higher concrete strength (fcu = 30.1 vs. 26.7 MPa).

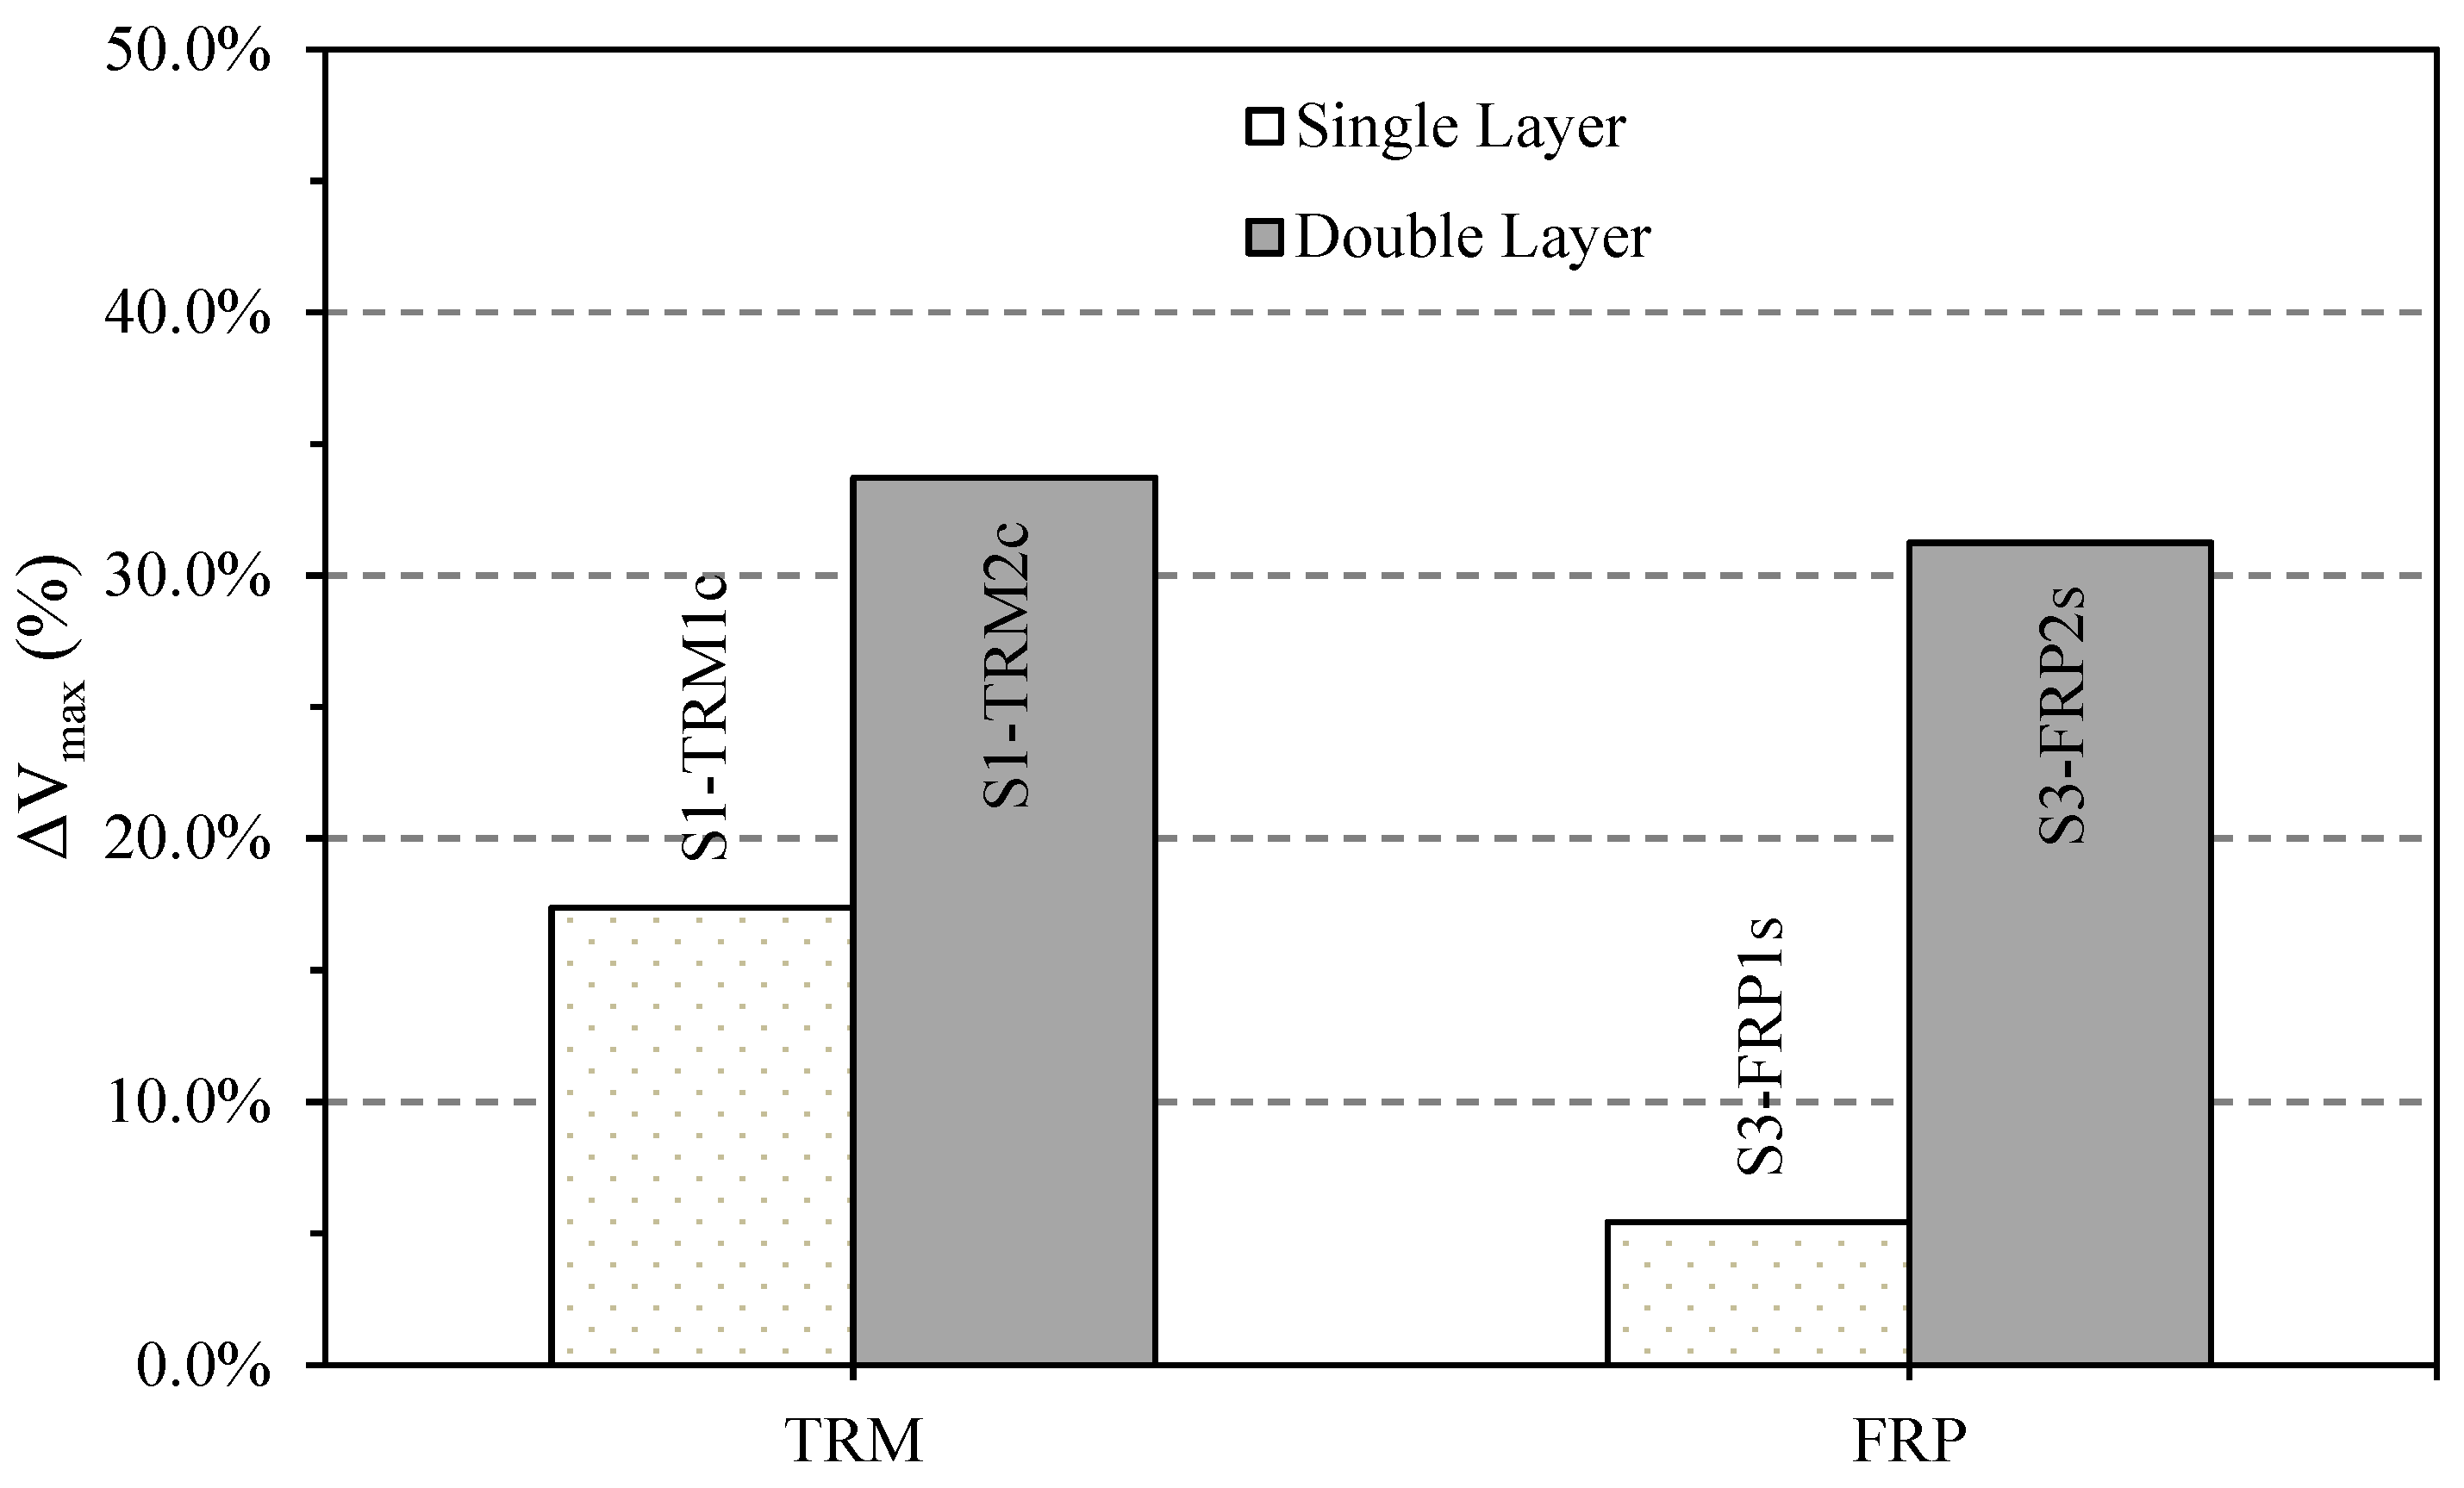
3.6. Effect of Composite Shear Retrofit Amount

The effect of the amount of applied composite material was assessed by exactly doubling the ρfw for two beams with FRP-strip strengthening (S3-FRP1s and S3-FRP2s) and two beams with TRM-strengthening (S1-TRM1c and S1-TRM2c). As shown in Figure 10, in the case of the TRM-strengthened beams, the strength increase was very close to double (+17.4% vs. +33.7% compared to the control beam), while for the FRP-strengthened beams, the increase was significantly more pronounced (+5.4% and +31.3%) when the strengthening amount was doubled. However, it is also important to note that for the TRM-retrofitted specimens, S1-TRM2c had a lower concrete strength of 25 MPa compared to S1-TRM1c and S1-C (29.0 and 30.7 MPa, respectively), which may have affected the reported strength increase.
In the case of the TRM-strengthened beams, the retrofit with double amount was applied by means of a second layer, while for the FRP-strengthened beams wider and more closely spaced strips were used. Note that the application of FRP strips for shear strengthening is generally more efficient with respect to the amount of material needed than the use of continuous U-jackets [41]. The higher shear-strengthening effectiveness of FRP-strips compared to continuous U-jackets was also observed for beam S1-FRP1s with strips (+10.8%), compared to S1-FRP1c with a continuous jacket (+6.6%), despite the much larger amount of FRP applied in the continuous retrofit (ρfw = 0.45% vs. 0.13%).

3.7. Effectiveness of TRM Compared to FRP

Finally, to compare the effectiveness of TRM with that of FRP, the mechanical shear strengthening ratio (ωfw), based on the effective design strength of the retrofit jackets, was used to ensure equivalence in strengthening amounts. For beams in series 1 with reinforcement design HS, the FRP-strengthened beam S1-FRP1s and the TRM-strengthened beam S1-TRM1c had very close values of ωfw of 0.6 and 0.5, respectively. The shear strength increase for the TRM-strengthened specimen was however larger (+17.4% compared to +10.8%). When comparing the continuous FRP jacket retrofit (S1-FRP2c, ωfw = 1.1) with the equivalent TRM-strengthened specimen (ωfw = 1.0 for S1-TRM2c), the strength increase of 33.7% was again much more significant than the FRP retrofitted counterpart (+7.0%). The increased effectiveness observed can be explained by the angle of the cracks, and hence of the principal strains in the jacket, which were closer to 45°, activating both directions of the orthogonal TRM jacket. It has to be noted that, while FRP debonding from the concrete surface did not occur (instead only concrete cover peeling), the use of spike-anchors in the TRM-retrofitted beams will also have affected the effectiveness of the retrofit. Finally, the behaviour of the TRM specimens was also more ductile, not only due to the increased initial stiffness, but also with the peak load reached at much larger values of vertical deflection of 13.4 and 15.4 mm.
The observation of higher TRM effectiveness is unlike previous observations made by Tetta et al. [33] for U-wrapped rectangular beams, in which TRM-strengthened beams only reached 42% (one layer) and 92% (two layers) of the capacity of an equivalent FRP-strengthened beam. The FRP strengthening in that study however used a bi-directional mesh which improved its effectiveness. Another difference is the application of a much thicker layer of mortar—20 mm in this study compared to 4 mm per TRM layer in [33]—which also led to a significant increase in the moment of inertia (Iyy). The thickness of the TRM, which is based on the manufacturer’s guidance for the specific textile, led to a strong increase in Iyy of +53% and +99% for one and two layers, respectively. Indeed, next to the higher strengthening effectiveness, the response is hence also significantly stiffer for the TRM-retrofitted specimens, with initial stiffness increases of 27% and 45% for one and two layers of TRM, compared to 5 and 14% for their respective FRP counterparts. It has to be pointed out, however, that the sections of the beams are half-scale, the increase in moment of inertia is hence unrealistically large and may lead to reduced strengthening effectiveness in real cases. Overall, the comparison of the effectiveness of TRM and FRP will always depend on the specific design and materials used.

4. Modelling

The statistical significance of so few experimental results is clearly limited. In order to expand the discussion from the experimentally obtained data, while removing unwanted fluctuation of material properties, a series of parametric studies using non-linear finite element modelling was conducted in ABAQUS [42]. The model is first compared to selected experimental results from this study on RC beams strengthened with FRP U-strips reinforcement.

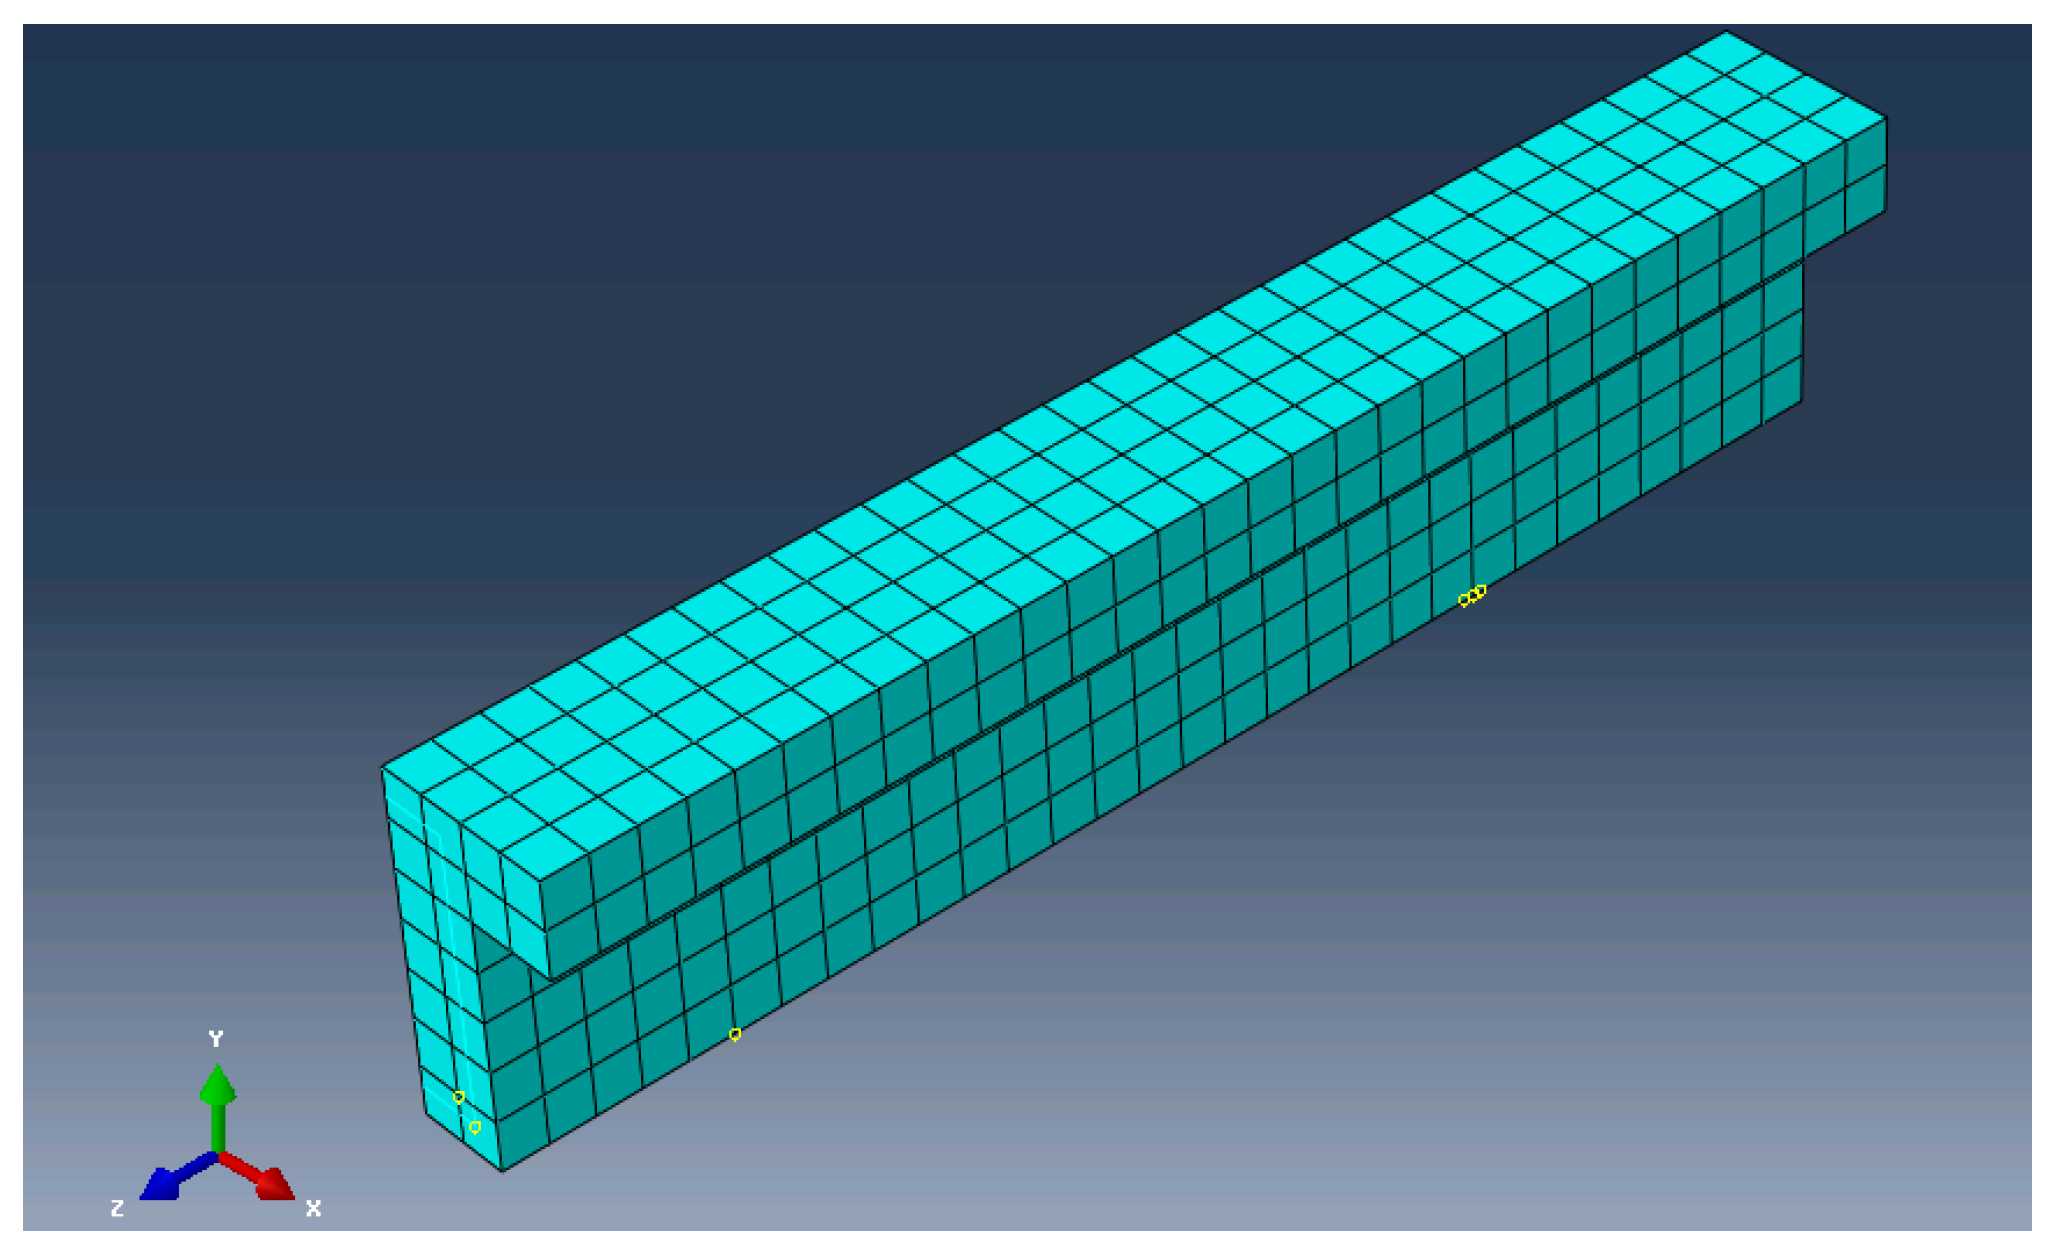
4.1. Analysis Method and Element Discretisation

The modelled RC beams have the same geometry, reinforcement detailing and material properties as the experimental specimens. Taking advantage of symmetry, an FE model was created for only a quarter of the beam and symmetric boundary conditions were applied along the mid-span and the centre line of the beam to reduce computational time. The model is shown in Figure 11 with a mesh size of 25 mm, which was determined to be the most appropriate balance of accuracy and runtime from a sensitivity analysis of different mesh sizes (100, 50, 25, 12.5 mm) [43]. It was found that the results in terms of the applied force did not significantly vary for mesh sizes below 50 mm and converged at very close values between 25 and 12.5 mm.
For all models, it was chosen to discretise concrete members with 3D 8-node hexahedron (brick) solid finite elements (C3D8R), the reinforcement bars by two-node truss elements (T3D2) and the FRP elements as four-node shell elements (S4R). The relation between concrete and steel reinforcement is defined using embedded elements. The concrete–FRP interaction was assumed to be a perfect bond and modelled as tied connections. This assumption was considered adequate as FRP U-wrap debonding was observed in the form of concrete cover peeling and not as delamination at the FRP–concrete interface. More accurate modelling using cohesive elements, which have shown good results in the past, would be more appropriate to model delamination within the adhesive layer [44].
To ensure convergence of the nonlinear models, a quasi-static explicit analysis with a low loading rate and mass scaling was performed in order to remove inertial effects. Loading was applied in displacement-control at the same point as the experiments at a rate of 0.1 mm/s. With the selected loading rate, a sensitivity study on the mass scaling factor was carried out, ensuring there was no significant effect of inertial forces, while reducing the computational cost of the model. Mass scaling of a factor of 104 was found adequate to balance the accuracy and run-time of the FE model.

4.2. Material Models

To model the concrete behaviour, the concrete damaged plasticity model (CDP) [45,46], based on a Drucker–Prager strength hypothesis was chosen. Material degradation through both tensile cracking and compressive crushing modes can be defined using an isotropic damage model. Damage is associated with a reduction in elastic stiffness due to cracking or crushing characterised by degradation variables dt and dc, respectively. The selected concrete material model has been described in [47] and was shown to match the behaviour of RC elements well, e.g., [48,49,50,51,52]. More details of the material model are found in Appendix A.
To model the reinforcing steel material, it was assumed that the bars had linear elastic behaviour defined by Young’s modulus up to the yield strain. Past this yield strain, the plastic behaviour of the material including strain hardening was used. The values for the post-yield stress-strain curve were chosen to match the curves of real tensile tests on the steel rebars. To model the longitudinal FRP sheet and the transverse FRP U-strips, the elastic lamina model was chosen with the material properties defined according to the tensile tests performed on FRP coupons.

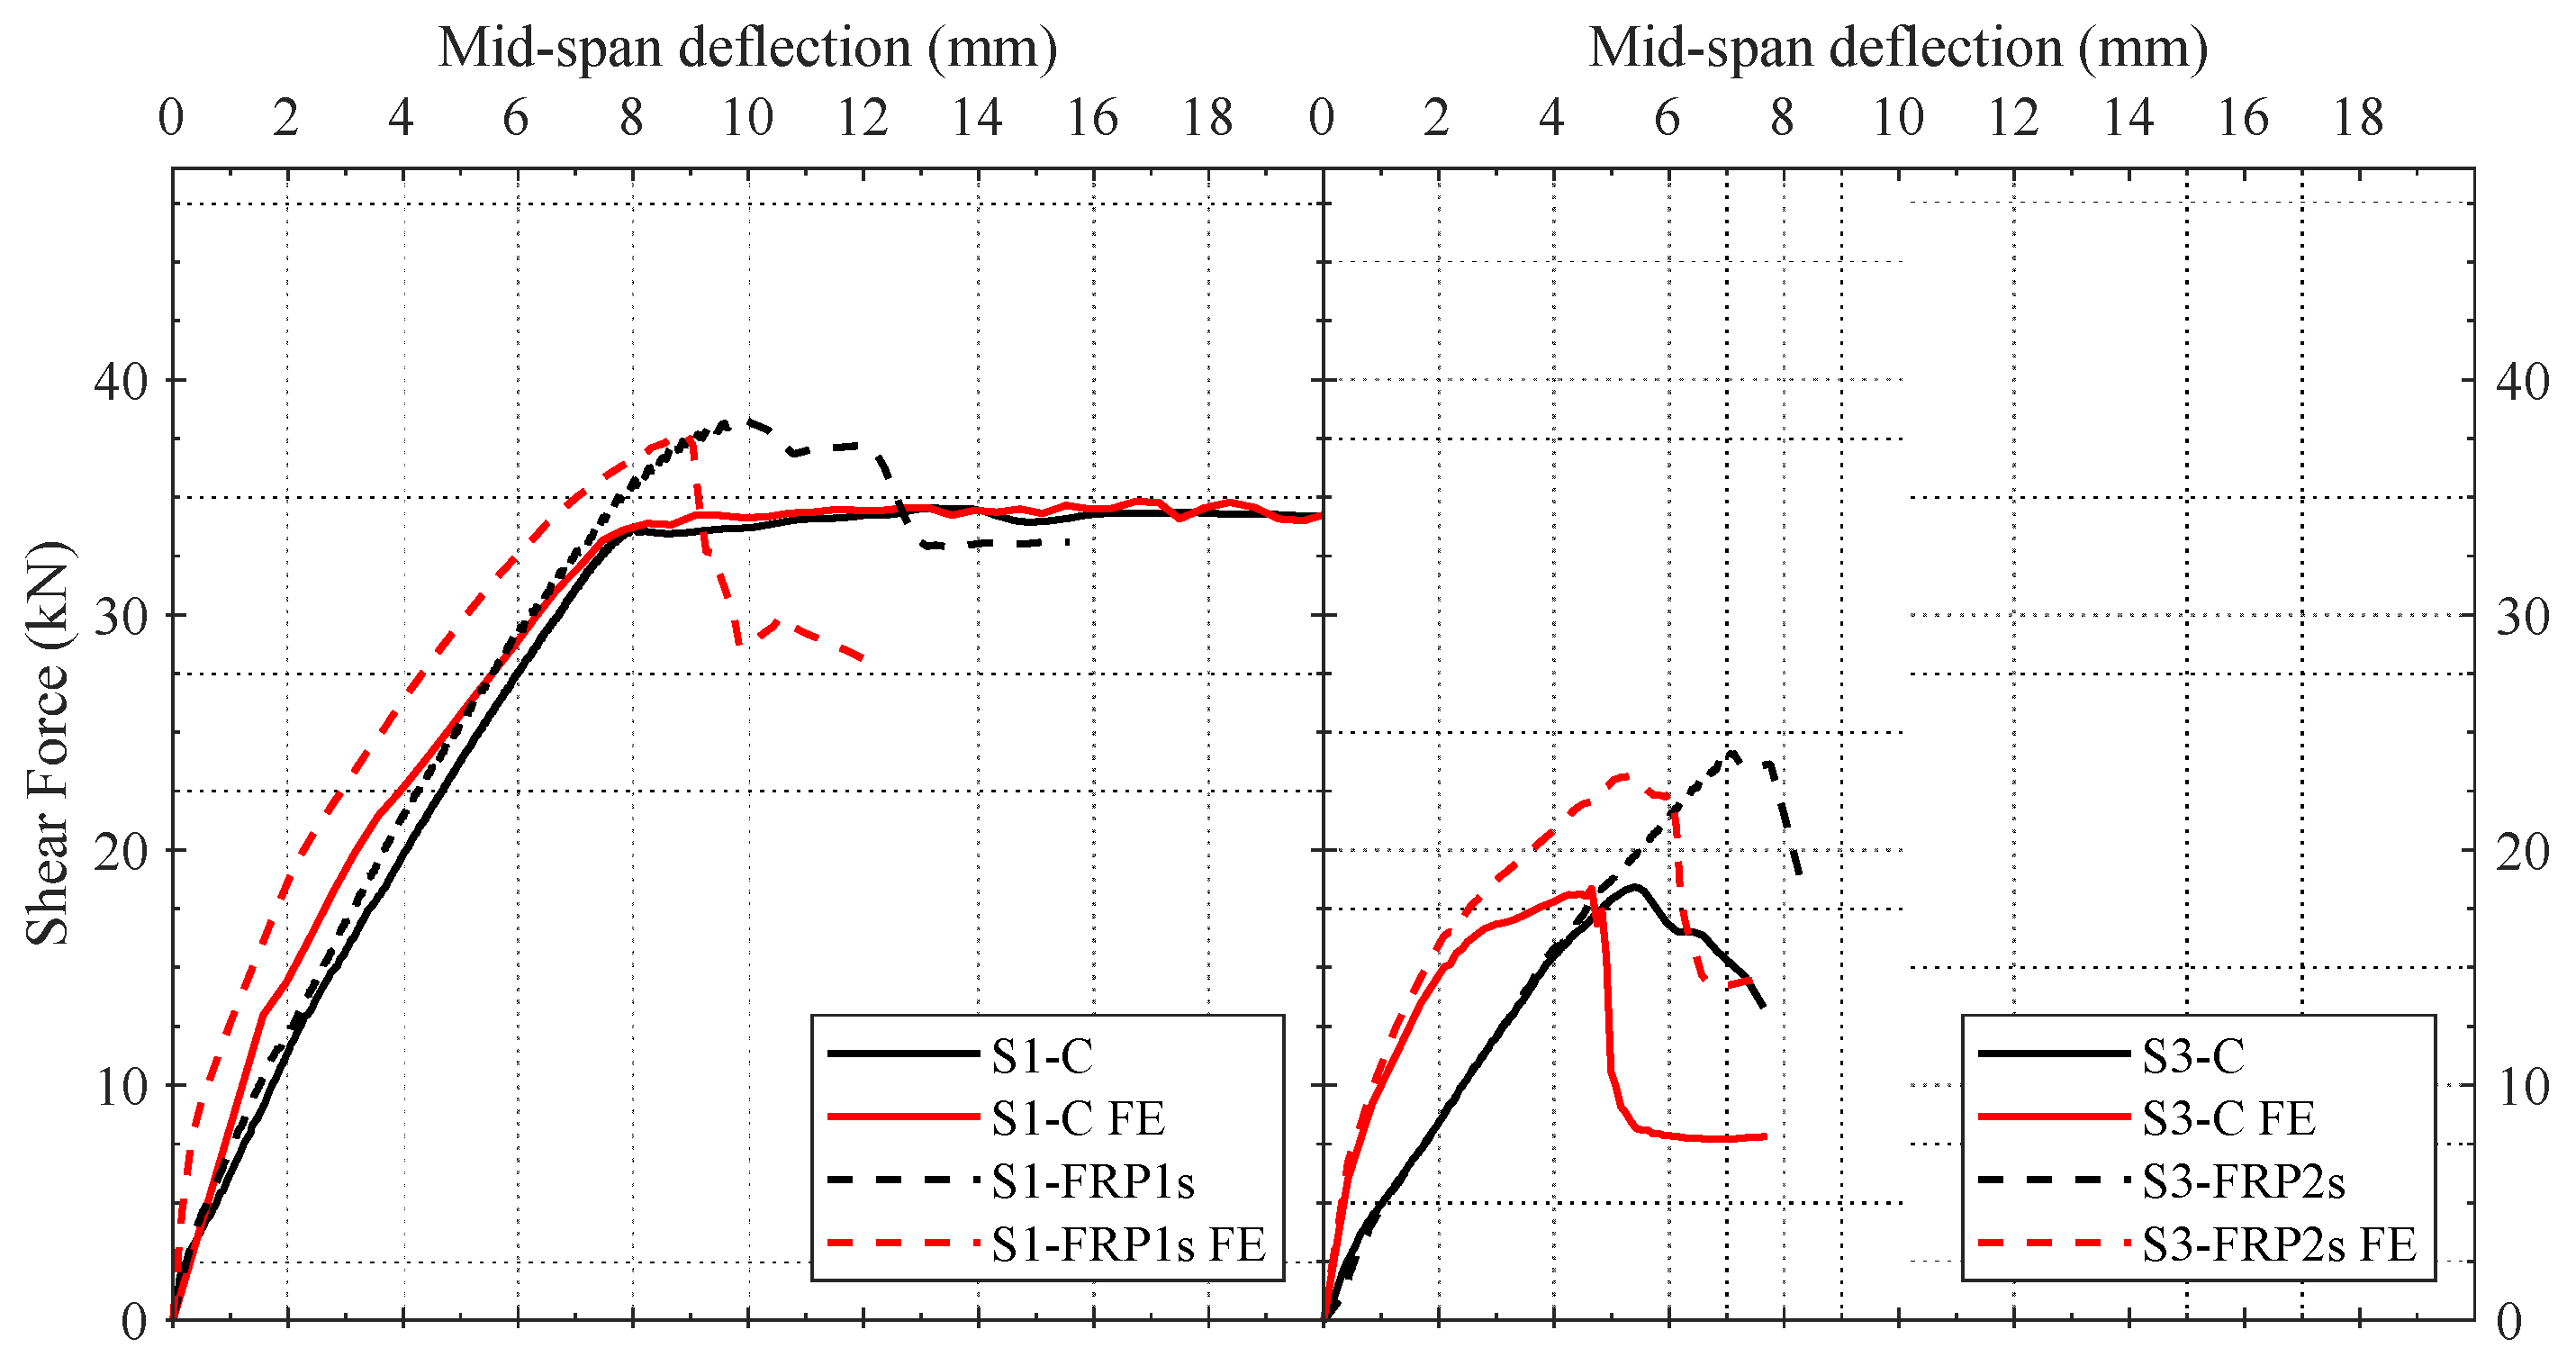
4.3. Model Validation

To assess the validity of the FE models, the results of two beams of series 1 (S1-C and S1-FRP1s) and series 3 (S3-C and S3-FRP2s) were selected, as the focus of the parametric study was on beams retrofitted with strips of FRP. The selected beams provided information on modelling flexural and shear failures, as well as retrofitting with different numbers of FRP U-strips. The force-displacement envelopes obtained from the four beam FE models are compared to the experimental results in Figure 12.
For the four specimens, as shown in Table 6, the maximum shear force in the FE model (Vnum) matched the experimental data very closely (difference ΔVnum within ±4%). The initial stiffness, however, was overestimated in the model, as commonly reported in the literature for FE models of RC members [53]. This observation can be related to the bond between concrete and steel, which is assumed to be perfect (no-slip) in the model, while some slip occurs in the experiments, slightly reducing composite action in the actual beams. Moreover, microcracks are produced by drying shrinkage. These reduce the stiffness of the actual beams but are not simulated in the models.
The failure mechanisms are well predicted for all four beams, with flexural failure and a ductile response for S1-C and shear failure with a sudden drop in strength observed for the other beams. Looking at the results in more detail, for beam S1-C, the damage and cracking in the concrete was compared to the experiment in Figure 13. Plastic strain (PE) distributions obtained from the FE analysis, corresponding to cracks in the CDP model, were visualised and compared to crack patterns from the experiment. A close match to the experimental crack pattern was obtained, indicating that the model can capture the main mechanism of failure in the beam.
Similarly, for the FRP-strengthened beam S1-FRP1s with one layer of FRP, when comparing plastic strains to the actual cracks in Figure 14, it can be seen that shear cracking in the experiment is well reproduced by the numerical model. By visualising the direction of the principal plastic strain on the right-hand side of Figure 14, it can be seen that the high strains indeed corresponded to diagonal crack opening.
Overall, the models reproduce well the main behaviour of the four beams, both in terms of the observed damage mechanisms and in terms of the peak forces.
The behaviour of specimen S1-C, which failed in flexure instead of shear, was further assessed by looking at the effect of concrete strength in the FE model. As can be seen in Figure 15, a reduction of concrete strength to 25 and 20 MPa not only affects the maximum applied shear force, but also the failure mechanism, with a ductile flexural failure only observed for the highest concrete strength (fcu = 30 MPa). Shear failure was indeed observed for the designed-for concrete strength of 25 MPa, with a shear capacity slightly below the capacity of S1-C (32.9 kN, −5.6%). This indicates that the strength enhancements for specimens S1-FRP1c and S1-FRP2c, which were compared to experimental results of S1-C, would hence be slightly higher than reported.

4.4. Parametric Study

A parametric FE study was designed to look further at the effect of the shear reinforcement ratio, span-to-depth ratio and concrete strength on the strengthening effectiveness of FRP-retrofitting with U-shaped strips. For this purpose, a beam with the same geometry as the experimental specimens was modelled with three values of shear span (SP), three values of shear reinforcement (RF) and three values of concrete strength (C), as summarised in Table 7.
For each specimen, two different amounts of FRP shear strengthening were applied. The lower amount corresponded to 40-mm wide FRP strips placed at 180 mm c/c (ρfw = 0.1%), while the higher amount had a spacing of 90 mm (ρfw = 0.2%). The naming convention for the parametric study was “C##-RF#-SP#”, with the number # referring to the respective value of the parameter indicated in Table 7. For the FRP-strengthened specimens, “-FRP#” was added, with # indicating the amount of FRP shear strengthening, ρfw. Note that the values of ρw and ρfw were selected to be different to the ones in the experimental study. The steel yield strengths in the parametric study were reduced to 550 MPa and 400 MPa for the longitudinal and shear reinforcement in order to ensure shear failure behaviour in the beams for all specimens.
The results from all models in terms of the obtained shear capacity (Vnum), deflection at peak load (δmax) and the peak stress recorded in the steel shear reinforcement (σst) and FRP shear wraps (σFRP) are presented in Table 8. Note the results are grouped by the respective parameter investigated.

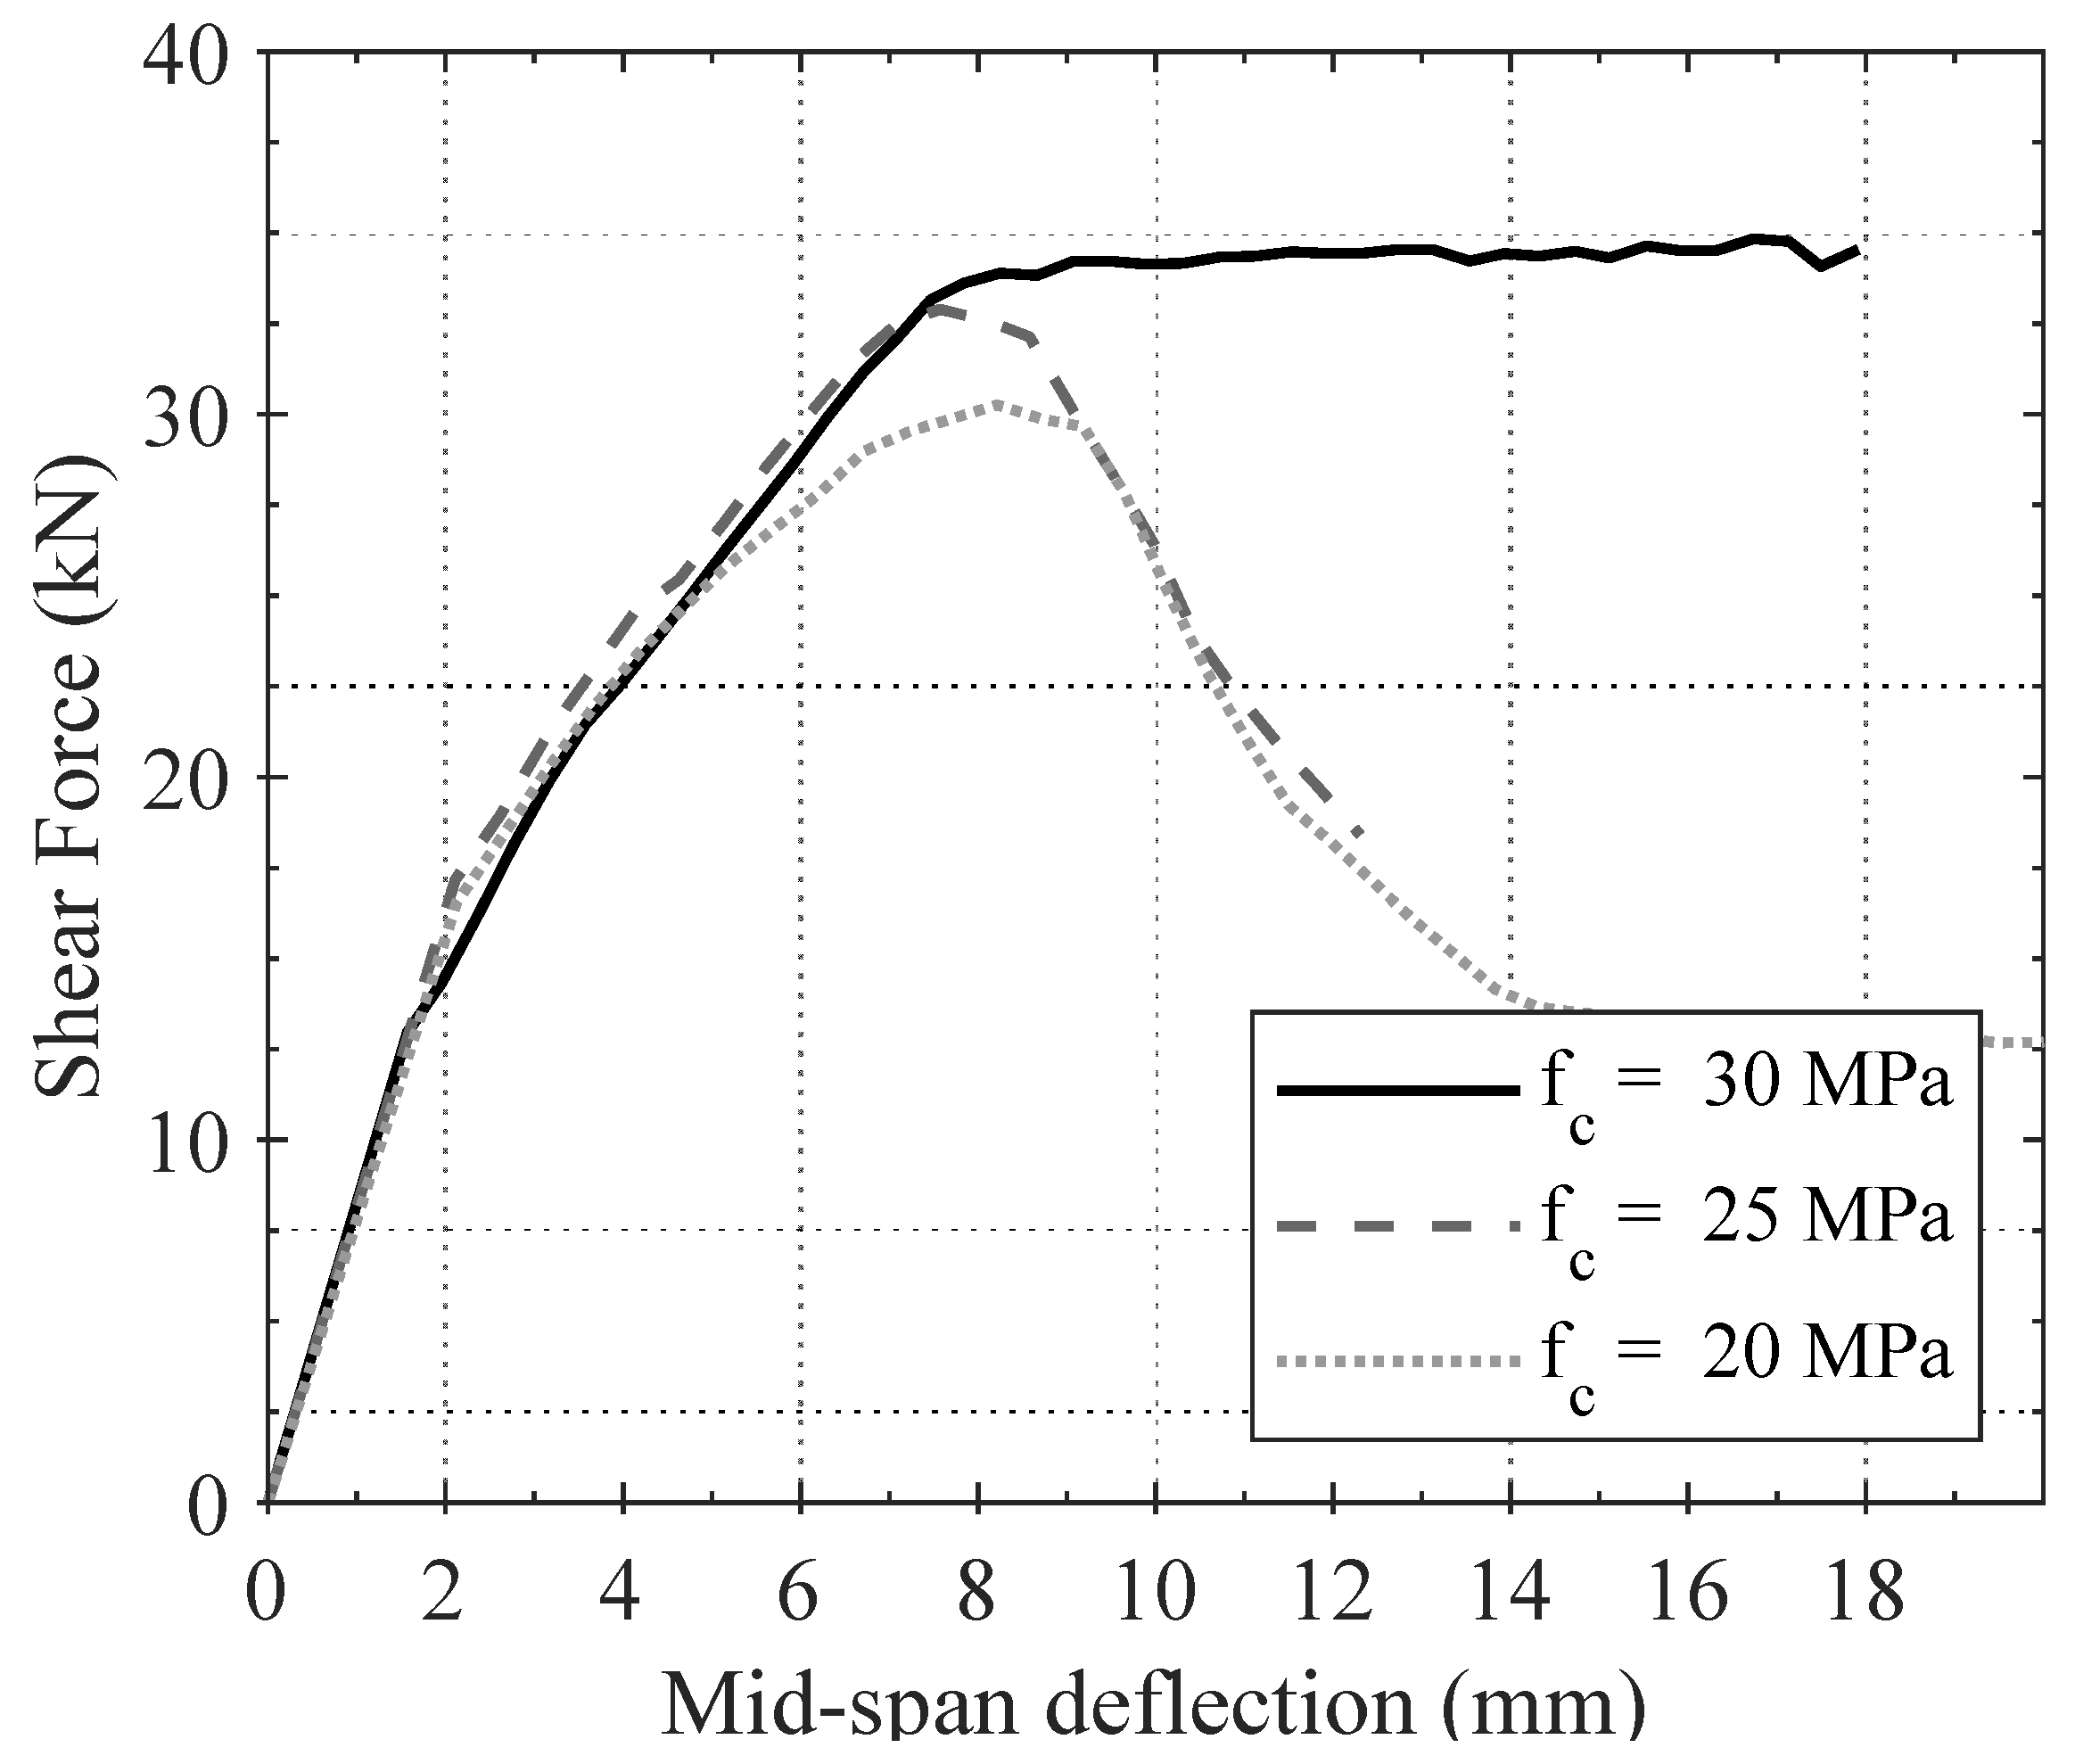
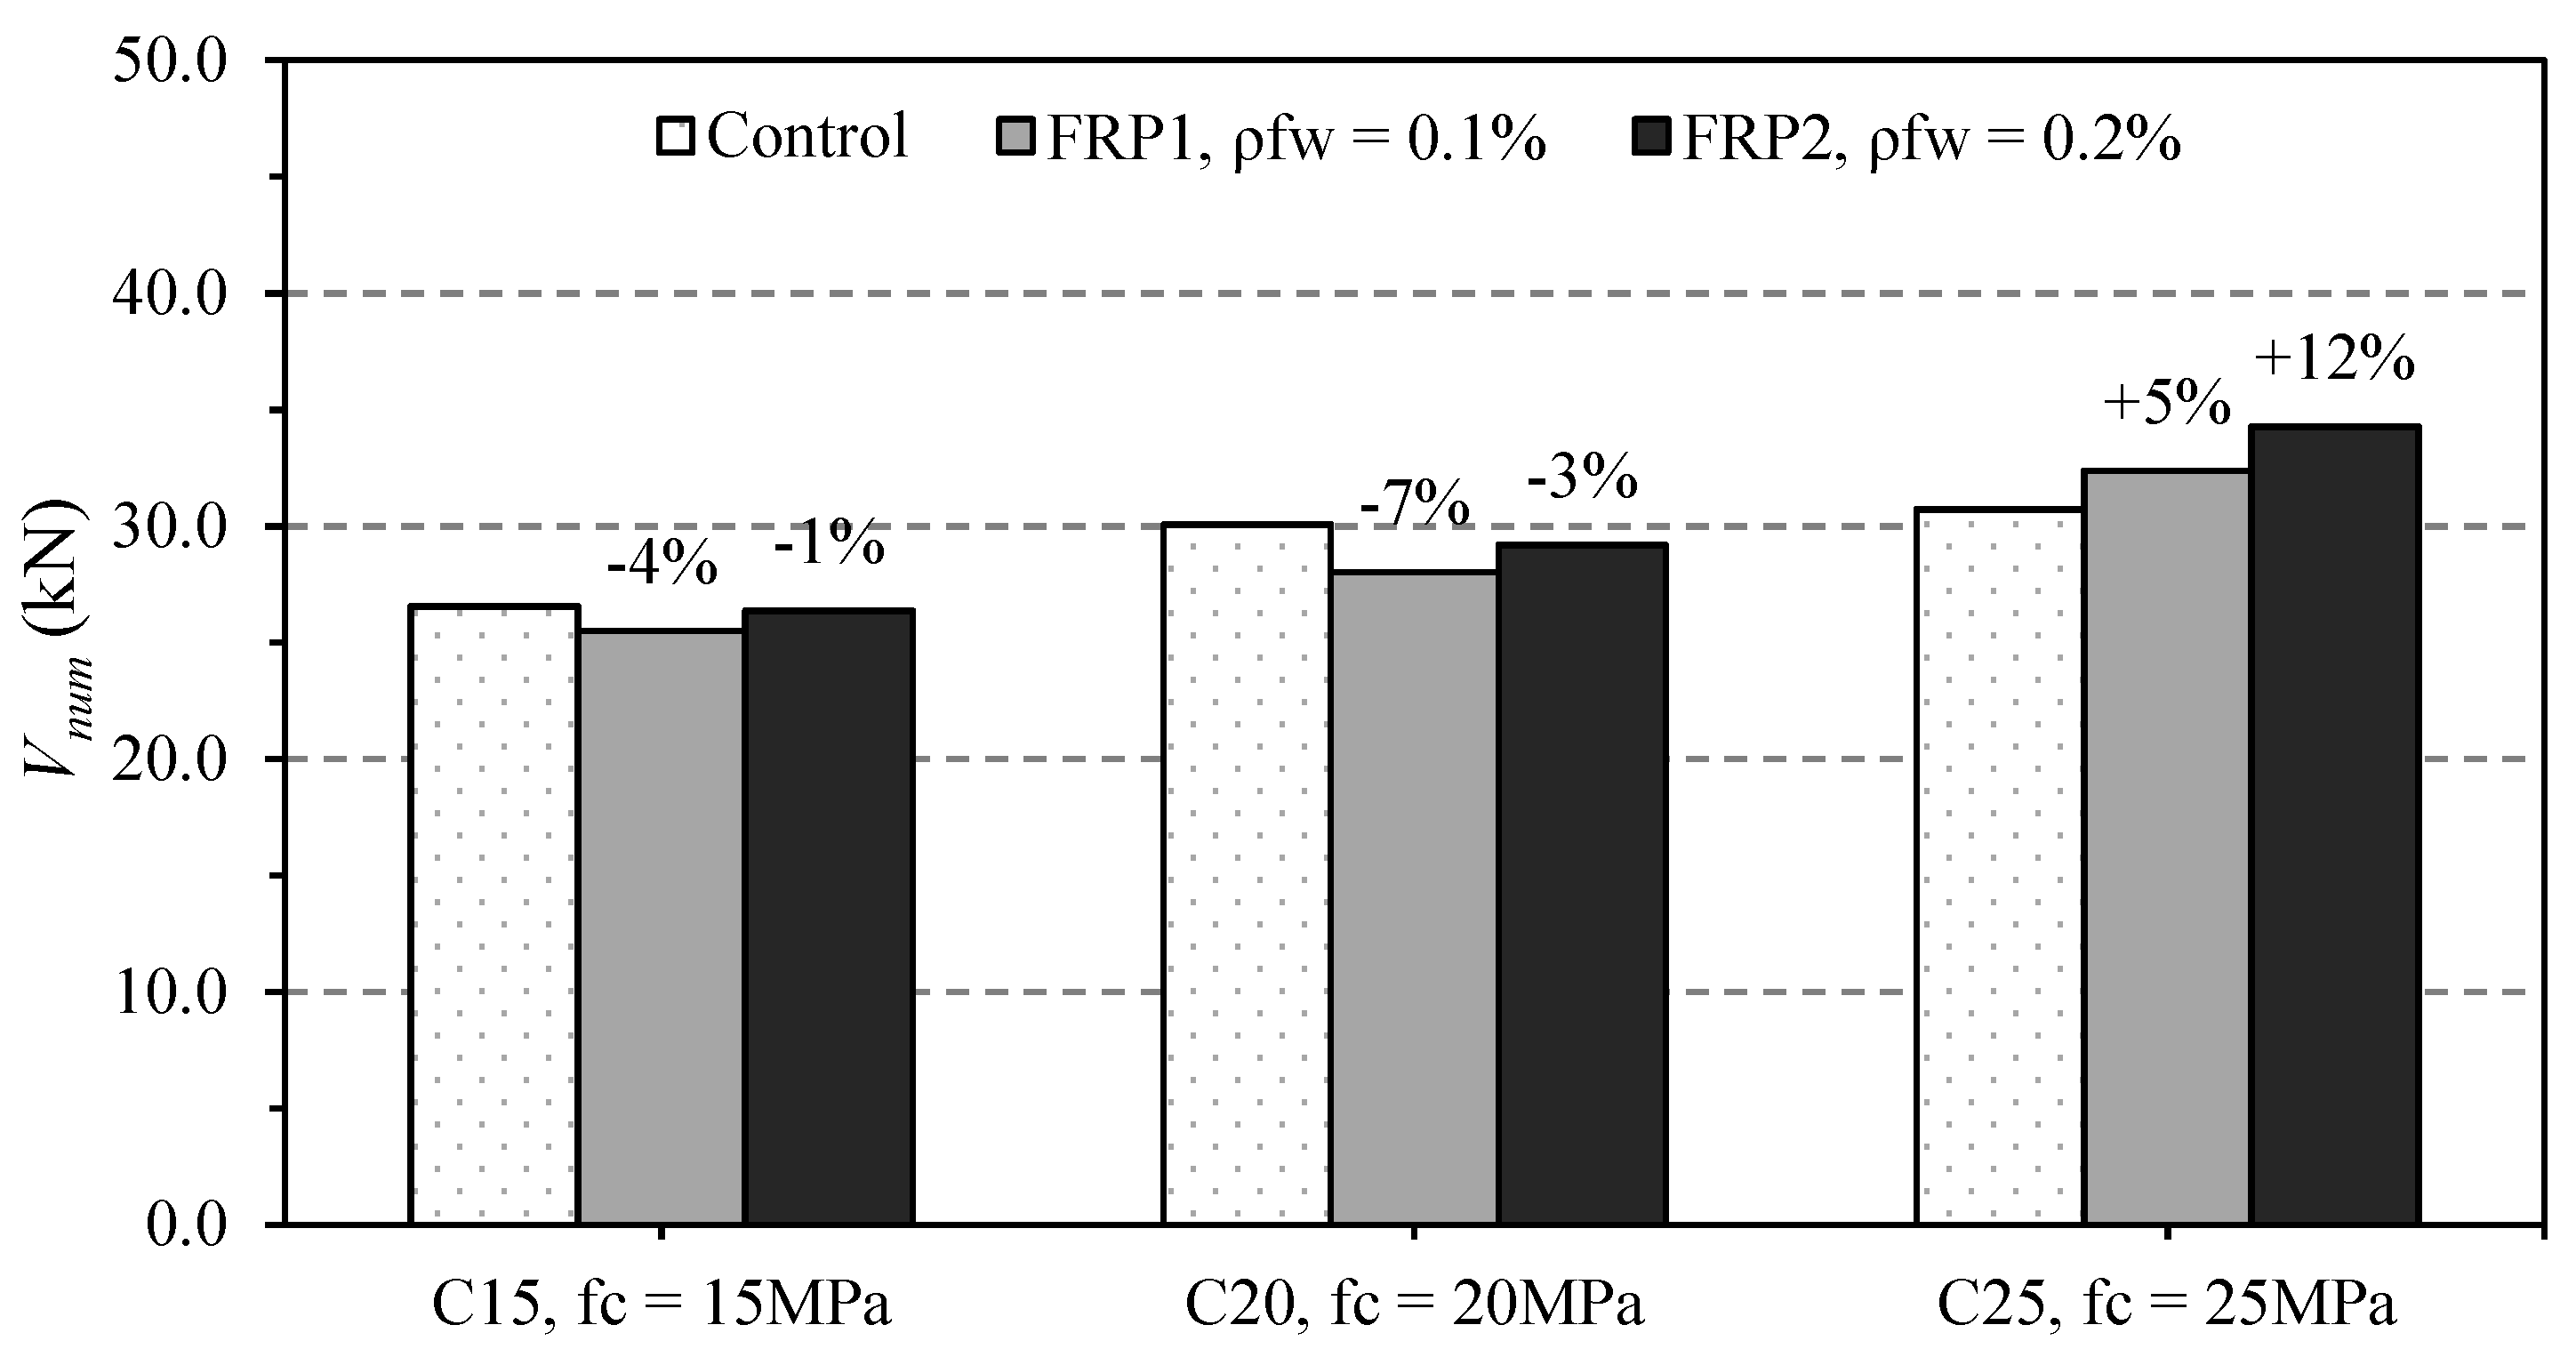
4.4.1. Effect of Concrete Strength

First, the effect of the concrete strength on the shear capacity of the FRP-strengthened beams is evaluated. Three concrete strengths representative of older structures that are more likely to be in need of retrofitting were selected (fcu = 15, 20 and 25 MPa). As can be seen in Figure 16, the shear capacity of the control beams increases with increasing concrete strength. Between the two retrofit layouts, for all concrete strengths a higher shear strength was observed for the FRP2 beams with the higher amount of FRP. For the highest concrete strength (fcu = 25 MPa), the strength increase due to the FRP was modest, with doubling of the strength increase with doubling the FRP (+5% for C25-RF4-SP1-FRP1 and +12% for C25-RF4-SP1-FRP2). However, it is important to note that strengthening of the beams with low concrete strength was instead shown to be ineffective in the FE models. The strength of the beams was reduced with the application of FRP U-wraps by −1% to −7%).
From the results in Table 8 for the lower concrete strength specimens, it can be observed that the maximum stress in the FRP elements is significantly lower than in the C25 series. For the weakest specimen, C15-RF4-SP1-FRP1, it can also be observed that the stress in the steel shear reinforcement was reduced significantly compared to the respective control specimen C15-RF4-SP1, which partially explains the reduction in shear capacity. The most important effect, however, was the significantly reduced deflection at peak load, δmax, for the retrofitted specimens in the C15 and C20 series, with reductions of 32% to 43% compared to the relative control specimens leading to a reduced area of concrete in compression and explaining further the reduced shear capacity.
Overall, this indicates an important effect of concrete strength on the shear strength of FRP-strengthened beams. Note that most design guidelines only consider concrete properties for the evaluation of FRP-debonding [37], which is not considered in the FE models.

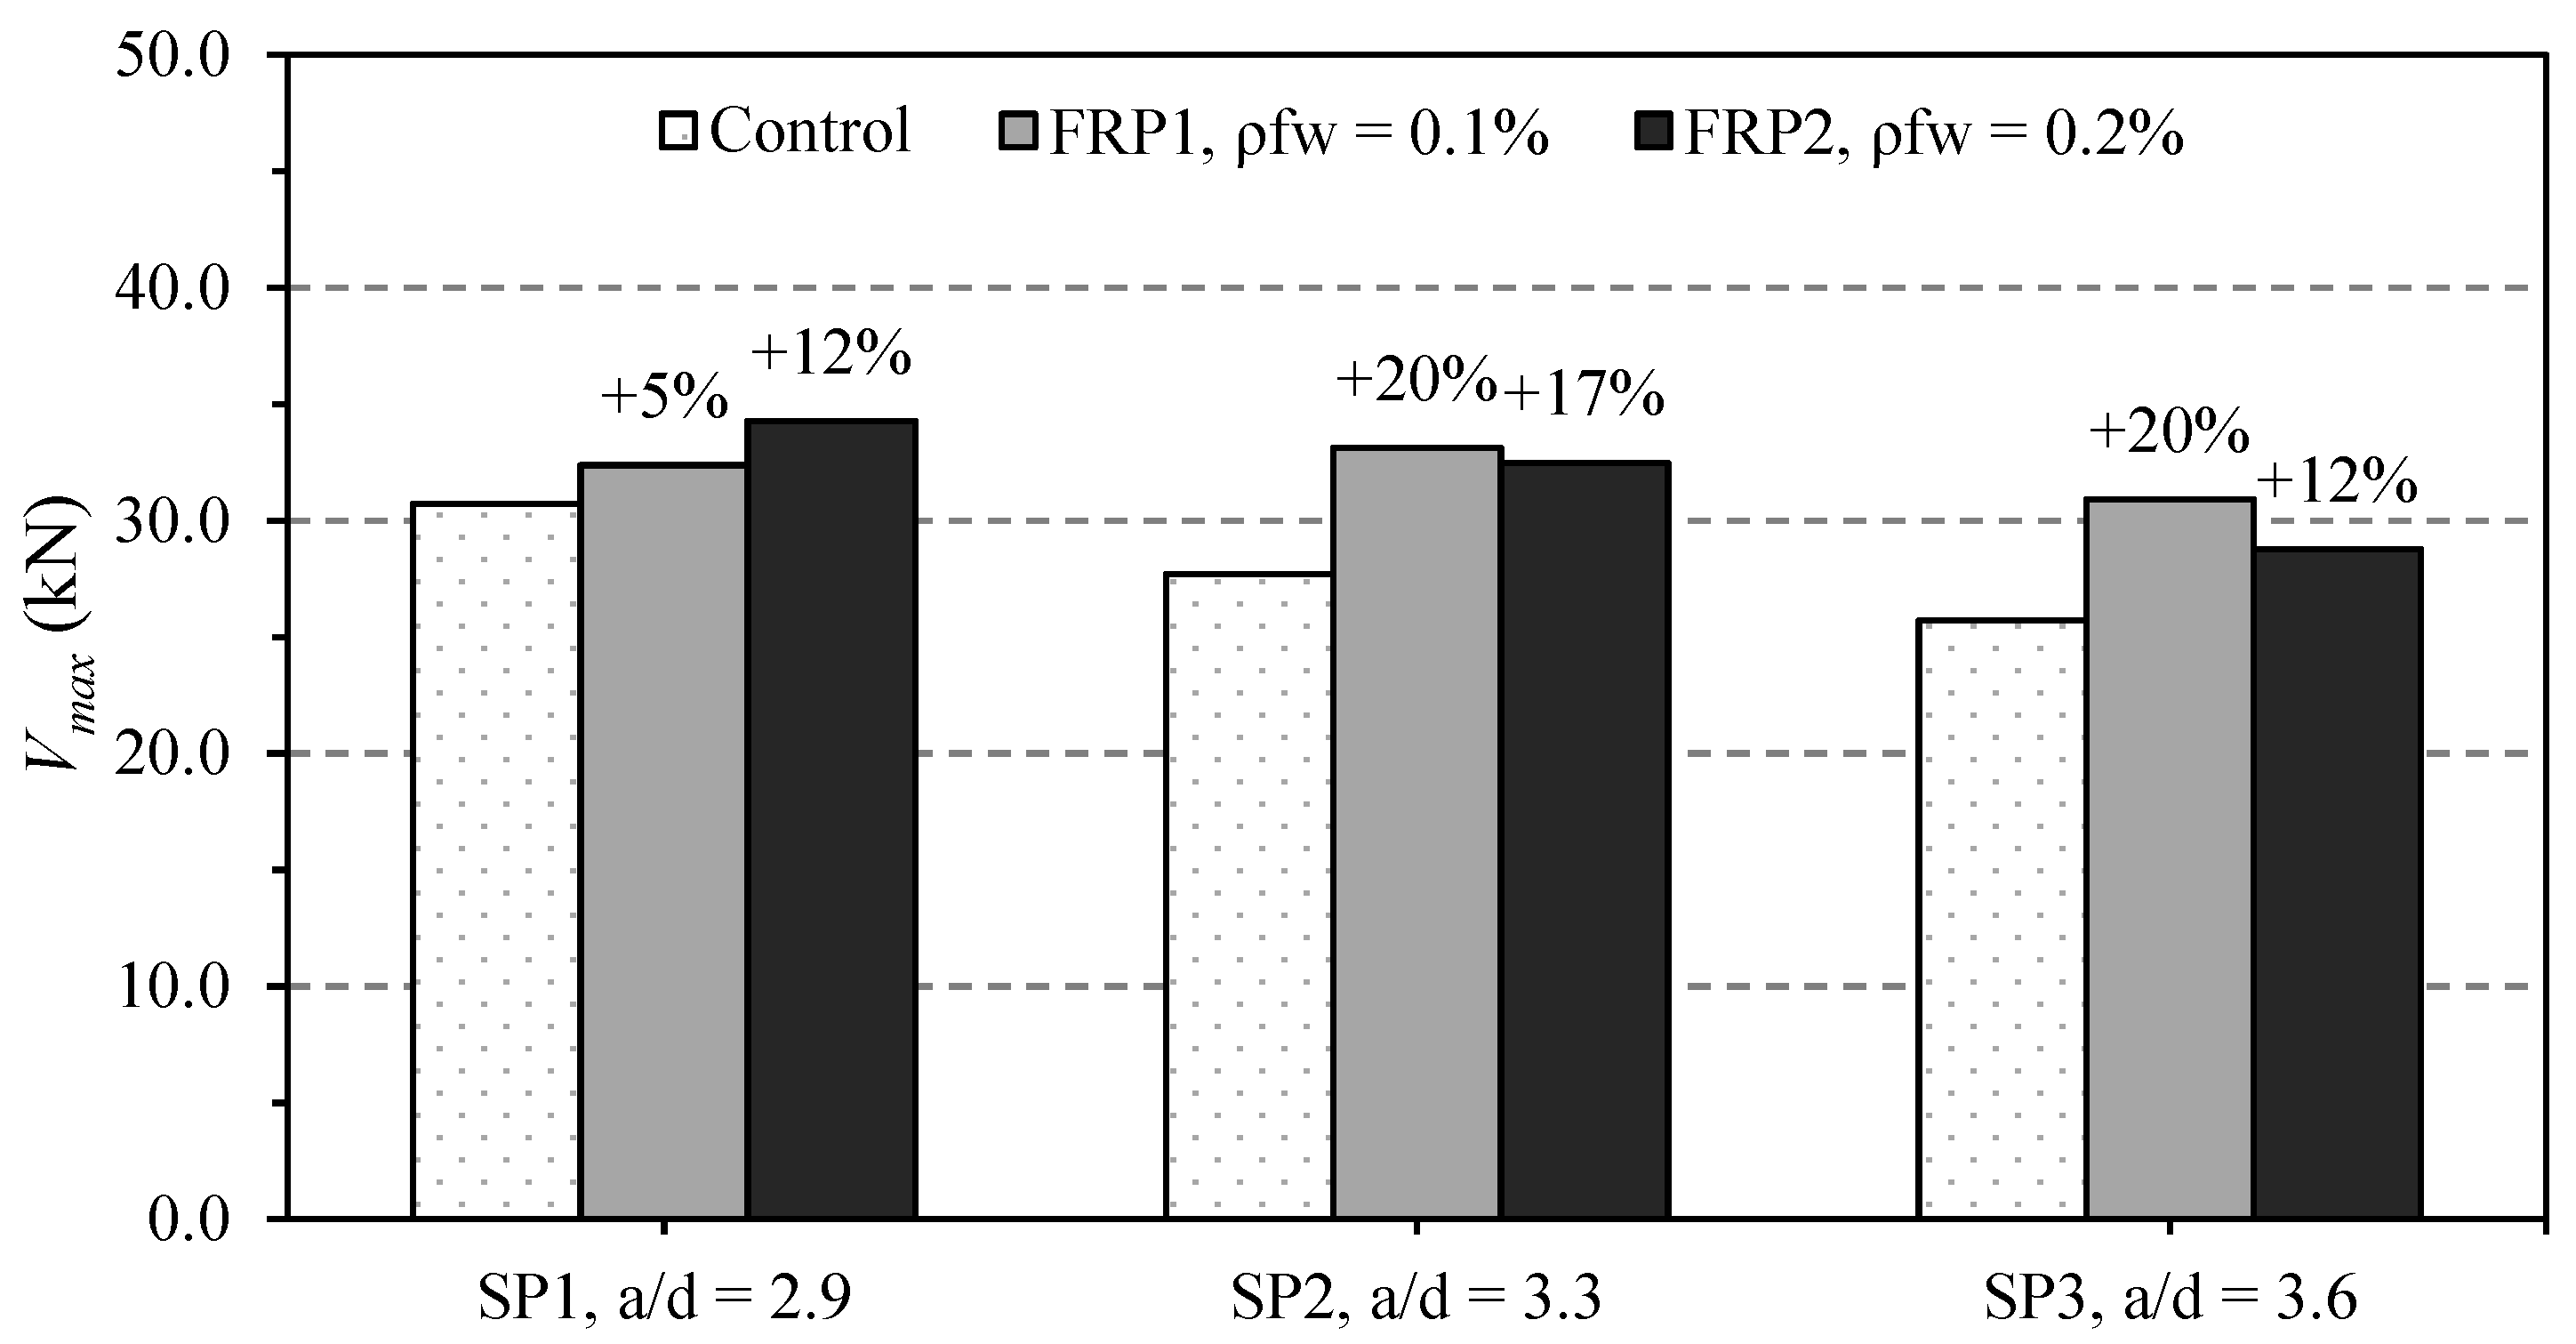
4.4.2. Effect of Shear Span

Looking instead at the effect of shear span on the strength of the modelled beams in Figure 17, a similar trend to the experimental results is observed: with increased a/d ratio, the shear strength of the control specimen decreases, but the retrofit effectiveness increases. As previously observed experimentally by Li and Leung [8], the FE modelling results indicate the highest strengthening effectiveness for the medium a/d ratio of 3.3, and generally, a significantly higher strengthening effectiveness for high a/d ratios compared to the low a/d (2.9).
Looking at the results in Table 8, the peak stress in the steel shear reinforcement is significantly lower for the control specimens with high a/d ratios (C25-RF4-SP2 and C25-RF4-SP3), with values of σst around 250 MPa, compared to nearly 350 MPa (close to the yield strength of 400 MPa) for C25-RF4-SP1. Here lies the explanation of the higher strength increase for the higher a/d ratios, as significant increases in σst from around 250 MPa in the control specimens to values between 300 and 400 MPa were recorded for the retrofitted specimens with shear spans SP2 and SP3. Large values of peak stress in the FRP U-wraps were also observed; these are however not significantly different between the different a/d ratios, with exception of C25-RF4-SP2-FRP2 (σFRP = 2197.0 MPa).
Shear strength increases of +20% for the retrofit with ρfw = 0.1% (FRP1) were observed for both a/d = 3.3 and 3.6. Doubling the FRP amount to ρfw = 0.2% (FRP2) did however not lead to any further improvement, but instead to lower strengthening effectiveness (+17% and +12%, respectively). It can be seen in Table 8 that with the FRP retrofit, the deflection at peak was only reduced slightly (between 6% and 8%) for the specimens with the lower FRP amount (FRP1), while δmax was reduced by over 20% for the specimens with double the FRP amount. This effect led again to a reduced contribution of the concrete compression block to the shear capacity, hence a less effective FRP retrofit.

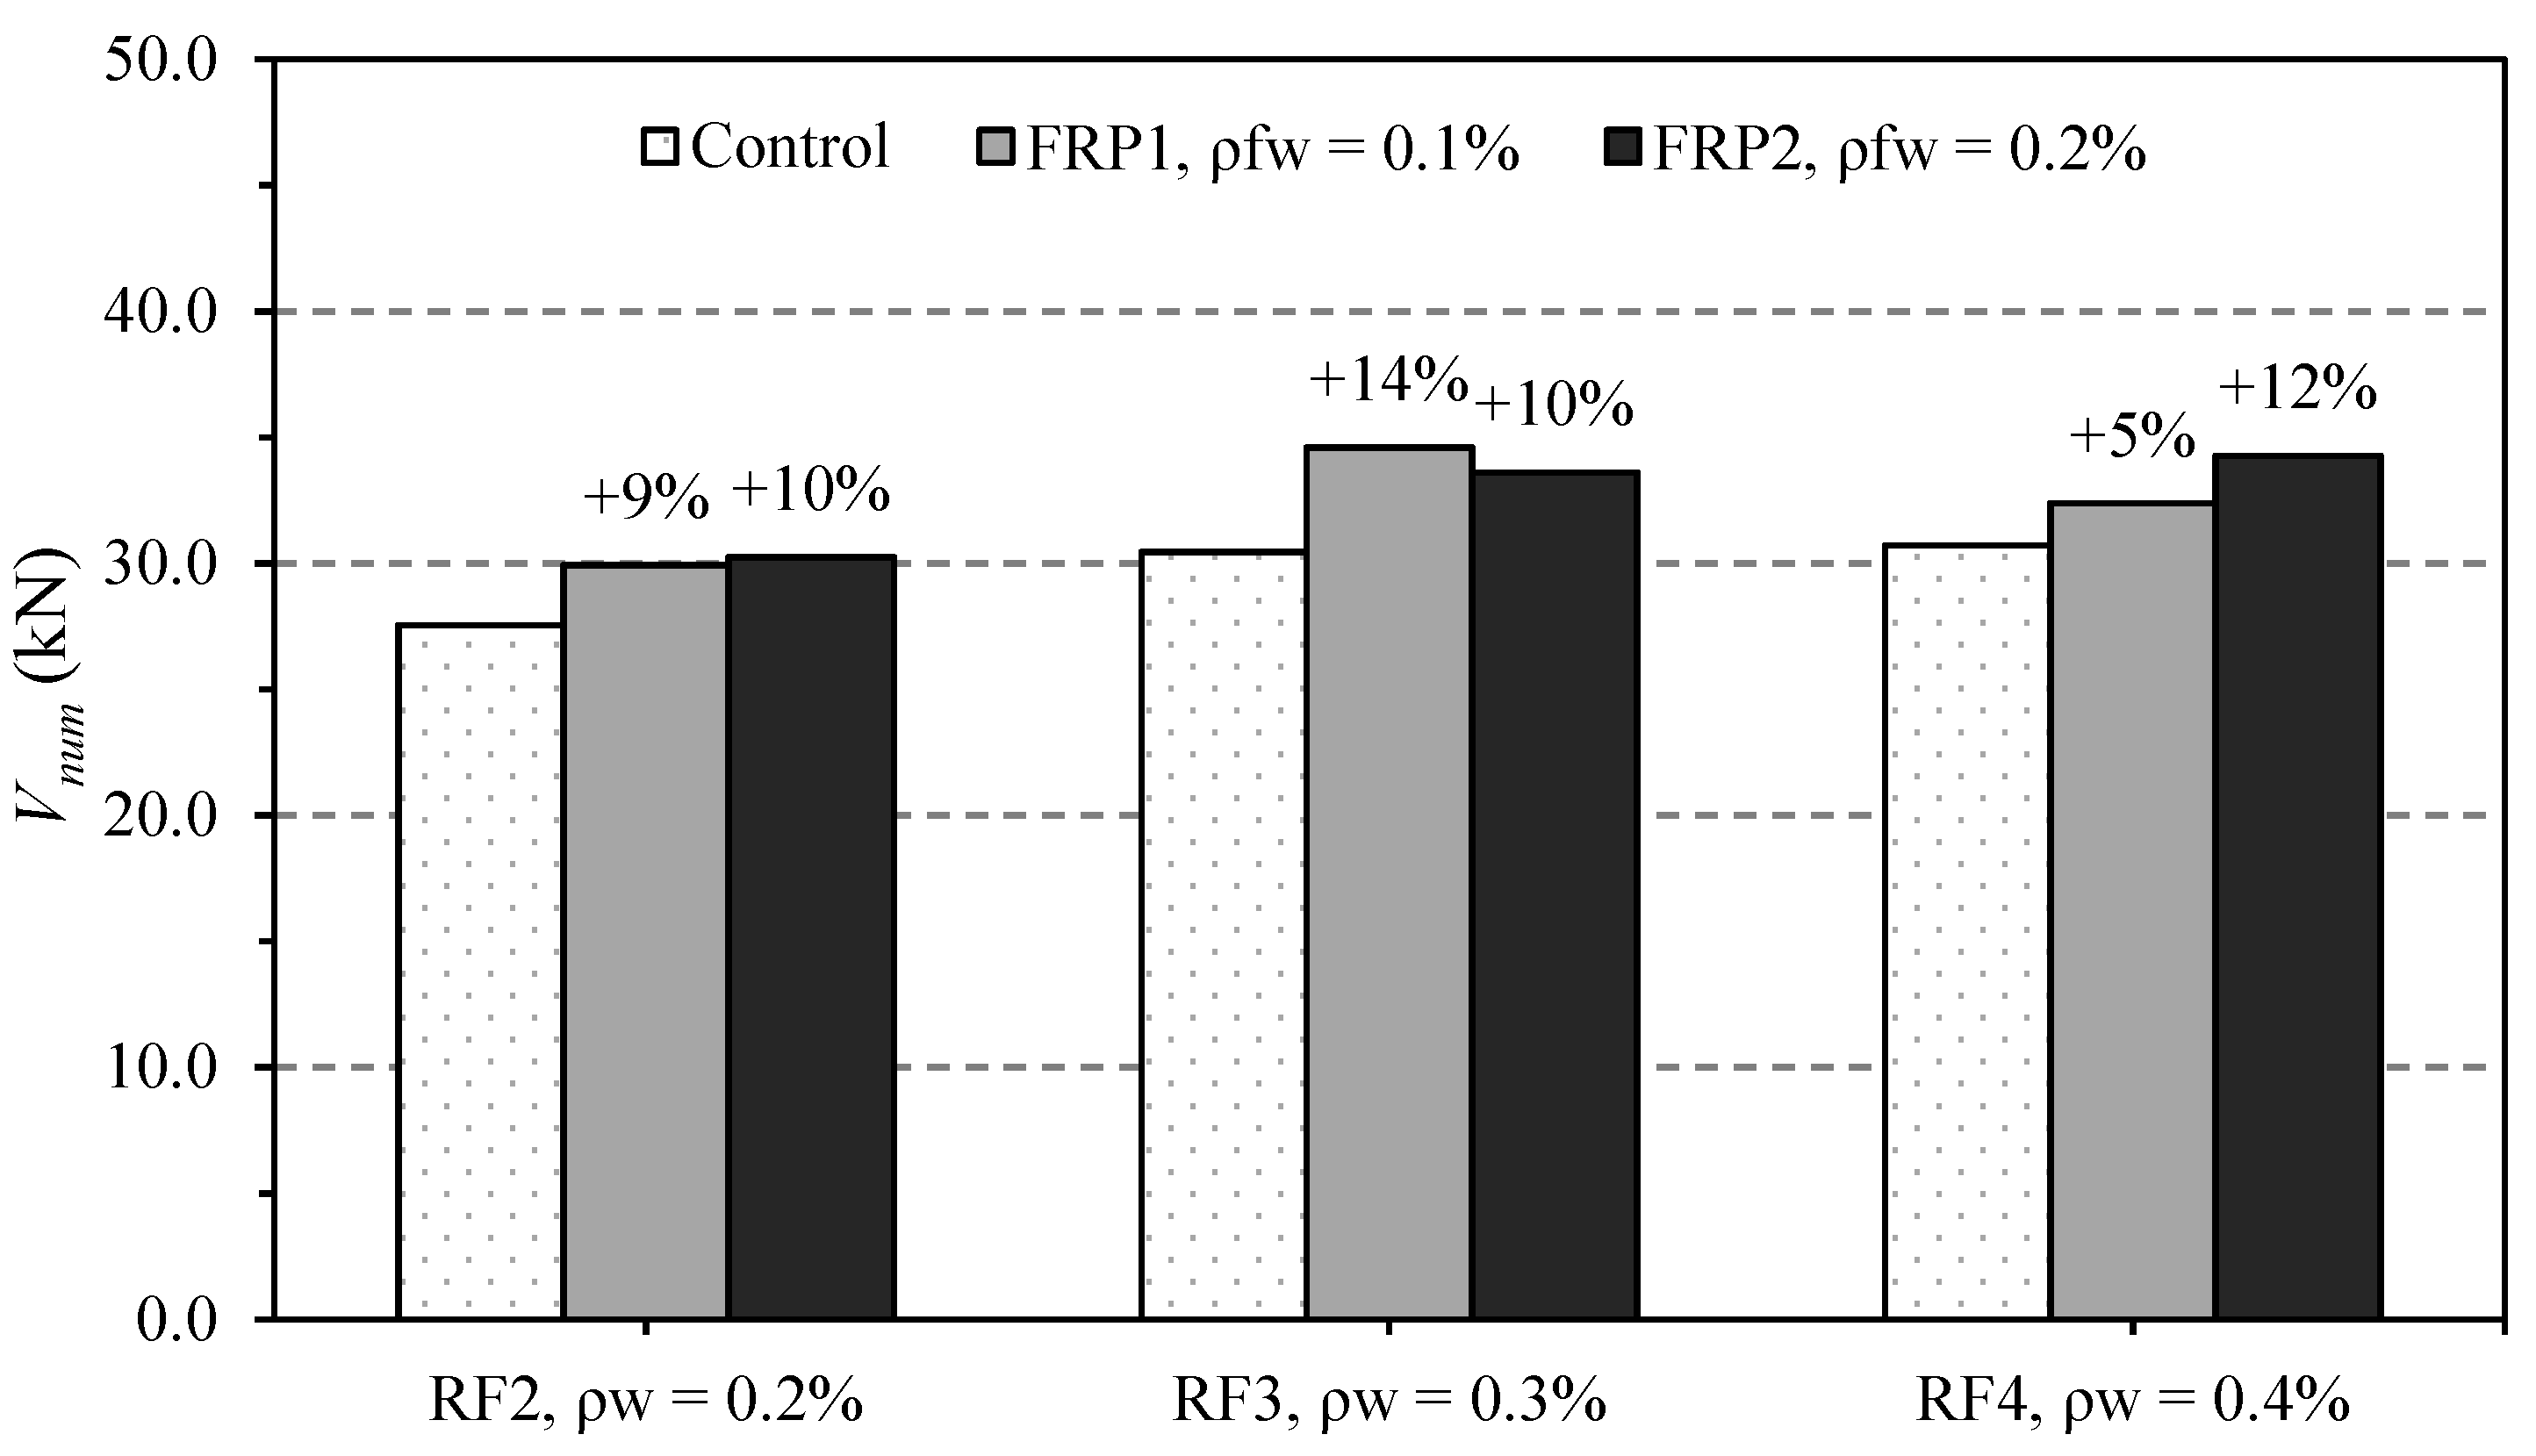
4.4.3. Effect of Steel Shear Reinforcement

Finally, when looking at the effect of steel shear reinforcement ratio on the shear strength of the beams, as expected, a higher shear strength was observed for the beams with larger shear reinforcement in Figure 18. For the retrofitted specimens, the results echo observations in previous experimental and numerical studies of a strong interaction between steel reinforcement and FRP-strengthening effectiveness, e.g., [31,32].
For the specimens with ρfw = 0.2% (FRP2), larger FRP-strengthening effectiveness was observed for the beams with a higher steel reinforcement ratio, as was also the case in the experiments. The strength increased for specimens C25-RF2-SP1-FRP2 (+9.8%), C25-RF3-SP1-FRP2 (+10.4%) and C25-RF4-SP1-FRP2 (+11.6%), albeit slightly, with the steel shear reinforcement ratio. For the lower FRP amount (FRP1), however, the strength increase was lowest for the beam with the highest steel shear reinforcement, with only +5.4% strength increase (RF4) and a lowering in the recorded maximum steel stress. The highest strength increase and highest shear strength were obtained for the low FRP strengthening amount and intermediate steel shear reinforcement (C25-RF3-SP1-FRP1). The results indicate a complex interaction between steel reinforcement ratio and FRP strengthening effectiveness that could not be predicted by FRP-strengthening code equations that simply add together the contributions of steel and FRP to the shear capacity of beams.

5. Conclusions

An experimental study on twelve half-scale beams was designed to assess the effect of various parameters on the effectiveness of combined flexural and shear strengthening with composite materials. The specimens were split into three series, evaluating the effects of increased steel shear reinforcement, changes in shear span-to-depth ratios, as well as the effect of different retrofit layouts and materials (FRP and TRM). The experimental results were used to calibrate a detailed non-linear finite element analysis to further complete the parametric study. It was found that the parameters of interest do influence the retrofit effectiveness in the following ways.
  • The effect of flexural retrofitting on the shear capacity of a non-shear-strengthened RC beam was found to be low, but present due to the increase in the neutral axis depth of the retrofitted beam. For specimens with combined retrofitting, the amount of longitudinal FRP sheets was not found to affect the shear capacity, as the effect of the neutral axis depth change was counteracted by an increased deflection control.
  • The effectiveness of shear strengthening was found to be significantly higher for specimens with increased shear span-to-depth ratio, echoing observations from previous studies.
  • For a reduced steel shear reinforcement, the effectiveness of the FRP retrofit was found to be less significant, albeit the magnitude of the strength increase was generally low.
  • For TRM-strengthened beams, the effect of doubling the retrofit material was found to have a proportional effect on the strength and stiffness of the specimens, where however the specimen with double-layered application suffered a shear failure instead of the flexural failure observed for the single layer application. For the FRP-strengthened specimens, the increase in strength was significantly more pronounced for the increased retrofit amount.
  • The effectiveness of TRM-strengthened specimens was found to be higher than that of FRP-strengthened specimens, despite lower mechanical strengthening ratios, due to the observed steeper crack pattern activating both directions of the orthogonal TRM fibre mesh and the applied anchorage delaying failure in the TRM-strengthened specimens.
  • The FE models indicate a good match to experimental results and the parametric FE study confirmed the experimental observations. Generally higher strength increases were obtained for higher concrete strength, higher steel shear reinforcement and higher shear span-to-depth ratios. The detailed analysis of the FE models indicates a significant complexity of the interactions between the studied parameters, leading to no straightforward trends in the retrofit effectiveness and the need for further research on this topic.

Author Contributions

Conceptualization, D.A.P., J.M. and T.R.; methodology, D.A.P. and J.M.; software, D.A.P.; validation, D.A.P.; formal analysis, D.A.P. and J.M.; investigation, D.A.P. and J.M.; resources, J.M. and T.R.; data curation, D.A.P. and J.M.; writing—original draft preparation, D.A.P.; writing—review and editing, D.A.P., J.M. and T.R.; visualization, D.A.P.; supervision, T.R.; project administration, T.R.; funding acquisition, J.M. and T.R. All authors have read and agreed to the published version of the manuscript.

Funding

This research was part of the Challenging RISK project funded by EPSRC (EP/K022377/1). The author José Melo was funded by “FCT—Fundação para a Ciência e Tecnologia”, Portugal, co-funded by the European Social Fund, namely through the post-doc fellowship, with reference SFRH/BPD/115352/2016 and CONSTRUCT—Instituto de I&D em Estruturas e Construções—funded by national funds through the FCT/MCTES (PIDDAC) with Base Funding—UIDB/04708/2020 and Programmatic Funding—UIDP/04708/2020.

Data Availability Statement

The data presented in this study are available on request from the corresponding author.

Acknowledgments

The authors acknowledge the staff of the Concrete Laboratory at UCL for the support during the experimental campaign. Part of the experimental work was carried out by Nderim Azemi as part of his MSc thesis. The CFRP and TRM material used in this experimental campaign are kindly provided by S&P reinforcement.

Conflicts of Interest

The authors declare no conflict of interest.

Appendix A

Appendix A.1. Concrete in Compression

The stress–strain of concrete in compression is modelled in three phases. Initially, a linear elastic part is defined by the initial stiffness Ec up to a stress fc0, defined as 40% of the failure strength fcm in accordance with Eurocode 2 [54], where Ec can be reasonably accurately defined using the Eurocode 2 [34] formulation:
E c = 22 ( f c m / 10 ) 0.3
A non-linear hardening phase up to the mean concrete strength fcm is defined based on the fib-model code [55], which was found to fit experimental data very well [47]:
σ c ( 2 ) = E c i ε f c m ( ε ε c 1 ) 2 1 + ( E c i ε c 1 f c m 2 ) ( ε ε c 1 ) f c m
where, according to Eurocode 2, εc1 is the strain of concrete taken as [54]:
ε c 1 ( ) = 0.7 f c m 0.31
and Eci is defined as the secant modulus [55]:
E c i = 1 2 E c ( f c m ε c 1 ) 2 f c m ε c 1 + 3 2 E c
Finally, the softening phase is described by a decreasing function [56] that takes into account the crushing fracture energy, Gcl, and a characteristic length, lc. For the former a value between 10 and 25 kN/m can be taken for medium strength concrete [57] and adjusted to fit experimental curves [47]. The characteristic length is dependent on the element geometry and is taken as the mesh size in the case of cubic elements.
σ c ( 3 ) = ( 2 + γ c f c m ε c 1 2 f c m γ c ε + γ c ε 2 2 ε c 1 ) 1
where γc is the descent function that incorporates the ratio of Gcl and lc:
γ c = π 2 f c m ε c 1 2 [ G c l l c 1 2 f c m ( ε c 1 ( 1 b c ) + b c f c m / E c ) ] 2
where bc is a constant factor linking corresponding plastic strains with inelastic strains and takes values between 0 and 1. In this study bc is taken as 0.7 based on experimental evidence on RC beams [48].
The damage function for concrete, dc, can be defined based on the relationship between inelastic and plastic strain [48]:
d c = 1 σ c / E c ε c i n ( 1 b c ) + σ c / E c
where the inelastic strain is defined in the CDP model as:
ε c i n = ε σ c / E c

Appendix A.2. Concrete in Tension

The stress-strain relation for tensile loading consists of a linear part up to the tensile strength fct and a nonlinear descending tensile softening branch. This post-peak evolution of concrete tensile strength is an important aspect of the model as it implicitly controls the concrete–steel bond and load-transfer after cracking of the concrete section.
For the parts of the model without steel reinforcement, using a stress–strain relationship for tensile softening will introduce considerable mesh sensitivity according [58]. To avoid this, it is preferable to use fracture energy or stress-crack opening laws. Bilinear crack opening laws by Hillerborg [59] or exponential laws by Cornelissen [60] and Hordijk [61] are the most commonly used. Here, the law by Hordijk (1992) is used, as it is reported to be the most accurate model [58]. The relationship for the tensile stress, σt (w), at crack opening displacement (w), normalised by the tensile strength of concrete, fct, is given by:
σ t ( w ) f c t = [ 1 + ( c 1 w w c ) 3 ] e c 2   w w c w w c ( 1 + c 1 3 ) e c 2
where wc is the crack opening at which stress can no longer be transferred. For normal weight concrete, Reinhardt et al. (1986) propose values for material constants c1 = 3 and c2 = 6.93, and express wc as a function of the fracture energy Gf, with wc = 5.14 Gf/ft. The cracking energy can be determined from Equations (5.1)–(9) of the CEB-fib model code (2010):
G f = 73 f c m 0.18
and fctm can be calculated according to EC 2 [54] as:
f c t m = 0.3 f c m 2 / 3
The principle of the fictitious crack model [62] can be used to convert the crack opening law to a stress–strain relationship, by expressing the crack opening w as a product of the inelastic tensile strain, εt, and the characteristic length (i.e., mesh size):
w = l c ( ε t σ t / E )
ε t = w l c + σ t / E
Accordingly, positive plastic strain in the analysis corresponds to initiation of cracking in the model [63]. Finally, the damage parameter for tension, dt, can be found in the same way as for compression, with bt, the ratio of plastic to inelastic tensile strain, taken as 0.1 [48]:
d t = 1 σ t / E c ε t i n ( 1 b t ) + σ t / E c

Appendix A.3. Further Parameters of Importance

Finally, parameters for the yield function of the models have to be defined for the CDP model in ABAQUS. These parameters will not be described in detail but some information with regards to the choice of their values will be given here. A summary of the chosen values is given in Table A1. More detail can be found in [48,64].
Default values are given in the ABAQUS theory manual for some of the parameters. These are the flow potential eccentricity (e), the ratio of initial equi-biaxial compressive yield stress to initial uniaxial compressive yield stress, fb0/fc0, and the ratio of the second stress invariant on the tensile meridian, Kc. Values for these constants can be obtained from experiments, but the default values have proven to be accurate and give good results in previous studies [48,49,64,65]. Further parameters include the dilation angle ψ, which corresponds to the concrete internal friction angle, assumed to be between 36–40° according to an in-depth study by Kmiecik and Kaminski [66], and a viscosity parameter, µ, which controls the influence of the hydrostatic stress on the yield/damage potential, for which a value of 0 is taken as default. Finally, the Poisson’s ratio for concrete, v, is assumed to be 0.2 [54].
Table A1. Summary of chosen parameters for CDP model.
ParameterEfb0/fc0KcψµV
Value0.11.162/336°00.2

References

  1. Barros, J.A.O.; Dias, S.J.E.; Lima, J.L.T. Efficacy of CFRP-Based Techniques for the Flexural and Shear Strengthening of Concrete Beams. Cem. Concr. Compos. 2007, 29, 203–217. [Google Scholar] [CrossRef]
  2. Chen, J.F.; Teng, J.G. Shear Capacity of FRP-Strengthened RC Beams: FRP Debonding. Constr. Build. Mater. 2003, 17, 27–41. [Google Scholar] [CrossRef]
  3. Lu, X.Z.; Chen, J.F.; Ye, L.P.; Teng, J.G.; Rotter, J.M. RC Beams Shear-Strengthened with FRP: Stress Distributions in the FRP Reinforcement. Constr. Build. Mater. 2009, 23, 1544–1554. [Google Scholar] [CrossRef]
  4. Mofidi, A.; Chaallal, O. Tests and Design Provisions for Reinforced-Concrete Beams Strengthened in Shear Using FRP Sheets and Strips. Int. J. Concr. Struct. Mater. 2014, 8, 117–128. [Google Scholar] [CrossRef] [Green Version]
  5. Bousselham, A.; Chaallal, O. Effect of Transverse Steel and Shear Span on the Performance of RC Beams Strengthened in Shear with CFRP. Compos. Part B Eng. 2006, 37, 37–46. [Google Scholar] [CrossRef]
  6. Foster, R.; Brindley, M.; Lees, J.; Ibell, T.; Morley, C.; Darby, A.; Evernden, M. Experimental Investigation of Reinforced Concrete T-Beams Strengthened in Shear with Externally Bonded CFRP Sheets. J. Compos. Constr. 2016, 21, 04016086. [Google Scholar] [CrossRef] [Green Version]
  7. Koutas, L.; Triantafillou, T. Use of Anchors in Shear Strengthening of Reinforced Concrete T-Beams with FRP. J. Compos. Constr. 2013, 17, 101–107. [Google Scholar] [CrossRef]
  8. Li, W.; Leung, C.K.Y. Shear Span–Depth Ratio Effect on Behavior of RC Beam Shear Strengthened with Full-Wrapping FRP Strip. J. Compos. Constr. 2016, 20, 04015067. [Google Scholar] [CrossRef] [Green Version]
  9. Chalioris, C.E.; Zapris, A.G.; Karayannis, C.G. U-Jacketing Applications of Fiber-Reinforced Polymers in Reinforced Concrete T-Beams against Shear—Tests and Design. Fibers 2020, 8, 13. [Google Scholar] [CrossRef] [Green Version]
  10. Foster, R.M.; Morley, C.T.; Lees, J.M. Shear Capacity of Reinforced Concrete T-Beams Retrofit with Externally Bonded CFRP Fabric: A New Perspective. J. Struct. Eng. 2020, 146, 04020253. [Google Scholar] [CrossRef]
  11. Ebead, U.; Shrestha, K.C.; Afzal, M.S.; El Refai, A.; Nanni, A. Effectiveness of Fabric-Reinforced Cementitious Matrix in Strengthening Reinforced Concrete Beams. J. Compos. Constr. 2017, 21, 04016084. [Google Scholar] [CrossRef]
  12. Tetta, Z.C.; Koutas, L.N.; Bournas, D.A. Shear Strengthening of Concrete Members with TRM Jackets: Effect of Shear Span-to-Depth Ratio, Material and Amount of External Reinforcement. Compos. Part B Eng. 2018, 137, 184–201. [Google Scholar] [CrossRef]
  13. Pohoryles, D.A.; Melo, J.; Rossetto, T.; Fabian, M.; McCague, C.; Stavrianaki, K.; Lishman, B.; Sargeant, B. Use of DIC and AE for Monitoring Effective Strain and Debonding in FRP and FRCM-Retrofitted RC Beams. J. Compos. Constr. 2017, 21, 04016057. [Google Scholar] [CrossRef]
  14. Thermou, G.E.; Katakalos, K.; Manos, G. Experimental Investigation of Substandard RC Columns Confined with SRG Jackets under Compression. Compos. Struct. 2018, 184, 56–65. [Google Scholar] [CrossRef]
  15. Thermou, G.E.; Papanikolaou, V.K.; Lioupis, C.; Hajirasouliha, I. Steel-Reinforced Grout (SRG) Strengthening of Shear-Critical RC Beams. Constr. Build. Mater. 2019, 216, 68–83. [Google Scholar] [CrossRef]
  16. Wakjira, T.G.; Ebead, U. Shear Span-to-Depth Ratio Effect on Steel Reinforced Grout Strengthened Reinforced Concrete Beams. Eng. Struct. 2020, 216, 110737. [Google Scholar] [CrossRef]
  17. Funari, M.F.; Verre, S. The Effectiveness of the DIC as a Measurement System in SRG Shear Strengthened Reinforced Concrete Beams. Crystals 2021, 11, 265. [Google Scholar] [CrossRef]
  18. ACI. ACI 440.2R-08—Guide for the Design and Construction of Externally Bonded FRP Systems for Strengthening Concrete Structures; American Concrete Institute: Farmington Hills, MI, USA, 2008; ISBN 978-0-87031-285-4. [Google Scholar]
  19. CSA (Ed.) S806-12—Design and Construction of Building Structures with Fibre-Reinforced Polymers; CSA: Toronto, ON, Canada, 2012. [Google Scholar]
  20. FIB (Ed.) Fib Bulletin 14—Externally Bonded FRP Reinforcement for RC Structures: Technical Report on the Design and Use of Externally Bonded Fibre Reinforced Polymer Reinforcement (FRP EBR) for Reinforced Concrete Structures; FIB: Lausanne, Switzerland, 2001; ISBN 2-88394-054-1. [Google Scholar]
  21. CNR (Ed.) DT 200.R1/2012—Guide for the Design and Construction of Externally Bonded FRP Systems for Strengthening Existing Structures—Materials, RC and PC Structures, Masonry Structures; CNR: Rome, Italy, 2012. [Google Scholar]
  22. Standards Australia Limited. HB 305—Design Handbook for RC Structures Retrofitted with FRP and Metal Plates: Beams and Slabs; Sydney Standards Australia: Sydney, Australia, 2008; ISBN 0-7337-8744-4. [Google Scholar]
  23. BSI. CEN BS EN 1998-3:2005—Eurocode 8. Design of Structures for Earthquake Resistance. Assessment and Retrofitting of Buildings; BSI: London, UK, 2006. [Google Scholar]
  24. Lima, J.L.; Barros, J.A. Reliability Analysis of Shear Strengthening Externally Bonded FRP Models. Proc. ICE—Struct. Build. 2011, 164, 43–56. [Google Scholar] [CrossRef] [Green Version]
  25. El-Sayed, A.K. Effect of Longitudinal CFRP Strengthening on the Shear Resistance of Reinforced Concrete Beams. Compos. Part B Eng. 2014, 58, 422–429. [Google Scholar] [CrossRef]
  26. Foster, R.M.; Lees, J.M.; Morely, C.T. An Experimental Investigation into the Effect of Externally Bonded CFRP Fabrics on the Shear Behaviour of Reinforced Concrete T-Beams; ACIC 2015: Cambridge, UK, 2015. [Google Scholar]
  27. Chen, G.; Teng, J.; Chen, J. Shear Strength Model for FRP-Strengthened RC Beams with Adverse FRP-Steel Interaction. J. Compos. Constr. 2013, 17, 50–66. [Google Scholar] [CrossRef]
  28. Mofidi, A.; Chaallal, O. Shear Strengthening of RC Beams with EB FRP: Influencing Factors and Conceptual Debonding Model. J. Compos. Constr. 2011, 15, 62–74. [Google Scholar] [CrossRef]
  29. El-Ghandour, A.A. Experimental and Analytical Investigation of CFRP Flexural and Shear Strengthening Efficiencies of RC Beams. Constr. Build. Mater. 2011, 25, 1419–1429. [Google Scholar] [CrossRef]
  30. Dong, J.; Wang, Q.; Guan, Z. Structural Behaviour of RC Beams with External Flexural and Flexural–Shear Strengthening by FRP Sheets. Compos. Part B Eng. 2013, 44, 604–612. [Google Scholar] [CrossRef]
  31. Hawileh, R.A.; Nawaz, W.; Abdalla, J.A.; Saqan, E.I. Effect of Flexural CFRP Sheets on Shear Resistance of Reinforced Concrete Beams. Compos. Struct. 2015, 122, 468–476. [Google Scholar] [CrossRef]
  32. Osman, B.H.; Wu, E.; Ji, B.; Abdulhameed, S.S. Effect of Reinforcement Ratios on Shear Behavior of Concrete Beams Strengthened with CFRP Sheets. HBRC J. 2018, 14, 29–36. [Google Scholar] [CrossRef] [Green Version]
  33. Tetta, Z.C.; Koutas, L.N.; Bournas, D.A. Textile-Reinforced Mortar (TRM) versus Fiber-Reinforced Polymers (FRP) in Shear Strengthening of Concrete Beams. Compos. Part B Eng. 2015, 77, 338–348. [Google Scholar] [CrossRef] [Green Version]
  34. CEN. BS EN 1992-1-1:2004 Eurocode 2. Design of Concrete Structures. Part 1-1; BSI: London, UK, 2008; ISBN 978-0-580-61759-1. [Google Scholar]
  35. Triantafillou, T.; Antonopoulos, C. Design of Concrete Flexural Members Strengthened in Shear with FRP. J. Compos. Constr. 2000, 4, 198–205. [Google Scholar] [CrossRef]
  36. Pohoryles, D.A.; Melo, J.; Rossetto, T.; Varum, H.; Bisby, L. Seismic Retrofit Schemes with FRP for Deficient RC Beam-Column Joints: State-of-the-Art Review. J. Compos. Constr. 2019, 23, 03119001. [Google Scholar] [CrossRef] [Green Version]
  37. Pohoryles, D.A.; Rossetto, T. A Critical Evaluation of Current Design Guidelines for the Seismic Retrofit of Beam-Column Joints with FRP. In Proceedings of the 2nd Second European Conference on Earthquake Engineering and Seismology, Istanbul, Turkey, 8–29 August 2014. [Google Scholar]
  38. CNR (Ed.) DT 215/2018—Guide for the Design and Construction of Externally Bonded Fibre Reinforced Inorganic Matrix Systems for Strengthening Existing Structures; CNR: Rome, Italy, 2020. [Google Scholar]
  39. ACI. ACI 549.4R—Guide to Design and Construction of Externally Bonded Fabric-Reinforced Cementitious Matrix (FRCM) Systems for Repair and Strengthening Concrete and Masonry Structures; American Concrete Institute: Farmington Hills, MI, USA, 2013. [Google Scholar]
  40. Hu, B.; Wu, Y.-F. Effect of Shear Span-to-Depth Ratio on Shear Strength Components of RC Beams. Eng. Struct. 2018, 168, 770–783. [Google Scholar] [CrossRef]
  41. Antonopoulos, C.; Triantafillou, T. Experimental Investigation of FRP-Strengthened RC Beam-Column Joints. J. Compos. Constr. 2003, 7, 39–49. [Google Scholar] [CrossRef]
  42. ABAQUS (Ed.) ABAQUS Theory Manual Version 6.11; Dassault Systèmes: Vélizy-Villacoublay, France, 2011. [Google Scholar]
  43. Pohoryles, D.A. Realistic FRP Seismic Strengthening Schemes For Interior Reinforced Concrete Beam-Column Joints. Ph.D. Thesis, University College London, London, UK, 2017. [Google Scholar]
  44. Chen, G.M.; Chen, J.F.; Teng, J.G. On the Finite Element Modelling of RC Beams Shear-Strengthened with FRP. Constr. Build. Mater. 2012, 32, 13–26. [Google Scholar] [CrossRef] [Green Version]
  45. Lubliner, J.; Oliver, J.; Oller, S.; Oñate, E. A Plastic-Damage Model for Concrete. Int. J. Solids Struct. 1989, 25, 299–326. [Google Scholar] [CrossRef]
  46. Lee, J.; Fenves, G. Plastic-Damage Model for Cyclic Loading of Concrete Structures. J. Eng. Mech. 1998, 124, 892–900. [Google Scholar] [CrossRef]
  47. Krätzig, W.B.; Pölling, R. An Elasto-Plastic Damage Model for Reinforced Concrete with Minimum Number of Material Parameters. Comput. Struct. 2004, 82, 1201–1215. [Google Scholar] [CrossRef]
  48. Birtel, V.; Mark, P. Parameterised Finite Element Modelling of RC Beam Shear Failure. In Proceedings of the 2006 ABAQUS User’s Conference, Boston, MA, USA, 23–25 May 2006; pp. 95–108. [Google Scholar]
  49. López-Almansa, F.; Alfarah, B.; Oller, S. Numerical Simulation of RC Frame Testing with Damaged Plasticity Model. Comparison with Simplified Models. In Proceedings of the Second European Conference on Earthquake Engineering and Seismology, Istanbul, Turkey, 25–29 August 2014. [Google Scholar]
  50. Luk, S.; Kuang, J. Seismic Behaviour of RC Exterior Wide Beam-Column Joints. In Proceedings of the 15th World Conference on Earthquake Engineering, Lisbon, Portugal, 24–28 September 2012. [Google Scholar]
  51. Mark, P.; Bender, M. Computational Modelling of Failure Mechanisms in Reinforced Concrete Structures. Facta Univ. Ser. Archit. Civ. Eng. 2010, 8, 1–12. [Google Scholar] [CrossRef]
  52. Wang, Q.; Liu, Y.Q.; Lebet, J.P. Nonlinear Finite-Element Analysis of the Shear Behaviour of Stud Connectors. In Proceedings of the Eleventh International Conference on Computational Structure Technology, Dubrovnik, Croatia, 4–7 September 2012. [Google Scholar]
  53. Ibrahim, A.M.; Mahmood, M.S. Finite Element Modeling of Reinforced Concrete Beams Strengthened with FRP Laminates. Eur. J. Sci. Res. 2009, 30, 526–541. [Google Scholar]
  54. CEN. BS EN 1996-1-1:2005 Eurocode 6. Design of Masonry Structures—Part 1-1: General Rules for Reinforced and Unreinforced Masonry Structures; BSI: London, UK, 2005. [Google Scholar]
  55. FIB (Ed.) CEB-FIP Model Code for Concrete Structures; FIB: Lausanne, Switzerland, 1990. [Google Scholar]
  56. Feenstra, P.H.; de Borst, R. A Constitutive Model for Reinforced Concrete Based on Stress Decomposition. ASCE J. Eng. Mech. 1995, 121, 587–595. [Google Scholar] [CrossRef] [Green Version]
  57. Vonk, R.A. A Micromechanical Investigation of Solftening of Concrete Loaded in Compression. Heron 1993, 38, 3–90. [Google Scholar]
  58. Malm, R. Predicting Shear Type Crack Initiation and Growth in Concrete with Non-Linear Finite Element Method. Ph.D. Thesis, KTH Royal Institute of Technology, Stockholm, Sweden, 2009. [Google Scholar]
  59. Hillerborg, A. The Theoretical Basis of a Method to Determine the Fracture Energy Gf of Concrete, Matériaux et Struct. Rilem 1986, 18, 106. [Google Scholar]
  60. Reinhardt, H.; Cornelissen, H.; Hordijk, D. Tensile Tests and Failure Analysis of Concrete. J. Struct. Eng. 1986, 112, 2462–2477. [Google Scholar] [CrossRef]
  61. Hordijk, D.A. Tensile and Tensile Fatigue Behaviour of Concrete; Experiments, Modelling and Analyses. Heron 1992, 37, 3–79. [Google Scholar]
  62. Hillerborg, A. Analysis of One Single Crack. Fract. Mech. Concr. Dev. Civ. Eng. 1983, 223–249. [Google Scholar]
  63. Obaidat, Y.T.; Heyden, S.; Dahlblom, O. The Effect of CFRP and CFRP/Concrete Interface Models When Modelling Retrofitted RC Beams with FEM. Compos. Struct. 2010, 92, 1391–1398. [Google Scholar] [CrossRef]
  64. Jankowiak, T.; Lodygowski, T. Identification of Parameters of Concrete Damage Plasticity Constitutive Model. Found. Civ. Environ. Eng. 2005, 6, 53–69. [Google Scholar]
  65. Sinaei, H.; Shariati, M.; Abna, A.H.; Aghaei, M.; Shariati, A. Evaluation of Reinforced Concrete Beam Behaviour Using Finite Element Analysis by ABAQUS. Sci. Res. Essays 2012, 7, 2002–2009. [Google Scholar] [CrossRef] [Green Version]
  66. Kmiecik, P.; Kamiński, M. Modelling of Reinforced Concrete Structures and Composite Structures with Concrete Strength Degradation Taken into Consideration. Arch. Civ. Mech. Eng. 2011, 11, 623–636. [Google Scholar] [CrossRef]
Figure 1. Summary of test parameters.
Buildings 11 00520 g001
Figure 2. Anchorage system for TRM-strengthened beams.
Buildings 11 00520 g002
Figure 3. Example of FRP strengthening of beams in Ghent, Belgium.
Buildings 11 00520 g003
Figure 4. Shear force vs mid-span deflection for all tested specimens.
Buildings 11 00520 g004
Figure 5. Observed failure in beams of series 1—(a) S1-C, (b) S1-FRP1s and (c) S1-FRP1c.
Buildings 11 00520 g005
Figure 6. Observed failure in beams (a) S1-TRM1c and (b) S1-TRM2c.
Buildings 11 00520 g006
Figure 7. Observed failure in beams of series 2—(a) S2-C, (b) S2-FRP0 and (c) S2-FRP1c.
Buildings 11 00520 g007
Figure 8. Observed failure in beams of series 3—(a) S3-C, (b) S3-FRP1s and (c) S3-FRP2s.
Buildings 11 00520 g008
Figure 9. Effect of a/d ratio on shear-strengthening effectiveness.
Buildings 11 00520 g009
Figure 10. Effect of strengthening layers on shear-strengthening effectiveness.
Buildings 11 00520 g010
Figure 11. Quarter model of the control beam as modelled in Abaqus.
Buildings 11 00520 g011
Figure 12. FE and experimental force vs mid-span deflection plots for the control beam.
Buildings 11 00520 g012
Figure 13. Comparison of cracking and plastic strain between model and experiment for S1-C.
Buildings 11 00520 g013
Figure 14. Comparison of cracking and plastic strain between model and experiment for S1-FRP1s.
Buildings 11 00520 g014
Figure 15. Effect of concrete strength on the behaviour of specimen S1-C.
Buildings 11 00520 g015
Figure 16. FE analysis on the effect of concrete strength on the shear strength of FRP-strengthened beams (difference to control specimen in %).
Buildings 11 00520 g016
Figure 17. FE analysis on the effect of shear span on the shear strength of FRP-strengthened beams (difference to control specimen in %).
Buildings 11 00520 g017
Figure 18. FE analysis on the effect of steel shear reinforcement on the shear strength of FRP-strengthened beams (difference to control specimen in %).
Buildings 11 00520 g018
Table 1. Reinforcement detailing and loading arrangement for the three test series (in mm).
SeriesReinforcement DetailingShear Span
Series 1: HS-LA Buildings 11 00520 i001
ρw = 0.38%
Buildings 11 00520 i002
a/d = 2.9
Series 2: HS-HA Buildings 11 00520 i003
ρw = 0.38%
Buildings 11 00520 i004
a/d = 3.6
Series 3: LS-LA Buildings 11 00520 i005
ρw = 0.19%
Buildings 11 00520 i006
a/d = 2.9
Table 2. Material properties of carbon FRP sheets and textile.
MaterialFibre Weight
(g/m2)
tf
(mm)
Ef
(GPa)
CFRP sheet4000.223195
CTRM mesh80 (each direction)0.044 (each direction)195
Table 3. Experimental specimens and retrofit details.
Beam IDfcu
(MPa)
C.O.V
(%)
ρw
(%)
a/dMaterialShear
Retrofit
ρfwffdd,e,U
(MPa)
ωfw
Series 1: HS-LA
S1-C30.78.6%0.38%2.9nonenone///
S1-FRP1s30.17.1%FRPstrips0.13%665.00.6
S1-FRP1c25.07.0%FRPcont.0.45%380.01.1
S1-FRP2c24.82.0%FRPcont.0.45%380.01.1
S1-TRM1c29.017.6%TRMcont.0.09%844.50.5
S1-TRM2c25.08.4%TRMcont.0.18%844.51.0
Series 2: HS-HA
S2-C20.44.9%0.38%3.6nonenone///
S2-FRP019.68.9%FRPnone///
S2-FRP1c28.11.6%FRPcont.0.45%450.31.3
Series 3: LS-LA
S3-C23.38.4%0.19%2.9nonenone///
S3-FRP1s24.210.9%FRPstrips0.14%647.41.2
S3-FRP2s26.78.7%FRPstrips0.26%597.82.1
Table 4. Retrofit detailing for all specimens.
SeriesSpecimens
S1 FRPS1-FRP1s
Buildings 11 00520 i007
ρfw = 0.13%; ωfw = 0.6
S1-FRP1c
Buildings 11 00520 i008
ρfw = 0.45%; ωfw = 1.1
ρfl = 0.12%
S1-FRP2c
Buildings 11 00520 i009
ρfw = 0.45%; ωfw = 1.1
ρfl = 0.25%
S1 TRMS1-TRM1c
Buildings 11 00520 i010
ρfw = 0.09%; ωfw = 0.5
S1-TRM2c
Buildings 11 00520 i011
ρfw = 0.18%; ωfw = 1.0
S2S2-FRP0
Buildings 11 00520 i012
ρfw = 0.0%; ωfw = 0.0
S2-FRP1c
Buildings 11 00520 i013
ρfw = 0.45%; ωfw = 1.3
S3S3-FRP1s
Buildings 11 00520 i014
ρfw = 0.14%; ωfw = 1.2
S3-FRP2s
Buildings 11 00520 i015
ρfw = 0.26%; ωfw = 2.1
Table 5. Experimental results for all beam specimens.
Beam IDVmax
(kN)
ΔVmax
(%)
δmax
(mm)
Ki
(kN/mm)
ΔKi
(%)
Crack Angle
(°)
Series 1: HS-LA
S1-C34.5 */13.25.5/90
S1-FRP1s38.310.8%9.85.75%19
S1-FRP1c36.86.6%11.25.4−2%20
S1-FRP2c37.07.0%8.36.214%21
S1-TRM1c40.5 *17.4%13.46.927%90
S1-TRM2c46.233.7%15.47.945%37
Series 2: HS-HA
S2-C19.9/8.53.6/32
S2-FRP021.47.5%9.13.61%29/34
S2-FRP1c28.744.2%11.54.525%39
Series 3: LS-LA
S3-C18.4/5.44.3/27
S3-FRP1s19.45.4%4.45.119%29
S3-FRP2s24.231.3%7.14.2−3%33
* specimens did not fail in shear.
Table 6. Comparison of FE and experimental maximum shear force.
Beam IDVnum
(kN)
ΔVnum
(%)
Series 1: HS-LA
S1-C35.1+1.6%
S1-FRP1s37.7−1.4%
Series 3: LS-LA
S3-C18.3−0.3%
S3-FRP2s23.2−4.0%
Table 7. Variation of parameters for parametric FE study.
Beam IDfcu
(MPa)
ρw
(%)
a/dρfw
(%)
Effect of concrete
C15-RF4-SP1150.4%2.90.1 or 0.2%
C20-RF4-SP1200.4%2.90.1 or 0.2%
C25-RF4-SP1250.4%2.90.1 or 0.2%
Effect of shear span
C25-RF4-SP1250.4%2.90.1 or 0.2%
C25-RF4-SP2250.4%3.30.1 or 0.2%
C25-RF4-SP3250.4%3.60.1 or 0.2%
Effect of shear reinforcement
C25-RF2-SP1250.2%2.90.1 or 0.2%
C25-RF3-SP1250.3%2.90.1 or 0.2%
C25-RF4-SP1250.4%2.90.1 or 0.2%
Table 8. Summary of the parametric finite-element modelling results.
Beam IDVnumΔVnumδmaxσstσFRP
(kN)(%)(mm)(MPa)(MPa)
Effect of concrete
C15-RF4-SP126.5 10.0342.7
C15-RF4-SP1-FRP125.5−4.0%5.7282.8637.4
C15-RF4-SP1-FRP226.4−0.7%6.8373.41250.1
C20-RF4-SP130.1 8.1312.6
C20-RF4-SP1-FRP128.0−6.8%5.3309.6590.6
C20-RF4-SP1-FRP229.2−3.0%5.5405.01213.3
C25-RF4-SP130.7 9.0342.7
C25-RF4-SP1-FRP132.4+5.4%7.2331.7745.0
C25-RF4-SP1-FRP234.311.6%7.1401.71677.6
Effect of shear span
C25-RF4-SP130.7 9.0342.7
C25-RF4-SP1-FRP132.4+5.4%7.2331.7745.0
C25-RF4-SP1-FRP234.3+11.6%7.1401.71677.6
C25-RF4-SP227.7 10.2254.3
C25-RF4-SP2-FRP133.1+19.6%9.6346.0608.2
C25-RF4-SP2-FRP232.5+17.2%7.8407.42197.0
C25-RF4-SP325.7 10.1243.8
C25-RF4-SP3-FRP130.9+20.2%9.2296.4620.3
C25-RF4-SP3-FRP228.8+11.9%8.1402.01694.9
Effect of shear reinforcement
C25-RF2-SP127.5 6.2326.6
C25-RF2-SP1-FRP129.9+8.7%5.7382.8701.1
C25-RF2-SP1-FRP230.2+9.8%6.1403.41247.3
C25-RF3-SP130.5 7.9328.90.0
C25-RF3-SP1-FRP134.6+13.6%7.4380.5677.8
C25-RF3-SP1-FRP233.6+10.4%7.0413.31188.1
C25-RF4-SP130.7 9.0342.7
C25-RF4-SP1-FRP132.4+5.4%7.2331.7745.0
C25-RF4-SP1-FRP234.3+11.6%7.1401.71677.6
Publisher’s Note: MDPI stays neutral with regard to jurisdictional claims in published maps and institutional affiliations.

