
Physical, Chemical and Geotechnical Characterization of Wet Flue Gas Desulfurization Gypsum and Its Potential Application as Building Materials


Abstract
:1. Introduction
2. Materials and Methods
2.1. The Raw Material
2.2. pH and Density
2.3. Geotechnical Properties
2.3.1. Sieve Analysis
2.3.2. Gradation
2.3.3. Compaction Test
2.3.4. Evaluation of Plasticity
2.4. Mix Proportions and Preparation of Bricks
2.5. Toxicity Characteristic Leaching Procedure (TCLP)
2.6. Analytical Techniques
3. Results and Discussion
3.1. Physicochemical Properties of WFGD Gypsum
3.1.1. pH and Relative Density
3.1.2. Chemical and Mineralogical Composition
3.1.3. Toxicity Characteristic Leaching Procedure (TCLP)
3.2. Geotechnical Characterization of WFGD Gypsum
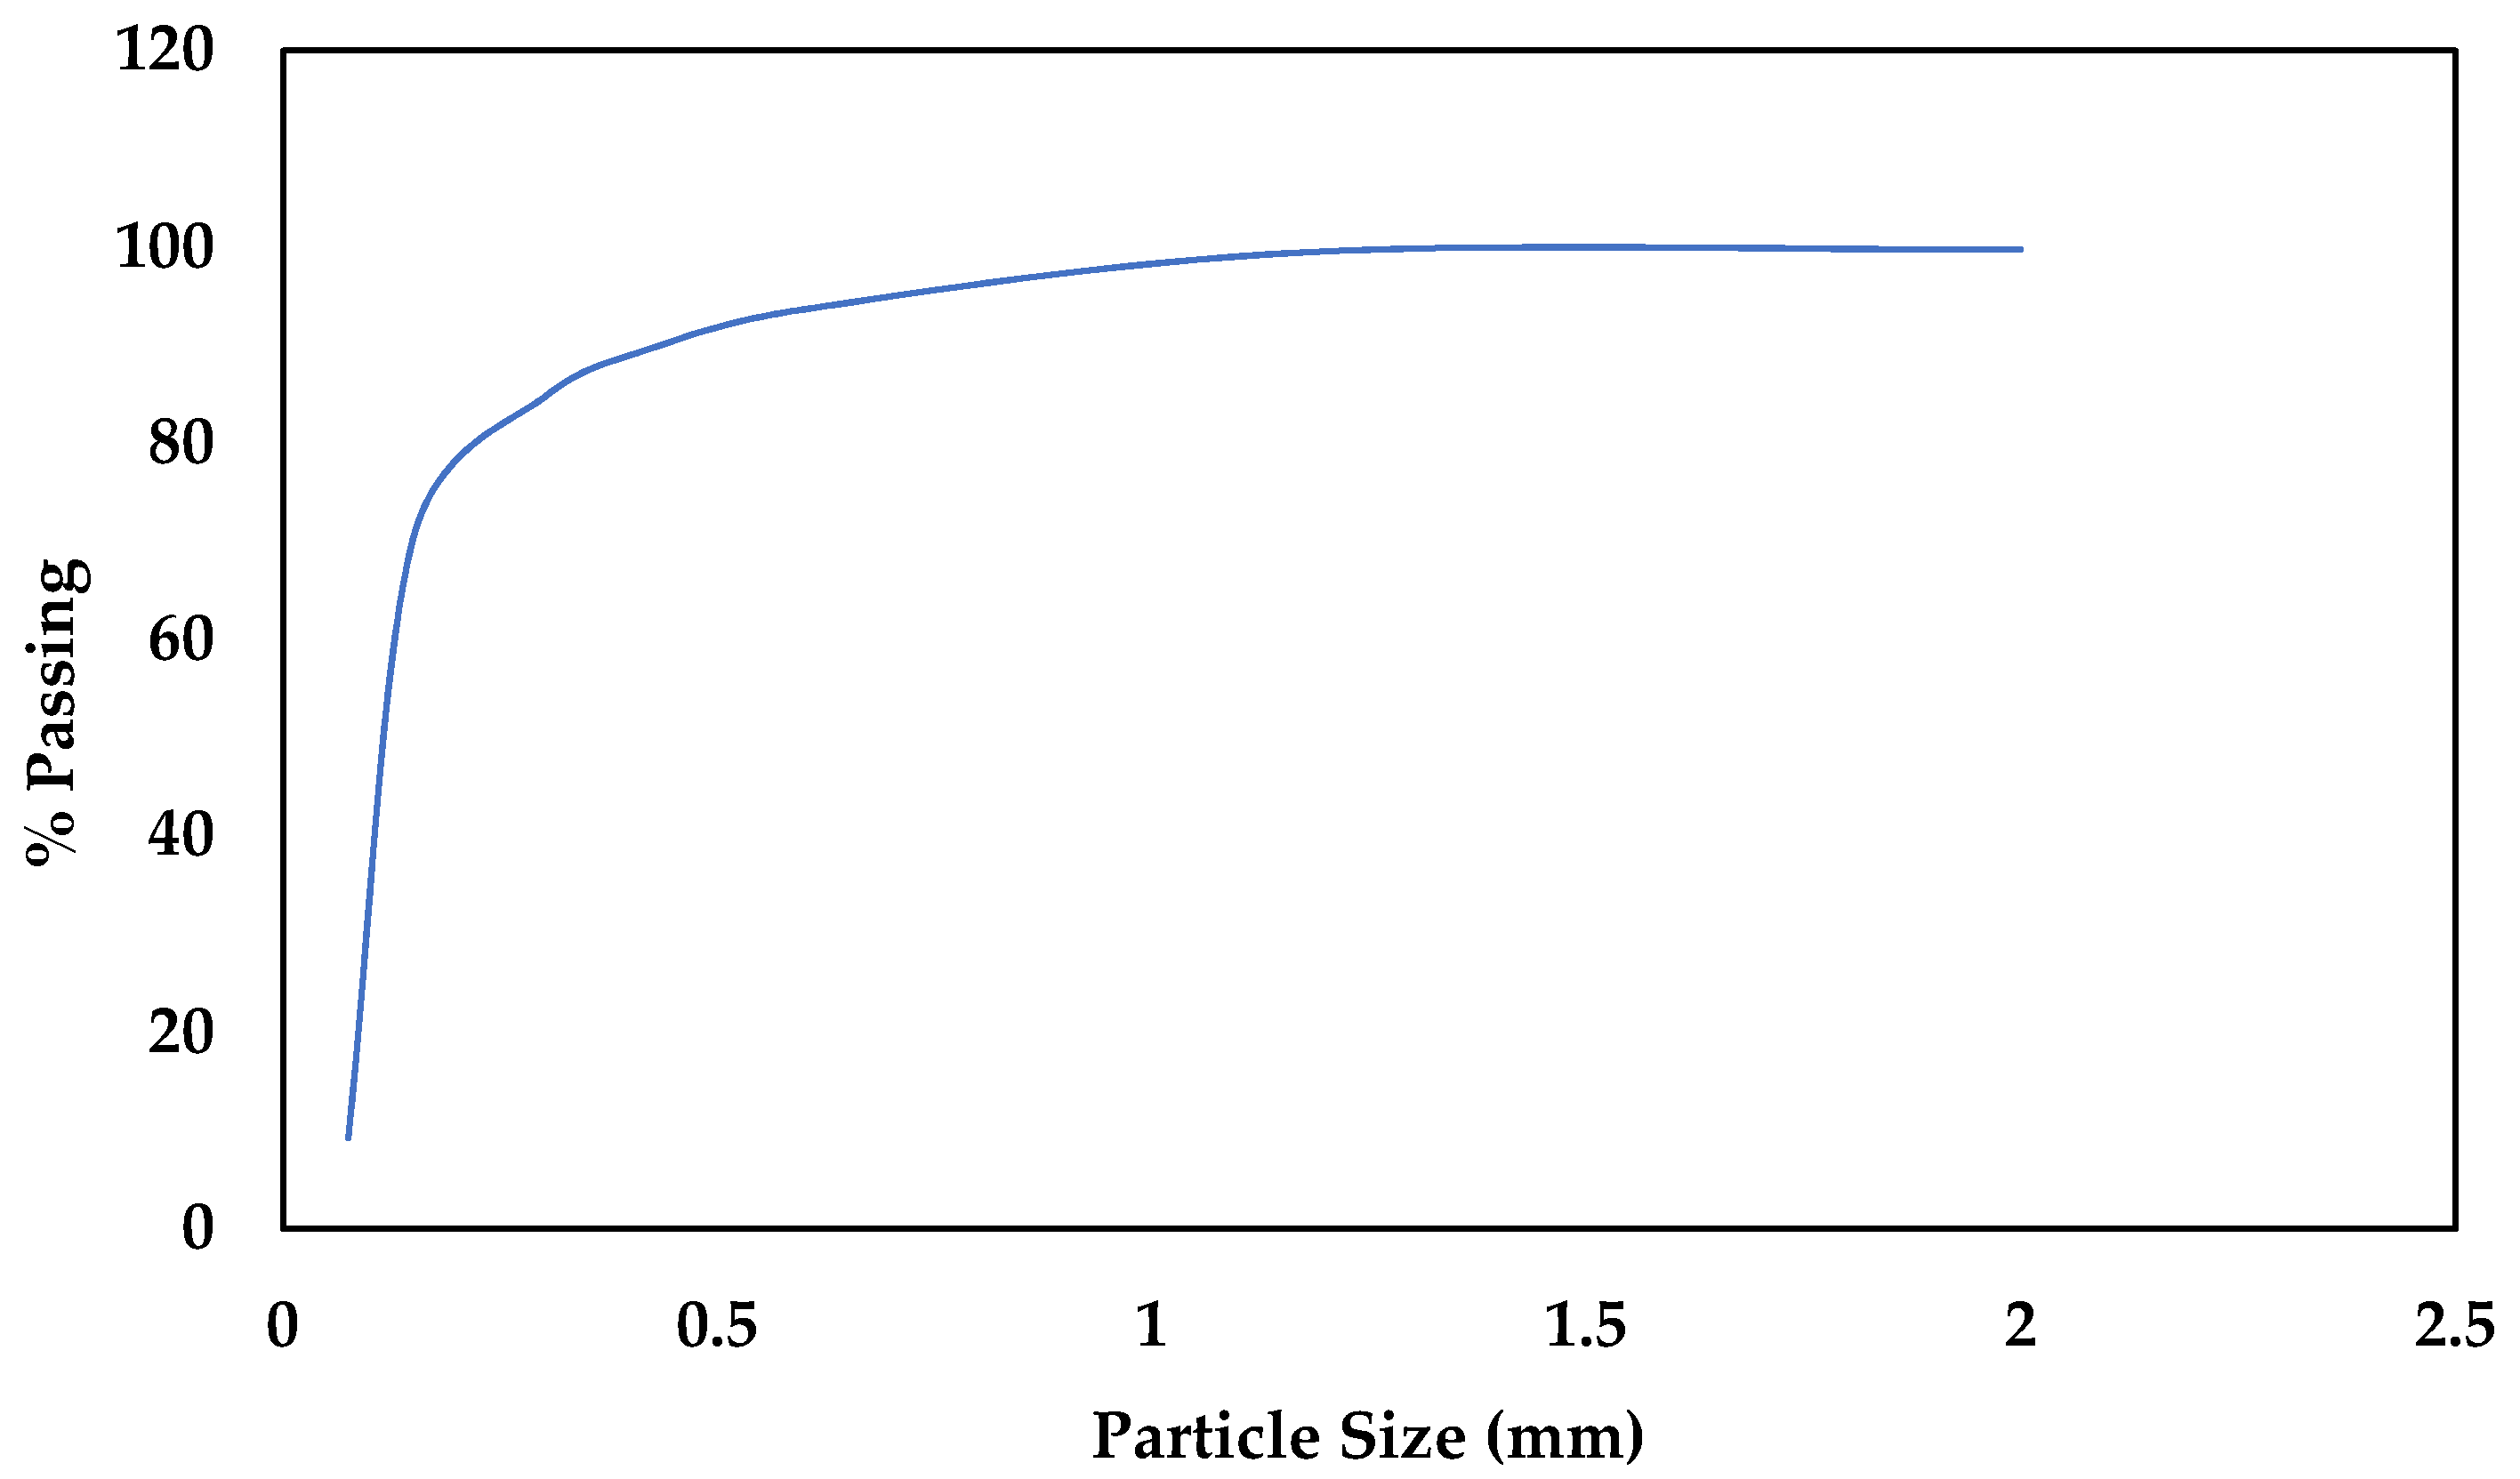
3.2.1. Particle Size Distribution
3.2.2. Maximum Dry Density (MDD) and Optimum Moisture Content (OMC)
3.2.3. Liquid Limit and Plastic Limit Tests
3.2.4. Linear Shrinkage
3.3. Characterization of WFGD Gypsum-Based Bricks
3.3.1. Effect of Curing Time
UCS
Mineralogy
FTIR Analysis
SEM/EDS Analysis
3.3.2. The Effect of Curing Temperature
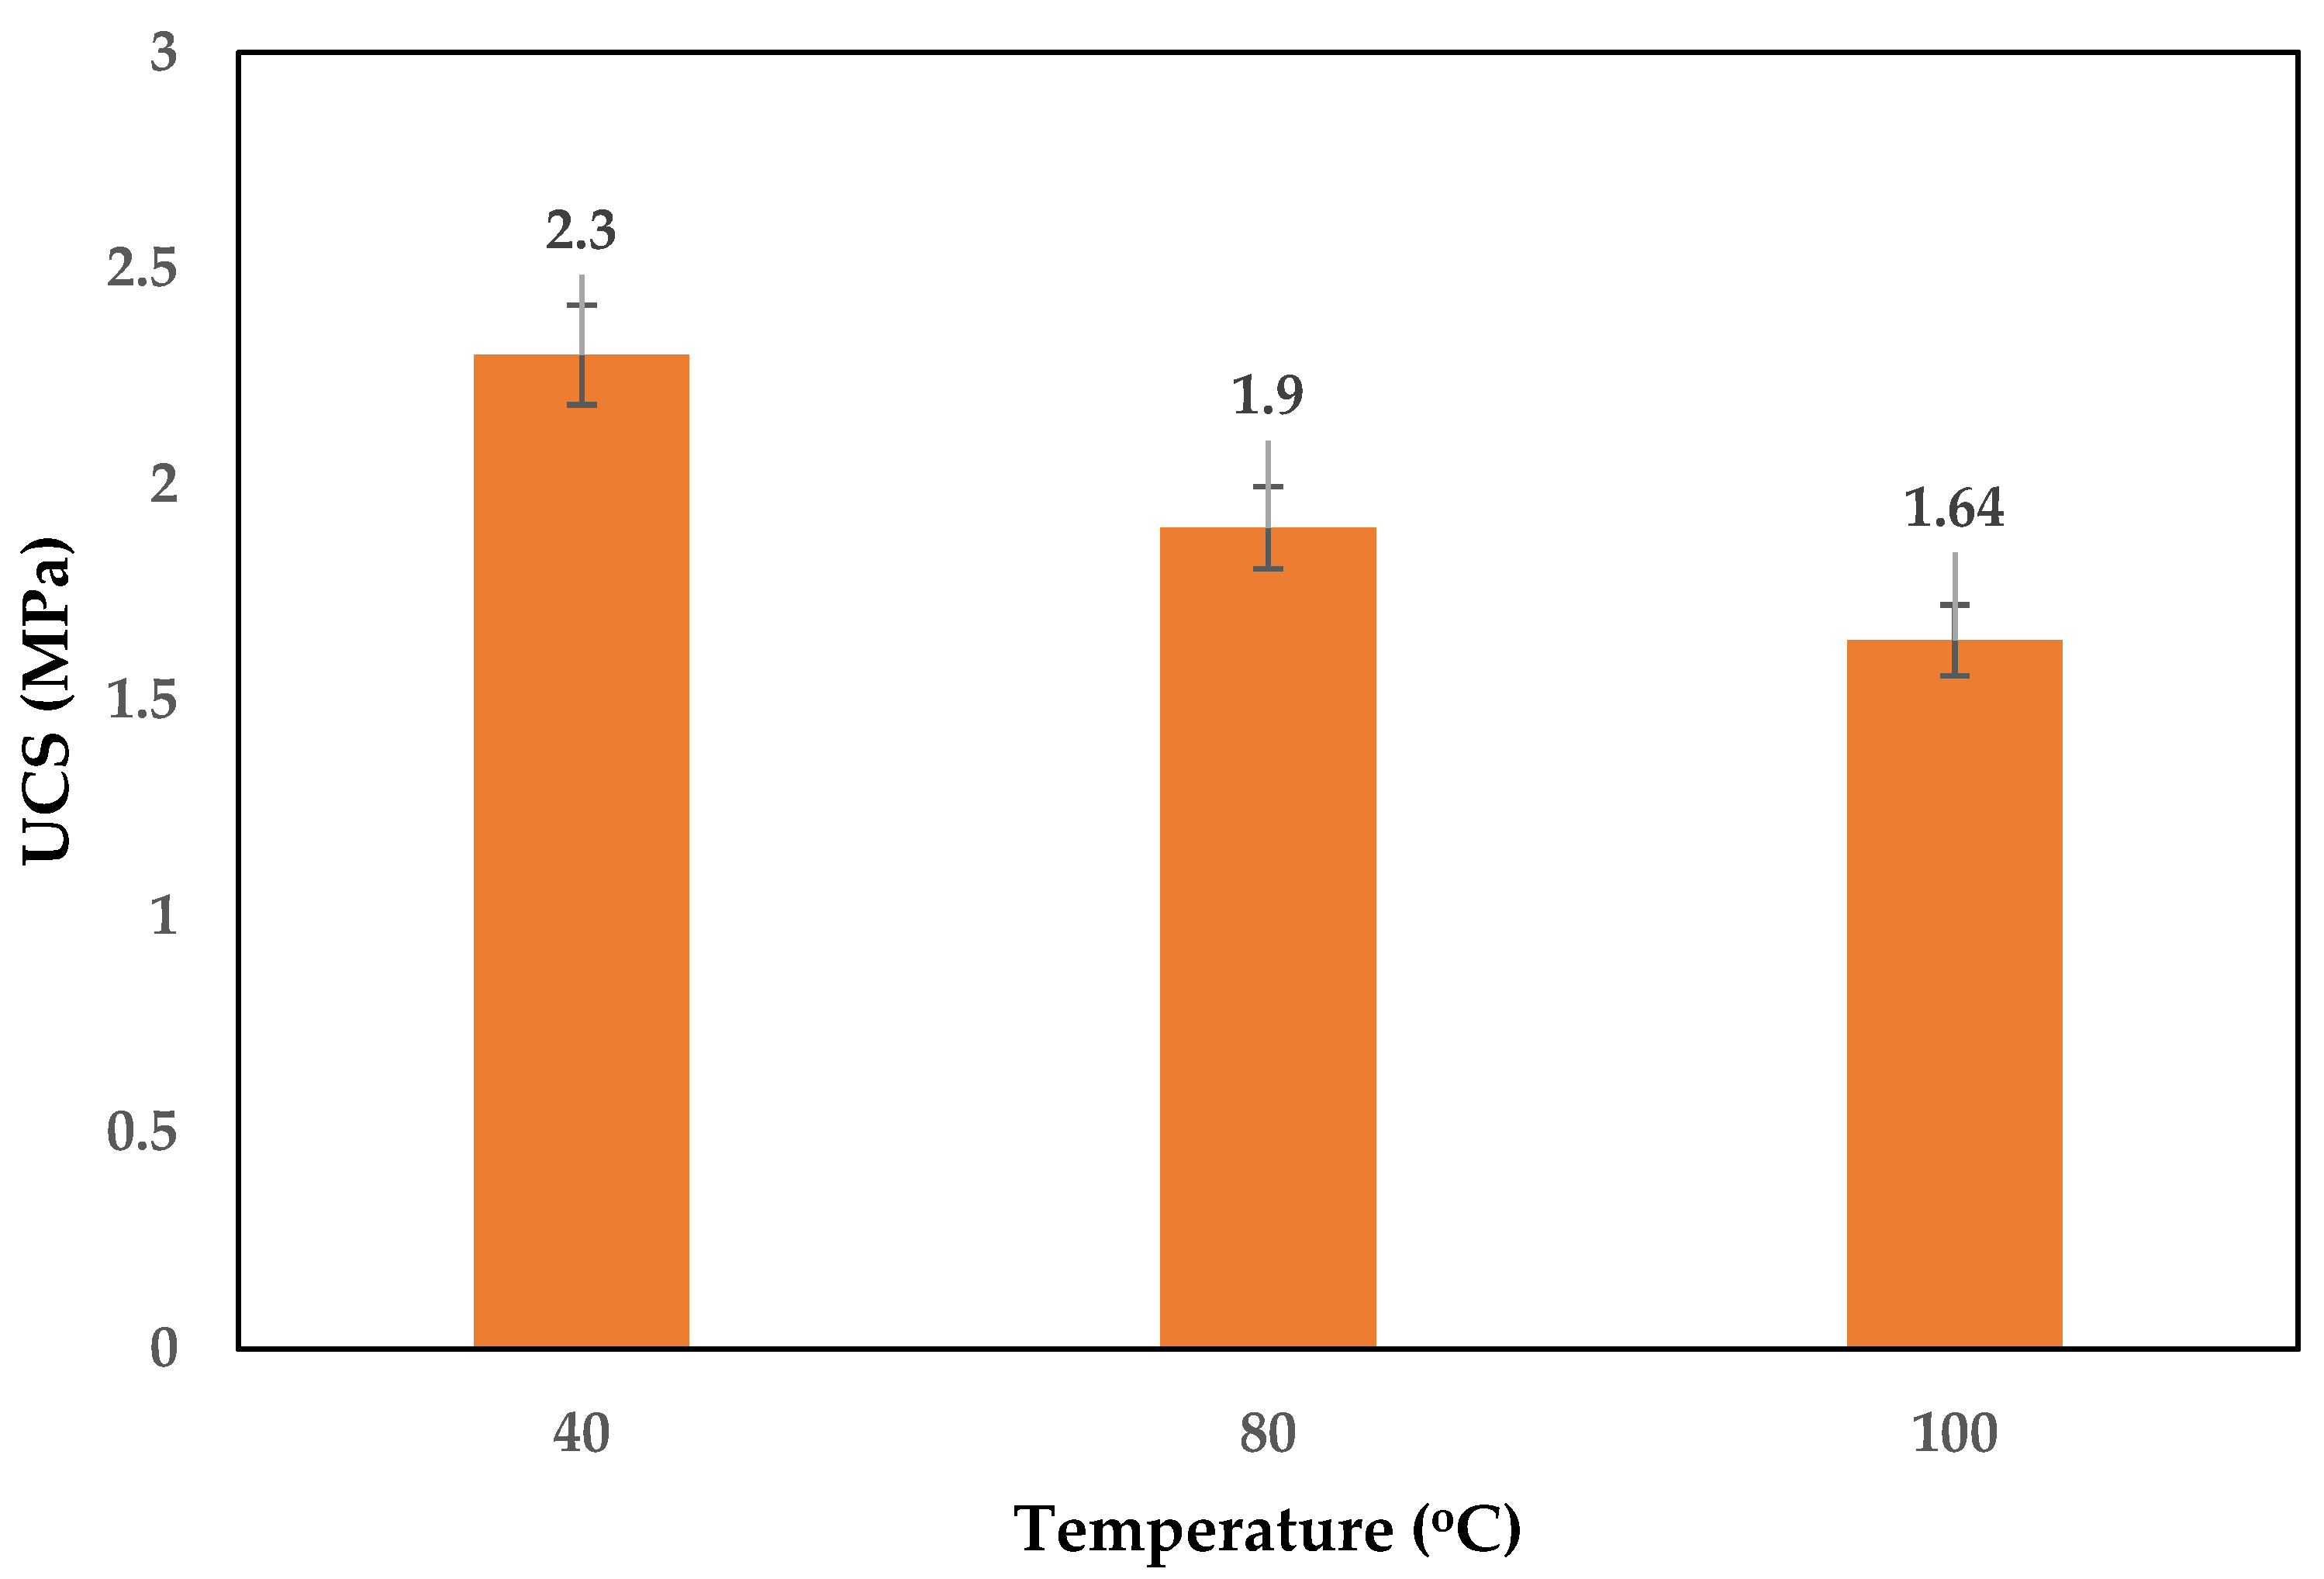
UCS
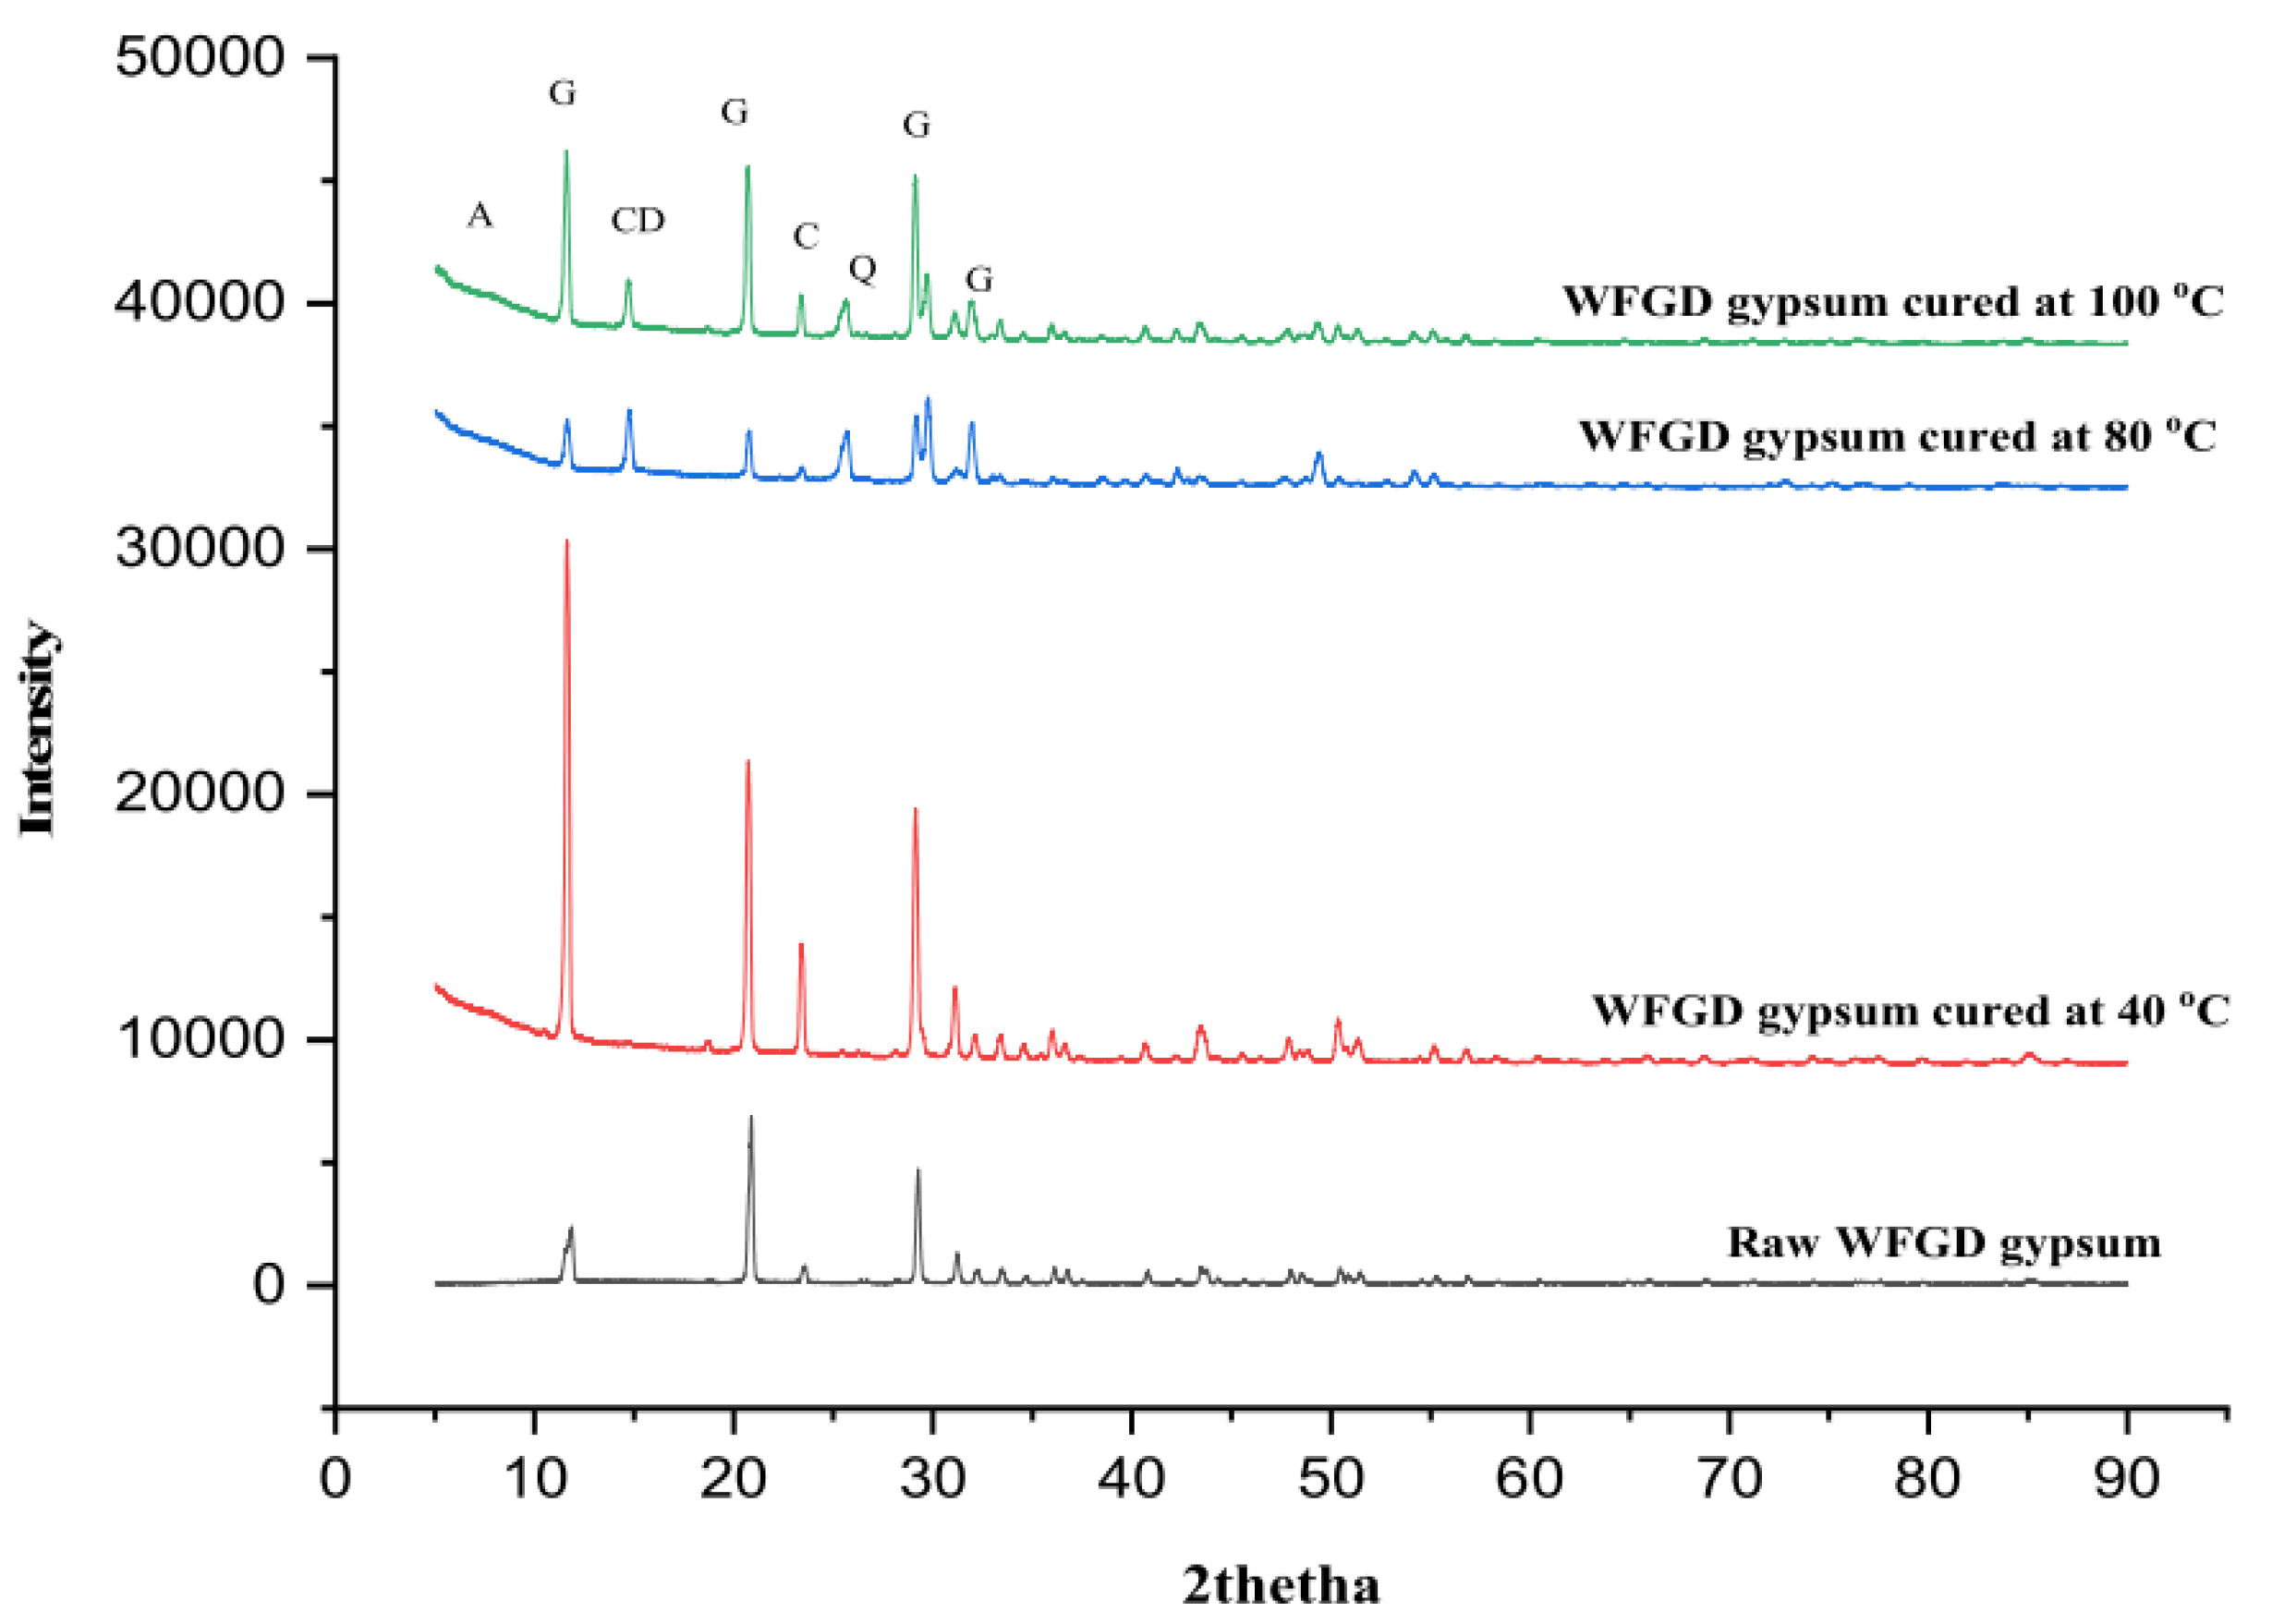
Mineralogy
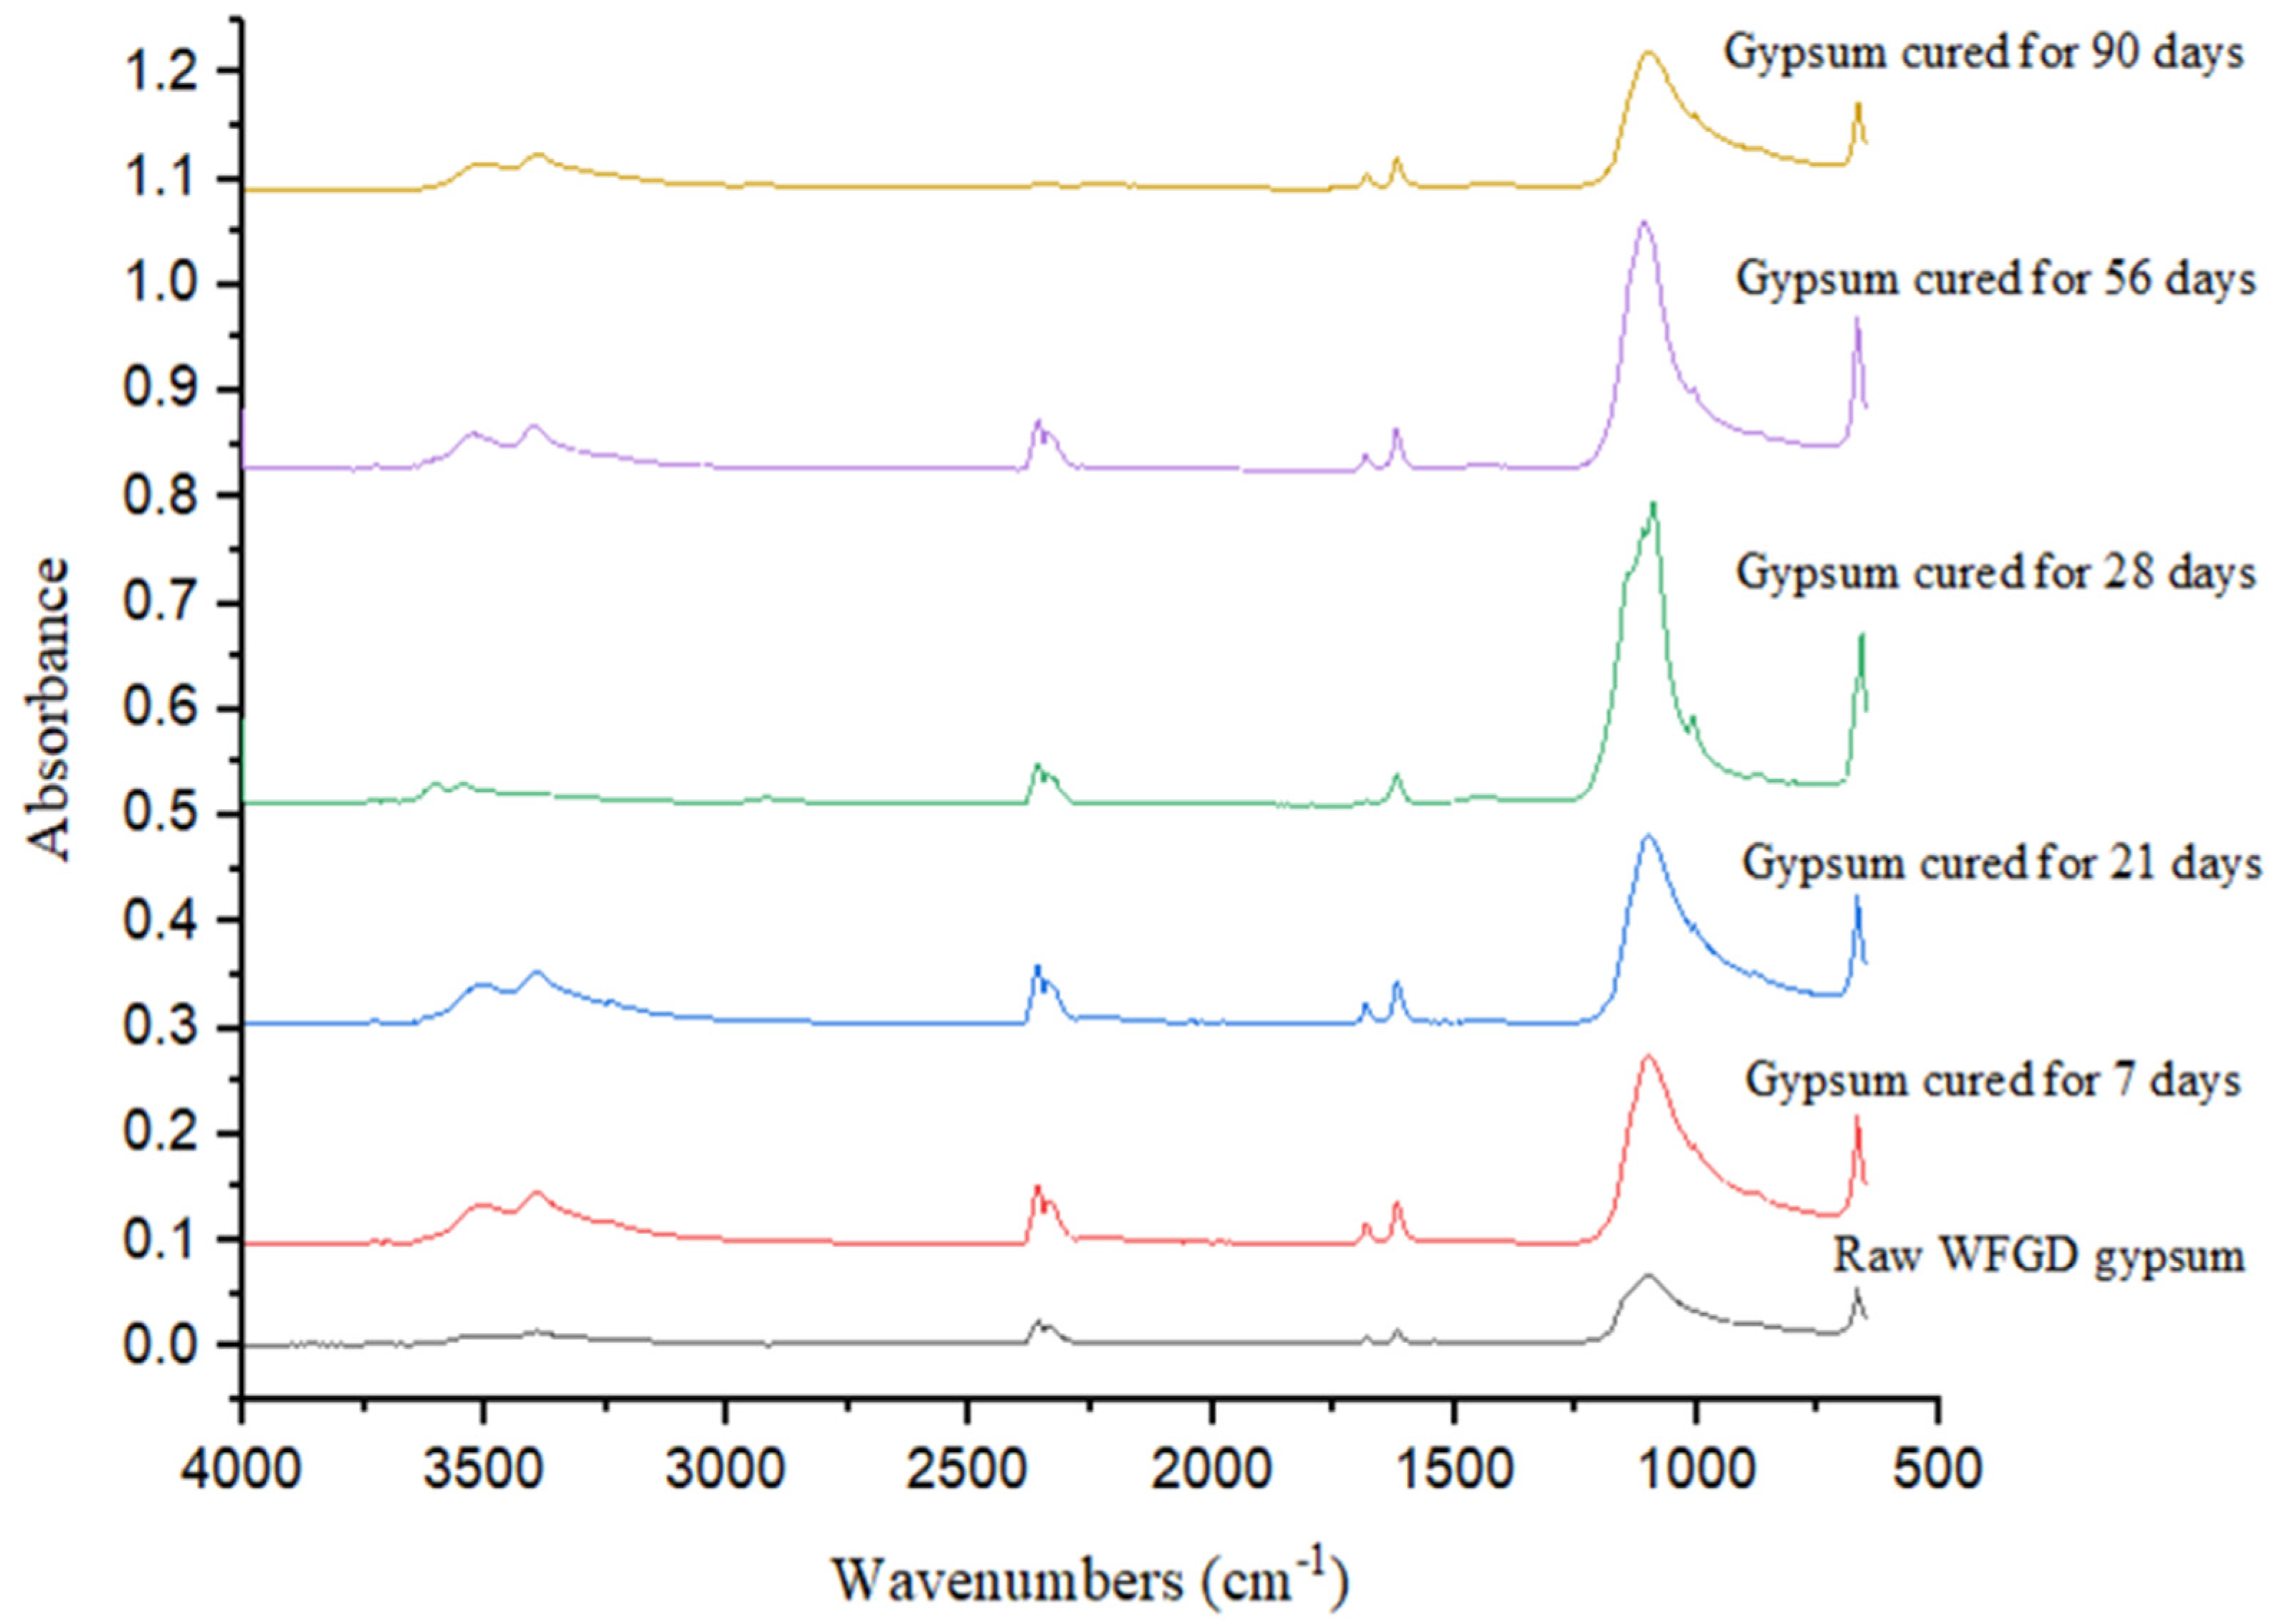
FTIR Analysis
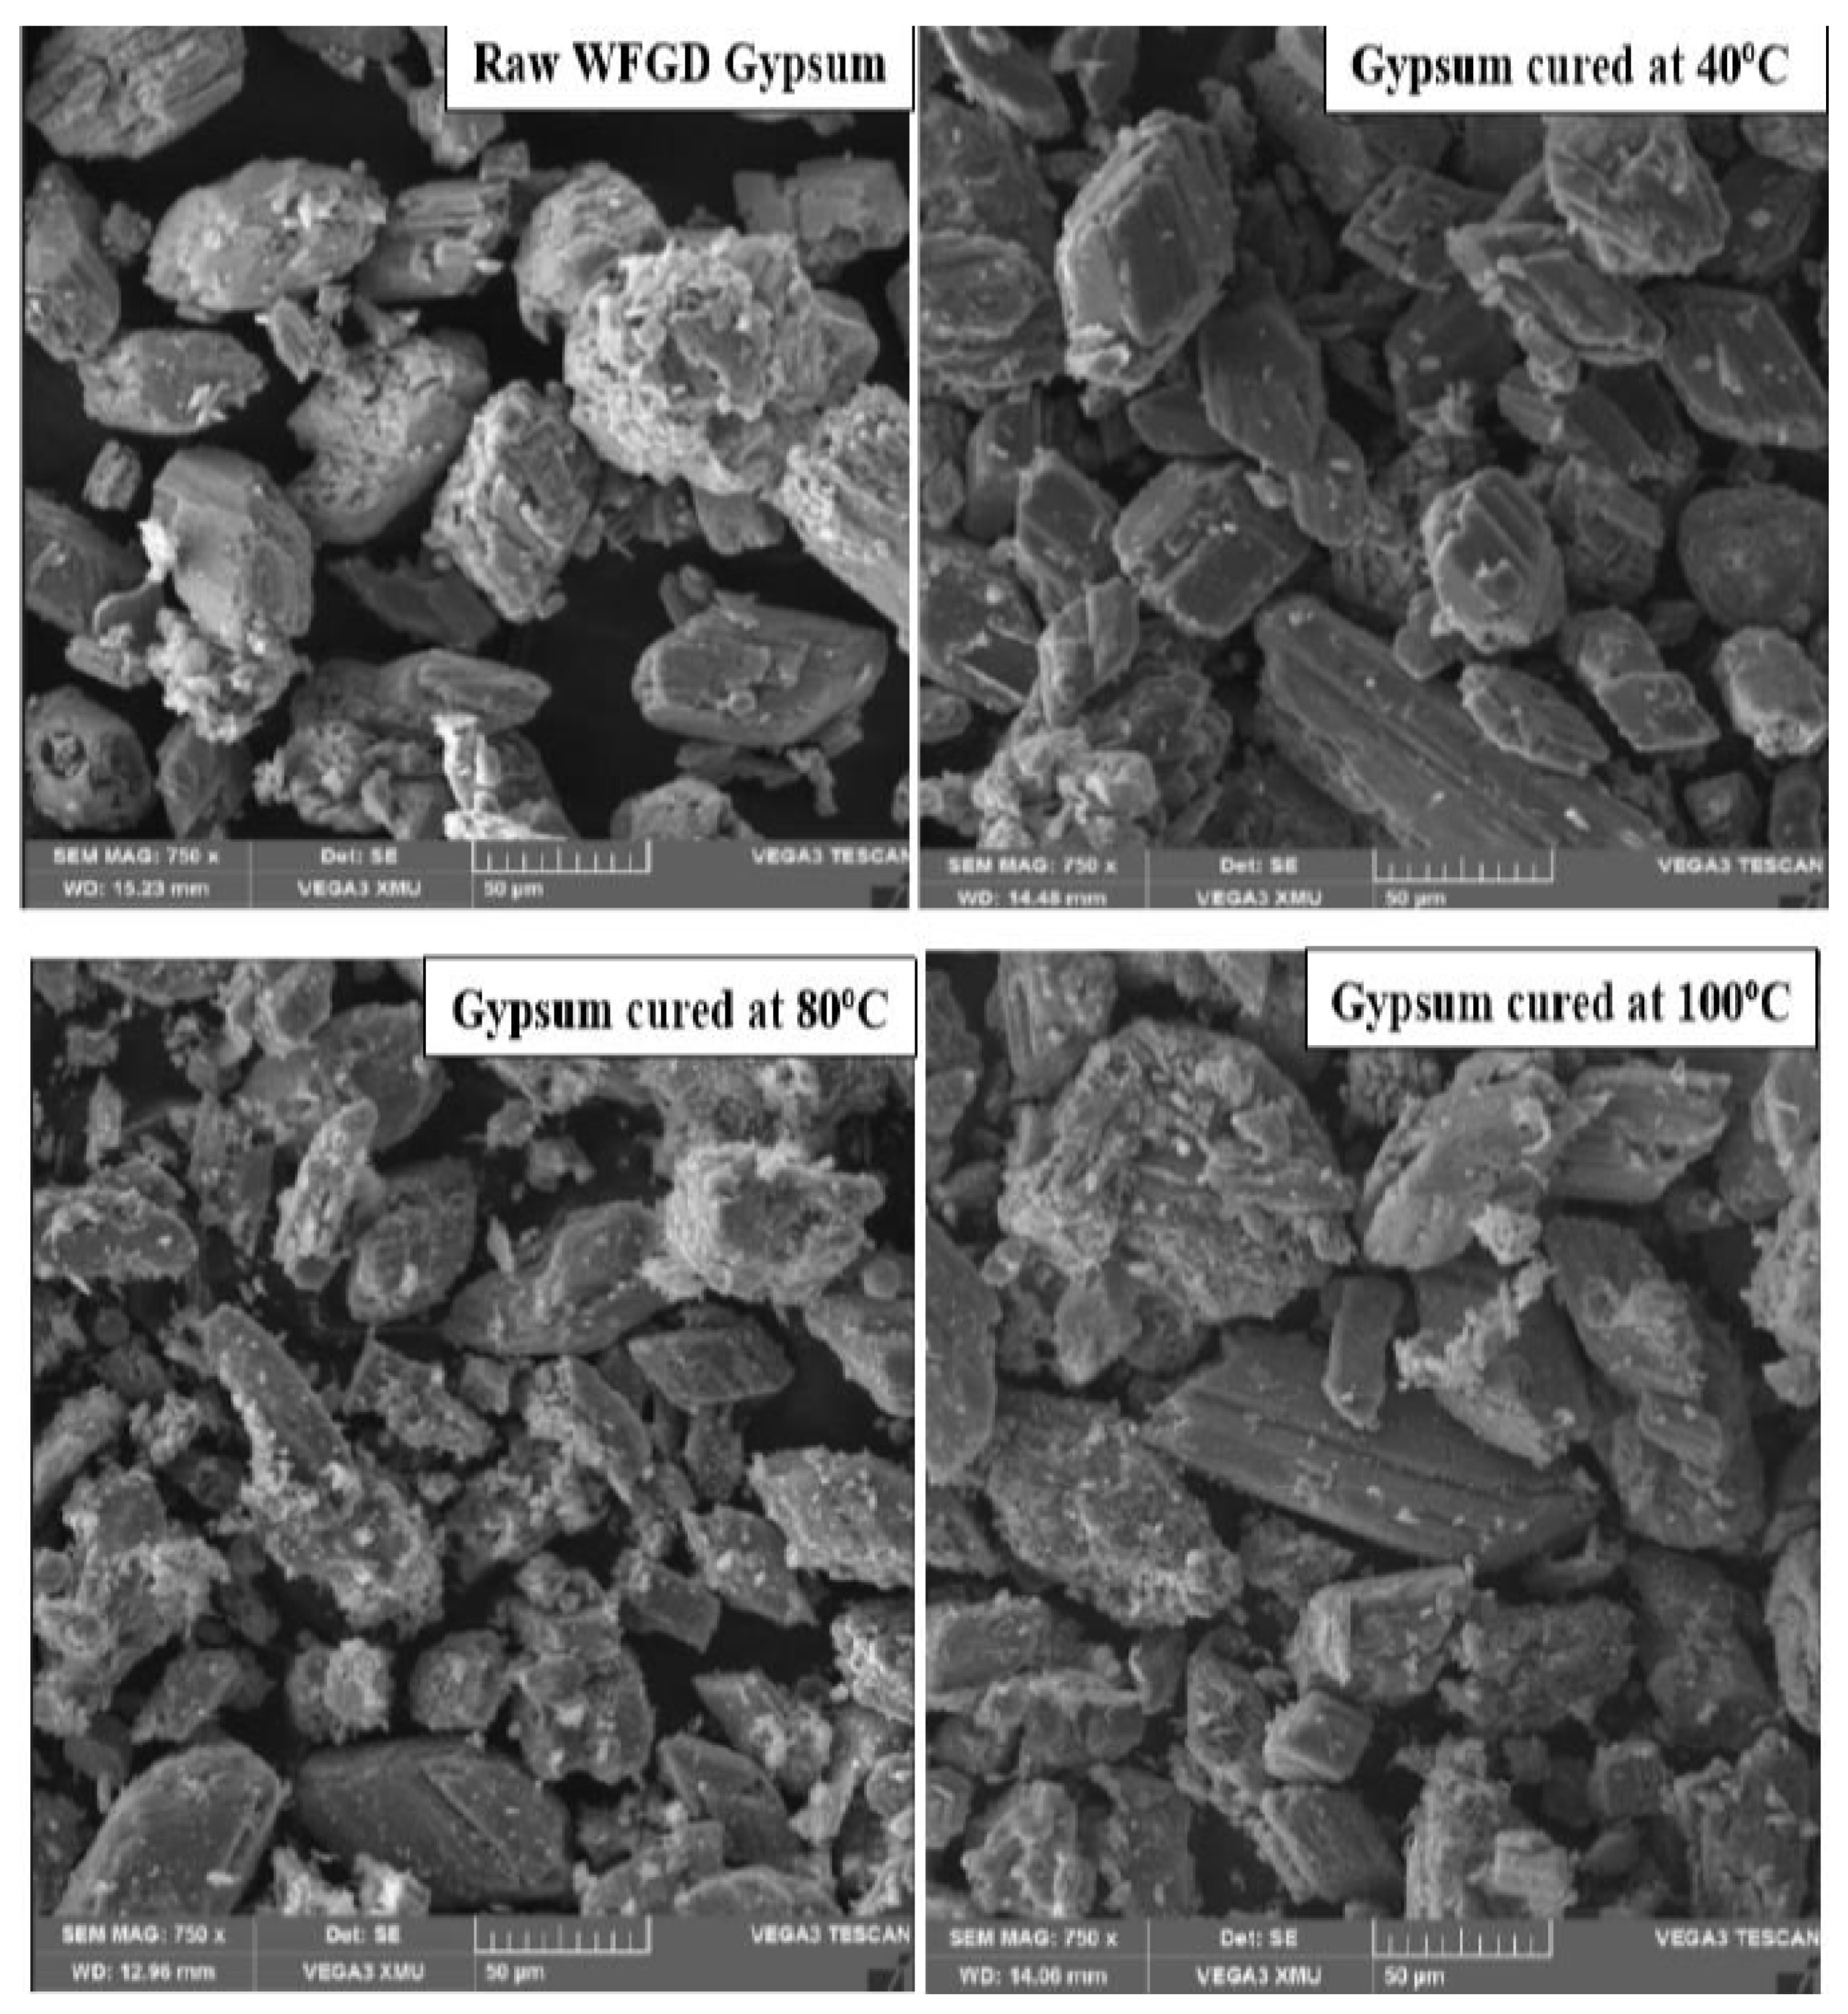
SEM/EDS Analysis
3.3.3. The Durability of WFGD Gypsum Bricks
4. Conclusions
Author Contributions
Funding
Data Availability Statement
Acknowledgments
Conflicts of Interest
References
- Schutte, C. Value Added Utilisation Possibilities of Coal Combustion Products in South Africa, North-West University. 2018. Available online: https://repository.nwu.ac.za/handle/10394/30922 (accessed on 12 October 2021).
- Haslup, C.J.A. The Velvære: Re-imagining Health & Wellness within Post-Industrial Urban Infrastructure. 2020. Available online: http://hdl.handle.net/1903/26241 (accessed on 12 October 2021).
- Conway, D.; Van Garderen, E.A.; Deryng, D.; Dorling, S.; Krueger, T.; Landman, W.; Lankford, B.; Lebek, K.; Osborn, T.; Ringler, C.; et al. Climate and southern Africa’s water–energy–food nexus. Nat. Clim. Chang. 2015, 5, 837–846. [Google Scholar] [CrossRef] [Green Version]
- IEA; WBCSD. Cement Technology Roadmap 2009: Carbon Emissions Reductions up to 2050; WBCSD: Paris, France, 2009. [Google Scholar]
- Koralegedaraa, N.H.; Pintob, P.X.; Dionysiouc, D.D.; Al-Abed, S.R. Recent advances in flue gas desulfurization gypsum processes and applications—A review. J. Environ. Manag. 2019, 251, 109572. [Google Scholar] [CrossRef]
- Córdoba, P. Status of Flue Gas Desulphurisation (FGD) systems from coal-fired power plants: Overview of the physic-chemical control processes of wet limestone FGDs. Fuel 2015, 144, 274–286. [Google Scholar] [CrossRef]
- Jiménez Rivero, A.; Sathre, R.; García Navarro, J. Life cycle energy and material flow implications of gypsum plasterboard recycling in the European Union. Resour. Conserv. Recycl. 2016, 108, 171–181. [Google Scholar] [CrossRef] [Green Version]
- Malhotra, V.M.J. Role of fly ash in reducing greenhouse gas emissions during the manufacturing of portland cement clinker. Adv. Concr. Technol. Middle East 2008, 19–20. [Google Scholar]
- Lei, D.-Y.; Guo, L.-P.; Sun, W.; Liu, J.; Miao, C. Study on properties of untreated FGD gypsum-based high-strength building materials. Constr. Build. Mater. 2017, 153, 765–773. [Google Scholar] [CrossRef]
- Telesca, A.; Marroccoli, M.; Calabrese, D.; Valenti, G.L.; Montagnaro, F. Flue gas desulfurization gypsum and coal fly ash as basic components of prefabricated building materials. Waste Manag. 2013, 33, 628–633. [Google Scholar] [CrossRef]
- Álvarez-Ayuso, E.; Querol, X.; Tomás, A. Environmental impact of a coal combustion-desulphurisation plant: Abatement capacity of desulphurisation process and environmental characterisation of combustion by-products. Chemosphere 2006, 65, 2009–2017. [Google Scholar] [CrossRef] [PubMed]
- Leiva, C.; García Arenas, C.; Vilches, L.F.; Vale, J.; Gimenez, A.; Ballesteros, J.C.; Fernández-Pereira, C. Use of FGD gypsum in fire resistant panels. Waste Manag. 2010, 30, 1123–1129. [Google Scholar] [CrossRef]
- Zhao, F.Q.; Liu, H.J.; Hao, L.X.; Li, Q. Water resistant block from desulfurization gypsum. Constr. Build. Mater. 2012, 27, 531–533. [Google Scholar] [CrossRef]
- Guan, B.; Lou, W.; Ye, Q.; Fu, H.; Wu, Z. Calorimetric study of calcium aluminate cement blended with flue gas desulfurization gypsum. J. Therm. Anal. Calorim. 2009, 98, 737. [Google Scholar] [CrossRef]
- Phutthimethakul, L.; Kumpueng, P.; Supakata, N. Use of Flue Gas Desulfurization Gypsum, Construction and Demolition Waste, and Oil Palm Waste Trunks to Produce Concrete Bricks. Crystals 2020, 709, 45–76. [Google Scholar] [CrossRef]
- Anastasiadou, K.; Christopoulos, K.; Mousios, E.; Gidarakos, E. Solidification/stabilization of fly and bottom ash from medical waste incineration facility. J. Hazard. Mater. 2012, 207, 165–170. [Google Scholar] [CrossRef] [PubMed]
- Little, D.N. Evaluation of Structural Properties of lime Stabilized Soils and Aggregates; National Lime Association: Arlington, VA, USA, 1998. [Google Scholar]
- Jafer, H.; Atherton, W.; Sadique, M.; Ruddock, F.; Loffill, E. Stabilisation of soft soil using binary blending of high calcium fly ash and palm oil fuel ash. Appl. Clay Sci. 2018, 152, 323–332. [Google Scholar] [CrossRef]
- Zhu, F.; Hou, J.; Xue, S.; Wu, C.; Wang, Q.; Hartlew, W. Vermicompost and gypsum amendments improve aggregate formation in bauxite residue. L. Degrad. Dev. 2017, 28, 2109–2120. [Google Scholar] [CrossRef] [Green Version]
- Raghavendra, S.C.; Raibagkar, R.L.; Kulkarni, A.B. Dielectric properties of fly ash. Bull. Mater. Sci. 2002, 25, 37–39. [Google Scholar] [CrossRef] [Green Version]
- Scheinherrová, L.; Doleželová, M.; Havlín, J.; Trník, A. Thermal analysis of ternary gypsum-based binders stored in different environments. J. Therm. Anal. Calorim. 2018, 133, 177–188. [Google Scholar] [CrossRef]
- Madani, H.; Bagheri, A.; Parhizkar, T. The pozzolanic reactivity of monodispersed nanosilica hydrosols and their influence on the hydration characteristics of Portland cement. Cem. Concr. Res. 2012, 42, 1563–1570. [Google Scholar] [CrossRef]
- Jelenić, I.; Panović, A.; Halle, R.; Gaćeša, T. Effect of gypsum on the hydration and strength development of commercial portland cements containing alkali sulfates. Cem. Concr. Res. 1977, 7, 239–245. [Google Scholar] [CrossRef]
- Al-Bedoor, A.A.; Al-Rawajfeh, A.E.; Jaradat, D.M.M.; Al-Jaradeen, Y.; Al-Obeidein, A. Influence of retardation and acceleration of setting time on the efficiency of water defluoridation by calcined gypsum. Int. J. Environ. Sci. Technol. 2017, 14, 1551–1558. [Google Scholar] [CrossRef]
- Tzouvalas, G.; Rantis, G.; Tsimas, S. Alternative calcium-sulfate-bearing materials as cement retarders: Part II. FGD gypsum. Cem. Concr. Res. 2004, 34, 2119–2125. [Google Scholar] [CrossRef]
- Ozkul, M.H. Utilization of citro- and desulphogypsum as set retarders in Portland cement. Cem. Concr. Res. 2000, 30, 1755–1758. [Google Scholar] [CrossRef]
- Lou, W.; Guan, B.; Wu, Z. Dehydration behavior of FGD gypsum by simultaneous TG and DSC analysis. J. Therm. Anal. Calorim. 2011, 104, 661–669. [Google Scholar] [CrossRef]
- Wu, S.; Yao, Y.; Yao, X.; Ren, C.; Li, J.; Xu, D.; Wang, W. Co-preparation of calcium sulfoaluminate cement and sulfuric acid through mass utilization of industrial by-product gypsum. J. Clean. Prod. 2020, 265, 121801. [Google Scholar] [CrossRef]
- Yilmaz, G. Structural characterization of glass–ceramics made from fly ash containing SiO2–Al2O3–Fe2O3–CaO and analysis by FT-IR–XRD–SEM methods. J. Mol. Struct. 2012, 1019, 37–42. [Google Scholar] [CrossRef]
- Bishop, J.L.; Lane, M.D.; Dyar, M.D.; King, S.J.; Brown, A.J.; Swayze, G.A. Spectral properties of Ca-sulfates: Gypsum, bassanite, and anhydrite. Am. Mineral. 2014, 99, 2105–2115. [Google Scholar] [CrossRef]
- La Russa, M.F.; Ruffolo, S.A.; Barone, G.; Crisci, G.M.; Mazzoleni, P.; Pezzino, A. The Use of FTIR and Micro-FTIR Spectroscopy: An Example of Application to Cultural Heritage. Int. J. Spectrosc. 2009, 2009, 893528. [Google Scholar] [CrossRef] [Green Version]
- Seidl, V.; Knop, O.; Falk, M. Infrared studies of water in crystalline hydrates: Gypsum, CaSO4•2H2O. Can. J. Chem. 1969, 47, 1361–1368. [Google Scholar] [CrossRef]
- Gong, K.; White, C.E. Nanoscale chemical degradation mechanisms of sulfate attack in alkali-activated slag. J. Phys. Chem. C 2018, 122, 5992–6004. [Google Scholar] [CrossRef]
- Sharpe, R.; Cork, G. Gypsum and Anhydrite; In Industrial Minerals & Rocks, 7th ed.; Kogel, J., Ed.; Society for Mining, Metallurgy, and Exploration: Englewood, CO, USA, 2006. [Google Scholar]
- Abdel Wahed, M.S.M.; Mohamed, E.A.; El-Sayed, M.I.; M’Nif, A.; Sillanpää, M. Crystallization sequence during evaporation of a high concentrated brine involving the system Na–K–Mg–Cl–SO4-H2O. Desalination 2015, 355, 11–21. [Google Scholar] [CrossRef]
- Vassilev, S.V.; Vassileva, C.G.; Karayigit, A.I.; Bulut, Y.; Alastuey, A.; Querol, X. Phase–mineral and chemical composition of composite samples from feed coals, bottom ashes and fly ashes at the Soma power station, Turkey. Int. J. Coal Geol. 2005, 61, 35–63. [Google Scholar] [CrossRef]
- Koralegedara, N.H.; Al-Abed, S.R.; Arambewela, M.K.J.; Dionysiou, D.D. Impact of leaching conditions on constituents release from Flue Gas Desulfurization Gypsum (FGDG) and FGDG-soil mixture. J. Hazard. Mater. 2017, 324, 83–93. [Google Scholar] [CrossRef] [PubMed]
- Nugteren, H.W.; Ogundiran, M.B.; Witkamp, G.-J.; Kreutzer, M. Coal fly ash activated by waste sodium aluminate solutions as an immobilizer for hazardous waste. In Proceedings of the 2011 World Coal Ash WOCA Conference, Denver, CO, USA, 9–12 May 2011; pp. 9–11. [Google Scholar]
- Fu, B.; Liu, G.; Mian, M.M.; Sun, M.; Wu, D. Characteristics and speciation of heavy metals in fly ash and FGD gypsum from Chinese coal-fired power plants. Fuel 2019, 251, 593–602. [Google Scholar] [CrossRef]
- Kroehong, W.; Sinsiri, T.; Jaturapitakkul, C.; Chindaprasirt, P. Effect of palm oil fuel ash fineness on the microstructure of blended cement paste. Constr. Build. Mater. 2011, 25, 4095–4104. [Google Scholar] [CrossRef]
- Ding, X.; Zhang, L. A new contact model to improve the simulated ratio of unconfined compressive strength to tensile strength in bonded particle models. Int. J. Rock Mech. Min. Sci. 2014, 69, 111–119. [Google Scholar] [CrossRef]
- Hallett, P.D.; Bengough, A.G. Managing the soil physical environment for plants. Soil Cond. 2013, 238–268. [Google Scholar]
- Taylor, M.; Kim, N.; Smidt, G.; Busby, C.; McNally, S.; Robinson, B.; Kratz, S.; Schnug, E. Trace element contaminants and radioactivity from phosphate fertiliser. In Phosphorus in Agriculture: 100% Zero; Springer: Berlin/Heidelberg, Germany, 2016; pp. 231–266. [Google Scholar]
- Coo, J.L.; So, Z.P.S.; Ng, C.W.W. Effect of nanoparticles on the shrinkage properties of clay. Eng. Geol. 2016, 213, 84–88. [Google Scholar] [CrossRef]
- Sharma, N.K.; Swain, S.K.; Sahoo, U.C. Stabilization of a clayey soil with fly ash and lime: A micro level investigation. Geotech. Geol. Eng. 2012, 30, 1197–1205. [Google Scholar] [CrossRef]
- Prashanth, J.P.; Sivapullaiah, P.V.; Sridharan, A. Pozzolanic fly ash as a hydraulic barrier in land fills. Eng. Geol. 2001, 60, 245–252. [Google Scholar] [CrossRef]
- Yilmaz, I.; Civelekoglu, B. Gypsum: An additive for stabilization of swelling clay soils. Appl. Clay Sci. 2009, 44, 166–172. [Google Scholar] [CrossRef]
- Bullard, J.W.; Jennings, H.M.; Livingston, R.A.; Nonat, A.; Scherer, G.W.; Schweitzer, J.S.; Scrivener, K.L.; Thomas, J.J. Mechanisms of cement hydration. Cem. Concr. Res. 2011, 41, 1208–1223. [Google Scholar] [CrossRef]
- Maichin, P.; Jitsangiam, P.; Nongnuang, T.; Boonserm, K.; Nusit, K.; Pra-Ai, S.; Binaree, T.; Aryupong, C. Stabilized High Clay Content Lateritic Soil Using Cement-FGD Gypsum Mixtures for Road Subbase Applications. Materials 2021, 14, 1858. [Google Scholar] [CrossRef] [PubMed]
- Liu, X.; Wen, H.; Edil, T.; Benson, C.H. Stabilization of flue gas desulfurization by-products with fly ash, cement, and sialite. Transp. Res. Rec. 2011, 2204, 102–109. [Google Scholar] [CrossRef]
- Mainuddin, M.; Ruhul Amin, M.; Sarkhel, S.; Bhowmick, P.; Ahmed, A. Stresses in Fly Ash Brick using different proportion of Lime, Cement, Gypsum, Sand and Stone Dust. Int. J. Innov. Technol. Explor. Eng. 2019, 9, 4288–4292. [Google Scholar] [CrossRef]
- Pedreño-Rojas, M.A.; De Brito, J.; Flores-Colen, I.; Pereira, M.F.C.; Rubio-de-Hita, P. Influence of gypsum wastes on the workability of plasters: Heating process and microstructural analysis. J. Build. Eng. 2020, 29, 101143. [Google Scholar] [CrossRef]
- Harrison, T.N. Experimental VNIR reflectance spectroscopy of gypsum dehydration: Investigating the gypsum to bassanite transition. Am. Mineral. 2012, 97, 598–609. [Google Scholar] [CrossRef]
- Pedreño-Rojas, M.A.; Fořt, J.; Černý, R.; Rubio-de-Hita, P. Life cycle assessment of natural and recycled gypsum production in the Spanish context. J. Clean. Prod. 2020, 253, 120056. [Google Scholar] [CrossRef]
- Lv, Q.; Wang, Z.; Gu, L.; Chen, Y.; Shan, X. Effect of sodium sulfate on strength and microstructure of alkali-activated fly ash based geopolymer. J. Cent. South Univ. 2020, 27, 1691–1702. [Google Scholar] [CrossRef]
- Wang, T.; Wu, K.; Wu, M. Development of green binder systems based on flue gas desulfurization gypsum and fly ash incorporating slag or steel slag powders. Constr. Build. Mater. 2020, 265, 120275. [Google Scholar] [CrossRef]
- Salvador, R.P. Accelerated Cementitious Matrices: Hydration, Microstructure and Mechanical Strength. 2016. Available online: http://hdl.handle.net/2117/106491 (accessed on 12 October 2021).
- Little, T.A.; Holcombe, R.J.; Ilg, B.R. Kinematics of oblique collision and ramping inferred from microstructures and strain in middle crustal rocks, central Southern Alps, New Zealand. J. Struct. Geol. 2002, 24, 219–239. [Google Scholar] [CrossRef]
- Ridge, M.J. Effect of Temperature on the Rate of Setting of Gypsum Plaster. Nature 1959, 184, 47–48. [Google Scholar] [CrossRef]
- Thomas, G. Thermal properties of gypsum plasterboard at high temperatures. Fire Mater. 2002, 26, 37–45. [Google Scholar] [CrossRef]
- Jiménez Delgado, M.C.; Guerrero, I.C. The selection of soils for unstabilised earth building: A normative review. Constr. Build. Mater. 2007, 21, 237–251. [Google Scholar] [CrossRef]
- Hoy, M.; Rachan, R.; Horpibulsuk, S.; Arulrajah, A.; Mirzababaei, M. Effect of wetting–drying cycles on compressive strength and microstructure of recycled asphalt pavement—Fly ash geopolymer. Constr. Build. Mater. 2017, 144, 624–634. [Google Scholar] [CrossRef]
- Barzgar, S.; Lothenbach, B.; Mohammed, T.; Ludwig, C. Effect of Aluminum on C-S-H Structure, Stability and Solubility. In Proceedings of the 15th International Congress on the Chemistry of Cement, Prage, Czech Republic, 16–20 September 2019; pp. 1–6. [Google Scholar]
- Li, J.; Yu, Q.; Huang, H.; Yin, S. Effects of Ca/Si ratio, aluminum and magnesium on the carbonation behavior of calcium silicate hydrate. Materials 2019, 12, 1268. [Google Scholar] [CrossRef] [Green Version]
- Pedrosa, H.C.; Reales, O.M.; Reis, V.D.; das Dores Paiva, M.; Fairbairn, E.M.R. Hydration of Portland cement accelerated by C-S-H seeds at different temperatures. Cem. Concr. Res. 2020, 129, 105978. [Google Scholar] [CrossRef]
- Gallucci, E.; Zhang, X.; Scrivener, K.L. Effect of temperature on the microstructure of calcium silicate hydrate (C-S-H). Cem. Concr. Res. 2013, 53, 185–195. [Google Scholar] [CrossRef]
- Falayi, T.; Okonta, F.N.; Ntuli, F. The geotechnical and microstructural properties of desilicated fly ash lime stabilised expansive soil. Mater. Struct. 2016, 49, 4881–4891. [Google Scholar] [CrossRef]
- Djobo, J.N.Y.; Elimbi, A.; Tchakouté, H.K.; Kumar, S. Mechanical properties and durability of volcanic ash based geopolymer mortars. Constr. Build. Mater. 2016, 124, 606–614. [Google Scholar] [CrossRef]
- Rodrigue Kaze, C.; Ninla Lemougna, P.; Alomayri, T.; Assaedi, H.; Adesina, A.; Kumar Das, S.; Lecomte-Nana, G.L.; Kamseu, E.; Chinje Melo, U.; Leonelli, C. Characterization and performance evaluation of laterite based geopolymer binder cured at different temperatures. Constr. Build. Mater. 2021, 270, 121443. [Google Scholar] [CrossRef]


| Component | WFGD Gypsum (wt %) |
|---|---|
| F | 0.42 |
| MgO | 1.06 |
| Al2O3 | 1.1 |
| SiO2 | 2.0 |
| P2O5 | 0.02 |
| SO3 | 42.7 |
| Fe2O3 | 0.64 |
| CaO | 50.8 |
| TiO2 | 0.1 |
| MnO | 0.6 |
| Element (%m/m) | WFGD Gypsum |
|---|---|
| Mn | 0.47 |
| Cu | 1.56 |
| Mg | 1.50 |
| Cr | 0.01 |
| Al | 0.08 |
| P | 0.19 |
| Fe | 2.8 |
Publisher’s Note: MDPI stays neutral with regard to jurisdictional claims in published maps and institutional affiliations. |
© 2021 by the authors. Licensee MDPI, Basel, Switzerland. This article is an open access article distributed under the terms and conditions of the Creative Commons Attribution (CC BY) license (https://creativecommons.org/licenses/by/4.0/).
Share and Cite
Sithole, T.; Mashifana, T.; Mahlangu, D.; Tchadjie, L. Physical, Chemical and Geotechnical Characterization of Wet Flue Gas Desulfurization Gypsum and Its Potential Application as Building Materials. Buildings 2021, 11, 500. https://doi.org/10.3390/buildings11110500
Sithole T, Mashifana T, Mahlangu D, Tchadjie L. Physical, Chemical and Geotechnical Characterization of Wet Flue Gas Desulfurization Gypsum and Its Potential Application as Building Materials. Buildings. 2021; 11(11):500. https://doi.org/10.3390/buildings11110500
Chicago/Turabian StyleSithole, Thandiwe, Tebogo Mashifana, Dumisane Mahlangu, and Leonel Tchadjie. 2021. "Physical, Chemical and Geotechnical Characterization of Wet Flue Gas Desulfurization Gypsum and Its Potential Application as Building Materials" Buildings 11, no. 11: 500. https://doi.org/10.3390/buildings11110500