
Effect of Amount of Fibre and Damage Level on Service Life of SFR Recycled Concrete in Aggressive Environment


Abstract
:1. Introduction
2. Experimental Approach
2.1. Samples and Mechanical Properties
2.2. Electrochemical Test Method
2.2.1. Surface Electrical Resistivity and Diffusion Coefficients
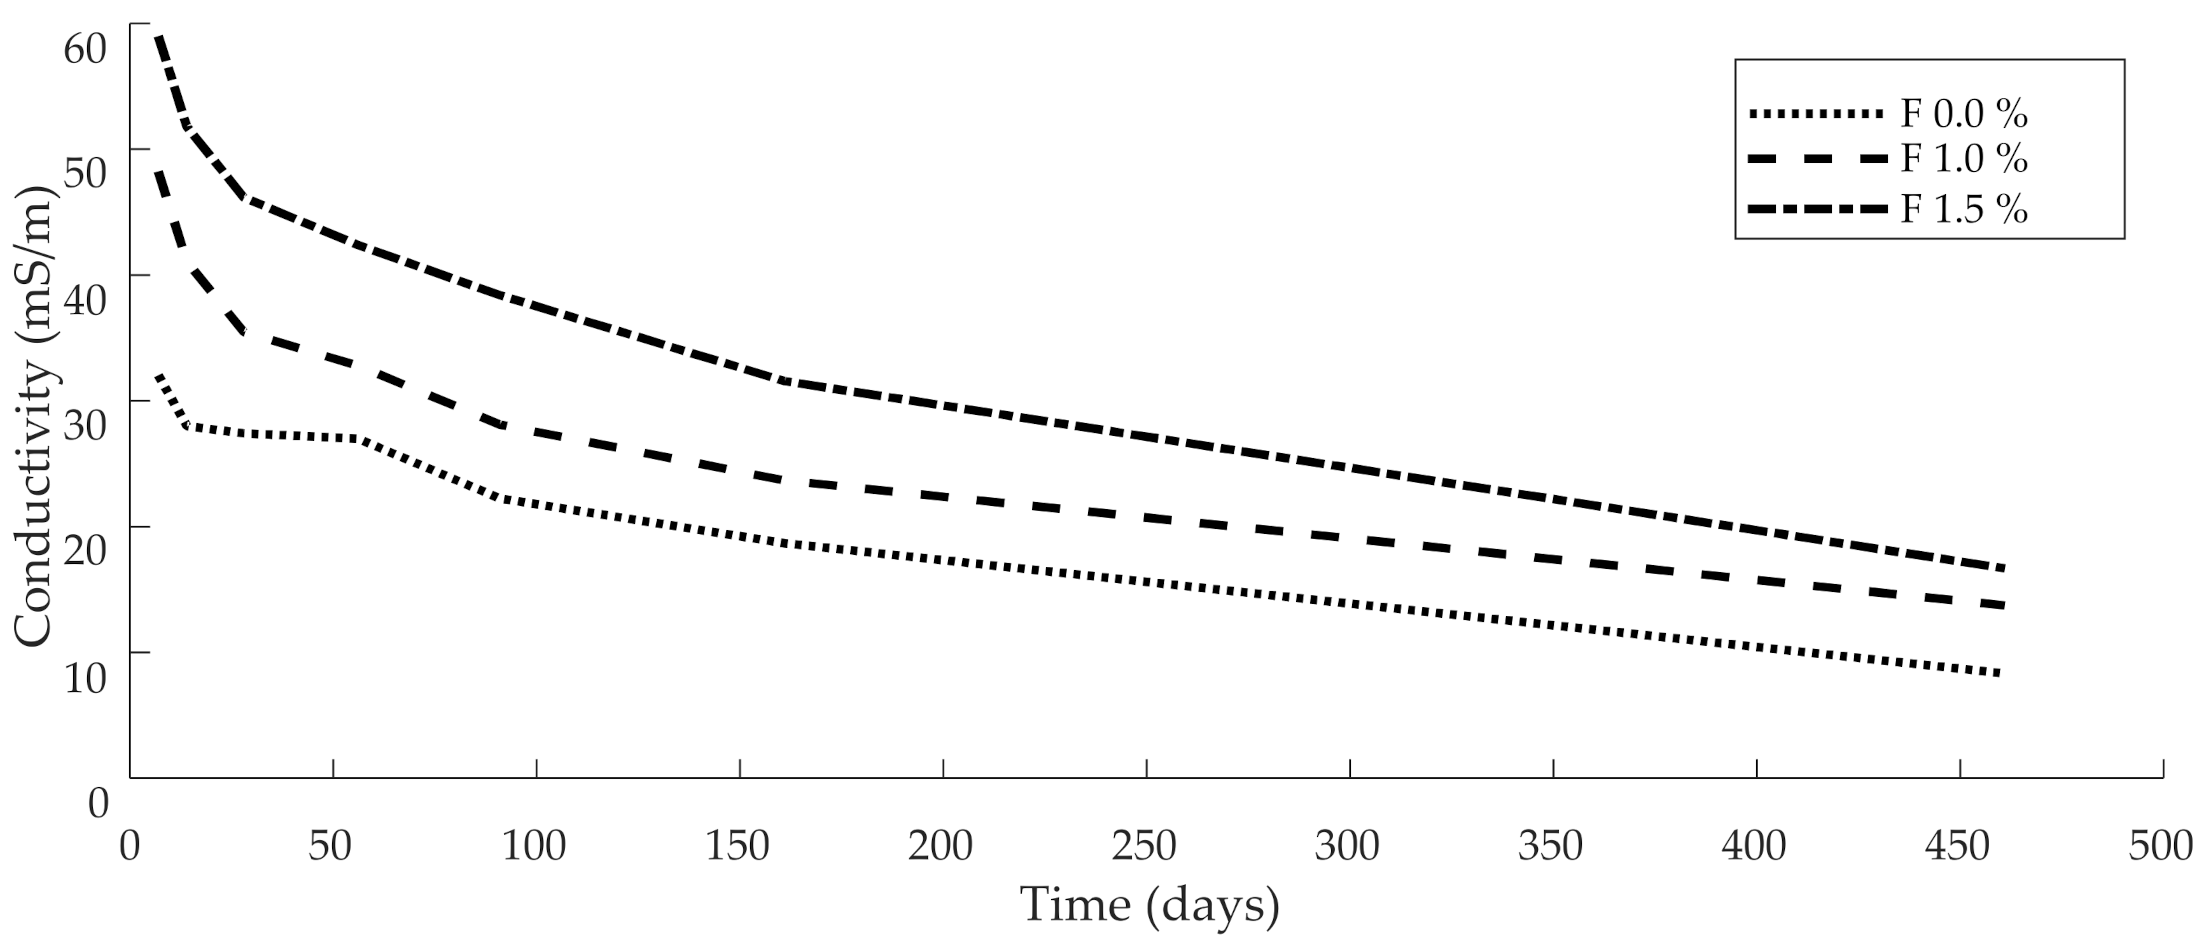
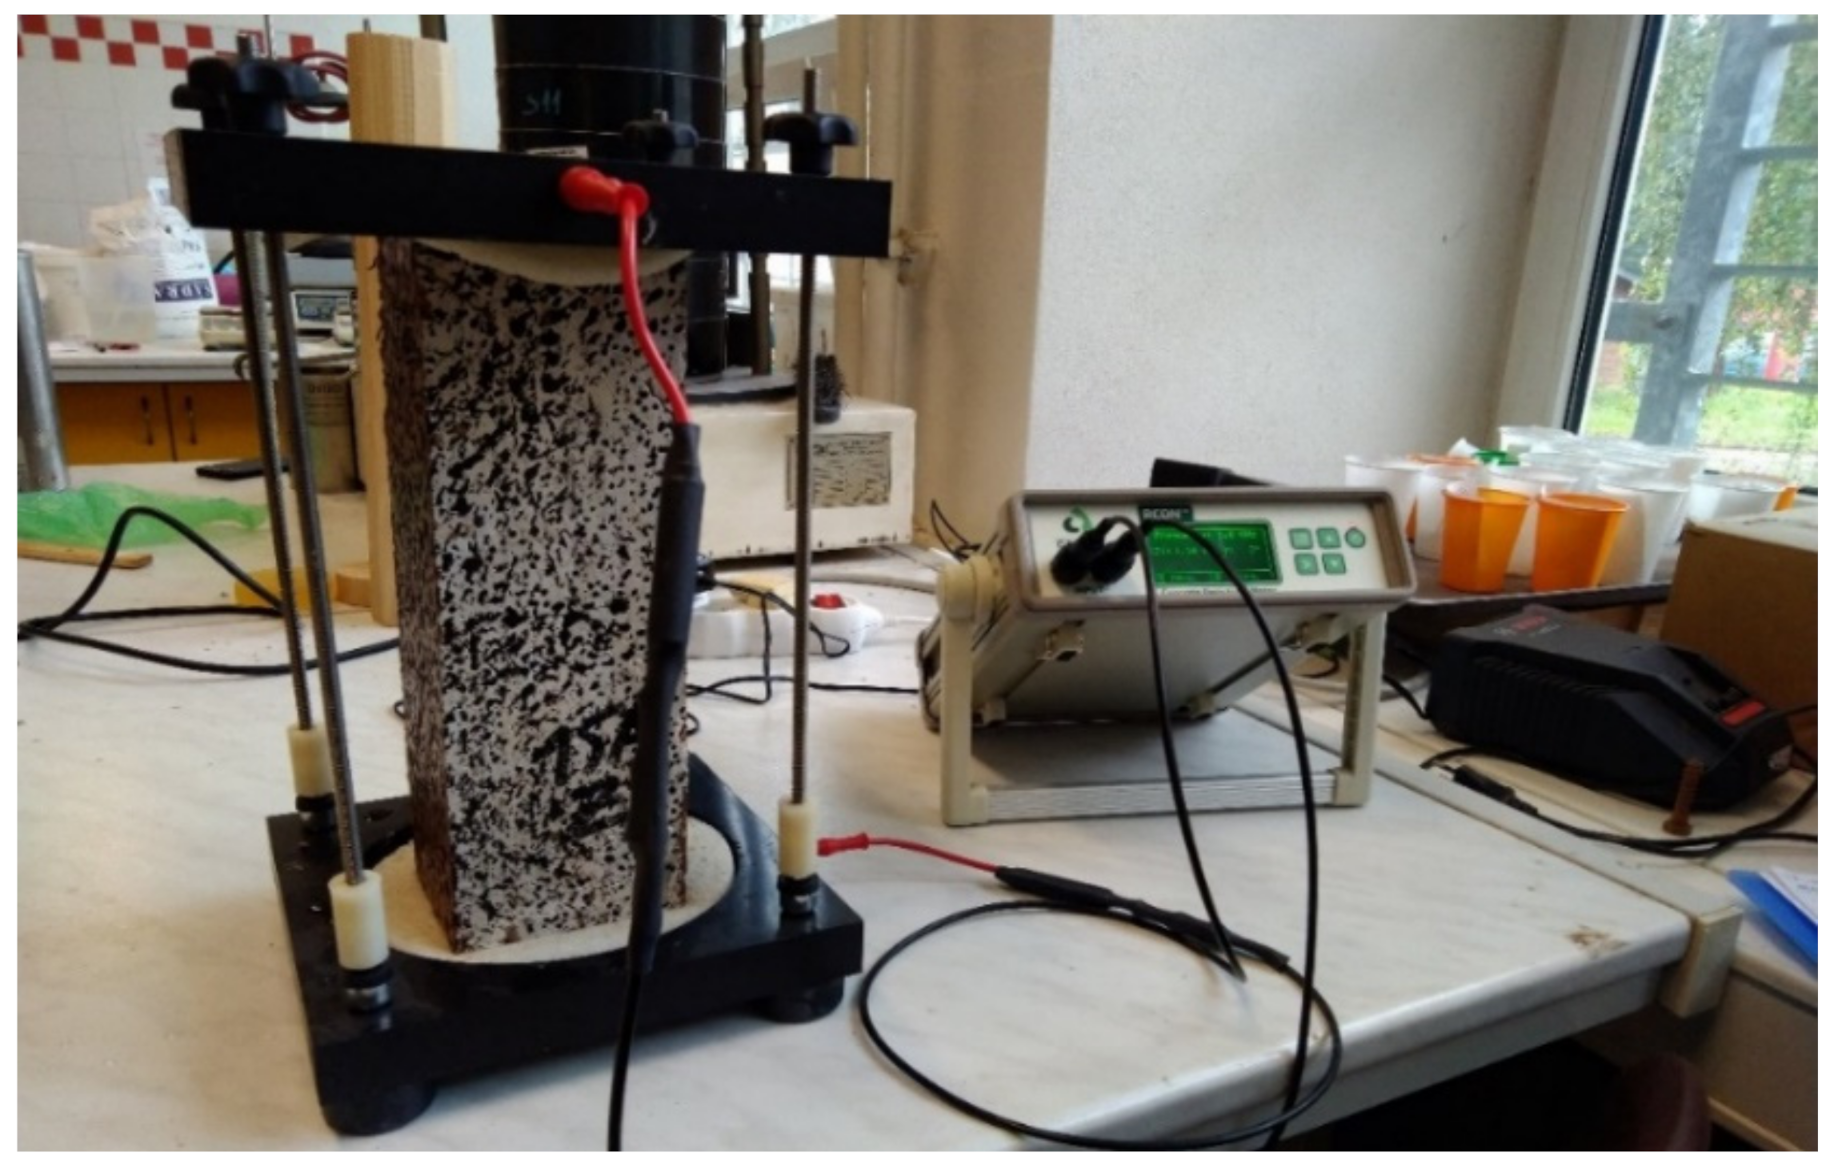
2.2.2. Bulk Resistivity and Diffusion Coefficients
3. Numerical Analysis of Service Life Related to Chloride Increase
4. Results of Service Life and Discussion
5. Conclusions
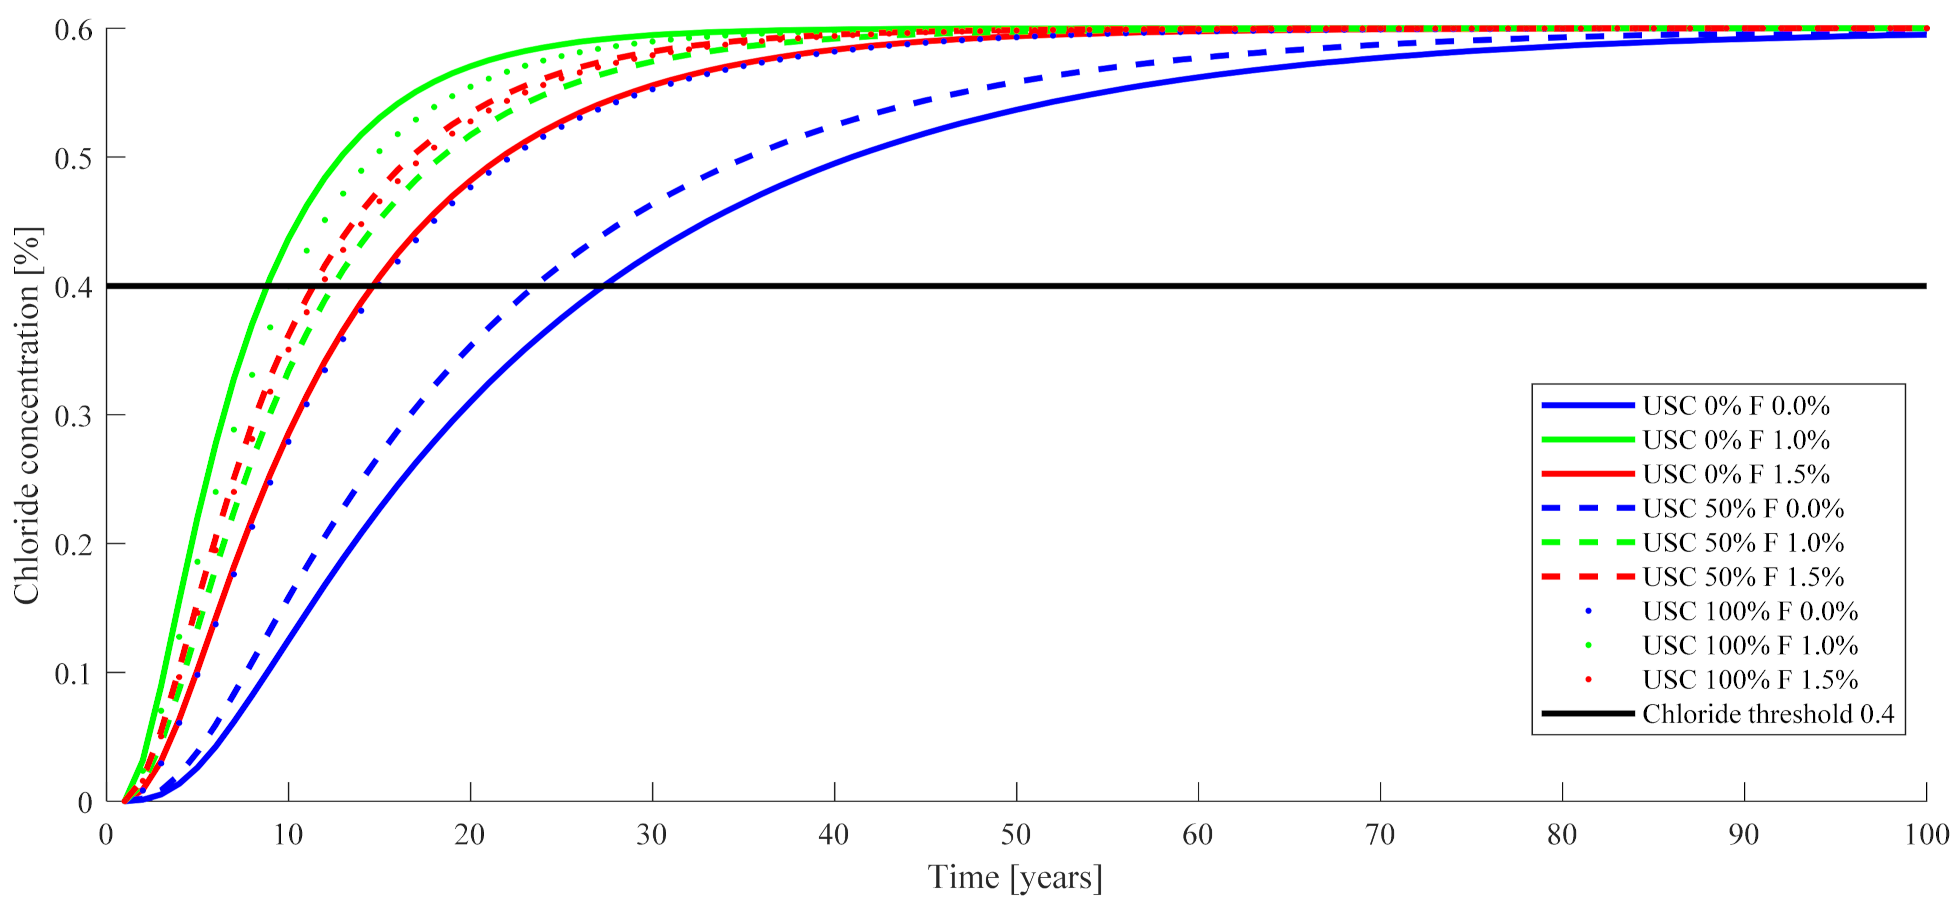
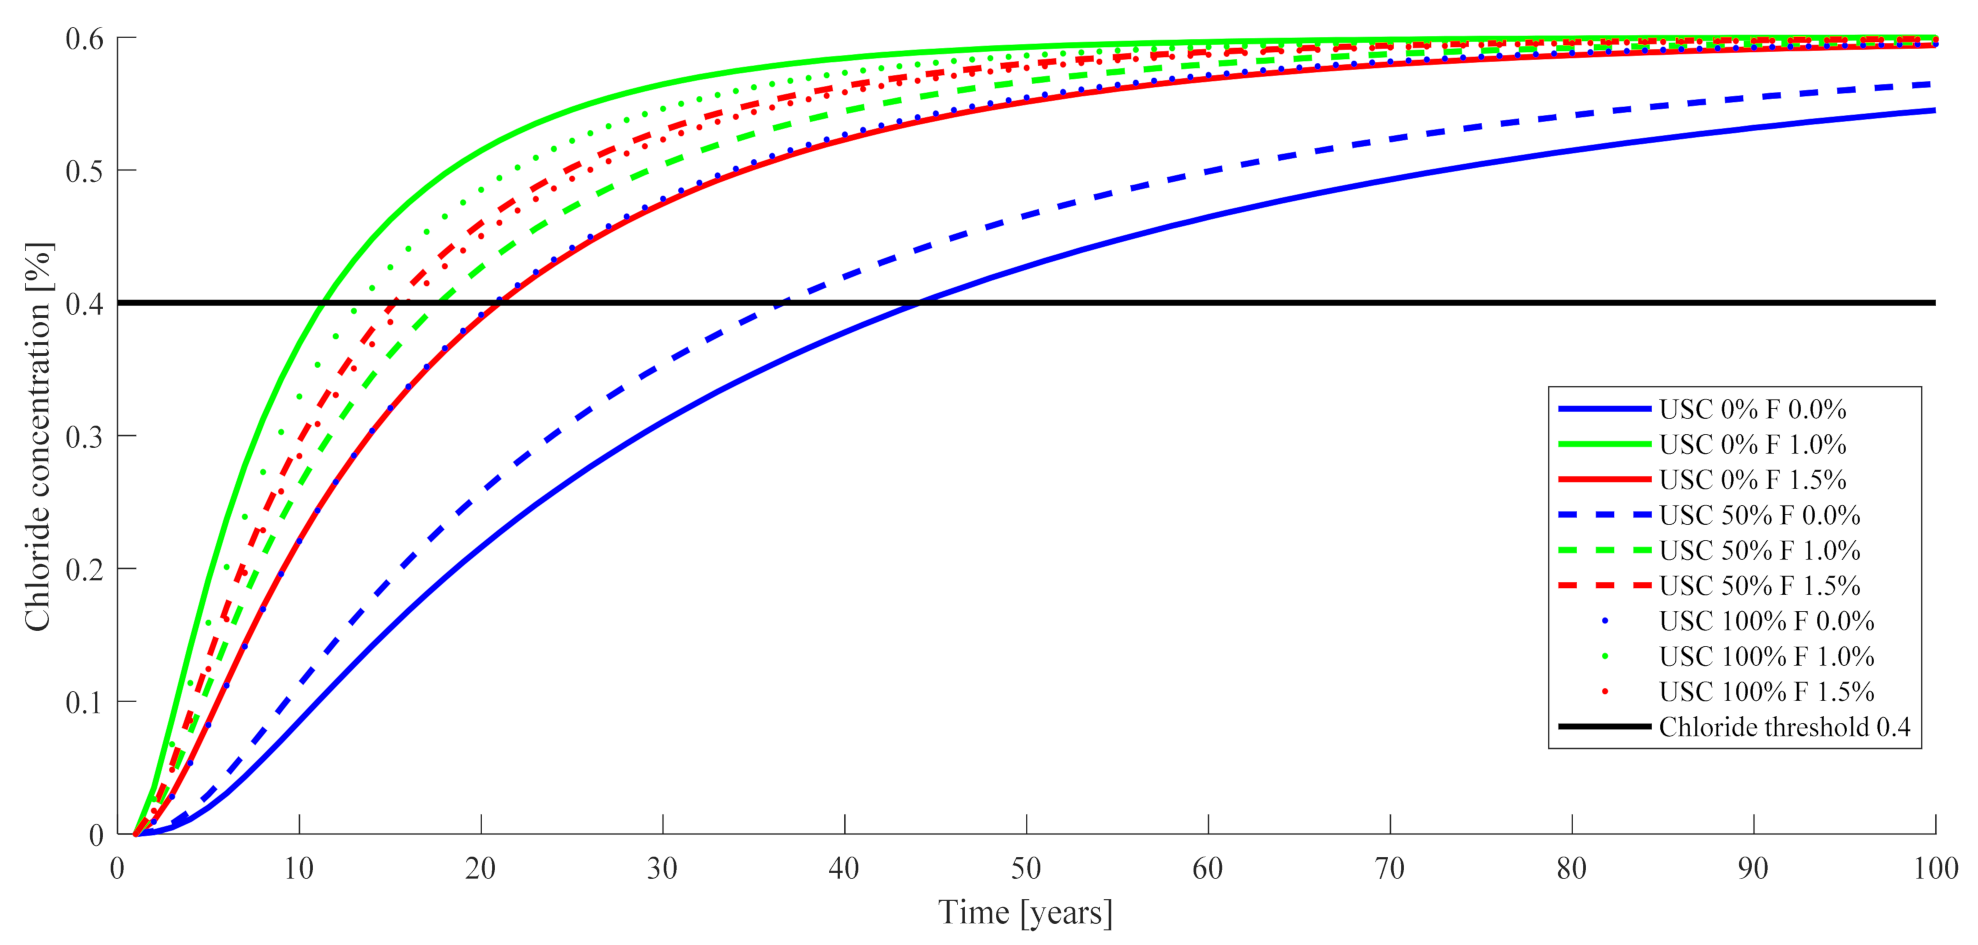
- the USC 0% F 0.0% mixture, which is concrete without fibre and without preloading, shows the best results in terms of service life associated with chloride penetration,
- the USC 0% F 1.0% mixture, which is concrete with 1% of fibre and without preloading, shows the worst results,
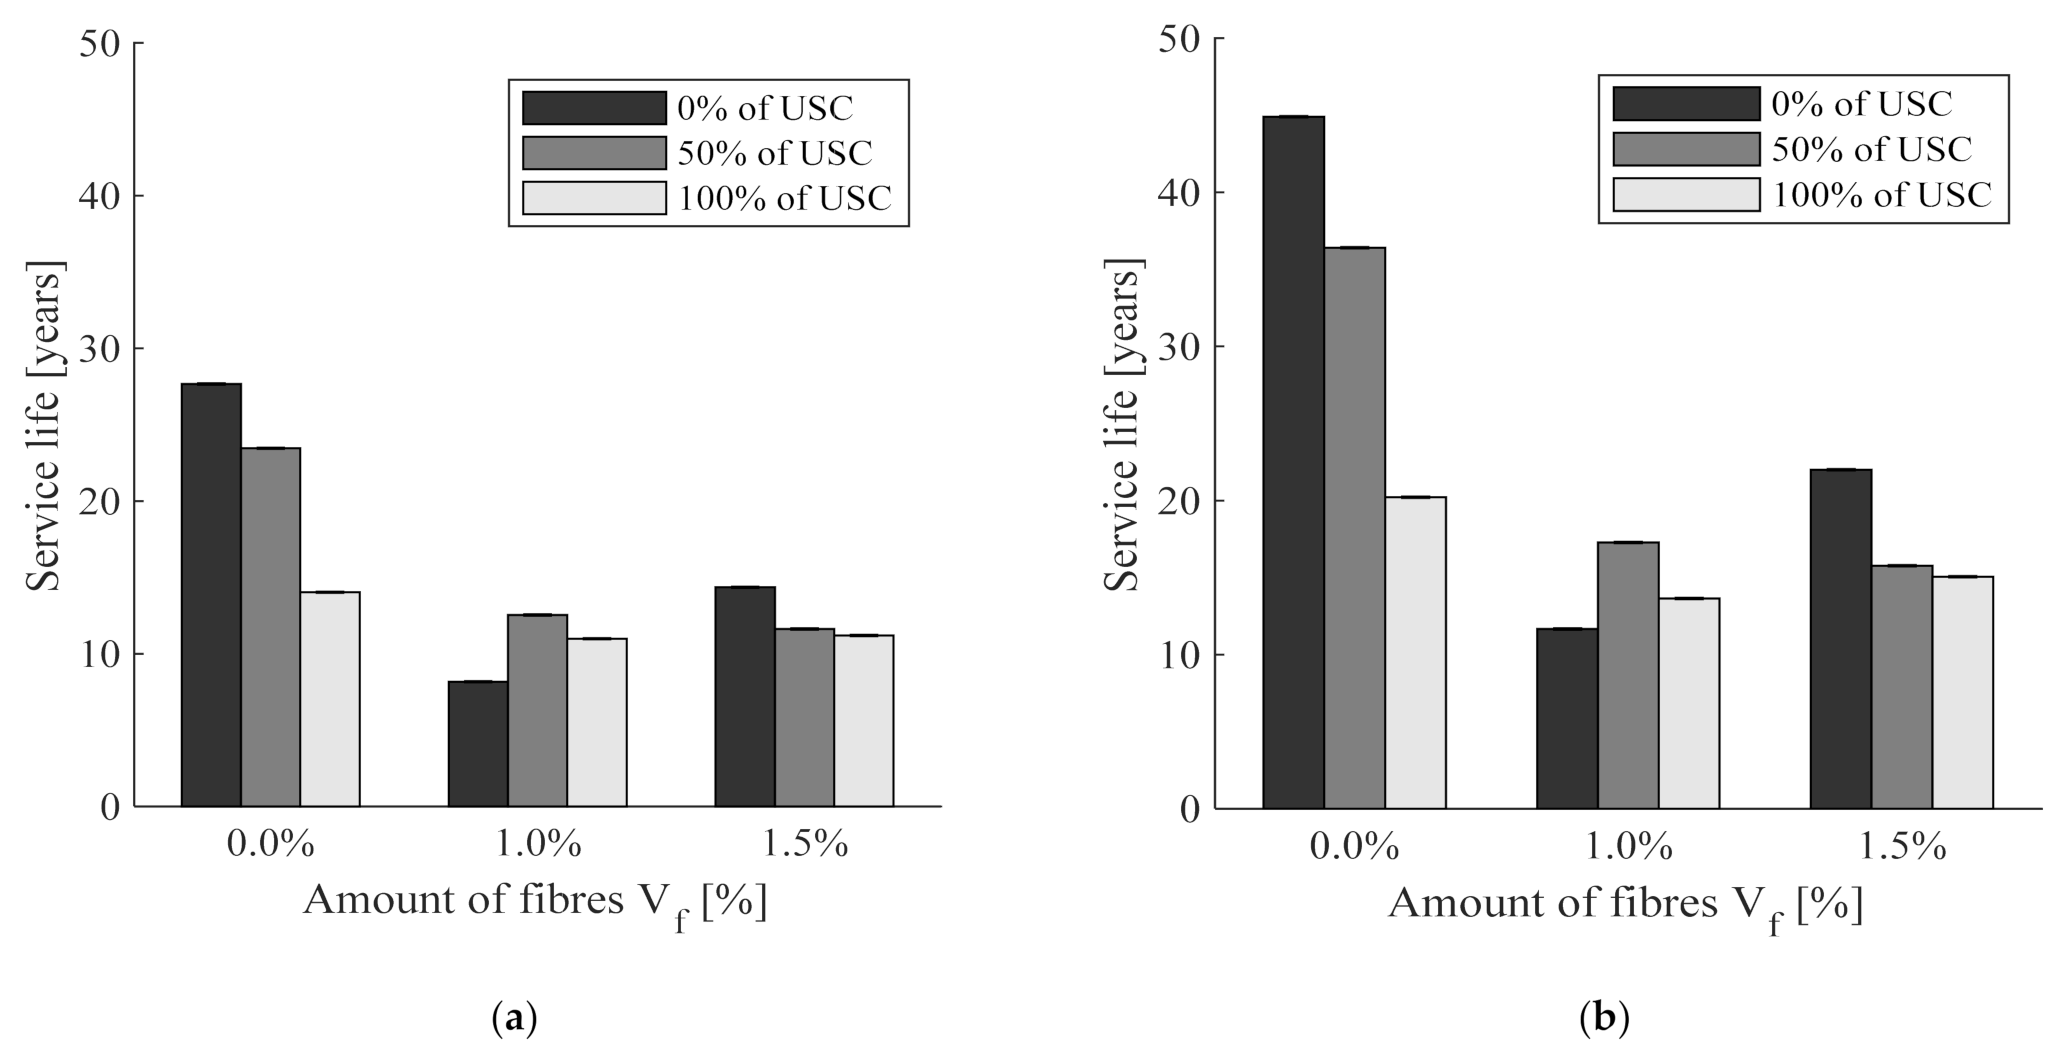
- the preloading negatively affects the service life, except for the group with 1% of fibre, where the service life is slightly higher when the preloading is considered,
- differences in variability are significant despite the small differences in basic material properties, for example, compressive strength,
- mixtures reinforced by fibre show lower service life than the mixture without fibre,
- the hypothetical service life is approximately 40% longer if the time-dependent diffusion parameters are considered,
- the value of the diffusion coefficient does not correspond to all results of service life if a time-dependent model with a maturation factor is considered.
Author Contributions
Funding
Conflicts of Interest
References
- Wittmann, F.; Zhao, T.; Jiang, F.; Wan, X. Influence of Combined Actions on Durability and Service Life of Reinforced Concrete Structures Exposed to Aggressive Environment. Restor. Build. Monum. 2012, 18, 105–112. [Google Scholar] [CrossRef]
- Kuosa, H.; Ferreira, R.M.; Holt, E.; Leivo, M.; Vesikari, E. Effect of coupled deterioration by freeze–thaw, carbonation and chlorides on concrete service life. Cem. Concr. Compos. 2014, 47, 32–40. [Google Scholar] [CrossRef]
- Wittmann, F.H.; Zhang, P.; Zhao, T. Ingteratction of Deterioration of Processes in Cement-Based Materials. In Proceedings of the 1st International Conference on Microstructure Related Durability of Cementitious Composites, Nanjing, China, 13–15 October 2008. [Google Scholar]
- Wang, H.-L.; Dai, J.-G.; Sun, X.-Y. Chloride transport in concrete under sustained flexural loading. Mag. Concr. Res. 2017, 69, 245–254. [Google Scholar] [CrossRef]
- Bao, J.; Wang, L. Combined effect of water and sustained compressive loading on chloride penetration into concrete. Constr. Build. Mater. 2017, 156, 708–718. [Google Scholar] [CrossRef]
- Azarsa, P.; Gupta, R. Electrical Resistivity of Concrete for Durability Evaluation: A Review. Adv. Mater. Sci. Eng. 2017, 2017, 1–30. [Google Scholar] [CrossRef] [Green Version]
- Yao, Y.; Wang, L.; Wittmann, F.H.; De Belie, N.; Schlangen, E.; Eguez Alava, H.; Wang, Z.; Kessler, S.; Gehlen, C.; Yunus, B.M.; et al. Test methods to determine durability of concrete under combined environmental actions and mechanical load: Final report of RILEM TC 246-TDC. Mater. Struct. 2016, 50, 123. [Google Scholar] [CrossRef]
- Cosoli, G.; Mobili, A.; Tittarelli, F.; Revel, G.M.; Chiariotti, P. Electrical Resistivity and Electrical Impedance Measurement in Mortar and Concrete Elements: A Systematic Review. Appl. Sci. 2020, 10, 9152. [Google Scholar] [CrossRef]
- Chung, D. Damage in cement-based materials, studied by electrical resistance measurement. Mater. Sci. Eng. R Rep. 2003, 42, 1–40. [Google Scholar] [CrossRef]
- Cao, J.; Wen, S.; Chung, D.D.L. Defect dynamics and damage of cement-based materials, studied by electrical resistance measurement. J. Mater. Sci. 2001, 36, 4351–4360. [Google Scholar] [CrossRef]
- Domski, J.; Katzer, J. Comprehensive approach to evaluation of mechanical properties of waste aggregate concrete reinforced by steel fiber. Struct. Concr. 2020, 21, 428–436. [Google Scholar] [CrossRef]
- Hornakova, M.; Katzer, J.; Kobaka, J.; Konecny, P. Lightweight SFRC Benefitting from a Pre-Soaking and Internal Curing Process. Materials 2019, 12, 4152. [Google Scholar] [CrossRef] [Green Version]
- Horňáková, M.; Lehner, P.; Le, T.; Konečný, P.; Katzer, J. Durability Characteristics of Concrete Mixture Based on Red Ceramic Waste Aggregate. Sustainability 2020, 12, 8890. [Google Scholar] [CrossRef]
- Horňáková, M.; Lehner, P. Relationship of Surface and Bulk Resistivity in the Case of Mechanically Damaged Fibre Reinforced Red Ceramic Waste Aggregate Concrete. Materials 2020, 13, 5501. [Google Scholar] [CrossRef]
- Konečný, P.; Lehner, P. Effect of cracking and randomness of inputs on corrosion initiation of reinforced concrete bridge decks exposed to chlorides. Frat. Integrità Strutt. 2016, 11, 29–37. [Google Scholar] [CrossRef] [Green Version]
- Cooper, C.A.; Mayer, P.; Faulkner, B.R. Effects of road salts on groundwater and surface water dynamics of sodium and chloride in an urban restored stream. Biogeochemistry 2014, 121, 149–166. [Google Scholar] [CrossRef]
- Whitaker, T. Book of ASTM Standards 2004. Section 4: Construction. Volume 04.01: Cement; Lime; Gypsum; ASTM International: Drive West Conshohocken, PA, USA, 2004. [Google Scholar]
- Rodriguez, O.G.; Hooton, R.D. Influence of Cracks on Chloride Ingress into Concrete. ACI Mater. J. 2003, 100. [Google Scholar] [CrossRef] [Green Version]
- Ye, H.; Jin, N.; Jin, X.; Fu, C. Model of chloride penetration into cracked concrete subject to drying–wetting cycles. Constr. Build. Mater. 2012, 36, 259–269. [Google Scholar] [CrossRef]
- Yuan, C.; Niu, D.; Luo, D. Effect of Carbonation on Chloride Diffusion in Fly Ash Concrete. Disaster Adv. 2012, 5, 433–436. [Google Scholar]
- Hooton, R.D. Life-365 Service Life Prediction Model and Computer Program for Predicting the Service Life and Life-Cycle Cost of Reinforced Concrete Exposed to Chlorides; Life-365 User Manual; Life-365™ Consortium III: Scottsdale, AZ, USA, 2012; pp. 1–80. [Google Scholar]
- Hooton, R.D.; Thomas, M.D.A.; Standish, K. Prediction of Chloride Penetration in Concrete; University of Toronto Department of Civil Engineering: Toronto, ON, Canada, 2001; p. 412. [Google Scholar]
- Hornakova, M.; Konecny, P.; Lehner, P.; Katzer, J. Durability of structural lightweight waste aggregate concrete—Electrical resistivity. MATEC Web Conf. 2020, 310, 00015. [Google Scholar] [CrossRef]
- Morris, W.; Moreno, E.; Sagüés, A. Practical evaluation of resistivity of concrete in test cylinders using a Wenner array probe. Cem. Concr. Res. 1996, 26, 1779–1787. [Google Scholar] [CrossRef]
- AASHTO T358. Standard Method of Test for Surface Resistivity Indication of Concrete’s Ability to Resist Chloride Ion Penetration; AASHTO: Washington, DC, USA, 2013. [Google Scholar]
- Lehner, P.; Konečný, P.; Ponikiewski, T. Comparison of Material Properties of SCC Concrete with Steel Fibres Related to Ingress of Chlorides. Crystals 2020, 10, 220. [Google Scholar] [CrossRef] [Green Version]
- Tran, Q.; Ghosh, P. Influence of pumice on mechanical properties and durability of high performance concrete. Constr. Build. Mater. 2020, 249, 118741. [Google Scholar] [CrossRef]
- Lu, X.Y. Application of the Nernst-Einstein equation to concrete. Cem. Concr. Res. 1997, 27, 293–302. [Google Scholar] [CrossRef]
- Mangat, P.S.; Molloy, B.T. Prediction of long term chloride concentration in concrete. Mater. Struct. 1994, 27, 338–346. [Google Scholar] [CrossRef]
- Thomas, M.D.; Bamforth, P.B. Modelling chloride diffusion in concrete: Effect of fly ash and slag. Cem. Concr. Res. 1999, 29, 487–495. [Google Scholar] [CrossRef]
- Birge, R.T. The Calculation of Errors by the Method of Least Squares. Phys. Rev. 1932, 40, 207–227. [Google Scholar] [CrossRef]
- Konečný, P.; Lehner, P.; Ghosh, P.; Morávková, Z.; Tran, Q. Comparison of procedures for the evaluation of time dependent concrete diffusion coefficient model. Constr. Build. Mater. 2020, 258, 119535. [Google Scholar] [CrossRef]
- RCON Giatec Scientific. Available online: https://www.giatecscientific.com/products/concrete-ndt-devices/rcon-bulk-resistivity/ (accessed on 30 October 2020).
- ASTM International. (American Society for Testing and Materials). Standard Test Method for Bulk Electrical Conductivity of Hardened Concrete. In ASTM C1760-12; ASTM International: West Conshohocken, PA, USA, 2012. [Google Scholar]
- European Committee for Standarization EN 206-1. Concrete—Part 1: Specification, Performance, Production and Conformity; CEN: Brussels, Belgium, 2000. [Google Scholar]
- Tikalsky, P.J.; Pustka, D.; Marek, P. Statistical Variations in Chloride Diffusion in Concrete Bridges. ACI Struct. J. 2005, 102, 481–486. [Google Scholar] [CrossRef]
- Vassie, P.; Swenson, D.; Gregg, D.; Vine-Lott, K.; Arshad, M. Reinforcement Corrosion and the durability of concrete bridges. Proc. Inst. Civ. Eng. 1985, 78, 1253–1256. [Google Scholar] [CrossRef]


| Composition | Quantity (kg∙m−3) | Absorbed Water (kg∙m−3) |
|---|---|---|
| WRCFA-dry | 378.38 | 322.33 |
| ECCA-dry | 247.07 | 138.98 |
| Cement | 320.49 | - |
| CCCSF, Vf = 0.0% | 0.0 | - |
| CCCSF, Vf = 1.0% | 78.0 | - |
| CCCSF, Vf = 1.5% | 117.0 | - |
| Vf | 0.0% | 1.0% | 1.5% |
|---|---|---|---|
| Compressive strength (MPa) | 15.4 | 14.7 | 17.1 |
| Splitting Tensile Strength (MPa) | 1.7 | 1.9 | 2.2 |
| Static Modulus of Elasticity (GPa) | 8.2 | 8.9 | 9.6 |
| Dynamic Modulus of Elasticity (GPa) | 12.9 | 13.2 | 13.5 |
| Flexural tensile strength (MPa) | 1.4 | 1.7 | 1.6 |
| Shear Strength (MPa) | 2.2 | 2.3 | 2.6 |
| Amount of Fibers | USC 0% | USC 50% | USC 100% |
|---|---|---|---|
| F 0.0% | USC 0% F 0.0% | USC 50% F 0.0% | USC 100% F 0.0% |
| F 1.0% | USC 0% F 1.0% | USC 50% F 1.0% | USC 100% F 1.0% |
| F 1.5% | USC 0% F 1.5% | USC 50% F 1.5% | USC 100% F 1.5% |
| Time (Days) | 7 | 14 | 28 | 56 | 91 | 161 | 461 | m (-) |
|---|---|---|---|---|---|---|---|---|
| F0.0% | 2.37 | 2.07 | 2.03 | 2.00 | 1.65 | 1.39 | 0.62 | 0.20 |
| F1.0% | 3.57 | 3.05 | 2.64 | 2.44 | 2.09 | 1.75 | 1.02 | 0.24 |
| F1.5% | 4.37 | 3.84 | 3.43 | 3.15 | 2.85 | 2.35 | 1.24 | 0.22 |
| Parameter Name | Value |
|---|---|
| Width (m) | 1.0 |
| Depth (m) | 0.1 |
| Chloride threshold for corrosion initiation Cth (%) | 0.4 [35] |
| Concentration of chlorides at the surface C0 (%) | 0.6 [36] |
| Initial concentration of chloride in concrete Cb (%) | 0 |
| Monitored life span t (years) | 100 |
| Reference time (day) | 461 |
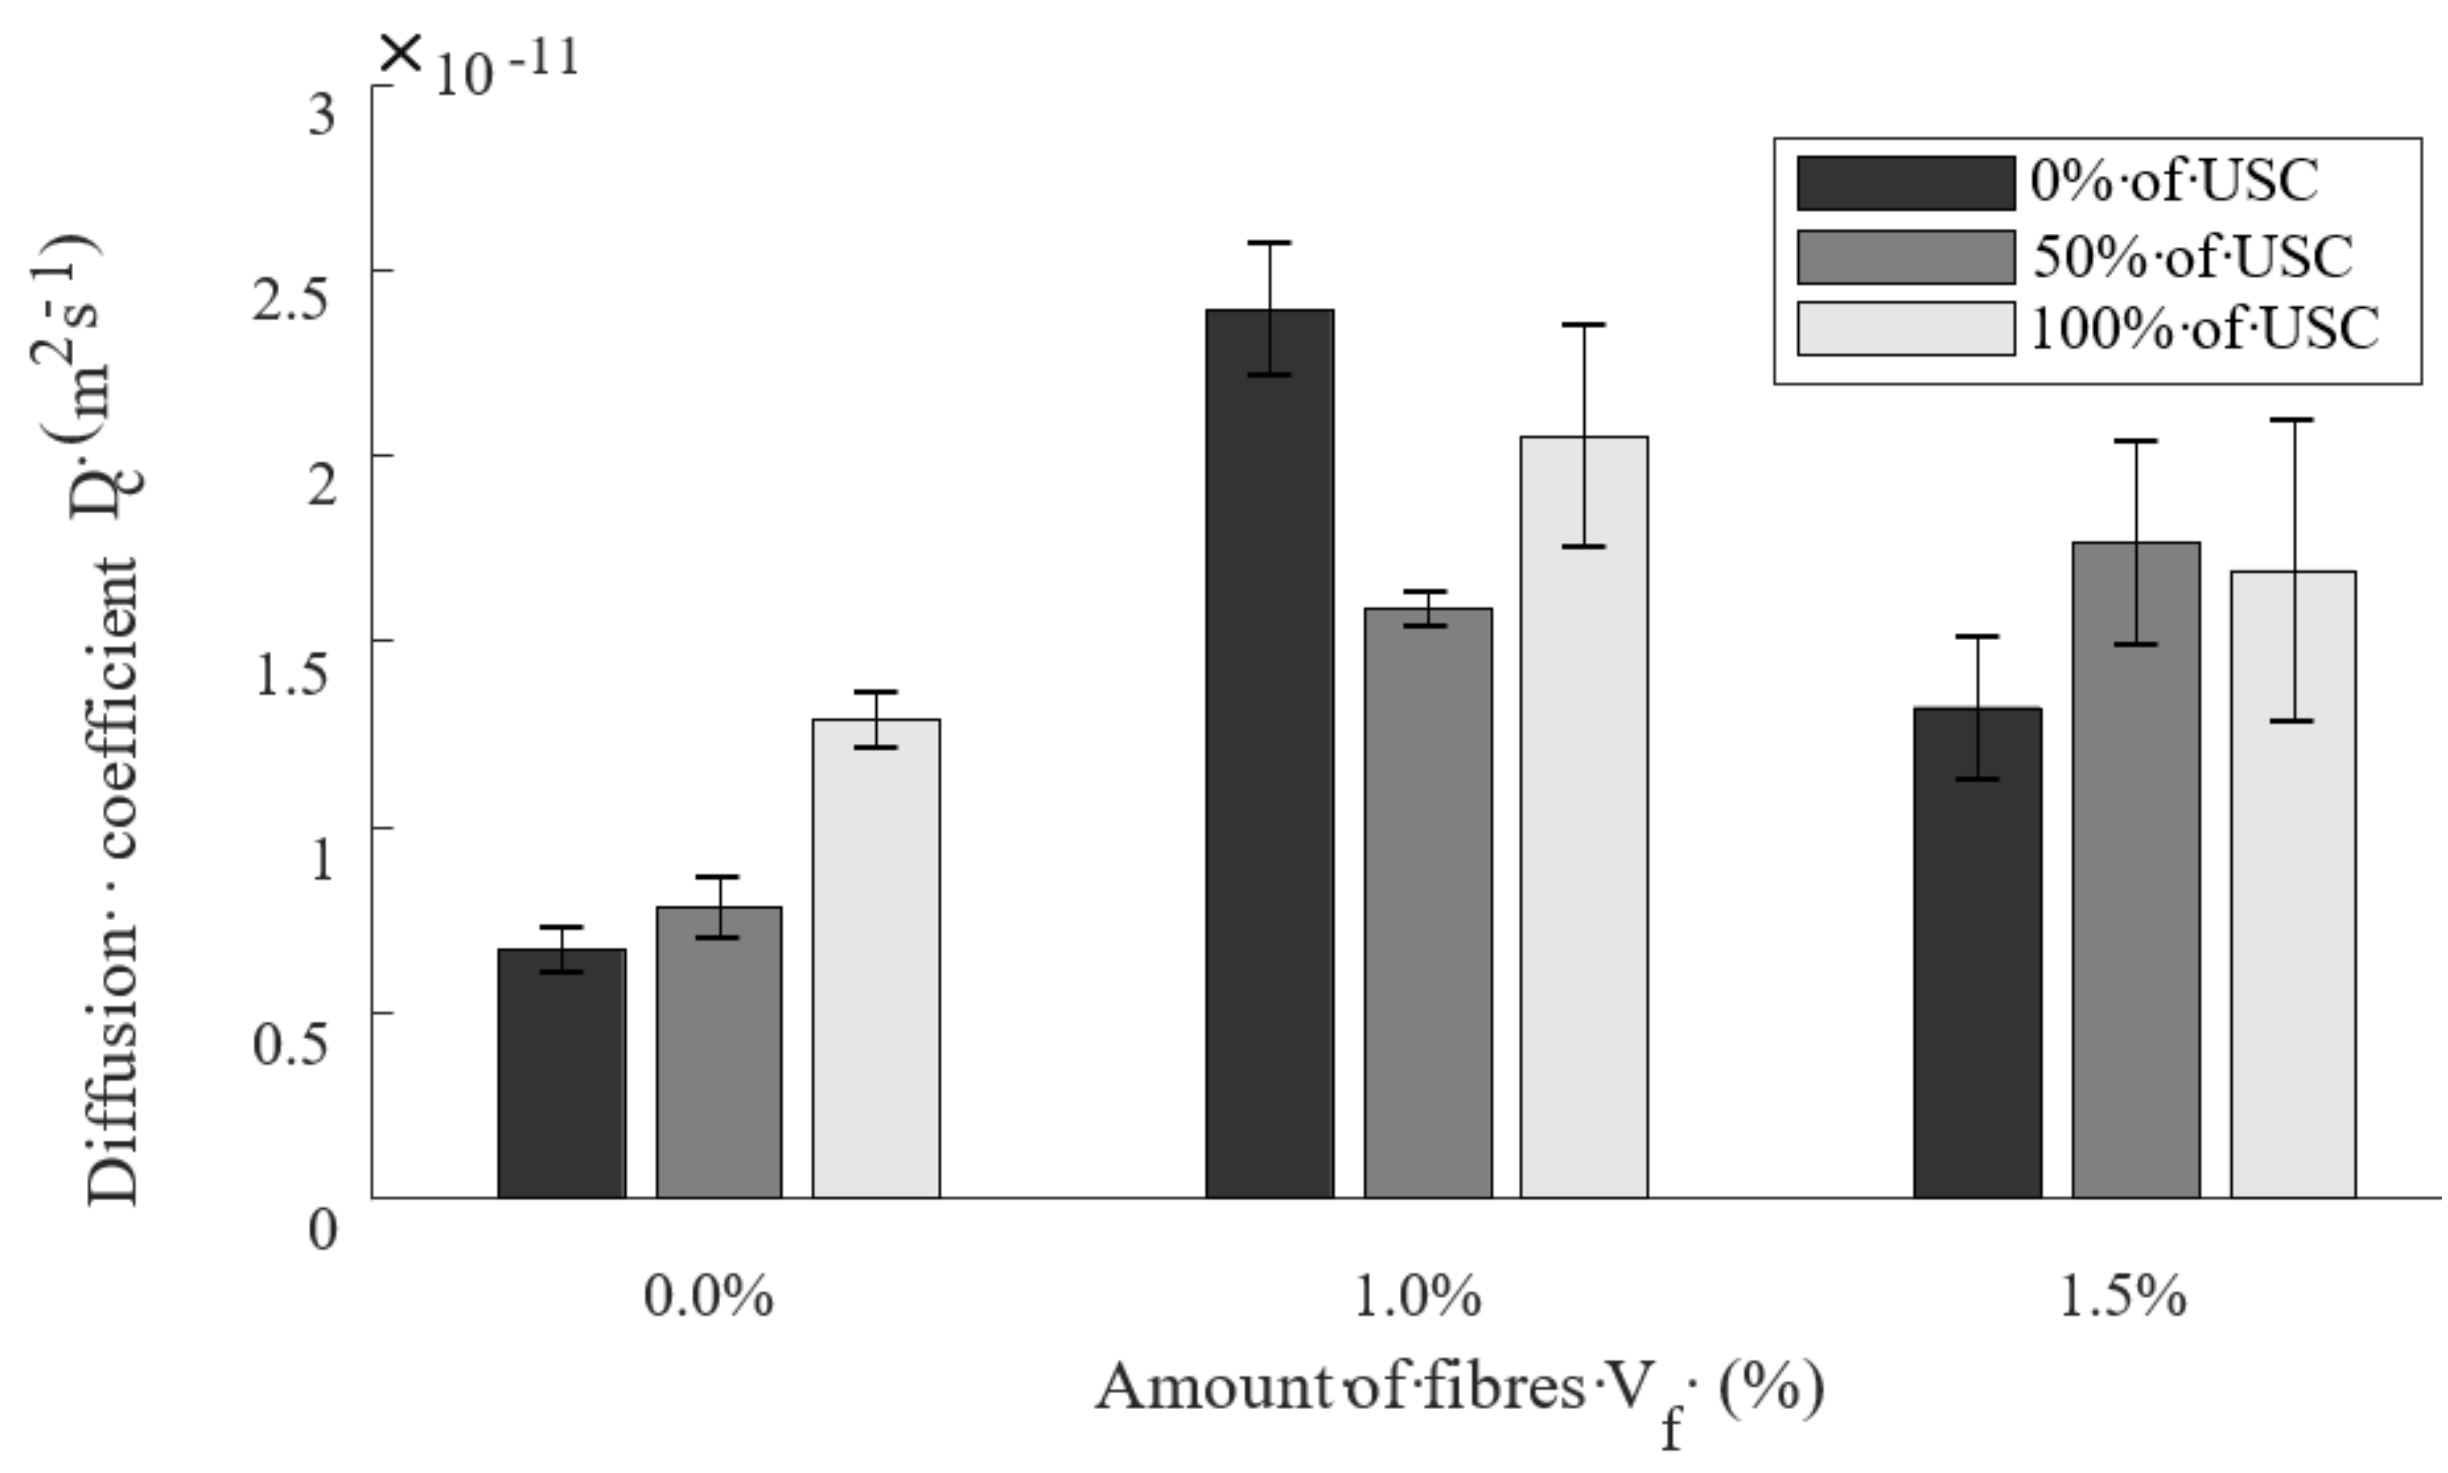
| MIX NAME | Diffusion Coefficient Dcnom (m2·s−1) × 10−11 (461 Days) | Aging Factor m (-) (461 Days) |
|---|---|---|
| USC 0% F 0.0% | 0.67 | 0.20 |
| USC 0% F 1.0% | 2.39 | 0.24 |
| USC 0% F 1.5% | 1.32 | 0.22 |
| USC 50% F 0.0% | 0.78 | 0.20 |
| USC 50% F 1.0% | 1.59 | 0.24 |
| USC 50% F 1.5% | 1.76 | 0.22 |
| USC 100% F 0.0% | 1.29 | 0.20 |
| USC 100% F 1.0% | 2.05 | 0.24 |
| USC 100% F 1.5% | 1.69 | 0.22 |
| Mix Name | SL for Constant Coefficient ti (Year) | SL for Time-Dependent Coefficient ti (Year) | Difference |
|---|---|---|---|
| USC 0% F 0.0% | 27.6753 | 44.89 | 62% |
| USC 0% F 1.0% | 23.4536 | 36.39 | 43% |
| USC 0% F 1.5% | 14.0349 | 20.21 | 53% |
| USC 50% F 0.0% | 8.1752 | 11.66 | 55% |
| USC 50% F 1.0% | 12.5336 | 17.27 | 38% |
| USC 50% F 1.5% | 10.9916 | 13.64 | 36% |
| USC 100% F 0.0% | 14.3582 | 21.99 | 44% |
| USC 100% F 1.0% | 11.6244 | 15.76 | 24% |
| USC 100% F 1.5% | 11.2032 | 15.04 | 34% |
Publisher’s Note: MDPI stays neutral with regard to jurisdictional claims in published maps and institutional affiliations. |
© 2021 by the authors. Licensee MDPI, Basel, Switzerland. This article is an open access article distributed under the terms and conditions of the Creative Commons Attribution (CC BY) license (https://creativecommons.org/licenses/by/4.0/).
Share and Cite
Lehner, P.; Horňáková, M. Effect of Amount of Fibre and Damage Level on Service Life of SFR Recycled Concrete in Aggressive Environment. Buildings 2021, 11, 489. https://doi.org/10.3390/buildings11100489
Lehner P, Horňáková M. Effect of Amount of Fibre and Damage Level on Service Life of SFR Recycled Concrete in Aggressive Environment. Buildings. 2021; 11(10):489. https://doi.org/10.3390/buildings11100489
Chicago/Turabian StyleLehner, Petr, and Marie Horňáková. 2021. "Effect of Amount of Fibre and Damage Level on Service Life of SFR Recycled Concrete in Aggressive Environment" Buildings 11, no. 10: 489. https://doi.org/10.3390/buildings11100489