Article

Reliability of Existing Climate Indices in Assessing the Freeze-Thaw Damage Risk of Internally Insulated Masonry Walls

1
Department of Building, Civil and Environmental Engineering, Concordia University, 1455 de Maisonneuve Blvd. West, Montreal, QC H3G 1M8, Canada
2
National Research Council Canada, Construction Research Centre, Ottawa, ON K1A 0R6, Canada
*
Author to whom correspondence should be addressed.
Buildings 2021, 11(10), 482; https://doi.org/10.3390/buildings11100482
Submission received: 13 September 2021 / Revised: 6 October 2021 / Accepted: 14 October 2021 / Published: 17 October 2021
(This article belongs to the Special Issue Climate Resilient Buildings)

Abstract

:
This paper evaluates the reliability of the currently used climate-based indices in selecting a moisture reference year (MRY) for the freeze-thaw (FT) damage risk assessment of internally insulated solid brick walls. The evaluation methodology compares the ranking of the years determined by the climate-based indices and response-based indices from simulations, regarded as actual performance. The hygrothermal response of an old brick masonry wall assembly, before and after retrofit, was investigated in two Canadian cities under historical and projected future climates. Results indicated that climate-based indices failed to represent the actual performance. However, among the response-based indices, the freeze-thaw damage risk index (FTDR) showed a better correlation with the climate-based indices. Additionally, results indicated a better correlation between the climatic index (CI), the moisture index (MI), and FTDR in Ottawa; however, in Vancouver, a better fit was found between MI and FTDR. Moreover, the risk of freeze-thaw increased considerably after interior insulation was added under both historical and projected future climates. The risk of FT damage would increase for Ottawa but decrease for Vancouver under a warming climate projected in the future, based on the climate scenario used in this study. Further research is needed to develop a more reliable method for the ranking and the selection of MRYs on the basis of climate-based indices that is suitable for freeze-thaw damage risk assessment.

1. Introduction

With the increased concern in respect to climate change, and following the Paris Agreement, Canada has established the Vancouver Declaration on Clean Growth and Climate Change, a pan-Canadian framework to contribute to the growth of a clean economy and address the severity of climate change. Canada is committed to reducing 30% of greenhouse gas (GHG) emissions below 2005 levels by 2030 [1]. The Canadian government has also introduced the “Canadian Net-zero Emission Accountability Act” in November 2020 to legislate Canada’s target of net-zero GHG emission by 2050. The existing building stock, which contributes up to 17% of the country’s carbon emissions, can be an integral part of the solution by improving energy efficiency and adopting low carbon energy sources [2]. A general observation from the historical weather data shows that the average temperature has increased globally by 0.85 °C [3]. Previous research has shown that under a changing climate, greater rainfall intensity, more extreme winds, and more frequent storms are expected, which may increase wind-driven rain (WDR) loads on the façade and, consequently, heighten risks of rain penetration and moisture-related damage to buildings [4,5,6,7,8,9]. On the other hand, an increased air temperature may increase the drying potential of wall assemblies. Therefore, the growth in weather and climate extremes may significantly increase the risk of deterioration of existing infrastructure [10,11,12,13].
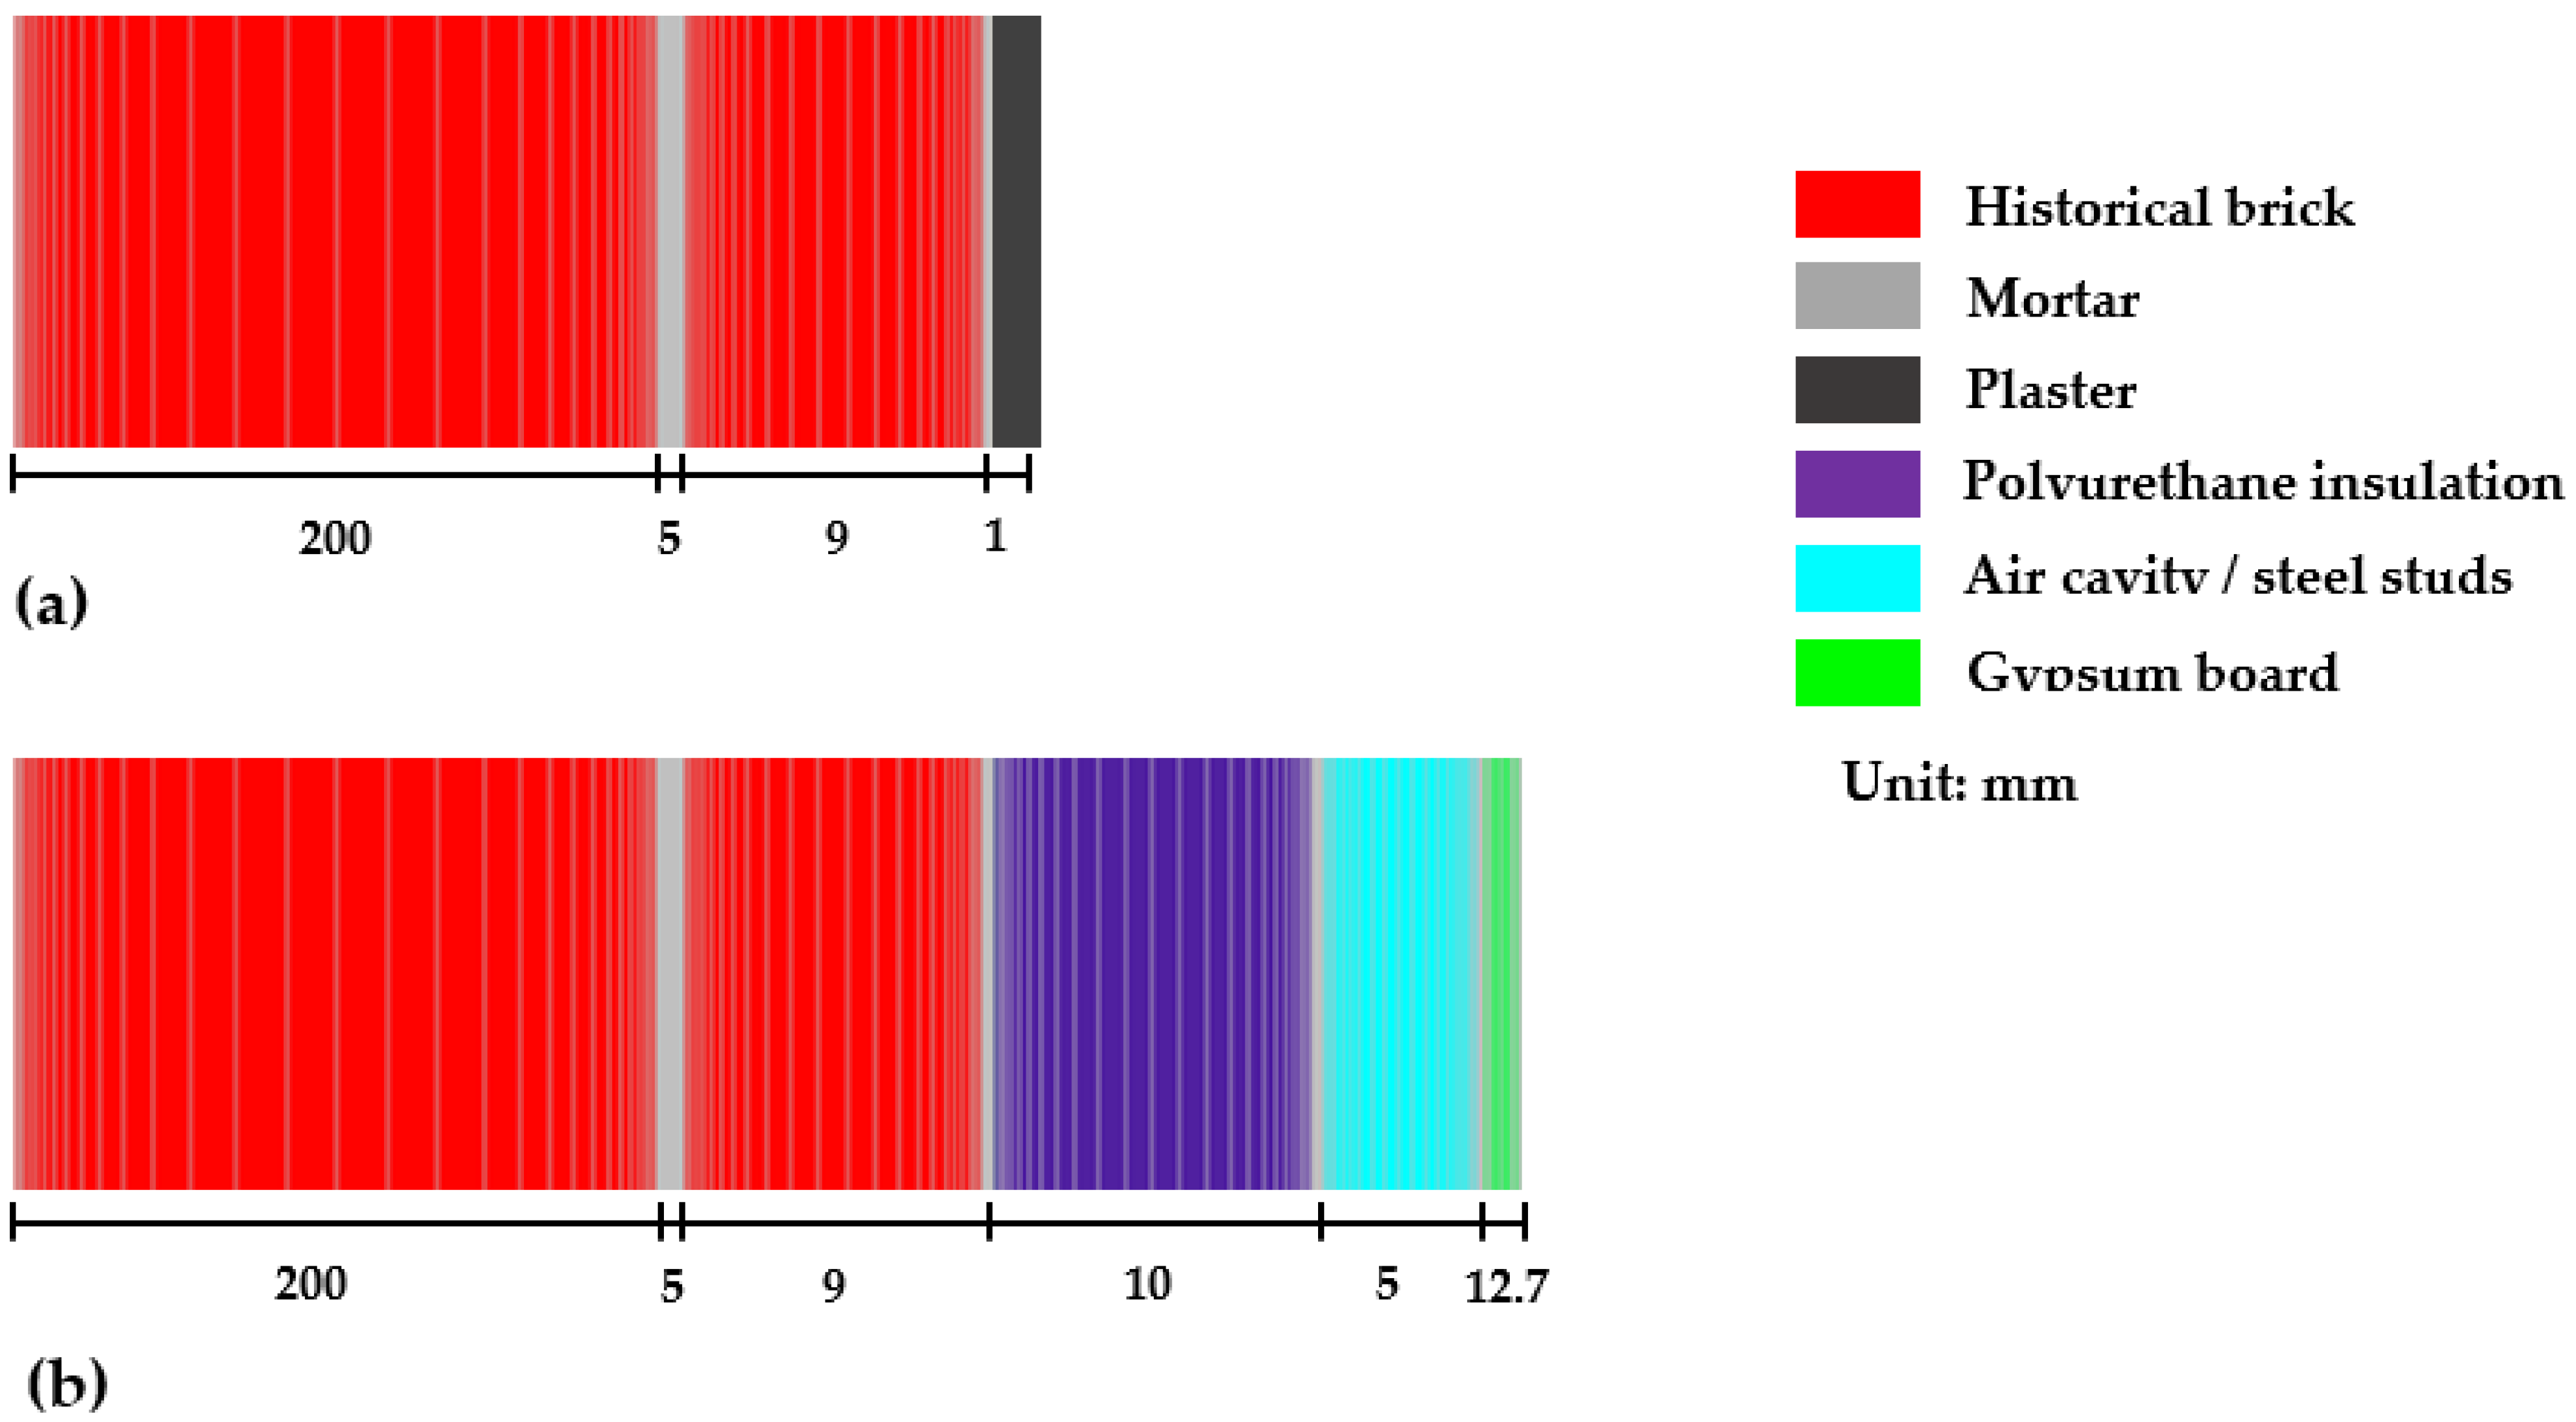
In Canada, many buildings of historical importance are often poorly thermally insulated. Thus, to increase their energy efficiency while ensuring occupant comfort, interior insulation is regarded as the only retrofit solution. Due to such interventions, the masonry of historical buildings will be subjected to lower temperatures during the heating season, which may increase the potential for condensation and frost within the wall. A balance must therefore be maintained between improvements in thermal performance and durability.
Frost damage, also referred to as freeze-thaw (FT) damage, remains amongst the primary damage mechanisms of porous materials that threaten the durability of buildings located in cold climates. The damage is mainly affected by the action of freezing and thawing inside materials and is the result of multiple critical freeze-thaw cycles (FTCcrit) [14,15]. It is understood that for damage to occur, two important factors must exist concurrently: a freezing temperature and the exceedance of the critical degree of moisture saturation within the porous material [16]. Thus, for example, regardless of the number of fluctuations around the freezing point, no damage occurs if the moisture content in the material remains below its critical degree of moisture saturation (Scrit). The value of Scrit is influenced by the material properties of the masonry and is defined as a constant that specifies the moisture content at which frost damage can occur proportionally to the fully saturated moisture content. Laboratory freezing tests [17] and frost dilatometry [18] are used to determine this critical moisture content which can vary substantially between different types of masonry [19]. Fagerlund [17] considered a hypothetical value of Scrit of 66% determined from the x-axis intercept of the strain of damaged specimens. Straube et al. [18] have used frost dilatometry to measure the value of Scrit of three different brick materials from Canada. A wide range of Scrit values were found (i.e., 25%, 30%, and 87%) amongst the sets of bricks that were tested. Using the same frost dilatometry method, an average range in value of Scrit of 70%-80% was found for samples taken from clay brick masonry of a historic house located in Toronto [20]. These values were in line with data collected on existing brick units of North American buildings constructed between the years 1830 and 1950, where Scrit varied between 30% and 90% [21].
From a building physics perspective, the principal mechanism for the onset of frost damage is the volume expansion of freezing water by nine percent [22,23]. Once the material strength is no longer able to withstand the tensile forces in the pore system, damage happens in the form of fine cracks. These cracks can gradually develop under successive frost events and induce scaling at the material surface and may also cause complete disintegration of the masonry unit [15].
To assess the risk of frost-induced damage, several performance indicators have been introduced in the literature, a summary of which is provided in [24]. One way to quantify the frost damage risk is to count the number of freeze-thaw cycles [25,26,27,28,29,30]. Grossi et al. [25] counted a cycle based on the day having a positive average temperature, followed by a day with a negative average temperature. Mukhopadhyaya et al. [26] counted the number of critical freeze-thaw cycles (FTCcrit) on an hourly basis using the freeze-thaw index. The larger the number of FTCcrit at conditions exceeding the critical moisture content, the greater the potential freeze-thaw damage. Other performance indicators include the winter index (WI) [27] and the Time-of-Frost (TOF) [28]. The WI calculates the level of severity when the relative humidity (RH) is above the critical level and concurrently the temperature falls below its freezing value. Whereas the time-of-frost (TOF) calculates the number of hours during the year when conditions are favorable for ice formation. Kočí et al. [
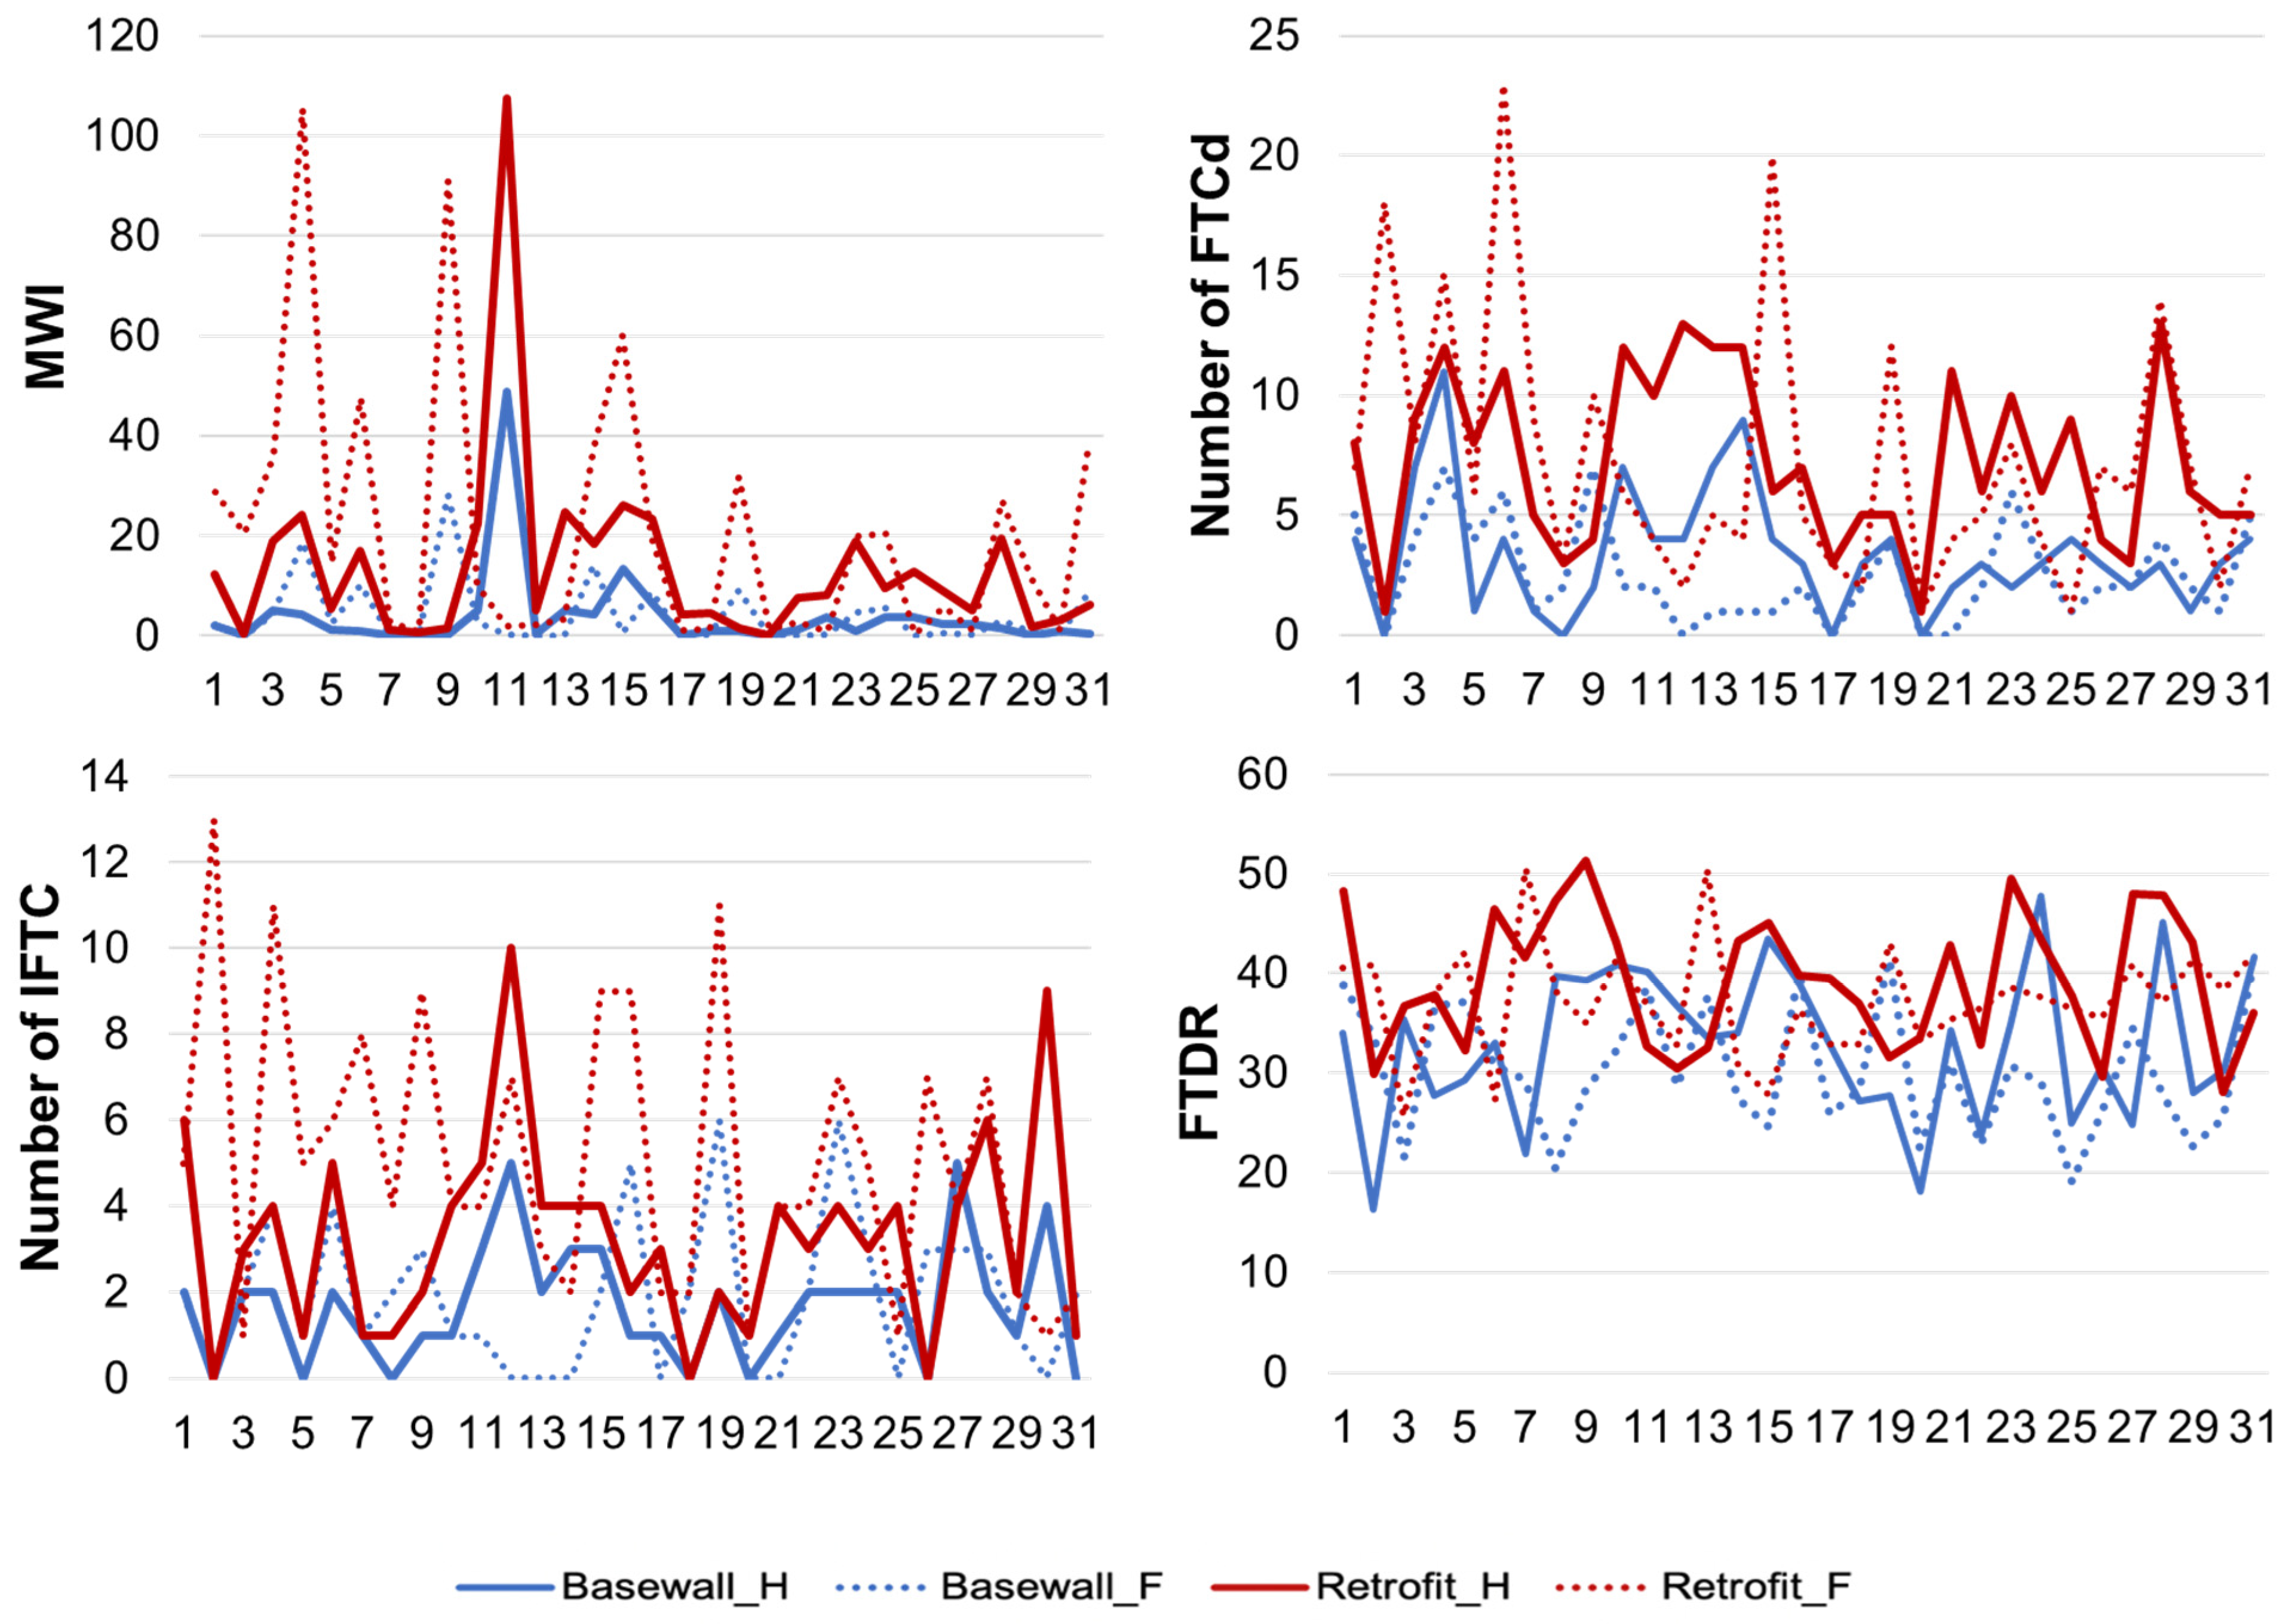
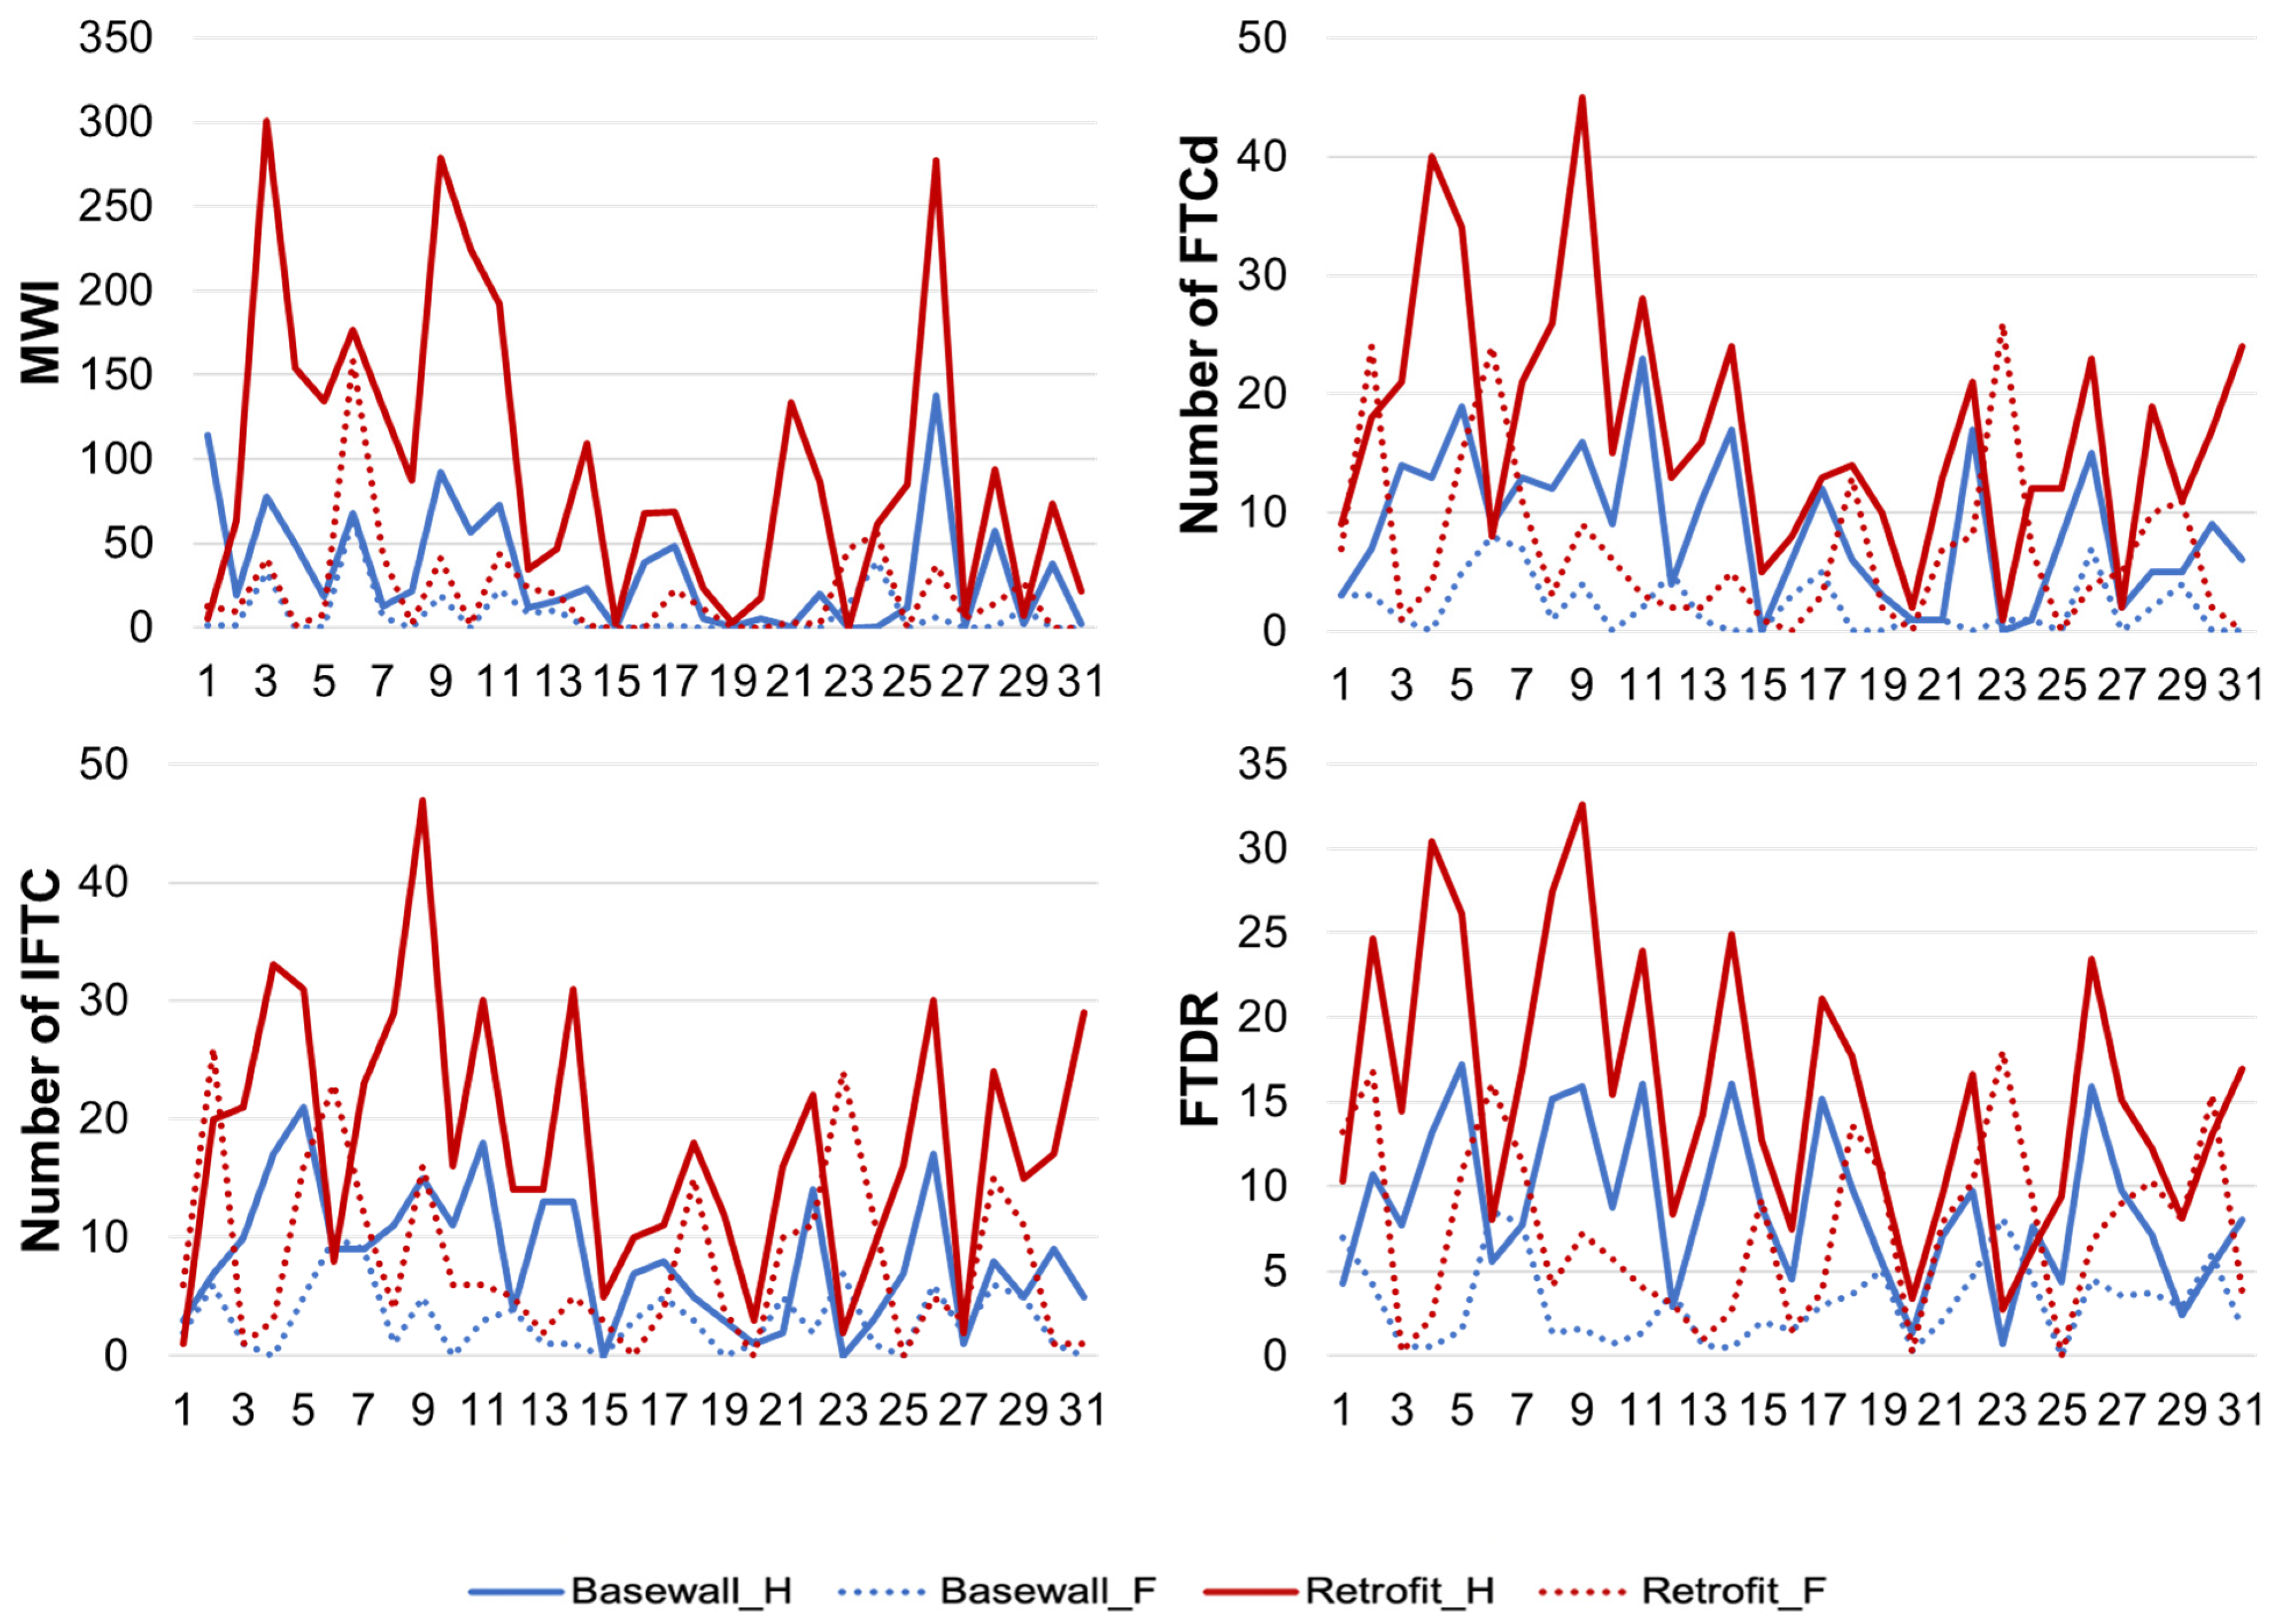
29] then proposed modified versions of the winter index—MWI, and TOF, which utilize hourly values of moisture content (MC) instead of RH. Other performance indicators are the amount of frozen water (AFW) and the number of indicative freeze-thaw cycles (IFTC) [29,30]. Moreover, Zhou et al. [31] developed a freeze-thaw damage risk index (FTDR), which is defined as the sum of the difference between the maximum and minimum degree of saturation of ice content during every complete or incomplete FT cycle. An incomplete freeze-thaw cycle occurs when the freezing activity restarts before complete thawing. As well, a contentious issue in respect to freeze-thaw effects in masonry products are the temperatures at which freezing occurs within a masonry unit. Straube and Schumacher [19] considered that freezing occurs at the time the temperature inside the material falls beneath −5 °C. However, Grossi et al. [25] found that crack growth is more representative at temperatures between −4 °C and −15 °C. In addition, some studies considered the period of freezing and thawing as an important factor. For instance, the CSN EN 12371 [32] requires 6 h of freezing followed by 6 h lags to count the FTC.
Very little research has been conducted on the impact of climate change on the moisture durability of energy-efficient building envelopes compared to the energy performance of these buildings. Van Aarle et al. [33] reported that the risk of frost damage might increase under severe rainfall events. However, this damage risk might be reduced with the increase in air temperature. Hence, following a series of hygrothermal simulations of a building with calcium silicate masonry brick in the Netherlands [33] and historic masonry used in different European cities [25], the risk of frost damage significantly decreased under the projected future climate. Whereas an increase in the number of freeze-thaw cycles (FTCs) was anticipated in the Netherlands due to higher levels of precipitation [12]. Vandemeulebroucke et al. [34] have investigated the impact of the urban heat island effect and global warming on the durability of retrofitted historical buildings for the city of Ghent, Belgium. It was revealed that the effect of the urban heat island and the warming of climate have mutually helped mitigate freeze-thaw damage risk of historical masonry in this city, in contrast to that expected in the surrounding countryside. Sehizadeh and Ge [35] analyzed the effect of the future climate of Montreal, Canada on the durability performance of conventional masonry residential wall assemblies retrofitted to meet Passive Haus requirements. They found that the frost damage risk of brick masonry would increase from 2020 to 2050; however, a decrease would be expected by 2080. The hygrothermal performance of an internally retrofitted heritage building located in Ottawa, Canada was also evaluated under both historical and projected future climates [36]. Results showed no critical levels of accumulated moisture within the wall assembly, and the projected increase in temperature in the future will significantly lower the risk of freeze-thaw damage. Moreover, the impact of adding different interior insulation thicknesses of polyurethane foam on a typical old masonry wall located in Ottawa was investigated [37]. The assessment included assumptions in regard to different frost resistance levels of the historical brick units. Results indicated that for low frost resistance brick masonry, the risk to frost damage increased with an increase in insulation level; however, the insulation thickness showed no influence on the frost damage risk for those masonry brick units having enhanced frost resistance.
To determine the moisture risks of building elements, heat, air, and moisture (HAM) simulation tools are often used. Yet, undertaking simulations and having to deal with many climate parameters over a long period incurs high computation time and cost. One way to reduce such expenses is to select a year that can accurately represent a climate over the long term and therefore, allow a correct evaluation of the moisture stress to which the building envelope is subjected over time. Such a year is known as a moisture reference year (MRY) [38]. Different methods have been introduced in the past and used to define moisture reference years (MRYs) [39,40,41,42]. Amongst the most used methods are the: Moisture Index (MI) [43]; Severity Index (Isev) [44,45]; and Climatic Index (CI) [38]. These methods were developed to rank the years in terms of their moisture severity for the purpose of selecting MRYs. The Moisture Index (MI) [43] is computed using wetting and drying functions and is used to categorize the years as dry, average, and wet based on the lowest, average, and highest MI values, respectively. The Severity Index (Isev), recommended by ASHRAE [44], is a regression equation used for computing RHT and consists of combining the climate loads and durability parameters to choose an MRY amongst the most “severe” weather years [45]. This method was deemed to be reliable in selecting MRYs appropriate for the assessment of mold growth risk. The Climatic Index (CI) [38] also involves wetting and drying elements. The wetting element is subject to the annual WDR, whereas the drying element is contingent on the annual potential evaporation. In contrast to the MI method, the CI combines several climate parameters such as the net short-wave and long-wave radiation, temperature, relative humidity, wind speed, wind direction, and orientation of the façade. A comparison between the CI and the MI methods showed that CI is useful in selecting a more representative MRY [38].
Although some studies have been conducted on the impact of climate change on the durability of the building envelope, only a few have been dedicated to retrofitted buildings located in Canadian cold climates. It was also obvious from a review of literature that the impact of the future climate is different for different climates and building envelope constructions. Although several methods exist to select an MRY, they are mostly based on the evaluation of the risk of damage arising from mold growth, and no MRY selection method has been specifically developed for assessing the risk of freeze-thaw damage. How reliable these methods are in assessing frost damage has not been investigated.
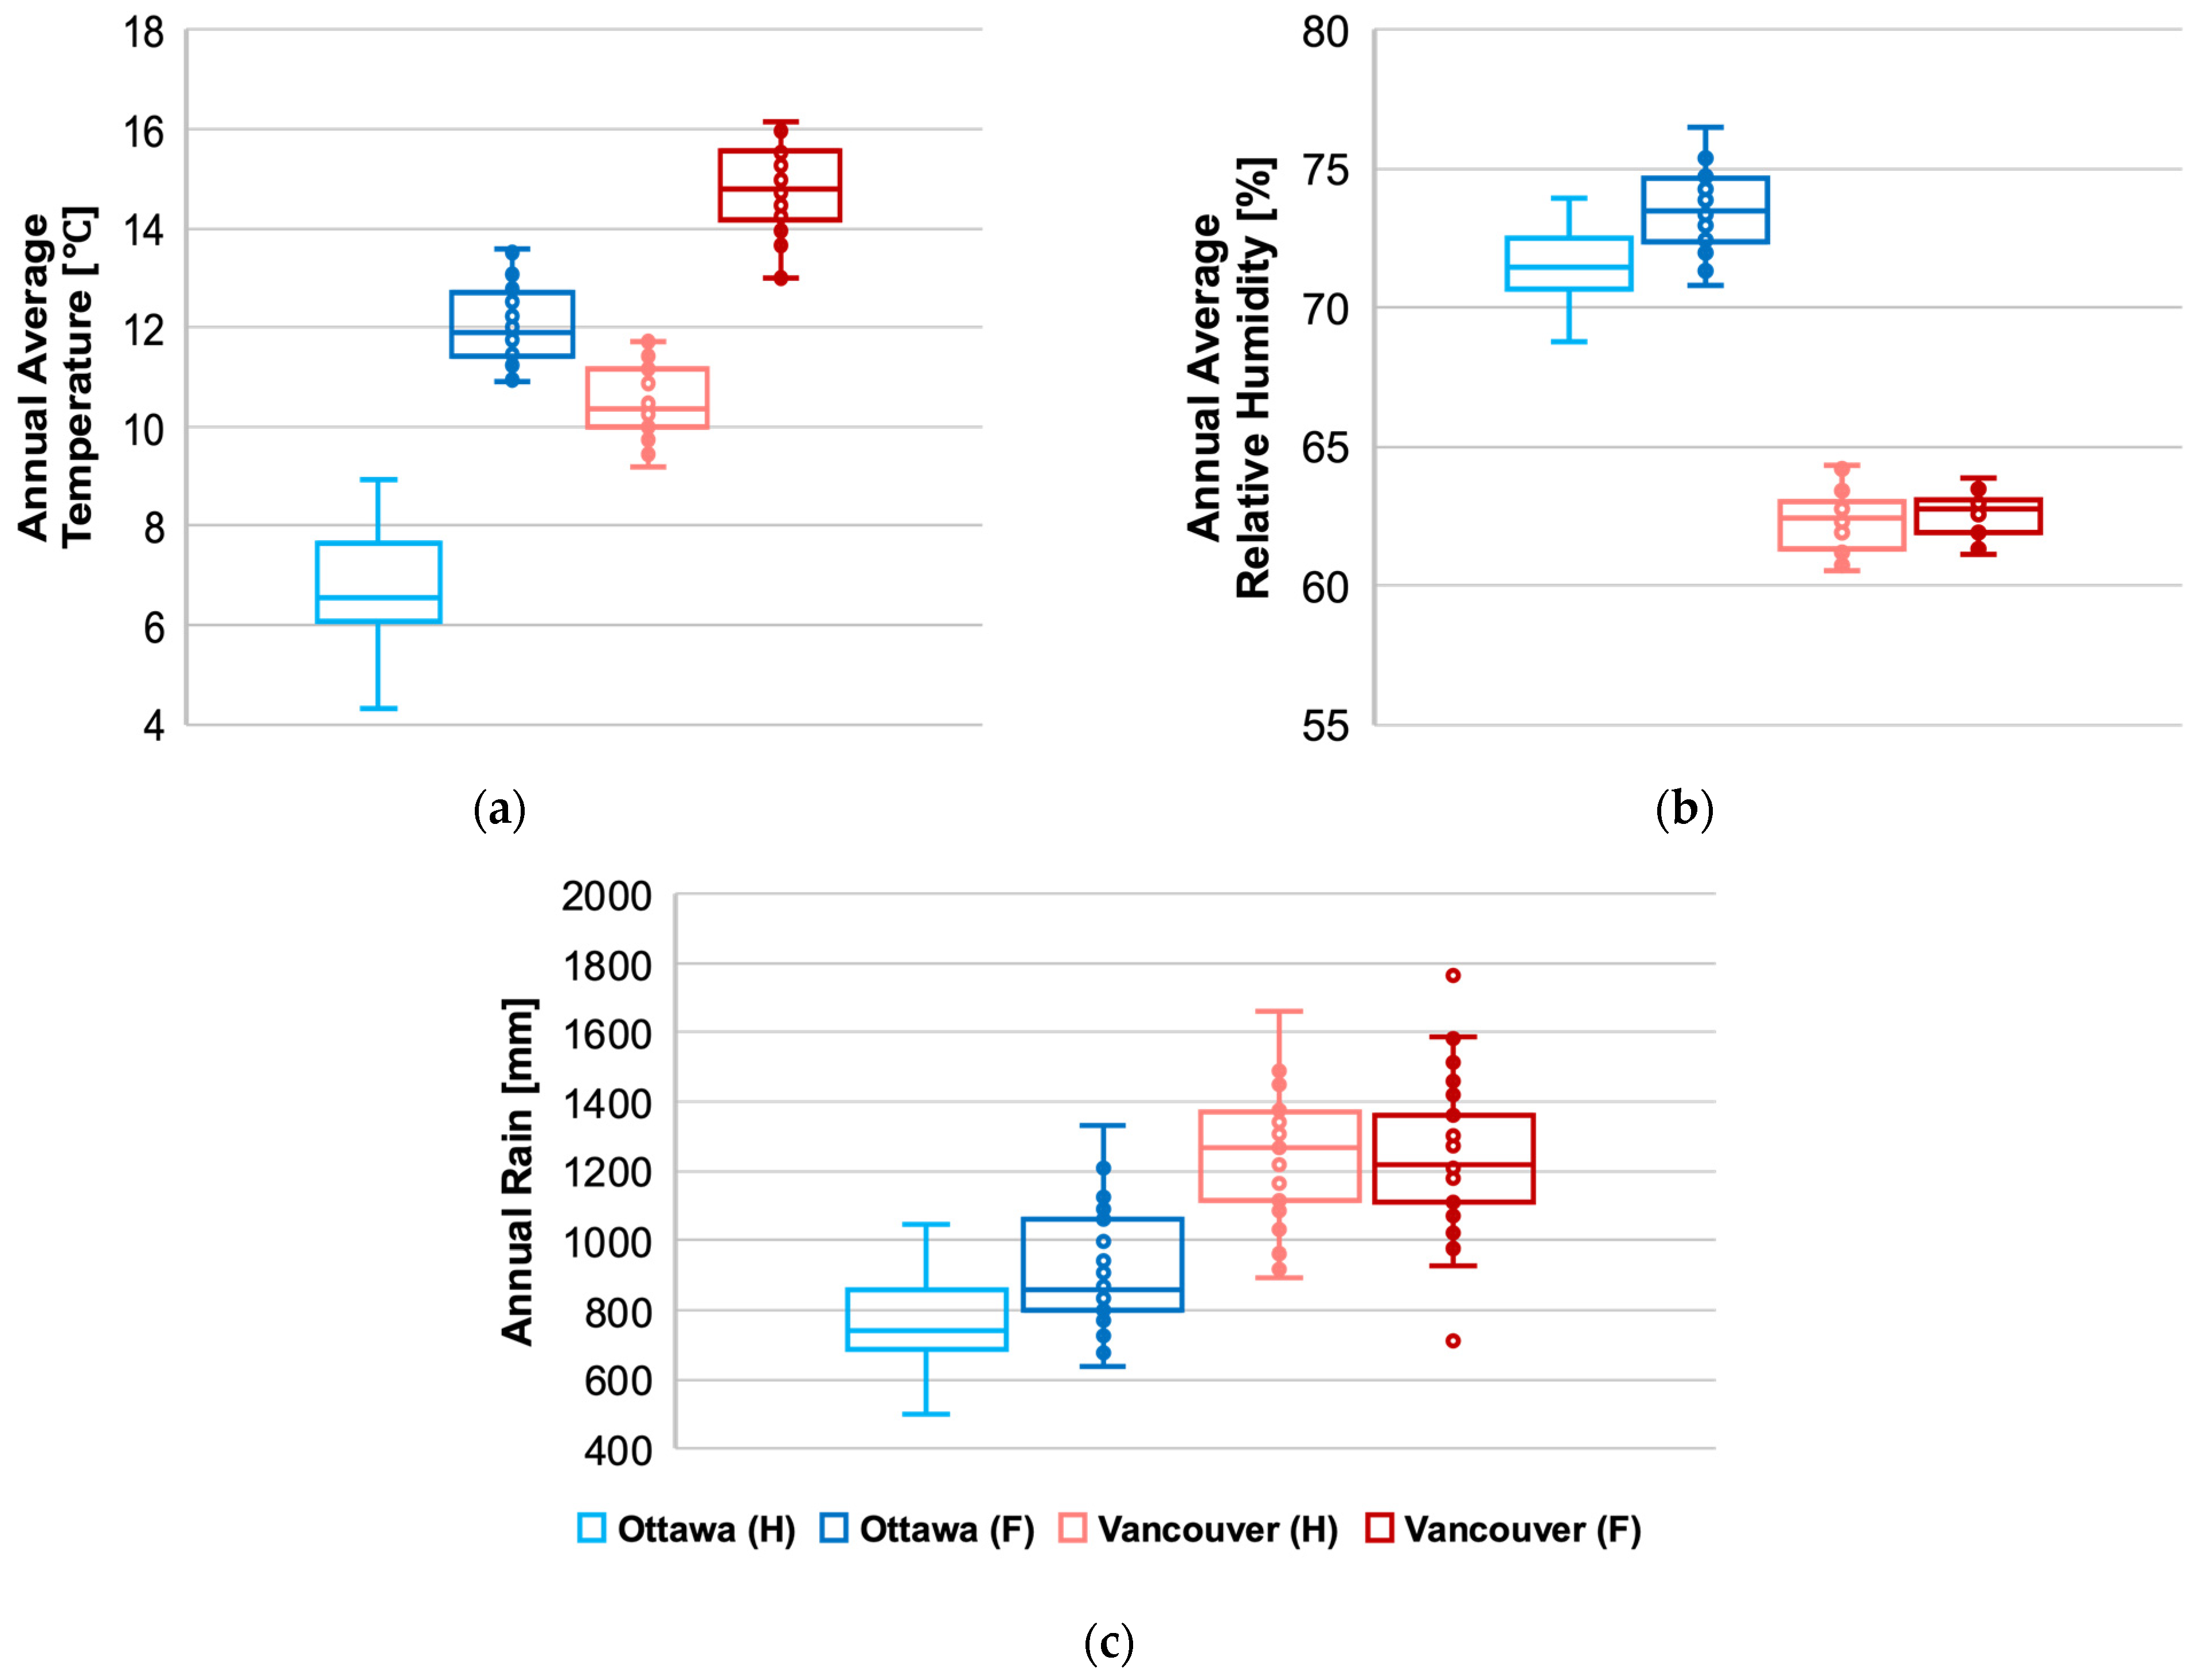
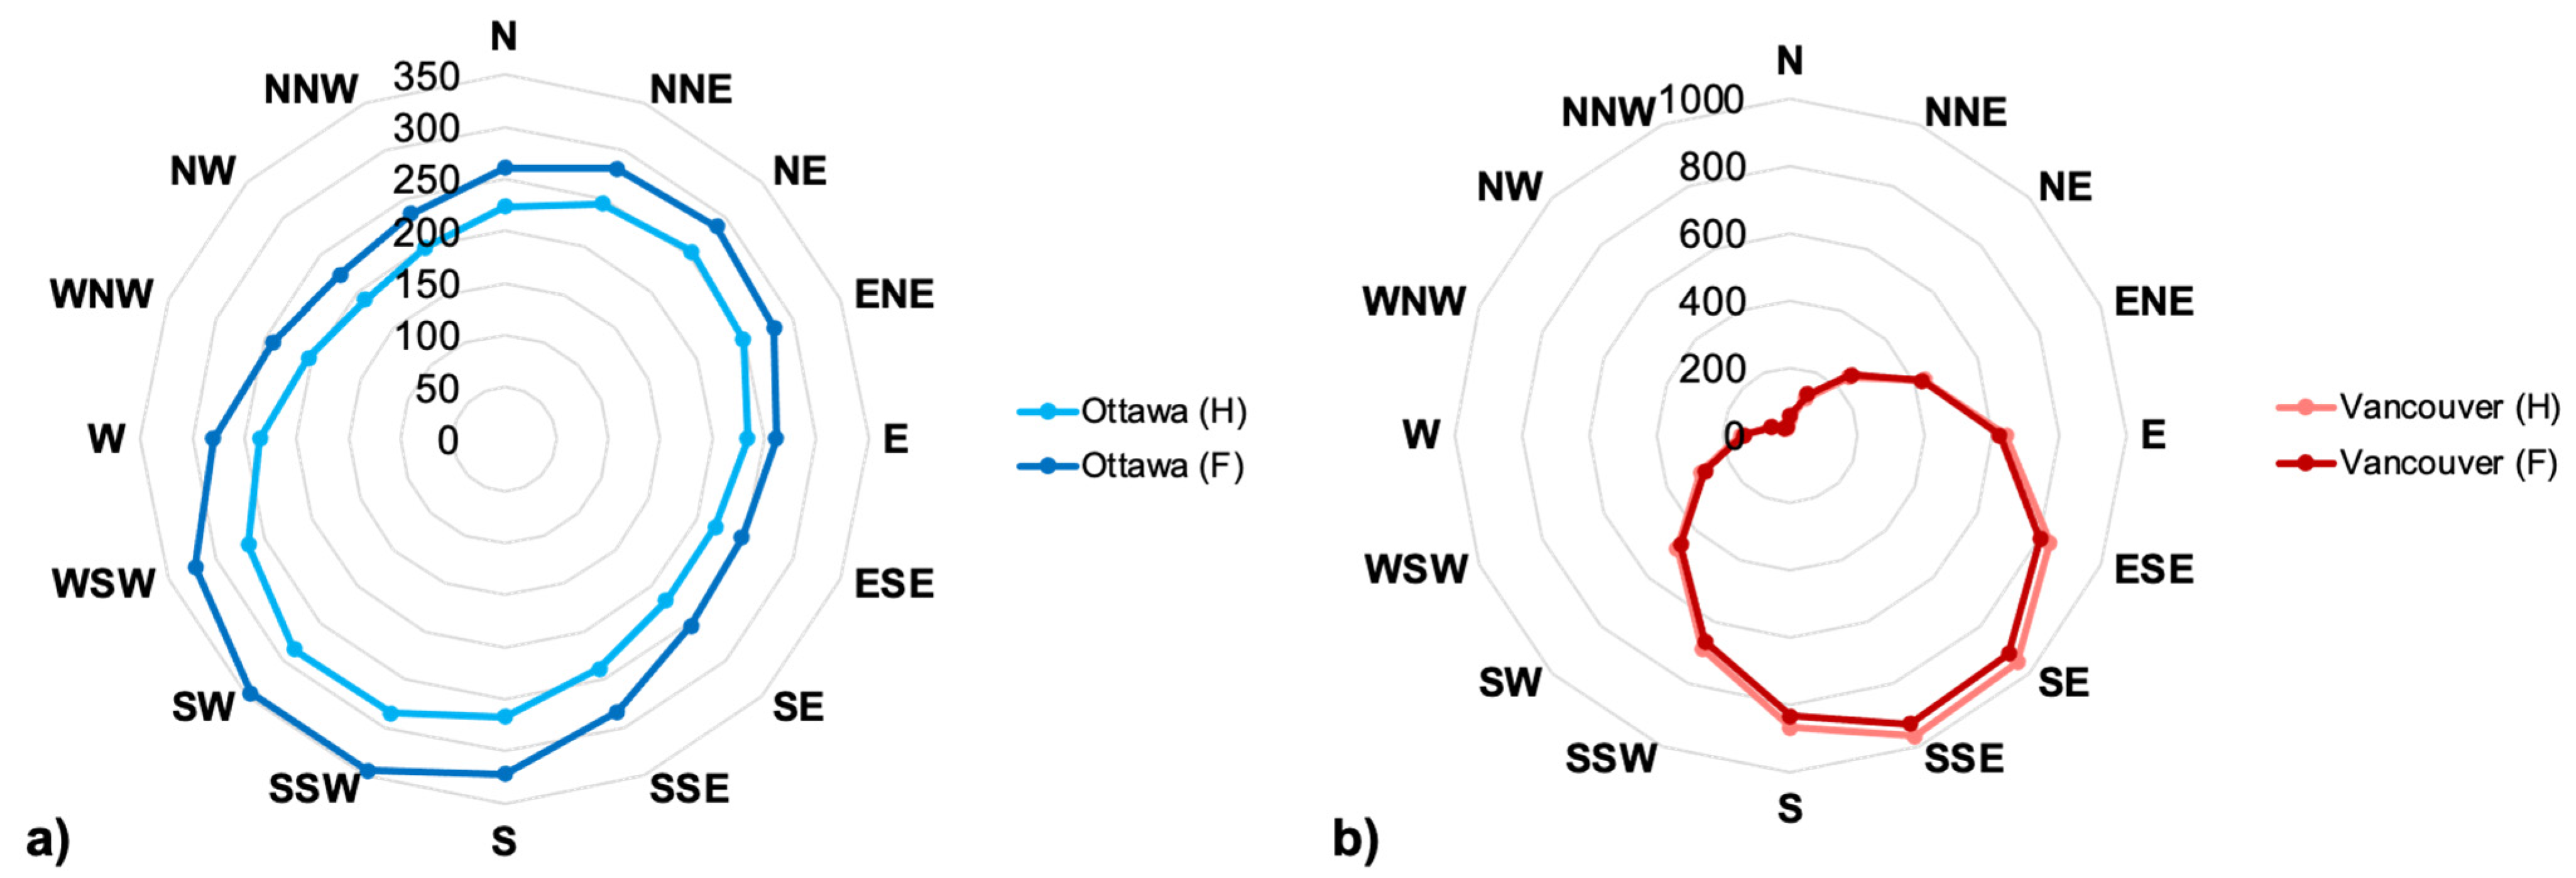
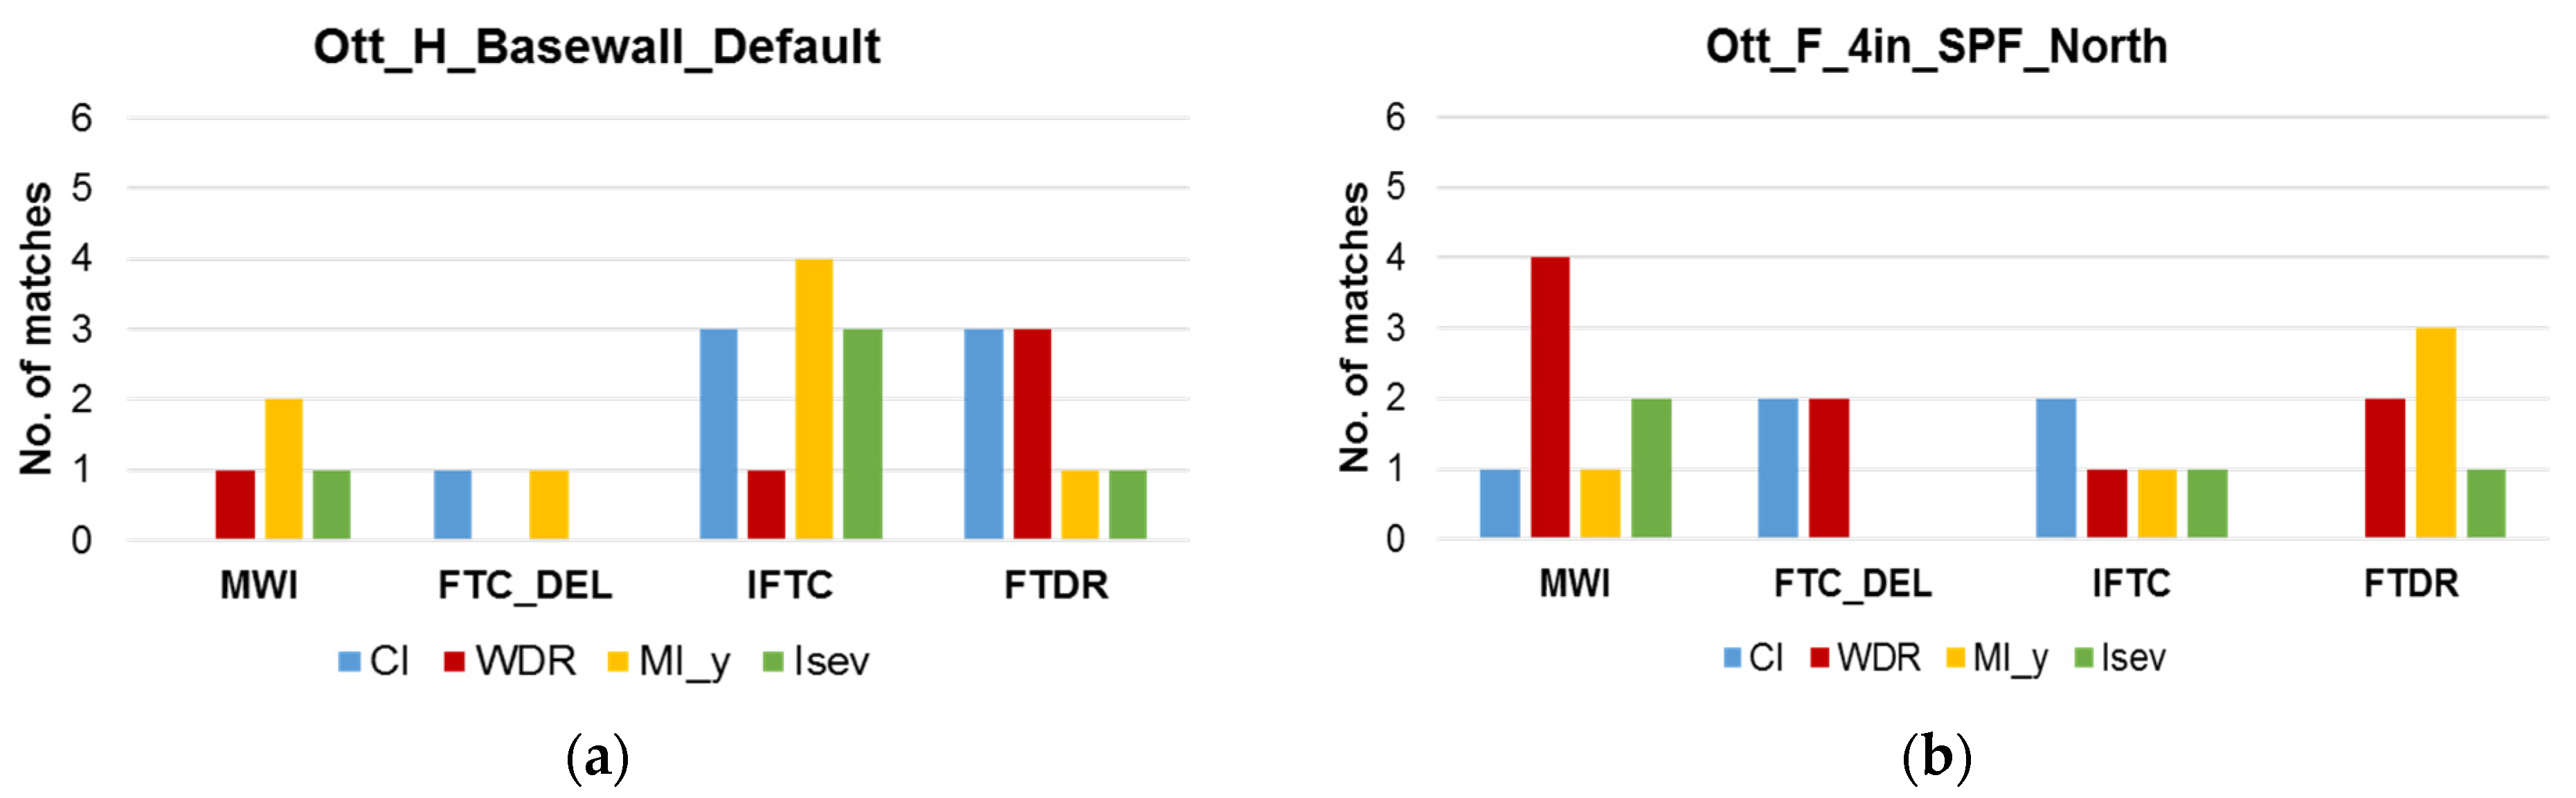
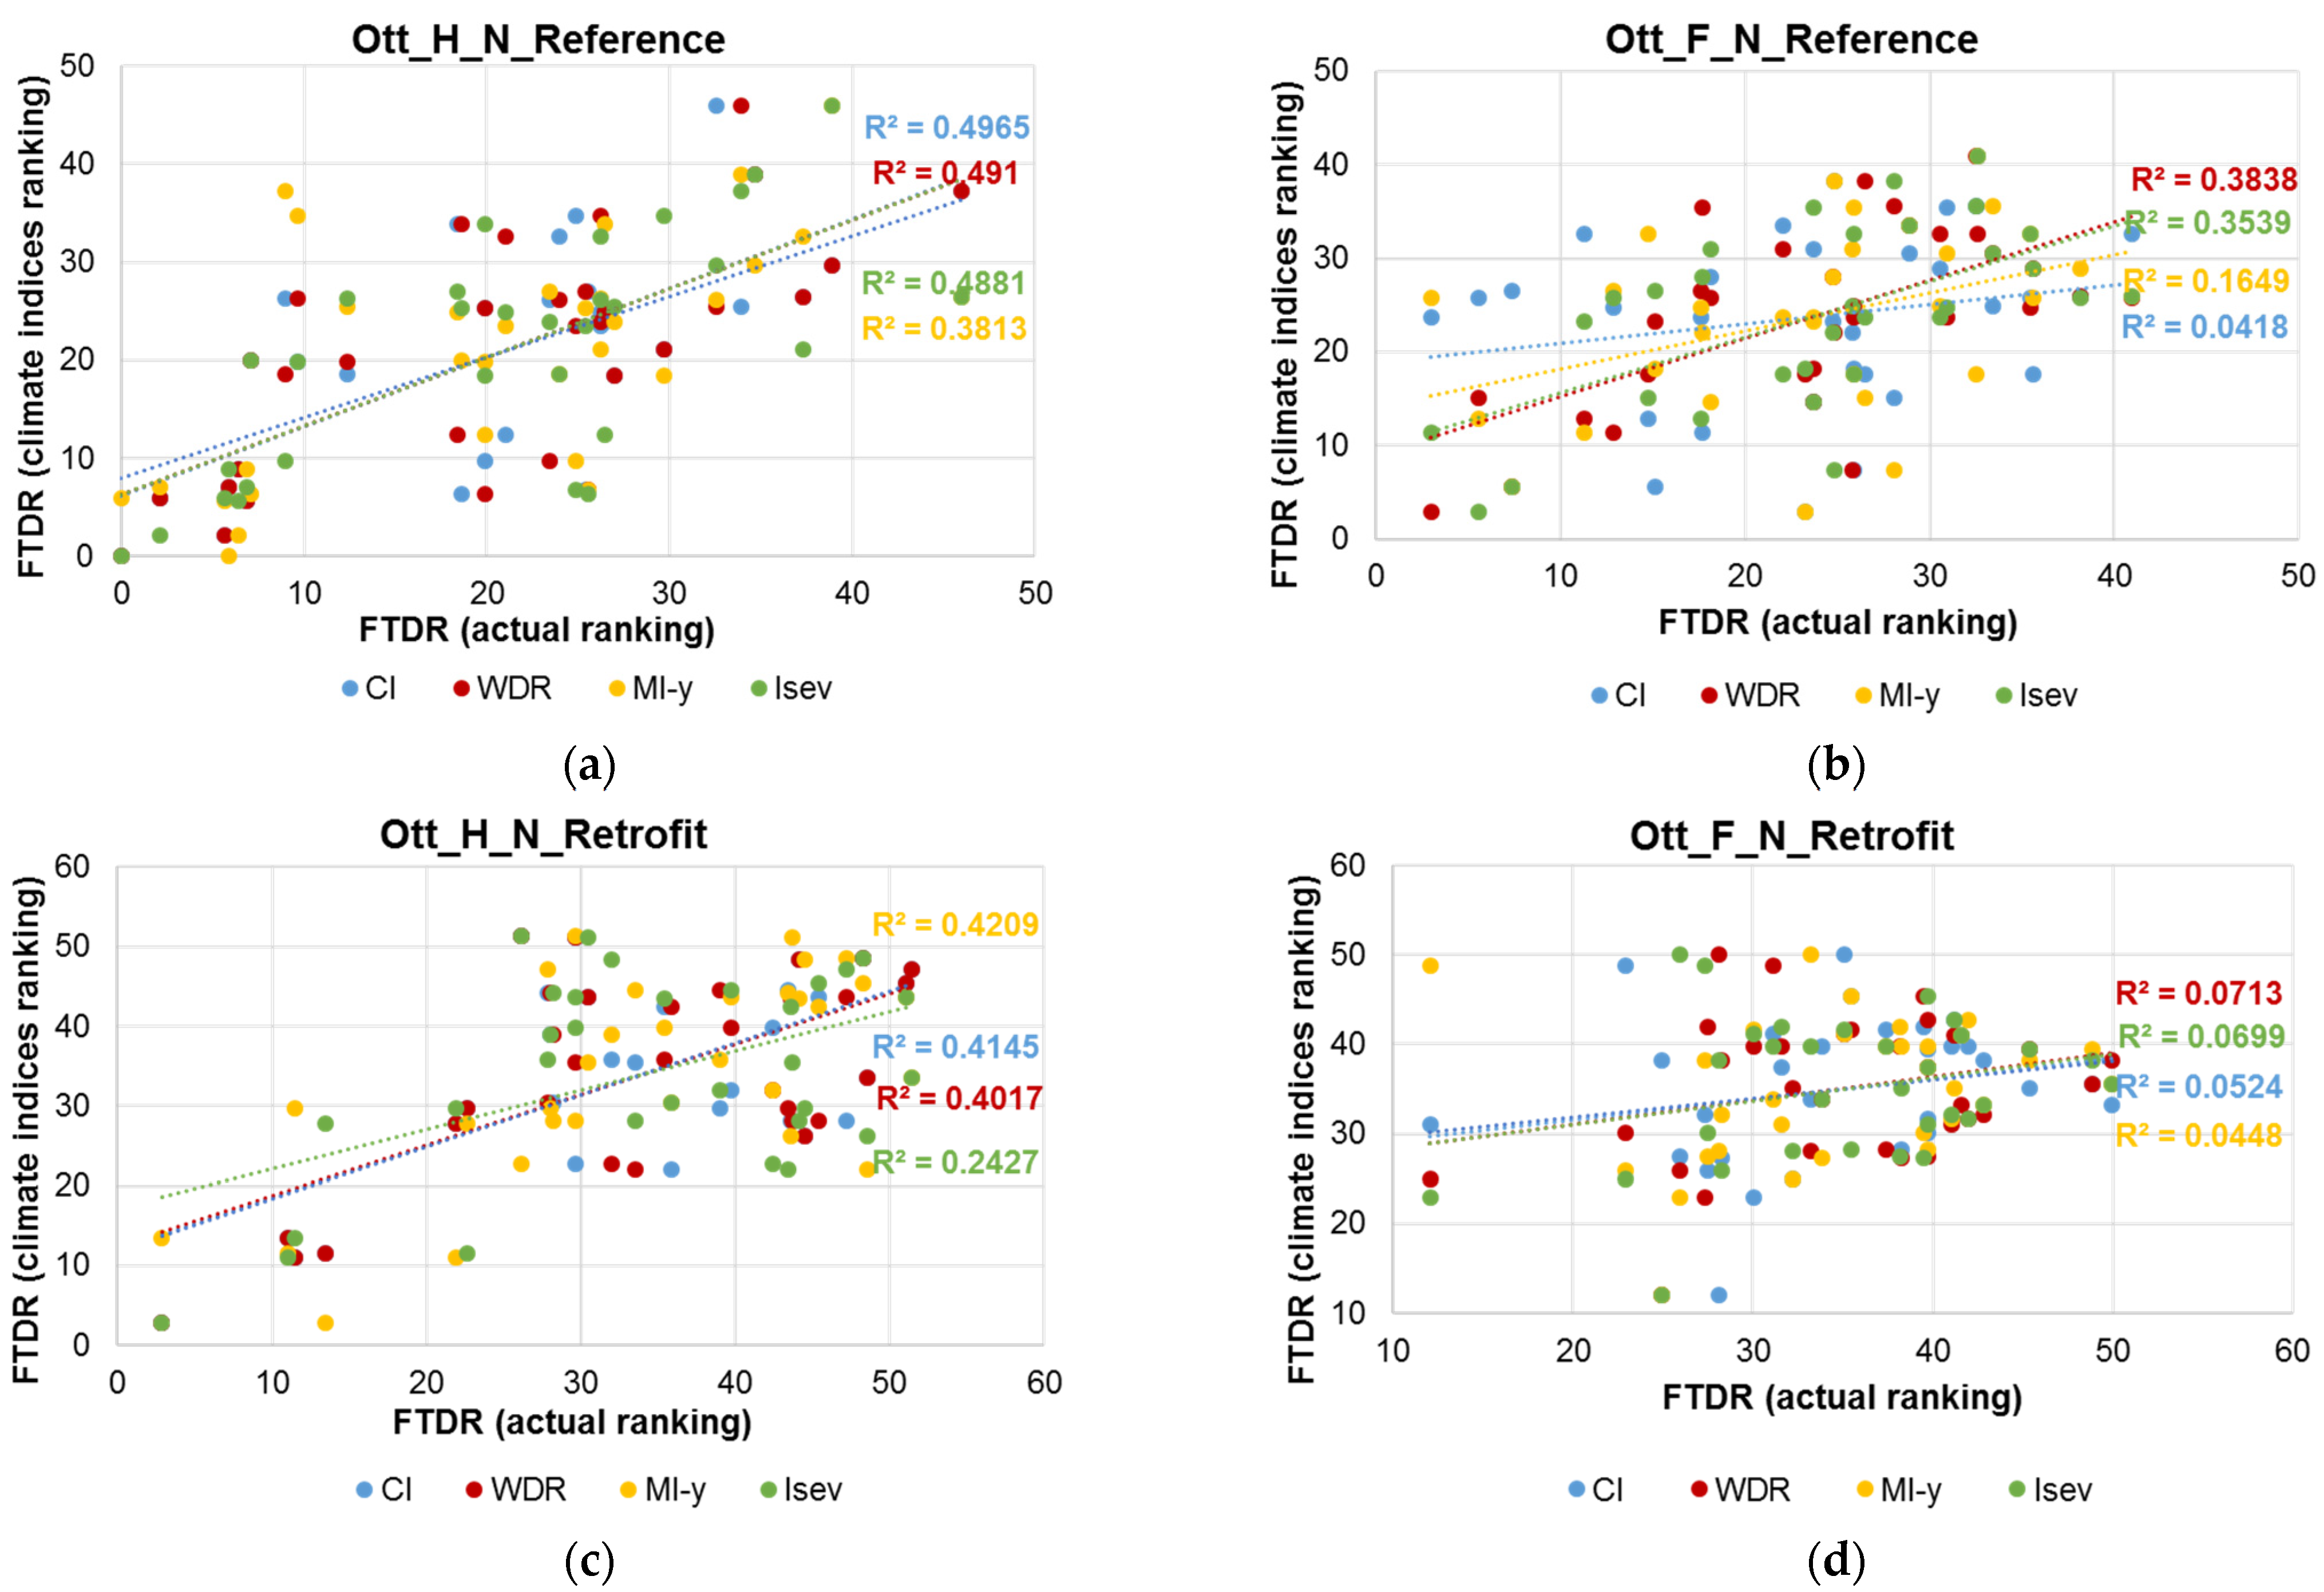
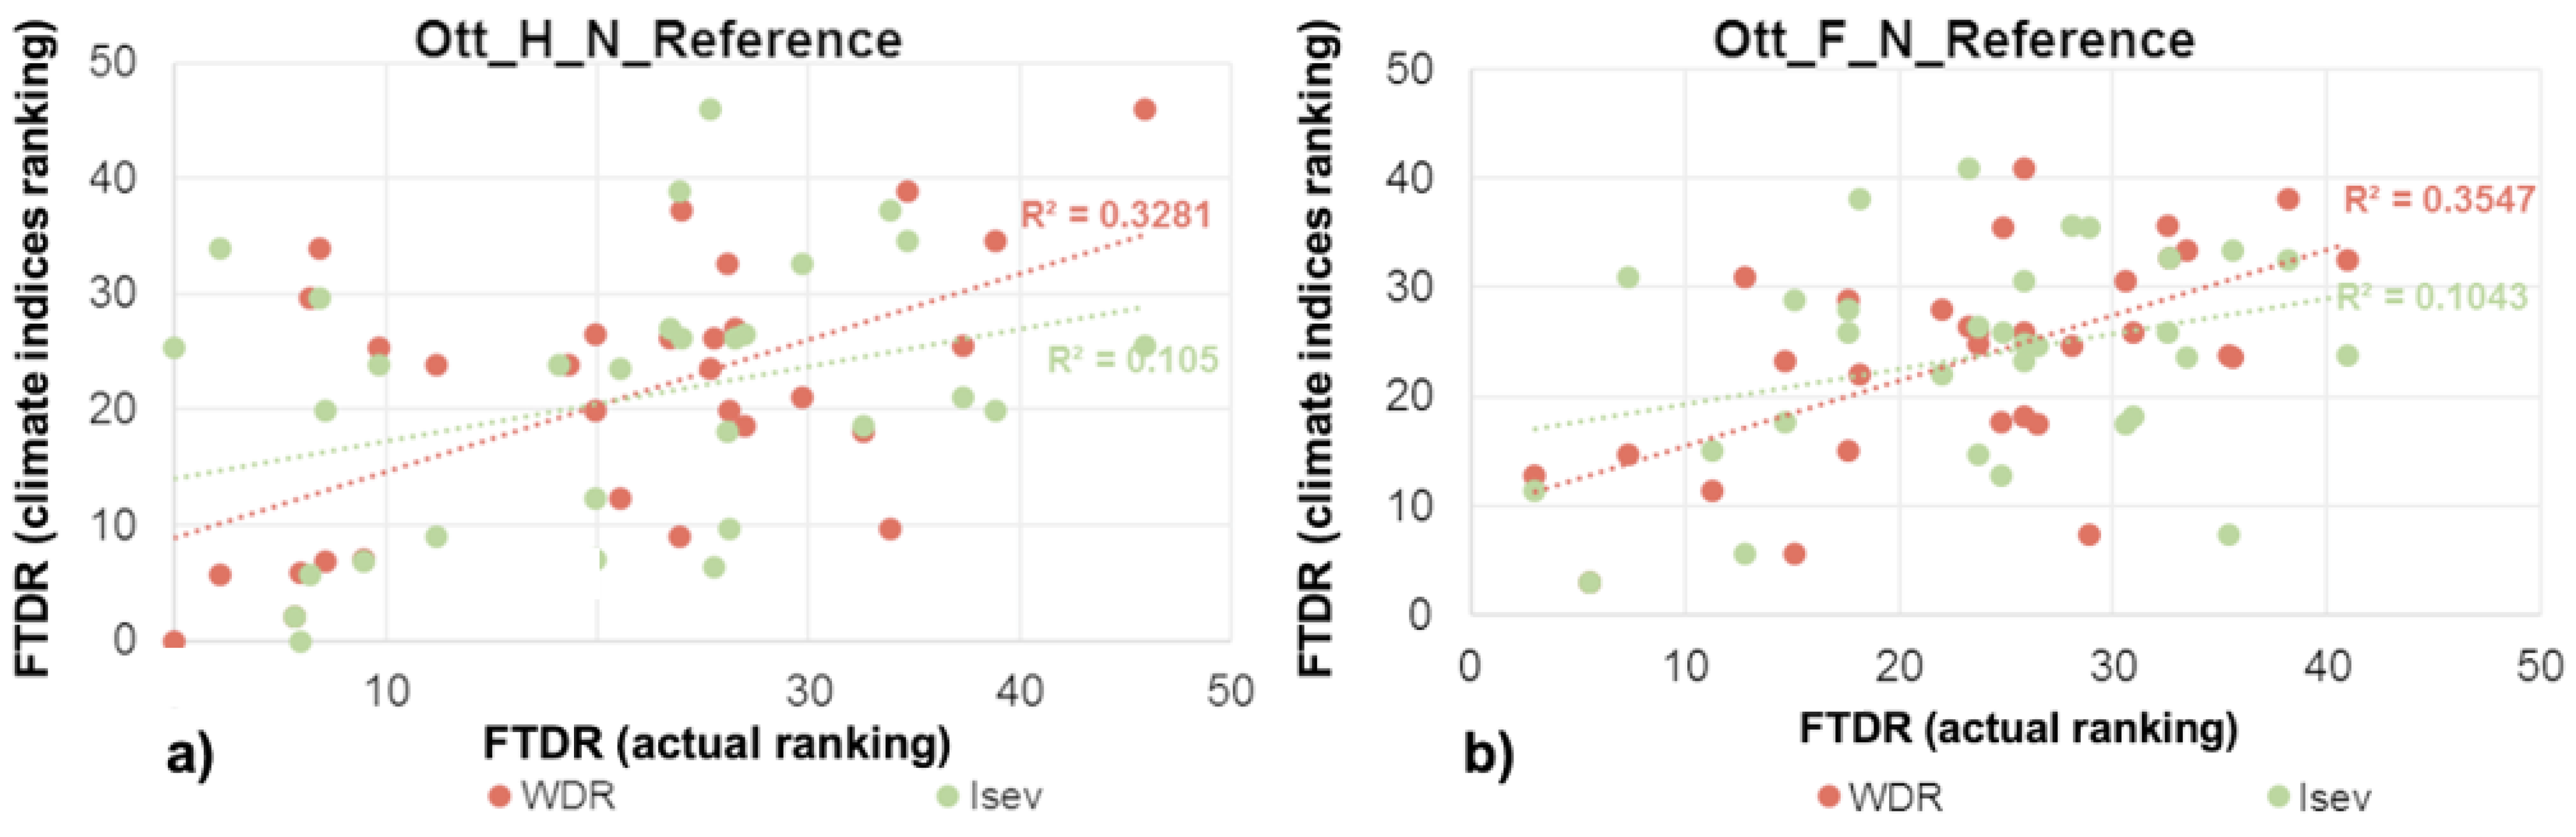
The primary objective of this paper is to evaluate the reliability of the currently used climate-based indices in selecting a moisture reference year to assess the freeze-thaw damage risk of an internally insulated solid brick wall. This would be achieved by comparing the ranking of the years determined using climatic indices with that ranking based on results of HAM simulations, regarded as the reference performance. This paper also intended to investigate the effect of climate change on the freeze-thaw damage risk of internally insulated brick masonry walls of buildings located in different Canadian cities.

2. Methods

To address the objectives of this study, the methodology employed includes the use of hygrothermal simulations of an old brick masonry wall assembly configured: (1) in its original configuration (base wall); and (2) when insulation is added to the interior wythe of its masonry (retrofitted wall). The walls are assumed to be located in two Canadian cities (i.e., Ottawa and Vancouver), and simulations are carried out under historical and projected future climates when global warming of 3.5 °C is expected to be reached at the end of the century. Moreover, two wall orientations were considered in this study: (1) the orientation with the least solar radiation—North; (2) the orientation with the highest amount of wind-driven rain. In total, 496 simulations were carried out. DELPHIN 5, v5.9.8, was used for hygrothermal simulations [46].
Four different climate-based indices, commonly used in the literature, were used for the selection of MRYs and included: the amount of Wind-Driven Rain (WDR), the Moisture Index (MI), the Climatic Index (CI), and the Severity Index (Isev). Part of these climate-based indices were introduced in [47]. Four freeze-thaw performance indicators were calculated based on output from hygrothermal simulations, i.e., response-based indices were used to evaluate the potential risk of freeze-thaw damage. These are comprised of the Modified Winter Index (MWI), Indicative Freeze-Thaw Cycles (IFTC), Freeze-Thaw Damage Risk (FTDR) and, the number of Freeze-Thaw cycles output from Delphin (FTCd). These indices were calculated for each simulated case, and MRYs were then chosen based on these four indicators. Three methods of comparison amongst MRYs were used in the analysis to evaluate the reliability of climate-based indices in selecting MRYs and were selected based on values obtained for climate-based indices and response-based indices derived from simulations. These included: matching year method, scatter plots method, and the Salonvara et al. method [45].

2.1. Climate-Based Indices

2.1.1. Wind-Driven Rain (WDR)

WDR is the quantity of rain that has a horizontal velocity component due to wind that falls obliquely on vertical surfaces such as facades, and inclined surfaces such as roofs. In this study, the semi-empirical WDR model by ASHRAE [48] was used (Equation (1)).
r b v = F E × F D × F L × U × c o s θ × R
where,
  • rbv—the rain deposition on a vertical wall, [kg/(m2·h)]
  • FE—the rain exposure factor
  • FD—the rain deposition factor
  • FL—an empirical constant of 0.2 kg·s/(m3·mm)
  • U—the hourly average wind velocity at height of 10 m above the ground measured at airport weather station [m/s]
  • θ —the angle between wind direction and normal to the wall [°]
  • R—the hourly rainfall intensity on a horizontal plane [mm].
In this paper the values of FE and FD were set as 1.0 and 0.5, respectively, which corresponds to a 3.5 story building located in a suburban area, to represent a typical historical masonry building with a medium exposure and a low-sloped roof.

2.1.2. Moisture Index (MI)

Following the previous work performed at the National Research Council (NRC) [43], the moisture index for every hour (MIh) was calculated as a function of hourly values of wetness (WIh) and dryness (DIh) indices. In this paper, WIh is based on the hourly rainfall, and DIh corresponds to p v —the difference between the saturation vapor pressure (pvs) and the vapor pressure of the ambient air. The saturation vapor pressure (pvs) was calculated according to that given in the ASHRAE Handbook of Fundamentals [49] and the magnitude of ∆pv was calculated using Equation (2):
p v = p v s p v
After the hourly values of WIh and DIh were calculated for each year out of 31 years of historical climate and another 31 years representing the projected future climate, the annual sum of WI and DI was computed. Then, both the wetting and drying indices were normalized using Equation (3):
I n o r m a l i z e d = ( I I m i n ) / ( I m a x I m i n )
where,
  • I—the index of interest
  • Imin—the minimum values of the annual sums for each year
  • Imax—the maximum values of the annual sums for each year.
Wetting and drying were assumed to be of equal importance and thus they were given equal weight in the determination of the hourly moisture index (MI) (Equation (4)).
M I = ( 1 D I n o r m ) 2 + W I n o r m 2
The MI was calculated for 31 years in each historical and future time period. The moisture index (MI) was thus obtained by a yearly averaging of the MI (1 value for each year).

2.1.3. Climatic Index (CI)

Zhou et al. [38] introduced the Climatic Index (CI) as a ratio between annual wetting and drying components (Equation (5)). The wetting component is the annual WDR, and the drying component is the annual potential evaporation, which is calculated based on the Penman equation (Equation (6)) [50].
C I = A n n u a l   W D R   l o a d   ( r b v ) A n n u a l   p o t e n t i a l   e v a p o r a t i o n   ( E )
E = Δ Δ + γ K + L A I + γ Δ + γ h m ( e a e )
where,
  • Δ Δ + γ K + L A I —the radiation term
  • γ Δ + γ h m ( e a e ) —the turbulence term
  • E—the drying index
  • K—the net short-wave radiation, (W/m2)
  • L—the net long-wave radiation, (W/m2)
  • A—the conductive heat flux to the porous material, (W/m2)
  • I—the latent heat of vaporization, (J/kg)
  • γ —the psychometric constant, (Pa/K)
  • Δ —the gradient between saturation vapor partial pressure and air temperature, (Pa/K)
  • ea—the saturated partial vapor pressure of the air, (Pa)
  • e—the vapor partial pressure in the air, (Pa)
  • hm—the convective vapor transfer coefficient, (s/m).
In the calculation of the drying index, the conductive heat flux and long-wave radiation are neglected since the values are much smaller in comparison to that of the short-wave radiation.

2.1.4. Severity Index (Isev)

The Severity Index (Isev) was developed based on hygrothermal simulations and is a regression equation to correlate climatic parameters with RHT as the performance indicator. Salonvaara et al. [45] considered that Isev is the most reliable and the most accurate amongst all available methods in selecting the most severe years. The yearly average value of each climate parameter was used in the equation and years are ranked in descending order of the RHT values. The year corresponding to the 93rd percentile (i.e., third out of the 31 years in this paper) in each time period was chosen as MRY. Based on the proposed addendum to ASHRAE Standard 160 [48], the severity index (Isev) for each year was calculated according to Equation (7):
I s e v = 108307 241 × E v 1391 × I c l 312326 × ϕ + 183308 × r w d         + 15.2 × p v + 27.3 × T 2 + 261079 × ϕ 2 0.00972 × p v 2
where,
  • Ev—the solar radiation incident on the wall, (W/m2)
  • Icl—the cloud index, (0–8)
  • ϕ—the relative humidity, (0 < RH < 1)
  • rwd—the wind-driven rain on the wall, (kg/m2·h)
  • pv—the vapor pressure, (Pa)
  • T is the ambient temperature, (°C)
As specified by the method, Isev was calculated for the orientation receiving the least solar radiation (North). All the weather parameters were calculated in terms of annual average values for each year using the number of hours during that year.
Note that Equation (7) was developed based on the simulation results at the OSB-layer within wood-framed walls of stucco cladding facing North and located in a number of cities in the United States. This equation was then verified and found suitable for a number of cities in Canadian and European countries and for other types of walls [45].

2.2. Response-Based Indices

The FT performance indicators used in this study are the Modified Winter Index (MWI), the number of Indicative Freeze-Thaw Cycles (IFTC), the Freeze-Thaw Damage Risk index (FTDR), as well as the number of freeze-thaw cycles outputted from Delphin (FTCd).

2.2.1. The Modified Winter Index (MWI)

The Modified Winter Index (MWI) [29] utilizes hourly values of MC instead of RH and calculates the level of severity for that instance where the MC is higher than the critical level (Equation (8)).
M W I = i = 1 8760 ( T L T i ) ( w i w L )                   f o r   [ T i < T L     w i > w L ]
where,
  • TL—the critical value of temperature, (K)
  • wL—the critical value of moisture content, (% m3/m3)
  • Ti—the hourly values of temperature at the investigation point, (K)
  • wi—the hourly values of moisture content at the investigation point (% m3/m3)
In this paper, a value of (Scrit) equal to 0.25 was considered to account for the least frost-resistant type of brick. Therefore, the wL was calculated as being 25% of the effective saturation of the brick material (wL = 0.071 m3/m3). Moreover, freezing is assumed to occur at 0 °C within the material to allow comparison between different FT performance indicators.

2.2.2. Indicative Freeze-Thaw Cycles (IFTC) Number

The number of indicative freeze-thaw cycles (IFTC) is another performance indicator developed by Koci et al. [29], where, in addition to meeting the previous conditions of temperature and moisture content, a freeze-thaw cycle is counted when the freezing lasts at least 2 h and is followed by at least 2 h of thawing. The same parameters set in the previous index (MWI) were also used here.

2.2.3. Freeze-Thaw Damage Risk (FTDR) Index

The freeze-thaw damage risk index (FTDR) [3] is described as “the accumulation of the difference between the maximum and the minimum saturation degree of ice content in each complete or incomplete freeze-thaw cycle”, and it can be calculated using Equation (9).
F T D R   i n d e x = c y c l e ( S i c e , m a x S i c e ,   m i n ) ;           f o r   ( S i c e , m a x S i c e ,   m i n ) > 0.05
where,
  • Sice—the saturation degree of ice content (which is the ratio between the ice mass density and the total moisture content).
One complete FTC is the process of ice formation in the porous material and then its total melting. Whereas an incomplete FTC occurs when the freezing activity re-starts prior to the termination of the thawing process. This means that an incomplete FTC is counted after the ice is formed, and the ice content starts decreasing—but before it reaches zero—the ice content increases again. Zhou et al. [31] concluded that incomplete FTC would potentially increase the risk of freeze-thaw damage. The FTDR index is calculated for each complete FTC and incomplete FTC. A value of 0.05 is introduced as a threshold neglecting the effect of FTCs having a small variation in ice content. The greater the value of the FTDR Index, the greater is the risk of freeze-thaw damage.

2.2.4. Number of Critical Freeze-Thaw Cycles—DELPHIN Output (FTCd)

Similar to the IFTC, DELPHIN has an integrated model that counts the number of critical FT cycles. DELPHIN takes ice formation into account by assuming the instantaneous equilibrium between the three phases (vapor, liquid, and ice), and by applying a freezing point depression whilst assuming that the pore space fills from the smallest to the largest pore and that ice crystalizes outside of the liquid phase [51,52]. The use of this model permits investigating whether the moisture content is sufficiently high to fill pores where water could freeze. In this paper, one FT cycle was counted when the rate of ice formation (by volume) is lower than the minimum value of 0.255.

2.3. Setting in HAM Simulations

Simulations were performed for the base and retrofitted wall under historical and future climatic conditions, using the hygrothermal simulation program Delphin 5, v5.9.4. No air or moisture leakage sources were assumed. Two wall assemblies were evaluated in this study: a solid masonry wall assembly and an internal retrofit of the same solid masonry wall assembly. The first configuration consists of 300 mm historical brick and 15 mm of gypsum plaster, and the second wall configuration is of an internally retrofitted strategy of the same wall, with an insulation thickness of 100 mm (4 inches) of polyurethane foam [53]. The simulations were performed for a one-dimensional cross-section of the base wall and the retrofit wall. The material properties of historical brick were taken from the database in Delphin as listed in Table 1. Figure 1 displays the geometry and meshing of the two walls. A fine variable discretization, with a minimum element width of 0.5 mm and a stretch factor of 125 was used to set up the meshing of the materials. The point of investigation was placed at a depth of 5 mm from the exterior brick surface.
Two locations of two different climatic regions in Canada were selected for this study: Ottawa (Ontario) and Vancouver (British Columbia). Their geographical locations, weather data (Figure 2) and respective climate zone according to the National Energy Code of Canada for Buildings [54] are listed in Table 2. The wall orientation facing North and the one receiving the highest amount of annual wind-driven rain calculated according to ASHRAE [48] were both selected for simulations. To determine this critical orientation, an analysis of the prevailing wind direction (during all hours and rain hours only) and the driven-rain index was performed for historical and future data periods. Using the airfield WDR index (IA) (Equation (10)) [55], the wall orientation with the most severe WDR intensity was 202.5° and 157.5° from the North for Ottawa and Vancouver, respectively (Table 2 and Figure 3).
I A = 2 9     v × r 8 9 × cos ( D θ )
where,
  • v—the hourly mean wind speed, (m/s)
  • r—the hourly rainfall, (mm)
  • D—the hourly mean wind direction from North, (°)
  • θ —the wall orientation relative to the north.
The summation is calculated for all hours during which c o s   ( D θ ) is positive.
Climate data for both Ottawa and Vancouver were provided by the National Research Council of Canada (NRC). A continuous time-series (The full dataset can be accessed from: 10.17605/OSF.IO/UPFXJ.) of hourly climate data was prepared for a baseline time period spanning from 1986–2016 and a 31-year future time period when global warming of 3.5 °C is expected to be reached at the end of the century [56]. Under the RCP8.5 scenario, a future rise in temperature of 3.5 °C will be reached between 2062 and 2092 [57]. Each dataset includes 15 realizations generated based on variations in initial conditions; however, only the median realization based on the moisture index (MI) was used in this study. Simulations were executed over a period of five years for every 31 years in each time period, i.e., each selected year was repeated five times. After completing the five-year cycle, the hygrothermal response of the walls stabilized, and the results of the 5th year were used for analysis.
The indoor temperature and relative humidity conditions were set to 21 °C and 50%, respectively. The indoor vapor diffusion and the heat conduction coefficient were set as 1.52 × 10⁻⁸ s/m and 8 W/m2K [58], respectively.
Outdoor boundary conditions included heat conduction, vapor diffusion, wind-driven rain, short-wave, and long-wave radiations. To compute the transfer coefficient, the boundary layer method was selected in Delphin. The required long-wave emission coefficient of the building surface was set to 0.9. The outdoor convective heat exchange coefficient (hce) [58] and convective vapor diffusion coefficient (βv) were calculated using Equations (11) and (12). (βv) is computed using the convective heat exchange coefficient (hce) and the Lewis relation.
h c e = 4 + 4 × v
β v = 2.44 × 10 8 + 2.44 × 10 8 × v
where,
  • v—the wind speed, (m/s)
The reflection coefficient of the surrounding ground (albedo) was set to 0.2 and the short-wave absorptance coefficient of the brick cladding surface was 0.6. WDR is calculated according to the ASHRAE method [48] using Equation (1).
The initial conditions for relative humidity and temperature were set, respectively, to 50% and 21 °C for all components.

3. Results and Discussion

3.1. Comparison between Climate-Based Indices and Response-Based Indices

A moisture reference year can be selected amongst the most severe years ranked according to climate-based indices. However, for an MRY to be representative and reliable, it should deliver consistent performance evaluations as that obtained from the actual hygrothermal performance. Using scatter plots, the capability of the climate-based indices in predicting the response of an internally retrofitted solid masonry wall was first evaluated. The values of climate-based indices were calculated for different cities, orientations, and climates and were compared to response-based indices. Besides, the coefficient of determination R2 was computed for comparison.
In general, results in Table 3 show that the correlation between the climate-based indices and the response-based indices is very weak (R2 is found less than 5% for most of the cases). This indicates that climate-based indices alone do not represent the actual performance of the walls, and therefore mis-assess the potential risk to freeze-thaw. However, for walls-oriented North under a historical climate in Ottawa, the climate-based indices are found to have a better correlation with the FTDR index. For a solid masonry wall in its original condition, R2 varied between 46% and 58% and was highest for Isev. As for the retrofitted wall, the correlation between the indices was less: R2 varied between 28% and 45% and was highest for MI.
Since in the majority of the cases the climate-based indices have failed to represent the actual performance of the walls, although the correlation between the climate-based indices and FTDR was found relatively good in a few cases compared to other indices, further investigation was carried out based on the indices’ ability in properly ranking years according to their severity. The climate-based indices calculated for 31 years in each time period were first ranked from highest to lowest. To verify whether the ranking of these years was indeed representative of the actual severity of the risk of frost damage, these years were also ranked using response-based indices. Three methods were used to evaluate whether the climate-based indices and the response-based indices lead to a similar ranking: i.e., the number of matching year method, scatter plots (where the R2 of the average per index is computed), and the Salonvaara et al. method [45]. This would indicate the reliability of a climate-based method in ranking and selecting MRYs for freeze-thaw risk assessment. In addition, for the selected MRY to be representative, it should be applicable to a series of different situations—and not only for a few particular cases. Thus, the years’ ranking during historical and future periods was studied for different indices and orientations.

3.1.1. Number of Matching Years

This method of comparison was first applied in an attempt to count the number of matchings between the years ranked using the response-based indices (response-based being regarded as providing the correct value of actual performance) and those ranked according to climate-based indices. The higher the number of matching years between climate-based and response-based indices, the more reliable the climate-based indices are in representing the actual order (ranking) of the years; and therefore, the higher possibility for a more accurate selection of an MRY, depending on the selection criteria of MRY.
At first, this method was applied to the entire duration of the time period (i.e., 31 years) for both historical and future climates. The same method was then used only for the three most severe years, i.e., the first three years with the highest index ranked according to the values obtained for the climate-based and response-based indices. Results for Vancouver were provided only for a wall facing the direction of highest wind-driven rain because a north-facing wall showed almost no risk to freeze-thaw damage (because the North orientation receives almost no WDR, refer to Figure 3), and therefore, values of indicators were zero, or close to zero, for most of the cases.
In general, the number of matching years between the climate-based indices and the response-based indices was found to be relatively small for all compared scenarios under both historical and future climates. For instance, the matching number was found, for the most part, between zero and two (2) and reached a maximum of four (4) years for a few scenarios in Ottawa—a base wall facing prevailing WDR direction under historical climate (Figure 4a) and future climate, and a retrofit wall facing North under future (Figure 4b) and historical climate. In these cases, it is not possible to draw a general conclusion on which climate-based index provides a better ranking with the response-based indices as each scenario leads to different results. For instance, the best match (4 out of 31 years) was ranked according to the moisture index (MI) and the IFTC—for a base wall facing prevailing WDR direction under historical climate (Figure 4a). However, the same number of matching years was achieved by the ranking of WDR and MWI indices—for a retrofit wall facing North under future climate (Figure 4b) and the ranking of the severity index (Isev) and FTDR for a retrofit wall facing North under historical climate.
A similar comparison was completed for the ranking of different indices for the three most severe years only (the first three years ranked based on each index). Results showed that in most of the cases the number of matching years was found to be zero or one (1) out of three.
For Vancouver, the number of matching years was also very low; with a maximum of four years (4) out of 31 when comparing within the entire time period, and only one (1) matching year when comparing the ranking of the three most severe years.
This method of the comparison showed that the ranking of years based on climate-based indices does not represent the same ranking as that based on the walls’ performance; meaning that the years selected based on climate-based indices alone do not represent the actual frost damage risk to masonry wall assemblies. The ranking using neither different climate-based indices nor response-based indices is consistent amongst different scenarios, i.e., orientation, location, and time periods. Therefore, relying on counting the number of matching years between the different indices alone is not likely sufficient to provide a consistent evaluation of the correlation between the climate-based indices and freeze-thaw performance indicators.

3.1.2. Scatter Plots

The method using scatter plots is intended to permit comparison of the correlation between the actual performance indicator, which is the response-based indices of ranked years, and the corresponding response-based indices of the ranked years based on the climate-based indices ranking. This method allows evaluating the ranking performance of climate-based indices, which provides an indication of how reliable climate-based indices represent the risk to FT damage, i.e., the risk as determined by response-based indices of the wall assemblies. As such, the response-based indices values are given in ascending order on the x-axis of the plot, and on the y-axis, are the values of the response-based index corresponding to the year ranked in ascending order according to the climate-based indices. The coefficient of determination R2 is also computed for comparison.
Figure 5 and Table 4 show the correlation between the actual performance of the walls, using an FTDR index, and the corresponding FTDR values based on the ranking of climate-based indices for a masonry building located in Ottawa. If climate-based indices rank the years accurately, all dots should fall on a straight line and R2 should be 1. Results showed that the ranking performance of climate-based indices is generally poor and varies with the wall types, orientation, and climate scenarios and that the FTDR index is a better indicator of risk to FT damage compared to other response-based indices. For walls facing the prevailing WDR orientation in Ottawa, the highest R2 of 0.39 was achieved using WDR for the reference wall under historical climate. In general, WDR and CI indices provided better ranking performance as compared to the other indices, which have R2 close to zero for all cases. The ranking performance of climate-based indices was found better for the reference wall than the retrofit wall, in which all climate-based indices have R2 close to zero. For a north-facing wall in Ottawa (Figure 5), the ranking performance of climate-based indices is slightly better than walls facing the prevailing WDR orientation, however, the results are not consistent. The correlation between the actual performance using the FTDR index and its corresponding index based on climate-based indices’ ranking varied between different scenarios: under a historical climate, the FTDR index had a better correlation with the CI, WDR, and Isev indices, having the highest R2 value of 0.49 for CI. However, under a future climate, an improved correlation for WDR (R2 of 0.38) and Isev (R2 of 0.35) indices was found. Similar to walls facing the prevailing WDR direction, under future climate for the retrofitted walls, all climate-based indices fail to rank the years reliably, with R2 less than 0.1. As shown in Table 4, the ranking performance of climate-based indices is very poor when other response-based indices are used, with R2 < 10%.
The analysis for Vancouver showed the ranking performance of climate-based indices is very poor for all cases with R2 < 0.01 and therefore, the results were not provided in this paper.

Seasonal Analysis

Since it is more likely for frost damage to occur during the winter season, the same scatter plot method has been applied to the months experiencing freeze-thaw cycles (November to April) to investigate whether this will result in a better correlation. The climate-based indices (Isev and WDR) and the response-based indices were calculated only for this period, and results are plotted in Figure 6. Comparing the coefficient of determination (R2) shown in Figure 5a,b and Figure 6a,b, it was noticed that the seasonal calculation did not improve the correlation between the indices. For instance, when WDR was used to rank the years, R2 dropped from 49% to 32%, and from 38% to 35%, for a reference wall under historical and future climate, respectively. Besides, the decrease in the correlation between FTDR and Isev was even more significant; with R2 decreasing from 49% to 10% under a historical climate, and from 35% to 10% under a future climate.

3.1.3. Method of Salonvaara et al.

Salonvaara et al. [45] developed a method to numerically evaluate the conformity of different MRY selection methods. To apply this method, the weather years are first ranked in decreasing order of risk based on the performance indicator obtained from simulations. The performance indicator is then normalized to attain a range in values between 0% and 100%. Thereafter, the top three years are selected using each MRY selection method to determine the corresponding normalized performance indicator for each year for which the average over the three years for each MRY selection method is subsequently calculated. Finally, a comparison can be completed to establish which method for the selection of MRY permits determining the three years with the highest value for the performance indicator.
The above-mentioned approach was slightly modified by dividing the average normalized performance indicator value of the top three years, ranked using climate-based indices, by the average value of normalized performance indicator over the top three years ranked using simulation results (actual value); this value yields to a ratio. The higher the value of the ratio, the better the ranking performance (i.e., more accurate) of the climate-based index as compared to the actual ranking. As shown in Table 5, all climate-based indices have better ranking performance when the FTDR index is used as the performance indicator—with the ratio varying in the range of 41 to 92%. These values indicate a better correlation between FTDR and climate-based indices in selecting an MRY among the most severe years. The ratio for MWI, FTCd, and IFTC, respectively vary between 2–65%, 23–83%, and 14–76%. Although the average normalized MWI values based on climate-based indices ranking were on average low for all cases (i.e., <0.65), a better ranking performance was found for MI when MWI is used as the performance indicator for the historical period, and CI for the projected future period. Results for the FTCd and IFTC indicators were found relatively similar, having a better correlation with MI for North oriented walls under historical climate and CI and WDR for walls facing the prevailing WDR direction. However, when the FTDR index is used as the performance indicator, the correlation with the climate-based indices was inconsistent for different scenarios. For instance, the ratio of the normalized values was highest for MI and Isev for the North-oriented base wall, and the North-oriented retrofit wall under future climate. These values were highest for CI and WDR for walls under future climate and a base wall facing prevailing WDR direction under historical climatic loads.
For Vancouver, the average normalized values ranged between 0% and 66% among all indices, and it was obvious that the Moisture Index (MI) has the best correlation with the response-based indices (Table 6). Moreover, the ratio for Isev is found much higher for Ottawa than obtained for Vancouver. This could be explained that Isev was developed based on structures facing North; however, it was only possible to obtain results for a wall facing the prevailing wind-driven rain direction in Vancouver, since a north-facing wall showed almost no risk to freeze-thaw damage.
In summary, all three methods indicate that the ranking performance of climate-based indices is generally poor compared to the ranking based on response-based indices (i.e., the actual performance) from simulations, and inconsistent for different scenarios. Relying on counting the number of matching years between the climate-based indices and the response-based indices based on their ranking alone is not sufficient to draw conclusions, given the results were not consistent. Both the scatter plots and the method developed by Salonvaara et al. provided a more quantitative evaluation of the ranking performance of the climate-based indices, which varies with different scenarios. The scatter plot method compared the correlation between climate-based and response-based indices ranking for all years in each time period, while the Salonvaara et al. method applies to ranking the three most severe years only through the normalization of the performance indicator. Both methods indicated that, in general, the FTDR has a better correlation with the climate-based indices, and particularly with CI and MI in Ottawa and MI in Vancouver.

3.2. Effects of the Response-Based Indices on the Selection of MRY

To evaluate the consistency of using the response-based indices in selecting an MRY for freeze-thaw damage, correlations amongst the four different response-based indices were analyzed using the scatter plot method. The coefficient of determination R2 is also computed for comparison (Table 7).
A general observation of the results shows that different response-based indices may lead to a different ranking of the years in each time period, therefore a different selection of MRY. The overall best correlation was found between IFTC and FTCd, with 0.3 < R2 < 0.92. This may be explained by the nature of these two indicators as they both count the number of critical FT cycles. The difference between the two is that the IFTC index considers the freezing and thawing period, whereas the FTCd considers a minimum ice volume rate for thawing to occur. Although the correlation between the FTDR index and other indices is generally poor, it correlates better with the FTCd and IFTC than the MWI.
Moreover, although the MWI and the FTDR indices consist of numerical equations, they have however provided different results in ranking the years to predict the severity of FT damage. This difference may be explained because the MWI is a product of temperature below its critical freezing value and MC above its critical value; thus, for events where the temperature is well below the freezing value, or MC is well above the critical saturation value, the product of the two parameters may indicate a very high index value. However, the FTDR is calculated based on the formation and melting of ice. To verify which index is closer to reality, measurements are needed for comparison and validation, however, these types of measurements have not been reported in the literature.

3.3. Influence of Adding Interior Insulation

To assess the influence of interior insulation on the risk to frost damage of historical brick masonry walls under a changing climate, the risks to frost damage as calculated from simulation results were compared. The results obtained for a base wall and a retrofitted wall, both facing the prevailing WDR orientation, located in Ottawa and Vancouver, are respectively shown in Figure 7 and Figure 8. The x-axis represents the years in their chronological order for both historical (1986–2016) and future (2062–2092) time periods.
In general, adding interior insulation will increase the risks of freeze-thaw damage as indicated by the values given for all four response-based indices. In Ottawa, the MWI increased in certain years and the difference between a base wall and the retrofit reached a maximum of 60 during the year 1996. In addition, the number of freeze-thaw cycles, as derived from the results of Delphin simulations (FTCd), increased by a maximum of 10 cycles during 2013, and the number of indicative freeze-thaw cycles (IFTC) increased by a maximum of five cycles during 2015. As for the FTDR index, it increased by a maximum value of 23 during 2012. Besides, the effect of adding interior insulation was even more significant in the future. For instance, an increase of 86 (in 2065), 19 (in 2076), 13 (in 2063), and 21 (in 2068) was observed for MWI, FTCd, IFTC, and FTDR, respectively.
As shown in Figure 7, adding interior insulation will also increase the frost damage risk of a masonry wall; however, the impact is more significant in Vancouver than in Ottawa. For instance, the MWI increased for almost all the years and the difference between a base wall and the retrofit reached a maximum of 220 (in 1998), whereas the values for the FTCd and IFTC indices showed an increase of freeze-thaw cycles by a maximum of 29 and 32, respectively during the year 1994. The FTDR index has also increased by a maximum value of 17 (in 1989). Masonry solid walls in Vancouver would still have frost damage risk in the future, but unlike Ottawa, the impact of adding interior insulation would be less significant: an increase of 92 (in 2067), 25 (in 2084), 20 (in 2063) and 12 (in 2063) was observed for MWI, FTCd, IFTC, and FTDR, respectively (Figure 8).
As for the impact of climate change, when using MWI, the FTCd, and the IFTC as indicators, in general, the risk of freeze-thaw damage for Ottawa remains constant for some years and increases over other years in the future. However, the FTDR index value has shown a slight increase for a few years, but also a decrease in the risk of FT damage (Figure 7). One explanation for that may be because the FTDR index was developed using a threshold value of 0.05, thus, freeze-cycles having a very small variation in ice content are disregarded and hence the reduction in risk to FT damage. For Vancouver, all response-based indices have predicted a decrease in the risk of freeze-thaw damage (Figure 8).
For Vancouver, the increased risk of frost damage is more significant due to the addition of interior insulation, whereas for Ottawa the increased risk of frost damage is more significant due to climate change.

4. Conclusions

The objective of this study was primarily to evaluate the reliability of commonly used approaches for the selection of a moisture reference year (MRY) to assess the freeze-thaw damage risk of solid brick masonry walls. This was achieved by comparing the ranking based on the climate-based indices to that based on response-based indices obtained from HAM simulations. Hygrothermal simulations were carried out for a brick masonry wall assembly prior and post-retrofit in two Canadian cities (Ottawa and Vancouver) under historical and projected future climates and for two wall orientations: a North-facing wall and a wall facing the prevailing wind-driven rain direction. Four freeze-thaw performance indicators were used to assess the potential risk to the occurrence of freeze-thaw damage. Four commonly used climate-based indices were calculated for different cities, orientations, and climates and were compared to response-based indices.
The principal conclusions are summarized as follows:
  • The direct correlation between the climate-based indices and the response-based indices is poor, which means that climate-based indices alone do not represent the actual freeze-thaw performance of the walls;
  • The rankings based on climate-based indices are found to have a better correlation with the FTDR index ranking; however, results were not consistent and varied amongst the different scenarios;
  • The correlation between response-based indices: different response-based indices may lead to different rankings of years in each time period and given this, a different selection of MRY. As well, the best overall correlation was found between IFTC and FTCd. The correlation between FTDR index and other response-based indices was generally poor; however, it had a better correlation with the FTCd and IFTC than MWI;
  • The risk of freeze-thaw increased considerably for a masonry wall after interior insulation was added for buildings located in both Ottawa and Vancouver; however, this was more significant in the case of Vancouver. The risk of FT damage would increase for Ottawa but decrease for Vancouver under a warming climate projected in the future, based on the climate scenario used in this study.
Given the advantage of moisture reference years (MRYs), however, the poor reliability of commonly used climate-based indices in ranking and selecting MRYs for frost damage risk assessment, further research is needed to develop a more reliable and robust method for the ranking and selection of MRYs based on climate-based indices that is suitable for freeze-thaw damage risk assessment. Additionally, the uncertainty due to future climate will be further investigated taking into consideration both additional city locations and climate scenarios.

Author Contributions

S.S.: Conceptualization, methodology, formal analysis, writing—original draft preparation; H.G.: Conceptualization, methodology; writing—review and editing, supervision; M.A.L. and M.D.: writing—review and editing. All authors have read and agreed to the published version of the manuscript.

Funding

This work is funded by NSERC Discovery Grant no. RGPIN/6994–2001.

Institutional Review Board Statement

Not applicable.

Informed Consent Statement

Not applicable.

Data Availability Statement

Not applicable.

Acknowledgments

Financial supports received from NSERC Discovery Grant no. RGPIN/6994–2001, and Gina Cody School of Engineering and Computer Science, Concordia University are acknowledged.

Conflicts of Interest

The authors declare no conflict of interest.

References

  1. Environment and Climate Change Canada (ECCC). Pan-Canadian Framework on Clean Growth and Climate Change: Canada’s Plan to Address Climate Change and Grow the Economy. 2016. Available online: https://publications.gc.ca/site/eng/9.828774/publication.html (accessed on 5 September 2021).
  2. Senate of Canada. Reducing Greenhouse Gas Emissions in Canada’s Buildings Necessary to Meeting Paris Agreement Targets. 2018. Available online: https://sencanada.ca/en/newsroom/enev-reducing-ghg-canada-buildings/ (accessed on 24 August 2021).
  3. Pachauri, R.K.; Meyer, L.A. Climate Change 2014: Synthesis Report. Contribution of Working Groups I, II and III to the Fifth Assessment Report of the Intergovernmental Panel on Climate Change. In Proceedings of the AR5 Climate Change 2014: Mitigation of Climate Change, Geneva, Switzerland, 23–27 September 2013, 25–30 March 2014 and 7–12 April 2014. [Google Scholar]
  4. Gastineau, G.; Soden, B.J. Model projected changes of extreme wind events in response to global warming. Geophys. Res. Lett. 2009, 36. [Google Scholar] [CrossRef] [Green Version]
  5. Kumar, D.; Mishra, V.; Ganguly, A.R. Evaluating wind extremes in CMIP5 climate models. Clim. Dyn. 2014, 45, 441–453. [Google Scholar] [CrossRef]
  6. Stocker, T.F.; Qin, D.; Plattner, G.K.; Tignor, M.; Allen, S.K.; Boschung, J.; Nauels, A.; Xia, Y.; Bex, V.; Midgley, P.M. Climate Change 2013: The Physical Science Basis, Contribution of Working Group I to the Fifth Assessment Report of the Intergovernmental Panel on Climate Change. In Proceedings of the Climate Change 2013: The Physical Science Basis, Stockholm, Sweden, 23–26 September 2013; Cambridge University Press: Cambridge, UK; New York, NY, USA, 2013. [Google Scholar]
  7. Bush, E.; Lemmen, D.S. Canada’s Changing Climate Report; Government of Canada: Ottawa, Canada, 2019.
  8. Jeong, D.I.; Sushama, L. Rain-on-snow events over North America based on two Canadian regional climate models. Clim. Dyn. 2017, 50, 303–316. [Google Scholar] [CrossRef] [Green Version]
  9. Jeong, D.I.; Cannon, A.J. Projected changes to risk of wind-driven rain on buildings in Canada under +0.5 °C to +3.5 °C global warming above the recent period. Clim. Risk Manag. 2020, 30, 100261. [Google Scholar] [CrossRef]
  10. Infrastructure Canada. Adapting Infrastructure to Climate Change in Canada’s Cities and Communities; Government of Canada: Ottawa, ON, Canada, 2006.
  11. Natural Resources Canada. From Impacts to Adaptation: Canada in a Changing Climate; Government of Canada: Ottawa, ON, Canada, 2007.
  12. Nijland, T.G.; Adan, O.C.; Van Hees, R.P.; van Etten, B.D. Evaluation of the effects of expected climate change on the durability of building materials with suggestions for adaptation. Heron 2009, 54, 37–48. [Google Scholar]
  13. Cabrera, P.; Samuelsona, H.; Kurthb, M. Simulating Mold Risks under Future Climate Conditions. In Proceedings of the 16th IBPSA Conference, Rome, Italy, 2–4 September 2019. [Google Scholar]
  14. Wardeh, G.; Perrin, B. Freezing–thawing phenomena in fired clay materials and consequences on their durability. Constr. Build. Mater. 2007, 22, 820–828. [Google Scholar] [CrossRef]
  15. Lisø, K.R.; Kvande, T.; Hygen, H.O.; Thue, J.V.; Harstveit, K. A frost decay exposure index for porous, mineral building materials. Build. Environ. 2007, 42, 3547–3555. [Google Scholar] [CrossRef]
  16. Fagerlund, G. Critical Degrees of Saturation at Freezing of Porous and Brittle Materials. Ph.D. Thesis, Lund University, Lund, Sweden, 1973. [Google Scholar]
  17. Fagerlund, G. The critical degree of saturation method of assessing the freeze/thaw resistance of concrete. J. Struct. Mater. 1977, 10, 217–229. [Google Scholar] [CrossRef]
  18. Straube, J.; Schumacher, C.; Mensinga, P. Assessing the freeze-thaw resistance of clay brick for interior insulation retrofit projects. In Proceedings of the XI International Conference Thermal Performance of the Exterior Envelopes of Whole Buildings, Clearwater, FL, USA, 15 December 2010; pp. 5–9. [Google Scholar]
  19. Straube, J.F.; Schumacher, C.J. Assessing the Durability Impacts of Energy Efficient Enclosure Upgrades Using Hygrothermal Modeling. Ph.D. Thesis, University of Waterloo, Waterloo, ON, Canada, 2006. [Google Scholar]
  20. Williams, B.; Richman, R. Laboratory dilatometry and field test to assess durability of masonry. J. Build. Phys. 2016, 40, 425–443. [Google Scholar] [CrossRef]
  21. Van Straaten, R. Improving access to the frost dilatometry methodology for assessing brick masonry freeze thaw degradation risk. In Proceedings of the 14th Canadian Conference on Building Science and Technology, Toronto, Canada, 28–30 October 2014. [Google Scholar]
  22. Powers, T.C.; Helmuth, R.A. Theory of volume changes in hardened Portland cement paste during freezing. TRID 1953, 32, 285–297. [Google Scholar]
  23. Kralj, B.; Pande, G.; Middleton, J. On the mechanics of frost damage to brick masonry. Comput. Struct. 1991, 41, 53–66. [Google Scholar] [CrossRef]
  24. Sahyoun, S.; Ge, H.; Defo, M.; Lacasse, M. Evaluating the potential of freeze-thaw damage in internally insulated masonry under climate change using different models. MATEC Web Conf. 2019, 282, 02081. [Google Scholar] [CrossRef]
  25. Grossi, C.M.; Brimblecombe, P.; Harris, I. Predicting long term freeze–thaw risks on Europe built heritage and archaeological sites in a changing climate. Sci. Total. Environ. 2007, 377, 273–281. [Google Scholar] [CrossRef] [PubMed]
  26. Mukhopadhyaya, P.; Kumaran, K.; Nofal, M.; Tariku, F.; Van Reenen, D. Assessment of building retrofit options using hygrothermal analysis tool. In Proceedings of the 7th Symposium on Building Physics in the Nordic Countries, Reykjavik, Iceland, 13–15 June 2005; pp. 1139–1146. [Google Scholar]
  27. Kočí, J.; Maděra, J.; Černý, R. Generation of a critical weather year for hygrothermal simulations using partial weather data sets. Build. Environ. 2014, 76, 54–61. [Google Scholar] [CrossRef]
  28. Corvo, F.; Pérez, T.; Martin, Y.; Reyes, J.; Dzib, L.; González-Sánchez, J.; Castañeda, A. Time of wetness in tropical climate: Considerations on the estimation of TOW according to ISO 9223 standard. Corros. Sci. 2008, 50, 206–219. [Google Scholar] [CrossRef]
  29. Kočí, J.; Maděra, J.; Keppert, M.; Černý, R. Damage functions for the cold regions and their applications in hygrothermal simulations of different types of building structures. Cold Reg. Sci. Technol. 2017, 135, 1–7. [Google Scholar] [CrossRef]
  30. Maděra, J.; Kočí, V.; Doleželová, M.; Čáchová, M.; Jerman, M.; Černý, R. Influence of weather-affected material characteristics on appearance of freeze/thaw cycles in building envelopes. In AIP Conference Proceedings 2017; AIP Publishing LLC: Melville, NY, USA, 2017; Volume 1866, p. 040023. [Google Scholar]
  31. Zhou, X.; Derome, D.; Carmeliet, J. Hygrothermal modeling and evaluation of freeze-thaw damage risk of masonry walls retrofitted with internal insulation. Build. Environ. 2017, 125, 285–298. [Google Scholar] [CrossRef]
  32. CSN EN 12371. Natural Stone Test Methods-Determination of Frost Resistance; Czech Standards Institute: Prague, Czech Republic, 2010. [Google Scholar]
  33. Van Aarle, M.; Schellen, H.; van Schijndel, J. Hygrothermal simulation to predict the risk of frost damage in masonry, effects of climate change. Energy Procedia 2015, 78, 2536–2541. [Google Scholar] [CrossRef] [Green Version]
  34. Vandemeulebroucke, I.; Calle, K.; Caluwaerts, S.; De Kock, T.; Van Den Bossche, N. Does historic construction suffer or benefit from the urban heat island effect in Ghent and global warming across Europe? Can. J. Civ. Eng. 2019, 46, 1032–1042. [Google Scholar] [CrossRef]
  35. Sehizadeh, A.; Ge, H. Impact of future climates on the durability of typical residential wall assemblies retrofitted to the PassiveHaus for the Eastern Canada region. Build. Environ. 2016, 97, 111–125. [Google Scholar] [CrossRef]
  36. Wells, J.A.; Lacasse, M.A.; Sturgeon, G. Assessment of Moisture Response and Expected Durability of a Heritage Masonry Building Subjected to Projected Future Climate Loads of Ottawa, Canada. In Proceedings of the XV International Conference on Durability of Building Materials and Components, Barcelona, Spain, 20–23 October 2020. [Google Scholar]
  37. Sahyoun, S.; Wang, L.; Ge, H.; Defo, M.; Lacasse, M. Durability of Internally Insulated Historical Solid Masonry Under Future Climates: A Stochastic Approach. In Proceedings of the XV International Conference on Durability of Building Materials and Components, Barcelona, Spain, 20–23 October 2020. [Google Scholar]
  38. Zhou, X.; Derome, D.; Carmeliet, J. A new procedure for selecting moisture reference years for hygrothermal simulations. Bauphysik 2016, 38, 361–365. [Google Scholar] [CrossRef]
  39. Rode, C. Reference Years for Moisture Calculations; Denmark Report T2-DK-93/02; International Energy Agency, Energy Conservation in Buildings and Community Systems Program, Annex 24 Heat, Air, and Moisture Transfer in Insulated Building Parts (HAMTIE): Paris, France, 1993. [Google Scholar]
  40. Hagentoft, C.E.; Harderup, E. Reference Years for Moisture Calculations; International Energy Agency: Paris, France, 1993. [Google Scholar]
  41. Geving, S. Moisture Design of Building Constructions: Hygrothermal Analysis Using Simulation Models—Part I and II. Ph.D. Thesis, Faculty of Civil and Environmental Engineering, Norwegian University of Science and Technology, Trondheim, Norway, 1997. [Google Scholar]
  42. Kalamees, T.; Vinha, J. Estonian Climate Analysis for Selecting Moisture Reference Years for Hygrothermal Calculations. J. Therm. Envel. Build. Sci. 2004, 27, 199–220. [Google Scholar] [CrossRef]
  43. Cornick, S.; Djebbar, R.; Dalgliesh, W.A. Selecting moisture reference years using a Moisture Index approach. Build. Environ. 2003, 38, 1367–1379. [Google Scholar] [CrossRef]
  44. ASHRAE. Environmental Weather Loads for Hygro- Thermal Analysis and Design of Buildings; RP-1325; American Society of Heating, Refrigerating and Air-Conditioning Engineers, Inc.: Atlanta, GE, USA, 2010. [Google Scholar]
  45. Salonvaara, M.; Sedlbauer, K.; Holm, A.; Pazera, M. Effect of selected weather year for hygrothermal analyses. In Proceedings of the Thermal Performance of the Exterior Envelopes of Whole Buildings XI, Clearwater Beach, FL, USA, 5–9 December 2010; American Society of Heating, Refrigerating and Air-Conditioning Engineers, Inc.: Atlanta, GE, USA, 2010. [Google Scholar]
  46. DELPHIN 5.0, Version 5.9.8 [Computer Software]; Bauklimatik Dresden: Dresden, Germany, 2018.
  47. Sahyoun, S.; Ge, H.; Aggarwal, C.; Defo, M.; Moore, T. Effect of Selected Moisture Reference Year on the Durability Assessment of Wall Assemblies under Future Climates. In Proceedings of the XV International Conference on Durability of Building Materials and Components, Barcelona, Spain, 20–23 October 2020. [Google Scholar]
  48. ANSI/ASHRAE. Criteria for Moisture Control Design Analysis in Buildings; American Society of Heating, Refrigerating and Air-Conditioning Engineers, Inc: Atlanta, GE, USA, 2016. [Google Scholar]
  49. ASHRAE. ASHRAE Handbook: Fundamentals; ASHRAE: Atlanta, GE, USA, 2009. [Google Scholar]
  50. Penman, H.L. Natural evaporation from open water, bare soil and grass. R. Soc. 1948, 193, 120–145. [Google Scholar] [CrossRef] [Green Version]
  51. Sontag, L.; Nicolai, A.; Vogelsang, S. Validierung der Solverimplementierung des Hygrothermischen Simulationsprogramms DELPHIN. 2013. Available online: http://www.bauklimatik-dresden.de/delphin/benchmarks/hamstad.php (accessed on 24 August 2021).
  52. Nicolai, A.; Fechner, H.; Vogelsang, S.; Sontag, L.; Paepcke, A.; Grunewald, J. DELPHIN 5.8 Model Reference; TU: Dresden, Germany, 2013. [Google Scholar]
  53. Straube, J.F.; Ueno, K.; Schumacher, C.J. Measure Guideline: Internal Insulation of Masonry Walls; No. DOE/GO-102012-3523; National Renewable Energy Lab. (NREL): Golden, CO, USA, 2012.
  54. NECB. National Energy Code of Canada for Buildings; National Research Council of Canada: Ottawa, ON, Canada, 2015.
  55. EN ISO 15927-3. Hygrothermal Performance of Buildings—Calculation and Presentation of Climatic Data Part 3: Calculation of a Driving Rain Index for Vertical Surfaces from Hourly Wind and Rain Data; CEN: Brussels, Belgium, 2009. [Google Scholar]
  56. Gaur, A.; Lacasse, M.; Armstrong, M. Climate Data to Undertake Hygrothermal and Whole Building Simulations Under Projected Climate Change Influences for 11 Canadian Cities. Data 2019, 4, 72. [Google Scholar] [CrossRef] [Green Version]
  57. Environment and Climate Change Canada. Memorandum of Understanding between National Research Council and Environment and Climate Change Canada; Government of Canada: Ottawa, ON, Canada, 2018.
  58. EN ISO 6946. Building Components and Building Elements—Thermal Resistance and Thermal Transmittance—Calculation Methods; National Standards Authority of Ireland: Dublin, Ireland, 2017. [Google Scholar]
Figure 1. Geometry and meshing of the 1D cross-section of brick masonry wall assemblies: (a) masonry wall without insulation (Base wall) and (b) masonry wall with interior insulation (Retrofit).
Buildings 11 00482 g001
Figure 2. Comparison of (a) annual average temperature, (b) annual average relative humidity, and (c) annual rainfall, during the time periods of 1989–2016 (H) and 2062–2092 (F) in Ottawa and Vancouver.
Buildings 11 00482 g002
Figure 3. Annual average driven-rain index for (a) Ottawa and (b) Vancouver over historical and future time periods.
Buildings 11 00482 g003
Figure 4. Number of matching years between climate-based indices (x-axis) and the response-based indices (legend) for (a) a base wall facing prevailing WDR orientation under historical climate, and (b) a retrofit wall facing North under future climate, in Ottawa.
Buildings 11 00482 g004
Figure 5. Correlation between FTDR values based on the actual ranking and FTDR values based on the climatic indices ranking—for (a) a reference wall under historical period, (b) a reference wall under future period, (c) a retrofit wall under historical period, and (d) a retrofit wall under future period, all facing North orientation in Ottawa.
Buildings 11 00482 g005
Figure 6. Correlation between FTDR values based on the actual ranking and the climate-based indices ranking of the seasonal period—for a reference wall under (a) historical period, and (b) future period, facing North orientation in Ottawa.
Buildings 11 00482 g006
Figure 7. Freeze-thaw performance indicators calculated for a base wall and a retrofitted wall (100 mm spray foam and Scrit of 0.25) facing the prevailing WDR orientation in Ottawa under historical and future climates.
Buildings 11 00482 g007
Figure 8. Freeze-thaw performance indicators calculated for a base wall and a retrofitted wall (100 mm spray foam and Scrit of 0.25) facing the prevailing WDR orientation in Vancouver under historical (1986–2016) and future climates (2062–2092).
Buildings 11 00482 g008
Table 1. Material properties of the historical brick (DELPHIN material database).
MaterialDensity (kg/m3)Specific Heat (J/kg∙K)Thermal Conductivity (W/mK)Open Porosity (m3/m3)A (kg/m2∙s5)µ (-)
Old building brick (outer brick 1)1842.5772.20.79750.30470.066937.56
Plaster *84013800.5880.0890 73.33
Polyurethane foam4515000.0290.9200.0001104
Air layer1.212140.276 0.90
Gypsum7008700.1600.3997 137.85
A: Water absorption coefficient; µ: Vapor resistance factor; * Plaster was only used inboard in the case of the original wall (reference wall).
Table 2. Climate and location characteristics of the two Canadian cities selected for hygrothermal simulations.
CityLatitudeLongitudeClimate ZoneCritical Orientation (WDR)
Ottawa45.25°−75.42°6202.5° (SSW)
Vancouver49.28°−123.12°5157.5° (SSE)
Table 3. Correlation between climate-based and response-based indices for the two orientations N and WDR of each wall: original solid masonry wall (Base wall) and internally retrofitted wall (Retrofit) located in Ottawa and Vancouver. The highest values per index and climate are marked in bold.
CityWallOrientationIndicatorHistoricalFuture
MWIFTCdIFTCFTDRMWIFTCdIFTCFTDR
OttawaBaseNorth CI0.04580.14160.06870.51810.02210.01880.07690.067
WDR0.03210.13530.06210.52760.12070.10340.06880.2776
MI0.04860.09270.14140.46290.03160.00010.00760.1479
Isev0.09690.11440.14620.58770.14190.06190.03310.2823
Prevailing WDR orientationCI0.03410.02480.14070.33930.25730.19530.17120.2343
WDR0.02720.04350.21480.35110.22250.18040.21920.2157
MI0.00050.0040.04360.05130.19180.14330.03430.1831
Isev0.00090.00230.04410.01640.05810.03290.00010.0014
RetrofitNorth CI0.05460.1210.07380.36740.00560.02260.00720.0635
WDR0.03940.10690.06120.36020.13070.21640.18610.0336
MI0.03950.19450.22410.45690.02460.0810.05890.0826
Isev0.07190.10390.10850.28660.14210.21590.18270.0462
Prevailing WDR orientation CI0.05930.14740.30750.0010.08980.00130.03930.0434
WDR0.04560.17190.34850.0020.07230.0040.0390.0346
MI0.00300.00560.03340.08420.00030.05630.0635
Isev0.00050.00750.012600.02550.02950.00680.0164
VancouverBasePrevailing WDR orientationCI0.06990.12350.12310.00150.00280.03960.020.0652
WDR0.05680.11220.11390.00090.00090.01530.00360.0963
MI0.0260.15140.13010.00510.00540.12130.07460.0052
Isev0.13240.15470.19980.03770.22330.3350.20410.0696
RetrofitCI0.09090.02870.03720.00120.010.05310.04970.0251
WDR0.05360.02410.02750.00130.00380.0240.02120.0532
MI0.19340.05010.08060.00750.02240.09890.09380.0012
Isev0.16530.19580.21540.11190.27950.14070.13870.038
Table 4. The correlation coefficient (R2) between response-based indices values based on their actual ranking, and their corresponding values based on climate-based indices ranking—for a North and WDR oriented reference wall and retrofit wall under historical and future periods in Ottawa. The highest values per index and climate are marked in bold.
WallOrientationIndicatorHistoricalFuture
MWIFTCdIFTCFTDRMWIFTCdIFTCFTDR
BaseNorth CI0.00040.06460.00120.49650.10690.00950.0260.0418
WDR0.00130.06090.00120.4910.05540.06940.02780.3838
MI0.02510.09360.05350.38130.0100.0010.1649
Isev0.03980.12260.04550.48810.06710.05310.0350.3539
Prevailing WDR orientationCI00.0110.16090.33250.36780.21980.15020.2326
WDR00.02080.14710.39070.35610.15530.15850.2239
MI0.001800.0210.05360.27540.11680.02410.1051
Isev0.00140.00450.00550.0150.18730.049300.0031
RetrofitNorth CI0.00560.07640.01390.41450.09290.03590.02050.0524
WDR0.00190.07110.0160.40170.02870.2240.20240.0713
MI0.01190.12570.12490.42090.00760.07680.05460.0448
Isev0.00670.0610.0450.24270.04430.23940.1950.0699
Prevailing WDR orientation CI0.00740.16650.34840.00310.113800.03950.0416
WDR0.00520.11680.32090.00210.11240.0020.03360.0314
MI0.00740.00020.00560.0350.10050.00030.04970.0416
Isev0.00180.00710.0040.01230.05030.01570.01020.0343
Table 5. Ratio of the average normalized values of the top three years ranked based on the climate-based indices and simulated results for Ottawa.
WallOrientationClimateClimate-Based IndicesResponse-Based Indices
MWIFTCdIFTCFTDR
BaseNorth HCI0.020.230.15 0.41
WDR0.020.230.150.41
MI0.540.550.620.70
Isev0.40.460.540.58
FCI0.580.300.140.64
WDR0.080.230.140.68
MI0.080.230.140.68
Isev0.080.230.140.68
Prevailing WDR orientationHCI0.10.370.640.92
WDR0.10.370.640.92
MI0.170.260.210.77
Isev0.170.330.50.78
FCI0.650.650.530.74
WDR0.650.650.530.74
MI0.510.650.350.44
Isev0.510.650.350.44
RetrofitNorth HCI0.020.280.190.83
WDR0.020.280.190.83
MI0.450.630.690.64
Isev0.270.410.460.67
FCI0.530.490.560.63
WDR0.100.380.410.71
MI0.100.380.410.71
Isev0.100.380.410.71
Prevailing WDR orientation HCI0.220.830.760.57
WDR0.220.830.760.57
MI0.240.510.240.48
Isev0.230.430.560.41
FCI0.490.310.630.54
WDR0.490.310.630.54
MI0.410.280.470.57
Isev0.410.280.470.57
Table 6. Ratio of the average normalized values of the top three years based on climate-based indices and the simulation results for Vancouver for a wall facing the prevailing WDR orientation.
WallClimateClimate-Based IndicesResponse-Based Indices
MWIFTCdIFTCFTDR
BaseHCI0.450.490.460.33
WDR0.270.490.460.33
MI0.390.500.480.44
Isev0.310.390.360.66
FCI0.020.450.380.18
WDR0.080.270.230.09
MI0.150.640.580.25
Isev00.050.040.08
RetrofitHCI0.520.370.420.32
WDR0.520.370.420.32
MI0.410.530.640.48
Isev0.350.250.240.53
FCI0.120.240.270.29
WDR0.110.230.250.23
MI0.280.360.490.43
Isev000.010.08
Table 7. Coefficient of determination (R2) among different response-based indices for all the simulated cases for a solid brick in its original state and after being retrofitted, in Ottawa and Vancouver.
CityWallOrientationIndicatorHistoricalFuture
MWIFTCdIFTCFTDRMWIFTCdIFTCFTDR
OttawaBaseNorth MWI1.000.440.250.201.000.600.320.38
FTCd 1.000.620.37 1.000.740.45
IFTC 1.000.36 1.000.40
FTDR 1.00 1.00
Prevailing WDR orientationMWI1.000.480.230.061.000.650.520.10
FTCd 1.000.30.09 1.000.620.13
IFTC 1.000.01 1.000.11
FTDR 1.00 1.00
RetrofitNorth MWI1.000.470.350.081.000.550.560.06
FTCd 1.000.730.27 1.000.730.04
IFTC 1.000.27 1.000.07
FTDR 1.00 1.00
Prevailing WDR orientation MWI1.000.540.320.031.000.580.25---
FTCd 1.000.530.02 1.000.440.03
IFTC 1.000.04 1.000.01
FTDR 1.00 1.00
VancouverBasePrevailing WDR orientation MWI1.000.470.510.131.000.530.430.07
FTCd 1.000.920.50 1.000.540.04
IFTC 1.000.48 1.000.26
FTDR 1.00 1.00
RetrofitMWI1.000.470.480.251.000.330.410.10
FTCd 1.000.920.69 1.000.900.51
IFTC 1.000.63 1.000.51
FTDR 1.00 1.00
Publisher’s Note: MDPI stays neutral with regard to jurisdictional claims in published maps and institutional affiliations.

