1. Introduction
In the last two decades, the world has witnessed an alarmingly increasing number of serious natural hazards such as typhoons, floods, tsunamis, hurricanes, and earthquakes. In the year 2017 alone, 335 natural hazards affected over 95.6 million people and resulted in 9697 casualties and over US
$335 billions of economic impact [
1]. The countries in the Southeast Asia and South Asian regions were hardest hit. In Australia, over the past decade, the total economic cost of natural hazards averaged around
$18.2 billion per year, which is equivalent to 1.2% of the GDP over the same period [
2]. The economic loss due to natural hazards includes large proportion of damages to infrastructures. In September 2008, Hurricane Ike hit America and caused severe damages to the infrastructure including roadways and bridge structure of the Houston/Galveston region [
3].
In the aftermath of major natural hazards, relevant authorities or agencies urgently rush to assess the impact on the community, property, environment, etc. [
4,
5]. Herein lies the one of the priority tasks of evaluating the safety of major infrastructures, especially the lifeline system, with the aim of restoring the operation and functionality of the facilities and services as quickly as possible [
6]. A number of techniques, tools, and methods have been proposed to assess the structural damage. The availability of reliable and high-quality data of an infrastructure asset, both before and after a natural hazard, can be extremely useful to assist with critical decision-making processes. However, it is a very costly and cumbersome task to collect reliable, high-quality data of a structure, including the information about structural conditions and service records. In the aftermath of natural hazards, both time and resources are extremely constrained. This means that there are significant challenges for collecting rich information about a structure to support the rapid structural damage assessment. Furthermore, on-site (field) inspections require significant efforts and resources. Yet, the information collected can be very limited in order to quantify the damages to structures and evaluate their safety situation.
The above-mentioned situations emphasize the gap in the current practice for a reliable, timely, and integrated structural damage assessment after natural hazards. It is critical that asset managers, on-site damage inspectors, and structural engineers have access to reliable, prior, and post structural information pertaining to the critical infrastructures to assist them for a quicker, accurate, and informed damage assessment and identification. Therefore, new technologies and efficient processes are required to collect the necessary data of a structure on a continuous basis while simultaneously exploiting the data affordances and quality.
Advances in Building Information Modeling (BIM) technology, more broadly the digital engineering processes, together with Infrastructure Asset Management (IAM) tools provide rich information about a facility or an asset and opportunities for integrated, whole-of-life asset management. BIM is a digital representation of an asset and serves as the central information management hub or repository and the holistic process of creating and managing information [
7] for planning, design, procurement, construction, operation, and the ultimate disposal depending on the stakeholders needs and project requirements [
8]. IAM is defined as “a systematic, structured process covering the whole life of an asset” [
9]. It translates business objectives into asset-related decisions, plans, and actions within a strategic framework using a set of processes, techniques, and tools [
10]. Commercial BIM/IAM platforms offer integrated data management, component libraries, general functionalities, and lifecycle maintenance records for infrastructures [
8]. We collectively refer, in this paper, to the existing as-built and facility operational information about a structure respectively represented in BIM and IAM systems as Product Lifecycle Data (PLD). Arguably, PLD combined with other forms of post-hazard condition assessment data and information would provide a more reliable basis for a damage assessment of critical infrastructures in the aftermath of natural hazards.
Unfortunately, the application of PLD in this area is rare. Even though the literature is abundant with the damage assessment methods, tools, and techniques, the mapping between the PLD and damage assessment methods is loosely investigated. In this paper, we aim to critically review the damage assessment methods and identify the supporting PLD data and information needed for the hazard assessment of critical infrastructures. The specific objectives are as follows:
Review relevant infrastructure inspection methodologies and evaluation criteria for different damage scenarios;
Investigate the opportunities and challenges for damage assessment methods for specific damage scenarios; and
Explore the potential for leveraging PLD and identify valuable data and information needed to support a comprehensive damage evaluation and assessment process.
This research contributes to providing a critical review of the damage assessment methods and identifying the supporting PLD data and information, which will be of great assistance to help practitioners in selecting an appropriate method or technique for damage assessment. It will also provide further theoretical developments on the possible integration of PLD and the damage assessment methods.
2. Research Framework
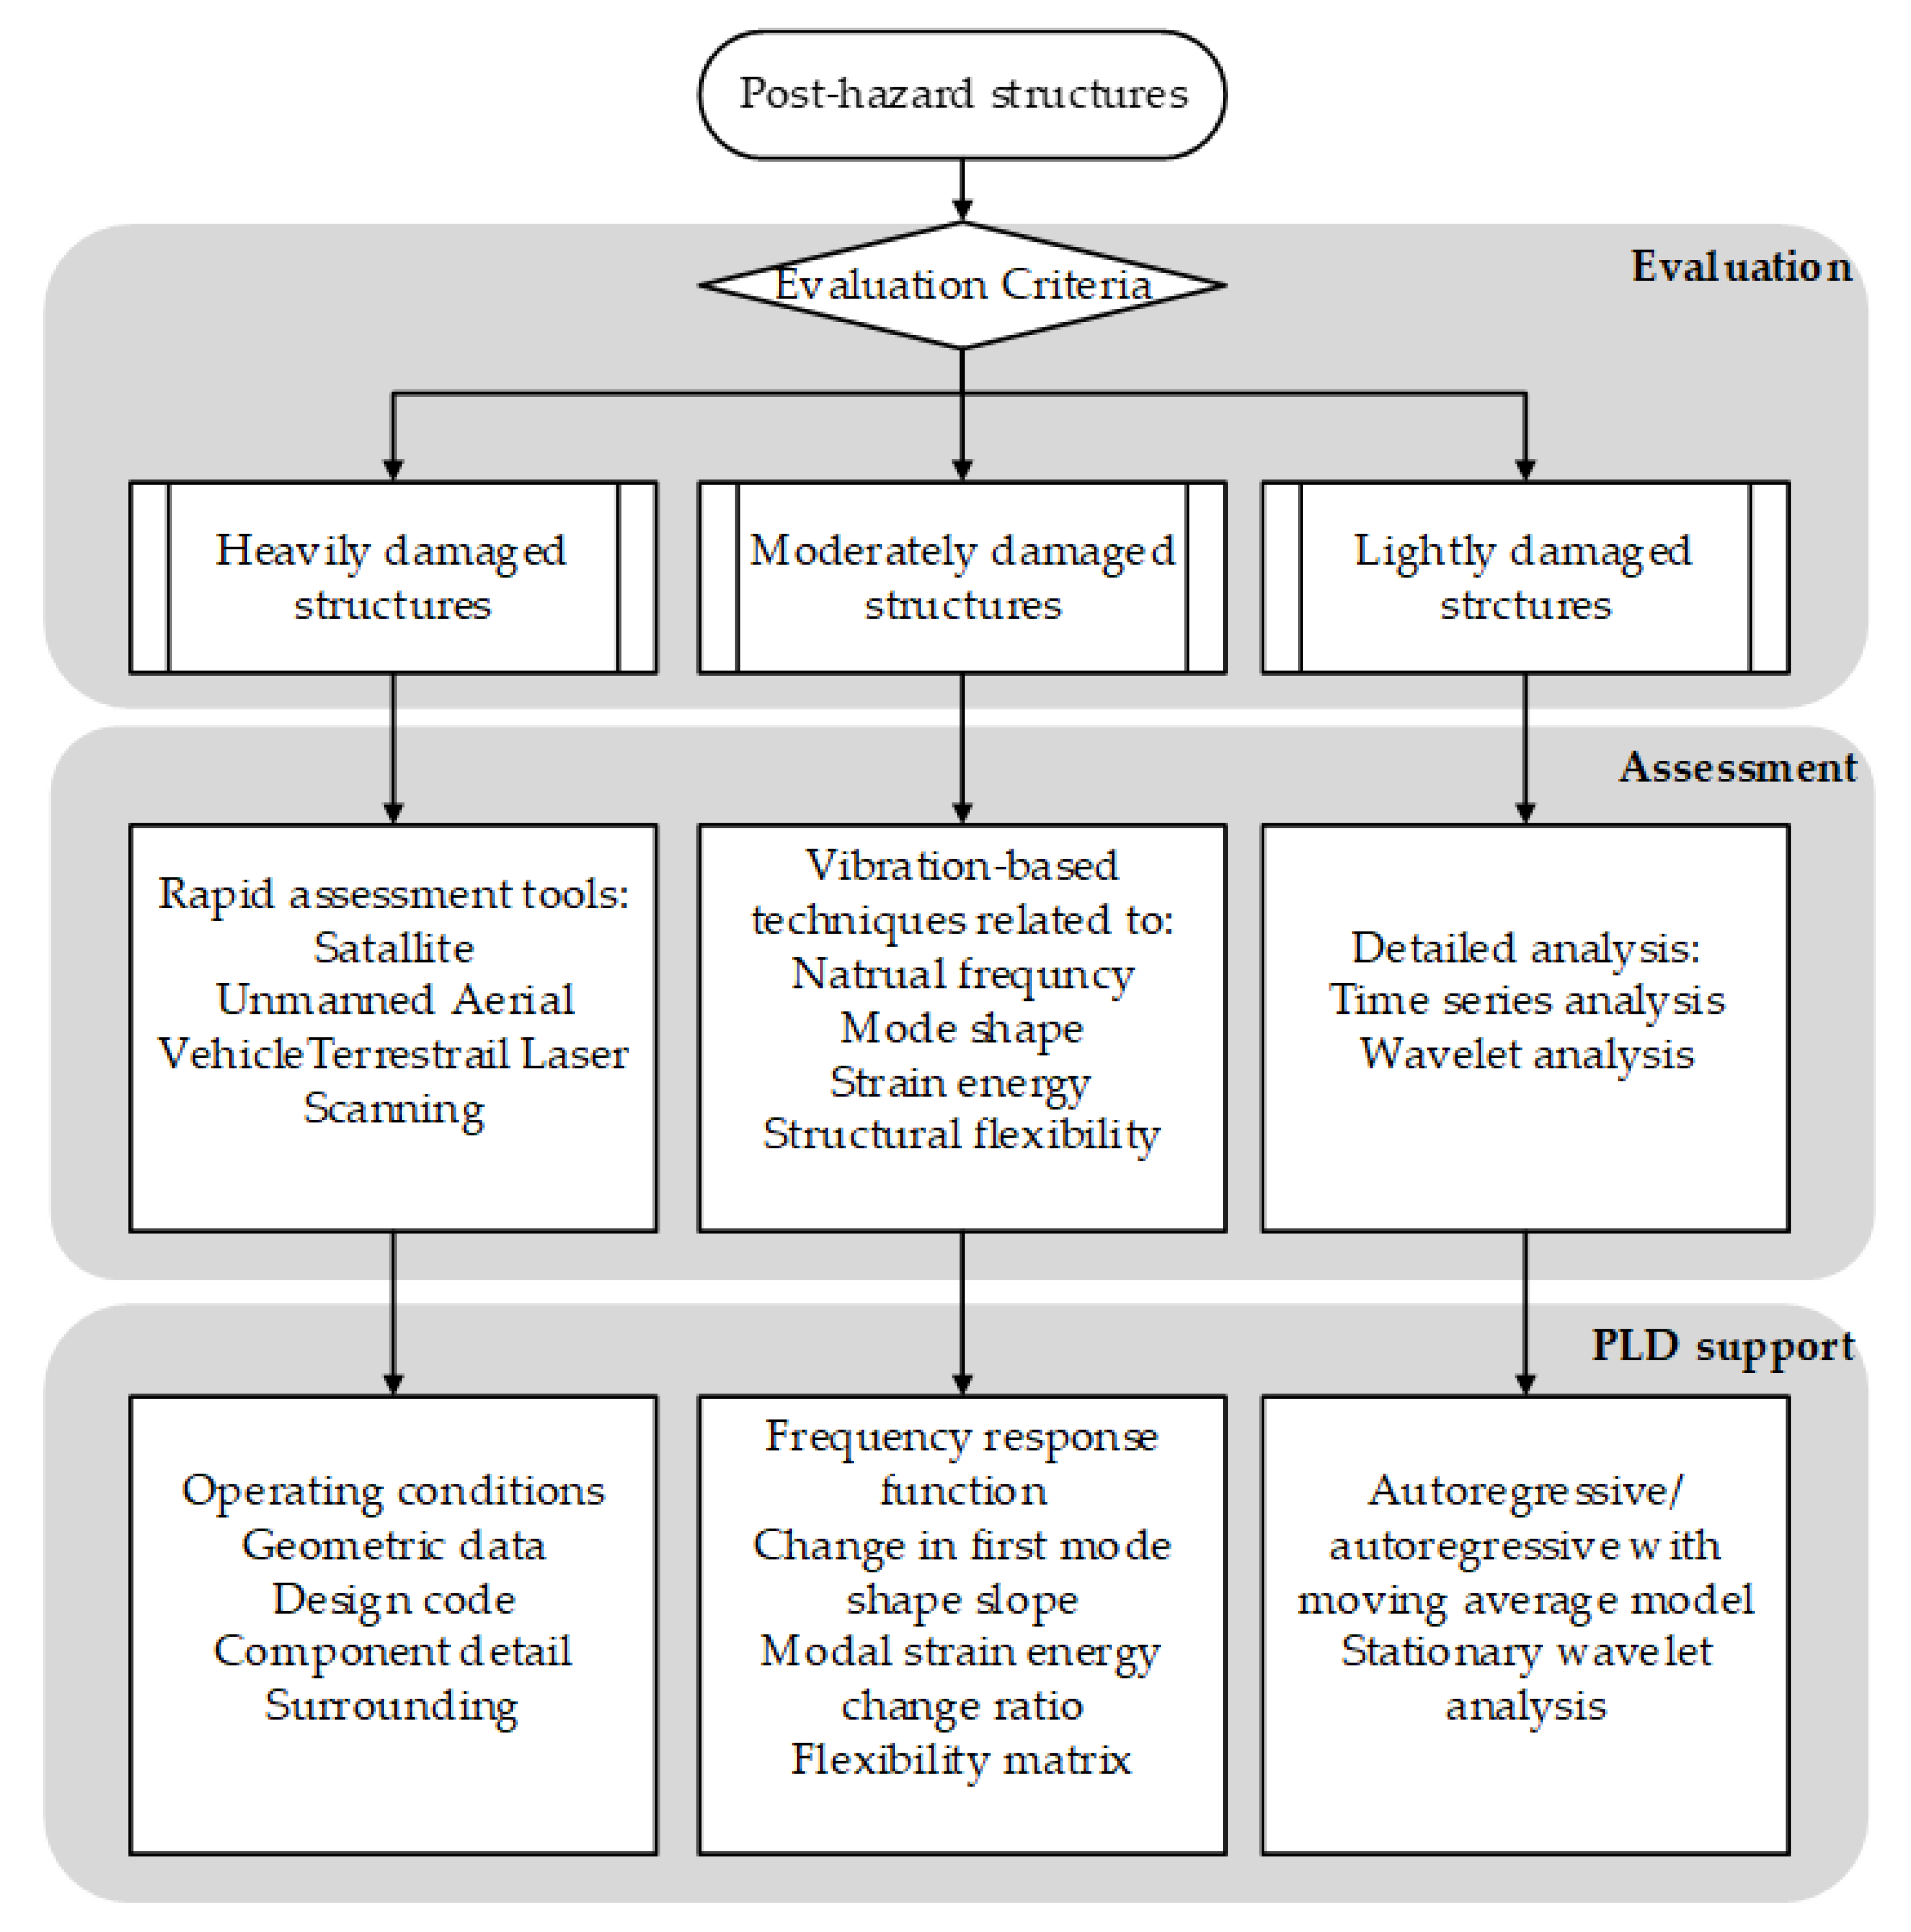
A post-hazard damage evaluation and assessment framework, as presented in
Figure 1, is proposed based on a comprehensive review of the literature. The keywords search criteria used to identify extant literature of interest included “hazard assessment”, “product data”, “product lifecycle”, and “infrastructure”. The search was initially limited to Google Scholar, which then was expanded to other electronic databases including Scopus and Web of Science. The literature search focused on peer-reviewed journal articles.
As mentioned above, this paper aims to provide valuable information on practical methods that could benefit the damage assessment procedure after natural hazards and establish information flow and connectivity between the damage assessment methods and PLD. Therefore, the literature will be organized according to the practical structural damage assessment framework, which is an “evaluation-assessment” framework. First, damage rating standards from four different countries are collated to establish an intuitive damage leveling criterion, which categorizes the affected structures as heavily, moderately, and lightly damaged structures. Secondly, damage detection techniques and methods are critically examined in line with the severity of the damage and damage detection conditions. Thirdly, the data and information required in these methods for a comprehensive damage assessment of a structure are analyzed and conceptually mapped to PLD. Thus, this research paves a way toward developing an integrated PLD system to support the rapid damage assessment of critical structures after natural hazards.
3. Structural Damage Evaluation Criteria
Table 1 shows a glimpse of the rating standards available in the four major countries—namely, the United States, Japan, the United Kingdom, and Germany—to support the assessment of the level of damage to bridge infrastructures. Damage evaluation after a hazard can generally be categorized according to the degree of damage to a structure, namely: destroyed, heavily damaged, moderately damaged, and lightly damaged [
11,
12,
13].
Table 2 shows the criteria for the state of damage evaluation after hazards. These evaluation criteria form a basis of initial assessment to provide a rapid response to hazard rescue, relief, and reconstruction activities, assess the impact on physical/property, human, monetary, economy, etc., and to mobilize necessary resources. Then, engineers and damage inspectors can select the appropriate assessment method/s or techniques for more detailed structural damage assessment.
Table 3 shows the description of different levels of damage to structures. The implication of a varying degree of damage level is such that there will be different requirements for a response. Heavily damaged structures need a rapid assessment; they do not require higher identification accuracy (as the damages are significant); and they are too dangerous to inspectors for close-up inspection and damage detection. To this end, contactless tools can be the best choice. Moderately damaged bridge structures, on the other hand, are open for bridge tests, and the required accuracy level in such an instance is relatively high. Vibration-based quick test methods could be the suitable candidates for this situation. In the case of lightly damaged structures, even though no severe damage is apparent, high-accuracy methods and long-term monitoring technologies are generally recommended to be installed to avoid potential safety hazards.
4. Review of the Damage Assessment Techniques
4.1. Damage Assessment Methods for Heavily Damaged Structures
Heavily damaged structures may pose safety risks to on-site inspectors and engineers to enter the vicinity of the structure to conduct an on-site damage assessment and, therefore, they must rely on alternative contactless assessment methods. The most common distant assessment methods that are applicable to rapid post-hazard damage assessments include the use of images using satellite, unmanned aerial vehicles and terrestrial laser scanning.
4.1.1. Satellite Imagery
High-resolution satellite images are often used to scan a large area to determine the extent of damages to buildings and other infrastructures. The biggest advantage of this method is such that it helps the authorities, hazard rescue, and relief teams to ascertain the damage to structures and plan for rescue/emergency operations and relief works.
Assessment methods using satellite images determine visual damages to structures or areas by identifying changes in the state of an object at different times [
18]. By analyzing pre- and post-hazard images, some works have successfully determined damaged structures [
19,
20,
21]. Different approaches have been used in this area. For example, Myint et al. [
20] analyzed the satellite images captured after the Oklahoma City Tornado using component analysis, image recognition, and object-oriented classification to determine the damaged structures. It was found that the object-oriented classification provided the most precise results.
However, the most analysis approaches still rely on manual works of a group of experts scanning thousands of images [
22], which is obviously very time consuming and costly. Therefore, some automatic assessment methods that are based on object classification have been proposed, and these include methods such as minimum distance classifier, decision tree algorithm, and support vector machine [
23,
24,
25].
Ye et al. [
26] compared various approaches for the automated detection of damaged buildings using aerial imaging. Feature sets were firstly created from the images and then trained and tested via selected classification algorithms. Results indicated that the combination of feature sets and classification methods would provide the best performance. Unfortunately, a major limitation of satellite imagery-based techniques is that the pre- and post-hazard images are all required.
4.1.2. Unmanned Aerial Vehicles (UAVs)
Unmanned Aerial Vehicles (UAVs) are increasingly being deployed to rapidly capture high-resolution images. Even though UAVs need to be operated on-site, UAVs have their own applications and advantages. By capturing large collection of images and videos, this platform provides more detailed inspection and results in higher accuracy of damage assessment. Moreover, with rapid advances in sensing, low-cost camera, and autonomous navigation, UAVs are more affordable, reliable, and easy to operate than satellites. These advantages make UAVs a preferred tool to assess heavily damaged structures with prohibited access.
The UAV-driven damage assessment can be broken down to three steps [
27]:
- (1)
Image acquisition: collecting images or videos of the damaged structures or site
- (2)
Visual data analytics: extracting information features from images and comparing with a priori information to detect deviations
- (3)
Information visualization: quickly determining the current damage situation of structures with data visualization techniques.
Some studies have been conducted following this procedure and showed the large potential of using this platform in damage assessment. A field practice presented by Hallermann and Morgenthal [
28] detected the displacement of a large-scale retaining wall using this platform. The calibration (original) state and transformed (deformed) state wall was recorded by UAVs separately. The captured photos were analyzed photogrammetrically and generated to a 3D point cloud, which were then compared and visualized with relevant software for change detection on the wall. The results showed that this technique makes it possible to detect relatively small displacement in a short time, which makes it impressive in diagnosing bridge deflection (such as deck distortion, tower incline, and pile settlement) after natural hazards. It is worthy to mention that this technique determines the displacement by comparing the “calibration-transformed” state of the wall, akin to the satellite imagery-based methods. However, because most of these methods identify defects from the change of a healthy and damaged structure, these all face the same challenge of the lack of prior information in post-hazard practices.
In an effort to overcome this challenge, Fernandez et al. [
29] used the object-based image analysis (OBIA) to assess heavy damages to building roofs, concrete facades, and brick facades with a damaged image only. In OBIA, the UAV-derived images were processed through an image segmentation approach to generate meaningful, damage-related objects. These objects help to distinguish the damaged parts from those that are intact. The results demonstrated that the OBIA-processed oblique images are suitable for the identification of significant damages in structures. Nevertheless, there is a lack of research on the application of this method for damage assessment of critical infrastructures such as bridges.
Despite its promising application in the rapid damage assessment after natural hazards, several challenges remain to be addressed in the effective deployment of UAVs. The major ones are (1) auto-pilot, path planning, and navigation procedures; (2) specifications of feature description and configuration information; and (3) data collection from hidden parts of the structures [
30].
Some efforts on Simultaneous Localization and Mapping techniques have been made to provide paths for self-navigation. Fernandez Galarreta et al. [
29] pointed out the capabilities of automotive navigation using GPS waypoints and existing maps. However, immediate changes to structures and the environment after natural hazards are not accounted for, and hence, the navigation may be influenced by unexpected blockages and safety risks. Michael et al. [
31], in an effort to address this drawback, utilized a 3D map of the post-hazard buildings, which was generated by 3D point clouds produced by rotating a laser scanner and a 2D occupancy grid map. Nevertheless, the second and third challenges still lack sufficient investigation. There is an opportunity for leveraging PLD as the priori information about the geometry and other physical and functional characteristics of a structure.
4.1.3. Terrestrial Laser Scanning (TLS)
Terrestrial Laser Scanning (TLS) is another extremely useful contactless technique. The laser scanning technology was firstly developed in the field of Geographic Information Systems (GIS) [
32] to obtain location information of structures. Park et al. [
33] introduced and advanced the technique for the monitoring of structural safety and serviceability and referred to it as TLS.
TLS allows contactless measurement of the static displacement or deformed shape of the structure, which could further establish a 3D model of the structure [
33]. Field test results showed that this approach can detect the deflection of a bridge with only 1.6% error. The approach has potential for a rapid detection of structural integrity and deflection of the structural members in the aftermath of hazards if information about the healthy state of the structures was sufficiently recorded or made available.
TLS is an open platform that can incorporate many features of visual inspections. For example, photographic data or point clouds can be rendered from TLS data when a detailed 3D digital model of a structure is available, which thereby could facilitate damage detection through image analytics. Teza et al. [
34] used TLS to assess the health of the concrete bridge through curvature analysis of TLS-based data. Their study was able to detect the presence of surface damages remarkably. Damage assessment via TLS has no requirements for in situ sensors or wiring, has direct contact with the observed surface, and is not affected by illumination conditions. However, this technique currently focuses on surface-level damages and defects; more studies are needed to identify other types of damages or deterioration.
4.2. Damage Assessment Methods for Moderately Damaged and Restricted Access Structures
Defects on the moderately damaged structures may not be visually obvious to the inspectors. However, damages or internal cracks may occur in some invisible parts. As the access is restricted, engineers may only be allowed to bring in small or light equipment for inspection to ascertain the damage. To this end, the vibration-based structural damage detection techniques using modal parameters are recommended. Since these parameters can be obtained by ambient excitations such as wind load, the complexity and effort required are relatively low. Works in this part are categorized by the damage indicator.
4.2.1. Change in Natural Frequency-Based Methods
A damage will modify the structural mass and stiffness and hence change the modal parameters. Therefore, it is possible to identify the location and severity of damage by detecting the difference of modal parameters of the intact and damaged structure [
35].
In practice, natural frequencies are mostly convenient and accurate to be measured. However, several matters should be considered for effective damage detection using natural frequencies. Firstly, sensors should be uniformly placed throughout the structure. Secondly, the main positions to place sensors should be the ones where the sum of the mode shape vector is zero. Lastly, the number of sensors required and the key points for their placement are determined by undertaking a prior modal analysis on a simulated Finite Element (FE) model of the target structure. Many researchers have proposed the availability of determining damages via frequency. Lee and Chung [
36] used natural frequencies to localize and quantify structural damage. Kim et al. [
37] proposed a frequency-based damage detection method, which involved a damage location algorithm to locate damage and damage-sizing algorithm to estimate the crack size. While this method can determine large, single damage with high efficiency, it has poor performance in multiple damage scenarios.
4.2.2. Change in Mode Shape-Based Methods
The information of mode shapes usually is measured accompanied by change in natural frequencies, in most cases. Compared to natural frequencies, mode shapes contain geometrical data that benefit the localization and distinguishing of multiple damages [
38]. Considering the measurement cost and sensitivity of different order of mode shapes [
39], the first three to five mode shapes are mostly applied in damage detection [
40].
Following this direction, change in the first mode shape slope (CFMSS) was developed by Zhu et al. [
41]. It was applied on an eight-story building and successfully identified a multiple damage scenario with good accuracy.
It is worth noting that mode shapes measurement is sensitive to environmental noises, and the number of required sensors is relatively high. Moreover, in order to determine multiple damage cases, the location of sensors needs to be accurately arranged to capture both modal and geometrical information, or else there is a chance of triggering a false alarm.
4.2.3. Change in Strain Energy-Based Methods
Keeping in mind the difficulties faced with the previous parameters, some derivative indicators related to frequency and mode shapes have been developed and shown better performance. Modal strain energy (MSE) was firstly proposed by Shi et al. [
42] as an effective methodology for damage detection. It was validated as a highly reliable and stable parameter for damage assessment [
43]. The change of MSE is minor in undamaged elements, but it has shown a large difference in values in damaged elements and therefore can distinguish the damage. In further studies, the change was developed to the modal strain energy change ratio (MSECR), which gives a significant difference for damaged area compared to undamaged ones [
44]. A great advancement of this method is that it detects the damage via comparing the deviation between the undamaged and damaged area of the structure; thus, it requires no prior information about the structure. In addition, it is effective for identifying multiple damage locations. Furthermore, Huang et al. [
45] proposed a hybrid detection framework that combined modal frequency strain energy assurance criterion (MFSEAC), modal flexibility, and enhanced moth-flame optimization. Numerical and experimental studies on a continuous beam, shear frame, and truss models showed that the MFSEAC can be a very sensitive indicator that reflected both global and local structural damages, and with the enhancement of moth-flame optimization, the efficiency of damage identification was significantly improved.
Nevertheless, these methods require information of high-order modes to produce accurate results. As high-order modes are hardly collected in practical modal tests, a precise finite element model of the structure is required for the assessment, which obviously requires additional efforts and cost.
4.2.4. Change in Structural Flexibility-Based Method
Previous study has shown that the changes in the higher-order mode shape and its derivatives are more sensitive to damage [
46], but its extraction costs are too high. To this end, the concept of a structural flexibility matrix is proposed. It is a function of the mode shape and frequency whose high-frequency components are more sensitive to the deviation of frequency. This makes the flexibility matrix easily obtainable by only measuring several low-order modes and frequencies while giving rise to high sensitivity to damages. By identifying the difference in the matrix of the flexibility matrixes before and after a structural damage, the structural damage location can be ascertained.
Yan and Golinval [
47] presented a damage diagnosis technique based on changes in the dynamically measured flexibility and stiffness of structures. The flexibility matrix was assembled by modal parameters identified by a covariance-driven subspace identification technique. The corresponding stiffness matrix was obtained by pseudo-inversing the matrix. Then, the damage was located via the difference in stiffness between the reference and damage states. As the stiffness matrices were generated through modal parameters, no finite element model is required.
4.3. Damage Assessment Methods for Lightly Damaged Structures
Lightly damaged structures generally have no restrictions to access and hence provide more flexibility to using damage detection techniques. However, the assessment is expected with a higher level of accuracy and level of detail. This section reviews the most recent studies that have reported good accuracy in identifying minor damages to structures.
4.3.1. Time-Series Analysis
In order to detect minor damages, time-series analysis methods aim to fit vibration data into some form of statistical models by extracting damage features from the constructed models [
48]. Algorithms such as scalar autoregressive (AR), moving average (MA), autoregressive with exogenous input (AR-ARX), and autoregressive with moving average (ARMA) modeling have been applied as damage features.
For example, Yu and Zhu [
49] developed an effective damage detection method with an AR-utilized time history model. They set a damage sensitive index, which is a ratio of residual errors of the damaged and original structure. The deviation of this ratio from 1 illustrates the magnitude of relevant damage. Their study diagnosed a damaged three-story building model with only acceleration signals as input data. Experimental results using this method effectively indicated the damage location for minor damages. Interestingly, Chen and Yu [
50] studied the same experiment with the consideration of a non-linear damage situation and by using the ARMA model. Results from their study not only proved that the model can clearly distinguish small damages but also confirmed its potential to quantify the damage. Moreover, changes in the environmental parameters, mass, and stiffness did not affect the results, which is an indication for the required robustness of the method.
However, most of these methodologies are time-consuming [
51] and less efficient in their applications to large structures [
52]. The main challenge is an overwhelming, large volume of data and the lack of an effective tool to deal with it in order to retrieve valuable information.
Cloud computing provides a powerful computational platform to address this challenge [
53]. It has advantages such as data virtualization, distributed parallel computing, and flexible data storage. Yu and Lin [
54] explored the combination of cloud computing techniques and time-series analysis and applied an improved AR model in the damage identification of a three-story building in laboratory. A MapReduce framework was imported wherein data and computation are automatically stored and executed across all computers to obtain redundancy, fault tolerance, parallelization, and load balance [
55]. Experimental results confirmed that damage identification using cloud computing can be up to 2.47 times faster than the traditional methods.
4.3.2. Wavelet Analysis
Wavelet analysis, due to its ability for multiple scales in signal processing, has shown merits over traditional methods for minor damage detection. As wavelet functions could adjust to scanning scales to detect various levels of details in signals, this method can observe both macro and micro level variation of the signals. This means that the method is very sensitive to signal changes caused by a minor damage [
56] while filtering out the signal interference caused by ambient noises [
57].
Lu and Hsu [
58] conducted a feasibility of applying wavelet analysis in damage detection by comparing the discrete wavelet transform of two sets of vibration signals from damaged and undamaged structures. Not only was the presence of defects identified but also their locations. Case studies results showed that even the small added mass can induce a significant deviation in the wavelet coefficients of the vibration signals. Later, a wavelet-based damage identification approach was applied on the beam and plate structural element, and a delamination detection approach of composite plates was proposed by Rajasekaran and Varghese [
59]. This study showed the potential of using wavelet analysis for the damage detection of beams, trusses, and even box-girder types of bridges.
Law et al. [
60] derived the sensitivity of wavelet transformation with respect to local change in the system parameters and found that it was a better solution in vibrational-based damage detection. Numerical results proved that wavelet transformation significantly improved the stability of inverse calculation and decreased the singularity caused by measurement noise. The efficiency of the detection procedure was also improved, and damages were differentiated in a very short duration.
The sensitivity of this method to small damages is remarkable. Zhong and Oyadiji [
56] performed a stationary wavelet transformation in the mode shape of a beam bridge and proposed a crack detection algorithm. With the assumption that the beam was symmetric, the authors compared the transformed mode shape data of the left part (uncracked) and the right part (cracked) and used the difference of the two data series as damage detection indicator. The effects of crack size, depth, and location as well as the effects of the sampling interval were examined. Results confirmed the existence of cracks at the right location, even for small cracks with only a 4% crack ratio.
5. Integration between Damage Assessment Methods and Product Lifecycle Data
In the previous sections, we discussed various damage detection techniques. These techniques in one way or other depend heavily on different types of information about the assets and their contextual environment. Product Lifecycle Data (PLD) can add significant value to data collection, processing, and damage prediction of critical infrastructures. This section briefly reflects on the advantages and disadvantages of the reviewed contactless methods and discusses how different assessment techniques/methods could benefit by their integration with PLD and the key information that will be required to support the key activities involved.
Table 4 provides an overview of integration between PLD and the contactless damage assessment techniques, namely satellite-driven, UAVs-driven, and TLS-based methods for the assessment of heavily damaged structures. Firstly, the images captured by satellites are largely influenced by the climatic condition of the target area; the local climate data and freeze–thaw cycles will have some bearings on successful data acquisition. While in the damage assessment stage, basically satellite imagery-based techniques require undamaged, pre-damaged states images: the “change detection” approaches need them as a reference for the comparison of pre- and post-damaged states; the auto-detection approaches need them to train the classifier. Thus, the images stored in PLD are indispensable to damage assessment. In addition, access to information about the maintenance and operational condition of an asset, active changes on structures can be highlighted immediately and should not be mistaken as “damage”.
In terms of UAVs-driven techniques, there have been limited investigations on the (a) characterization of the criteria necessary for data collection, including the configurations information, and (b) identification of the most informative views for data collection. However, these challenges could be addressed if the techniques are integrated with PLD. For example, inputting geometric information/drawings and inspection notes of a structure perfects the pilot path of UAVs such as collision avoidance with the structure. In particular, this information can also identify the most informative views of the structure for observation. Together with 4D (3D + time) point clouds, PLD has the potential to minimize many technical challenges facing fully autonomous navigation and data collection methods for damage assessment. In the case of detecting deflection of the structural members/structure, geometric data from PLD can augment the establishment of a “collaboration state”, which thereby enables the post-hazard damage detection to be conducted more efficiently. While in the damage determination activities, object-based image analysis (OBIA) needs a “object classification” phase to differentiate the damaged area from the undamaged ones, and this is where the PLD could be useful. The component and substructure details are important indices in the classification of the undamaged area, which could aid the establishment of their topological relationships.
It is expected that most of the drawbacks of TLS-based techniques can be improved by importing PLD information of the structure. As the acquisition distance must be chosen properly to respect the limitation of noise level, drawings of the structure could be helpful in decision making. In addition, because a TLS scan is highly sensitive to the water content [
61], the information about the surrounding environment may also be required. Specifically for bridge curvature calculation, shape information of the bridge structure is necessary when transforming data from the TLS coordinate to the structural coordinate system. The assessment time could be dramatically reduced if this information was extracted directly from the PLD.
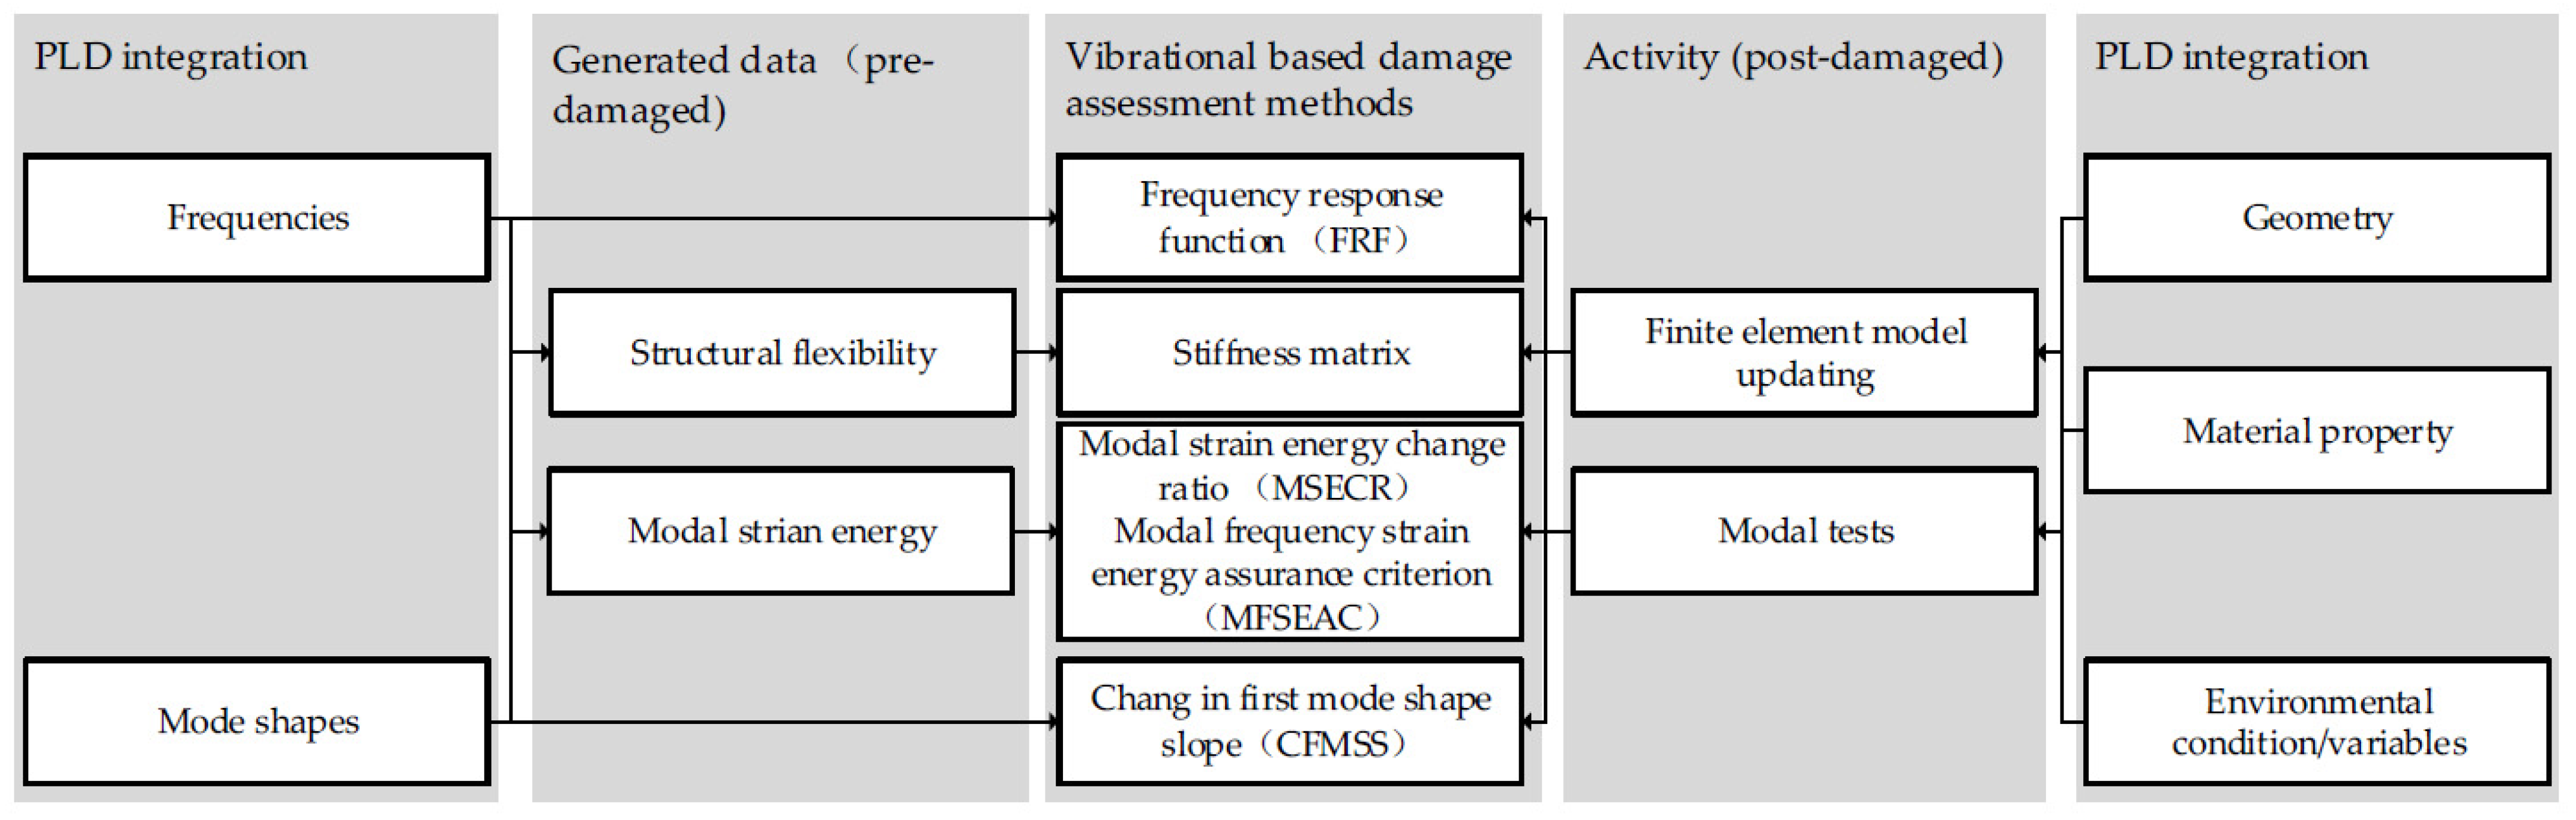
Generally, the vibration-based techniques determine the damages in moderately damaged structures through a comparison of changes in modal parameters. Therefore, the parameters of the intact and damaged structure are both requisite. Next, we briefly discuss how PLD can support the collection of those parameters in pre-damaged and post-damaged structures and what information could ideally be stored in PLD.
Figure 2 graphically depicts the integration of the vibration-based assessment methods with PLD. The PLD for undamaged structures could ideally store as much modal information as possible; parameters such as the stiffness matrix, MSECR, FRF, and CFMSS are all useful for damage assessment. However, storing such a large amount of data may not be very practical. In fact, these parameters are generated from the structural flexibility, MSE, frequency, and mode shape analysis, respectively, whilst the first two parameters can be transformed from the latter two. Therefore, the frequency and mode shape are the most suggested data type to be integrated in PLD. Moreover, these two parameters could be easily obtained if the structure has modal analysis during its maintenance or repairment procedures. The Peak-Picking (PP) and Complex Mode Indication Function (CMIF) both are commonly used methods to acquire such data [
62].
During the assessment stage of the post-damaged structures, modal parameters are usually acquired by activities such as finite element model updating and modal testing. Therefore, the critical information of geometry, material properties, and environmental condition/variables are suggested to be integrated in the PLD databases. This information not only could provide support on modal analysis arrangement (such as sensor planning) but also accelerate the computation of the damage index [
63]. In particular, the FRFs are calculated from the structural stiffness, mass, and damping parameters, and they could be derived from the geometry and material property information of the structure stored in PLD. The calculation of CFMSS, MSECR etc. needs a precise geometry (3D model) of the structure, for which PLD is an ideal source of information. Furthermore, since the accuracy of modal tests is also affected by the environmental conditions/variables such as temperature, humidity, and wind speed, these records could be integrated in PLD and will be immensely valuable.
6. Concluding Remarks
This research conducted a critical review of damage evaluation and assessment methods of infrastructures assets, with particular focus in the aftermath of natural hazards. It discussed the dependency of the most common methods with Product Lifecycle Data (PLD), on the basis of data acquisition, signal processing and detection procedure encountered during the inspection, identification, and assessment of damages to the structures.
A post-hazard damage assessment evaluation and assessment framework was proposed to guide this study. The framework graphically represents damage assessment criteria, the methods commonly in use, and their interactions with the PLD environment. The damage assessment studies are categorized into three broader categories of rapid assessment tools, vibration-based methods, and detailed damage detection technologies, respectively targeting the heavily, moderately, and lightly damaged structures. This taxonomy should provide a clear roadmap for choosing the most appropriate damage detection strategies in the aftermath of natural hazards where time, money, and information must be mobilized or used in the most efficient and effective manner. Depending on the type and features of the damaged structures, along with the practicality of the damage assessment methods as discussed in this paper, engineers and facility managers should be able to adopt the most applicable or practical method/s.
Heavily damaged structures have serious defects in appearance and are usually dangerous for close inspections. With these characteristics, techniques using contactless tools are preferred for damage detection. The techniques based on satellite images, UAVs, and TLS are found to be the most advanced. Their merits were discussed, along with their possible integration with PLD to address the shortcoming. For structures subject to moderate damages, vibration-based methods using features such as frequency, mode shape, strain energy, and structural flexibility were reviewed. These methods generally yield higher accuracy yet demand less data. However, most of them are based on the “change detection” approach, which means that the undamaged and damaged state are both required in the detection process. This provides a significant opportunity for improvement by leveraging PLD. The undamaged state or sufficient data establishing the undamaged state of a structure that could be stored in PLD will significantly speed up and simplify the damage detection process.
Intelligent damage detection and diagnosis, including time-series analysis and wavelet analysis methods, were also briefly reviewed for damage identification of the lightly damaged structures. The level of accuracy, efficiency, sensitivity, robustness, and application range of these techniques were discussed. These methods are mainly based on modern signal processing techniques and artificial intelligence-based techniques. They can produce high-accuracy results in determining small cracks and defects in structures.
Author Contributions
Conceptualization, M.P.N., C.H., and J.L.; methodological development and research framework, M.P.N. and Z.X., review and analysis, M.P.N. and Z.X.; writing—original draft preparation, M.P.N., C.H., J.L., and Z.X., writing—final revision, M.P.N., Z.X., writing—review and editing. M.P.N., C.H., and J.L., supervision, M.P.N. All authors have read and agreed to the published version of the manuscript.
Funding
This research was funded by the former School of Civil Engineering and Built Environment, Queensland University of Technology, Brisbane, Australia.
Conflicts of Interest
The authors declare no conflict of interest.
References
- Alexander, D.C. Natural Hazards; Routledge: London, UK, 2017. [Google Scholar]
- Deloitte Access Economics. Building Resilience to Natural Hazards in Our States and Territories; Deloitte Australia: Sydney, NSW, Australia, 2016. [Google Scholar]
- Stearns, M.; Padgett, J.E. Impact of 2008 Hurricane Ike on Bridge Infrastructure in the Houston/Galveston Region. J. Perform. Constr. Facil. 2012, 26, 441–452. [Google Scholar] [CrossRef] [Green Version]
- Jaman, T.; Dharanirajan, K.; Shivaprasad, S.S.V. Assessment of impact of cyclone hazard on social vulnerability of Bhadrak District of Odisha State during Phailin Cyclone in 2013 and Titli Cyclone in 2018 using multi-criteria analysis and geospatial techniques. Int. J. Disaster Risk Reduct. 2021, 53, 101997. [Google Scholar] [CrossRef]
- Feofilovs, M.; Romagnoli, F. Dynamic assessment of urban resilience to natural hazards. Int. J. Disaster Risk Reduct. 2021, 62, 102328. [Google Scholar] [CrossRef]
- Kakareko, G.; Jung, S.M.; Ozguven, E.E. Estimation of tree failure consequences due to high winds using convolutional neural networks. Int. J. Remote Sens. 2020, 41, 9039–9063. [Google Scholar] [CrossRef]
- Watson, A. Digital buildings—Challenges and opportunities. Adv. Eng. Inform. 2011, 25, 573–581. [Google Scholar] [CrossRef]
- Eastman, C.; Teicholz, P.; Sacks, R.; Liston, K. BIM Handbook: A Guide to Building Information Modeling for Owners, Managers, Designers, Engineers and Contractors; John Wiley & Sons: Hoboken, NJ, USA, 2011. [Google Scholar]
- Too, E.G.; Tay, L. Infrastructure Asset Management (IAM): Evolution and Evaluation. In Proceedings of the CIB International Conference on Building Education and Research: Building Resilience Conference Proceedings, Heritance Kandalama, Sri Lanka, 11–15 February 2008. [Google Scholar]
- Pocock, D.; Shetty, N.; Hayes, A.; Watts, J. Leveraging the relationship between BIM and asset management. Infrastruct. Asset Manag. 2014, 1, 5–7. [Google Scholar] [CrossRef]
- Alexander, D. Planning for Post-Hazard Reconstruction. In Proceedings of the I-Rec 2004 International Conference Improving Post-Hazard Reconstruction in Developing Countries, Coventry, UK, 22–23 April 2004. [Google Scholar]
- Hwang, H.; Jernigan, J.B.; Lin, Y.-W. Evaluation of Seismic Damage to Memphis Bridges and Highway Systems. J. Bridge Eng. 2000, 5, 322–330. [Google Scholar] [CrossRef]
- Padgett, J.; DesRoches, R.; Nielson, B.; Yashinsky, M.; Kwon, O.-S.; Burdette, N.; Tavera, E. Bridge Damage and Repair Costs from Hurricane Katrina. J. Bridge Eng. 2008, 13, 6–14. [Google Scholar] [CrossRef] [Green Version]
- Phares, B.M.; Washer, G.A.; Rolander, D.D.; Graybeal, B.A.; Moore, M. Routine highway bridge inspection condition documentation accuracy and reliability. J. Bridge Eng. 2004, 9, 403–413. [Google Scholar] [CrossRef]
- Yokoyama, K.; Inaba, N.; Honma, A.; Ogata, N. Development of bridge management system for expressway bridges in Japan. In Proceedings of the 3rd International Conference on Bridge Maintenance, Safety and Management, Porto, Portugal, 16–19 July 2006; pp. 687–693. [Google Scholar]
- Strauss, A.; Ivankovic, A.M.; Matos, J.C.; Casas, J. WG1 Technical Report: Performance Indicators for Roadway Bridges of COST Action 1406. 2016. Available online: http://repositorium.sdum.uminho.pt/bitstream/1822/44827/3/COST_TU1406_WG1_TECH_REPORT.pdf (accessed on 20 March 2020).
- Vaghefi, K.; Oats, R.C.; Harris, D.K.; Ahlborn, T.M.; Brooks, C.N.; Endsley, K.A.; Dobson, R. Evaluation of commercially available remote sensors for highway bridge condition assessment. J. Bridge Eng. 2011, 17, 886–895. [Google Scholar] [CrossRef]
- Singh, A. Review article digital change detection techniques using remotely-sensed data. Int. J. Remote Sens. 1989, 10, 989–1003. [Google Scholar] [CrossRef] [Green Version]
- Brunner, D.; Lemoine, G.; Bruzzone, L. Earthquake damage assessment of buildings using VHR optical and SAR imagery. IEEE Trans. Geosci. Remote Sens. 2010, 48, 2403–2420. [Google Scholar] [CrossRef] [Green Version]
- Myint, S.W.; Yuan, M.; Cerveny, R.S.; Giri, C.P. Comparison of remote sensing image processing techniques to identify tornado damage areas from Landsat TM data. Sensors 2008, 8, 1128–1156. [Google Scholar] [CrossRef] [PubMed] [Green Version]
- Radhika, S.; Tamura, Y.; Matsui, M. Texture-wavelet analysis for automating wind damage detection from aerial imageries. In Proceedings of the 2013 3rd IEEE International Advance Computing Conference (IACC), Ghaziabad, India, 22–23 February 2013; pp. 1246–1250. [Google Scholar]
- Sagara, E. Hurricane Sandy’s Destruction: Aerial Assessment Shows Nearly 72K Buildings Damaged in NJ. The Star Ledger. 18 November 2012. Available online: https://www.nj.com/news/2012/11/hurricane_sandys_destruction_a.html (accessed on 20 November 2019).
- Balz, T.; Liao, M. Building-damage detection using post-seismic high-resolution SAR satellite data. Int. J. Remote Sens. 2010, 31, 3369–3391. [Google Scholar] [CrossRef]
- Radhika, S.; Tamura, Y.; Matsui, M. Use of post-storm images for automated tornado-borne debris path identification using texture-wavelet analysis. J. Wind Eng. Ind. Aerodyn. 2012, 107, 202–213. [Google Scholar] [CrossRef]
- Yamazaki, F.; Vu, T.T.; Matsuoka, M. Context-Based Detection of Post-Hazard Damaged Buildings in Urban Areas from Satellite Images. In Urban Remote Sensing Joint Event; IEEE: Piscataway, NJ, USA, 2007; pp. 1–5. [Google Scholar]
- Ye, S.; Nourzad, S.H.H.; Pradhan, A.; Bartoli, I.; Kontsos, A. Automated Detection of Damaged Areas after Hurricane Sandy using Aerial Color Images. In Proceedings of the Computing in Civil and Building Engineering, Orlando, FL, USA, 23–25 June 2014. [Google Scholar]
- Ham, Y.; Han, K.K.; Lin, J.J.; Golparvar-Fard, M. Visual monitoring of civil infrastructure systems via camera-equipped Unmanned Aerial Vehicles (UAVs): A review of related works. Vis. Eng. 2016, 4, 1. [Google Scholar] [CrossRef] [Green Version]
- Hallermann, N.; Morgenthal, G. Visual inspection strategies for large bridges using Unmanned Aerial Vehicles (UAV). In Proceedings of the 7th IABMAS, International Conference on Bridge Maintenance, Safety and Management, Shanghai, China, 7–11 July 2014; pp. 661–667. [Google Scholar]
- Fernandez Galarreta, J.; Kerle, N.; Gerke, M. UAV-based urban structural damage assessment using object-based image analysis and semantic reasoning. Nat. Hazards Earth Syst. Sci. 2015, 15, 1087–1101. [Google Scholar] [CrossRef] [Green Version]
- Han, K.; Lin, J.; Golparvar-Fard, M. A formalism for utilization of autonomous vision-based systems and integrated project models for construction progress monitoring. In Proceedings of the 2015 Conference on Autonomous and Robotic Construction of Infrastructure, Ames, IA, USA, 2–3 June 2015. [Google Scholar]
- Michael, N.; Shen, S.; Mohta, K.; Kumar, V.; Nagatani, K.; Okada, Y.; Ohno, K. Collaborative Mapping of an Earthquake Damaged Building via Ground and Aerial Robots. In Field and Service Robotics; Springer: Berlin/Heidelberg, Germany, 2014; pp. 33–47. [Google Scholar]
- Ackermann, F. Airborne laser scanning present status and future expectations. ISPRS J. Photogramm. Remote Sens. 1999, 54, 64–67. [Google Scholar] [CrossRef]
- Park, H.; Lee, H.; Adeli, H.; Lee, I. A new approach for health monitoring of structures: Terrestrial laser scanning. Comput.-Aided Civ. Infrastruct. Eng. 2007, 22, 19–30. [Google Scholar] [CrossRef]
- Teza, G.; Galgaro, A.; Moro, F. Contactless recognition of concrete surface damage from laser scanning and curvature computation. NDT E Int. 2009, 42, 240–249. [Google Scholar] [CrossRef]
- Yan, Y.; Yam, L. Detection of delamination damage in composite plates using energy spectrum of structural dynamic responses decomposed by wavelet analysis. Comput. Struct. 2004, 82, 347–358. [Google Scholar] [CrossRef]
- Lee, Y.S.; Chung, M.J. A study on crack detection using eigenfrequency test data. Comput. Struct. 2000, 77, 327–342. [Google Scholar] [CrossRef]
- Kim, J.T.; Ryu, Y.S.; Cho, H.M.; Stubbs, N. Damage identification in beam-type structures: Frequency-based method vs. mode-shape-based method. Eng. Struct. 2003, 25, 57–67. [Google Scholar] [CrossRef]
- Das, S.; Saha, P.; Patro, S.K. Vibration-based damage detection techniques used for health monitoring of structures: A review. J. Civ. Struct. Health Monit. 2016, 6, 477–507. [Google Scholar] [CrossRef]
- Whalen, T.M. The behavior of higher order mode shape derivatives in damaged, beam-like structures. J. Sound Vib. 2008, 309, 426–464. [Google Scholar] [CrossRef]
- Roy, K.; Ray-Chaudhuri, S. Fundamental mode shape and its derivatives in structural damage localization. J. Sound Vib. 2013, 332, 5584–5593. [Google Scholar] [CrossRef]
- Zhu, H.; Li, L.; He, X.-Q. Damage detection method for shear buildings using the changes in the first mode shape slopes. Comput. Struct. 2011, 89, 733–743. [Google Scholar] [CrossRef]
- Shi, Z.; Law, S.; Zhang, L. Structural damage localization from modal strain energy change. J. Sound Vib. 1998, 218, 825–844. [Google Scholar] [CrossRef]
- Alvandi, A.; Cremona, C. Assessment of vibration-based damage identification techniques. J. Sound Vib. 2006, 292, 179–202. [Google Scholar] [CrossRef]
- Shi, Z.; Law, S.; Zhang, L. Improved damage quantification from elemental modal strain energy change. J. Eng. Mech. 2002, 128, 521–529. [Google Scholar] [CrossRef]
- Huang, M.S.; Li, X.F.; Lei, Y.Z.; Gu, J.F. Structural damage identification based on modal frequency strain energy assurance criterion and flexibility using enhanced Moth-Flame optimization. In Structures; Elsevier: Amsterdam, The Netherlands, 2020; Volume 28, pp. 1119–1136. [Google Scholar]
- Yan, Y.J.; Cheng, L.; Wu, Z.Y.; Yam, L.H. Development in vibration-based structural damage detection technique. Mech. Syst. Signal Process. 2007, 21, 2198–2211. [Google Scholar] [CrossRef]
- Yan, A.; Golinval, J.-C. Structural damage localization by combining flexibility and stiffness methods. Eng. Struct. 2005, 27, 1752–1761. [Google Scholar] [CrossRef]
- Brockwell, P.J.; Davis, R.A.; Fienberg, S.E. Time Series: Theory and Methods: Theory and Methods; Springer Science & Business Media: Berlin, Germany, 1991. [Google Scholar]
- Yu, L.; Zhu, J.-H. Nonlinear damage detection using higher statistical moments of structural responses. Struct. Eng. Mech. 2015, 54, 221–237. [Google Scholar] [CrossRef] [Green Version]
- Chen, L.-J.; Yu, L. Structural nonlinear damage identification algorithm based on time series ARMA/GARCH model. Adv. Struct. Eng. 2013, 16, 1597–1609. [Google Scholar] [CrossRef]
- Gul, M.; Catbas, F.N. Structural health monitoring and damage assessment using a novel time series analysis methodology with sensor clustering. J. Sound Vib. 2011, 330, 1196–1210. [Google Scholar] [CrossRef]
- Yao, R.; Pakzad, S.N. Time and frequency domain regression-based stiffness estimation and damage identification. Struct. Control Health Monit. 2014, 21, 356–380. [Google Scholar] [CrossRef]
- Chen, K.; Zheng, W.-M. Cloud computing: System instances and current research. J. Softw. 2009, 20, 1337–1348. [Google Scholar] [CrossRef]
- Yu, L.; Lin, J.-C. Cloud computing-based time series analysis for structural damage detection. J. Eng. Mech. 2015, 143, C4015002. [Google Scholar] [CrossRef]
- Chung, W.-C.; Chen, C.-C.; Ho, J.-M.; Lin, C.-Y.; Hsu, W.-L.; Wang, Y.-C.; Chang, Y.-J. CloudDOE: A user-friendly tool for deploying Hadoop clouds and analyzing high-throughput sequencing data with MapReduce. PLoS ONE 2014, 9, e98146. [Google Scholar] [CrossRef] [Green Version]
- Zhong, S.; Oyadiji, S.O. Crack detection in simply supported beams without baseline modal parameters by stationary wavelet transform. Mech. Syst. Signal Process. 2007, 21, 1853–1884. [Google Scholar] [CrossRef]
- Hong, J.-C.; Kim, Y.; Lee, H.; Lee, Y. Damage detection using the Lipschitz exponent estimated by the wavelet transform: Applications to vibration modes of a beam. Int. J. Solids Struct. 2002, 39, 1803–1816. [Google Scholar] [CrossRef]
- Lu, C.-J.; Hsu, Y.-T. Vibration analysis of an inhomogeneous string for damage detection by wavelet transform. Int. J. Mech. Sci. 2002, 44, 745–754. [Google Scholar] [CrossRef]
- Rajasekaran, S.; Varghese, S. Damage detection in beams and plates using wavelet transforms. Comput. Concr. 2005, 2, 481–498. [Google Scholar] [CrossRef]
- Law, S.; Li, X.; Zhu, X.; Chan, S. Structural damage detection from wavelet packet sensitivity. Eng. Struct. 2005, 27, 1339–1348. [Google Scholar] [CrossRef]
- Lu, J.; Georghiades, A.S.; Rushmeier, H.; Dorsey, J.; Xu, C. Synthesis of material drying history: Phenomenon modeling, transferring and rendering. In Proceedings of the ‘06: ACM SIGGRAPH 2006 Courses, Boston, MA, USA, 30 July–3 August 2006. [Google Scholar]
- Peeters, B.; De Roeck, G. Stochastic system identification for operational modal analysis: A review. J. Dyn. Syst. Meas. Control 2001, 123, 659–667. [Google Scholar] [CrossRef]
- Ventura, C.E.; Lord, J.-F.; Simpson, R.D. Effective use of ambient vibration measurements for modal updating of a 48 storey building in Vancouver, Canada. In Proceedings of the International Conference on Structural Dynamics Modeling–Test, Analysis, Correlation and Validation, Madeira, Portugal, 3–5 June 2002. [Google Scholar]
| Publisher’s Note: MDPI stays neutral with regard to jurisdictional claims in published maps and institutional affiliations. |
© 2021 by the authors. Licensee MDPI, Basel, Switzerland. This article is an open access article distributed under the terms and conditions of the Creative Commons Attribution (CC BY) license (https://creativecommons.org/licenses/by/4.0/).


