Article

Non-commercial Air Purifier—The Effectiveness and Safety

1
Faculty of Energy and Environmental Protection, Department of Air Protection, Silesian University of Technology, 44-100 Gliwice, Poland
2
Faculty of Energy and Environmental Protection, Department of Technologies and Installations for Waste Management, Silesian University of Technology, 44-100 Gliwice, Poland
*
Author to whom correspondence should be addressed.
Buildings 2020, 10(6), 104; https://doi.org/10.3390/buildings10060104
Submission received: 30 April 2020 / Revised: 25 May 2020 / Accepted: 27 May 2020 / Published: 31 May 2020

Abstract

:
(1) Background: On the Internet, we can find the guidelines for homemade air purifiers. One of the solutions includes the use of a low-cost ozone generator to decrease the level of odors and biological contaminants. However, the authors do not notify about hazardous effects of ozone generation on human health; (2) Methods: We elaborated our test results on the bacterial and fungal aerosol reduction by the use of two technical solutions of homemade air purifiers. First, including a mesh filter and ozone generator, second including an ozone generator, mesh filter, and carbon filter. (3) Conclusions: After 20 min of ozone generation, the concentration of bacteria decreased by 78% and 48% without and with a carbon filter, while fungi concentration was reduced in the lower range 63% and 40%, respectively. Based on our test results, we proposed a precise periodical operation of homemade air purifier to maintain the permissible level of ozone for the occupants.

1. Introduction

As we spend about 90% of our lifetime inside, indoor air pollution appears as one of the most harmful threats these days. One of the crucial indicators of indoor air pollution is bioaerosols. These biological particles are one of the risk factors bringing adverse health effects [1,2]. Biological aerosols are a broad category of airborne particles, comprising all particles having a biological source. One group includes bacteria, fungi, viruses and pollen suspended in the air, while the second includes biomolecules (toxins, debris from membranes such as lipids and proteins) [3]. This kind of aerosol has been linked to various health effects from allergic, through infections, to toxic reactions [4,5,6,7,8].
In order to improve air quality by reducing bioaerosols in the environment, air purifiers are used. There are many air purifiers on the market. In particular, mobile devices have the advantage of being independent of integrated installations and can also be used in buildings where no air conditioning has been installed. Furthermore, they are considered to be an alternative way of treating hazardous and/or odorous pollutants in buildings that cannot be fully remediated at reasonable costs [9]. The typical method of air cleaning is filtering. The most common material is high-efficiency particle-arresting (HEPA) filters or carbon, often used in activated modifications [9]. Generally, air purifiers recommended by the Association of Home Appliance Manufacturers (AHAM) meet the 80% effectiveness criterion for small particles (e.g., environmental tobacco smoke—ETS). Shaughnessy et al. [10] underlined that meeting this criterion for all particles is difficult because specific air cleaner effectiveness depends on three key elements—room size, clean air delivery rate (CADR), and particle-size category. The authors pointed to three particle types crucial for effectiveness evaluations: environmental tobacco smoke (ETS) (particle size range, 0.09–1.0 µm diameter); dust (particle size range, 0.5–3.0 µm diameter); and paper mulberry pollen (particle size range, 5–11 µm diameter). The particle removal effectiveness depending on these three parameters can vary from 19% to 99%. Portable air purifiers can run on various technologies, including mechanical filters, electrostatic precipitators, ion generators, hybrid filters, gas phase filters, and ozone generators [11]. Many devices and appliances dedicated to indoor use release ozone either intentionally or unintentionally [12]. Siegel [13] pointed out that a device intended as an air cleaner that intentionally emits any compound into indoor air should not be considered a true air cleaner because the contamination can outweigh any air cleaning benefits. However, very often, commercial ozone generators are marketed as air purifiers [14]. Among various mechanisms, the ozone generators aim to improve the microbiological quality of air, reducing the levels of fungi, bacteria, and viruses present in the environment by over 80% [15]. Some have claimed that ozone can oxidize airborne gases, and even particulates, to simple carbon dioxide and water vapor [16].
The literature reports several tests on air purifiers reducing levels of bioaerosols in indoor environments (Table 1). In these studies, the effectiveness of air purifiers is defined as the percentage of reduction in pollutant concentration in a room of interest [17,18]. Some studies have examined the efficacies of air purifiers in indoor environments with a single dominating emission source, such as cat/dog allergens [19,20,21]. Others investigated the effectiveness of air filtration in lowering concentrations of air pollution in educational [22,23] and residential buildings [24,25].
Air purifiers generally cost about USD 200 to 500, but can go over USD 1000. Replacement filters and filter sets typically cost from USD 30 to 100, depending on the brand and model of air purifier [26]. Currently, technological progress and the availability of various technical solutions allow one to build a homemade air purifier and purchase for USD 25–50. On the internet (YouTube), movies on homemade air cleaners can be found—some recommend an ozone generator as an effective way to remedy the problem of odors and bacteria. However, we should put forward the question regarding the safety of such a solution.
As opposed to publications complimenting the ozone-generating devices to improve indoor air quality (IAQ), some studies cited US EPA the Consumers Union statement that “Air cleaners that generate ozone intentionally should not be used indoors” and focus on potentially deleterious consequences of overexposure to ozone as a public health concern [16,27]. For example, Britigan et al. [27] examined thirteen air purifiers and pointed out that ozone generators can produce O3 levels above public health standards. Except for measurements indoors, in cars or airliner cabins [27,28], the tests with personal air purifiers (PAP) were done [27,29]. All skeptical publications underline that O3 emission rates can maintain levels over public health standards, particularly in urban areas where ozone levels are already elevated as a result of outdoor emission. They also underline the susceptibility of the elderly, children, and persons with chronic diseases to ozone emissions.
Among the documented health effects of exposure, there is an increased risk of deaths and illnesses due to respiratory diseases (including asthma and chronic obstructive pulmonary disease—COPD) and cardiovascular diseases. A separate issue is occupational exposure to ozone, which arises, among others, for example, during working with office devices, such as photocopiers, printers, or projectors [12,30].
Due to the rapidly changing conditions, ozone concentrations are usually provided as 1 h, 8 h, 1 month, and annual averages [12]. In order to protect human health, the World Health Organization (WHO) has provided a guideline value of 100 μg/m3 as the maximum 8 h mean ozone concentration [31]. However, governmental organizations have issued various recommendations or standards for ozone. According to current Polish regulations of the Ministry of Family, Work, and Social Policy defining the highest permissible concentrations and intensities of agents harmful to health in the work environment [32], the highest permissible concentration of O3 by 8-h exposure is 150 μg/m3 (0.06 ppm = 60 ppb). The U.S. Occupational Safety and Health Administration (OSHA) established a permissible exposure limit (PEL) of 100 ppb (241 μg/m3) for an 8-h exposure and short-term exposure limit (STEL) of 300 ppb (723 μg/m3) for a 15-min exposure [27]. The most restricted values are in Canada. The Health Canada recommends a residential maximum exposure limit of 40 µg/m3 (20 ppb) ozone, based on an averaging time of 8-h [33]. The WHO working group puts O3 in the second group of potential interest as a pollutant, possibly carcinogenic to humans [34].
On the other hand, some authors considered the ozone levels from 0.08 (190 μg/m3) to 3 ppm (7230 μg/m3) in the environment as toxic and it has been associated with various adverse health effects, including the formation of reactive oxygen species (ROS), reduction in lung function induced airway inflammation through the infiltration of neutrophils and macrophages in both healthy individuals, and those who already have some kind of respiratory disease, exacerbation of respiratory illnesses, and increased rates of hospital admissions [15,39].
The review of available literature data confirms well-known knowledge that the emission of ozone is a very effective sterilization process, killing viable bacteria and fungi suspended in indoor air. Unfortunately, ozone is a toxic gas. Therefore, the exposure to ozone must be strongly limited. It should be underlined that the sterilization of indoor air using ozone, especially when people are present in the indoor environment, can be performed only using a device continuously sampling air and sterilizing it inside this instrument. It is easy to understand that although the idea of such a device is quite simple, it is difficult to construct such an instrument which should meet different expectations.
The main objective of our study was to verify whether low-cost ozone generator equipped with a mesh and carbon filter will meet the following expectations: (1) high sterilization efficiency, (2) low emission of ozone, guaranteeing the concentration of ozone in the indoor environment meeting health standards and, (3) relatively low cost of the designed air purifier. In this paper, we report our work in this field. The following sections describe the experimental procedure, key results, and implications of these measurements.

2. Materials and Methods

2.1. Research Room and Experimental Conditions

The challenges associated with the non-uniform distribution of bioaerosols point to the experimental measurements being an appropriate method to evaluate the efficiency of portable air purifiers. For comparison of bioaerosol reduction with the use of a mobile air cleaning device, multiple experiments need to be conducted for the same environmental boundary conditions. For a residence in a house, they vary significantly due to the stochastic nature of external weather conditions, but in the laboratory environment, these parameters can be controlled [40]. Generally, airtight test chambers have mostly been used for the ranking of the individual air purifiers. Unfortunately, the mixtures of typical air pollutants introduced in the chamber at selected concentrations have higher concentrations than those of indoor environments [41]. In Polish apartments, an average bedroom, primarily a child bedroom, is characterized by a surface area of approx. 9 m2, so in our study, we used a laboratory room with a similar area equipped with a fume hood, both characterized in Table 2. During the test, environmental parameters, including temperature, relative humidity, PM10, and CO2 concentrations, were reported. An automatic portable monitor (model 77535, Az Instruments International Ltd., Hong Kong, China) connected to a PC with RS232 software installed was used to monitor the temperature, relative humidity, and CO2 concentrations. For PM10 monitoring, the TSI SidePak AM510 Personal Aerosol Monitor (TSI, Inc., Shoreview, MN, USA) was used. The SidePak is a portable, battery-operated device using a built-in sampling pump that continuously measures PM10. It uses the method of laser scattering and has proven useful in measuring exposure particles within the sampling area [42]. According to Mahyuddin et al. [43], one sensor in a room with a <100 m2 floor area has significant p-value relationships. Both monitors displayed and recorded in real-time the measurements of environmental parameters in the laboratory room (Table 2), which allows recorded data to be downloaded for analysis. The sampling interval was 1 min.

2.2. Air Purifier

The air purifier used in the study (Figure 1) includes VENTS, TT 150 duct fan (1), mesh filter (2), ozone generator (3), carbon filter (4). For the measurements of ozone concentrations, two air sampling pumps model 224-PCMTX8–SKC (SKC Inc., UK) (5), and set of scrubbers for collecting air samples for ozone determination according to [44] (6) were used. The fan (1) is used to induce constant flow through the air purifier. The mesh filter (2) is used to decrease the concentration of particulate matter (PM), it provides good filtration efficiency down to sizes of 2 to 10 μm [45].
Next is the ozone generator to sterilize the air from bacteria and fungi. Ozone was emitted by generator model OG-CP-7G with yield 7000 mg/h. It has to be underlined that commercial air purifiers are characterized by ozone emission rates from 16 μg/h to 220 mg/h [27,46]. Our low-cost solution is characterized by a significantly higher emission rate of ozone, so undoubtedly will be characterized by a high reduction in bioaerosols, but its high ozone emission can have a negative impact on the health of occupants.
The air purifier was operated in two modes. The first mode included the airflow through the fan (1), mesh filter (2), and ozone generator (3), while the second mode included the assembling of carbon filter (4) after ozone generator (3). The carbon filter was used to reduce the ozone emission into the laboratory room. The standard parameters of the carbon filter included: the mass of the activated carbon filter (90 g), the granulation of the activated carbon filter (0.5–1.0 mm), the specific surface of the activated carbon filter (900 m2/g), and the cross-sectional area of the activated carbon filter (0.042 m2). The carbon filter was added to reduce the O3 emission into the laboratory room, but the use of a carbon filter substantially decreases the air velocity (Table 3).

2.3. Bioaerosol Determination

The bacterial and fungal aerosol concentrations were measured by using an Air Ideal (AI) one-stage impactor (Figure 2). The air flow throughout AI was 100 dm3/minute, and the sampling time was 3 min. Every measurement was conducted before the air purifier was active—to determine the background, and also after 5 and 20 min of air purifier work.
Between each sampling, AI was disinfected. The disinfection was performed by the use of cotton balls immersed in 70% ethanol. Tryptic soy agar (TSA) with cycloheximide added to inhibit fungal growth was used for bacteria growth. At the same time, malt extract agar (MEA 2%) with chloramphenicol added to inhibit bacterial growth was used for fungal bioaerosol growth. Results were calculated as total colony counts which were corrected for multiple impactions by the positive hole method and expressed as colony-forming units per cubic meter of air (CFU/m3). As presented in our previous studies [47,48], to control the quality of the bioaerosols sampling and determination the authors followed PN-EN 12322 and ISO 11133 standards. The Shapiro–Wilk test checked the normality of distribution of the bacterial and fungal concentrations in construction without or with a carbon filter. The distributions were lognormal, so comparison at 0, 5, and 20 min without and with carbon filter were calculated using Student’s t-test. The Statistica Software v. 13 was used to perform all statistical analyses. All data are reported as means ± standard deviation (SD), and p-values less than 0.05 are accepted as statistically significant.

2.4. Ozone Determination

In the study, two methods of ozone determination were used. During measurements of bioaerosol reduction, the method was based on the ozone absorption in the potassium iodide solution and a colorimetric determination (SHIMADZU UV/VIS 2101PC) of iodine-based on the violet color of the reaction product with dimethyl-p-phenylenediamine. In order to collect the sample, 10 dm3 of the air is passed through two scrubbers containing 10 cm3 of a 1% KI solution at a rate of 1 dm3/min. To determine the ozone concentration in the samples the operator should follow the following instruction [49]:
  • take 5 cm3 of the absorbing solution from the scrubber and transfer it to a colorimetric tube,
  • add 0.5 cm3 of 0.02% dimethyl-p-phenylenediamine hydrochloride and mix it.
  • after 15 min, test the color of the solution in visible light (λ = 550 nm) in compare to earlier prepared scale of standards.
However, during ozone emission rate testing, the portable indoor air quality monitor Aeroqual series 500 (Aeroqual Limited Auckland, New Zealand) was used. It enables accurate real-time measurement of ozone in the air. Two sensor heads (OZL and OZH) were used. OZL (gas-sensitive semiconductor—GSS method) sensor measuring head enables to monitor ozone levels in the range 0–0.5 ppm, while the OZH sensor (gas-sensitive electrochemical—GSE method) determines the ozone level from 0.5 to 20 ppm. The resolution is 0.001 and 0.01 ppm, respectively [50]. The procedure of ozone decay rate measurement included the following steps:
  • in both cases (without or with carbon filter) the laboratory room was not ventilated,
  • ozone generation was turned on for 20 min (116 mg/min × 20 min), which corresponds to 2320 mg of generated O3,
  • after 20 min, the ozone generator was turned off,
  • in the case of an activated carbon filter, the flow remained constant of 180 m3/h,
  • time in which the ozone concentration dropped below the lowest limit value of 40 µg/m3 (Health Canada) was measured.
The measurement of mechanical ventilation use was also performed.

3. Results

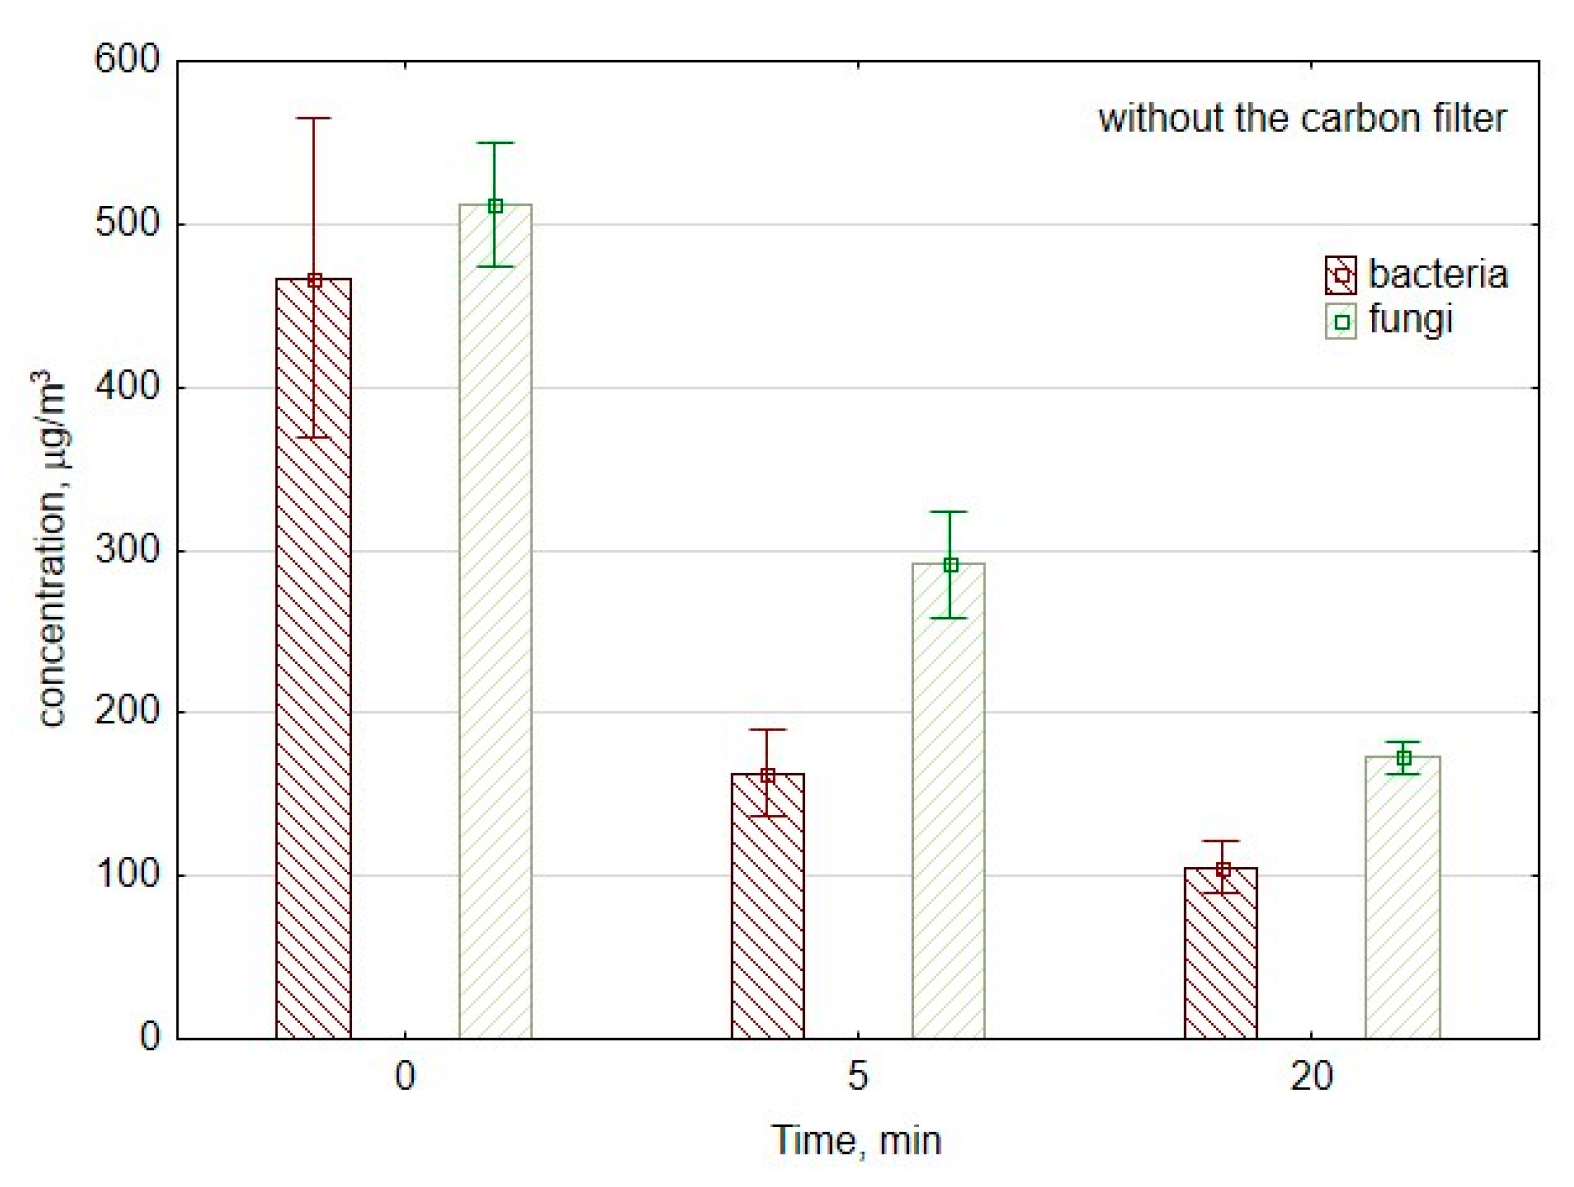
3.1. Bacterial And Fungal Aerosol Reduction with the Ozone Generator

Figure 3 shows changes in the number of CFU of bacteria and fungi per cubic meter of air at the beginning of measurements as well as after 5 and 20 min of work of the ozone generator. In the first 5 min, the concentration of bacterial aerosol decreased from 500 to 180 CFU/m3, which corresponds to the reduction speed of approx. 64 CFU/min. Between the 5th minute and 20th minute of ozone generation, the concentration of bacterial aerosol decreased significantly (p = 0.01) from 180 to 110 CFU/m3; the reduction speed was approx. 5 CFU/min.
In the case of culturable fungal spores, the concentration decreased significantly from 477 to 253 CFU/m3 (p = 0.01) during the first 5 min of ozone generation. So, during the first period of measurements, the reduction speed was approx. 45 CFU/min. Meanwhile, during the second period of measurements between the 5th minute and 20th minute, the reduction speed was significantly lower than approx. 5 CFU/min. This corresponds to the decrease from 253 to 179 CFU/m3 (p = 0.04), with and without a carbon filter.
Usually, for both bacteria and fungi, the reduction speed is higher at the beginning of ozone generation. In the beginning, there is substantial damage and deformity of the surface structure of ozone-treated microorganisms. The progressive degradation involves the changes in membrane permeability and cell integrity. During the next stage, there is the lysis reaction, which corresponds to the biological effect on cell viability [51].

3.2. Ozone Concentrations

As can be seen in Figure 4, after 5 min of ozone generation, the concentration of O3 increased to the hazardous level of 420.7 μg/m3. After 20 min of ozone generation, the concentration of ozone decreases significantly (p = 0.02) compared to the concentration level consistent with 5 min of work. This decrease is due to the decomposition time of ozone, which is approx. 20 min. Britigan et al. [27] pointed that O3 lifetime is moderately dependent on temperature variation and highly dependent on the presence of many reactive surfaces; for example, inside the car, the lifetime was only 2 min. In our study, after 20 min of air purification, the concentration of ozone remained at the level exceeding the acceptable O3 concentration (150 μg/m3) more than twice. Therefore, we installed a carbon filter after the ozone generator to decrease the emission of ozone into the room. Figure 4 presents the reduction in ozone concentration with the use of a carbon filter. The installation of carbon filer significantly (p < 0.01) decreased the level of O3 in the air from 420.7 to 222.6 μg/m3 and from 382.2 to 239.8 μg/m3 after 5 min and 20 min of the ozone generator work without and with a carbon filter, respectively. The concentration of ozone after 5 and 20 min of the ozone generator maintenance with carbon filter is not significantly different (p = 0.13), because the installation of carbon filter stabilizes the concentration of ozone.

3.3. Bacterial and Fungal Aerosol Reduction with Ozone Generator and Carbon Filter

Although the ozone levels between the 5th minute and 20th minute decrease without carbon filter or remain on the constant level with a carbon filter, respectively, the concentrations of bacterial and fungal aerosols significantly decrease.
Figure 5 presents changes in concentrations of fungi and bacteria in the laboratory room if the ozone generator was equipped with a carbon filter to reduce ozone emissions into the room. The use of carbon filter decreased the viable bacterial cells concentration with a similar reduction speed like without carbon filter approx. 6 CFU/min, the decrease was from 330 to 245 CFU/m3 (p = 0.001). The difference in the reduction speed was crucial in the first 5 min of ozone generation. It was 64 and 28 CFU/min without and with a carbon filter, respectively, which corresponds to the decrease from 500 to 180 CFU/m3 (p = 0.007) and 470 to 330 CFU/m3 (p = 0.001), respectively.
In the case of culturable fungal spores, the concentration decreased from 530 to 500 CFU/m3, so it was not as significant a difference (p = 0.51) as without a carbon filter. During the first period of measurements, the reduction speed was higher without carbon filter approx. 45 and 6 CFU/min with a carbon filter. Nevertheless, during the second period of measurements between the 5th minute and 20th minute, the reduction speed was higher with the carbon filter 12 CFU/min and approx. 5 CFU/min without a carbon filter. It corresponds to the decrease from 500 to 320 CFU/m3 (p = 0.03) and 253 to 179 CFU/m3 (p = 0.04), with and without a carbon filter, respectively.

3.4. The Efficiency of Bacterial and Fungal Aerosol Removal

During the use of ozone generator both without and with a carbon filter, the number of air changes in the room is not significantly different 7 and 6 h−1, respectively. However, the efficiency of reduction is significantly different. After just 5 min of work without a carbon filter, we observed (Table 4) a 64% reduction in bacterial particles and a 47% reduction in fungal spores. After 20 min of O3 generation, the concentrations of bacterial and fungal aerosols decreased by 78% and 63%, respectively. With a carbon filter, the reduction in bacterial and fungal aerosols is significantly lower, for bacteria 30% and 50% as well as 6% and 40% for fungi, after 5 and 20 min of ozone generation, respectively. However, in both cases, such a reduction level is sufficient for the users. Faster reduction in bacteria levels compared to fungi levels was observed because the fungal aerosol is generally more resistant to environmental and mechanical stress than bacterial aerosol [52,53,54].

3.5. Ozone Decay Rate

Since the use of carbon filter did not allow to reduce O3 concentration to the acceptable level below 150 μg/m3, we have decided to perform the measurements of the ozone decay rate. They were performed in two series at the same laboratory room (approx. 30 m3). The first series included ozone concentration measurements with ozone generator without a carbon filter; in the second series, the carbon filter was used. In the first case, the OZH sensor head with detection limit 0.01 ppm was used, while the second series was performed with the use of the OZL head with a detection limit of 0.001 ppm.
For both measurement sessions, the background concentration level was first monitored. Next, the air purifier was switched on, and the ozone generation started. The rapid increase in ozone concentration was observed. After 20 min, the homemade purifier was switched off, and the ozone concentration decay was further monitored for about 1.5 h. The highest concentrations of ozone have exceeded 3500 and 500 μg/m3, without and with a carbon filter, respectively (Figure 6). The decrease in ozone concentration provides the natural decay of ozone in the environmental test conditions. As can be seen from Figure 6, the ozone concentration in the case of a system without a carbon filter meets the acceptable Polish level 33 min after turning off the device, and, in the case of a system with a carbon filter, after 8 min.
The ozone decomposition rate was determined from O3 concentration changes in the reaction time. The reaction orders and rate constants were determined by the standard integral technique (1).
r = d [ O 3 ] d t = k 1 [ O 3 ] n
We also checked the decrease in ozone concentration with mechanical ventilation use. At the lowest available airflow of 820 m3/h and an air exchange rate of 27 h−1, the ozone concentration drops below the acceptable level after 2 min.
To interpret the monitored data of a decay mechanism of ozone during two separate experiments performed without and with a carbon filter, we calculated the empirical reaction order. The highest correlation coefficients point to first−order of the reaction (R2 = 0.95 and 0.99) with experimental decay constants 5.45 and 10.56 h−1 without and with a carbon filter, respectively. The first-order decay model was first used in the 1970s to interpret outdoor-originated ozone decay in the indoor environment [55,56,57].

4. Discussion

4.1. Effectiveness of Bioaerosol Removal by a Low-Cost Air Purifier

This study focuses on the efficiency of a homemade portable bioaerosol purifier consisting of an ozone generator preceded by mesh filter in the basic construction and in the second construction additionally equipped with a carbon filter to decrease the concentration of generated ozone. Both constructions proved effective in the removal of bacterial aerosol. However, the reduction in fungal aerosol levels with a carbon filter was effective after more extended use (20 min).
Commercial devices allow for reducing bioaerosol concentration with the effectiveness of 30% to 60% (Table 1). Our construction without carbon filter provides >60% of bacterial aerosol and 47.1% ± 20.7% to 62.6% ± 7.5% of fungal aerosol reduction. The achieved levels of reduction are similar to other, non-commercial devices. Huang et al. [36] reached 75–85% reduction in bacterial aerosol and 80–90% reduction in fungi, while Lee et al. [37] reported 79–82% reduction in bioaerosols. The reported levels are higher than in our more effective construction without a carbon filter; however, both reported devices used HEPA filters, which increase the cost of such an air purifier. Our construction is a low-cost device, the total value of which is comparable to the price of a single HEPA filter.
The construction with carbon filter allowed us to reduce bacterial and fungal aerosols to the level of 47.9% ± 9.9% and 39.6% ± 22.1%, respectively. Our levels of reduction are similar to the results of Shaughnessy et al. (42% ± 14%) [35], who used analogous construction elements: ozone generator, prefilter, and activated carbon. On the other hand, the bioaerosol reduction by commercial air purifiers allows for achieving 50% of bioaerosol reduction with a much higher cost of the device [11,17,20,21]. However, higher efficiency and lower costs of our construction require particular attention because of the accompanying emission of ozone into the room.

4.2. Ozone Threat

It is well known that ozone due to its oxidative power supports the biological decontamination of environments. However, the careless usage of any ozone generator available on the market can be hazardous to the consumers. Our study assessed the effectiveness of the ozonolysis air purification system in reducing the overall bacterial and fungal burden load throughout the laboratory room with an ozone generator and in the next step with the use of carbon filter. Both technical solutions ensure a significant reduction in bioaerosols. However, without a carbon filter, the concentration of O3 after 20 min of generation reached 160 ppb. Even though it does not exceed OSHA STEL (15-min exposure) limit 300 ppb, it is above OSHA PEL (8-h) exposure limit (100 ppb), and Polish PEL limit (60 ppb).
Our research included determination of O3 concentration decay due to decomposition; we based this on the ozone generation calculation method [58], based upon a generation-decay model:
V d C d t = E k V C
where V is the chamber volume (m3), C the ozone concentration (mg/m3), t the time (s), E the ozone generation rate by the unit tested (mg/s), k the decay constant due to various decomposition mechanisms (s−1). When no ozone emission source is present, i.e., when an air cleaner is off, we have E = 0, and then Equation (1) becomes:
d C C = k d t
where k represents the natural decay constant in the chamber when an air cleaner is not operating. We have obtained two ozone decay constants kwithout carbon filter and kwith carbon filter, which are 1.5×10⁻³ s−1 and 2.9×10⁻³ s−1. The solution is:
ln C C 0 = k ( t t 0 )
t t 0 = ln C C 0 k
where C0 (mg/m3) is the initial ozone concentration in the laboratory room, C (mg/m3) is the maximum ozone concentration that can be in the laboratory room, (e.g., COSHA= 0.241 mg/m3, CPoland = 0.150 mg/m3, and CCanada = 0.04 mg/m3), t (s) is time, and t0 = 0, k (s−1) represents the natural decay constant in the laboratory room when the air cleaner is not operating; we used separately kwithout carbon filter and kwith carbon filter.
The question is how long after turning-off a homemade air purifier can the occupants enter the room without a health threat. If we consider three permissible exposure limits for 8-h exposure (COSHA= 241 μg/m3, CPoland = 150 μg/m3, and CCanada = 40 μg/m3), after 20 min of ozone generation the air will meet the OSHA standard in 29 and 4 min without and with a carbon filter, respectively. The Polish standard will be preserved after 35 and 7 min, while the most restrictive Canadian standard will be preserved after 74 and 15 min without and with a carbon filter, respectively. As it can be seen, the installation of carbon filer decreases the O3 level below 100 ppb (241 μg/m3) in less than 5 min, but the decrease in O3 concentration to the safe level of 40 μg/m3 without using a carbon filter requires turning-off the ozone generator approx. 1.5 h before occupancy. Following Britigan et al. [27], it should be underlined that ozone decrease depends on the surface area of the room—in this case, the loss is dominated by heterogeneous removal on surfaces as well as on the total volume of the room, when the O3 decrease is dominated by air exchange.

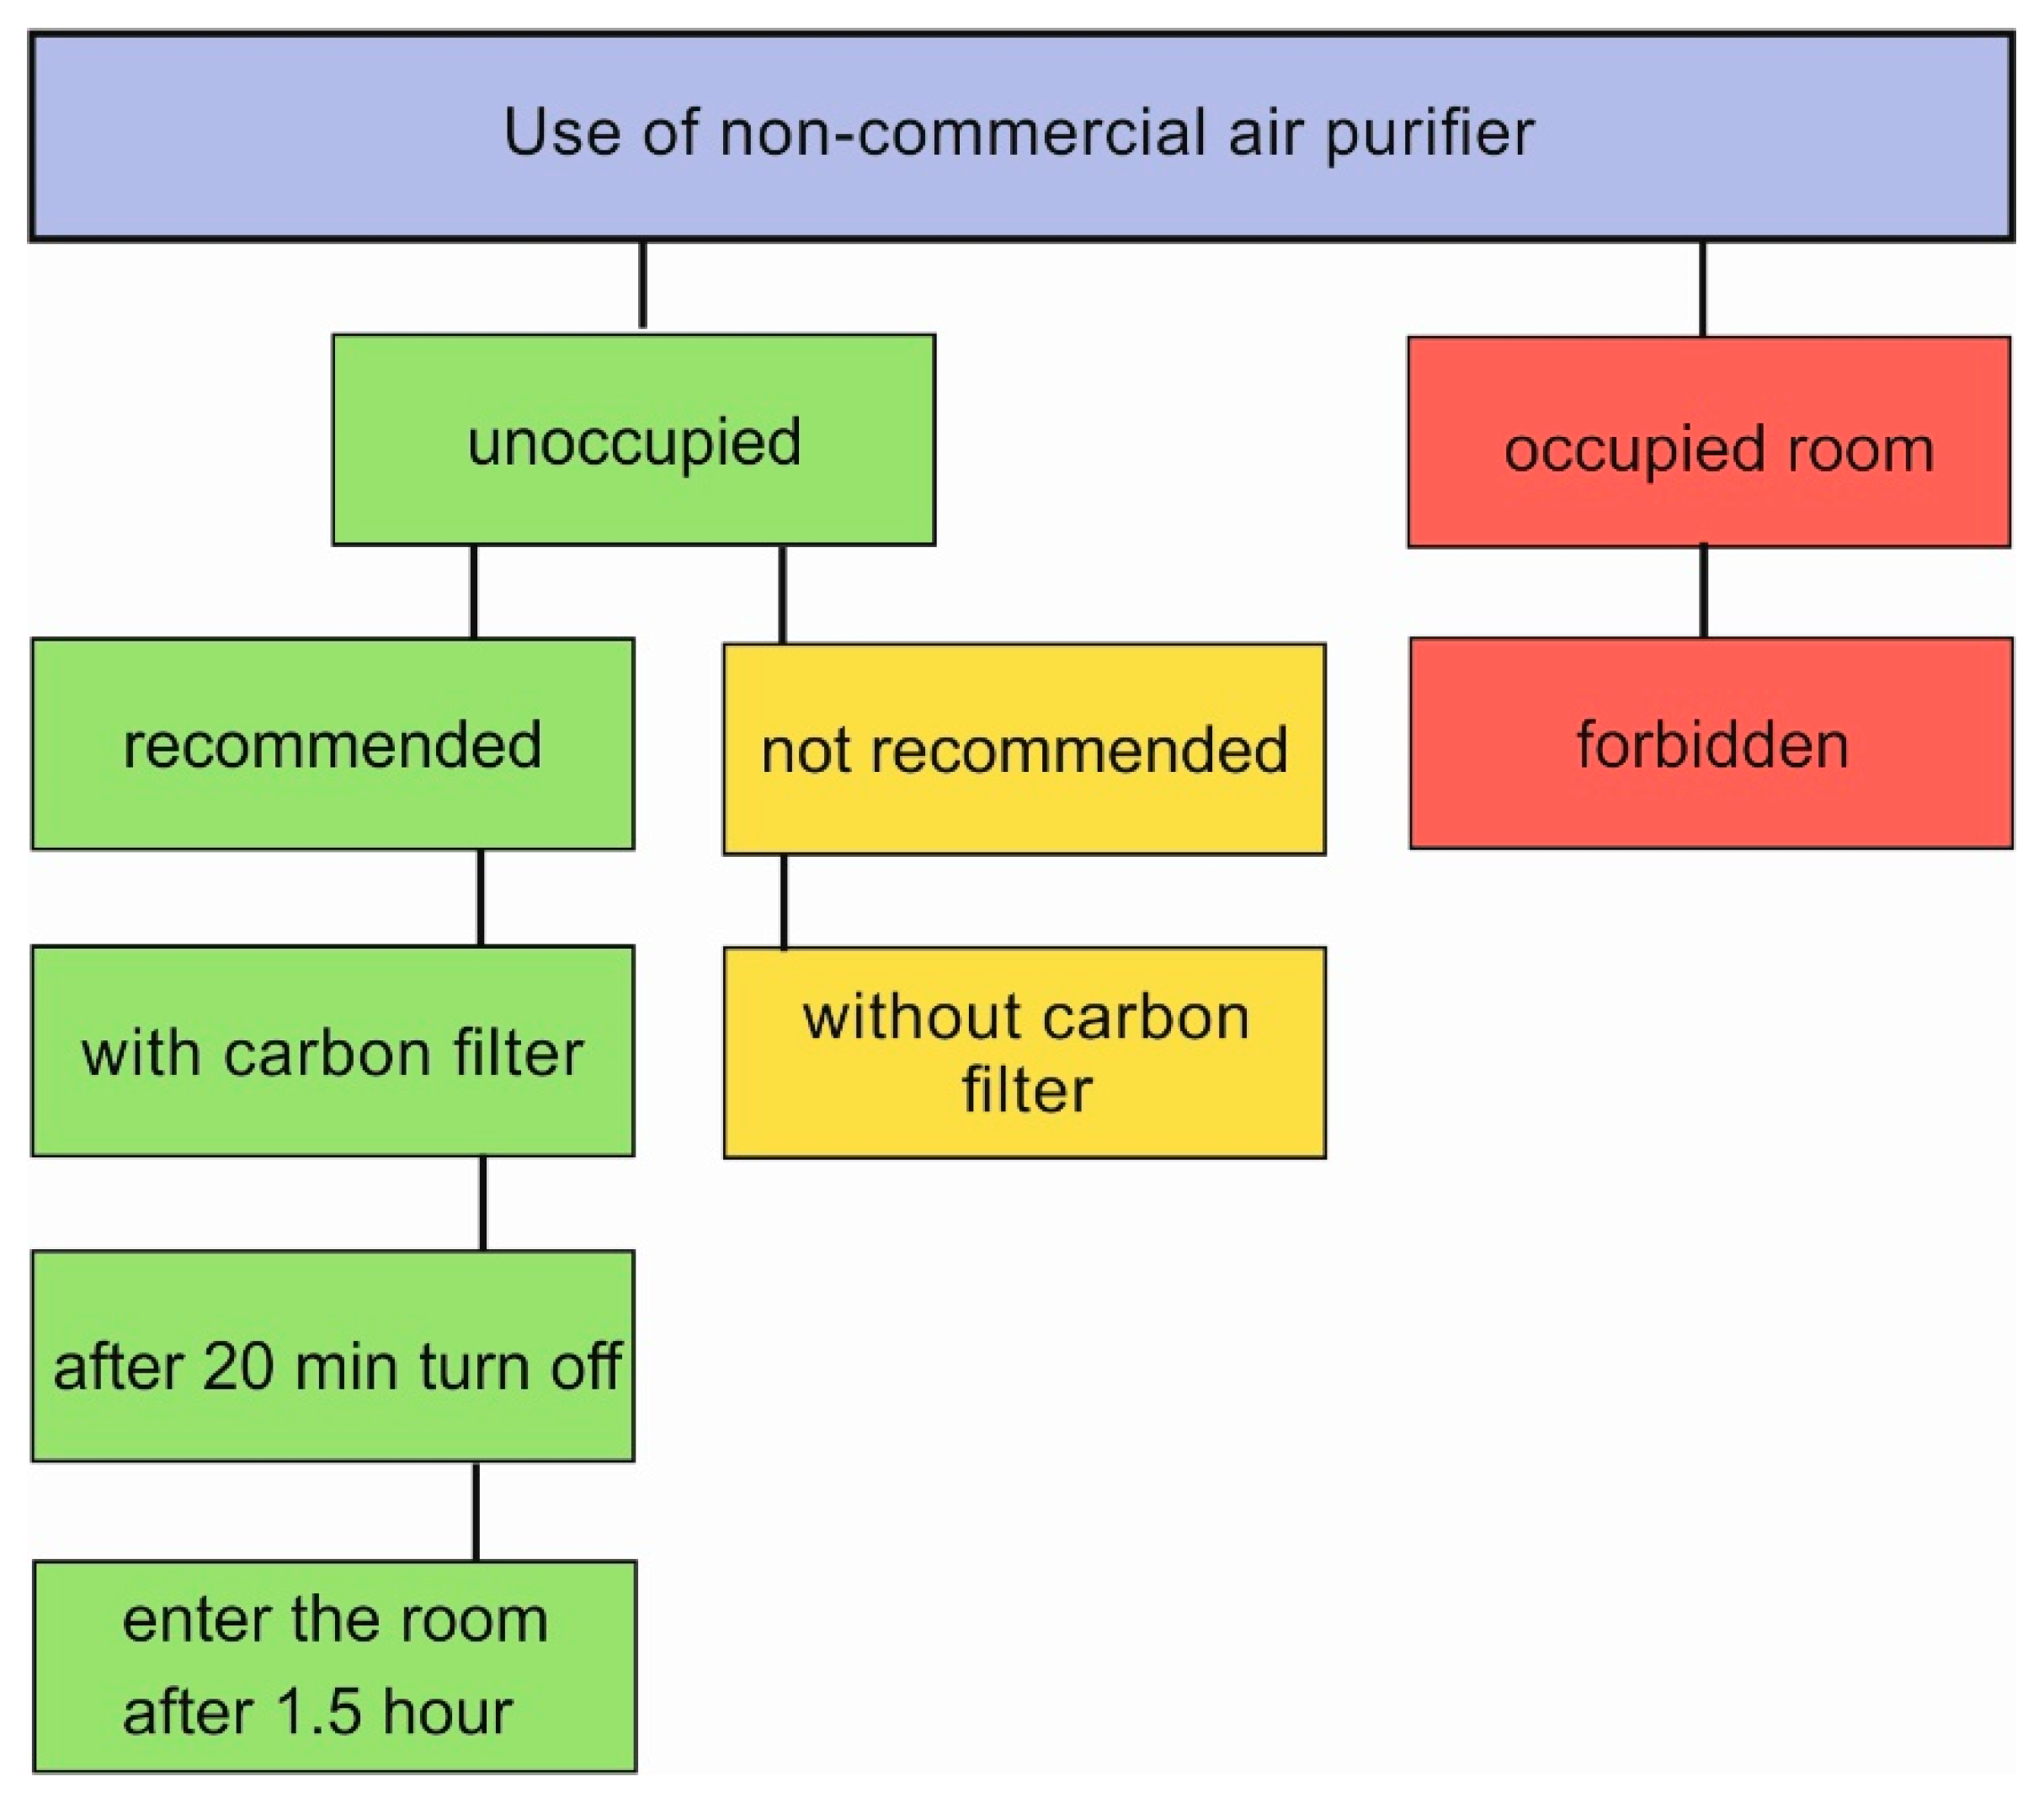
4.3. Implications for Health

To effectively control indoor air pollution, the flux of generated O3 should exceed permissible exposure limits, but to improve IAQ, health benefits are superior. As written in the introduction, high ozone levels (0.08–3 ppm) in indoor spaces are considered toxic and are associated with various health effects. Thiele et al. [59] reported that following a single 2 h exposure to 10 ppm of O3 and a 30 min exposure to air, the outermost skin layers of mice were significantly depleted of vitamins C and E. Furthermore, there was a dramatic increase in lipid peroxidation, as evidenced by increased concentrations of epidermal malondialdehyde (MDA). The research on pulmonary toxicity on the lungs of rats pointed out that rats exposed to 0.06 ppm of O3 for 5 days presented increased alveolar epithelium volume and cellular injury [15]. Beyond detrimental health effects of breathing O3-polluted air, ozone can react with indoor surfaces, such as carpets, linoleum, clothing, and furniture, releasing volatile oxidation products that may have adverse health effects. One of the examples is the reaction of O3 with volatile organic compounds (VOCs) found in many detergents, which produces aldehydes [27]; others include reactions with nitric oxide and some free radicals. There is evidence that the by-products may often be more irritating than the original reactants. Clausen et al. [60] exposed mice to a high concentration of ozone (3 ppm) and limonene (48 ppm) for 2 h. The mice experienced a 33% reduction in respiratory rate, while the individual compounds that were measured in the chamber could not explain this reduction. Although ozone generated by air purifiers in concentration about 0.05 ppm is defined as safe, either in the use of 3 h/day as well as 24 h/day [15], the health impacts of lower O3 levels are possible, particularly in more susceptible individuals such as children and persons with asthma or other respiratory diseases or allergies, and depend on the duration of exposure and breathing rate. The epidemiological studies document a dose—response relationship between the long-term exposure of O3 concentrations below 0.05 ppm, particularly in ambient air and human health, leading to a decrease in pulmonary function and broncho-provocation [31].
As our device is based on O3 emission, below please find a scheme (Figure 7) and instruction with the steps required for safe use. The authors recommend the use of the device with a carbon filter. The crucial feature is that the operation of the device in occupied places is forbidden. The device is designed to be used periodically, and the occupants can enter the room 1.5 h after turning it off. Intended or unintended entry to the room during the operation of the device is highly dangerous, due to O3 exposure.
Not following the instructions mentioned above can lead to pulmonary system effects, including inflammation, reflexes, and reduction in pulmonary defenses. Ozone affects pulmonary defenses by several mechanisms: the impairment of mucociliary clearance, decreased macrophage activity, and effects on circulating lymphocytes. These effects of short time exposure on immunity are acute, and recovery might take more than three days. Longer exposures can cause significant structural alterations to the lungs, characterized by diffuse mucus hyperplasia, bronchiolar narrowing and alveolar fibrosis. These alterations revert partially after finishing the exposure. Although uptake of ozone is almost exclusively by inhalation, there is also a possibility that some effects can be detected in the tear duct epithelial cells [31]. If the user must enter the room during air ozonolysis, breathing through the nose is recommended, because ozone removal in the upper respiratory tract is lower for oral than for nasal inhalation.

5. Conclusions

The following conclusions regarding the use of low-cost portable air cleaner for removing bacterial and fungal aerosols can be drawn based on laboratory tests reported here.
To summarize our results, we demonstrated the purification of air by a low-cost ozone generator. However, it is highly effective but requires an ozone reduction solution, e.g., carbon filter, as well as periodical operation to ensure a safe environment for the users.
Generally, there is a belief among users that if something is easy to buy, it is checked and safe for the user. Unfortunately, many easily accessible technologies can be harmful to users. Hence, further studies are necessary to compare different low-cost air filtration and purification products to develop meaningful outcomes regarding their impact on human health.
Following Hashimoto and Kawakami [24], we have to underline the limitations of our study. The experiments were performed in a laboratory room to minimize fluctuations in the number of airborne microbes due to external factors. Houses are less airtight and contain many obstacles; however, the amount of in-house microbe generation (CFU/h) and ventilation (m3/h), which affect the microbial concentration, differ among houses.
Although our ozone generator is dedicated to killing bacteria and fungi indoors, a new global epidemic of coronavirus requires consideration of whether this device can also be used to destroy coronavirus. The new coronavirus is considered to be an “enveloped virus”. Enveloped viruses are usually more sensitive to physicochemical challenges than naked viruses (without an envelope). In addition, ozone has been shown to kill the SARS coronavirus. Since the structure of the new 2019-nCoV coronavirus is almost identical, we believe that it will also work on the new coronavirus. It is also known that ozone destroys this type of virus, breaking through the outer shell to the core, causing damage to the viral RNA. Ozone can also damage the outer layer of the virus in a process called oxidation. However, this problem requires further investigation.

Author Contributions

Conceptualization A.M., W.M. and J.S.P.; methodology A.M. and W.M.; formal analysis E.B.; investigation A.J.; data curation W.M.; writing—original draft preparation A.M.; writing—review and editing A.M. and J.S.P.; visualization A.M. and W.M.; supervision, A.M. and W.M. All authors have read and agreed to the published version of the manuscript.

Funding

This research was funded by the Faculty of Energy and Environmental Engineering, Silesian University of Technology, Poland (statutory research).

Acknowledgments

The authors would like to thank Jan Kaczmarczyk and Monika Blaszczok for technical support (sharing the portable indoor air quality monitor Aeroqual—series 500 for O3 decay rate measurements).

Conflicts of Interest

The authors declare no conflict of interest.

References

  1. Jiayu, C.; Qiaoqiao, R.; Feilong, C.; Chen, L.; Jiguo, W.; Zhendong, W.; Lingyun, C.; Liu, R.; Guoxia, Z. Microbiology Community Structure in Bioaerosols and the Respiratory Diseases. J. Environ. Sci. Public Health 2019, 3, 347–357. [Google Scholar] [CrossRef]
  2. Brągoszewska, E.; Biedroń, I.; Hryb, W. Microbiological air quality and drug resistance in airborne bacteria isolated from a waste sorting plant located in poland—A case study. Microorganisms 2020, 8, 202. [Google Scholar] [CrossRef] [PubMed] [Green Version]
  3. Wéry, N. Bioaerosols from composting facilities-a review. Front. Cell. Infect. Microbiol. 2014, 4, 42. [Google Scholar] [PubMed]
  4. Pearson, C.; Littlewood, E.; Douglas, P.; Robertson, S.; Gant, T.W.; Hansell, A.L. Exposures and health outcomes in relation to bioaerosol emissions from composting facilities: A systematic review of occupational and community studies. J. Toxicol. Environ. Health B Crit. Rev. 2015, 18, 43–69. [Google Scholar] [CrossRef] [PubMed]
  5. Fung, F.; Hughson, W.G. Health Effects of Indoor Fungal Bioaerosol Exposure. Appl. Occup. Environ. Hyg. 2003, 18, 535–544. [Google Scholar] [CrossRef]
  6. Douwes, J.; Thorne, P.; Pearce, N.; Heederik, D. Bioaerosol health effects and exposure assessment: Progress and prospects. Ann. Occup. Hyg. 2003, 47, 187–200. [Google Scholar] [PubMed] [Green Version]
  7. Kim, K.H.; Kabir, E.; Jahan, S.A. Airborne bioaerosols and their impact on human health. J. Environ. Sci. China 2018, 67, 23–35. [Google Scholar] [CrossRef]
  8. Górny, R.L. Microbial Aerosols: Sources, Properties, Health Effects, Exposure Assessment—A Review. KONA Powder Part. J. 2020, 37, 264–285. [Google Scholar] [CrossRef] [Green Version]
  9. Gunschera, J.; Markewitz, D.; Bansen, B.; Salthammer, T.; Ding, H. Portable photocatalytic air cleaners: Efficiencies and by-product generation. Environ. Sci. Pollut. Res. 2016, 23, 7482–7493. [Google Scholar] [CrossRef]
  10. Shaughnessy, R.J.; Sextro, R.G. What is an effective portable air cleaning device? A review. J. Occup. Environ. Hyg. 2006, 3, 169–181. [Google Scholar] [CrossRef]
  11. Grinshpun, S.A.; Mainelis, G.; Trunov, M.; Adhikari, A.; Reponen, T.; Willeke, K. Evaluation of ionic air purifiers for reducing aerosol exposure in confined indoor spaces. Indoor Air 2005, 15, 235–245. [Google Scholar] [CrossRef] [PubMed]
  12. Salonen, H.; Salthammer, T.; Morawska, L. Human exposure to ozone in school and office indoor environments. Environ. Int. 2018, 119, 503–514. [Google Scholar] [CrossRef] [PubMed]
  13. Siegel, J.A. Primary and secondary consequences of indoor air cleaners. Indoor Air 2016, 26, 88–96. [Google Scholar] [CrossRef] [PubMed]
  14. Hubbard, H.F.; Coleman, B.K.; Sarwar, G.; Corsi, R.L. Effects of an ozone-generating air purifier on indoor secondary particles in three residential dwellings. Indoor Air 2005, 15, 432–444. [Google Scholar] [CrossRef] [PubMed]
  15. Cestonaro, L.V.; Marcolan, A.M.; Rossato-Grando, L.G.; Anzolin, A.P.; Goethel, G.; Vilani, A.; Garcia, S.C.; Bertol, C.D. Ozone generated by air purifier in low concentrations: Friend or foe? Environ. Sci. Pollut. Res. 2017, 24, 22673–22678. [Google Scholar] [CrossRef] [PubMed]
  16. Boeniger, M.F. Use of ozone generating devices to improve indoor air quality. Am. Ind. Hyg. Assoc. J. 1995, 56, 590–598. [Google Scholar] [CrossRef]
  17. Cheng, K.C.; Park, H.K.; Tetteh, A.O.; Zheng, D.; Ouellette, N.T.; Nadeau, K.C.; Hildemann, L.M. Mixing and sink effects of air purifiers on indoor PM2.5 concentrations: A pilot study of eight residential homes in Fresno, California. Aerosol Sci. Technol. 2016, 50, 835–845. [Google Scholar] [CrossRef] [Green Version]
  18. Zhang, Y.; Mo, J.; Li, Y.; Sundell, J.; Wargocki, P.; Zhang, J.; Little, J.C.; Corsi, R.; Deng, Q.; Leung, M.H.K.; et al. Can commonly-used fan-driven air cleaning technologies improve indoor air quality? A literature review. Atmos. Environ. 2011, 45, 4329–4343. [Google Scholar] [CrossRef]
  19. Custovic, A.; Smith, A.; Green, R.; Woodcock, A. Distribution and aerodynamic characteristics of major cat allergen Fel d 1. Thorax 1996, 51, 33–38. [Google Scholar]
  20. Gherasim, A.; Jacob, A.; Schoettel, F.; Domis, N.; de Blay, F. Efficacy of air cleaners in asthmatics allergic to cat in ALYATEC® environmental exposure chamber. Clin. Exp. Allergy 2020, 50, 160–169. [Google Scholar] [CrossRef] [Green Version]
  21. Punsmann, S.; Van Der Graaf, T.; Zahradnik, E.; Czibor, C.; Raulf, M.; Sander, I.; Punsmann, S.; Zahradnik, E.; Czibor, C.; Raulf, M.; et al. Effectiveness of a portable air filtration device in reducing allergen exposure during household chores. Allergo J. Int. 2019, 28, 299–307. [Google Scholar] [CrossRef]
  22. Polidori, A.; Fine, P.M.; White, V.; Kwon, P.S. Pilot study of high-performance air filtration for classroom applications. Indoor Air 2013, 23, 185–195. [Google Scholar] [CrossRef] [PubMed]
  23. Scheepers, P.T.J.; De Hartog, J.J.; Reijnaerts, J.; Beckmann, G.; Anzion, R.; Poels, K.; Godderis, L. Influence of combined dust reducing carpet and compact air filtration unit on the indoor air quality of a classroom. Environ. Sci. Process. Impacts 2015, 17, 316–325. [Google Scholar] [CrossRef]
  24. Hashimoto, K.; Kawakami, Y. Effectiveness of Airborne Fungi Removal by using a HEPA Air Purifier Fan in Houses. Biocontrol Sci. 2018, 23, 215–221. [Google Scholar] [CrossRef] [PubMed] [Green Version]
  25. Vyas, S.; Srivastav, N.; Spears, D. An experiment with air purifiers in delhi during winter 2015–2016. PLoS ONE 2016, 11, 1–20. [Google Scholar] [CrossRef] [PubMed] [Green Version]
  26. How to Buy the Best Air Purifier. CHOICE. Available online: https://www.choice.com.au/home-and-living/cooling/air-purifiers/buying-guides/air-purifiers (accessed on 5 September 2019).
  27. Britigan, N.; Alshawa, A.; Nizkorodov, S.A. Quantification of ozone levels in indoor environments generated by ionization and ozonolysis air purifiers. J. Air Waste Manag. Assoc. 2006, 56, 601–610. [Google Scholar] [CrossRef] [PubMed] [Green Version]
  28. Nagda, N.L. Air Quality and Comfort in Airliner Cabins; ASTM: Chelsea, MI, USA, 2000; ISBN 0803128665. Available online: https://books.google.pl/books?id=41mdymdg0cwC&pg=PA208&lpg=PA208&dq=28.+Nagda,+N.L.+Air+Quality+and+Comfort+in+Airliner+Cabins;+ASTM&source=bl&ots=YubnoN5U7k&sig=ACfU3U0VONopy27atgomJMihPXBdJXu_Cg&hl=pl&sa=X&ved=2ahUKEwiWq7mOjtnpAhUrBhAIHd1WCZMQ6AEwAHoECAcQAQ#v=onepage&q=28.%20Nagda%2C%20N.L.%20Air%20Quality%20and%20Comfort%20in%20Airliner%20Cabins%3B%20ASTM&f=false (accessed on 30 August 2019).
  29. Phillips, T.J.; Bloudoff, D.P.; Jenkins, P.L.; Stroud, K.R. Ozone emissions from a “personal air purifier”. J. Expo. Anal. Environ. Epidemiol. 1999, 9, 594–601. [Google Scholar] [CrossRef] [Green Version]
  30. Kowalska, M.; Zajusz-Zubek, E. Occupational exposure to ozone in workers using photocopiers and printers. Medycyna Pracy 2010, 61, 549–551. (In Polish) [Google Scholar]
  31. WHO. Air Quality Guidelines for Particulate Matter, Ozone, Nitrogen Dioxide and Sulfur Dioxide; WHO: Geneva, Switzerland, 2006. [Google Scholar]
  32. Dz.U.1286 Regulation of the Minister of Family, Labor and Social Policy regarding the highest permissible concentrations and intensities of harmful factors in the work environment. Pol. J. Laws 2018. Available online: http://www.ilo.org/dyn/natlex/natlex4.detail?p_lang=en&p_isn=99664 (accessed on 26 August 2019). (In Polish).
  33. Health Canada Residential Indoor Air Quality Guideline: Ozone. Available online: www.canada.ca/content/dam/canada/health-canada/migration/healthy-canadians/publications/healthy-living-vie-saine/ozone/alt/ozone-eng.pdf (accessed on 31 October 2019).
  34. Penney, D.; Benignus, V.; Kephalopoulos, S.; Kotzias, D.; Kleinman, M. Agnes Verrier Guidelines for indoor air quality. WHO Guidel. 2010, 9, 454. [Google Scholar]
  35. Shaughnessy, R.J.; Levetin, E.; Blocker, J.; Sublette, K.L. Effectiveness of Portable Indoor Air Cleaners: Sensory Testing Results. Indoor Air 1994, 4, 179–188. [Google Scholar] [CrossRef]
  36. Huang, R.; Agranovski, I.; Pyankov, O.; Grinshpun, S. Removal of viable bioaerosol particles with a low-efficiency HVAC filter enhanced by continuous emission of unipolar air ions. Indoor Air 2008, 18, 106–112. [Google Scholar] [CrossRef] [PubMed]
  37. Lee, J.H.; Kim, J.Y.; Cho, B.B.; Anusha, J.R.; Sim, J.Y.; Raj, C.J.; Yu, K.H. Assessment of air purifier on efficient removal of airborne bacteria, Staphylococcus epidermidis, using single-chamber method. Environ. Monit. Assess. 2019, 191, 1–10. [Google Scholar] [CrossRef] [PubMed] [Green Version]
  38. Bischoff, W.; Russell, G.; Willard, E.; Stehle, J. Impact of a novel mobile high-efficiency particulate air-ultraviolet air recirculation system on the bacterial air burden during routine care. Am. J. Infect. Control 2019, 47, 1025–1027. [Google Scholar] [CrossRef] [PubMed]
  39. Alexis, N.E.; Becker, S.; Bromberg, P.A.; Devlin, R.; Peden, D.B. Circulating CD11b expression correlates with the neutrophil response and airway mCD14 expression is enhanced following ozone exposure in humans. Clin. Immunol. 2004, 111, 126–131. [Google Scholar] [CrossRef] [PubMed]
  40. Novoselac, A.; Siegel, J.A. Impact of placement of portable air cleaning devices in multizone residential environments. Build. Environ. 2009, 44, 2348–2356. [Google Scholar] [CrossRef]
  41. Pichat, P. A brief survey of the practicality of using photocatalysis to purify the ambient air (indoors or outdoors) or air effluents. Appl. Catal. B Environ. 2019, 245, 770–776. [Google Scholar] [CrossRef]
  42. Travers, M.J.; Kulak, J.A.; Vogl, L. Waterpipe cafés are hazardous to your health: Determination of a waterpipe specific calibration factor. Int. J. Hyg. Environ. Health 2018, 221, 48–53. [Google Scholar] [CrossRef]
  43. Mahyuddin, N.; Awbi, H.B. A Review of CO2 measurement procedures in ventilation research. Int. J. Vent. 2012, 10, 353–370. [Google Scholar] [CrossRef]
  44. PN-Z-04007-2. Protection of Air Purity—Ozone Content Tests—Determination of Ozone in the Presence of Nitrogen Oxides at Workplaces Using Spectrophotometric Method in Visible Light; Polish Committee for Standarization: Warsaw, Poland, 1994. (In Polish) [Google Scholar]
  45. Liu, G.; Xiao, M.; Zhang, X.; Gal, C.; Chen, X.; Liu, L.; Pan, S.; Wu, J.; Tang, L.; Clements-Croome, D. A review of air filtration technologies for sustainable and healthy building ventilation. Sustain. Cities Soc. 2017, 32, 375–396. [Google Scholar] [CrossRef]
  46. Guo, C.; Gao, Z.; Shen, J. Emission rates of indoor ozone emission devices: A literature review. Build. Environ. 2019, 158, 302–318. [Google Scholar] [CrossRef]
  47. Brągoszewska, E.; Mainka, A.; Pastuszka, J.S. Bacterial aerosols in an urban nursery school in Gliwice, Poland: A case study. Aerobiologia (Bologna) 2016, 32, 469–480. [Google Scholar]
  48. Brągoszewska, E.; Mainka, A.; Pastuszka, J. Bacterial and Fungal Aerosols in Rural Nursery Schools in Southern Poland. Atmosphere (Basel) 2016, 7, 142. [Google Scholar] [CrossRef] [Green Version]
  49. Pastuszka, J.S.; Mucha, W.; Wlazło, A.; Lis, D.; Marchwińska-Wyrwał, E.; Mainka, A. The study of the sterilization of the indoor air in hospital/clinic rooms by using the electron wind generator. Int. J. Environ. Res. Public Health 2019, 16, 4935. [Google Scholar] [CrossRef] [PubMed] [Green Version]
  50. Aeroqual Limited, Aeroqual Aeroqual Series 200, 300 & 500 User Guide MRK-D-0022V3.1. Auckland New Zeland. Available online: https://www.aeroqual.com/wp-content/uploads/Series-200-300-500-Portable-Monitor-User-Guide-11-14.pdf (accessed on 5 September 2019).
  51. Thanomsub, B.; Anupunpisit, V.; Chanphetch, S.; Watcharachaipong, T.; Poonkhum, R.; Srisukonth, C. Effects of ozone treatment on cell growth and ultrastructural changes in bacteria. J. Gen. Appl. Microbiol. 2002, 48, 193–199. [Google Scholar] [CrossRef] [PubMed] [Green Version]
  52. Tang, J.W. The effect of environmental parameters on the survival of airborne infectious agents. J. R. Soc. Interface 2009, 6, S737–S746. [Google Scholar] [CrossRef] [PubMed] [Green Version]
  53. Lin, W.H.; Li, C.S. Associations of fungal aerosols, air pollutants, and meteorological factors. Aerosol Sci. Technol. 2000, 32, 359–368. [Google Scholar] [CrossRef]
  54. Moore, G.; Griffith, C.; Peters, A. Bactericidal properties of ozone and its potential application as a terminal disinfectant. J. Food Prot. 2000, 63, 1100–1106. [Google Scholar] [CrossRef]
  55. Sabersky, R.H.; Sinema, D.A.; Shair, F.H. Concentrations, decay rates, and removal of ozone and their relation to establishing clean indoor air. Environ. Sci. Technol. 1973, 7, 347–353. [Google Scholar] [CrossRef]
  56. Mueller, F.X.; Loeb, L.; Mapes, W.H. Decomposition rates of ozone in living areas. Environ. Sci. Technol. 1973, 7, 342–346. [Google Scholar] [CrossRef]
  57. Shair, F.H.; Heitner, K.L. Theoretical model for relating indoor pollutant concentrations to those outside. Environ. Sci. Technol. 1974, 8, 444–451. [Google Scholar] [CrossRef]
  58. Niu, J.; Thung, T.C.W.; Burnett, J. Ozone emission rate testing and ranking method using environmental chamber. Atmos. Environ. 2001, 35, 2143–2151. [Google Scholar] [CrossRef]
  59. Thiele, J.E.N.S.J.T.; Raber, M.A.G.T.; Sang, K.E.T.; Ross, C.A.E.C.; Acker, L.E.P. In vivo exposure to ozone depletes vitamins c and e and induces lipid peroxidation in epidermal layers of murine skin. Free Radic. Biol. Med. 1997, 23, 385–391. [Google Scholar] [CrossRef]
  60. Clausen, P.A.; Wilkins, C.K.; Wolkoff, P.; Damga, G. Chemical and biological evaluation of a reaction mixture of R-(+) -limonene/ozone Formation of strong airway irritants. Environ. Int. 2001, 26, 511–522. [Google Scholar] [CrossRef]
Figure 1. Construction of air purifier used in the study.
Buildings 10 00104 g001
Figure 2. Air Ideal (AI) one-stage impactor used during the study.
Buildings 10 00104 g002
Figure 3. The concentration of bacterial and fungal aerosols during the work of air purifier consisting of mesh filter and ozone generator. The data represent the average values and the standard deviations of six measurements.
Buildings 10 00104 g003
Figure 4. The concentration of ozone during the work of air purifiers with and without carbon filter. The data represent the average values and the standard deviations of six measurements.
Buildings 10 00104 g004
Figure 5. The average concentration of bacterial and fungal aerosols during the work of air purifier consisting of mesh filter, ozone generator, and carbon filter. The data represent the average values and the standard deviations of six measurements.
Buildings 10 00104 g005
Figure 6. The rate of ozone reduction during the work of air purifier with and without a carbon filter.
Buildings 10 00104 g006
Figure 7. The scheme with maintenance instruction of non-commercial air purifier.
Buildings 10 00104 g007
Table 1. Selected air cleaning devices.
DeviceMechanismReductionReferences
Ozone generatorWith prefilter, primary glass media filter, a 0.45 kg granular activated carbon filter, ion generating pulsating section, and ozone generating sectionDust 29% ± 1%
Total spores 42% ± 14%
Viable spores 38% ± 29%
[35]
AS150G(Wein Products, Inc. (Los Angeles, CA, USA)), AS150GX(Wein Products, Inc. (Los Angeles, CA, USA)), AS250B(Wein Products, Inc. (Los Angeles, CA, USA)), AS1250((Wein Products, Inc. (Los Angeles, CA, USA),
VI-2500 (Wein Products, Inc. (Los Angeles, CA, USA)
Ionic air purifiersRespirable bacteria 50% after 15 min
almost 100% after 1.5 h
[11]
Not commercial device Negative ion emitter and HVAC filterBacteria 75–85%
(20% without ion emitter)
Fungi 80–90%
(40–60% without ion emitter)
[36]
Air purifier (model AX9000, Samsung,
Suwon, Korea)
HEPA filters for air filtration and is reported by the manufacturer to have a Clean Air Delivery Rate (CADR) up to 1000 m3/h.Endotoxin 29–37%[17]
Not commercial deviceHEPA filter device and UV filterBioaerosols 79–82%[37]
Aerobiotix Illuvia 500uv system (Aerobiotix, West Carrollton, OH, USA)Combining HEPA filtration, zirconium-based Photochemical oxidation, and germicidal UV irradiationBioaerosols 41%[38]
Philips AP (AC3256)Equipped with a HEPA and an activated carbon filterCat and dog allergen 60%[21]
Pure Air XL® PU6020F0 model RowentaHEPA filtersCat allergen 35%[20]
Table 2. Characteristics of laboratory room, fume hood, and environmental conditions.
ParameterFume HoodLaboratory Room
Length, m1.43.8
Height, m1.33.2
Width, m0.72.5
Volume, m31.330.4
Environmental conditionsAverageSD
Temperature, °C18.60.5
Relative humidity, %39.13.9
PM10, µg/m320.05.0
CO2, ppm363.622.5
Table 3. Characteristics of air purifiers with and without carbon filter.
ParameterAir Purifier
without Carbon Filterwith Carbon Filter
Average air velocity through the air purifier, m/s1.431.18
Average airflow through the air purifier, m3/h218180
The number of the air exchange rate in the room, h−176
Table 4. The average efficiency of air purifier with and without carbon filter (n = 24).
ParameterAir Purifier
without Carbon Filterwith Carbon Filter
Time of work, min520520
Reduction in bacterial aerosol, %64.0 ± 8.978.0 ± 6.029.8 ± 7.047.9 ± 9.9
Reduction in fungal aerosol, %47.1 ± 20.762.6 ± 7.55.7 ± 20.339.6 ± 22.1

