1. Introduction
Recent advancements in performance-based earthquake engineering have pointed out the importance of non-structural elements (NSEs) both in the seismic design of new buildings and in the assessment of existing ones. Although the performance-based concept is starting to become widely incorporated in building codes and standards [
1,
2], its application to NSEs is still an open issue. The need for the harmonization of the structural and non-structural seismic performance has been largely demonstrated during past seismic events. Following the 2010 Chile earthquake, for example, the Santiago International Airport was closed for several days because of the severe damage to piping systems interacting with ceiling systems [
3]. During that same earthquake, four hospitals completely lost their functionality and over 10 lost almost 75% of their functionality due to damage to sprinkler piping systems [
3]. Similarly, post-earthquake surveys carried out by Perrone et al. [
4] following the 2016 Central Italy earthquake identified significant damage to NSEs in critical facilities such as city halls, factories, hospitals, and schools. Major damage was reported to ceiling systems, partitions, piping systems, and shelves.
In this NSE-related context, the seismic performance assessment of existing critical facilities, such as hospital buildings, is of paramount importance to guarantee the life safety of the occupants and to provide the first aids to the increasing number of patients that are driven to the health facilities in the aftermath of the seismic event [
5]. Hospital buildings are on the center of the entire healthcare system and represent the final point of the rescue chain in the disaster response of entire communities. Any hospital is a complex system in which each component has its own role in the cascade loss of functionality. To guarantee the immediate post-event functionality of hospital buildings, a particular deal of attention should be paid to the seismic performance of NSEs, especially at the serviceability limit states. Furthermore, previous studies pointed out that at low seismic intensities, the NSEs also provide the highest contribution to expected annual losses [
6,
7] in critical facilities, in addition to significantly affecting the functionality of the buildings. For this reason, hospital buildings represent one of the most important examples of the need for harmonization of the structural and non-structural performance at multiple limit states.
To deal with this issue, an accurate estimation of the seismic demand to which the NSEs are subjected is required. Once the seismic demand has been evaluated, the improvement of the seismic performance of NSEs can be achieved by means of different strategies that depend on the non-structural configuration and on the engineering demand parameter (EDP) to which the NSEs are more sensitive (e.g., floor accelerations or interstorey drift). In some cases, simple mitigation details can guarantee the achievement of performance objectives for each limit state, while for more complex systems an accurate design of connections and bracing systems is required [
8,
9]. However, the estimation of the seismic demand for NSEs is not a simple task, as demonstrated by numerous past research studies dealing with the evaluation of simplified methodologies to predict peak floor acceleration profiles, interstorey drifts, and floor response spectra [
10,
11,
12,
13,
14,
15,
16]. National and international codes provide some simplified formulations to calculate the seismic demand on NSEs and, consequently, the equivalent static force to be applied at the center of mass of the NSE to perform the design and/or the assessment [
1,
2]. However, recent studies [
11,
12,
13,
14,
15,
16] pointed out the inaccuracy of such formulations and the need for further investigations to improve the prediction of peak floor acceleration, interstorey drifts, and floor response spectra.
This paper deals with the estimation of the seismic demand on NSEs, applied to a case-study hospital building. Following a statistical analysis on the main features (i.e., building materials, structural typologies, geometric configurations) of hospital buildings in Italy, a case-study building representative of typical existing reinforced concrete (RC) hospital structures built in Italy between 1960 and 1980 was selected. Considering the importance of the serviceability limit states for critical facilities, as well as the higher influence of NSEs in the loss of functionality, the study focuses on two low return periods (RPs) of the seismic intensity. Peak floor acceleration profiles, interstorey drifts, absolute acceleration, and relative displacement floor response spectra were selected as EDPs, calculated and discussed. Lastly, the results were compared with the seismic demand evaluated using simplified formulations proposed by the main international codes.
2. Case-Study Hospital Building
The data reported by the Italian Institute of Statistics (ISTAT) points out that in Italy, there are more than one thousand hospital buildings [
17] and that most of them were built in the period between 1960 and 1980, before the introduction of modern seismic codes. The percentage of buildings characterized by a RC structural system is significantly higher with respect to the masonry ones [
18]. This is also a consequence of the in-plan and in-elevation irregularity. In fact, hospital buildings are often characterized by complex geometrical configurations and several floors generally higher, with respect to residential buildings. Although for residential buildings the number of floors generally ranges between two and six, for hospital buildings it is not unusual to observe buildings with up to 8–10 floors.
Following these considerations, a hospital building that can be considered representative of typical hospital configurations in Italy was selected in this study to assess the seismic demand on NSEs at serviceability limit states. The case-study hospital building was built between 1969 and 1979, according to the Italian code in force at the time [
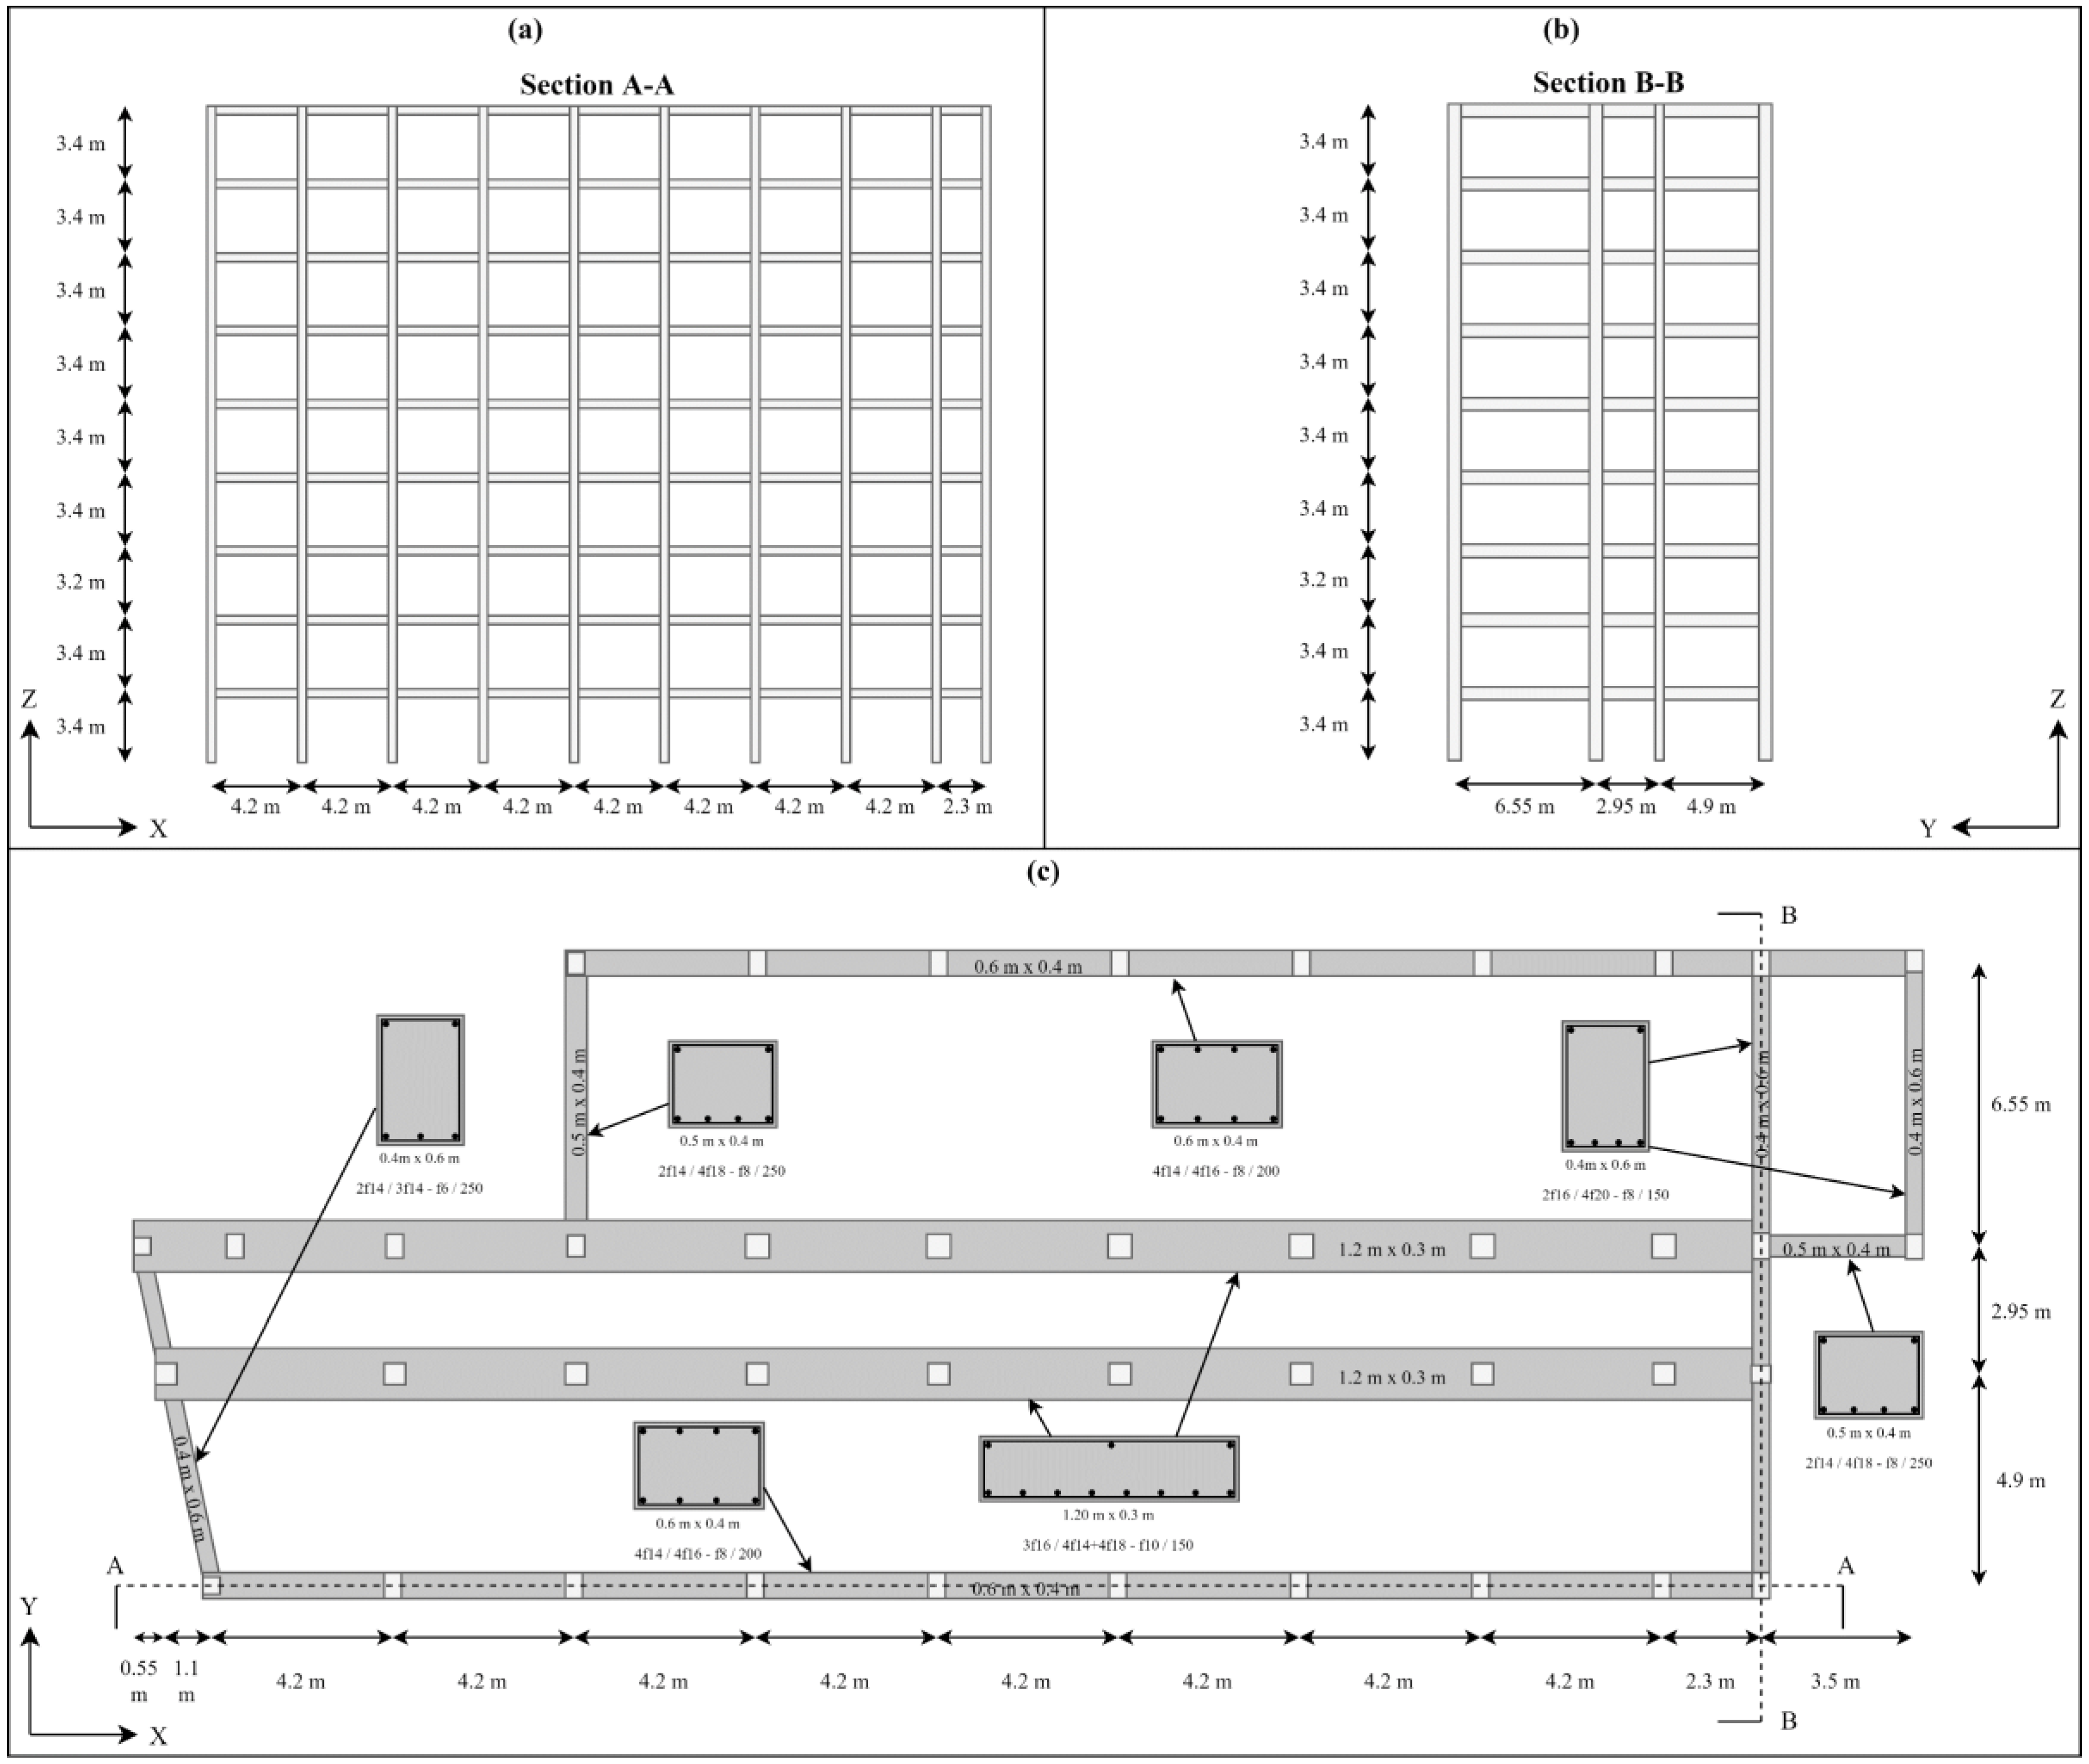
19]. The building complex is composed of 15 blocks separated by structural joints. Each block was designed only for gravity loads and the structural system is composed of RC moment resisting frames (MRFs) built in the longitudinal (longer) direction. The presence of the structural joints allowed the response of each block to be analyzed separately; in this study, the results for only one block are presented, given that both geometrical configuration and design approach are almost the same for all blocks. The analyzed block is nearly rectangular in shape with plan dimensions equal to 41.6 m and 14.4 m, respectively, in the longitudinal and transverse directions, as shown in
Figure 1.
The case-study building is composed of 10 floors with interstorey height of 3.4 m and a total height of 33.8 m. Note, however, that the interstorey height of the third floor is equal to 3.2 m, i.e., shorter than the remaining ones. Four parallel RC MRFs spaced of 4.9 m, 2.95 m and 6.55 m (as illustrated in
Figure 1c) compose the structural system under study; the MRFs are connected by transverse beams only in the perimetral sides, according to common practice for gravity-load-designed RC buildings at the time of construction. The floor systems were identified as
laterizio floor systems [
20] that, again, were quite common in Italy at that time. The mechanical properties of the construction materials were defined from original blueprints and in situ testing; the concrete is characterized by a characteristic strength (f
c) equal to 20 MPa, while the longitudinal and transverse steel reinforcement have a yield strength (f
y) equal to 320 MPa. According to the design practice at the time, the structural elements were not designed assuming a frame configuration; the columns were designed considering their area of influence, while the beams were designed following a continuous beam static scheme. The columns were only designed for compression, consequently reduced amounts of vertical and transverse reinforcement were used (in specific, the transverse reinforcement is characterized by 6mm-diameter rebars with a spacing of 250 mm). Since the size and the reinforcement layout of the columns vary in plane and along the height of the building, for the sake of brevity, they are not reported here. Moreover, as the hospital building was built before the introduction of modern seismic codes, the structural detailing does not comply with the minimum requirements that presently are applied to design newly built structures subjected to seismic-induced actions, such as the minimum amount of longitudinal, transverse, and shear reinforcement in both beams and columns, strengthening of beam-column joints and application of capacity design principles.
3. Numerical Modeling
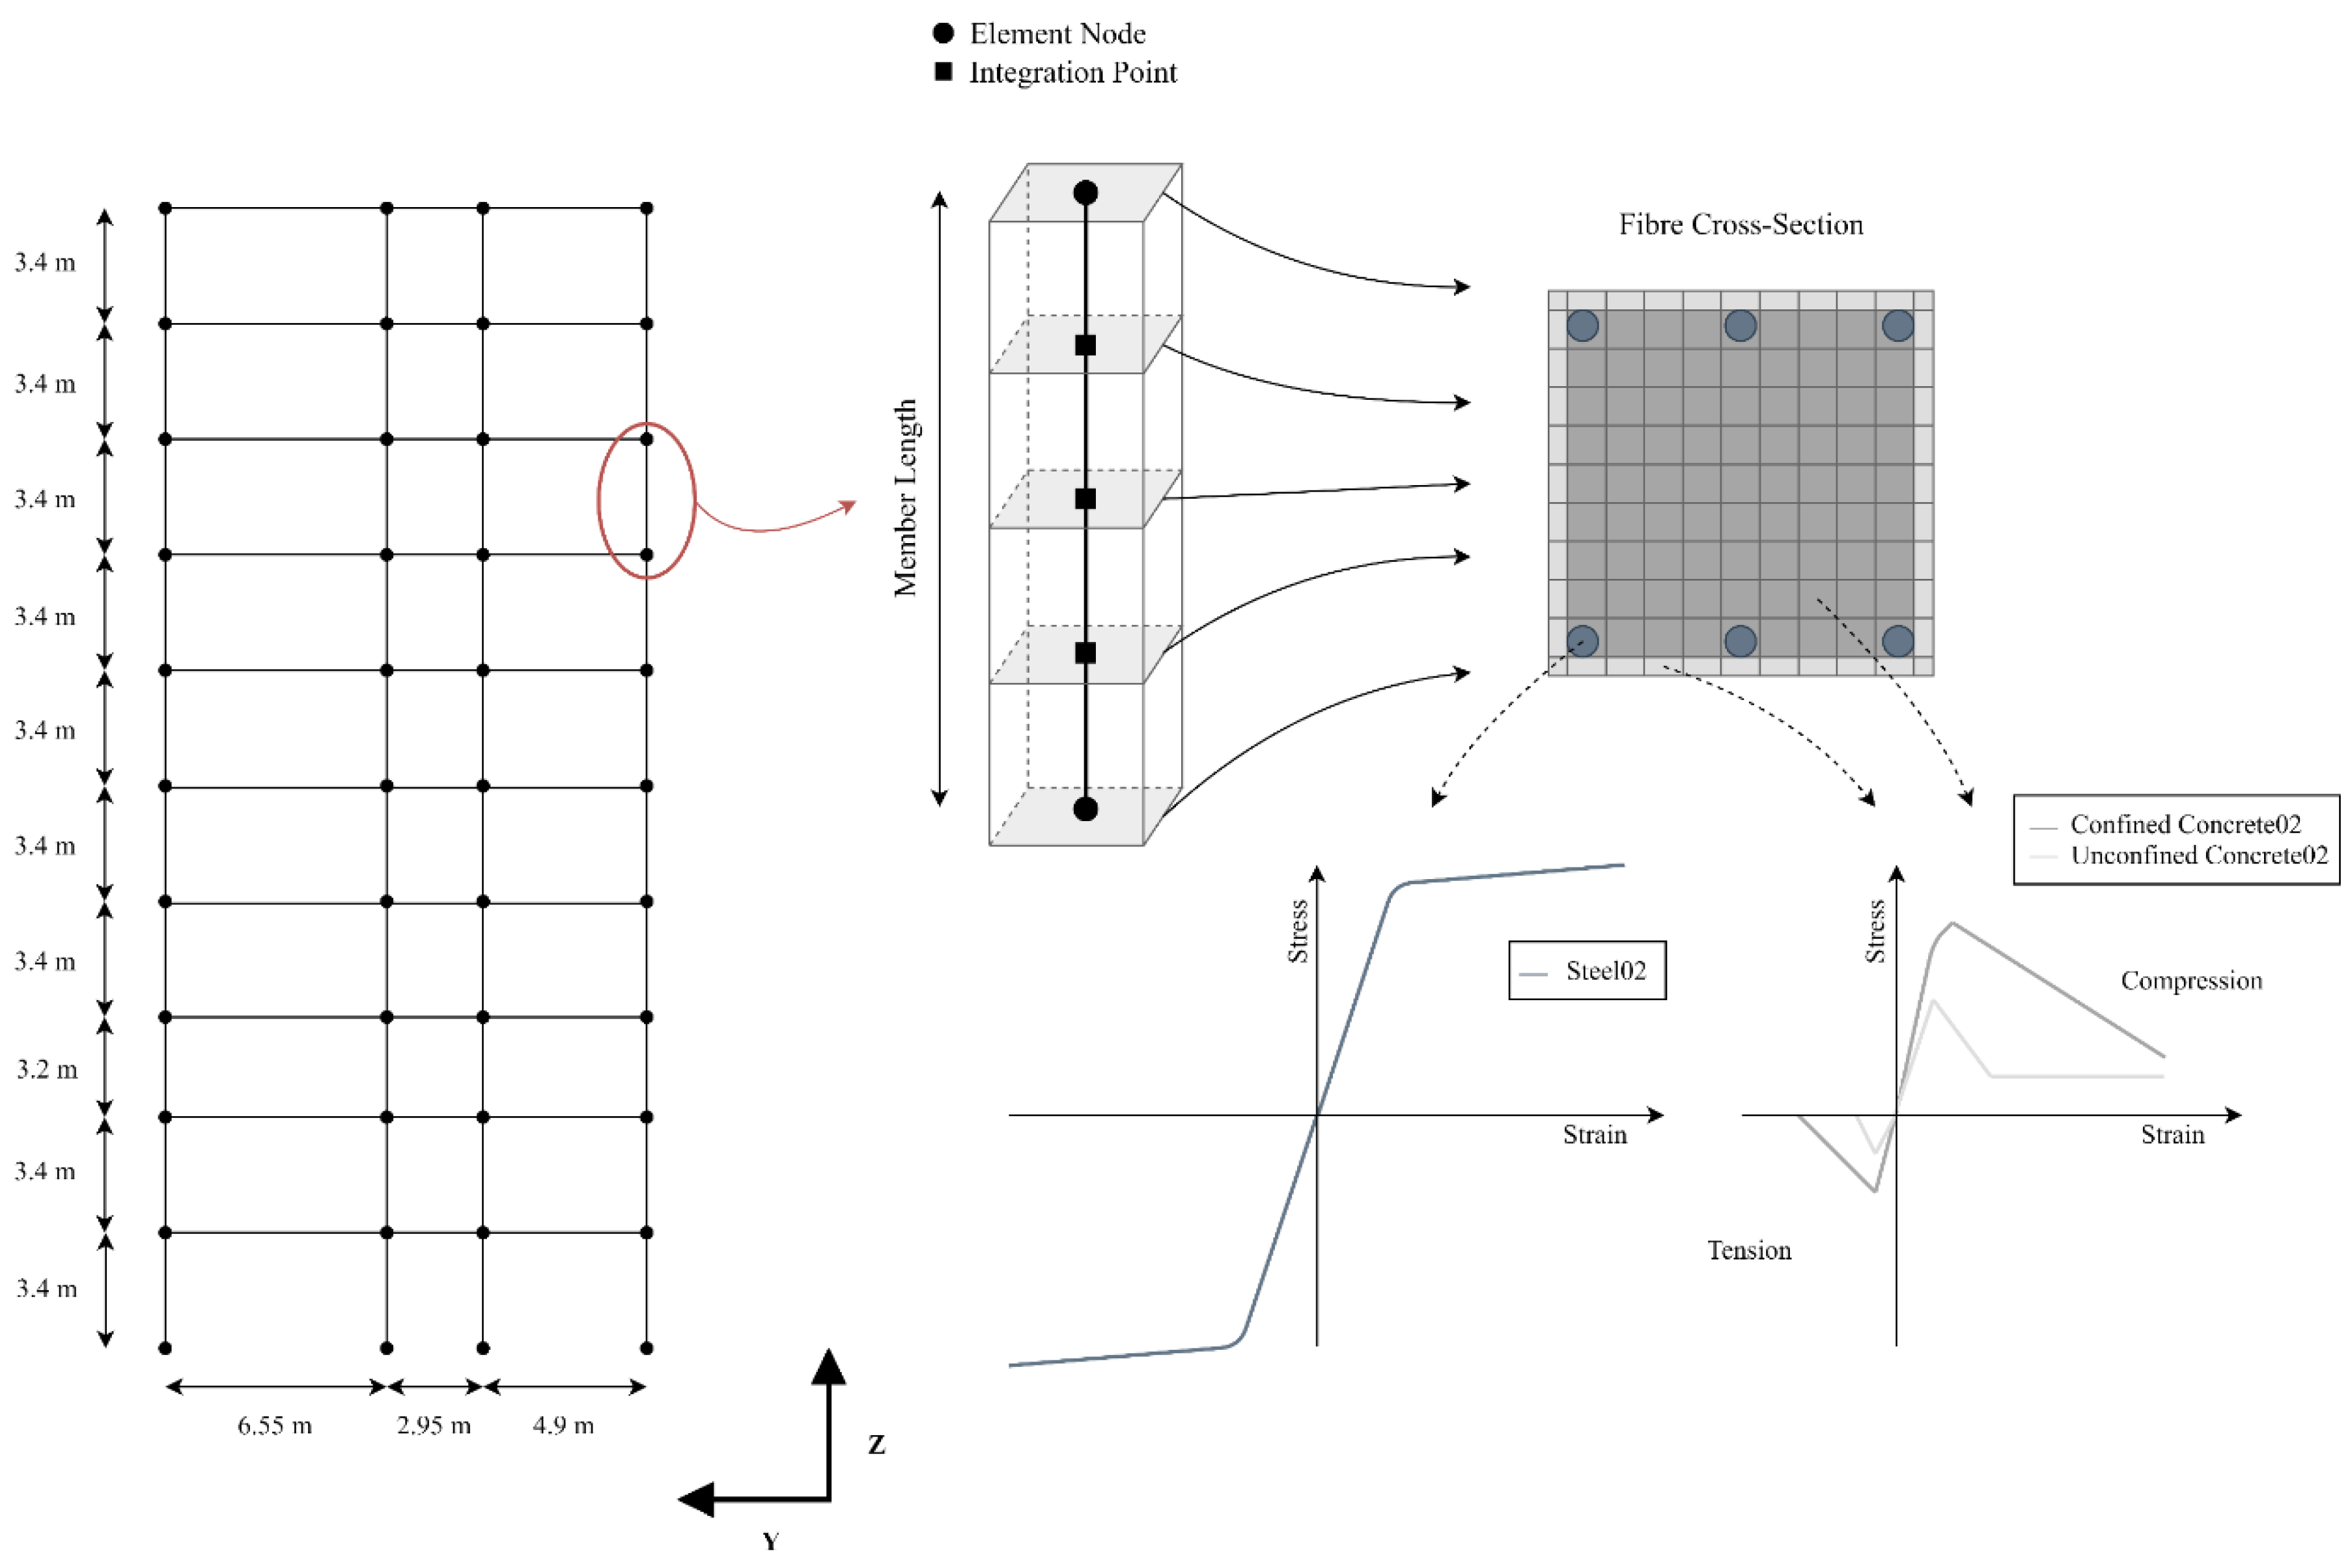
The building was modeled using the open-source finite element (FE) platform OpenSees [
21]. The data collected during the building surveys and in situ investigations (i.e., material properties, reinforcement, column and beam dimensions, etc.) were adopted to develop a geometrically and materially nonlinear numerical model. Eigenvalue and nonlinear dynamic analyses were performed; the former was used to estimate the fundamental periods, necessary also to perform the ground motion selection, while the latter (for several ground motion records) were used to investigate the nonlinear behavior and to estimate the response parameters of the structure. Both beams and columns were modeled with force-based beam-column elements [
22] with a distributed plasticity approach, considering five integration points with the Gauss–Lobatto method.
Figure 2 shows a plan-view of the numerical model, the discretization of the force-based elements and the material selected for the cross-section fibers; it is possible to observe that beams and columns were modeled with one force-based element, since such element guarantees a proper accuracy without increasing the element discretization. At the section level, approximately 100 fibers were used, also distinguishing the fibers of core and cover part with different concrete material properties, depending on the confinement effect provided by the steel reinforcement. The adopted formulation is well-known in the literature and its efficiency is recognized [
23,
24]. In particular, the concrete behavior has been simulated through Concrete02 uniaxial material model, while the steel reinforcement through Steel02, which is a uniaxial steel material object with isotropic strain hardening; both materials are well-known and commonly adopted worldwide [
25,
26]. On the other hand, this modeling approach cannot inherently take into account the shear failure mechanisms directly in the simulations, since the shear behavior is considered to be elastic and uncoupled from axial force and flexural moments. For this reason, the shear failure is verified in the post-processing phase, comparing the obtained shear demands with the shear capacity calculated following the recommendations provided by the Italian code [
27]. Although checking that no shear failures occur, this approach expedites the analyses and is feasible for low seismic intensity levels, such as those considered in this study. Moreover, geometrical nonlinearity was considered for both columns and beams, adopting a corotational formulation [
21], which can capture large displacements and rotations as well as the so-called p-delta effects. Regarding the damping model, tangent-stiffness 5% Rayleigh damping was introduced, for the first and third modes.
The floor systems, made up of
laterizio with a thickness of about 30 cm, were considered rigid enough so as not to induce effects on the seismic response of the structure, based on engineering judgement and recommendations from both Italian building code [
27] and European rules [
2]. Rigid diaphragms were therefore assumed, setting the master node close to the gravity center of each storey.
Although the data obtained from surveys was rather complete, additional information was required hence, for members without available information, appropriate reinforcement layouts were defined through simulated design calculations, following the recommendations of the standards available at the time of construction (1970s). Moreover, the simulated design process was undertaken assuming vertical gravity loads that consist of (i) self-weight of concrete, γ = 24 kN/m3, (ii) a permanent load of 5.4 kN/m2, and (iii) a live load equal to 3 kN/m2. The total mass of the hospital building, considering the masses corresponding to the aforementioned loads, is estimated to be 6000 tons.
Table 1 presents the first fundamental periods, and their corresponding types, of the case-study structure. The presence of infill walls can influence the response of the building, and they should be suitably considered on a case-by-case basis depending on the specific research objectives. In this study, the infill walls have been modeled as load and mass only, due to the high variability of the infills response—inherently related to the properties of its components, the presence of openings, their layout, and the surrounding boundary conditions with the RC elements—and mostly to the fact that the research aims at providing comparisons with codified analytical approaches derived for bare frame systems—NTC 2018, EC8 and ASCE [
1,
2,
27].
It should be noted that the analyses consider the boundary conditions at the foundation as completely fixed, hence neglecting soil-structure interaction (SSI), which could affect the natural period of the structure and its dynamic response. Although several studies highlighted this likely phenomenon [
28,
29,
30], in order not to add further uncertainties in the analyses outcomes, as well as to make a consistent comparison of the standards and design approaches with the present results, SSI has not been modeled in this study.
4. Hazard Modeling and Ground Motion Record Selection
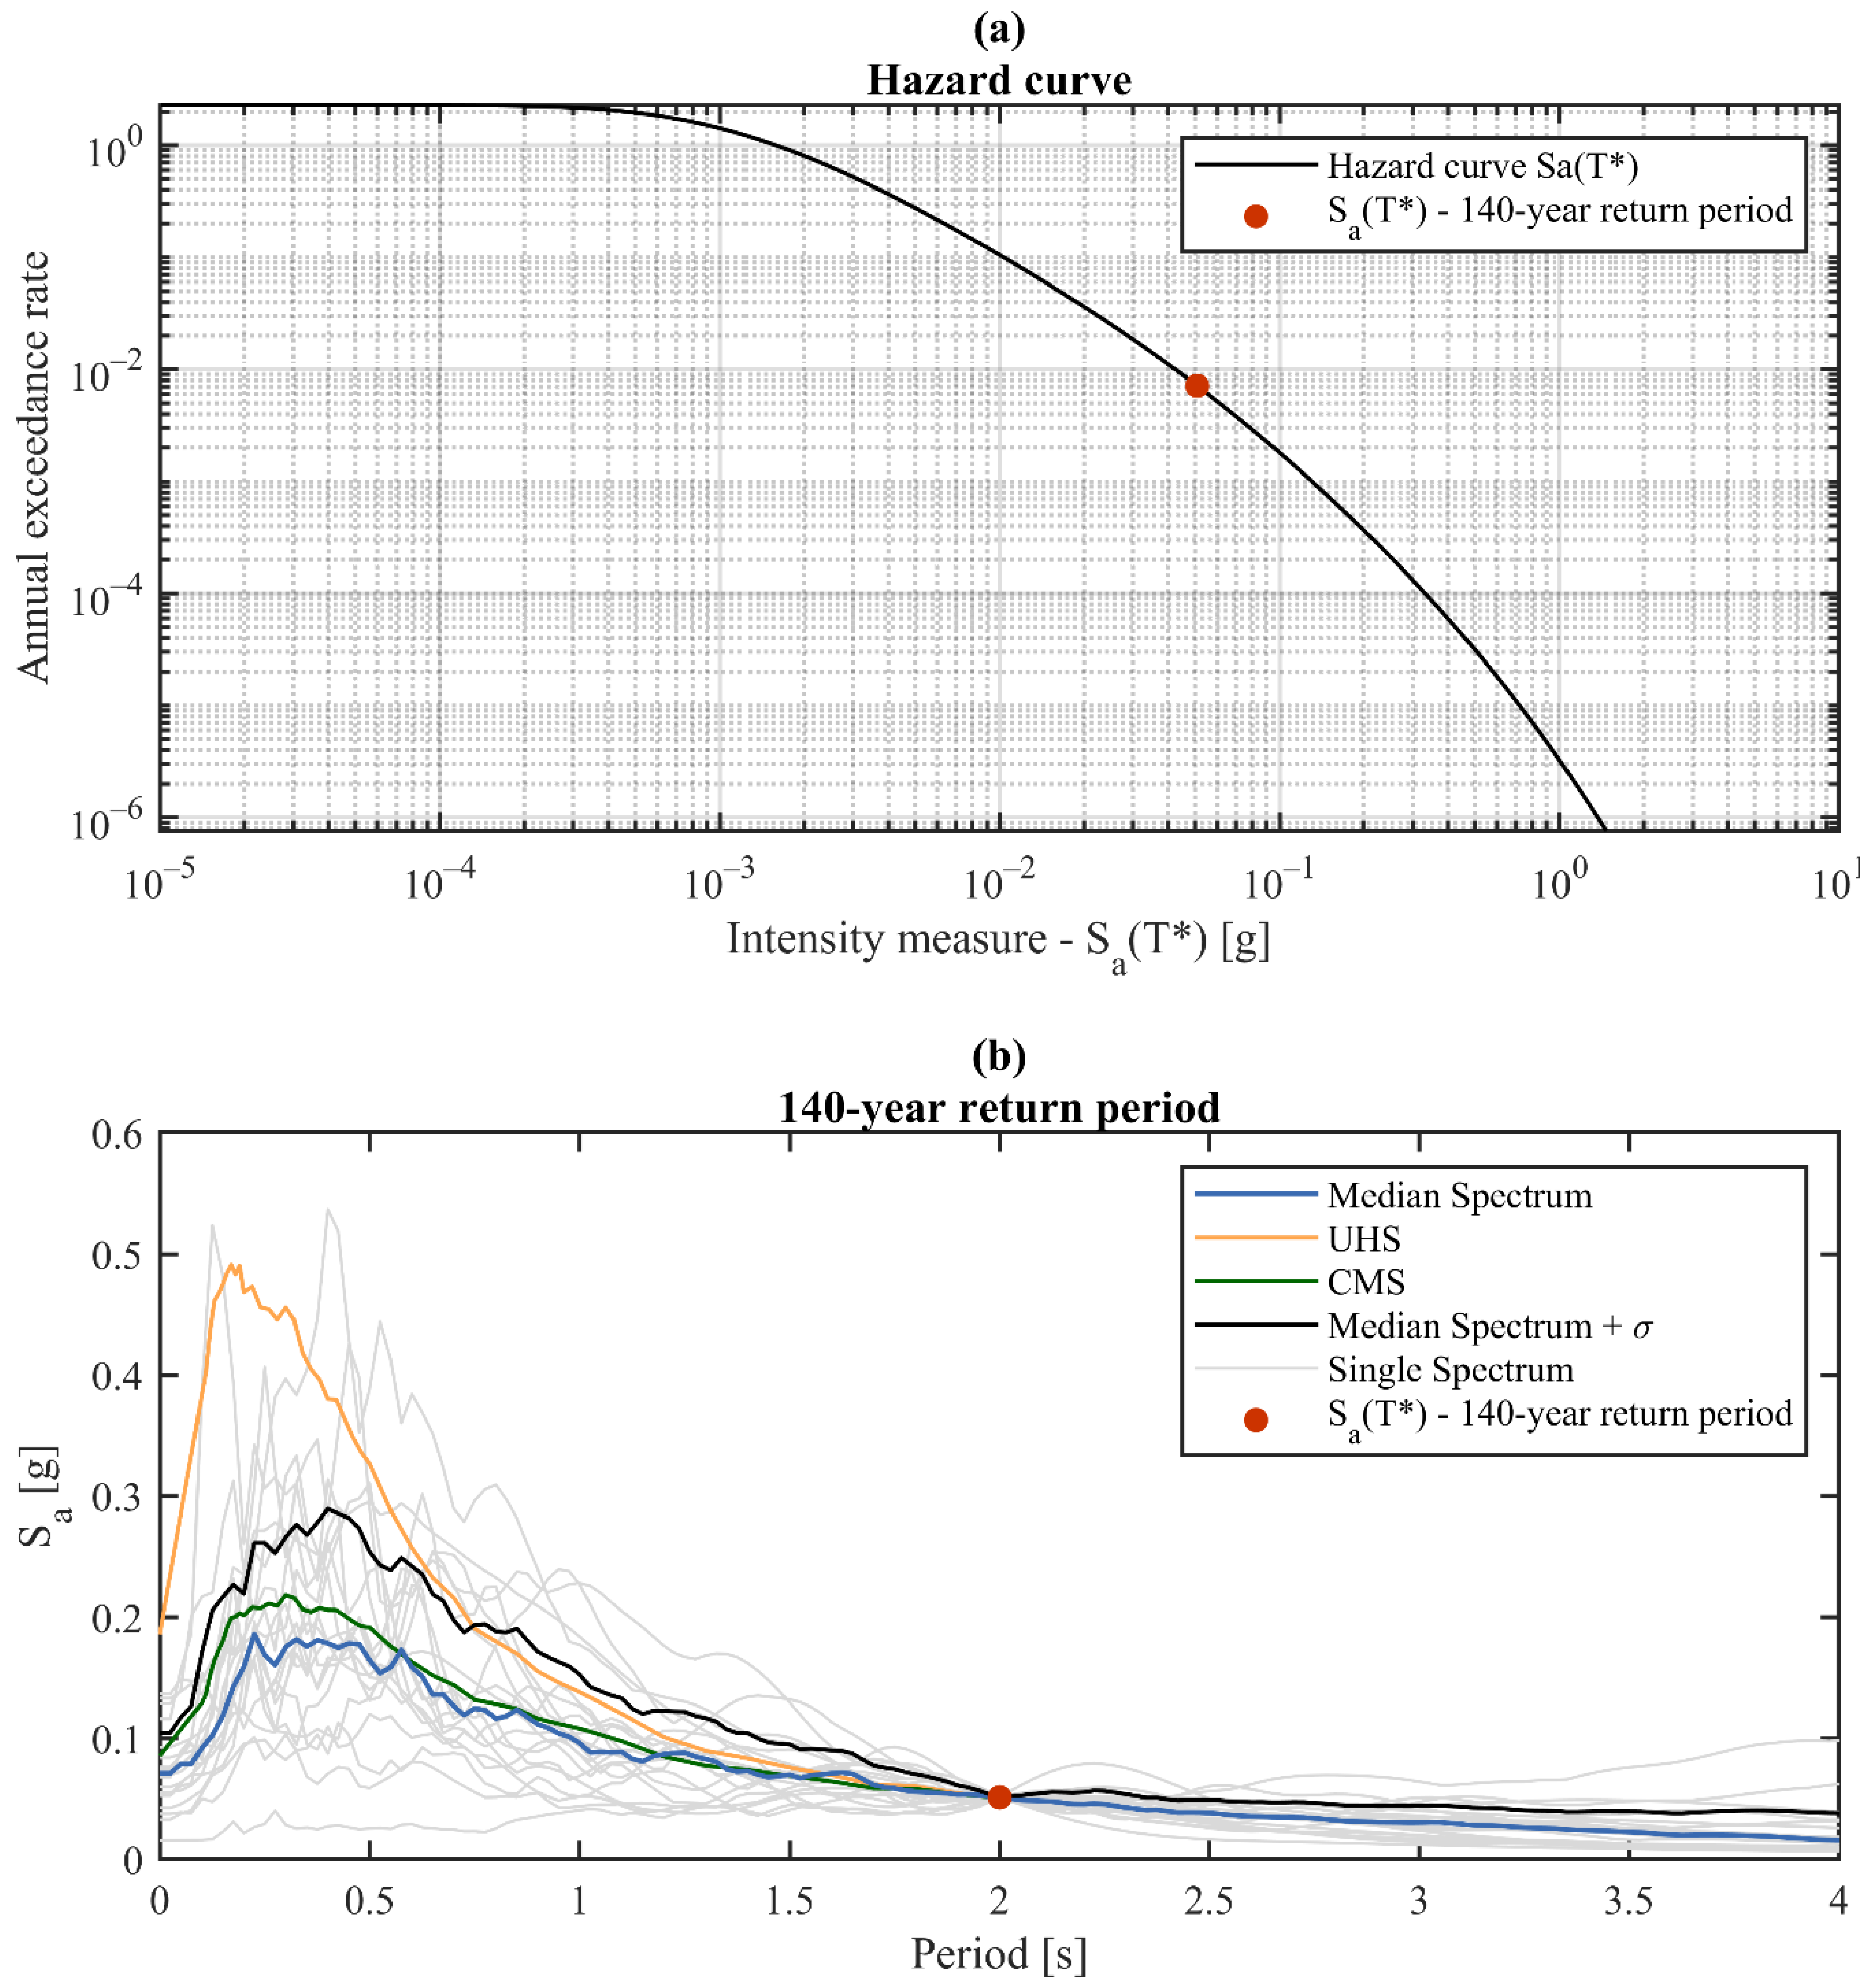
The selected hospital building reflects and resembles many characteristics of similar structures in the national hospital building stock thus the case-study structure could be found in different locations throughout the Italian territory. According to the results of a probabilistic seismic hazard assessment (PSHA) performed by Stucchi et al. [
31], the median peak ground acceleration (PGA) in Italy is approximately equal to 0.14 g for a 10% probability of exceedance in 50 years (or 475 years return period), while the median plus one standard deviation PGA is approximately 0.20 g. Following the results of this study, a location representative of medium–high seismicity in Italy was selected. The site selected to carry out the PSHA and consequently select the ground motion record sets is characterized by a PGA on stiff soil of 0.21 g for a 10% probability of exceedance in 50 years. In line with the scope of this study, i.e., to investigate the seismic demand on NSEs at low seismic intensities, the RPs of 140 and 200 years, which can be associated with the operational (OLS) and damage limitation (DLS) limit states for hospital buildings, were considered.
Figure 3 illustrates the hazard curve and conditional mean spectrum, for an illustrative return period (140 years), adopted for the selection and matching of ground motion records. The conditional mean spectrum was developed, according to the methodologies proposed by Baker [
32] and Jayaram et al. [
33], at different RPs. Both seismic hazard calculations and development of conditional mean spectra were performed using the free software REASSESS [
34]; in the hazard calculations, the ground motion prediction equation proposed by Ambraseys et al. [
35] was adopted. Regarding the spectral acceleration correlation, the methodology outlined in Baker and Jayaram [
36] was employed.
For each of the 2 selected RPs, a total of 20 pairs of ground motion records were selected from the PEER NGA-West 2 database [
37], considering a soil type B, as described by Eurocode 8 [
38]. Regarding the intensity measure (IM) assumed in this procedure, the spectral acceleration, S
a(T*), at a conditioning period (T*) was chosen. Concerning the choice of a suitable conditional period, FEMA P58 [
39] recommends using a T* deduced from the arithmetic mean of the two orthogonal modal periods. The selected case-study structure has the first two fundamental periods equal to T
1 = 2.306 s and T
2 = 1.387 s, with an arithmetic mean of T
mean = 1.85 s. Based on these results, the conditioning period was chosen, as a reasonable approximation of T
mean, as T* = 2 s. It is also important to underline that in this study, a hazard consistent record selection was performed; hence, the discrepancy in T* and the first period of vibration can be deemed as a valid approach in case of a risk-based assessment, as pointed out in Lin et al. [
40].
5. Structural Response Results
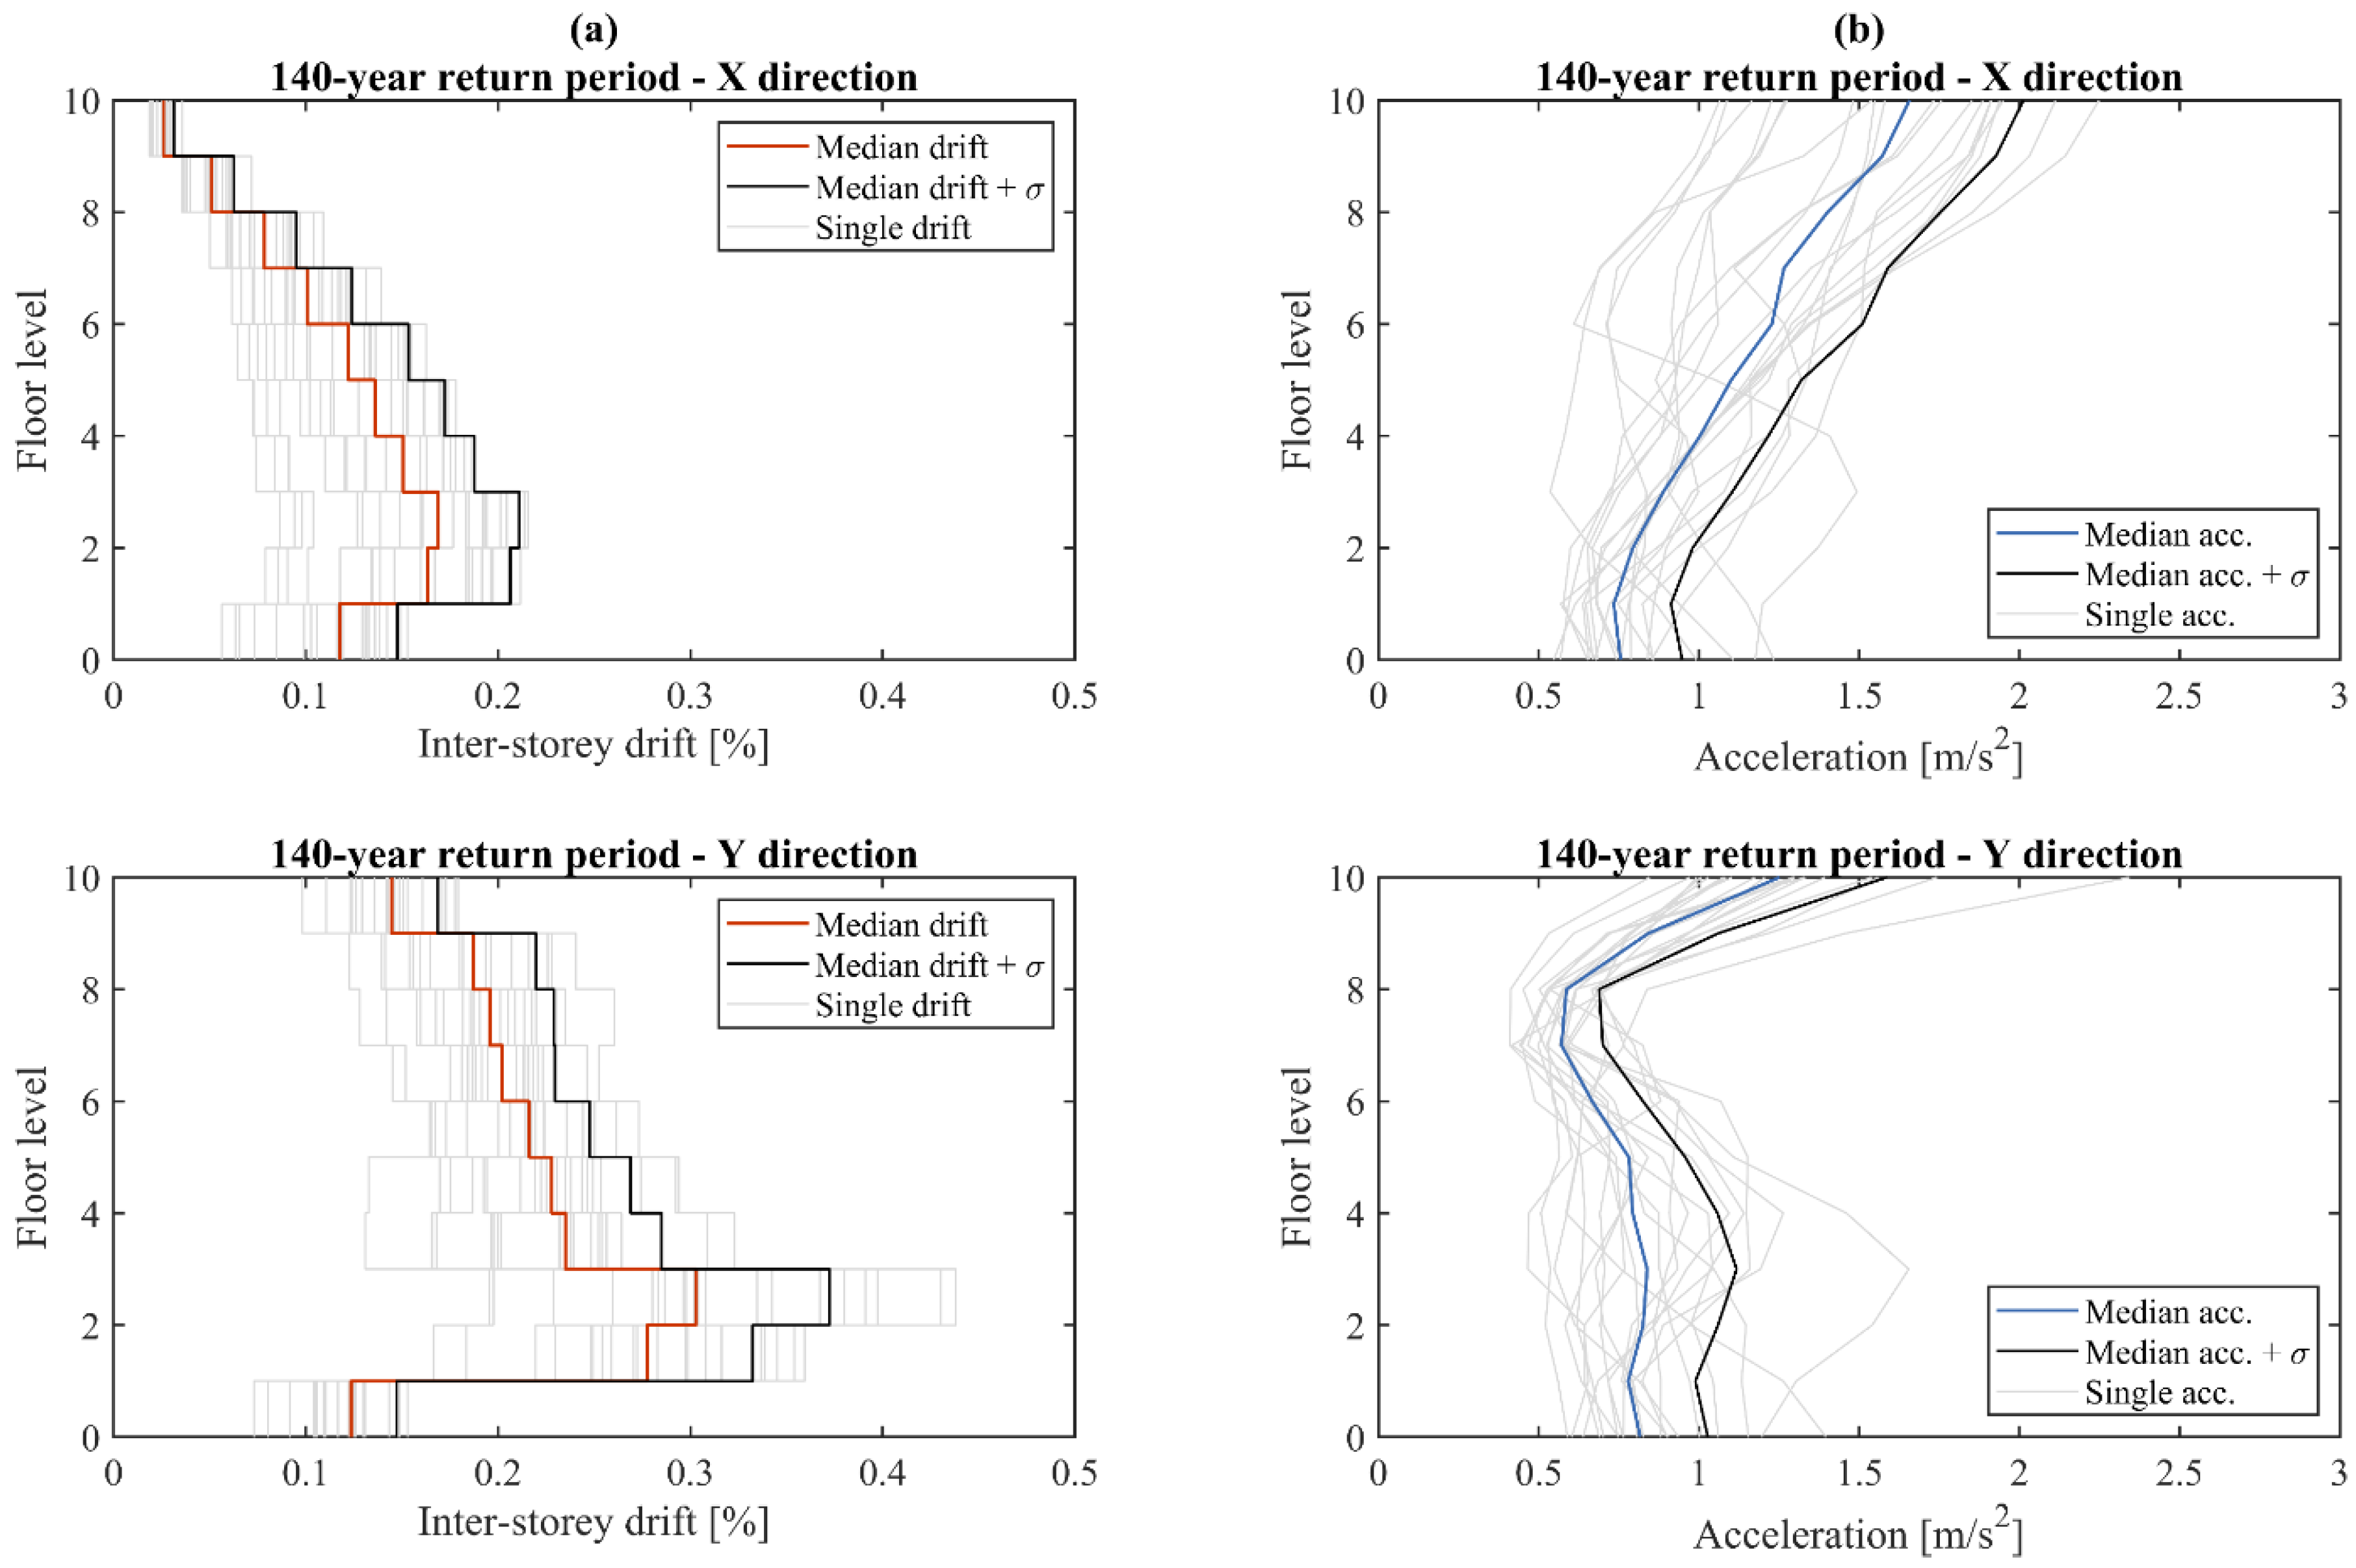
Acceleration and displacement time histories obtained for each storey of the building were first processed to derive the peak acceleration profiles and the peak interstorey drift profiles in both longitudinal and transverse directions, allowing structural response/performance to be quantified for the two seismic intensities of interest.
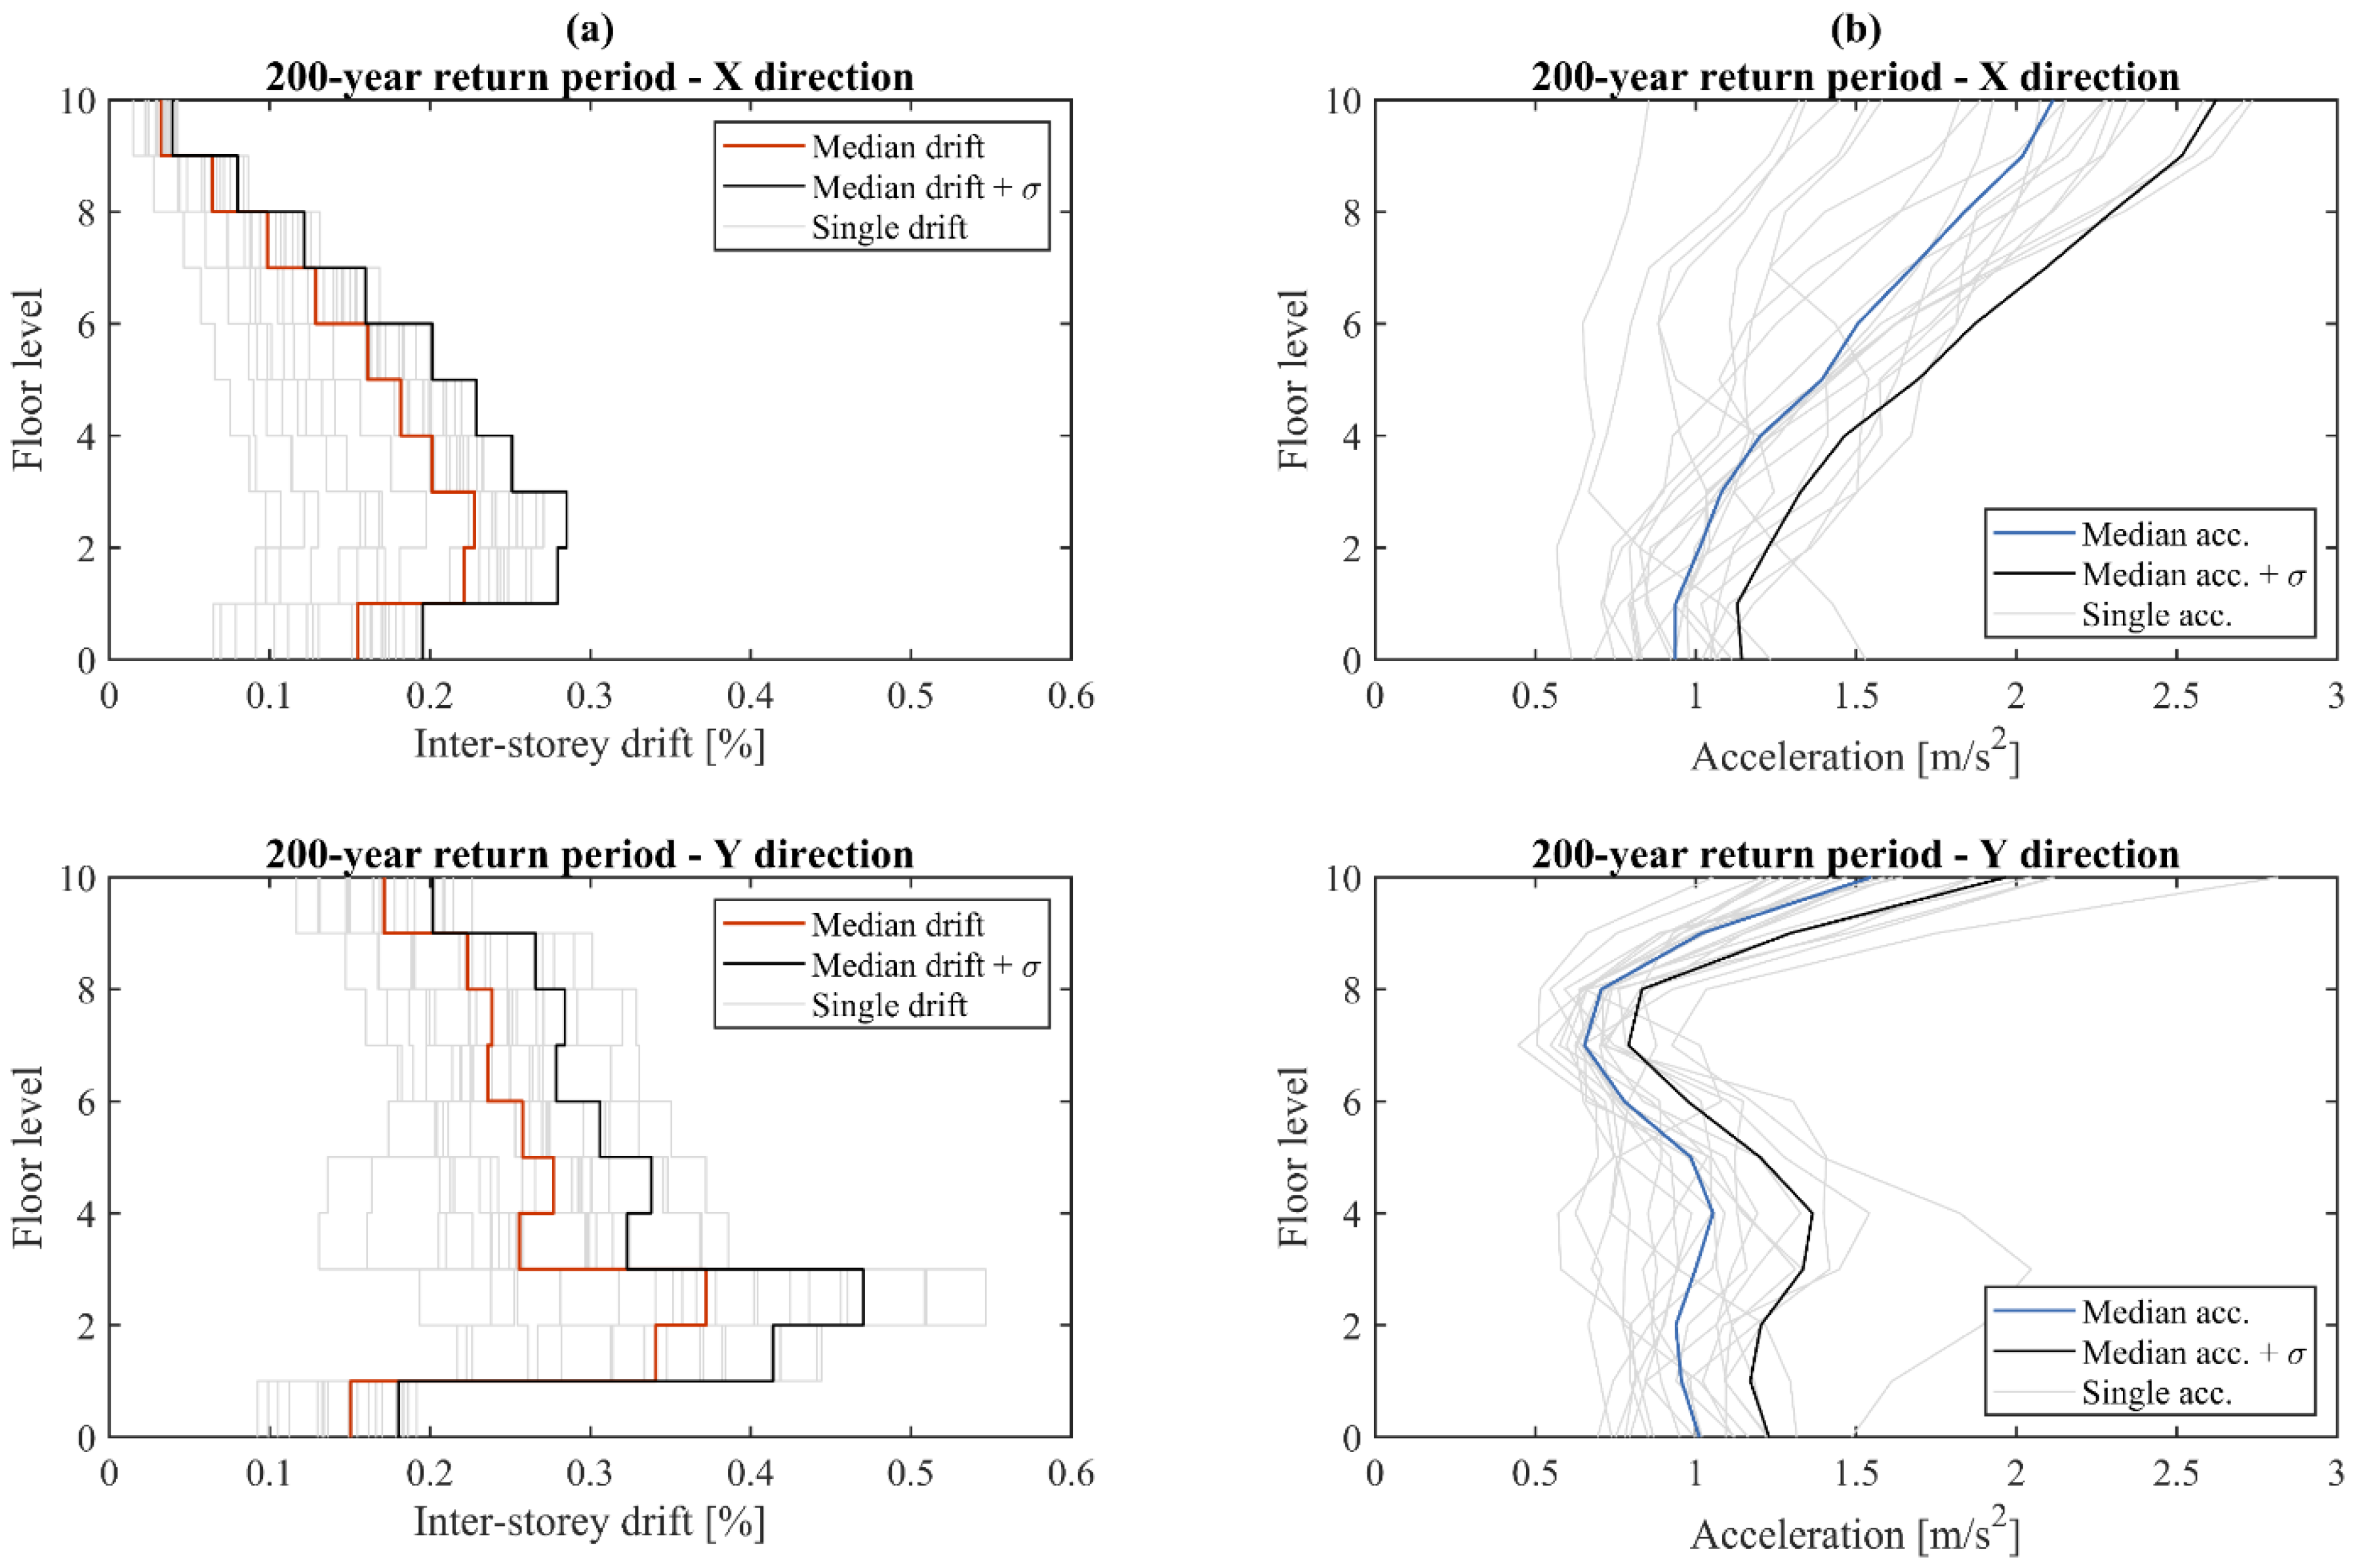
Figure 4 shows key structural response parameters in X and Y directions for RP = 140 years, whereas
Figure 5 presents the counterparts corresponding to RP = 200 years. The comparison is therefore two-fold, involving (i) the two building directions for the same intensity, and (ii) the intensities related to the two serviceability limit states, namely OLS and DLS, for the same building direction. For the sake of completeness, both
Figure 4 and
Figure 5 depict drift and acceleration profiles resulting from each individual record, along with the median and the median plus one standard deviation such that a measure of the record-to-record variability could be provided.
As far as the return period associated with the OLS limit state is concerned, median maximum peak drifts of about 0.17% and 0.3% were observed in X and Y directions, in-between the second and third floors, indicating that the building is more flexible in its transverse direction. In both cases, however, the 0.33% drift upper limit prescribed in the Italian code [
27] is fulfilled. Moreover, it is known that masonry infills can be subjected to damage also for lower drift values [
41], indicating that during the structural survey the infill properties should also be investigated. Similar considerations apply to the RP = 200 years, as can be gathered from
Figure 5a. Indeed, median maximum peak drifts equal to approximately 0.23% and 0.38% were recorded, again in-between the second and third floors in the longitudinal and transverse directions. These results thus render evident that increasing RP from 140 to 200 years causes a 27–35% increase in the median maximum peak drift, while those in the Y direction are nearly the double of the ones in the X direction, regardless of the considered RP. Furthermore, in the transverse direction, the storey drift peaks tend to show a more uniform profile over the structure height, as opposed to a linear decay in the opposite direction (see
Figure 4a or
Figure 5a). In both directions, however, record-to-record variability is not negligible, despite the low intensities, with peaks of up to 0.21% and 0.44% being obtained in X and Y directions for the most severe record for RP = 140 years.
The abovementioned trends are also reflected by the absolute acceleration peak profiles presented in
Figure 4b and
Figure 5b, which present contraflexure points at approximately mid-height in the Y direction and for both RPs. For all cases, median and individual profiles are approximately linear, with floor acceleration peaks recorded at the top storey.
Figure 4b shows median maximum roof accelerations slightly higher than 1.6 m/s
2 and 1.3 m/s
2, respectively, for the X and Y directions; maxima around 2 m/s
2 were predicted, again for both directions, although the variability among the record set is more pronounced in the longitudinal direction, with more scattered acceleration peak profiles over the structure height. As far as RP = 200 years is considered, an increase of approximately 25% is observed in terms of median peak roof accelerations in both building directions with respect to the OLS counterparts (see
Figure 5b vs.
Figure 4b), thus confirming a nearly linear variation and a nearly elastic building response for both serviceability limit states.
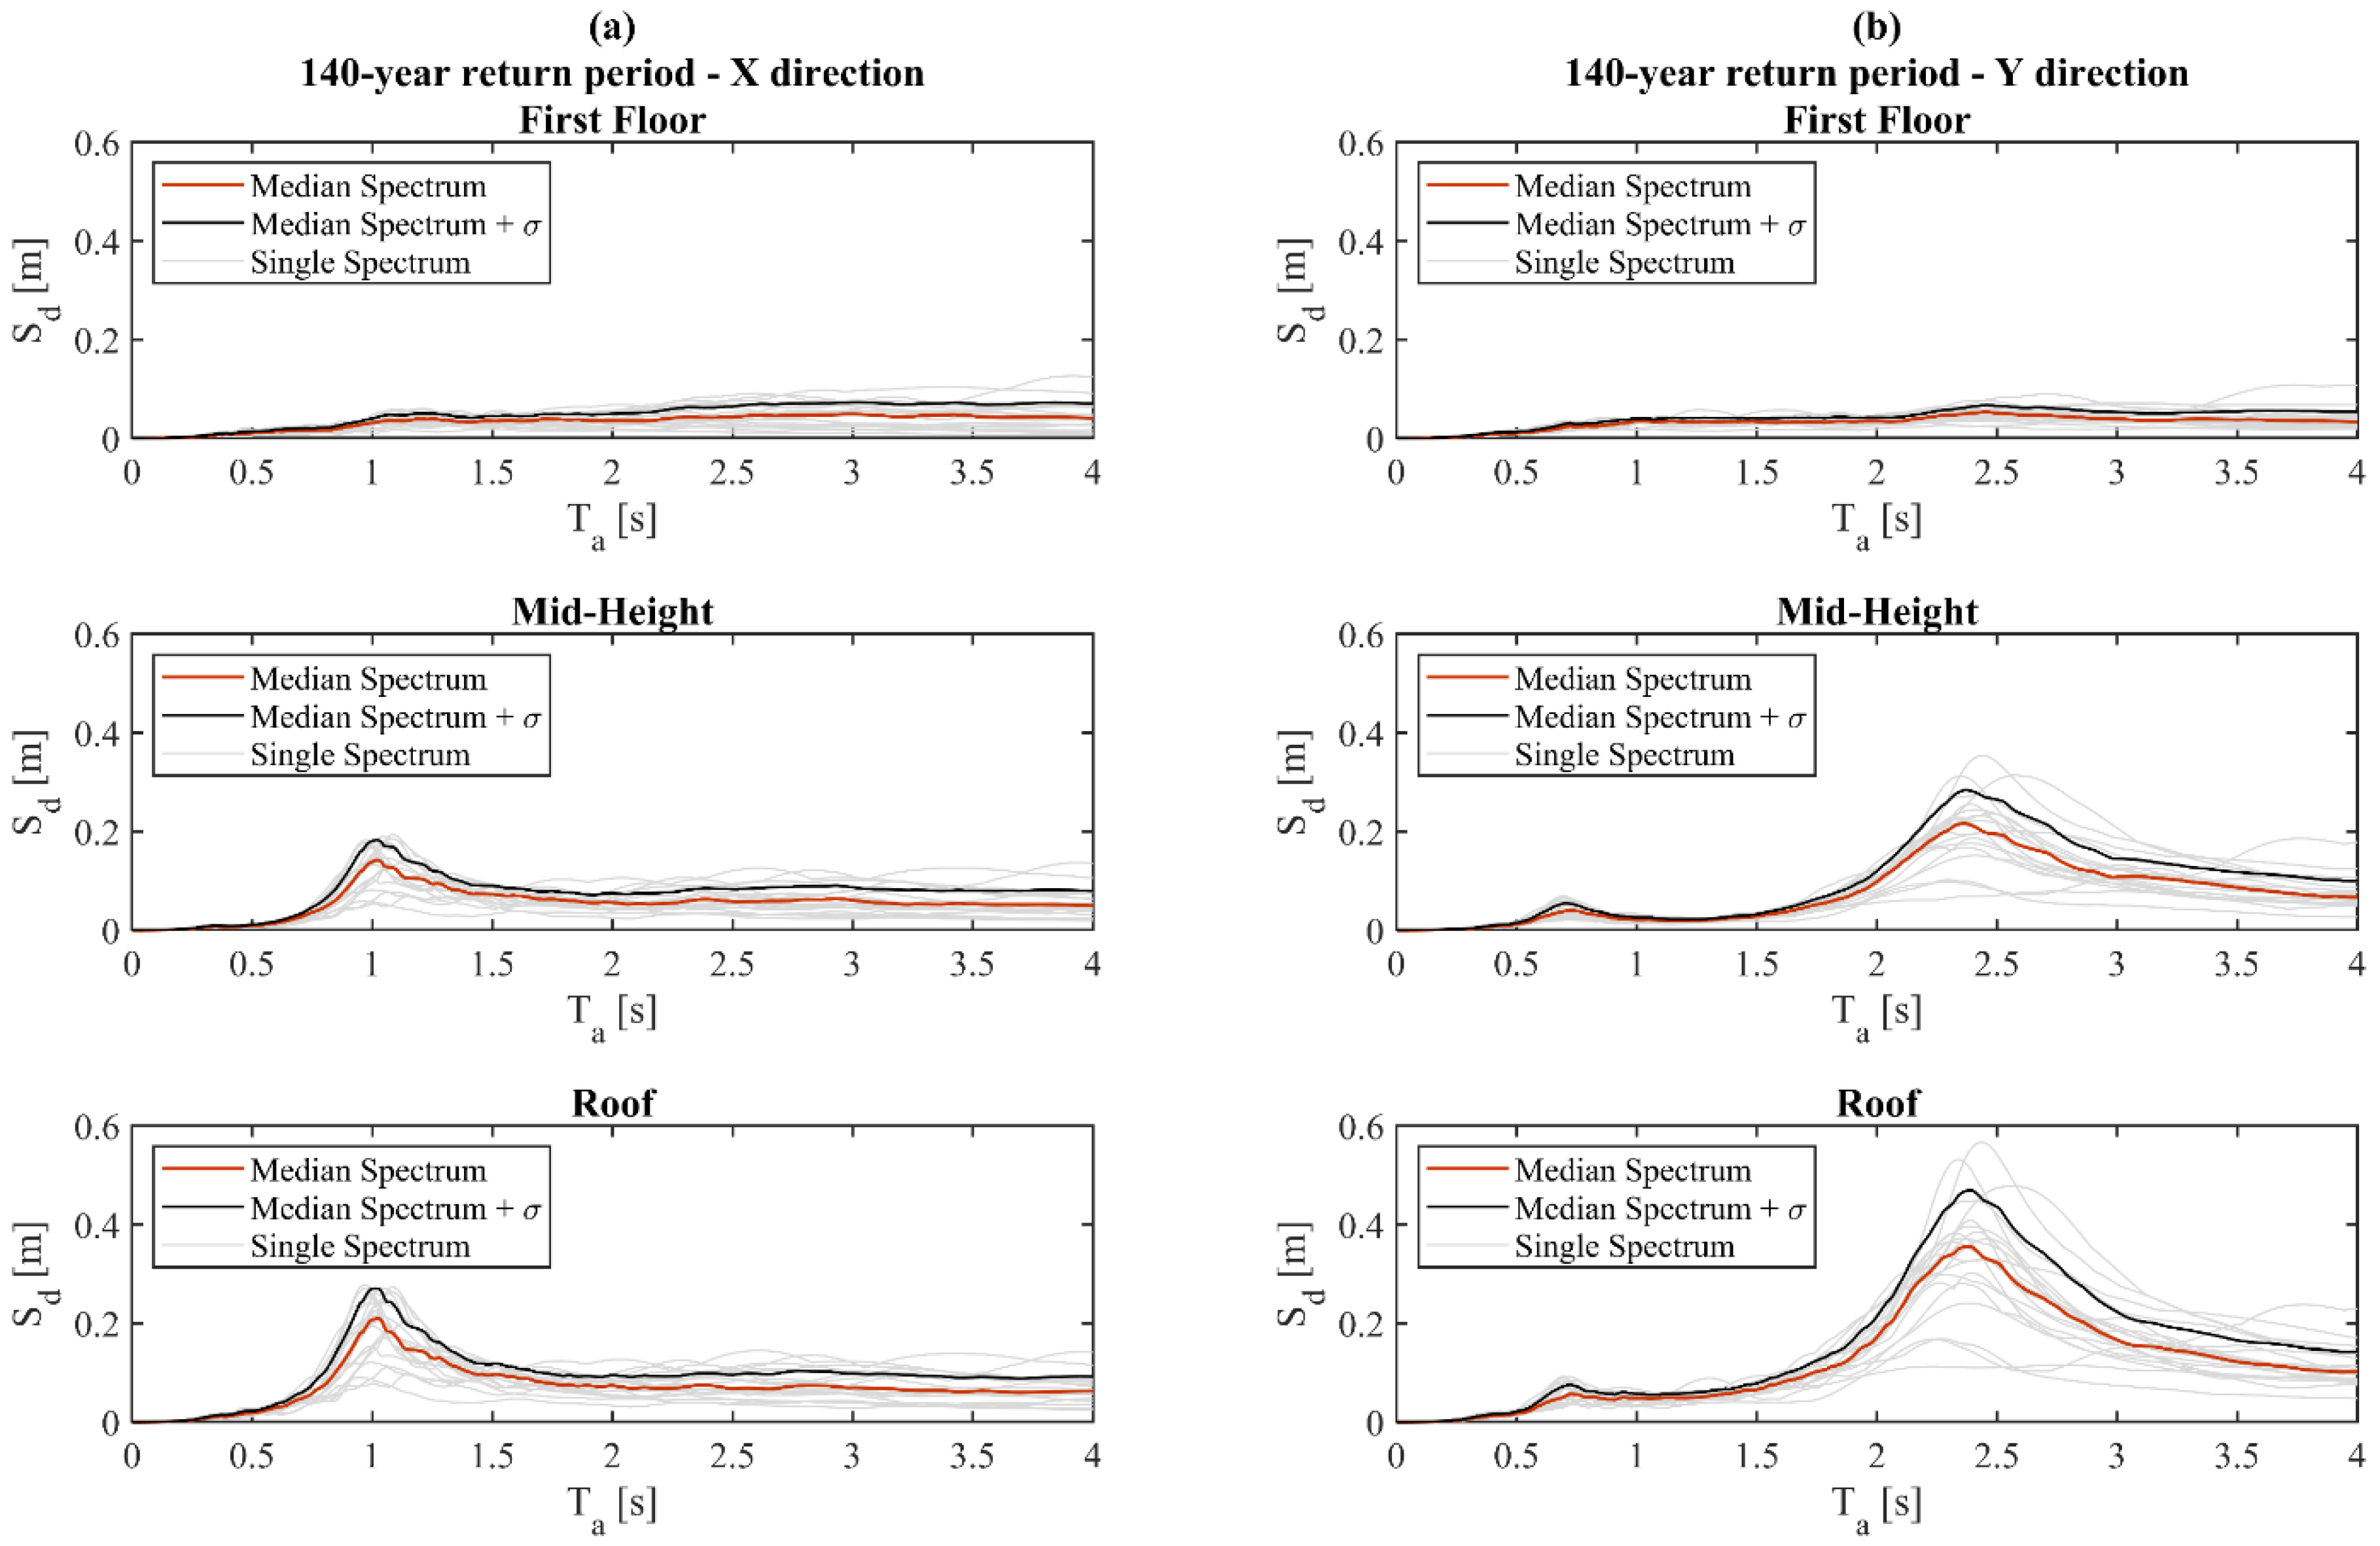
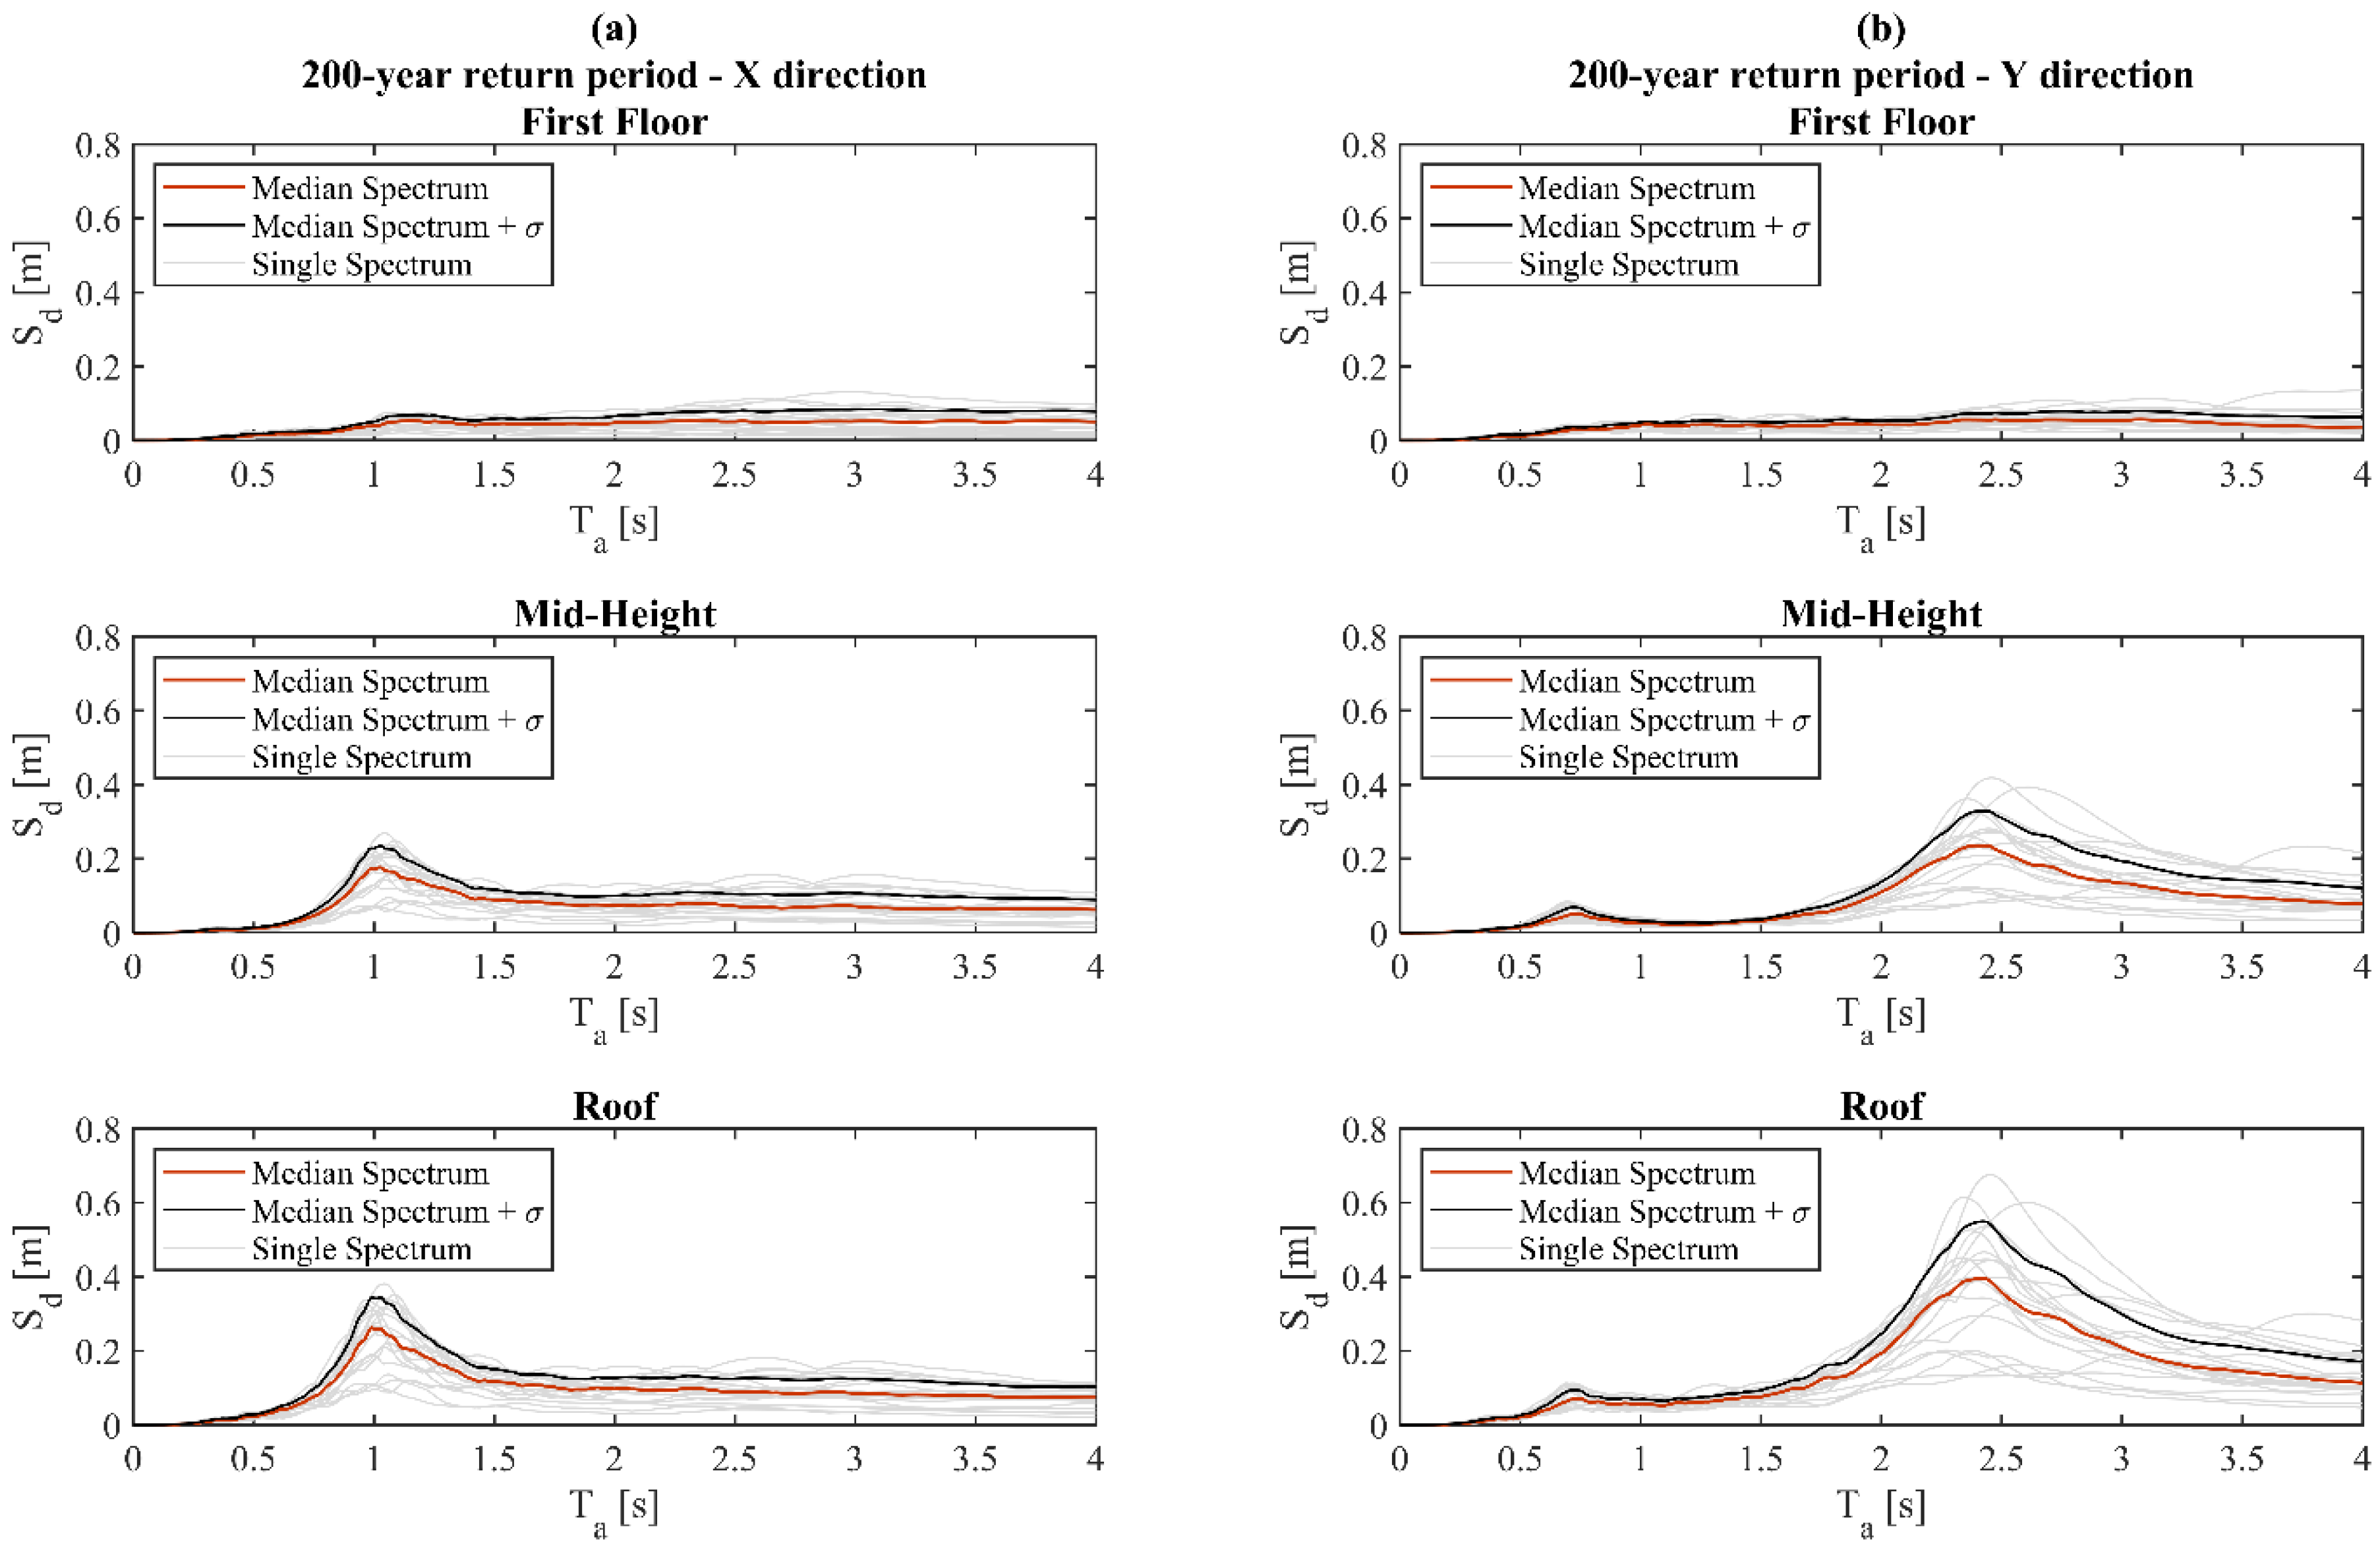
Acceleration and displacement time–history results used to derive the profiles presented in
Figure 4 and
Figure 5 were then processed and used to compute floor response spectra, thereby delving into the quantification of seismic demand on acceleration sensitive NSEs, whose behavior and functionality are issues of paramount importance for a hospital building. The absolute acceleration floor response spectra obtained for RP = 140 years at the first floor, mid-height, and roof are reported in
Figure 6, while
Figure 7 presents the corresponding set of relative displacement floor response spectra, including those from both individual records and statistical ones, as for the previously presented acceleration and drift peak profiles. Please note that these spectra, as well as those presented in what follows for RP = 200 years, are 5% damped and were obtained using the Newmark linear method to solve the equation of motion.
Moreover,
Table 2 and
Table 3 summarize, for RP = 140 years, the spectral absolute accelerations and relative displacements in correspondence with meaningful reference structural periods: 0 s, 1 s, and 2.3 s.
As can be seen from
Figure 6, the range of spectral amplification is relatively wide in both building directions and periods ranging between approximately 0.3 s and 2.3 s are involved because of the fragmentation of the total modal mass of the building into its eigenmodes. This trend is particularly evident at the upper storeys, as highlighted by the roof–floor response spectra collected in
Figure 6a,b, and becomes less pronounced at the lower storeys where the spectral amplification concentrates at fewer and more indistinct periods. This outcome can provide guidance regarding matters involving resonance with the periods of the NSEs, as well as the protection of building contents and their functionality at different levels along the height of the structure. When doing so, spectral amplifications should be weighted according to the mass participation factor of each mode.
As far as the longitudinal direction is concerned, the median acceleration spectra, as well as the median plus one standard deviation spectra, at mid-height and top storey show two visible peaks at around 0.4 s and 1.0 s (see
Figure 6a). Floor spectral accelerations of up to approximately 0.5 g and 1.1 g can be seen, respectively, when referring to the high-percentile roof estimate. On the other hand, the two floor response spectra in the opposite direction of the building present peaks at about 0.4 s, 0.69 s and 2.31 s, which further confirms that the structure is more flexible in the transverse direction. In this case, however, roughly equal spectral accelerations of around 0.5–0.6 g can be observed, in
Figure 6b, if the median plus one standard deviation of the individual spectra is taken as reference.
It is also worth noting that the individual and statistical relative displacement floor response spectra in both X and Y directions show a general shape similar to the absolute acceleration floor response spectra. In particular, at the first floor, it is not possible to identify specific peaks in the spectral displacements and a linear increase of the displacement demand is observed, while at the middle-height and roof, the maximum displacement demand is observed at the fundamental periods of the structure. Furthermore, when comparing the floor response spectra reported in
Figure 7a,b, it emerges very clearly how the displacement demand increases with the structural height in both directions. In the longitudinal direction, it can be noted that median spectral displacements reach peaks up to approximately 0.15 m and 0.21 m, for the mid-height and roof–floor respectively, in correspondence for 1.0 s period. Similar considerations can be made in the opposite direction, in which peaks of 0.2 m and 0.36 m can be observed in proximity of a period of 2.3 s.
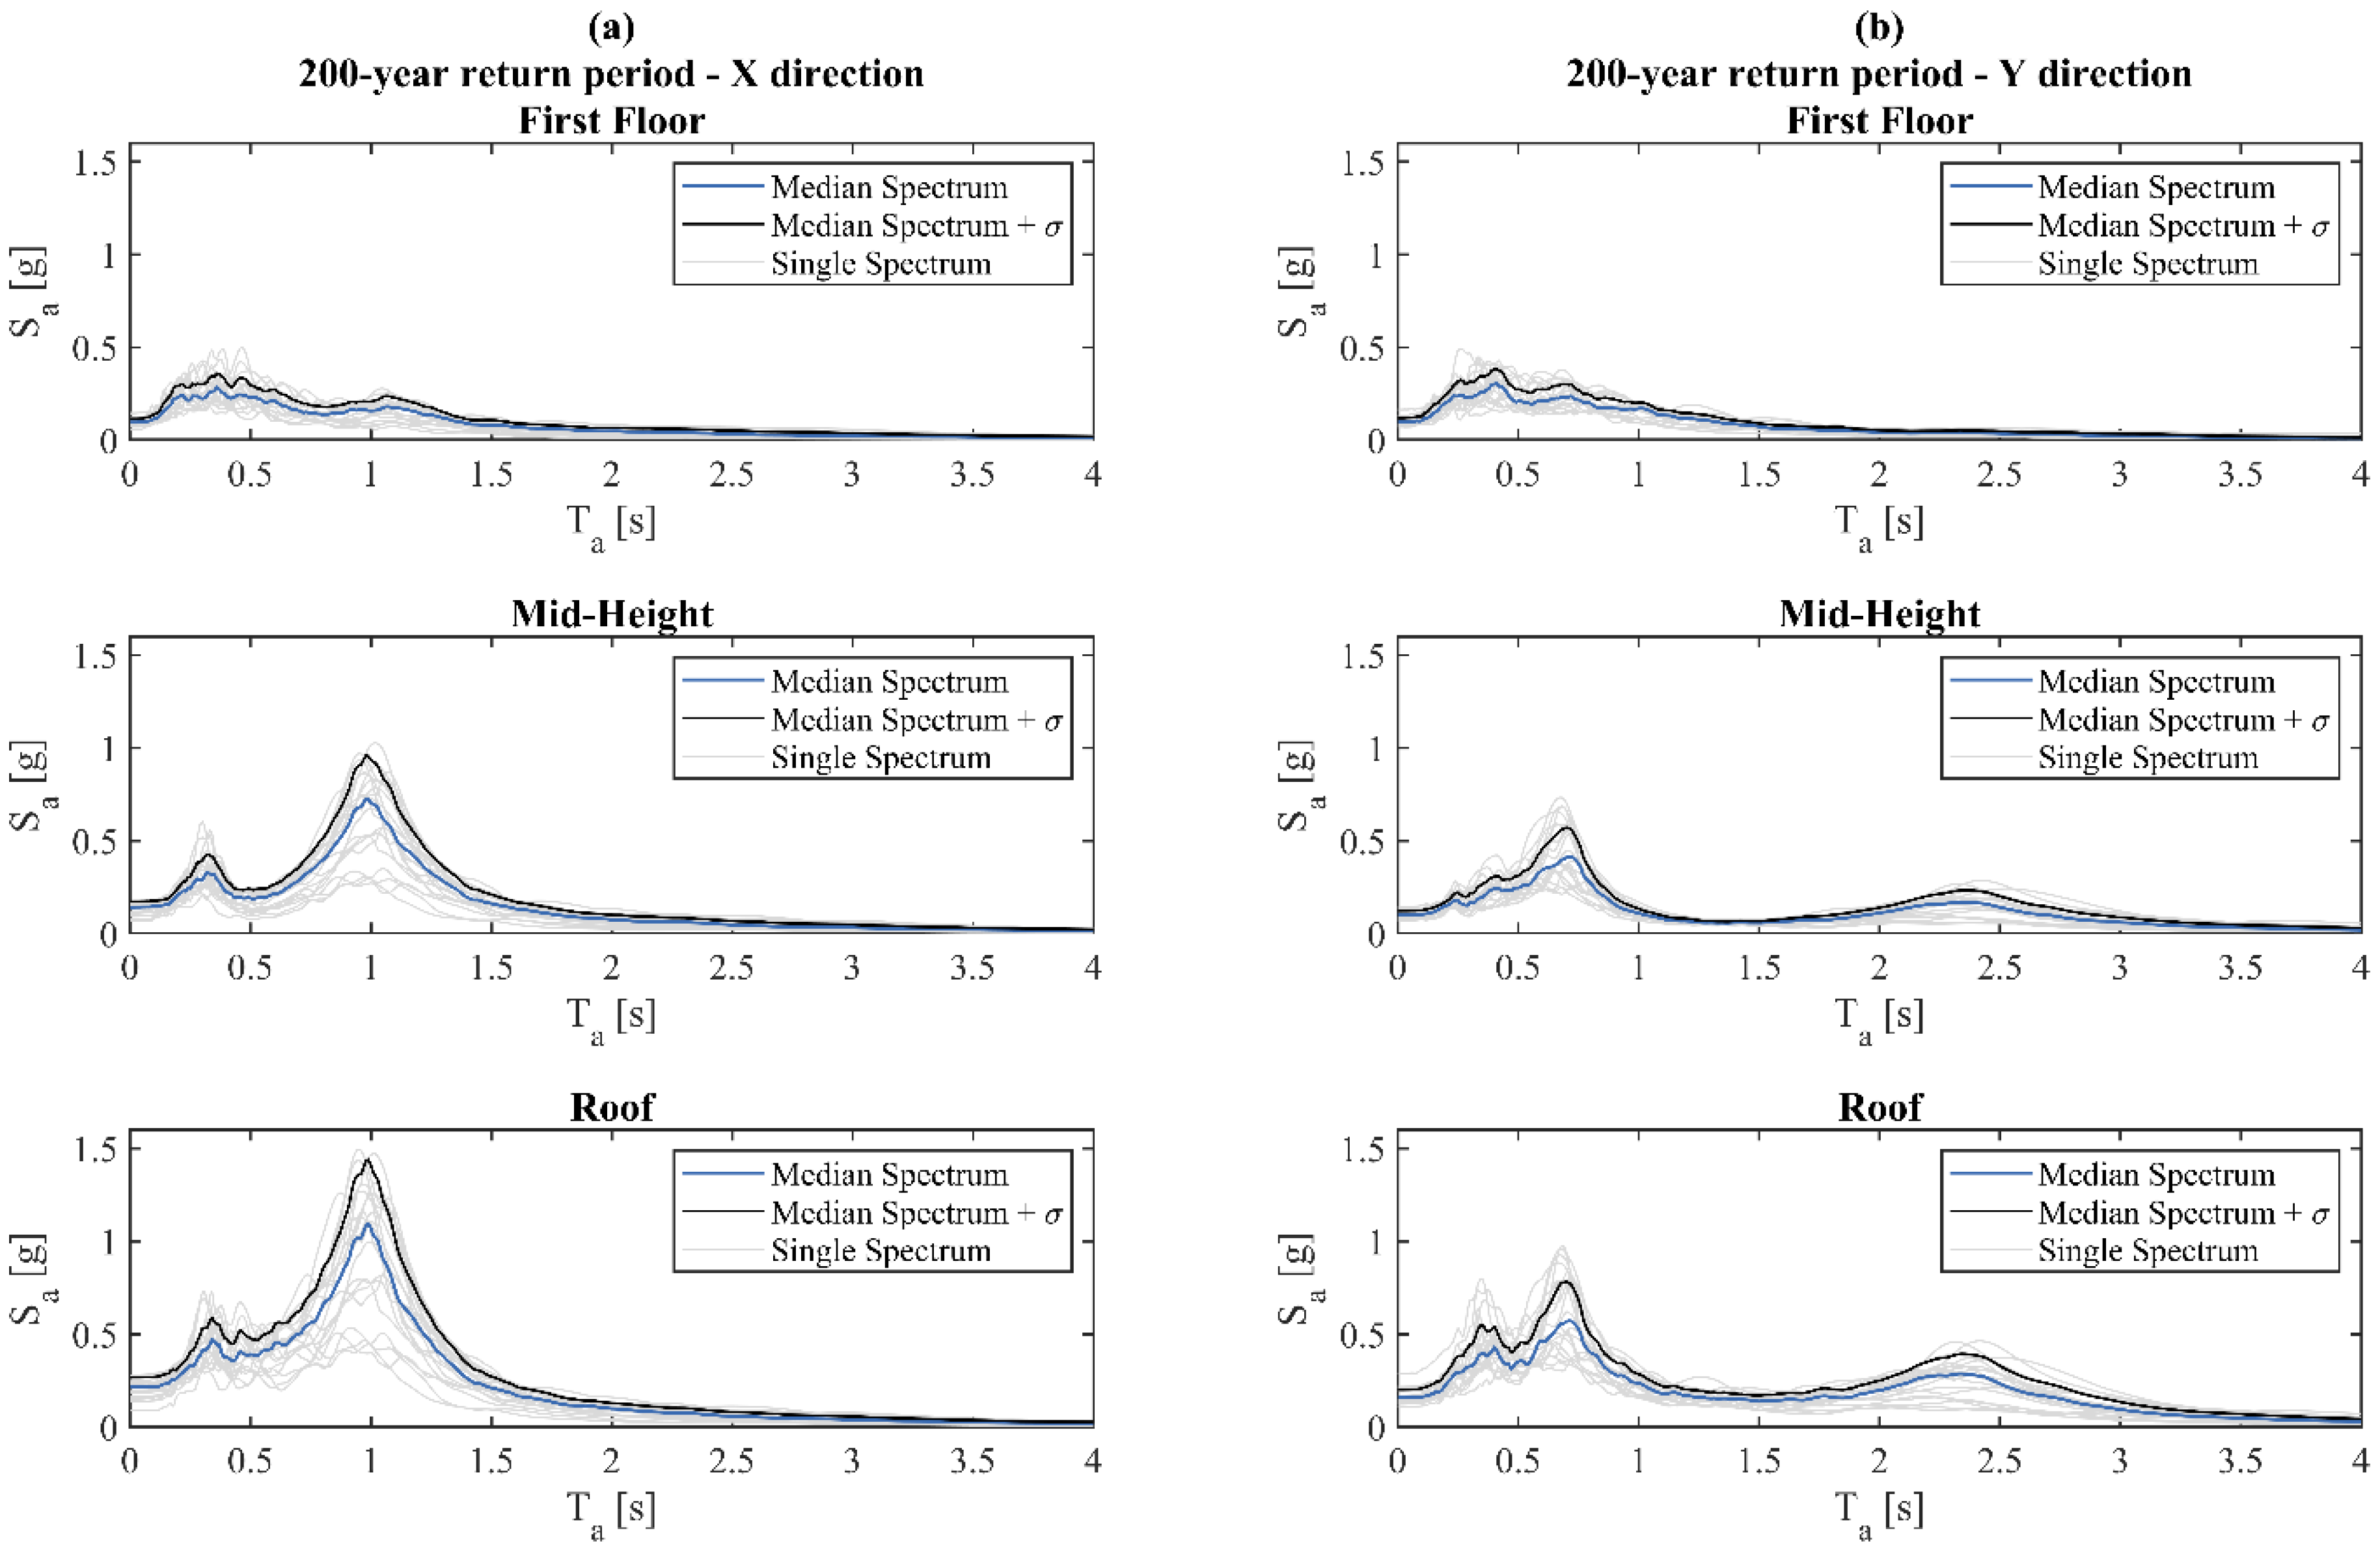
Consistently with the approach adopted for the first return period,
Figure 8 and
Figure 9 provide the individual and statistical acceleration and displacement response spectra corresponding to RP = 200 years, enabling the comparison with a higher seismic intensity associated with a more severe serviceability limit state (i.e., DLS).
Moreover,
Table 4 and
Table 5 summarize, for RP = 200 years, the spectral absolute accelerations and relative displacements in correspondence with meaningful reference structural periods: 0 s, 1 s, and 2.3 s.
Similar trends can be observed in
Figure 8 concerning the period range of spectral amplification at lower and upper storeys, for both building directions. At the roof, spectral accelerations of up to around 1.5 g and 0.9 g were obtained in X and Y directions for the fundamental periods, implying an increment of about 36% and 50%, respectively. The above results refer to the median plus one standard deviation case, even if almost identical percentage-wise increments are obtained when referring to median spectral acceleration estimates. The displacement spectra presented in
Figure 9 also show similar trends to those discussed for RP = 140 years, as regards (i) the spectral shape, exception made for a more pronounced amplification of longer periods at the roof in the transverse direction, and (ii) the different distribution of displacement demand over the structure height in the two directions. Despite this, the increase in the spectral displacement is relevant, with differences that go up to 30% in some cases. For instance, at the roof, the median spectral displacement for a period of 1 s is approximately 24% larger than that obtained for RP = 140 years in the X direction; same considerations can be made for the Y direction, since for a period of 2.3 s, the median spectral displacement is 11% larger than the corresponding one for the first return period. Even higher percentage-wise differences, namely 26% and 17%, can be found when taking as reference the median plus one standard deviation of the individual spectral displacement estimates.
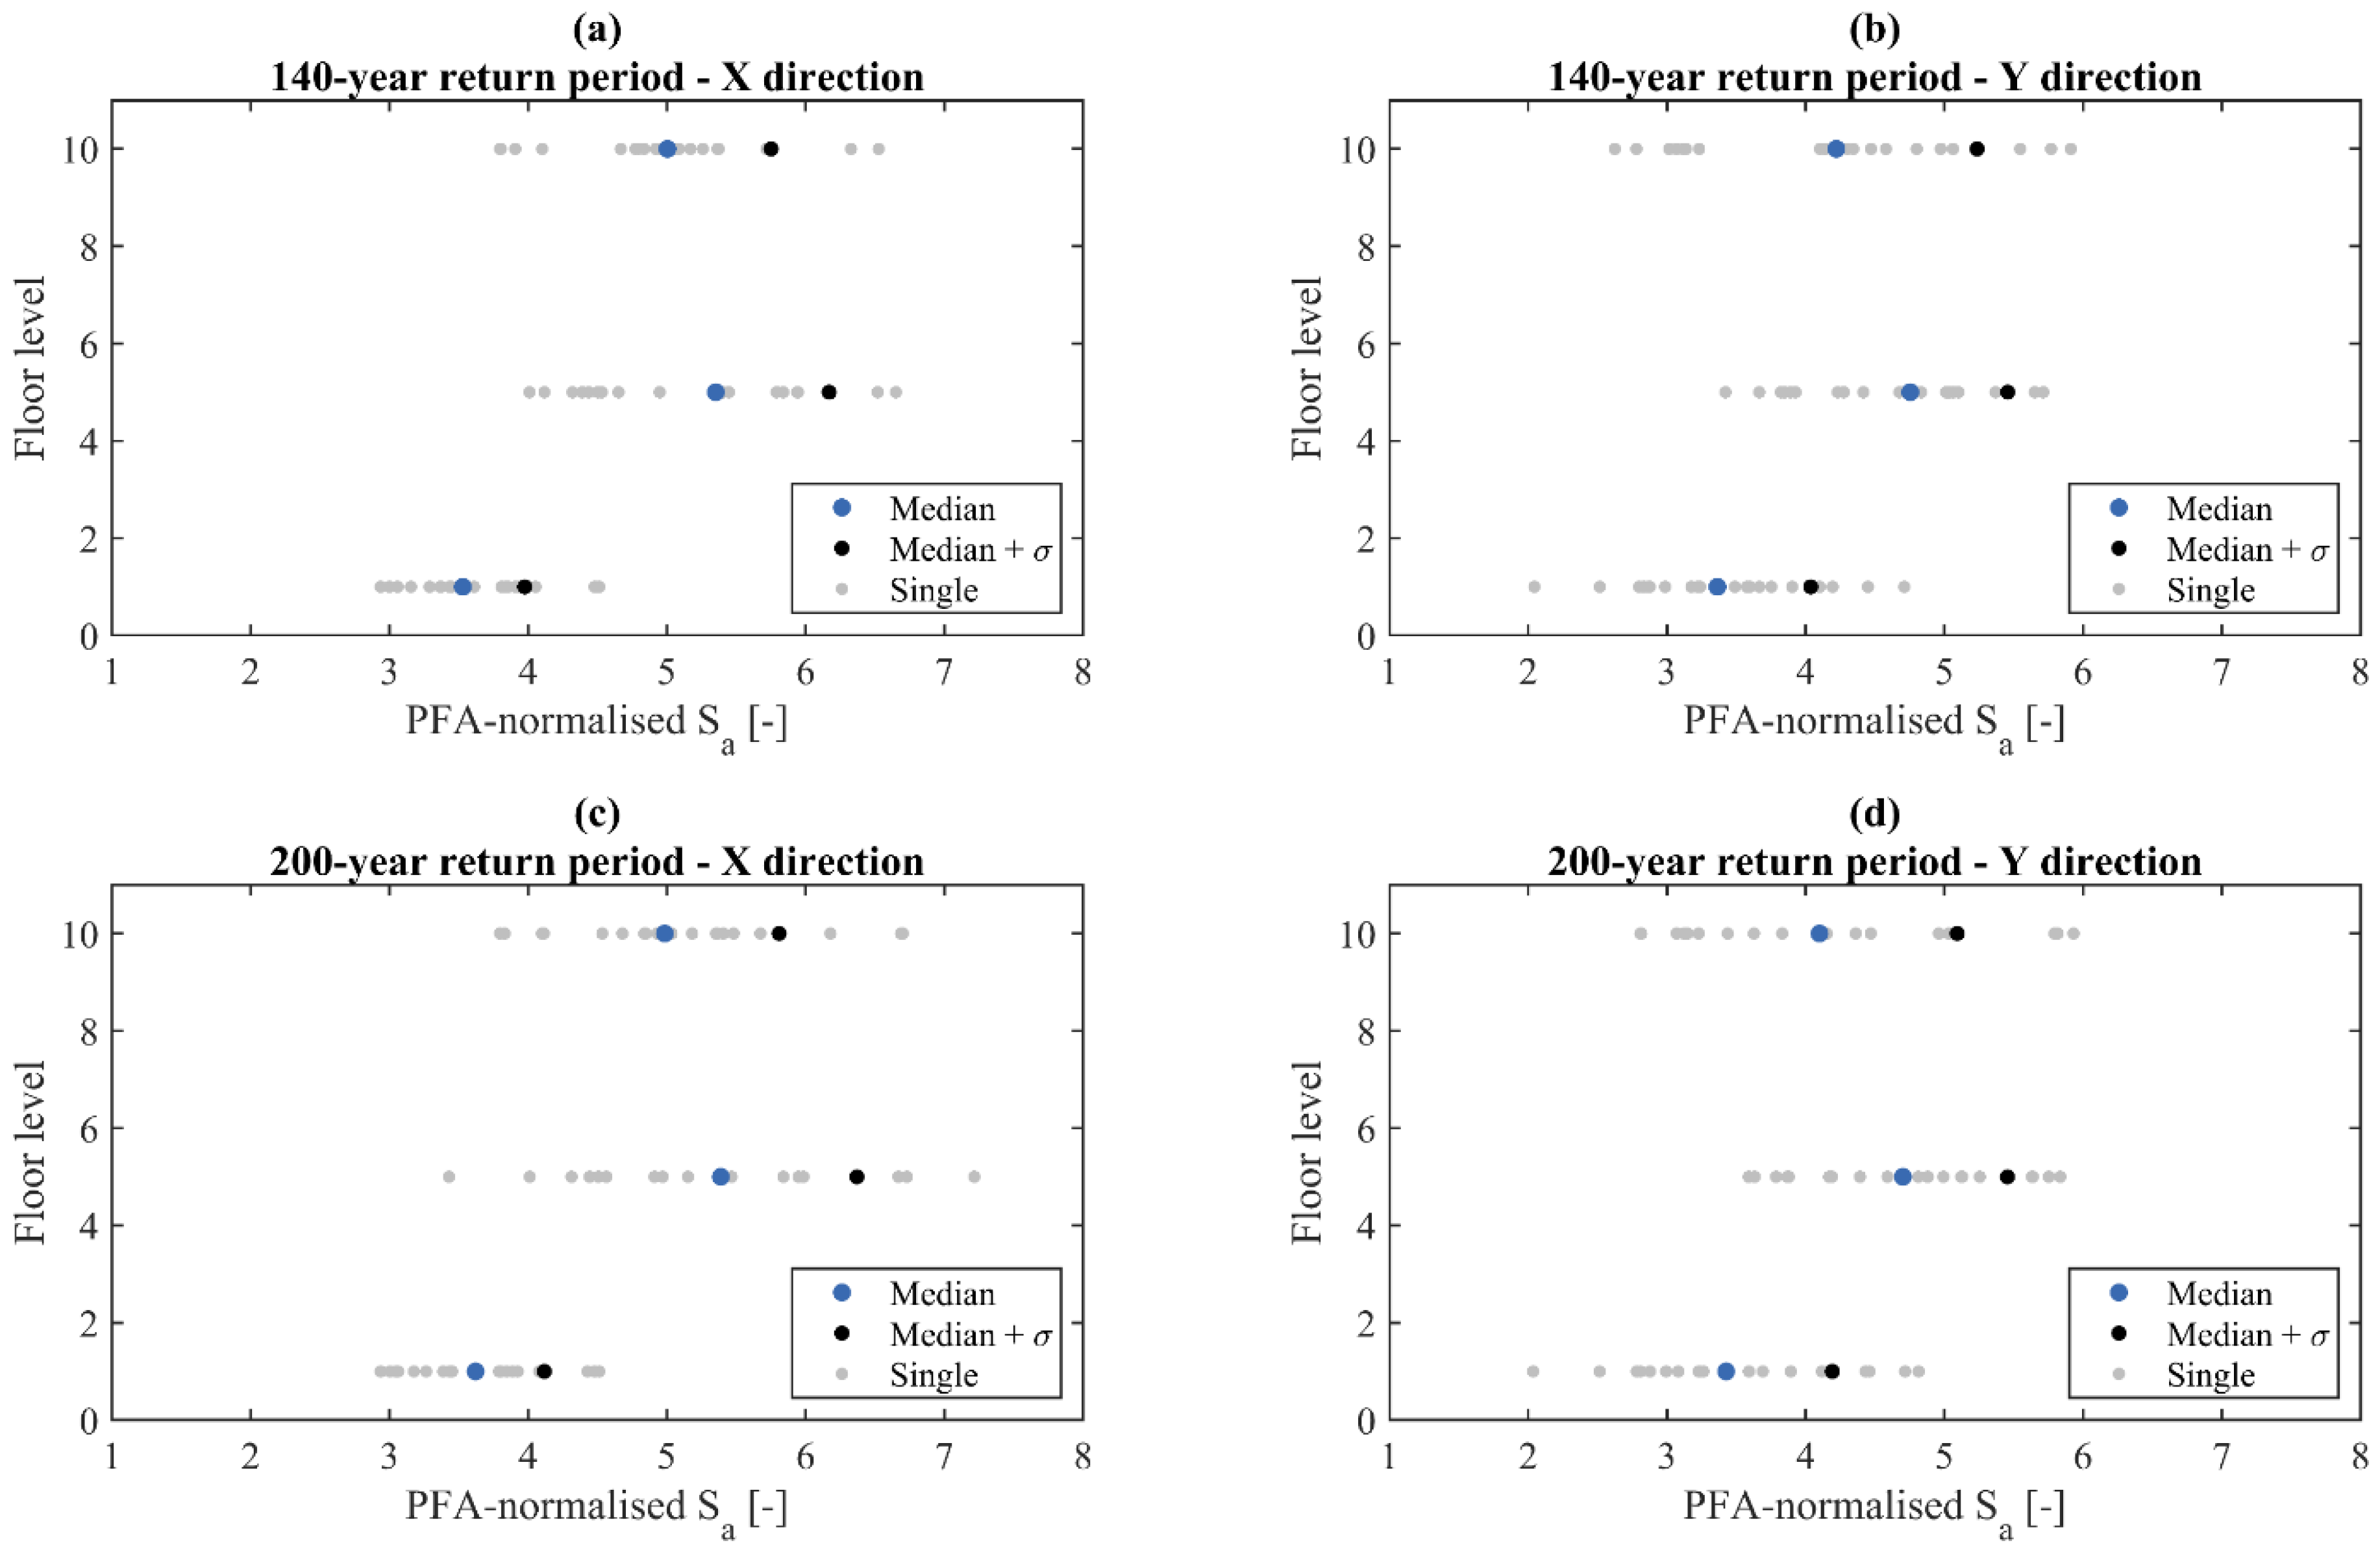
To further clarify the importance of selecting floor response spectra—Rather than peak floor response parameters—When evaluating the seismic demand on NSEs, the series of maximum spectral accelerations at different positions along the building’s height are normalized to the corresponding peak floor acceleration (PFA) values.
Figure 10 presents and compares the PFA-normalized maximum spectral accelerations for both RPs and both directions.
Individual and statistical ratios are computed alongside, showing values that range between 2 and 7, which corroborates the above considerations. In X and Y direction, respectively, the median of these ratios ranges approximately from 3.5 to 5.2 and 3.3 and 4.9, regardless of the considered return period, and show a more pronounced increase at mid-height both to RP = 140 years and RP = 200 years, as can be gathered from
Figure 10b,d. Similar considerations can be made in relation to the high-percentile estimates, with the set of median plus one standard deviation values that ranges between 4.0 and 6.4 and between 4.2 and 5.7 in X and Y directions, respectively. The above being stated, it also turns out that the coefficient of variation (CoV), which in this case also serves as a measure of the record-to-record variability, is rather high (i.e., 14–27%) for both longitudinal and transverse directions. In this sense, from
Figure 10 and the key data just discussed, the following remarks can be made: (i) PFA is a poor EDP for evaluating the response and performance of NSEs because it does not account for the dynamic amplification due to structural and non-structural fundamental periods; (ii) the presented sets of ratios indicate different levels of inaccuracy, varying along the height of the building and, eventually, with the seismic intensity and building direction.
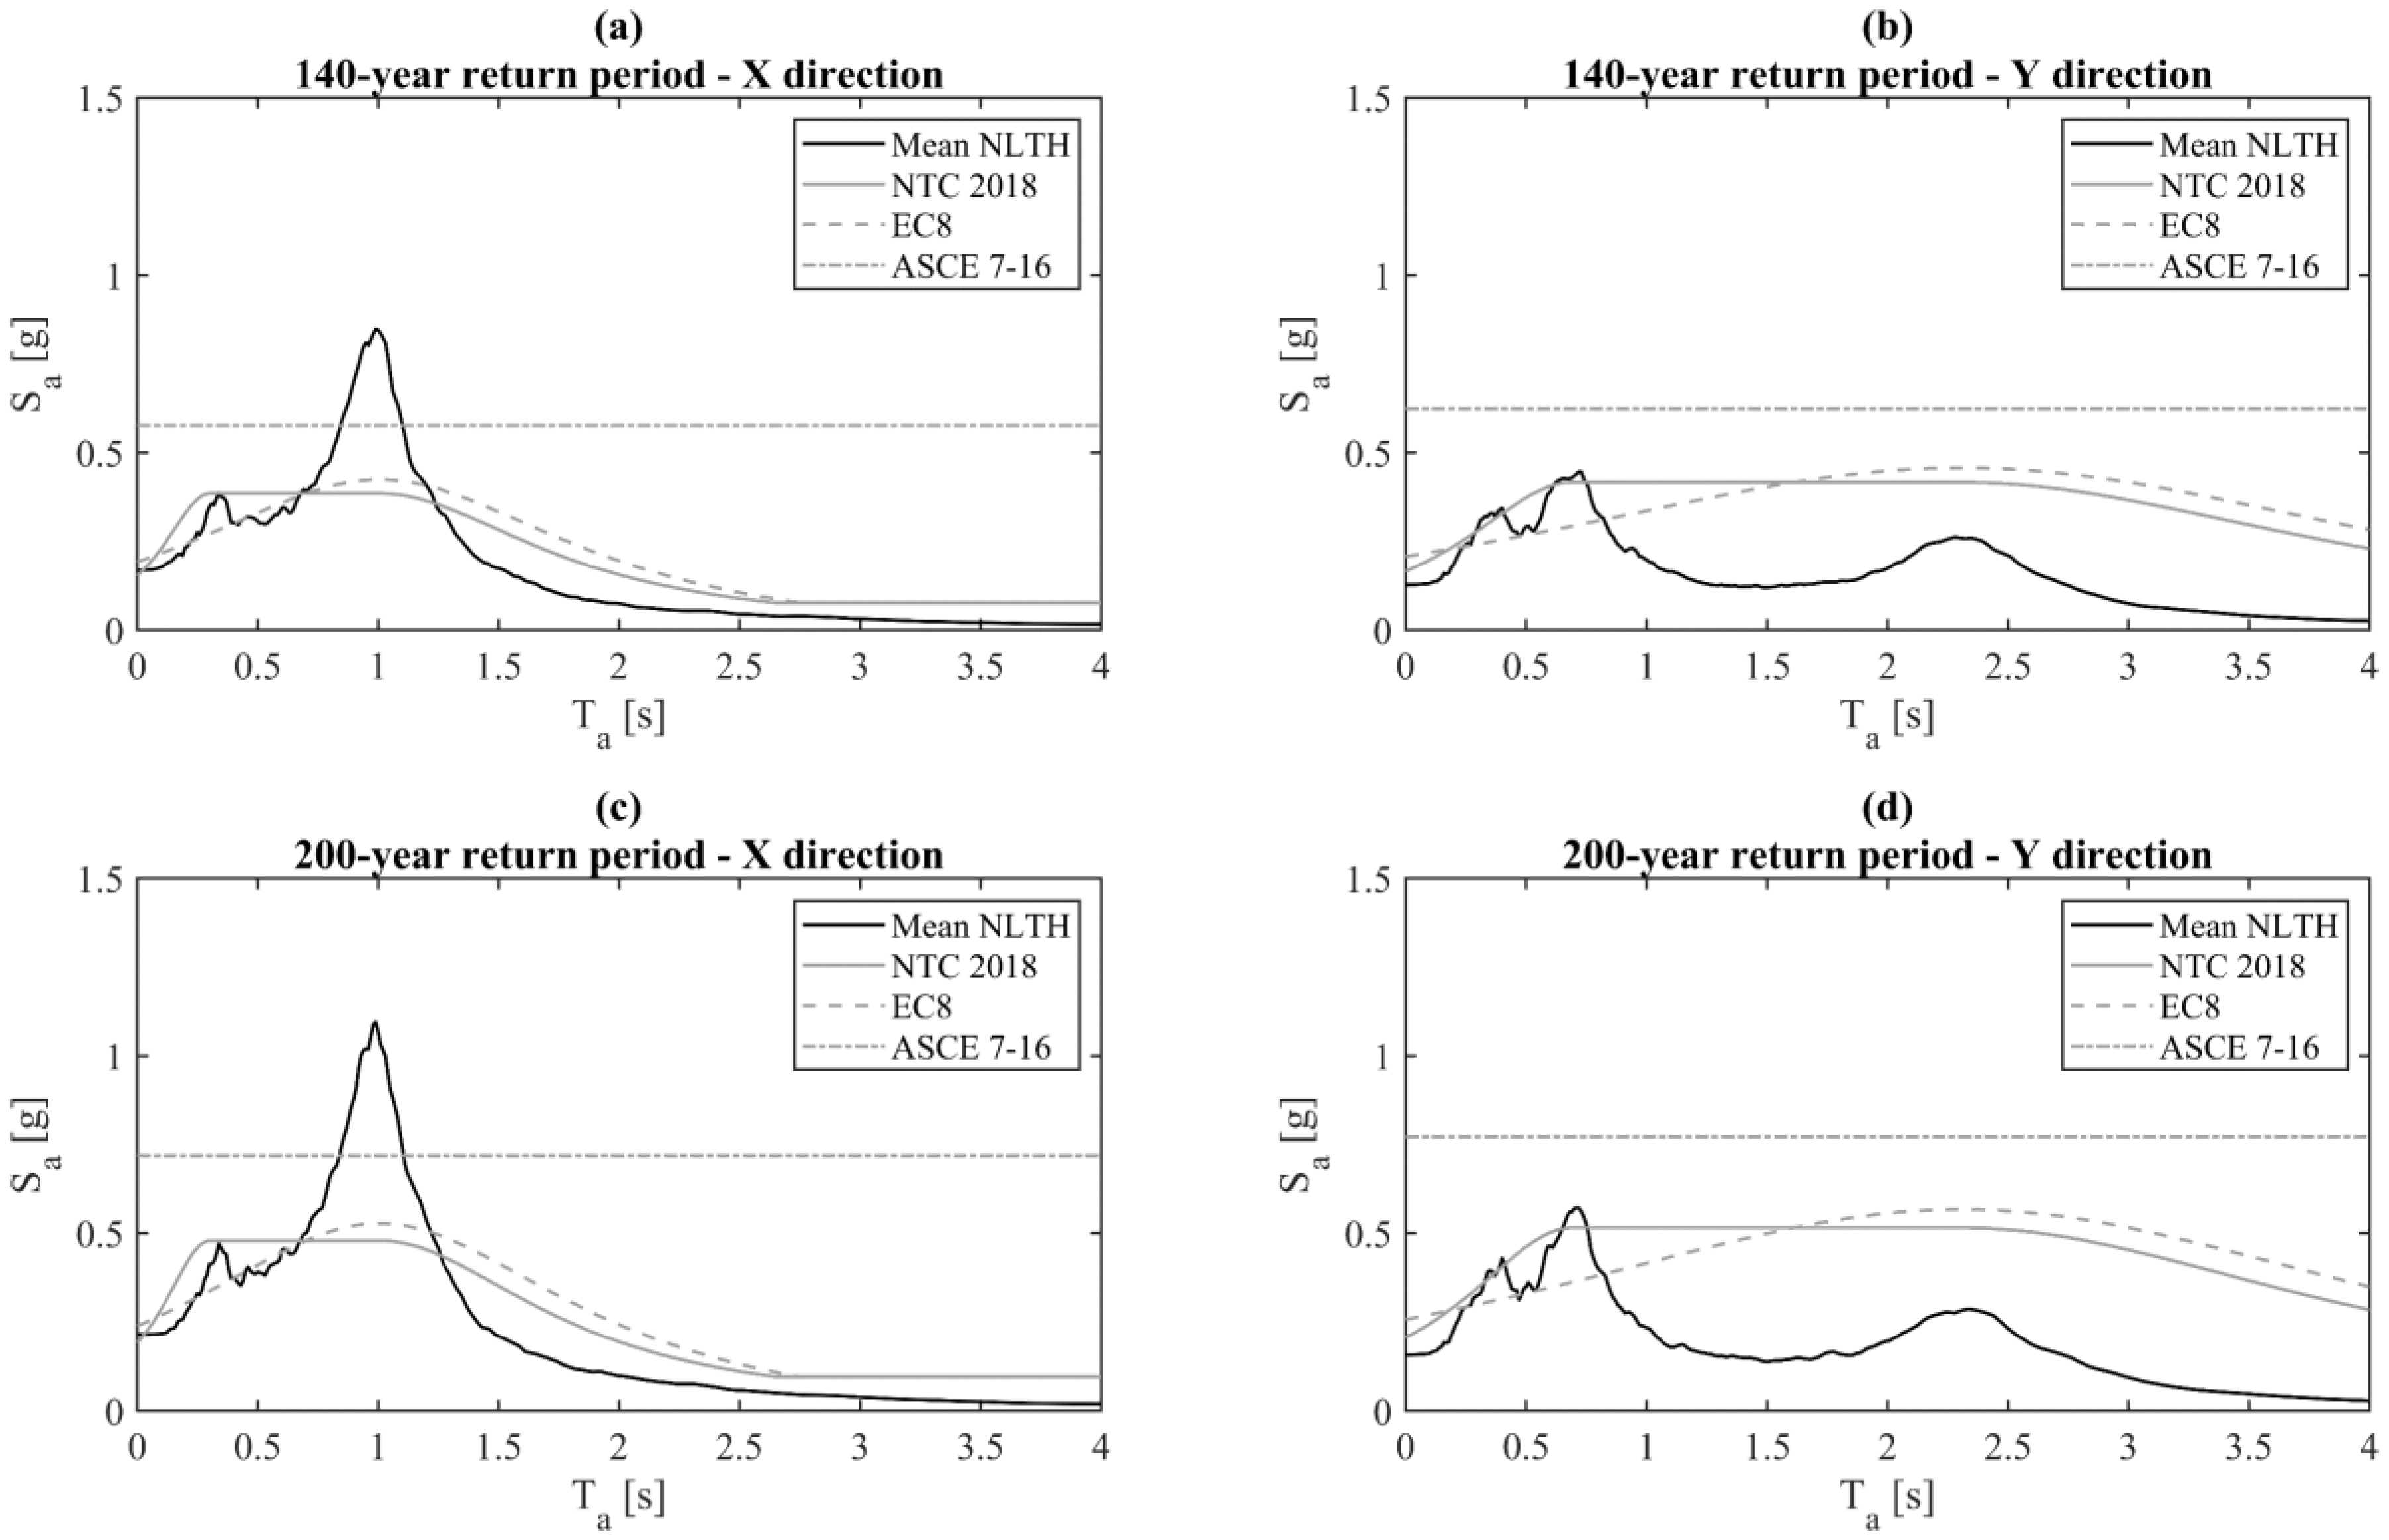
6. Discussion of Results and Comparison with Simplified Approaches
The results reported in the previous section provide a comprehensive example of how to estimate the seismic demand for NSEs installed in a specific building. However, in common practice, the structures are rarely analyzed using nonlinear time–history analyses and the seismic demand on the NSEs is quantified according to code provisions. In this section, the absolute acceleration floor response spectra calculated according to the Italian building code [
27] and Eurocode 8 [
2] are compared with those obtained from the nonlinear time–history analyses. For completeness, also the formulation provided by ASCE 7-16 [
1] is considered, although the case-study structure is in Italy.
Figure 11 compares the top floor absolute acceleration floor response spectra calculated according to three aforementioned codes and guidelines with the mean absolute acceleration floor response spectra obtained from nonlinear time–history analyses. The absolute acceleration floor response spectra are compared for both main directions of the building and for both considered RPs.
It can be seen, in particular, that all considered code formulations underestimate, in the X direction, the floor absolute spectral acceleration for a range of non-structural periods, T
a, between 0.6 s and 1.2 s. This range of non-structural periods can typically correspond to many typologies of NSEs [
9]. The floor response spectra predicted by NTC 2018 and EC8 are close to each other while higher spectral accelerations are predicted by ASCE 7-16, which may come from the fact that the formulation provided by ASCE 7-16 does not account for the ratio between the fundamental period of the supporting structure and the fundamental period of the NSE. For this reason, the floor spectral acceleration assumes the same value regardless of T
a.
In the Y direction, the code formulations provide better results and can predict reasonably well the peak spectral acceleration, although some shortcomings are also observed in this case. The ASCE 7-16 formulation significantly overestimates the floor spectral accelerations, in particular for periods longer than about 0.7 s. In the case of the Italian guidelines, the peak spectral acceleration, which occurs at the second mode, is predicted reasonably well, while for longer periods the spectral accelerations are significantly overestimated. Finally, in the case of the EC8 formulation, the floor spectral acceleration at the fundamental period in the Y direction is significantly overestimated while the floor spectral accelerations at the higher modes are underestimated.
The observed trends are very likely the consequence of the fact that both NTC 2018 and EC8 formulations are calibrated considering only the first fundamental period of the supporting structure, while the influence of the higher modes is neglected. This issue is of particular importance for buildings characterized by long periods, as for the case-study building analyzed in this work. The poor prediction capability of the code formulations was also reported by recent studies available in the literature that propose simplified methodologies to predict absolute acceleration floor response spectra [
12,
13,
14] and relative displacement floor response spectra [
14,
42].
The most meaningful peaks observed in
Figure 11 are numerically reported in
Table 6 and
Table 7, where the spectral absolute accelerations at the reference structural periods (0 s, 1 s, and 2.3 s), for RP = 140 years and RP = 200 years, computed from the floor response time histories and according to the considered code provisions, are summarized.
Furthermore, in this study, the influence of the masonry infills was only considered in terms of seismic masses to be consistent with the common practice; however, it is well known that masonry infills, based on their mechanical properties, might significantly affect the response of the structure both in terms of seismic capacity and dynamic response [
15,
43]. This can be an additional source of discrepancy between the results obtained herein and the code formulation estimates, which are generally developed for bare structures.
Finally, the accurate estimation of the seismic demand in the performance assessment of NSEs, particularly in the case of loss estimation studies, requires the selection of a proper EDP. In loss estimation studies, the fragility curves for NSEs are often expressed in terms of peak floor accelerations. This parameter, however, might not be ideal as it neglects the significant amplification that can be observed in the range of non-structural periods close to the periods of the supporting structures. Based on this consideration, a possible solution could be to use the floor spectral acceleration as reference EDP for NSEs, although significant efforts should still be made to implement it into practice and to produce new fragility functions. At the same time, even the identification of the modal properties of NSEs might be not a simple task.


